Article

A Genome-Wide Association Study of Dementia Using the Electronic Medical Record

1
Department of Mathematics and Statistics, University of Victoria, Victoria, BC V8P 5C2, Canada
2
School of Artificial Intelligence, Hebei University of Technology, Tianjin 300130, China
3
Department of Mathematics and Statistics, University of Saskatchewan, Saskatoon, SK S7N 5A2, Canada
*
Authors to whom correspondence should be addressed.
BioMedInformatics 2023, 3(1), 141-149; https://doi.org/10.3390/biomedinformatics3010010
Submission received: 16 January 2023 / Revised: 11 February 2023 / Accepted: 13 February 2023 / Published: 15 February 2023
(This article belongs to the Section Clinical Informatics)

Abstract

:
Dementia is characterized as a decline in cognitive function, including memory, language and problem-solving abilities. In this paper, we conducted a Genome-Wide Association Study (GWAS) using data from the electronic Medical Records and Genomics (eMERGE) network. This study has two aims, (1) to investigate the genetic mechanism of dementia and (2) to discuss multiple p-value thresholds used to address multiple testing issues. Using the genome-wide significant threshold ( p 5 × 10 8 ), we identified four SNPs. Controlling the False Positive Rate (FDR) level below 0.05 leads to one extra SNP. Five SNPs that we found are also supported by QQ-plot comparing observed p-values with expected p-values. All these five SNPs belong to the TOMM40 gene on chromosome 19. Other published studies independently validate the relationship between TOMM40 and dementia. Some published studies use a relaxed threshold ( p 1 × 10 5 ) to discover SNPs when the statistical power is insufficient. This relaxed threshold is more powerful but cannot properly control false positives in multiple testing. We identified 13 SNPs using this threshold, which led to the discovery of extra genes (such as ATP10A-DT and PTPRM). Other published studies reported these genes as related to brain development or neuro-development, indicating these genes are potential novel genes for dementia. Those novel potential loci and genes may help identify targets for developing new therapies. However, we suggest using them with caution since they are discovered without proper false positive control.

1. Introduction

Dementia is a term used to describe a decline in cognitive function, including memory, language and problem-solving abilities [1]. Dementia affects millions among the ageing population, and the probability of having a form of the condition increases with age [2]. Approximately one-third of people aged 85 or older are likely to have dementia. It is also a leading cause of disability and death among older adults and a significant burden on public health [3].
The cause of dementia is complex. Both genetic and environmental factors can influence dementia [4]. Scientists believe that genetic factors account for about 60% of the risk of developing dementia. Many genetic risk factors for dementia have been identified in previous research, including specific genetic mutations [5,6]. Some studies have shown an association between the risk genes and dementia, such as the APOE gene and Alzheimer’s disease (the most common form of dementia), as demonstrated by Strittmatter et al. [7] in 1993. Cervantes et al. [8] proposed that TOMM40, as an APOE cluster gene, is a risk of Alzheimer’s disease. Liu et al. [9] investigated the association of the SORL1 gene expression with Alzheimer’s disease. However, the genetic basis of most cases of dementia is not fully comprehended, leading to ongoing research in this area.
Genome-Wide Association Study (GWAS) is a powerful tool for identifying genetic variants associated with specific traits or diseases. GWAS can identify genetic variants that are more common in populations with specific traits or diseases than in the general population by analyzing patterns of variation in large numbers of individual genomes [10]. Most GWAS studies test the association between disease outcome and each individual SNP, one by one. These tests lead to numerous p-values, while multiple testing adjustment is critical to control false positives in many tests. The two most popular multiple-testing approaches for GWAS are the genome-wide significant threshold ( p 5 × 10 8 ) [11] and false discovery rate (FDR) [12]. Many GWAS studies suffer from a lack of power issue, which has led to the development and applications of many novel approaches. Such methods often have various limitations or require additional assumptions. For example, Xu et al. [13] proposed a pseudo-supervised machine learning approach for discovering SNPs, which utilizes information on the SNP-SNP relationship to achieve better power while properly controlling FDR. However, this method cannot handle covariates, which largely limits its applications when covariates play an essential role in affecting disease outcomes and must be adjusted in genomic data analysis. Alternatively, some studies reported SNPs without properly controlling false positives. Authors used subjectively decided p-value thresholds in these studies ( p 1 × 10 5 ) [14,15]. Such an approach is useful since it enables researchers to discover potentially interesting signals when the sample size is insufficient to achieve decent statistical power while controlling false positives properly. However, this approach should be used with extreme caution and its results should be properly interpreted to highlight the fact that there is no proper FDR control.
In this study, we have two aims. Firstly, we aim to provide insights into the biological mechanism underlying the development of dementia and help identify potential targets for developing new therapies. Secondly, we discuss three different p-value thresholds used to address multiple testing problems, which can help to discover SNPs when the statistical power is insufficient. To achieve the goals, we conducted a GWAS on the data of a published study from the electronic Medical Records and Genomics (eMERGE) network. The eMERGE is a consortium of biobanks linked to electronic medical record data and funded by NHGRI for genomic research in electronic medical record (EMR) systems [16]. The eMERGE actively tracks dementia investigations and many participants have lived to advanced ages under continuous observation, which provides data to support our study. We used the genomic data obtained from the consent group of Disease-Specific (Dementia). In our GWAS study, we apply and compare three discovering SNP approaches to investigate the genetic variants associated with dementia. Based on the difference in the results of these three approaches, we discuss their strength and weakness.
The rest of this paper is organized as below. Section 2 introduces the database, patient cohort, quality control and statistical analysis. Section 3 describes the results of covariates in the GWAS model and exploratory GWAS of dementia. Section 4 presents our discussion and conclusions.

2. Materials and Methods

2.1. Database

The Electronic Medical Records and Genomics (eMERGE) Network (https://emerge-network.org/, accessed on 11 December 2022) is a consortium of ten participating sites to develop, disseminate and apply methods that combine DNA biorepositories with EMR systems for large-scale, high-throughput genetic studies [17]. Using electronic phenotyping methods, the consortium used DNA samples from all participating sites to explore the genetic determinants of over forty phenotypes, including dementia. We used the data of the consent group of Disease-Specific (Dementia).

2.2. Patient Cohort

We selected participants with five or more visits. Diseases with any of the following conditions were defined by this study as a case group for dementia. They were senile dementia, presenile dementia, senile dementia delusional (paranoid) features, senile dementia with depressive features, senile dementia with delirium or confusion, arteriosclerotic dementia, vascular dementia with delirium, vascular dementia with delusions, dementia due to alcohol, dementia due to drugs, Alzheimer’s disease, pick’s disease of the brain, other frontotemporal dementia, dementia with Lewy bodies and dementia with Parkinsonism.

2.3. Quality Control

We performed a series of QC steps on genotype data provided by 1433 participants (578 cases and 855 controls before quality control). Missing genotypes introduce bias and reduce the analysis’s efficacy. Thus, we screened out variants with more than 20% missing individuals and excluded individuals with more than 20% missing variants. Moreover, we filtered the variants and individuals using a more stringent threshold (0.02; > 2%); 4,569,604 variants and 34 individuals were removed. Furthermore, SNPs are those variations with a minor allele frequency (MAF) greater than 1% [18]. In this paper, we used 0.01 as the MAF threshold and removed 27,994,441 variants. The variants that passed the threshold were SNPs. We also filtered out SNPs with HWE p 1 × 10 10 , which excluded 26631 SNPs. These filters were applied separately to each of these 22 chromosomes to remove poorly performing samples and variants/SNPs using tools implemented in PLINK [19].
After samples and marker quality control, the total genotyping rate is 0.994328. There are 5,449,492 variants and 1399 participants (559 cases and 840 controls) pass filters and QC.

2.4. Statistical Method

SNPs were tested for association with dementia in PLINK using logistic regression analysis that assumed an additive genetic model. We summarized the patient characteristics in the disease group and the control group to select the significant variables ( p < 0.05 ). Meanwhile, population structure could cause confounding in GWAS, which may produce spurious associations if we do not properly process it. We addressed this problem by including principal components (PCs) as covariates. In our GWAS model, we simultaneously input the significant variables and the top 10 PCs as covariates.
We selected three different discovering SNP approaches to identify the significant SNPs: (1) Genome-wide significant threshold ( p 5 × 10 8 ), which was a popular criteria. (2) Benjamini–Hochberg method was applied to adjusting the false discovery rate (FDR). We set the cut-off of FDR adjusted p-value as 0.05 . (3) We use a relaxed threshold, p 1 × 10 5 , to discover more SNPs but sacrifice proper false positive control.

3. Results

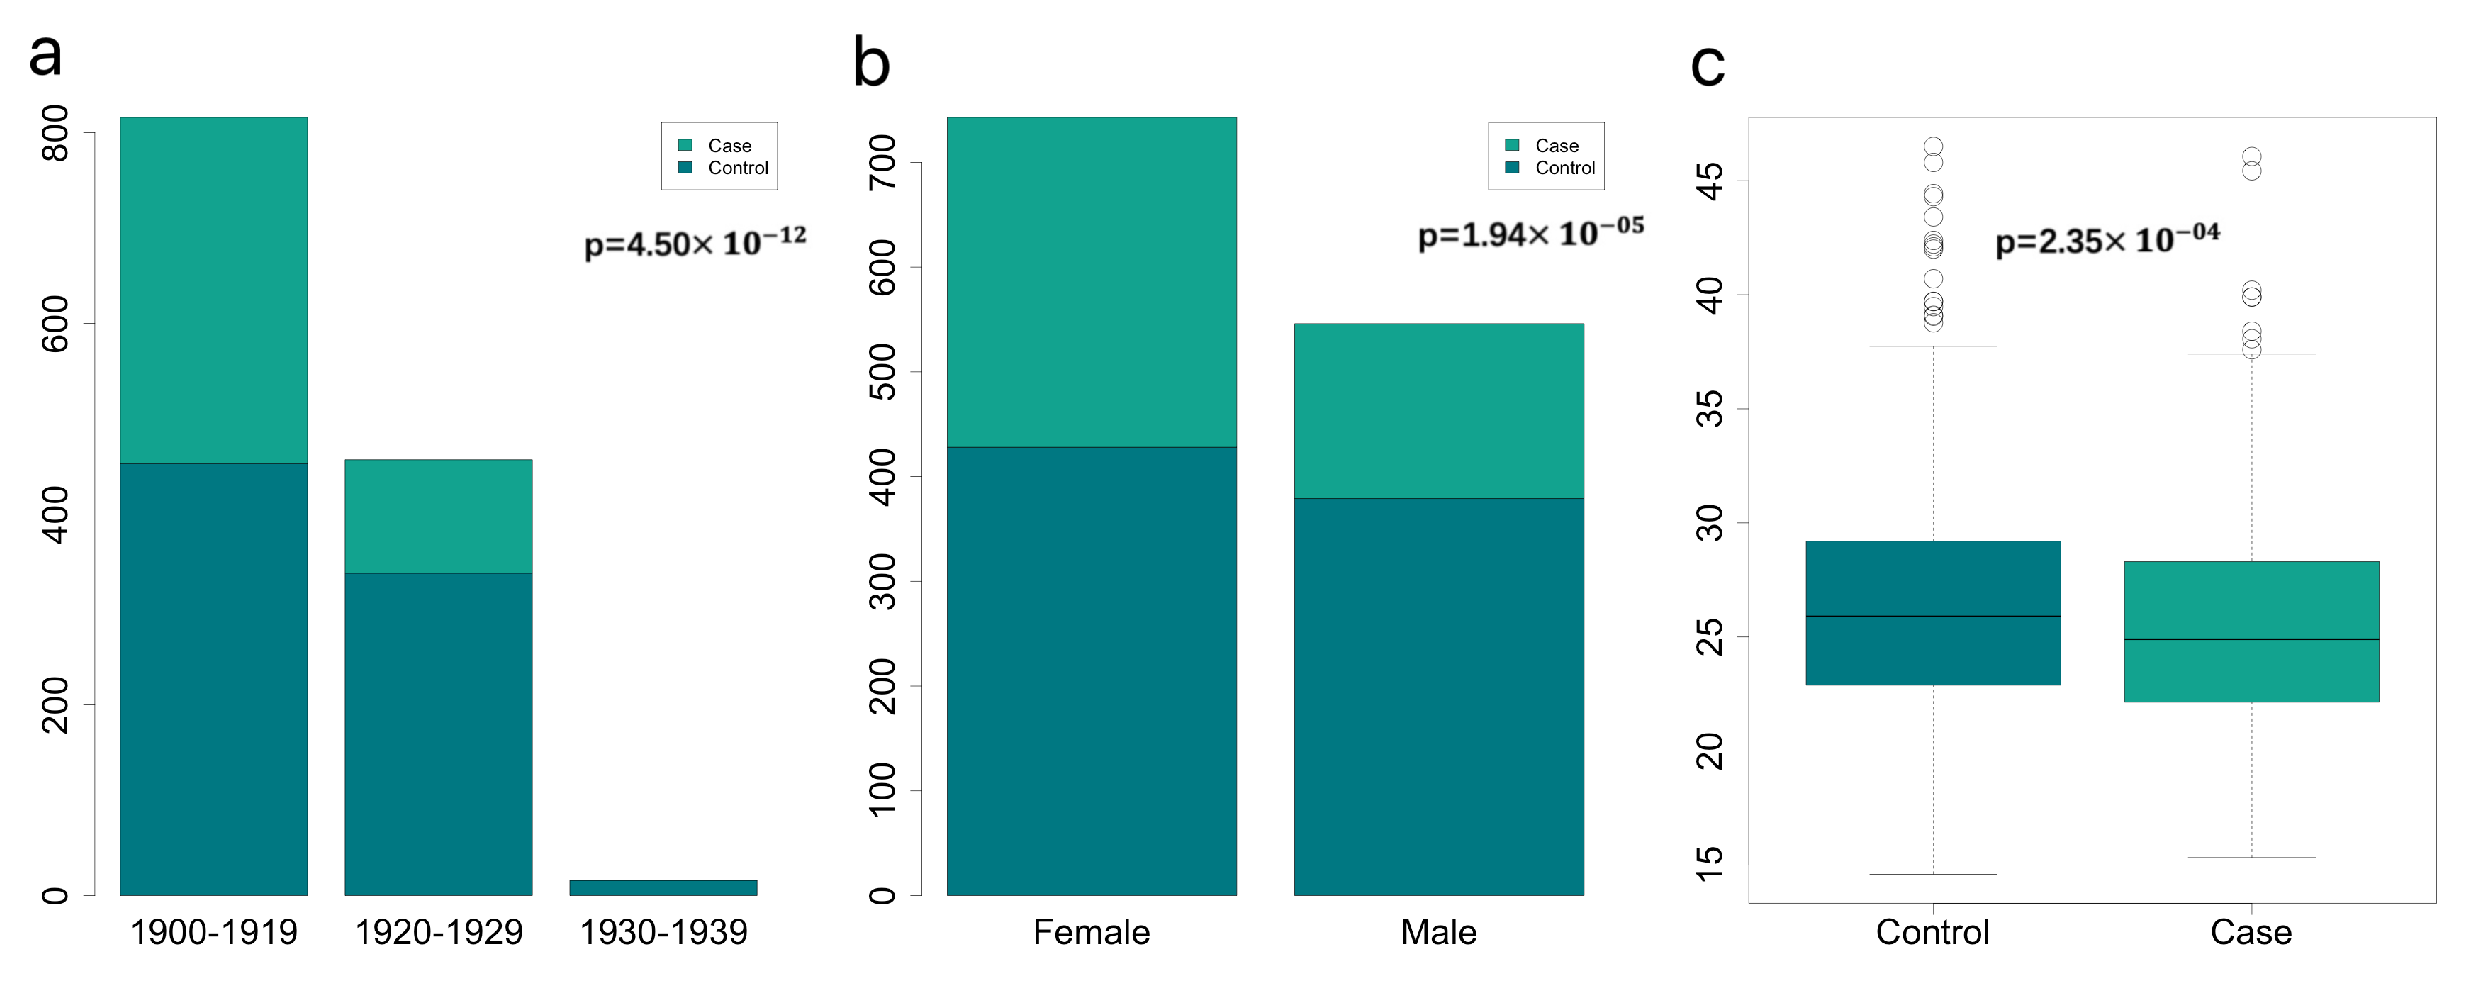
3.1. Important Non-Genomics Factors Affecting Risk of Dementia

To identify important covariates to be adjusted in GWAS analysis, we investigated the relationship between dementia disease status and some selected patient characteristics. The characteristics of the case-control groups are shown in Table 1. The proportion of females is 59.86% in dementia patients, which is higher than males (40.14%). However, it is nearly the same proportion in the control group (51.22% and 48.77%). The proportion of patients with advanced age in the case group is 78.03%, higher than those born in 1920–1929 and 1930–1939. We can see the mean value and standard error values of BMI. The mean ( ± S D ) BMI of the case group is 25.51 ( ± 4.62 ) , which is lower than that of the control group ( 26.43 ( ± 4.73 ) ) . These three variables, the birth year, gender and BMI, have statistically significant differences between the case and control groups ( p 0.05 ). In addition to the significant variables, we also considered smoke status, STC (serum total cholesterol), H-PSA (highest record of prostate-specific antigen) and race variables. These four variables were not significant.
Birth year, gender and BMI show a strong relationship with dementia, which are visualized in Figure 1. There were no participants born in 1930–1939 in the case group of dementia in the final filtered data and the proportion of those born in 1900–1919 was higher than in 1920–1929. The birth year and gender variables passed Pearson’s Chi-squared test ( p = 4.50 × 10 12 , p = 1.94 × 10 05 ) between the case and control groups. The patients had a lower median BMI (24.9) than the control group (25.9). Meanwhile, the BMI variable passed the Wilcoxon test ( p = 2.35 × 10 4 ). Based on this exploratory data analysis result, we decided to include birth year, gender and BMI, as well as the top 10 PCs as covariates in the logistic regression of GWAS analysis.

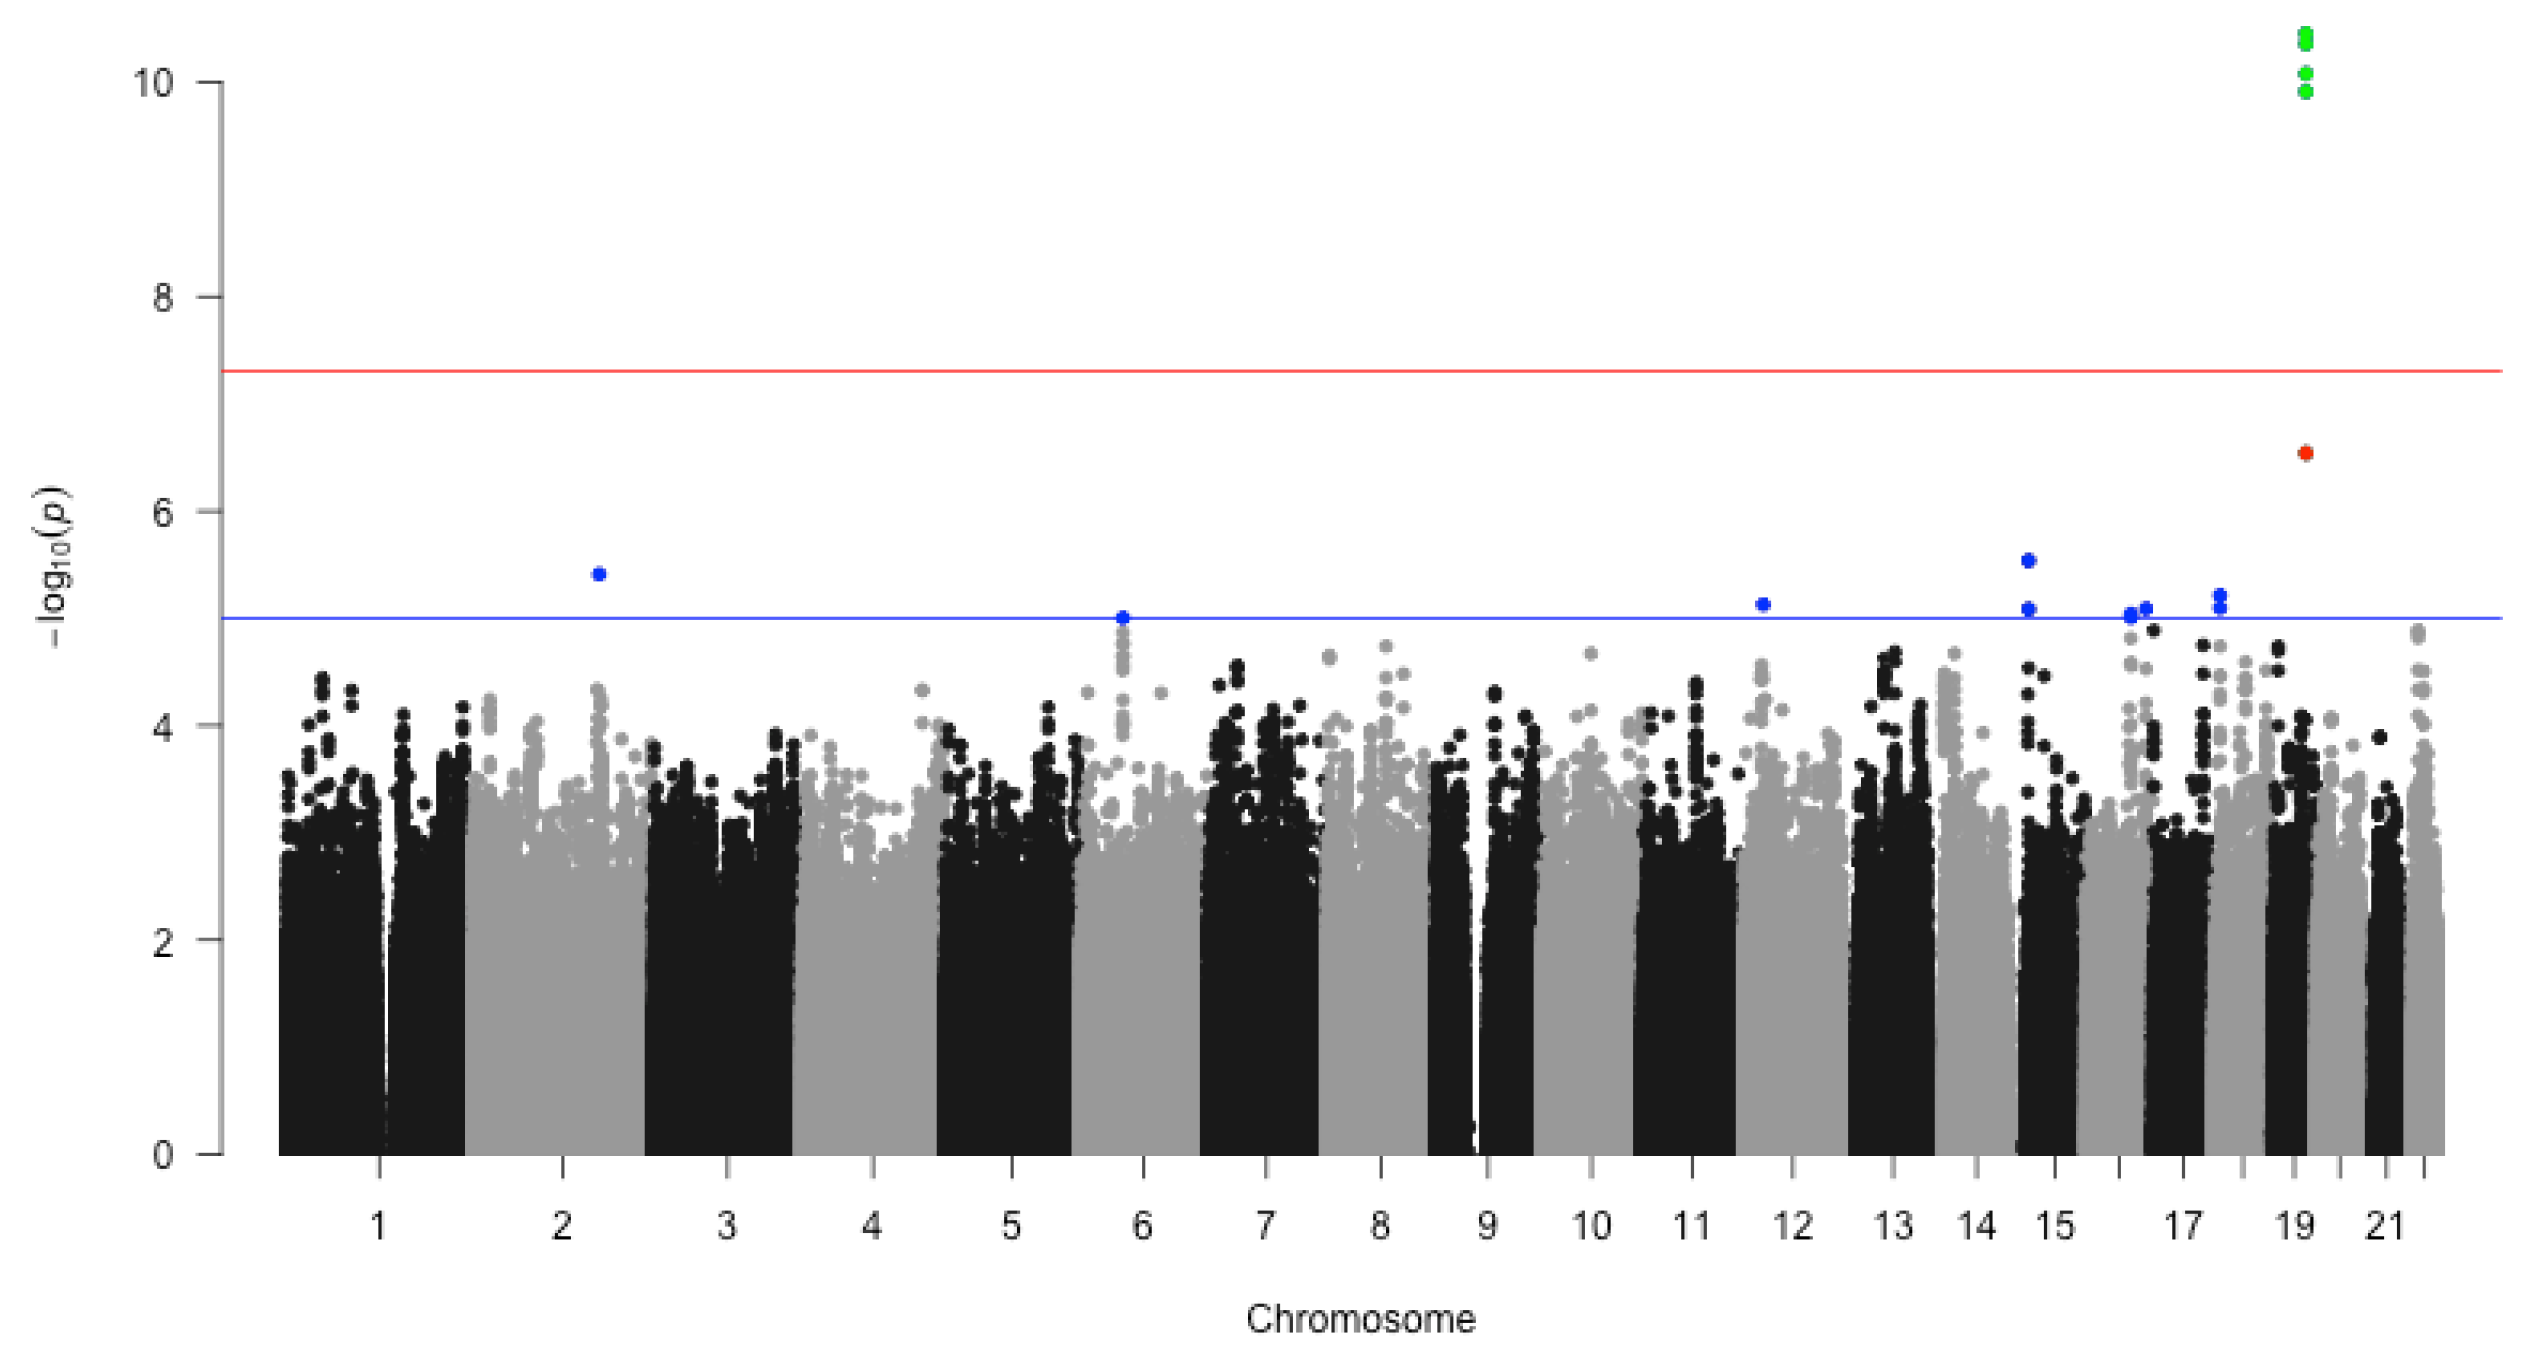
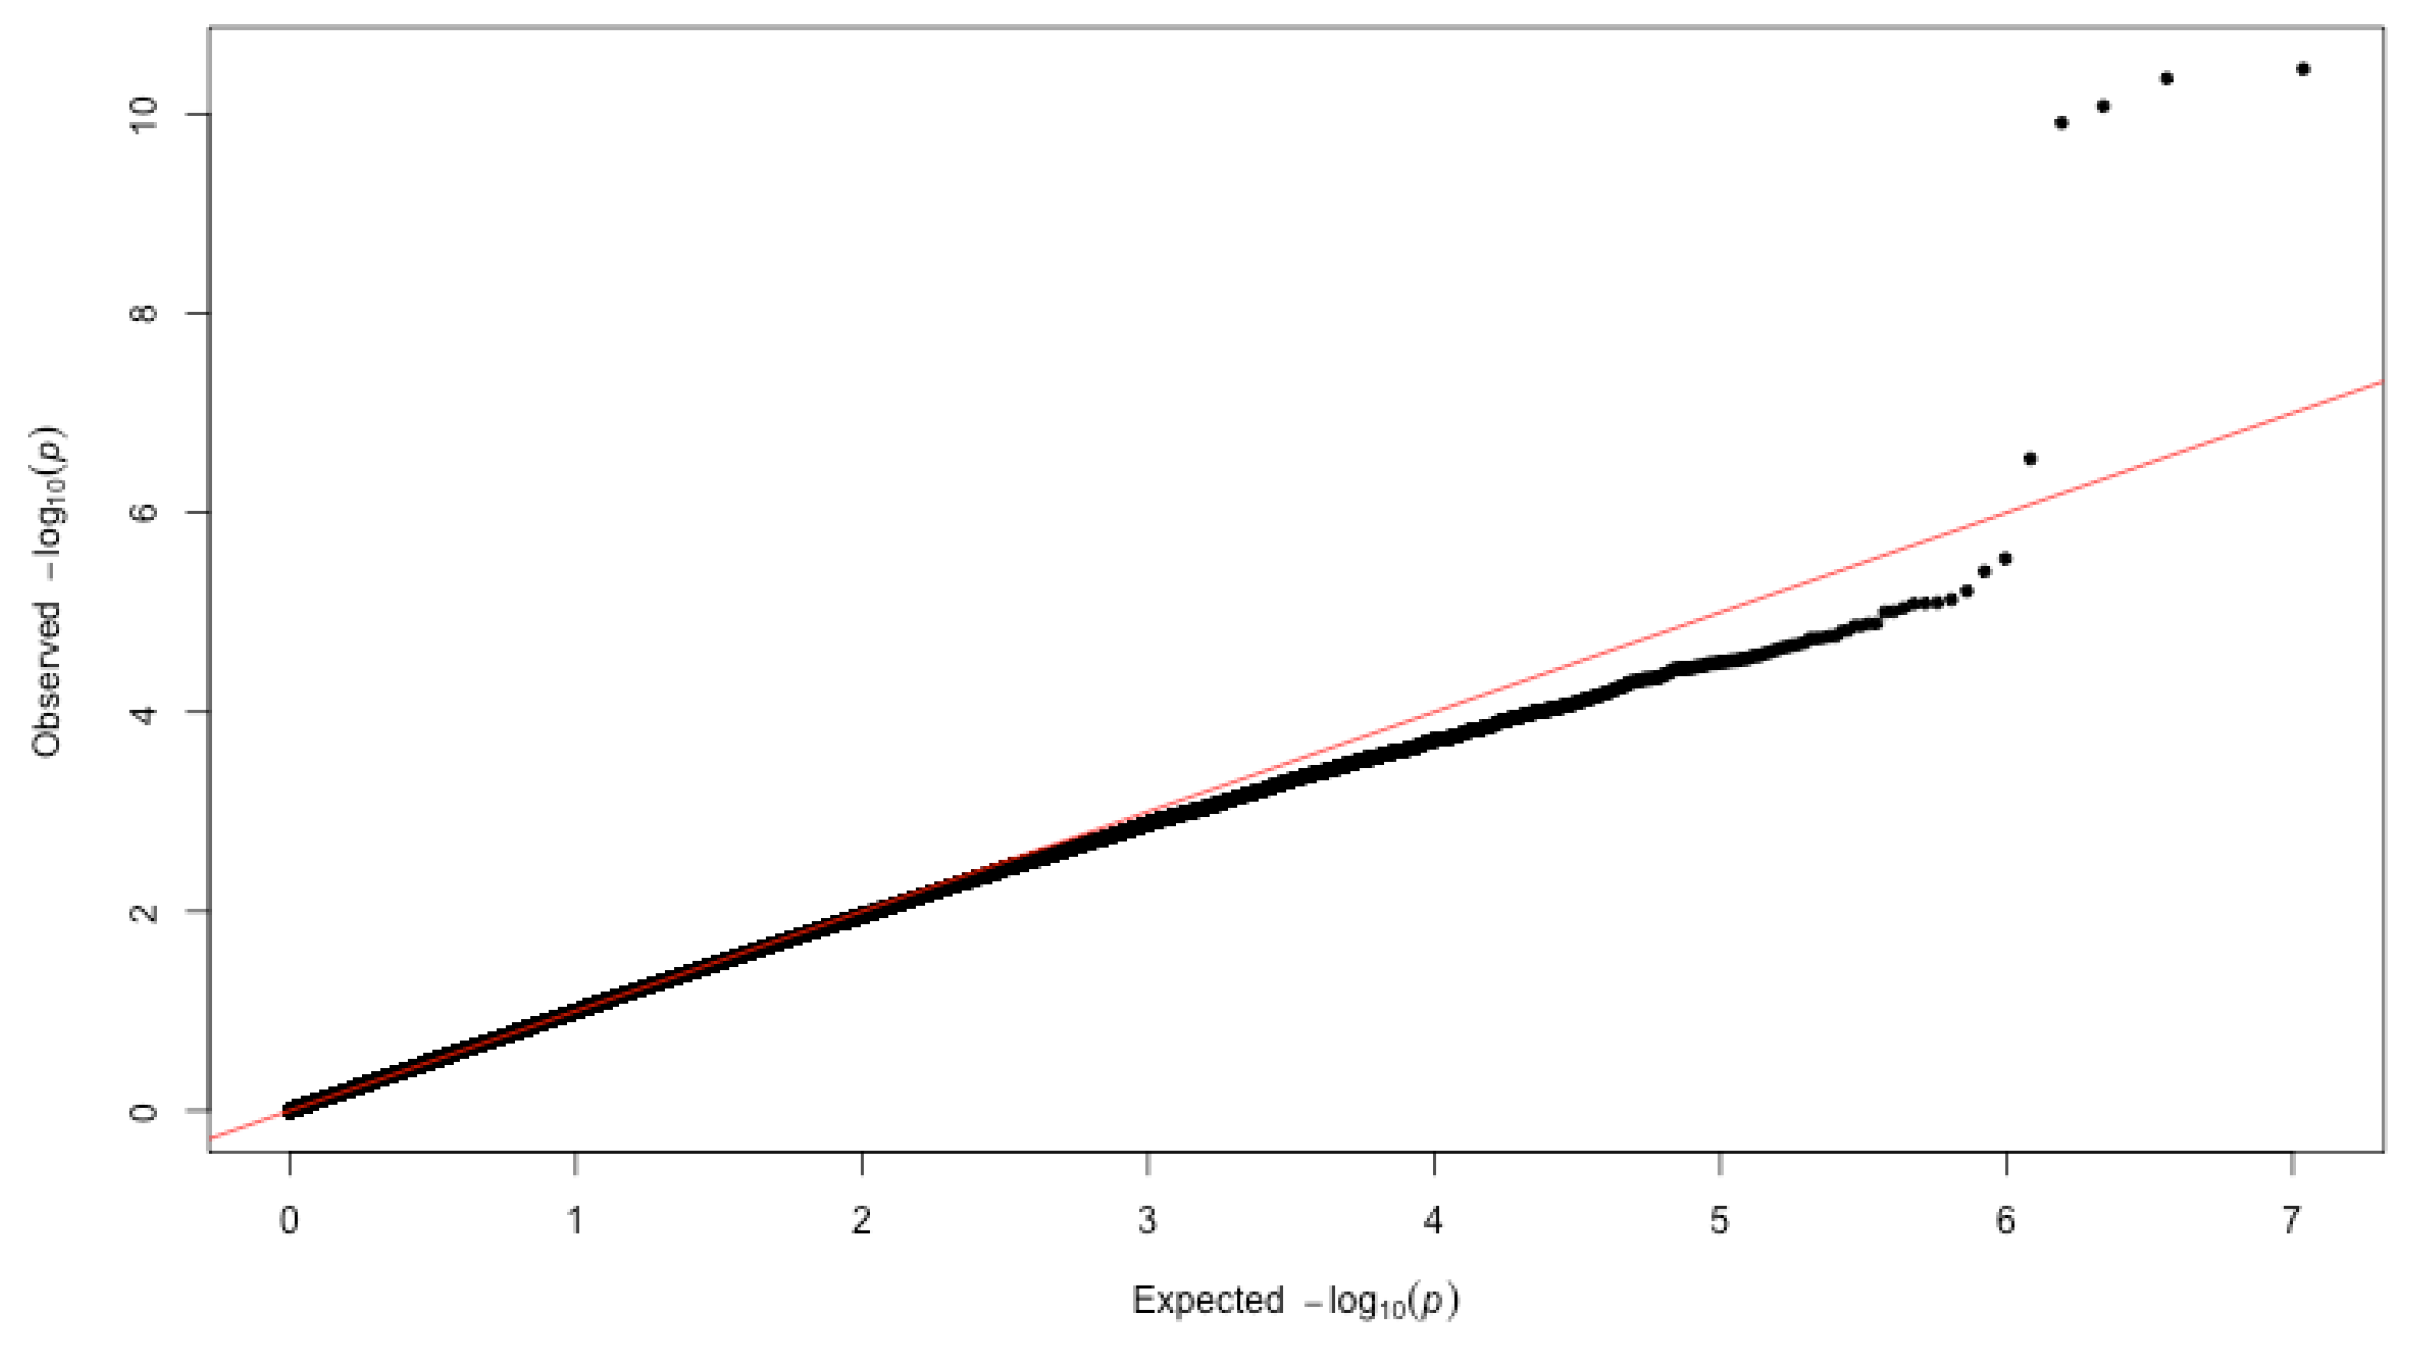
3.2. GWAS of Dementia

We performed a GWAS analysis of our collected data after merging and filtering with the non-genomic data. The ability of GWAS to identify genetic associations depends on the overall quality of the data. To avoid false negative and false positive associations, we performed quality control procedures on the data to explore true genetic associations [20]. First, we filtered out the variants with missing individuals of more than 20%, which resulted in 533,207 variants being removed. Secondly, when we set the threshold of missing sample rate to 20%, no samples were deleted. Then, we used a more stringent threshold filtering (2%) to filter the variants and individuals. A total of 4,036,397 variants and 34 individuals were removed. Furthermore, 27,994,441 variants were removed due to a minor allele less than the threshold (0.01). Meanwhile, 5,476,123 variants were maintained as SNPs. Finally, 26,631 SNPs were removed due to the Hardy–Weinberg exact test (HWE p 1 × 10 10 ). Therefore, after samples and marker quality control, the total genotyping rate was 0.994328. A total of 5,449,492 SNPs and 1399 participants passed the filters and QC. Among the remaining phenotypes, 559 were cases and 840 were controls. We performed a GWAS of dementia on the genome data after QC to identify significant SNPs exploring novel treatments.
We fit logistic regression to test the association between dementia disease status and every individual SNP. The birth year, gender, BMI and the top 10 PCs were used as covariates in logistic regression models. The p-value of the SNP coefficient in each logistic regression represents whether an SNP significantly affects the risk of dementia. These logistic regression models lead to 5,449,492 p-values for all SNPs that passed QC. The negative-log transferred p-values are visualized in the Manhattan plot Figure 2. Using the genome-wide significant threshold ( p 5 × 10 8 ), we identified four significant SNPs (rs11556505, p = 3.536 × 10 11 ; rs2075650, p = 4.394 × 10 11 ; rs34404554, p = 8.368 × 10 11 ; rs71352238, p = 1.229 × 10 11 ). Those four SNPs were represented as green dots in Figure 2. The number of the discovered SNPs was improved when we used another popular decision rule, FDR, which we identified one more SNP, rs34095326 ( F D R = 4.860 × 10 3 < 0.05 ). This SNP was represented using a red dot as in Figure 2. All these five SNPs are located on chromosome 19 and belong to the same gene, TOMM40. The relationship between TOMM40 and dementia is reported in other studies, such as [21], which serve as independent evidence of our findings.
In our study, we found that the p-values largely adhered to the expected p-values until the deviation of the five SNPs at the right-hand side tail, as shown in Figure 3. The expected p-values are calculated by assuming no SNPs are associated with the risk of dementia. Hence, these five SNPs’ deviation indicates a strong signal of associations and a low probability of false positive results. We confirmed that the five points at the tail above the diagonal are identical to the five SNPs identified by the FDR threshold. This provides independent support to find five significant SNPs (i.e., FDR rule) instead of four SNPs (i.e., the genome-wide significant threshold rule). Given our evidence, we conclude five SNPs are significantly associated with dementia with properly controlled false positives.
This study is not very well powered, given its sample size and the number of tests to be conducted. So, we decided to explore more potential signal (non-significant) SNPs or genes, sacrificing proper false positive control. Using another threshold p 1 × 10 5 (used by other published studies [14,15]) as the decision rule, we identify13 SNPs. These SNPs are located on 5 genes, including TOMM40, ATP10A-DT, PTPRM, MED21 and two undefined genes (details can be found in Table 2). We represent the extra SNPs identified using threshold p 1 × 10 5 using blue dots in Figure 2.
Among the genes identified using a relaxed p-value threshold, two genes were confirmed related to brain development and neurodevelopment. In a genetic study involving intellectual disability, autism and psychosis, ATP10A was identified as a gene that may affect neurodevelopmental disorders [22]. Therefore, we investigated these genes to explore their association with dementia. We found that PTPRM was a crucial gene involved in the formation of synapses regulated by zinc ions, which was related to the transmission of information in the brain [23]. The details of those genes are shown in Table 3.
Note that we need to highlight that the new SNPs or genes discovered with relaxed threshold 10 5 should be used with extreme caution since false positives are not properly controlled. We highly suggest using validation studies to confirm such relationships before using these SNPs and genes for critical decisions.

4. Discussions and Conclusions

We explored the biological mechanism underlying the development of dementia by conducting a GWAS of dementia and discussed three different p-value thresholds used to address multiple testing problems.
We investigated the relationship between dementia and patients’ characteristics and revealed three significant factors, birth year, gender and BMI, which are confirmed in the literature. For example, recent studies have suggested that ageing and gender are risk factors for dementia [25,26] and our study provides further validation of the hypothesis. The relationship between BMI and dementia is controversial in the literature. Our analysis found a lower BMI increases the probability of dementia in a cohort of patients with a normal BMI range (mean 25.51 and standard deviation 4.62). This result does not align with our intuition but is supported by other studies (e.g., [27]). Furthermore, we obtained the top 10 PCs to address the confound due to population structure. We input the three significant variables and the top 10 PCs into the GWAS model as covariates.
We applied and compared three discovering SNP approaches to investigate the genetic variants associated with dementia. Based on the difference in the results of these three approaches, we discuss their strength and weakness. In our analysis, we found that the genome-wide significant threshold p 5 × 10 8 is the least powerful approach, which discovered four SNPs on the TOMM40 gene located in Chromosome 19. The FDR adjustment approach is more powerful while keeping false positives of the study under control, which can discover one more significant SNP in the same gene. Using the threshold of p 1 × 10 5 , we can obtain 13 SNPs on a few uncharacterized locations on chromosome 2 and on several other genes. Among these genes, only MED21 is not discussed in related literature, which might be a false hit or a novel discovery. All other genes were reported to be associated with brain development or neuro-development, supported by the literature [22,23]. We believe these neuro-development genes are likely to be real dementia-related genes since neurological and neuropsychiatric matters are the primary causes of dementia [28].
Based on the different results of three different discovering SNP approaches in this study, we suggest using FDR adjustment if the false positives need to be properly controlled. However, GWAS studies often suffer from the issue of lack of power caused by the curse of dimensionality [29]. Investigators often cannot afford to study enough samples to address the multiple-testing issues when a huge number of tests need to be conducted in GWAS. In this situation, using a relaxed threshold, such as 10 5 , could help us find more potential signals. However, this approach needs to be used with extreme caution because it cannot properly control false positives in the study. When reporting these SNPs, authors should highlight the fact of no proper false positive control. We strongly suggest conducting validation studies to validate the SNPs discovered with a relaxed threshold if these SNPs are used to make important decisions.
In summary, we investigated three decision rules to discover significant SNPs for GWAS analysis and discussed their strengths and weaknesses. Our analysis results confirmed the significant associations of variants in TOMM40 with dementia. We discovered potential novel dementia SNPs, which were reported to be associated with brain development or neuro-development and novel SNPs with no related literature discussion. These findings reveal the genetic mechanism of dementia and may provide opportunities for identifying novel dementia treatment.

Author Contributions

L.X. and X.Z. contributed to the study conceptualization and design and supervised this project. X.C. contributed to data processing, data analysis and preparation of the first draft. X.C., Y.D., L.X. and X.Z. have developed drafts of the manuscript and approved the final draft of the manuscript. All authors have read and agreed to the published version of the manuscript.

Funding

Xuekui Zhang is a Tier 2 Canada Research Chair (Grant No. 950-231363) and a Michael Smith Health Research BC Scholar (Grant No. SCH-2022-2553). Li Xing is funded by the Natural Sciences and Engineering Research Council of Canada (Grant Number: RGPIN-2021-03530). Xiaowen Cao is funded by China Scholarship Council (Grant Number: 202106700012). Yao Dong is funded by China Scholarship Council (Grant Number: 202108130108).

Institutional Review Board Statement

Not applicable.

Informed Consent Statement

Not applicable.

Data Availability Statement

Data is available at the Electronic Medical Records and Genomics (eMERGE) Network (https://emerge-network.org/, accessed on 11 December 2022).

Acknowledgments

This research was enabled in part by support provided by WestGrid (www.westgrid.ca, accessed on 15 January 2023) and Compute Canada (www.computecanada.ca, accessed on 15 January 2023).

Conflicts of Interest

The authors declare no conflict of interest.

Abbreviations

The following abbreviations are used in this manuscript:
eMERGEelectronic Medical Records and Genomics
Q-Q plotQuantile-Quantile plot
BMIBody Mass Index
SNPSingle Nucleotide Polymorphism

References

  1. Fu, W.Y.; Ip, N.Y. The role of genetic risk factors of Alzheimer’s disease in synaptic dysfunction. Semin. Cell Dev. Biol. 2023, 139, 3–12. [Google Scholar] [CrossRef] [PubMed]
  2. Nguyen, J.; Chauhan, A. Bystanders or not? Microglia and lymphocytes in aging and stroke. Neural Regen. Res. 2023, 18, 1397. [Google Scholar] [PubMed]
  3. Ayenigbara, I.O. Preventive Measures against the Development of Dementia in Old Age. Korean J. Fam. Med. 2022, 43, 157–167. [Google Scholar] [CrossRef] [PubMed]
  4. Migliore, L.; Coppedè, F. Gene–environment interactions in Alzheimer disease: The emerging role of epigenetics. Nat. Rev. Neurol. 2022, 18, 643–660. [Google Scholar] [CrossRef]
  5. Wightman, D.P.; Jansen, I.E.; Savage, J.E.; Shadrin, A.A.; Bahrami, S.; Holland, D.; Rongve, A.; Børte, S.; Winsvold, B.S.; Drange, O.K.; et al. A genome-wide association study with 1,126,563 individuals identifies new risk loci for Alzheimer’s disease. Nat. Genet. 2021, 53, 1276–1282. [Google Scholar] [CrossRef] [PubMed]
  6. Moreno-Grau, S.; Rojas, I.D.; Hernández, I.; Quintela, I.; Montrreal, L.; Alegret, M.; Hernández-Olasagarre, B.; Madrid, L.; González-Perez, A.; Maroñas, O.; et al. Genome-wide association analysis of dementia and its clinical endophenotypes reveal novel loci associated with Alzheimer’s disease and three causality networks: The GR@ACE project. Alzheimers Dement. 2019, 15, 1333–1347. [Google Scholar] [CrossRef]
  7. Strittmatter, W.J.; Saunders, A.M.; Schmechel, D.; Pericak-Vance, M.; Enghild, J.; Salvesen, G.S.; Roses, A.D. Apolipoprotein E: High-avidity binding to beta-amyloid and increased frequency of type 4 allele in late-onset familial Alzheimer disease. Proc. Natl. Acad. Sci. USA 1993, 90, 1977–1981. [Google Scholar] [CrossRef] [Green Version]
  8. Cervantes, S.; Samaranch, L.; Vidal-Taboada, J.M.; Lamet, I.; Bullido, M.J.; Frank-García, A.; Coria, F.; Lleó, A.; Clarimón, J.; Lorenzo, E.; et al. Genetic variation in APOE cluster region and Alzheimer’s disease risk. Neurobiol. Aging 2011, 32, 2107.e7. [Google Scholar] [CrossRef]
  9. Mishra, S.; Knupp, A.; Szabo, M.P.; Williams, C.A.; Kinoshita, C.; Hailey, D.W.; Wang, Y.; Andersen, O.M.; Young, J.E. The Alzheimer’s gene SORL1 is a regulator of endosomal traffic and recycling in human neurons. Cell. Mol. Life Sci. 2022, 79, 162. [Google Scholar] [CrossRef]
  10. Harold, D.; Abraham, R.; Hollingworth, P.; Sims, R.; Gerrish, A.; Hamshere, M.L.; Pahwa, J.S.; Moskvina, V.; Dowzell, K.; Williams, A.; et al. Genome-wide association study identifies variants at CLU and PICALM associated with Alzheimer’s disease. Nat. Genet. 2009, 41, 1088–1093. [Google Scholar] [CrossRef]
  11. Roeder, K.; Wasserman, L. Genome-Wide Significance Levels and Weighted Hypothesis Testing. Stat. Sci. 2009, 24, 398–413. [Google Scholar] [CrossRef] [Green Version]
  12. Krohn, L.; Heilbron, K.; Blauwendraat, C.; Reynolds, R.H.; Yu, E.; Senkevich, K.; Rudakou, U.; Estiar, M.A.; Gustavsson, E.K.; Brolin, K.; et al. Genome-wide association study of REM sleep behavior disorder identifies polygenic risk and brain expression effects. Nat. Commun. 2022, 13, 7496. [Google Scholar] [CrossRef] [PubMed]
  13. Xu, Y.; Xing, L.; Su, J.; Zhang, X.; Qiu, W. Model-based clustering for identifying disease-associated SNPs in case-control genome-wide association studies. Sci. Rep. 2019, 9, 13686. [Google Scholar] [CrossRef] [PubMed] [Green Version]
  14. Magrangeas, F.; Kuiper, R.; Avet-Loiseau, H.; Gouraud, W.; Guérin-Charbonnel, C.; Ferrer, L.; Aussem, A.; Elghazel, H.; Suhard, J.; Sakissian, H.D.; et al. A Genome-Wide Association Study Identifies a Novel Locus for Bortezomib-Induced Peripheral Neuropathy in European Patients with Multiple Myeloma. Clin. Cancer Res. 2016, 22, 4350–4355. [Google Scholar] [CrossRef] [PubMed] [Green Version]
  15. Kang, G.; Liu, W.; Cheng, C.; Wilson, C.L.; Neale, G.; Yang, J.J.; Ness, K.K.; Robison, L.L.; Hudson, M.M.; Srivastava, D.K. Evaluation of a two-step iterative resampling procedure for internal validation of genome-wide association studies. J. Hum. Genet. 2015, 60, 729–738. [Google Scholar] [CrossRef] [Green Version]
  16. McCarty, C.A.; Chisholm, R.L.; Chute, C.G.; Kullo, I.J.; Jarvik, G.P.; Larson, E.B.; Li, R.; Masys, D.R.; Ritchie, M.D.; Roden, D.M.; et al. The eMERGE Network: A consortium of biorepositories linked to electronic medical records data for conducting genomic studies. BMC Med. Genom. 2011, 4, 13. [Google Scholar] [CrossRef] [Green Version]
  17. Gottesman, O.; Kuivaniemi, H.; Tromp, G.; Faucett, W.A.; Li, R.; Manolio, T.A.; Sanderson, S.C.; Kannry, J.; Zinberg, R.; Basford, M.A.; et al. The Electronic Medical Records and Genomics (eMERGE) Network: Past, present and future. Genet. Med. 2013, 15, 761–771. [Google Scholar] [CrossRef] [Green Version]
  18. Nelson, M.R.; Marnellos, G.; Kammerer, S.; Hoyal, C.R.; Shi, M.M.; Cantor, C.R.; Braun, A. Large-Scale Validation of Single Nucleotide Polymorphisms in Gene Regions. Genome Res. 2004, 14, 1664–1668. [Google Scholar] [CrossRef] [Green Version]
  19. Marees, A.T.; Kluiver, H.d.; Stringer, S.; Vorspan, F.; Curis, E.; Marie-Claire, C.; Derks, E.M. A tutorial on conducting genome-wide association studies: Quality control and statistical analysis. Int. J. Methods Psychiatr. Res. 2018, 27, e1608. [Google Scholar] [CrossRef] [Green Version]
  20. Turner, S.; Armstrong, L.L.; Bradford, Y.; Carlson, C.S.; Crawford, D.C.; Crenshaw, A.T.; Andrade, M.; Doheny, K.F.; Haines, J.L.; Hayes, G.; et al. Quality Control Procedures for Genome-Wide Association Studies. Curr. Protoc. Hum. Genet. 2011, 68, 1.19.1–1.19.18. [Google Scholar] [CrossRef]
  21. Lahti, J.; Tuominen, S.; Yang, Q.; Pergola, G.; Ahmad, S.; Amin, N.; Armstrong, N.J.; Beiser, A.; Bey, K.; Bis, J.C.; et al. Genome-wide meta-analyses reveal novel loci for verbal short-term memory and learning. Mol. Psychiatry 2022, 27, 4419–4431. [Google Scholar] [CrossRef]
  22. Huang, Y.S.; Fang, T.H.; Kung, B.; Chen, C.H. Two Genetic Mechanisms in Two Siblings with Intellectual Disability, Autism Spectrum Disorder and Psychosis. J. Pers. Med. 2022, 12, 1013. [Google Scholar] [CrossRef]
  23. Mo, X.; Liu, M.; Gong, J.; Mei, Y.; Chen, H.; Mo, H.; Yang, X.; Li, J. PTPRM Is Critical for Synapse Formation Regulated by Zinc Ion. Front. Mol. Neurosci. 2022, 15, 822458. [Google Scholar] [CrossRef] [PubMed]
  24. Larivière, L.; Plaschka, C.; Seizl, M.; Petrotchenko, E.V.; Wenzeck, L.; Borchers, C.H.; Cramer, P. Model of the Mediator middle module based on protein cross-linking. Nucleic Acids Res. 2013, 41, 9266–9273. [Google Scholar] [CrossRef] [PubMed] [Green Version]
  25. Stephan, Y.; Sutin, A.R.; Luchetti, M.; Terracciano, A. Subjective age and risk of incident dementia: Evidence from the National Health and Aging Trends survey. J. Psychiatr. Res. 2018, 100, 1–4. [Google Scholar] [CrossRef] [Green Version]
  26. Mielke, M.M. Sex and Gender Differences in Alzheimer’s Disease Dementia. Psychiatr. Times 2018, 35, 14–17. [Google Scholar]
  27. Eruysal, E.; Ravdin, L.; Zhang, C.; Kamel, H.; Iadecola, C.; Ishii, M. Sexually Dimorphic Association of Circulating Plasminogen Activator Inhibitor-1 Levels and Body Mass Index with Cerebrospinal Fluid Biomarkers of Alzheimer’s Pathology in Preclinical Alzheimer’s Disease. J. Alzheimers Dis. 2022, 91, 1–11. [Google Scholar] [CrossRef] [PubMed]
  28. Gale, S.A.; Acar, D.; Daffner, K.R. Dementia. Am. J. Med. 2018, 131, 1161–1169. [Google Scholar] [CrossRef] [PubMed]
  29. Uffelmann, E.; Huang, Q.Q.; Munung, N.S.; Vries, J.d.; Okada, Y.; Martin, A.R.; Martin, H.C.; Lappalainen, T.; Posthuma, D. Genome-wide association studies. Nat. Rev. Methods Prim. 2021, 1, 59. [Google Scholar] [CrossRef]
Figure 1. Explore data analysis of three significant variables. (a) indicates the year-of-birth information of the participants in the case and control groups of dementia. The birth years are divided into three groups with a decade interval, 1930–1939, 1920–1929 and 1900–1919, respectively. The legend shows the bars’ colours of case and control groups. Under the legend is the result of Pearson’s Chi-squared test on the birth years of the two groups. (b) The gender distribution in the two groups. The legend shows the bars’ colours of case and control groups. Under the legend is the result of Pearson’s Chi-squared test on the gender of the two groups. Boxplots in (c) represent the BMI information of the participants in the two groups and the p-value shown in (c) is the result of the Wilcoxon test on the BMI of the two groups.
Biomedinformatics 03 00010 g001
Figure 2. Scatterplot of chromosomal position (x-axis) against log 10 ( p ) (y-axis). It shows genome-wide associations from the significant loci with dementia. The red line indicates the genome-wide significant threshold ( p 5 × 10 8 ) and the blue line indicates the genome-wide suggestive threshold ( p 1 × 10 5 ). We highlighted the SNPs with p 1 × 10 5 in blue points, red points and green points. The green points represent those SNPs that passed the genome-wide significant threshold ( p 5 × 10 8 ), the red point is the SNP that passed the FDR threshold ( p 0.05 ) and the other blue points are general SNPs with p 1 × 10 5 .
Biomedinformatics 03 00010 g002
Figure 3. Quantile–quantile plot of the data. It shows observed log 10 ( p ) (y-axis) and expected log 10 ( p ) (x-axis) distribution in the GWAS of dementia. The red line represents y = x. If the two distributions are similar, the points are roughly distributed on this line. Five SNPs on TOMM40 correspond to the five points above the diagonal.
Biomedinformatics 03 00010 g003
Table 1. Demographic and clinical characteristics of the patients (full analysis population).
CharacteristicCase (N = 578)Control (N = 855)p-Value
Gender (%)   1.26 × 10 3
Female346 (59.86)438 (51.22) 
Male232 (40.14)417 (48.77) 
Birth year (%)  < 2 × 10 16
Birth in 1900–1919451 (78.03)486 (56.84) 
Birth in 1920–1929126 (21.80)352 (41.16) 
Birth in 1930–19391 (0.17)17 (1.99) 
BMI (Mean ± SD)25.51 (±4.62)26.43 (±4.73) 7.11 × 10 4
Smoke Status (%)  0.46
Never72 (43.11)223 (37.99) 
Current9 (5.39)39 (6.64) 
Past86 (54.50)325 (55.37) 
STC (Mean ± SD)232.41 (±42.37)229.47 (±43.10)0.26
H-PSA (Mean ± SD)4.17 (±6.18)3.63 (±4.43)0.53
Race (%)  0.34
Black or African American31 (5.37)32 (3.74) 
Unknown11 (1.90)10 (1.17) 
American Indian or Alaska Native2 (0.35)1 (0.12) 
Asian11 (1.90)19 (2.22) 
White523 (90.48)793 (92.70) 
BMI = Body Mass Index; H-PSA = Highest record of PS (prostate specific antigen); STC = Serum total cholesterol.
Table 2. Detailed information of significant SNPs with p 1 × 10 05 (sorted by p-value from smallest to largest). We marked the genes associated with dementia using (*) and a series of novel genes related to brain development or neurodevelopment using (-).
SNPIDCHRp-ValueFDRBPGENE
1rs1155650519 3.536 × 10 11 1.852 × 10 06 45396144TOMM40 *
2rs207565019 4.394 × 10 11 1.852 × 10 06 45,395,619TOMM40 *
3rs3440455419 8.368 × 10 11 2.352 × 10 06 45,395,909TOMM40 *
4rs7135223819 1.229 × 10 10 2.590 × 10 06 45,394,336TOMM40 *
5rs3409532619 2.882 × 10 07 4.860 × 10 03 45,395,844TOMM40 *
6rs7268926715 2.899 × 10 06 4.182 × 10 01 26,117,761ATP10A-DT -
7rs66816818 6.111 × 10 06 5.216 × 10 01 8,392,719PTPRM -
8rs14482209712 7.455 × 10 06 9.956 × 10 01 27,183,821MED21
9rs67030518 8.009 × 10 06 5.216 × 10 01 8,392,750PTPRM -
10rs717876515 8.222 × 10 06 5.929 × 10 01 26,121,173ATP10A-DT -
11rs478510816 9.097 × 10 06 4.489 × 10 01 60,446,014LOC101927605
12rs988898516 9.795 × 10 06 4.489 × 10 01 60,427,440LOC101927605
13rs104580226 9.910 × 10 06 9.999 × 10 01 58,308,335LOC101927293
CHR = chromosome; BP = base–pair position; * it has been confirmed that this gene is associated with dementia; - it has been confirmed that this gene is related to brain development or neurodevelopmental disorders.
Table 3. The function of the novel significant genes. ATP10A-DT and PTPRM are related to brain development and neurodevelopment. The third column shows the reference that supports the gene function.
GeneFunctionReference
1MED21an enzyme in humans[24]
2ATP10A-DTit can affect neurodevelopmental disorders[22]
3PTPRMit involved in the formation of synapses regulated by zinc ions,
which is related to the transmission of information in the brain.
[23]
Disclaimer/Publisher’s Note: The statements, opinions and data contained in all publications are solely those of the individual author(s) and contributor(s) and not of MDPI and/or the editor(s). MDPI and/or the editor(s) disclaim responsibility for any injury to people or property resulting from any ideas, methods, instructions or products referred to in the content.

