
Automatic Ship Detection Using PolSAR Imagery and the Double Scatterer Model

Electronics Laboratory, (ELLAB), Physics Department, University of Patras, 26504 Rio, Greece
*
Author to whom correspondence should be addressed.
Geomatics 2023, 3(1), 174-187; https://doi.org/10.3390/geomatics3010009
Submission received: 28 December 2022
/
Revised: 26 January 2023
/
Accepted: 3 February 2023
/
Published: 6 February 2023
Abstract
:In ship detection by means of Polarimetric SAR imagery, a very promising feature is the characterization of the pixels of the ship based on the elementary scattering mechanisms that can be extracted using different decomposition algorithms. Elementary scattering mechanisms provide information regarding the physical, electrical and geometrical properties of the scatterers in each Polarimetric SAR pixel. In this work, the newly established algorithm of the Double Scatterer Model is applied to interpret each pixel of the Polarimetric SAR image with the contributions of two elementary scattering mechanisms, namely, primary and secondary. The main idea is to construct a binary image while preserving the rich information content in order to proceed in simple and fast image processing for target detection. The present algorithm is applied to datasets with different inherent characteristics acquired by Radarsat-2 and ALOS-PALSAR. The results presented by this new perspective on ship monitoring are remarkable.
1. Introduction
Ship detection and monitoring is essential for a wide range of purposes, such as maritime surveillance, traffic, migration control and environmental protection. Since the launch of SeaSat in 1978, Satellite Aperture Radar (SAR) systems have proven to be unique tools for ship detection and maritime monitoring, as ship signatures are significant features frequently found in SAR ocean imagery. Characteristics such as high resolution, sensitivity to small variations in surface roughness and especially the strong signal return from hard targets like ships make SAR systems particularly adept at detecting targets at sea [1].
SAR systems exploit the advantage of electromagnetic waves to penetrate clouds, foliage and even the upper layer of the Earth’s surface and acquire data at any time of day or night. SAR images own these capabilities to promote the use of Fully Polarimetric SAR (PolSAR), also known as Quad Pol imaging systems.
PolSAR data contains the full polarization scattering matrix of each pixel in the scene by means of transmitting and receiving electromagnetic waves with different polarizations. Compared with the conventional single PolSAR, the polarimetric scattering matrix contains more information, which can represent the response of the target to different electromagnetic waves [2]. Therefore, by utilizing different polarizations, it is possible to extract unique and distinct features from targets. Some features can be observed in one polarization and not in another. Target characteristics can be defined more clearly by combining all four polarization modes. Therefore, to improve the detection performance of ship targets and optimize the separation from background clutter, most research utilizes PolSAR data.
The most common form of algorithm used in PolSAR images to detect ship targets against a background of noise, clutter and interference is the Constant False Alarm Rate (CFAR) algorithm [3,4]. Compared with sea clutter, ship targets have strong scattering echo; therefore, CFAR detectors are based on the statistical models describing the sea, in order to extract the signal of interest as a component deviating from the predetermined behavior. The most applied statistical models for sea clutter are Alpha state distribution, Weibull and K distribution, gamma and generalized Gaussian distribution [5,6,7]. Another classic approach is based on filtering methods to enhance the contrast between the target and the sea, such as the application of the Polarimetric Whitening Filter [8] and the Polarimetric Notch Filter [9].
Considering the different polarimetric scattering behavior of ships, coastal areas and the sea, plenty of scattering-mechanism-based algorithms have been proposed for accurate ship detection. Decomposition techniques for target information retrieved from polarimetric synthetic aperture radar (PolSAR) images have been extensively studied since the 1980s [10]. The main idea is to extract features that can describe PolSAR images in multiple aspects in order to be utilized in classification and target detection procedures.
Touzi et al. [11] explored Cloude-Pottier non-coherent decomposition [12], according to which the scattering characteristics were represented by the space of entropy and the averaged scattering angle , achieving good results in ship target detection. Ringrose et al. [13] used Cameron’s coherent decomposition [14] to discriminate ships from clutter based on the dominant scattering mechanism in each PolSAR cell. The four-component-model-based decomposition introduced by Yamaguchi et al. [15] was applied by Sugimoto et al. [16] for man-made target detection on the sea surface, while another four-component-model-based decomposition method incorporating surface, double-bounce, volume and cross-polarized components was proposed by Xi et al. [17] for analyzing the scattering mechanisms of ships. Apart from the abovementioned procedures, many techniques based on statistical approaches have been recently presented. Liu et al. [18] introduced a novel neighborhood polarimetric covariance matrix to detect small ships, leading to a significant separability between ship targets and sea clutter, while Cui et al. [19] extended the polarimetric correlation from a fixed angle to the rotation domain along the radar line of sight, extracting, in this way, a new set of features, resulting in accurate discrimination especially for inshore dense ships.
Despite the increase in detection accuracy achieved by these new sophisticated algorithms, several challenges remain. For instance, detection performance is sometimes insufficient and strongly dependent on sea state conditions, vessel size and material, data acquisition parameters and inherent characteristics of PolSAR data. In order to present a new feature in ship detection, this research introduces the exploitation of the Double Scatterer Model presented by Karachristos et al. [20] for a more in-depth interpretation of the target scattering behavior. The new features extracted are statistically analyzed and form a binary image, which, after being properly processed, results in high precision ship detection. The main idea of the proposed algorithm is based on the separation between the target and clutter, which can be considered to be a binary problem, with targets represented by digit 0 and clutter by 1, regardless of whether the clutter is sea, land or noise.
This paper is structured as follows: Section 2 contains a thorough description of the fully polarimetric data used to validate the proposed algorithm. Section 3 briefly provides the method of the Double Scatterer Model used to analyze the scattering behavior of the data. In Section 4, the proposed algorithm is presented, while Section 5 presents a discussion of the results and a comparison with another well-established method. Finally, conclusions are drawn in Section 6.
2. Fully Polarimetric Datasets
The evaluation of the proposed ship detection algorithm is carried out using three fully polarimetric Level-1 Single Look Complex (SLC) products. The first and the second data products were obtained by the RADARSAT-2, a spaceborne system of the Canadian Space Agency, using the C-band, in April 2008. The images were acquired using the Fine Quad-Pol Beam mode, which provides full polarimetric imaging with nominal resolution 5.2 × 7.6 [Range × Azimuth] () with swath widths of approximately 25 km, covering any area within the region from an incidence angle of 18 degrees to at least 49 degrees. The first scene contains an area of Vancouver, while the second data product depicts the area of San Francisco. The third dataset was obtained by the Phase Array L-band Synthetic Aperture Radar (PALSAR) aboard ALOS-1 using the L-band in the Polarimetric mode that provides a nominal resolution of approximately 9.4 × 3.6 [Range × Azimuth] (). The area of interest was located in Thailand, and the fully polarimetric scene was taken in September 2016.
SLC images are represented by a complex (I and Q) magnitude value and therefore contain both amplitude and phase information. To properly work with the SLC data, radiometric calibration processes are needed in order to convert raw digital image data from a satellite to a common physical scale based on known reflectance measurements taken from objects on the ground surface. The calibration procedure was carried out in the Sentinel Application Platform (SNAP) environment. SNAP is a common architecture for all Sentinel Toolboxes. SNAP and the individual Sentinel Toolboxes support numerous sensors, other than Sentinel sensors. ESA/ESRIN provides the SNAP user tool free of charge to the Earth Observation Community [21].
It should be noted that PolSAR cells from the first two datasets obtained by the RADARSAT-2 in C-band are used to train the proposed algorithm, while the entire third polarimetric scene acquired by ALOS-PALSAR in L-band is used to test the present methodology.
3. Double Scatterer Model
Based on Cameron’s coherent decomposition, the Double Scatterer Model algorithm presents a feature extraction approach that interprets each PolSAR cell as a mixture of two fundamental scattering mechanisms.
In particular, W. L. Cameron et al. [14] presented a technique for decomposing the polarization scattering matrix into three parts, based on the properties of reciprocity and symmetry. The three parts are: Non-reciprocal, Asymmetric and Symmetric. The first stage is to decompose the scattering matrix into reciprocal and non-reciprocal components via angle . The second stage considers decomposition of the reciprocal term into two further components, namely symmetric and non-symmetric via angle . The Cameron’s Decomposition takes the following form:
where the scalar , the angle represents the degree to which the scattering matrix obeys the reciprocity principle, and the angle represents the degree to which the scattering matrix deviates from the set of scattering matrices corresponding to symmetric scatterers. represents the normalized nonreciprocal components, the normalized maximum symmetric component and the the normalizes minimum symmetric component.
The maximum symmetric component can be transformed into a normalized complex vector with being referred to as a complex parameter that eventually determines the scattering mechanism. The normalized complex vector is given by:
Cameron in order to determine the scattering behavior of an unknown scattering target considered the following distance metric for the topology of complex unit disk depicted in Figure 1:
Cameron et al. [22] noticed the need for a closed surface rather than the disk, and ideally, the symmetric space could be the unit sphere. This was thoroughly demonstrated by a mapping procedure proposed in [22]. This mapping procedure is depicted in Figure 2. Specifically, in the new topology, they associated each point of the unit disk in Figure 1 with a circular arc on the unit sphere containing the points , and (Figure 2). Obviously, for the point not on the rim of the disk, the arc length is less than . In such a case, the arc is “stretched” to have a length equal to and to be part of a great circle. By associating each point to a semi-circle, the way this mapping works is easily depicted, by placing these circles tangent on the sphere’s surface with the initial position of the point on the unit disk determining the latitude and longitude of the point on the unit sphere. This mapping is represented in Figure 2, with spherical coordinates and given by:
where
The space distance measure of a test scatterer and each of the reference scattering mechanisms of Table 1 is now given by an equivalent to (3) but more intuitive form:
with
and
Inspired by Cameron’s approach, K. Karachristos et al. [20] presented the Double Scatterer Model, an algorithm extension of Cameron’s stepwise procedure, in order to extract more information from PolSAR cells using the percentages of the most dominant elementary scattering mechanisms located in each cell. Specifically, the main steps of the method are the following:
- 1.
- For each scattering matrix, the complex parameter is computed. If the criteria of reciprocity and symmetry are met, the imaginary and the real part of determine a point on the complex unit disk, according to Cameron’s algorithm.
- 2.
- The mapping of the point on the surface of the unit sphere follows. The PolSAR cell under examination and its scattering matrix is now represented by the longitude and the latitude on the unit sphere (Figure 3).
- 3.
- According to Poelman [23], the elemental scattering mechanisms of Cylinder and Narrow Diplane can be obtained as a linear combination of the remaining elementary scatterers:
Since the scattering mechanisms of Cylinder and Narrow Diplane can be composed by Trihedral, Dipole and Dihedral, the three mentioned above, as well as the ¼ wave device, can be characterized as the fundamental scattering mechanisms. This claim led us to disregard the scattering mechanisms of Cylinder and Narrow Diplane, being of minimum importance, and to update the spherical topology as it depicted in Figure 3.
- 4.
- Depending on the angle values of the point under examination, the right-angled spherical triangle to which it belongs is located. Whether it is above or below the equator, one vertex of the triangle will always be the one pole of the sphere and the other two, the nearest scattering mechanisms calculated by using the orthodromic/great circle distance :
- 5.
- The vector with an initial point on the sphere’s center and the terminal one given by the coordinates on the spherical shell is projected on the level of the equator to which the reference scattering mechanisms belong, based on the angle (Figure 3). Specifically, the projection is contained in the quadrant enclosed by the center of the sphere and the two closest to the examination point scatterers.
- 6.
- The immediate consequence is the analysis of the projection of the vector in two vertical components, which are the two nearest scatterers.
Based on the above, the mixture interpretation for each scatterer is accomplished by:
It is important to note the computes the contribution degree of each of the two dominating fundamental scattering mechanisms. When is approaching 1 or 100%, it means that the target scatterer is fully described by one of the four fundamental scattering mechanisms.
In the marginal case where , the scatterer can be assumed as undetermined and be classified as “non-Categorizable”. The same class is used for asymmetric scatterers.
4. Ship Detection Algorithm
The proposed algorithm is inspired by the interpretation of the scattering behavior of PolSAR cells, according to the Double Scatterer Model decomposition algorithm. Ships are defined as targets, while sea is defined as clutter. Therefore, a discrimination of specific regions from the available data, corresponding to these two cases, takes place at first. The data used for the learning process are numbered 1600 PolSAR cells in each case (clutter and targets) and belong to PolSAR acquisitions from coastal areas of Vancouver and San Francisco, where the targets/ships are clearly located utilizing the component of intensity HV, as it is depicted in Figure 4a,b. Specifically, the PolSAR cells inside the red circles correspond to ships, while the cells in the blue rectangular are assumed as clutter.
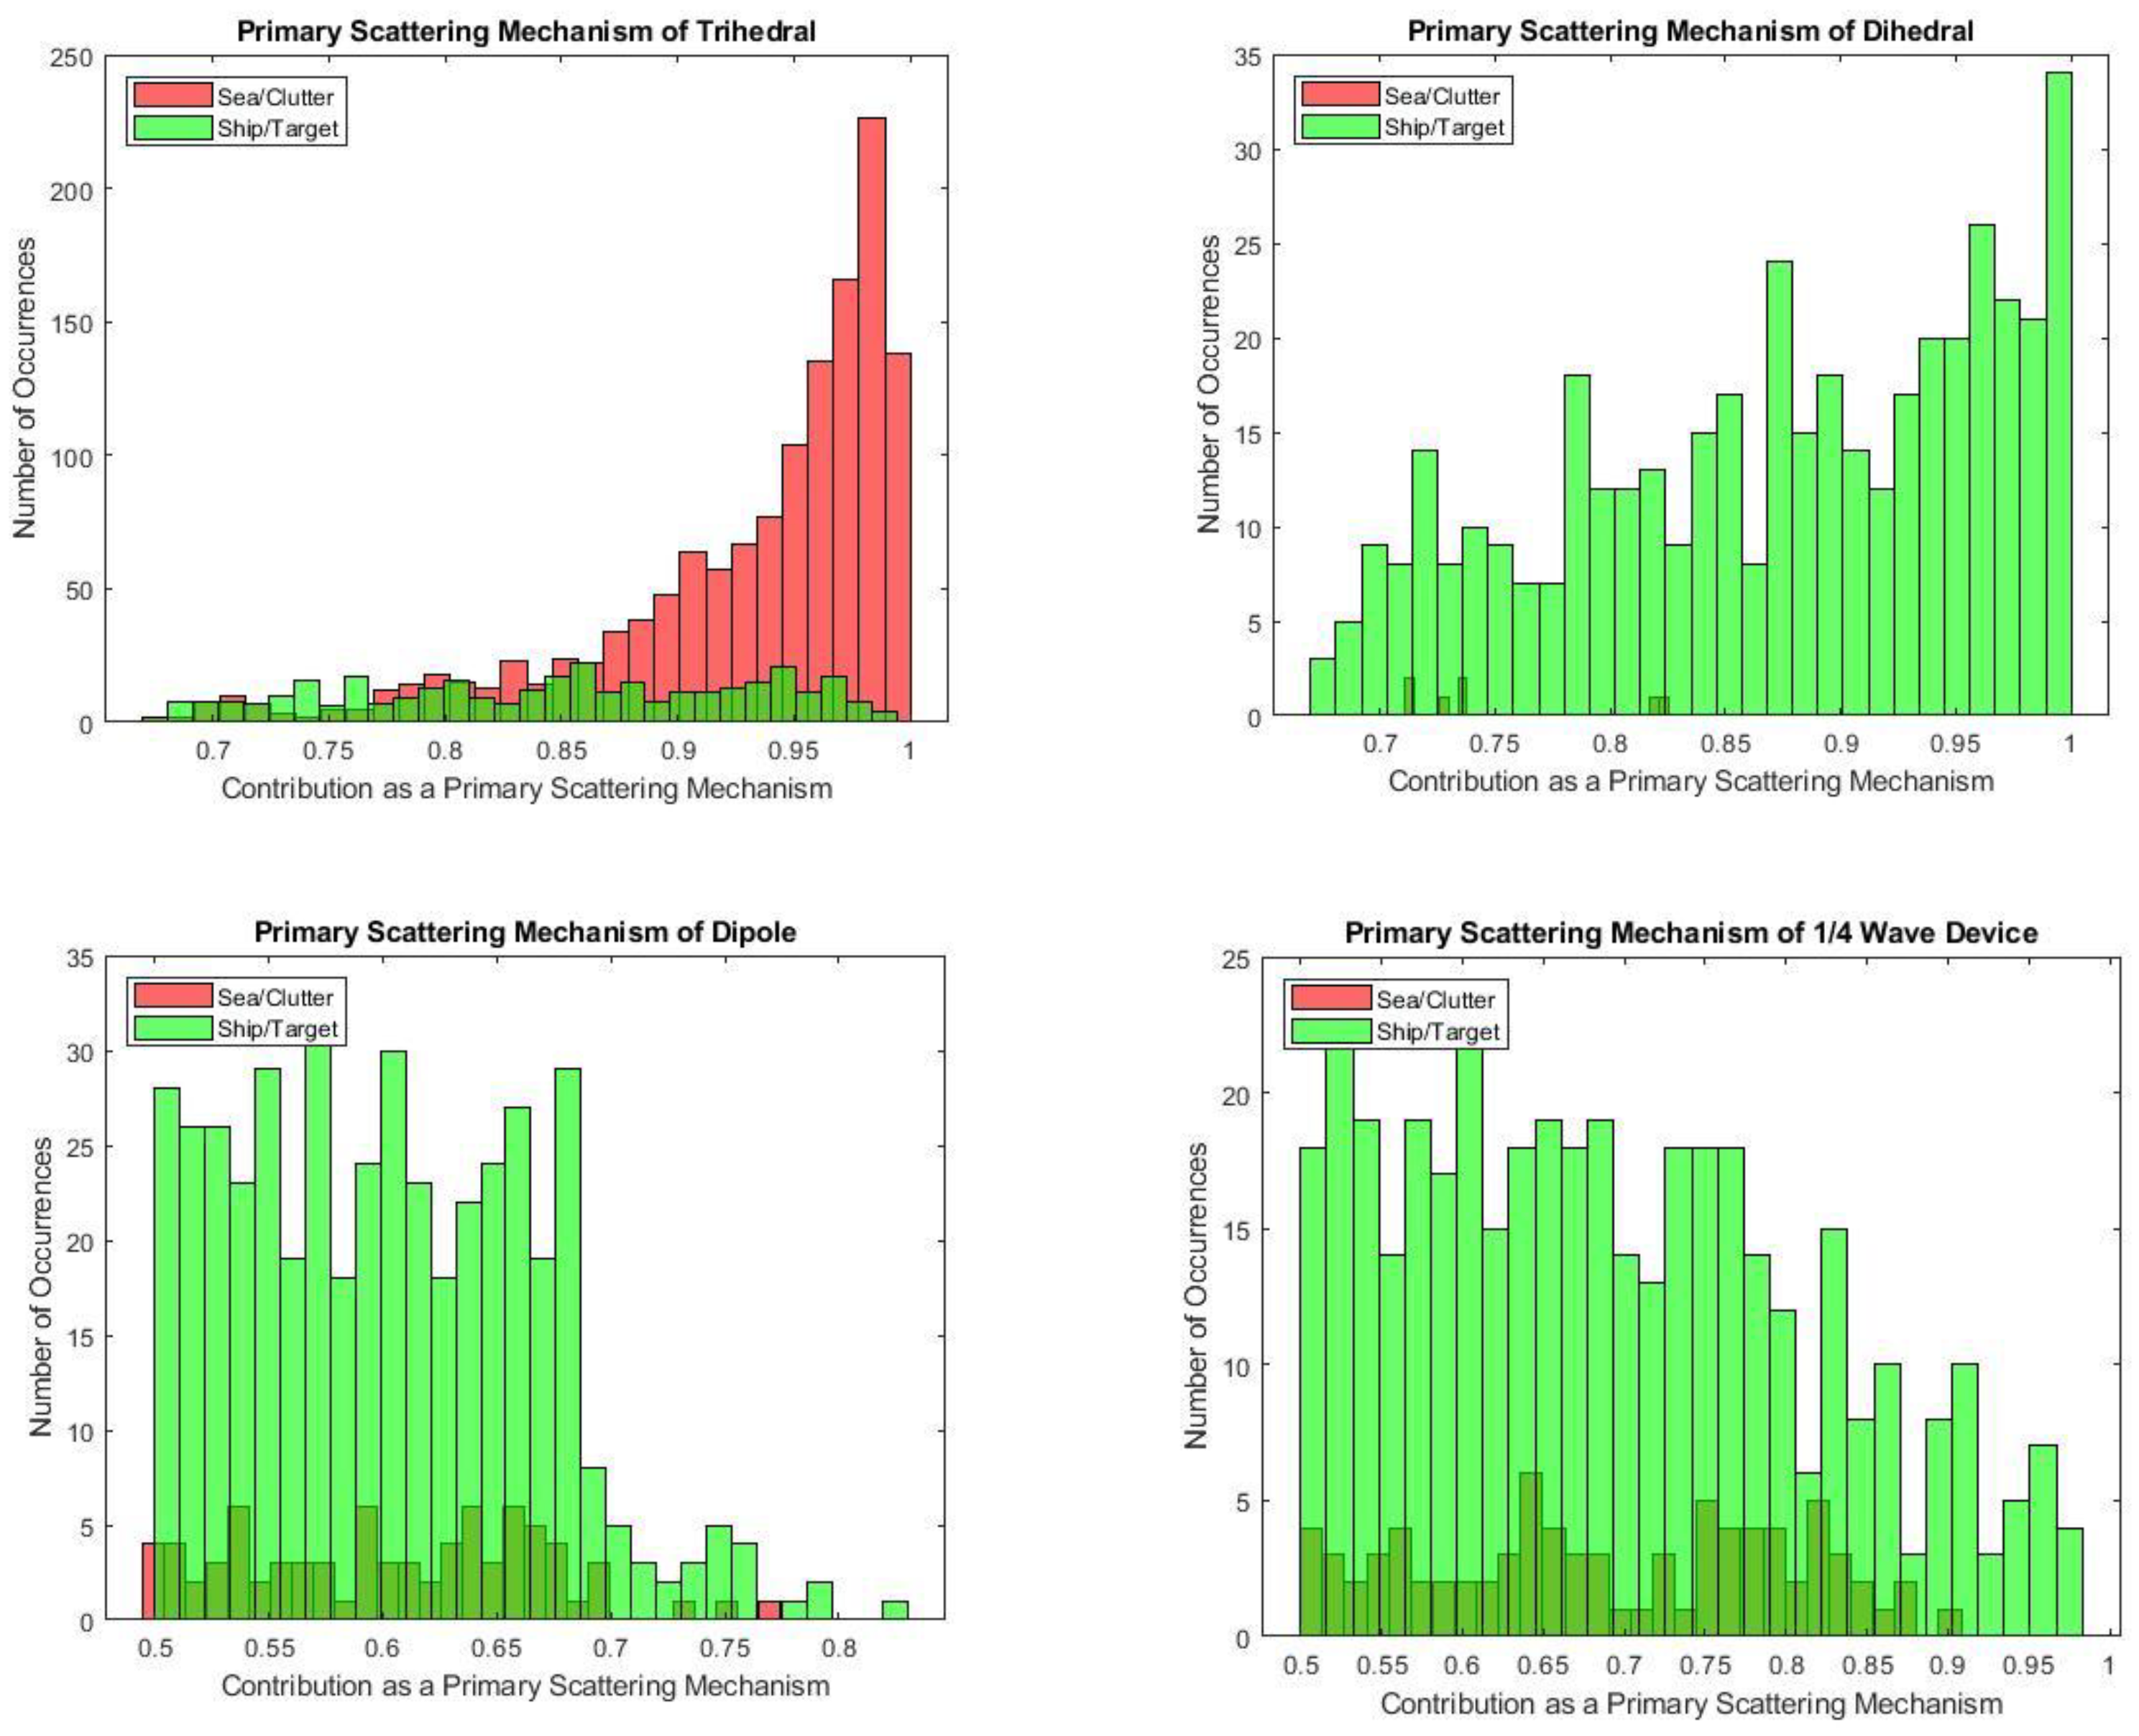
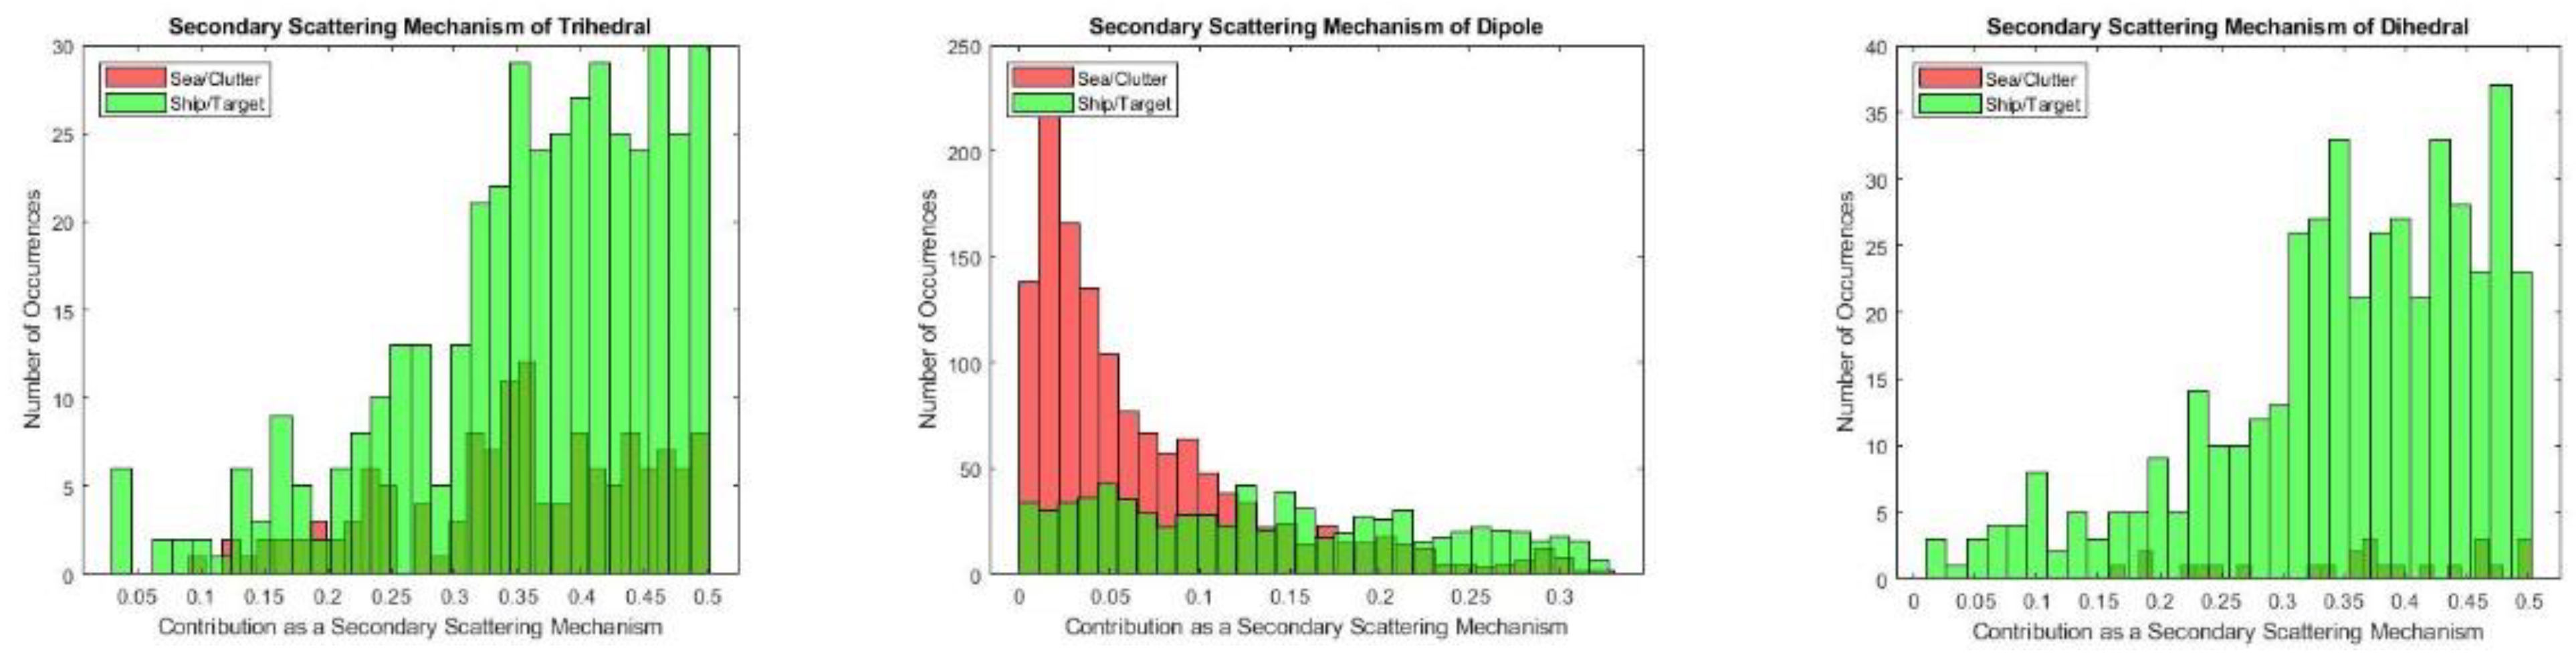
The present technique focuses on the statistical description of the Polarimetric cells by means of the contributions of the primary and secondary scattering mechanisms, according to the applied decomposition. For this reason, the histograms for each scattering mechanism corresponding in both target and clutter cells were calculated as a function of the number of occurrences in these regions.
Utilizing the extracted information, whereby each cell of Polarimetric images has four values, two determining the primary and secondary scatterers and two corresponding on their contribution rates, a supervised learning technique of Decision Trees is trained to separate targets from clutter by estimating the optimal thresholds for each feature. The value of the last cells will be either 1 or 0, depending on the assumption of the cell either as a target or as clutter; in this way, a binary image is constructed. The choice of this algorithm arose by studying the statistical behavior in line with the histograms depicted in Figure 5 and Figure 6.
In the decision tree, nodes are split into sub-nodes on the basis of a threshold value of each feature. In our case, the hierarchy that is followed in nodes splitting is based on the importance of each of the four features extracted from each PolSAR cell according to the Double Scatterer Model. More specifically, the first discrimination is based on the primary scattering mechanism. If this feature is not ‘strong’ enough to make an accurate discrimination, the contribution rate of the primary scattering located in the PolSAR cell is used as a secondary criterion. If there is not a clear separation, the additional criteria of the secondary scattering mechanism and its contribution rate are considered.
The classification tree algorithm mentioned above uses the Gini Index, also known as Gini Impurity. The Gini Index is a metric used in classification tasks that measures the sum of squared probabilities of each class. It calculates the probability of a specific variable being incorrectly classified when randomly chosen. It is a variation of the Gini coefficient and can only be applied to categorical variables with binary outcomes of “success” or “failure”. The Gini index ranges from 0 to 1, with a value of 0 indicating that all elements belong to one class, a value of 1 indicating that elements are randomly distributed across multiple classes, and a value of 0.5 indicating that elements are uniformly distributed among some classes. Mathematically, Gini Impurity is defined as follows:
where is the probability of a sample classified to a particular class.
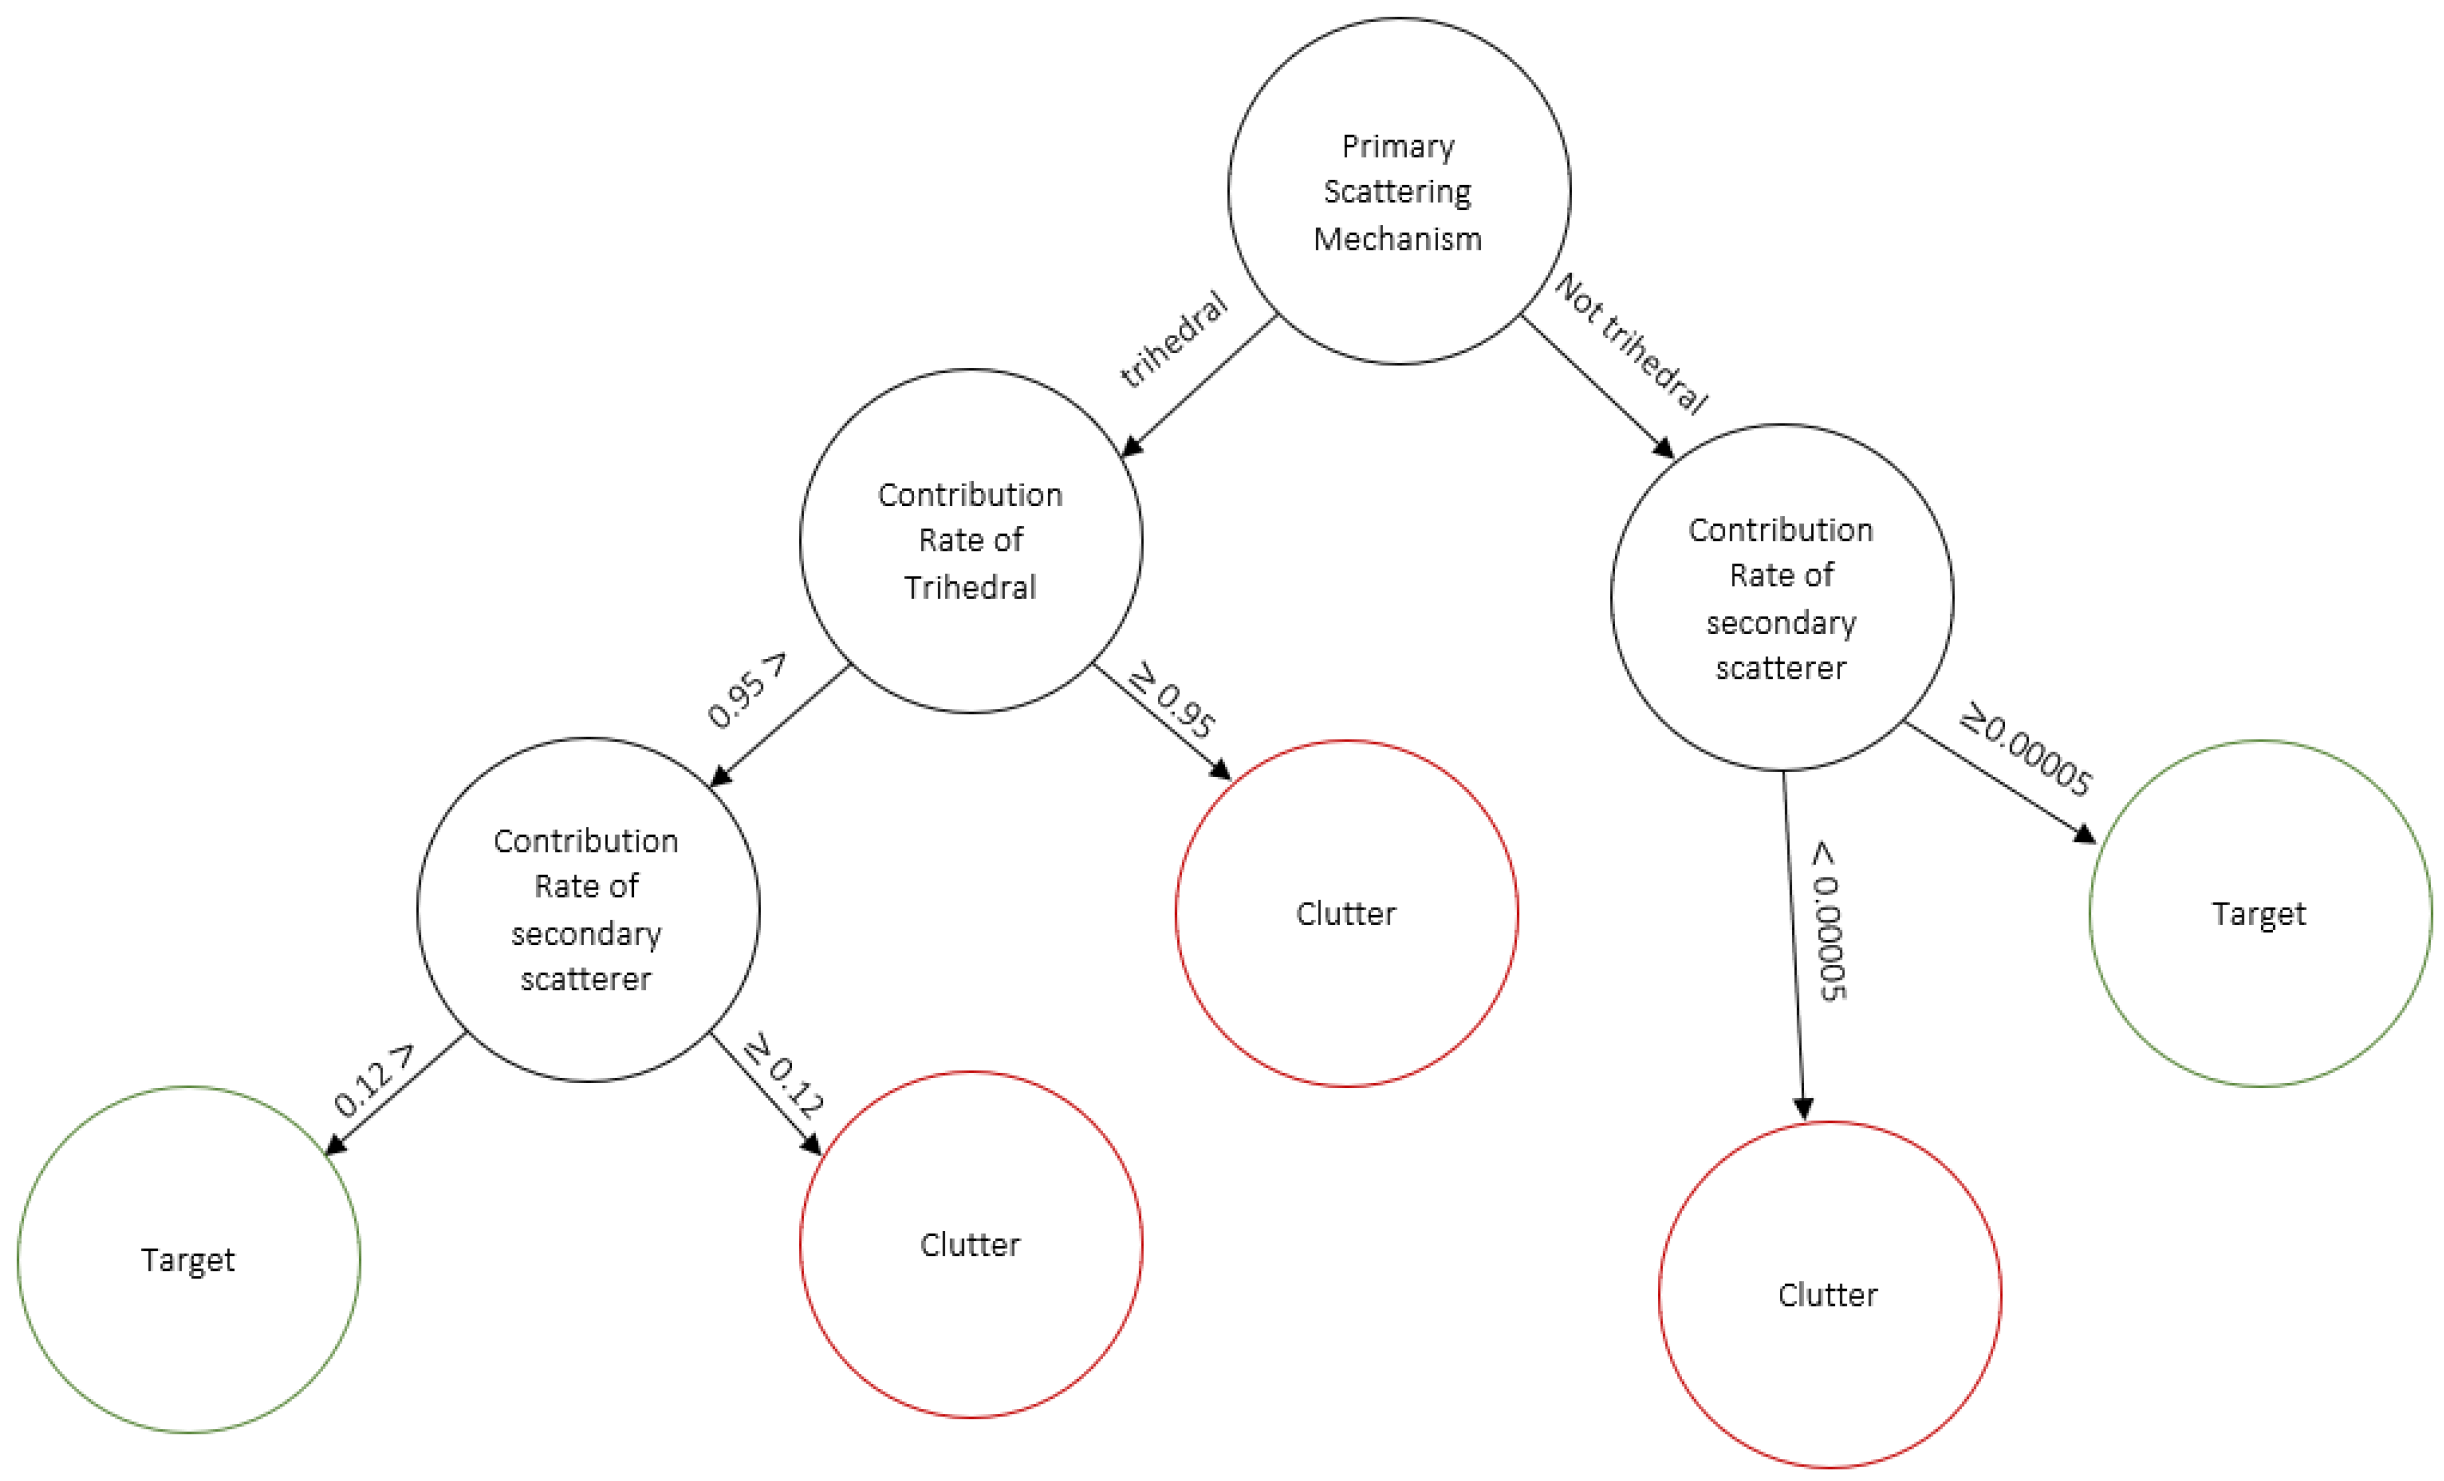
The splitting procedure continues until the last pure sub-set is found in the tree or the maximum number of splits in the growing tree is reached, in which case it is 7. The classification tree is depicted in Figure 7.
The proposed methodology reduces the complex task of target/object detection into simple image processing with minimum computational cost thanks to the simplified form of the binary image. By assigning the value 0 to each possible target and the value 1 to cells corresponding to clutter, the binary image will be constructed. The tree nodes follow the hierarchy indicated by the Double Scatterer Model, as previously mentioned. More specifically:
- 1.
- The first split is based on the primary scatterer. The under-examination cells are divided into two sub-roots, those whose scattering behavior is described by the primary scattering mechanism of trihedral and those whose scattering properties are interpreted by the other scattering mechanisms (dihedral, dipole, ¼ wave device). A decision that can clearly be made by observing the histograms and the number of occurrences for the trihedral mechanism as a primary scatterer.
- 2.
- If the primary scatterer is the trihedral mechanism of two branches, follow based on the contribution rate. Specifically, if the contribution rate is higher than the cell is characterized as clutter/sea, otherwise an additional split is needed. The left-hand branch (Figure 7) is indicated, according to which, if the contribution rate is less than , the cell is labeled as a target, otherwise it is assumed to be clutter.
- 3.
- In the case in which the primary scatterer is not the trihedral mechanism, but is any of the others, the contribution rate of the secondary scatterer determines the decision, as depicted in the right-hand branch (Figure 7). If the contribution rate of the secondary scattering mechanism is greater than or equal to , regardless of its kind, the cell is considered as a target, otherwise as clutter.
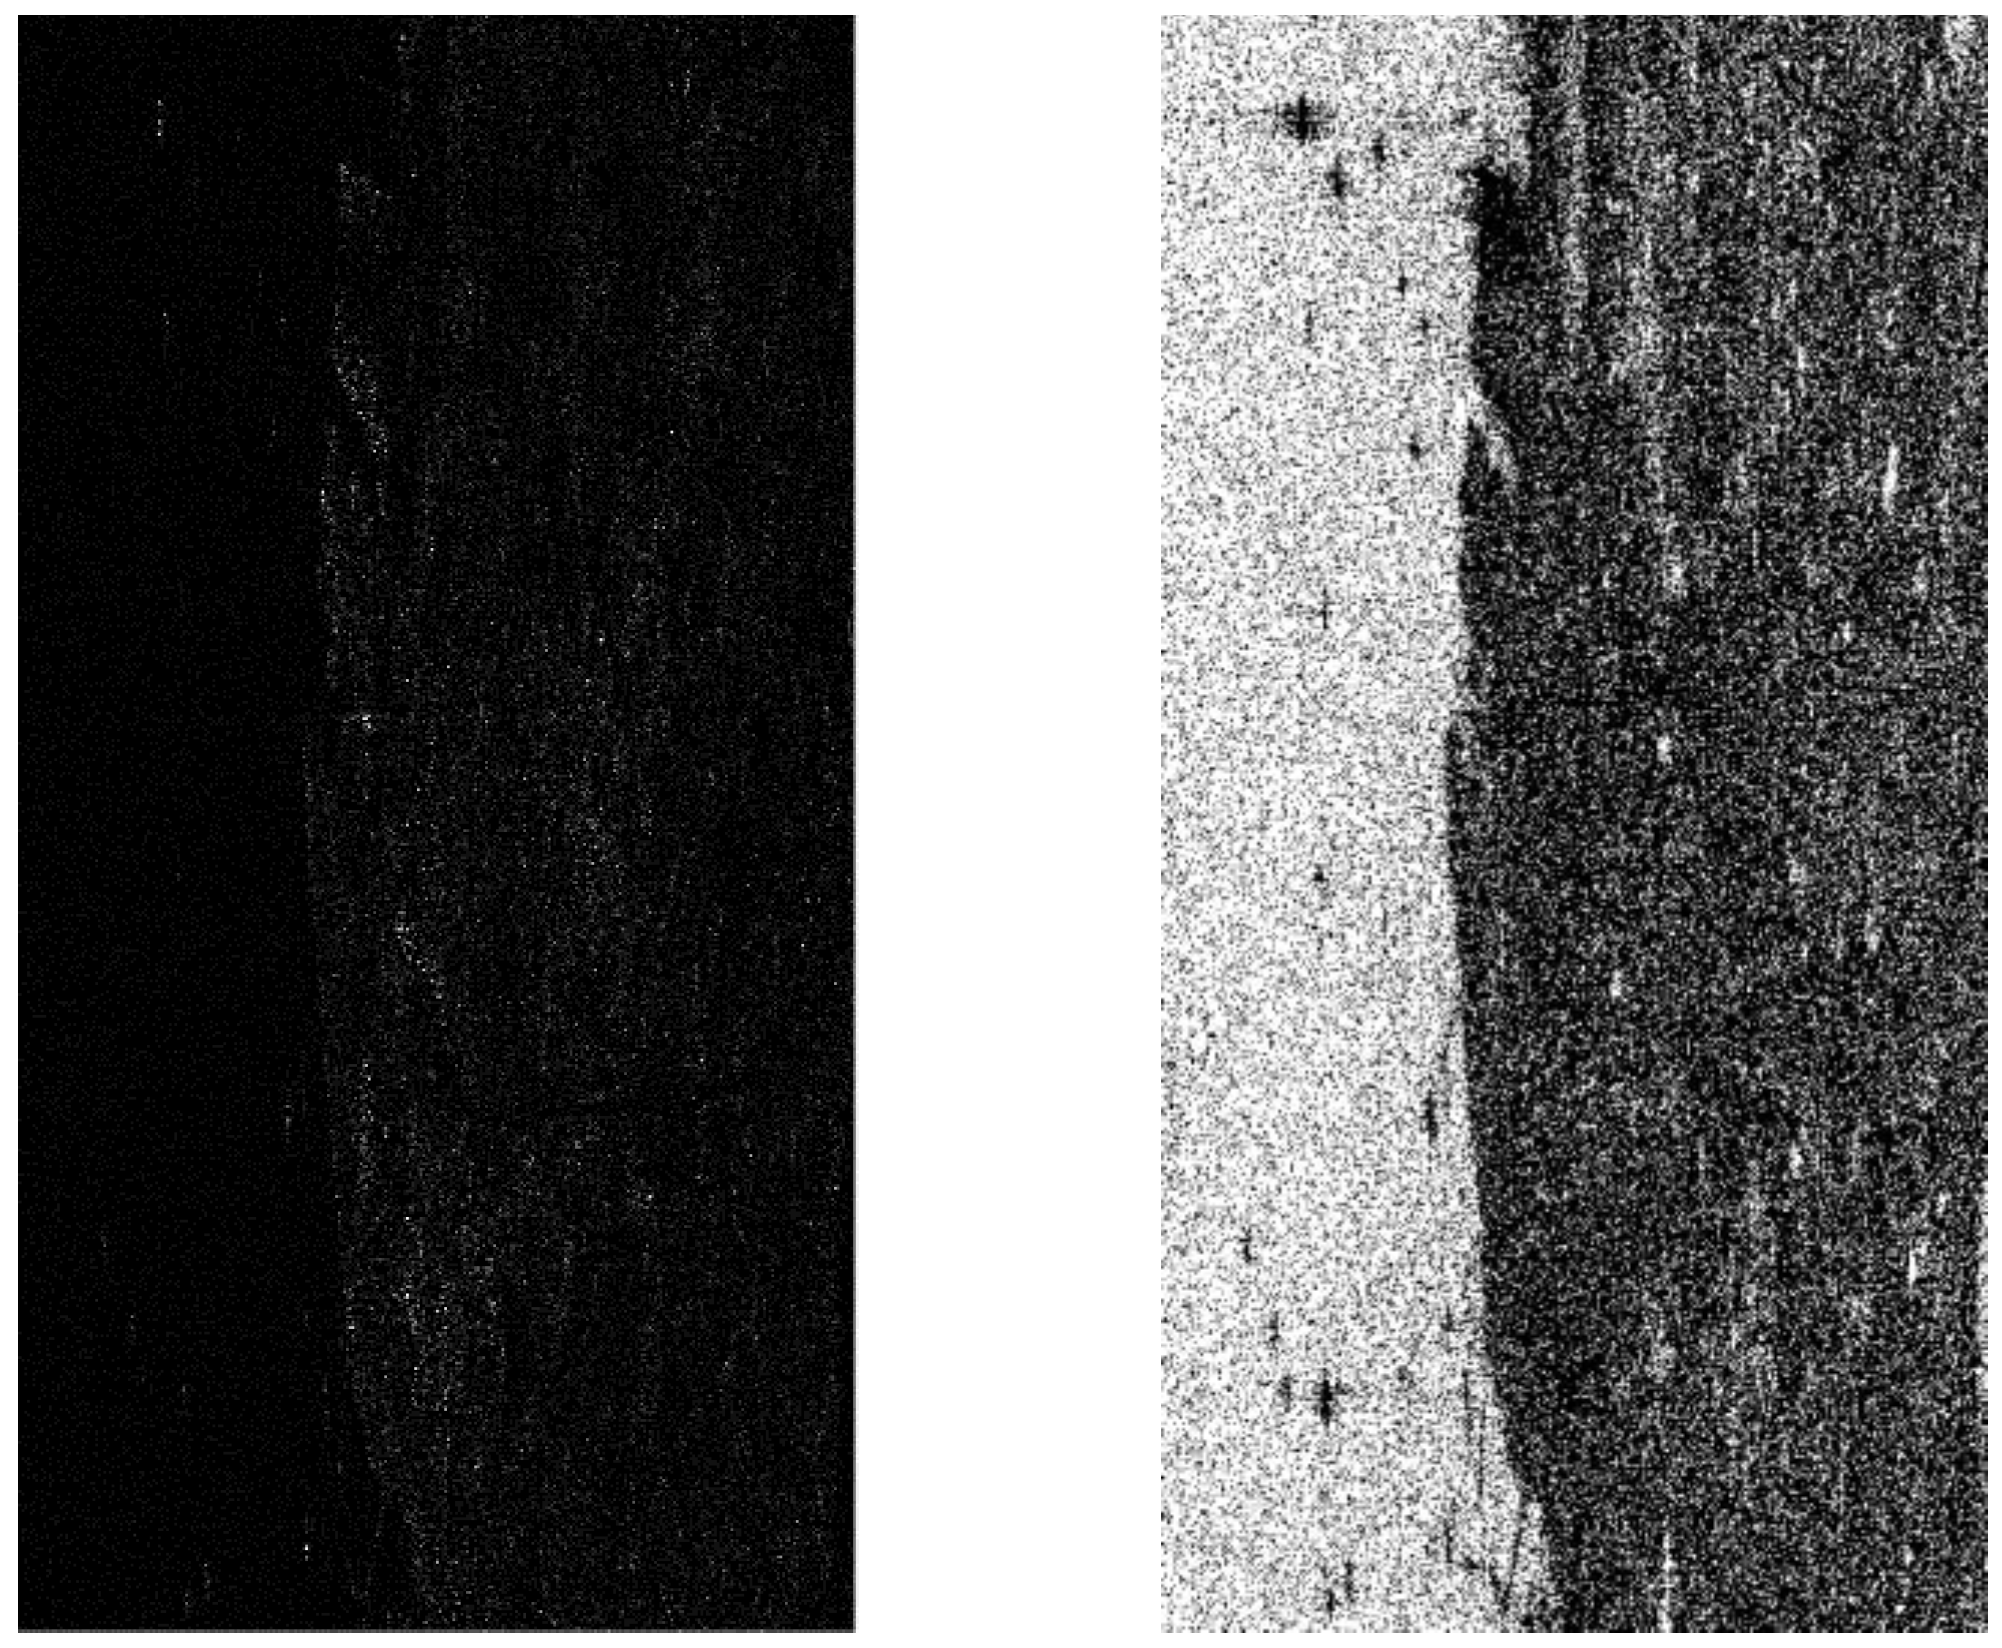
In order to highlight the robustness and the effectiveness of the proposed method, we applied the model that was trained based on the data from the imagery scenes acquired by the RADARSAT-2 to a test set obtained using a different sensor and, specifically, that of ALOS-PALSAR. In cases where the satellite imagery does not only depict sea and ships, but also land, following the proposed procedure, the values of 0 and 1 will be given in these cells. However, this does not affect the proposed algorithmic framework, because a well-established segmentation procedure follows that it will mask off the land regions; namely, the Active Contour model [24] s employed, as can be seen in Figure 8-Right. The processing of the constructed binary image that follows is very simple and fast in terms of filtering and segmentation. Therefore, by calibrating the PolSAR image of the coastal area of Thailand and applying the Double Scatterer Model and the decision tree model mentioned above (Figure 7), we obtain the following result (Figure 8-Right).
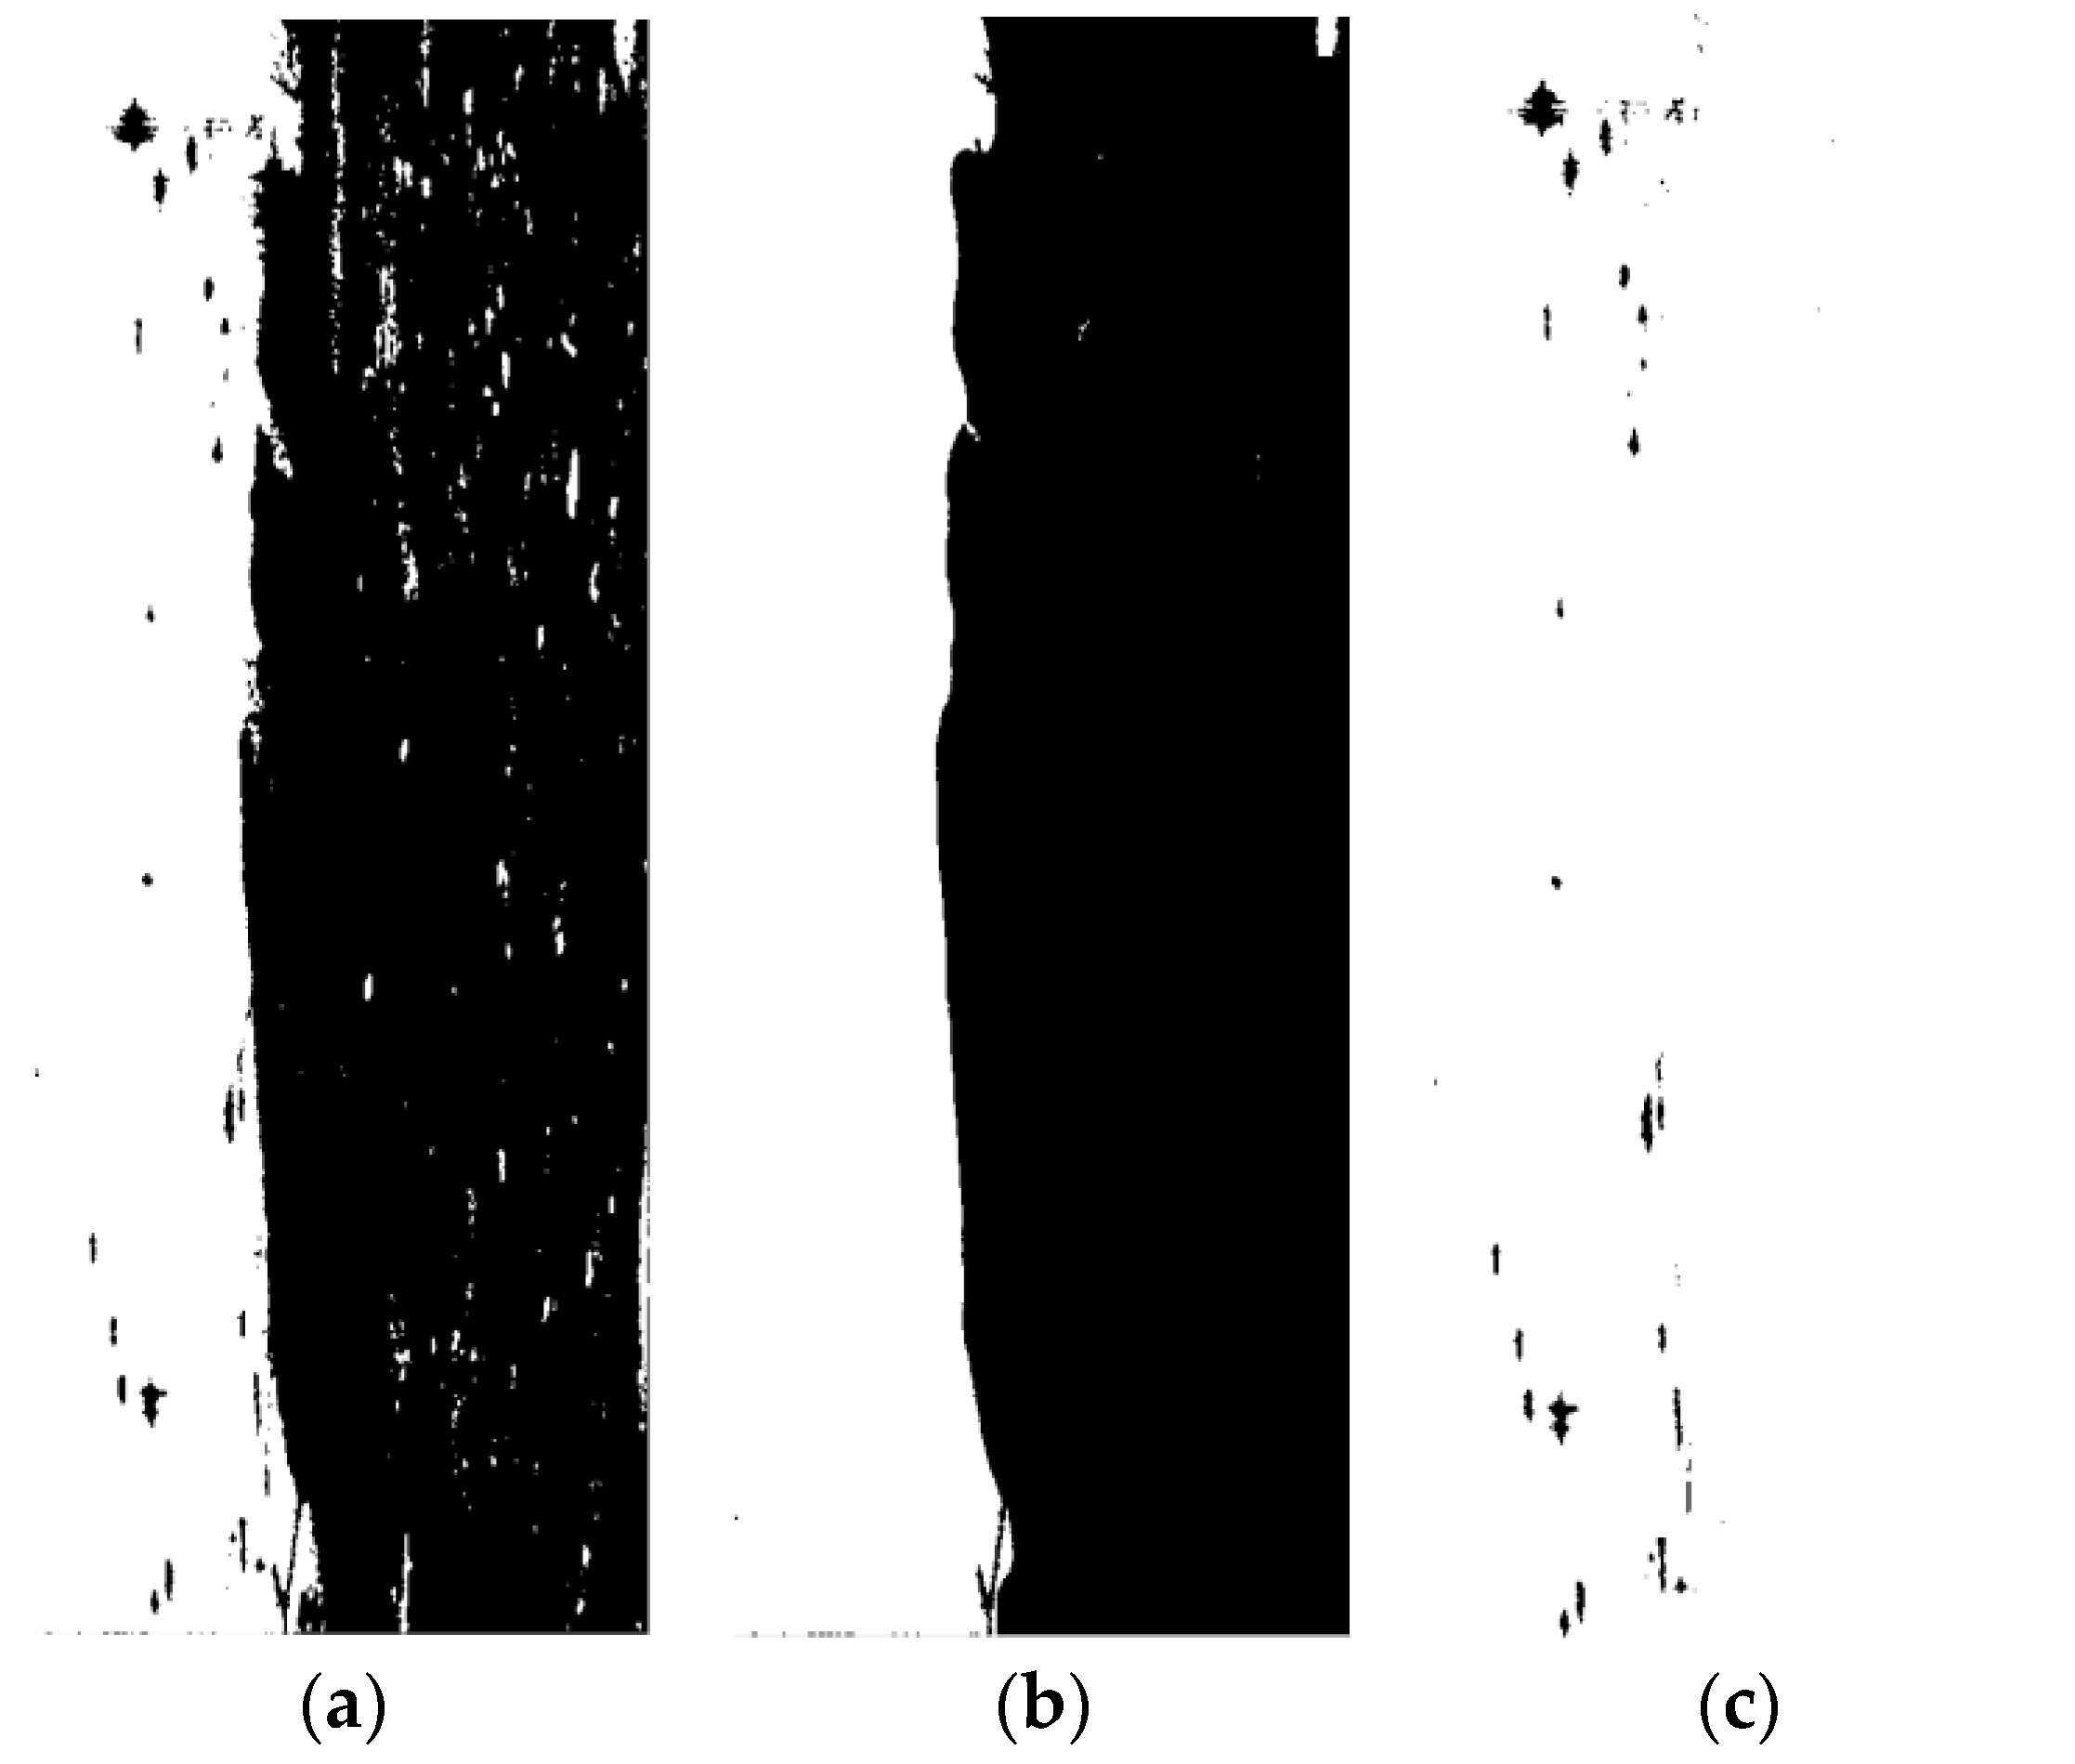
Τhe eight components, four imaginary and four real parts, that make up the original fully polarimetric image are now transformed into a binary one. The noise that appears could be modeled as impulse noise, also known as ‘salt and pepper’. Therefore, a 9 × 9 kernel of mean filter is applied. The segmentation of the image in order to mask off the land area and find the boundary lines of small islets and the coastline is based on the simple and well-established method of Active Contours [24]. By applying the hamming distance between the filtered image (Figure 9a) and the segmented one (Figure 9b), followed by a smoothing kernel, the candidate ships are located (Figure 9c).
By highlighting the coordinates of located targets into the Intensity HV component, we obtain the following result (Figure 10).
5. Results and Discussion
To quantitatively evaluate the effectiveness of the proposed algorithm (Figure 11), the FoM factor and the False Alarm Rate are calculated and compared with those of the most commonly used process of CFAR detection. The latter procedure includes Lee filtering for denoising, land mask-off by utilizing the statistical modeling of sea and the CFAR detection algorithm and was carried out in SNAP environment. Moreover, a target detection based on visual inspection was also made.
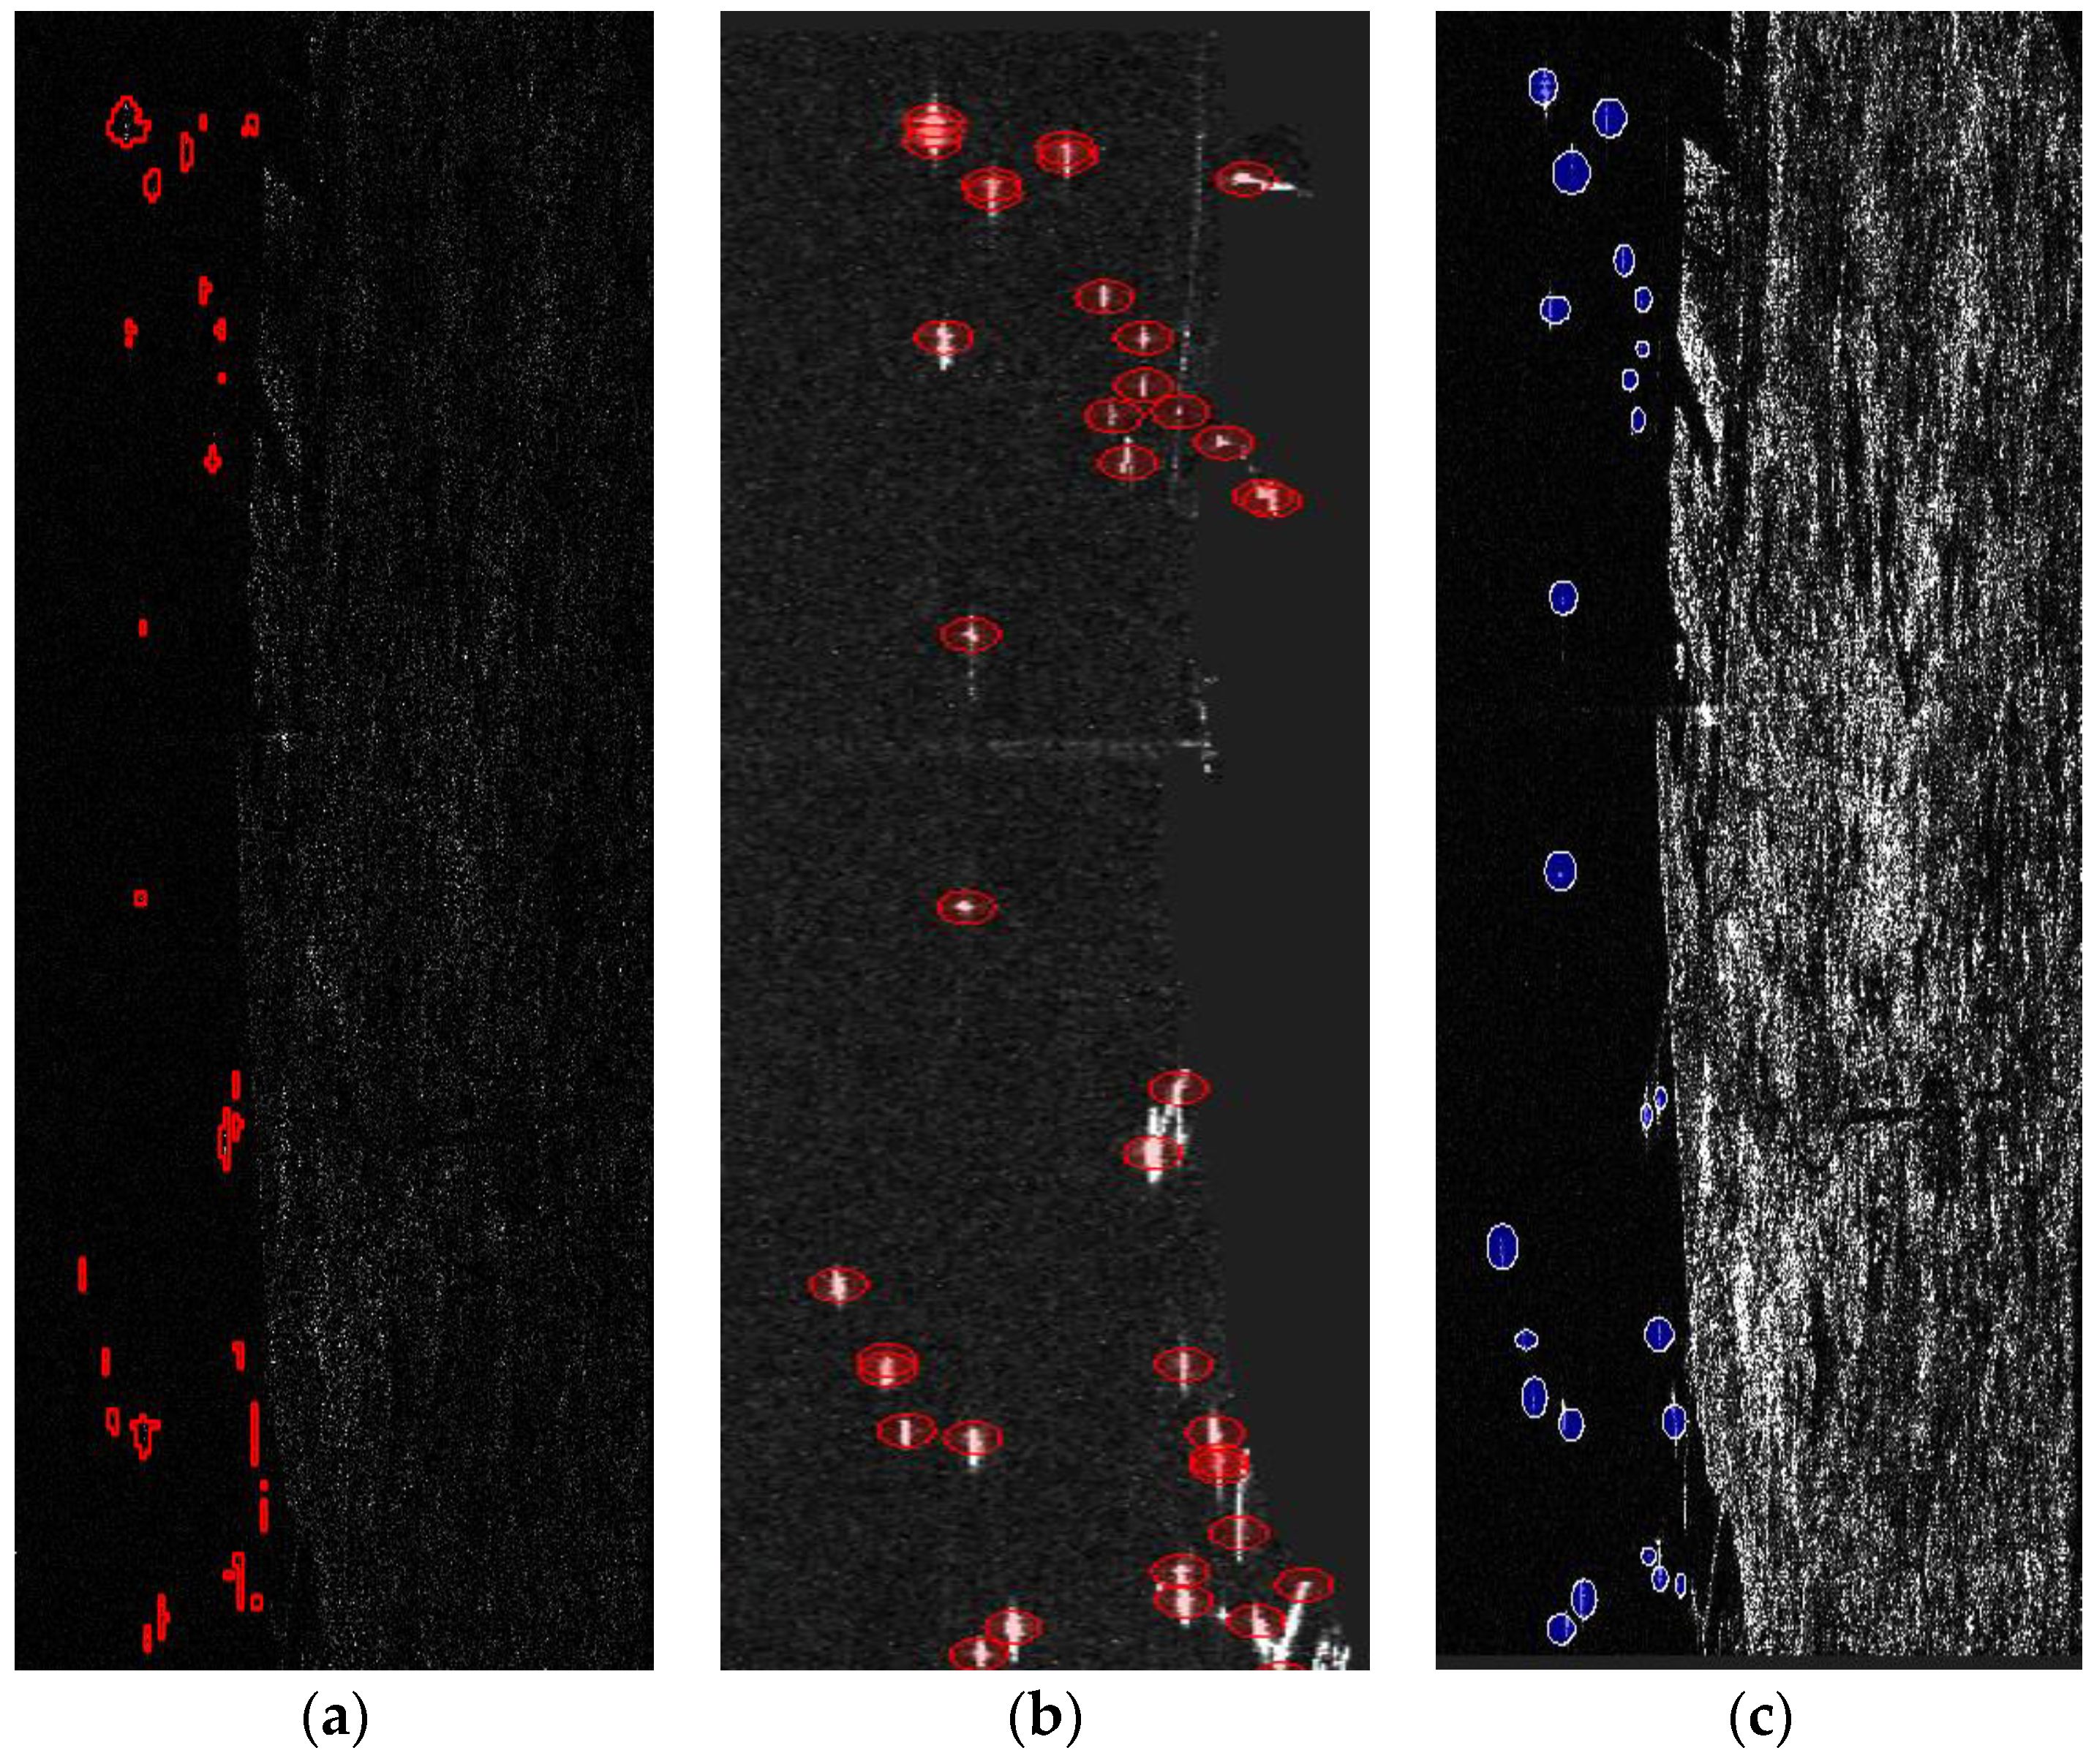
The efficiency of our method can be confirmed since it is able to detect twenty-three (Figure 12a) out of twenty-four targets/ships (Figure 12c), while it presents three false alarms. The CFAR procedure applied by the SNAP toolbox is able to detect all of the twenty-four targets (Figure 12b), but it detects seven false alarms.
The accuracy of the proposed algorithmic framework is estimated through the quality factor FoM (Figure of Merit), which is the ratio of the number of correct detections to the sum of false alarms and real ships:
corresponds to the number of true positives, i.e., the number of correct detected ships, represents the false alarms and is the number of true ships in the image.
The False Alarm Rate that represents the ratio of the number of false alarms to the number of real ships is also calculated:
Τhe higher the detection accuracy, the lower the false alarm rate and the better the performance.
The results (Table 2) show that the proposed technique performs better than the most commonly used algorithm in ship detection. This conclusion is very promising, considering the very limited number of samples that were used to achieve this accuracy in detection. Equally important to mention is the computational cost required for the proposed algorithm. While a combination of well-known image processing and machine learning techniques is applied, the proposed technique mainly relies on the rich information content of the data analysis process and presents a completely new perspective by converting the multidimensional satellite data into a binary image, greatly simplifying the target/object detection task.
6. Conclusions
This research presents a novel ship detection scheme, exploring, for the first time in a target/ship detection task, a new methodology for feature extraction, known as the Double Scatterer Model. The rich information content obtained, combined with classic image processing and machine learning procedures, led to remarkable results. At the same time, the main and radical idea of constructing a binary image from the multi-components Single Look Complex data proved to be an approach that reduces the processing computational load and decomposes the target detection task into a simple image processing problem by retaining the information content. Moreover, this novel stepwise algorithm is very promising considering the fact that it is independent of SAR data resolution, given that the proposed model was trained on Polarimetric cells acquired in C-band and evaluated on data obtained by L-band. Future works will focus on optimizing each step of the procedure, by improving the denoising and utilizing more sophisticated approaches in constructing the decision tree, which could have the potential to present important new aspects in the process of target detection in different spatial environments without the limitation of discrimination between ships and sea.
Author Contributions
K.K. and V.A. have equally contributed to Conceptualization, Methodology, Validation, and Writing—Original Draft Preparation. All authors have read and agreed to the published version of the manuscript.
Funding
No funding was received for conducting this study.
Institutional Review Board Statement
Not applicable.
Informed Consent Statement
Not applicable.
Data Availability Statement
Data availability for reasonable requests.
Conflicts of Interest
The authors declare no conflict of interest.
References
- Jackson, C.R.; Apel, J.R. Synthetic Aperture Radar. Marine User’s Manual; National Oceanic and Atmospheric Administration: Washington, DC, USA, 2004. [Google Scholar]
- Ruliang, Y.; Bowei, D.; Lulu, T.; Xiuqing, L.; Zhen, Y.; Haiying, L. Polarimetric Microwave Imaging; Springer Link: Berlin/Heidelberg, Germany, 2021. [Google Scholar]
- Schwegmann, C.P.; Kleynhans, W.; Salmon, B.P. Manifold Adaptation for Constant False Alarm Rate Ship Detection in South African Oceans. IEEE J. Sel. Top. Appl. Earth Obs. Remote Sens. 2015, 8, 3329–3337. [Google Scholar] [CrossRef]
- Anastassopoulos, V.; Lampropoulos, G.A. Optimal CFAR detection in Weibull clutter. IEEE Trans. Aerosp. Electron. Syst. 1995, 31, 52–64. [Google Scholar] [CrossRef]
- Liao, M.; Wang, C.; Wang, Y.; Jiang, L. Using SAR Images to Detect Ships From Sea Clutter. IEEE Geosci. Remote Sens. Lett. 2008, 5, 194–198. [Google Scholar] [CrossRef]
- Xinping, D.; Jinsong, C.; Hongzhong, L.; Pengpeng, H.; Wen, Y. Log-cumulants of the finite mixture model and their application to statistical analysis of fully polarimetric UAVSAR data. Geo-Spat. Inf. Sci. 2018, 21, 45–55. [Google Scholar] [CrossRef]
- Leng, X.; Ji, K.; Zhou, S.; Xing, X. Fast Shape Parameter Estimation of the Complex Generalized Gaussian Distribution in SAR Images. IEEE Geosci. Remote Sens. Lett. 2020, 17, 1933–1937. [Google Scholar] [CrossRef]
- Liu, T.; Zhang, J.; Gao, G.; Yang, J.; Marino, A. CFAR Ship Detection in Polarimetric Synthetic Aperture Radar Images Based on Whitening Filter. IEEE Trans. Geosci. Remote Sens. 2020, 58, 58–81. [Google Scholar] [CrossRef]
- Marino, A. A Notch Filter for Ship Detection With Polarimetric SAR Data. IEEE J. Sel. Top. Appl. Earth Obs. Remote Sens. 2013, 6, 1219–1232. [Google Scholar] [CrossRef]
- Griffiths, H.D. Principles of Synthetic Aperture Radar Imaging: A System Simulation Approach K.-S. Chen CRC Press, Taylor & Francis Group, 6000 Broken Sound Parkway NW, Suite 300, Boca Raton, FL, 33487–2742, USA. 2016. Distributed by Taylor & Francis Group, 2 Park Square, Milton Park, Abingdon, OX14 4RN, UK. 203pp. Illustrated £109.(20% discount available to RAeS members via www.crcpress.com using AKQ07 promotion code). ISBN 978-1-4665-9314-5. Aeronaut. J. 2017, 121, 1578–1579. [Google Scholar] [CrossRef]
- Touzi, R.; Charbonneau, F.; Hawkins, R.K.; Murnaghan, K.; Kavoun, X. Ship-sea contrast optimization when using polarimetric SARs, IGARSS 2001. Scanning the Present and Resolving the Future. In Proceedings of the IEEE 2001 International Geoscience and Remote Sensing Symposium (Cat. No.01CH37217), Sydney, NSW, Australia, 9–13 July 2001; Volume 1, pp. 426–428. [Google Scholar] [CrossRef]
- Cloude, S.R.; Pottier, E. An entropy base classification scheme for land applications of polarimetric SAR. IEEE Trans. Geosci. Remote Sens. 1997, 35, 68–78. [Google Scholar] [CrossRef]
- Ringrose, R.; Harris, N. Ship Detection Using Polarimetric SAR Data. Eur. Space Agency Esa Sp 2000, 450, 687. [Google Scholar]
- Cameron, W.L.; Youssef, N.N.; Leung, L.K. Simulated Polarimetric Signatures of Primitive Geometrical Shapes. IEEE Trans. Geosc. Rem. Sens. 1996, 34, 793–803. [Google Scholar] [CrossRef]
- Yamaguchi, Y.; Moriyana, T.; Ishido, M.; Yamada, H. Four-component scattering model for polarimetric SAR image decomposition. IEEE Trans. Geosci. Remote Sens. 2007, 45, 2583–2592. [Google Scholar] [CrossRef]
- Sugimoto, M.; Ouchi, K.; Nakamura, Y. On the novel use of model-based decomposition in SAR polarimetry for target detection on the sea. Remote Sens. Lett. 2013, 4, 843–852. [Google Scholar] [CrossRef]
- Xi, Y.; Lang, H.; Tao, Y.; Huang, L.; Pei, Z. Four-Component Model-Based Decomposition for Ship Targets Using PolSAR Data. Remote Sens. 2017, 9, 621. [Google Scholar] [CrossRef]
- Liu, T.; Yang, Z.; Marino, A.; Gao, G.; Yang, J. PolSAR Ship Detection Based on Neighborhood Polarimetric Covariance Matrix. IEEE Trans. Geosci. Remote Sens. 2021, 59, 4874–4887. [Google Scholar] [CrossRef]
- Cui, X.-C.; Tao, C.-S.; Chem, S.-W.; Su, Y. PolSAR Ship Detection with Polarimetric Correlation Pattern. In Proceedings of the 2019 6th Asia-Pacific Conference on Synthetic Aperture Radar (APSAR), Xiamen, China, 26–29 November 2019; pp. 1–4. [Google Scholar] [CrossRef]
- Karachristos, K.; Koukiou, G.; Anastassopoulos, V. PolSAR Cell Information Representation by a Pair of Elementary Scatterers. Remote Sens. 2022, 14, 695. [Google Scholar] [CrossRef]
- Available online: https://www.esa.int (accessed on 30 September 2022).
- Cameron, W.L.; Rais, H. Conservative Polarimetric Scatterers and Their Role in Incorrect Extensions of the Cameron Decomposition. IEEE Trans. Geosc. Remote Sens. 2006, 44, 3506–3516. [Google Scholar] [CrossRef]
- Poelman, A. Reconsideration of the target detection criterion based on adaptive antenna polarizations. AGARD Avion. Panel Symp. 1977, 197, 1–15. [Google Scholar]
- Balci, S.K.; Burak, A. Active Contours: A Brief Review; EE 570 Image Processing—Term Project; Department of Electrical and Electronics Engineering at Bogazici University: Istanbul, Turkey, 2006. [Google Scholar]
Figure 1.
The position of the elementary scattering mechanisms on Cameron’s Unit Disk representation.
Figure 1.
The position of the elementary scattering mechanisms on Cameron’s Unit Disk representation.

Figure 2.
Illustration of mapping a point (x, y) on the unit disk to the unit sphere as well as the positions taken by the symmetric scattering mechanisms.
Figure 2.
Illustration of mapping a point (x, y) on the unit disk to the unit sphere as well as the positions taken by the symmetric scattering mechanisms.

Figure 3.
The new spherical topology constructed based on the complementary nature of elementary scattering mechanisms.
Figure 3.
The new spherical topology constructed based on the complementary nature of elementary scattering mechanisms.

Figure 4.
(a) Intensity of HV channel of PolSAR SLC data depicts a coastal area of Vancouver. Targets are in the red circles and clutter in the blue rectangle; (b) Intensity of HV channel of PolSAR SLC data depicts a coastal area of San Francisco. Targets are in the red circles, the clutter in the blue rectangle.

Figure 5.
Histograms of the contribution rate of each primary scattering mechanism and the number of occurrences in both target and clutter PolSAR cells.
Figure 5.
Histograms of the contribution rate of each primary scattering mechanism and the number of occurrences in both target and clutter PolSAR cells.

Figure 6.
Histograms of the contribution rate of each secondary scattering mechanism and the number of occurrences in both target and clutter PolSAR cells.
Figure 6.
Histograms of the contribution rate of each secondary scattering mechanism and the number of occurrences in both target and clutter PolSAR cells.

Figure 7.
Decision tree for binary image construction based on features extracted via the Double Scatterer Model.
Figure 7.
Decision tree for binary image construction based on features extracted via the Double Scatterer Model.

Figure 8.
Coastal area of Thailand as depicted by the amplitude of channel HV in a grayscale format (Left). Binary image as constructed based on the proposed decision tree (Right) according to which the white color corresponds to sea/clutter and the black to candidate targets.
Figure 8.
Coastal area of Thailand as depicted by the amplitude of channel HV in a grayscale format (Left). Binary image as constructed based on the proposed decision tree (Right) according to which the white color corresponds to sea/clutter and the black to candidate targets.

Figure 9.
(a) Filtered image; (b) Segmented image; (c) Candidate targets presentation.

Figure 10.
Ship detection based on the proposed algorithm.

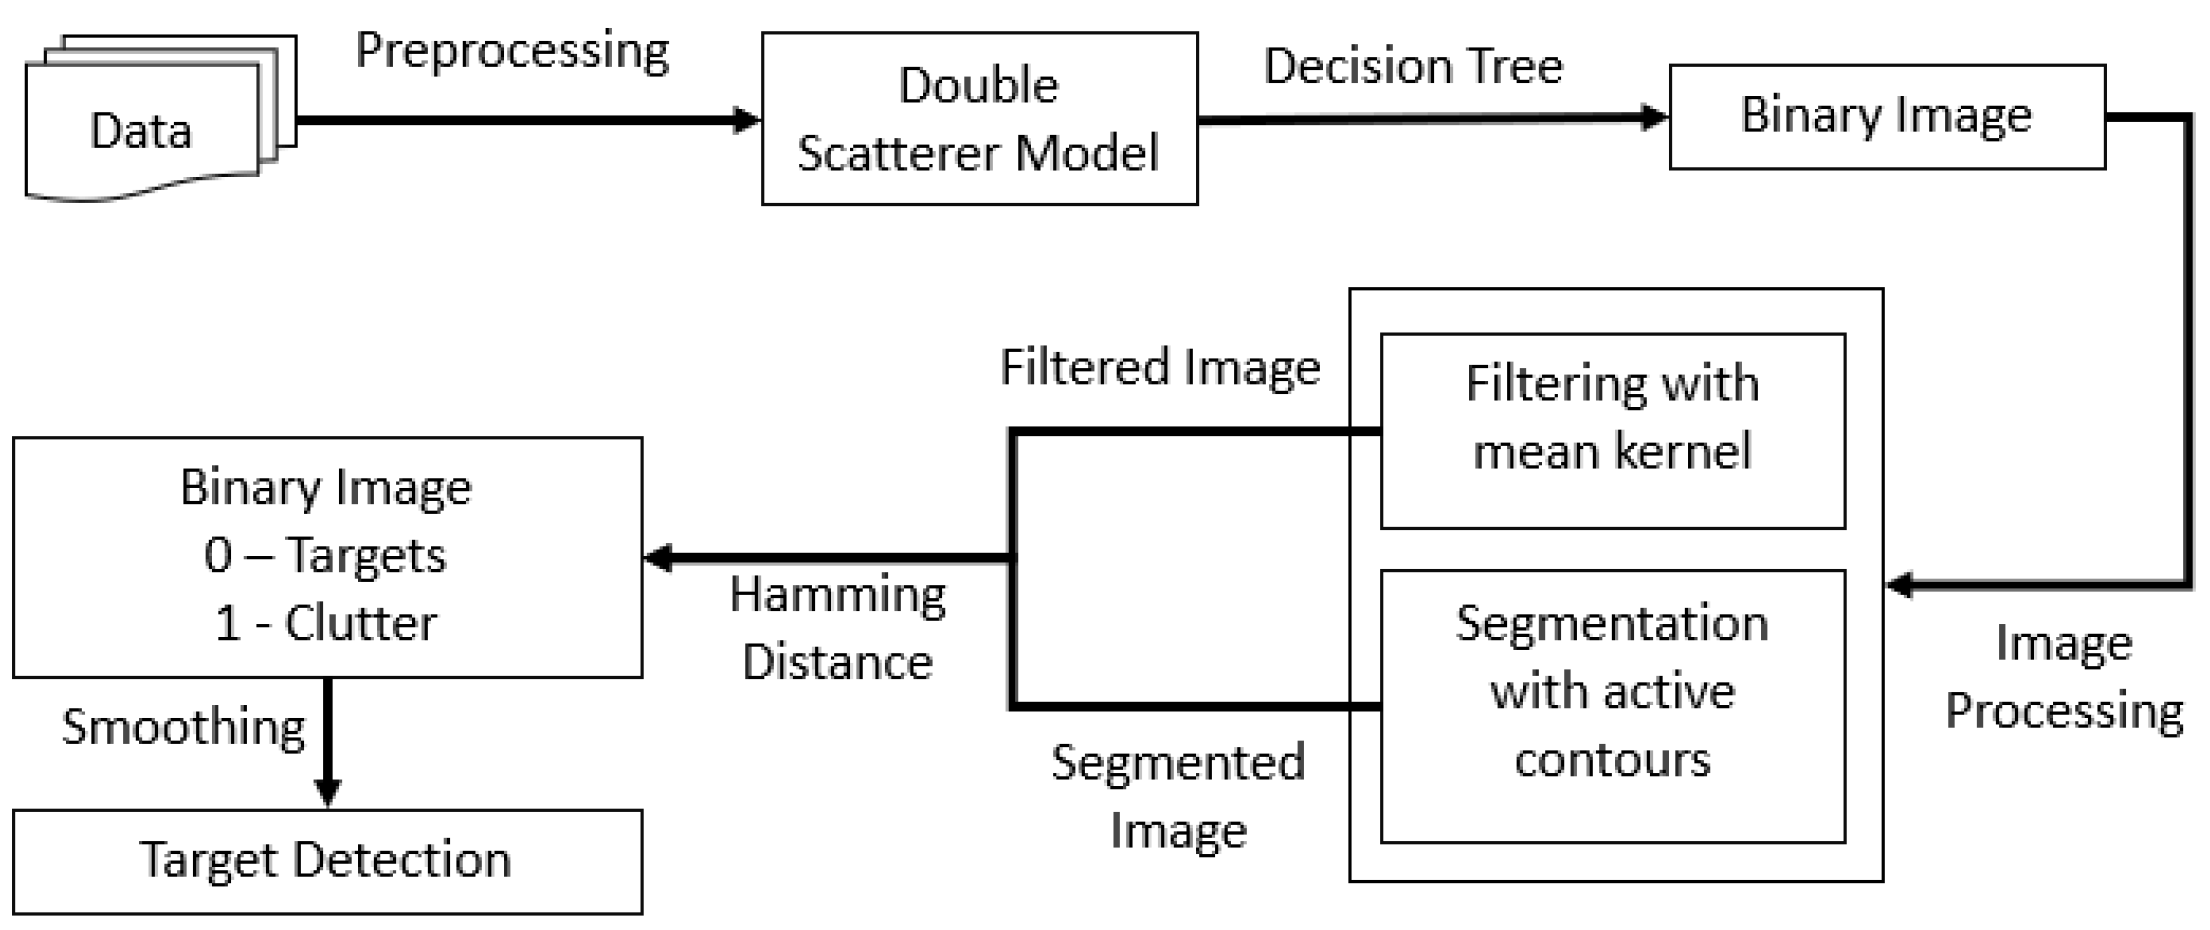
Figure 11.
Flowchart of the proposed ship detection algorithm.

Figure 12.
(a) Ship detection based on the proposed algorithm, Thailand; (b) Ship detection based on the CFAR and Lee filtering, Thailand; (c) Ship detection based on visual inspection, Thailand.
Figure 12.
(a) Ship detection based on the proposed algorithm, Thailand; (b) Ship detection based on the CFAR and Lee filtering, Thailand; (c) Ship detection based on visual inspection, Thailand.


Table 1.
Cameron’s scattering mechanisms.
| Trihedral | ||
| Diplane | ||
| Dipole | ||
| Cylinder | ||
| Narrow Device | ||
| ¼ wave device |
Table 2.
Quantitative detection performance of the proposed method compared with the most known one.
Table 2.
Quantitative detection performance of the proposed method compared with the most known one.
| CFAR Detection | 24 | 0 | 7 | 0.77 | 0.29 |
| Proposed Algorithm | 23 | 0 | 3 | 0.85 | 0.12 |
Disclaimer/Publisher’s Note: The statements, opinions and data contained in all publications are solely those of the individual author(s) and contributor(s) and not of MDPI and/or the editor(s). MDPI and/or the editor(s) disclaim responsibility for any injury to people or property resulting from any ideas, methods, instructions or products referred to in the content. |
© 2023 by the authors. Licensee MDPI, Basel, Switzerland. This article is an open access article distributed under the terms and conditions of the Creative Commons Attribution (CC BY) license (https://creativecommons.org/licenses/by/4.0/).
Share and Cite
MDPI and ACS Style
Karachristos, K.; Anastassopoulos, V. Automatic Ship Detection Using PolSAR Imagery and the Double Scatterer Model. Geomatics 2023, 3, 174-187. https://doi.org/10.3390/geomatics3010009
AMA Style
Karachristos K, Anastassopoulos V. Automatic Ship Detection Using PolSAR Imagery and the Double Scatterer Model. Geomatics. 2023; 3(1):174-187. https://doi.org/10.3390/geomatics3010009
Chicago/Turabian StyleKarachristos, Konstantinos, and Vassilis Anastassopoulos. 2023. "Automatic Ship Detection Using PolSAR Imagery and the Double Scatterer Model" Geomatics 3, no. 1: 174-187. https://doi.org/10.3390/geomatics3010009