


Multicriteria Decision Method for Siting Wind and Solar Power Plants in Central North Namibia


Division of Geomatics, University of Cape Town, Cape Town 7701, South Africa
*
Author to whom correspondence should be addressed.
Geomatics 2023, 3(1), 47-67; https://doi.org/10.3390/geomatics3010002
Submission received: 14 November 2022
/
Revised: 20 December 2022
/
Accepted: 23 December 2022
/
Published: 29 December 2022
(This article belongs to the Special Issue Geographical Information Systems and Spatial Analysis in Agriculture and Environment)
Abstract
:We demonstrate the application of geomatics tools (remote sensing and geographic information systems) for spatial data analysis to determine potential locations for wind and solar photovoltaic (PV) energy plants in the Central North region of Namibia. In accordance with sustainable development goal 7 (affordable and clean energy) and goal 13 (climate action), the Namibian government has committed to reducing reliance on fossil fuels. In support of this, suitable locations for renewable energy plants need to be identified. Using multi-criteria decision-making and the analytical hierarchy process, sites were selected considering topographical, economic, climatic, and environmental factors. It was found that the highest potential for solar PV energy plants is in the northwest, southwest, and southern regions of the study area, whereas only the northwest region is highly suitable for wind power plants. These results were substantiated by comparison with global suitability maps, with some differences due to the datasets used. The findings can be used as a guide by governments, commercial investors, and other stakeholders to determine prospective sites for the development of renewable energy in Central North Namibia.
1. Introduction
Conventional fossil fuels are noted to contribute to an increase in serious environmental and atmospheric impacts. Furthermore, energy demand is constantly escalating because of rapid human population growth, urbanisation, and industrial development [1]. These concerns have given rise to the establishment of the 17 Sustainable Development Goals (SDGs—see https://sdgs.un.org/, accessed on 22 December 2022). Goal 7 calls for access to reliable, affordable and sustainable energy for all, while goal 13 calls for urgent action to combat climate change and its impacts. The International Energy Agency observes that the African continent, especially Sub-Saharan Africa, has the biggest population with no access to electricity [2]. Namibia falls into this group and its energy demand is increasing. Namibia’s economic growth, combined with a greater emphasis on industrialisation and a large-scale rural electrification program to bring electricity to remote areas, has led to a substantial rise in energy demand.
Hence, Namibia has turned to integrated renewable energy sources (RESs) to supplement the current generation capacity of primary energy resources. RESs are now widely regarded as capable of meeting a significant portion of the world’s rising energy demand, ensuring a continuous energy supply, and reducing the negative impacts of fossil fuels [1,3,4]. Sources of renewable energy include geothermal, hydro, solar, wind, and tide. These are natural, free, replenishable, and widely available at various locations around the world. Namibia has the potential to tap into all the above RESs except geothermal. Although a variety of RESs exist, the most promising, rapidly expanding, and mature technologies are solar and wind energy [5]. The Global Status Energy [6] reports that globally in 2018, solar energy accounted for 55% of the new renewable capacity, while wind energy accounted for 28% and hydro energy accounted for only 11%.
Namibia imports half of its electricity through the Southern Africa Power Pool’s long term bilateral agreement and short-term trade markets to ensure that electricity demand is always met [7]. Namibia’s National Energy Policy of 2017 [8] states that in 2014 the country imported 73% of its total energy need. Namibia imported 71% of its energy from June 2018 to July 2019 [9], exposing the country to import dependency risks and highlighting the need to turn to RESs.
Namibia is fortunate to have an abundance of wind and solar power that may be utilised to minimise the country’s dependence on coal-fired energy plants, reducing foreign dependence, increasing energy security, improving quality of urban and rural living, creating job opportunities, while also reducing emissions of greenhouse gases. These goals all align with SDGs 7 and 13, indicators 7.1.2 (proportion of the population with primary reliance on clean fuels and technology), 7.2.1 (renewable energy share in the total final energy consumption), 7.b.1 (installed renewable energy-generating capacity in developing countries), and 13.2.2 (total greenhouse gas emissions per year). Achieving energy sustainability in Namibia would require investment in RESs such as wind and solar energy. Namibia has enacted an energy policy [8] (in line with indicator 13.2.1) with the aim to increase energy security, and enable access to modern, environmentally clean, sustainable, and affordable energy services for all Namibian inhabitants (in line with target 7.1). Clean energy is envisaged to be a key part of Namibia’s innovative future energy policy. The development of renewable energy is a critical part of the transition away from fossil fuels and reversal of the consequences of climate change. As part of the process, one of the most difficult tasks is to select suitable locations for the RES power plants.
The Kunene area of Central North Namibia has substantial sun irradiation and wind resources [10]. However, the decision-making regarding the installation of wind and solar photovoltaic (PV) power plants at a particular site is not determined only by the quality of the wind and sunlight available. There are many other factors to be considered, such as topography, economics, regulations, and environmental concerns [5,11]. Hence, the determination of suitable sites for these RESs requires accurate planning and detailed information. A variety of factors and reliable sources of information must be reviewed to identify geographical relationships, cost-benefits, suitability, and implications. In this regard, an integrated geographic information system (GIS) and multi-criteria decision making (MCDM) technique has been found to be an effective and powerful decision support tool for addressing complex problems relating to solar PV and wind power plant site selection [1,3,4,11,12].
GIS is a computer system designed to collect, store, manage, visualise, and analyse geospatial data, that is, information tied to specific geographical areas on the surface of the Earth. The application of GIS incorporates a comprehensive set of tools, people, procedures, and data that can assist with strategic planning and location selection for the intended purpose. MCDM is a structured framework that is essential for analysing and supporting decisions concerning problems characterised by complex multiple objectives and criteria. An example of MCDM is the analytical hierarchy process (AHP) approach [13]. With AHP, several factors are assessed simultaneously and compared based upon priorities, constraints, and the preference of decision-makers to find the most suitable option [5,11]. In many parts of the world, these approaches have been widely used for selecting suitable sites for wind and solar PV power plants, as briefly described below.
There are numerous studies that combine GIS and AHP technique for site selection of solar PV and wind power plants. For example, an AHP-based GIS application was used to establish the ideal areas for solar PV power plants in Turkey, Malatya province [1]. A map depicting the optimal locations for solar energy plants developments was created. Finally, PV power plants that are already in operation were compared to the results. A similar study was carried out in the Igdir region of Turkey, where GIS and AHP were employed to determine potential locations for wind and solar farms [14]. The study found 524.5 km2 of land to be suitable for solar power plants and 147.2 km2 for wind turbines. Using GIS and AHP in Tehran (Iran), Sadeghi and Karimi [15] identified potential locations for wind turbines and solar farms to establish a distributed network and increase the reliability of power grids. Xu et al. [16] used GIS and MCDM to identify suitable locations for wind power plants in Wafangdian, China. Al Garni and Awasthi [17] identified potential locations for solar PV power plants in Saudi Arabia by applying GIS and MCDM approach and excluded the unsuitable areas while considering the environmental consequences. Their study found that highly potential areas are situated in the north and northwest of the country. Ligus and Peternek [18] suggested a model based on the integrated GIS-based AHP technique for determining the most appropriate RES technology development in Poland. Their results align with a similar study conducted by Sun et al. [19]. Aly et al. [20] examined the spatial suitability for large-scale solar power installations using GIS and MCDM techniques in Tanzania. As part of their study, six exclusion criteria were identified to mask unsuitable areas. After identifying the criteria, the AHP method was used to determine their weights. Their analysis concluded that 20,801 km2 was designated as most suitable and 78,133 km2 was designated as moderately suitable.
Hence, from the foregoing, there is precedent for using MCDM and AHP to determine suitable locations for both solar and wind energy production plants. In this paper, we draw from these experiences and apply the technique to the Central North region of Namibia. The aim of the study was to determine suitable locations for wind and solar PV plants in Central North Namibia. The following objectives were established to achieve the study aim:
- To find out which factors and criteria influence the suitability of a solar PV and wind power plant’s site.
- To establish socio-economic and environmental constraints on the location of renewable energy production plants.
- To establish suitable sites for wind and solar power plants within Central North Namibia using GIS-based AHP technique, taking the previous objectives into consideration.
2. Materials and Methods
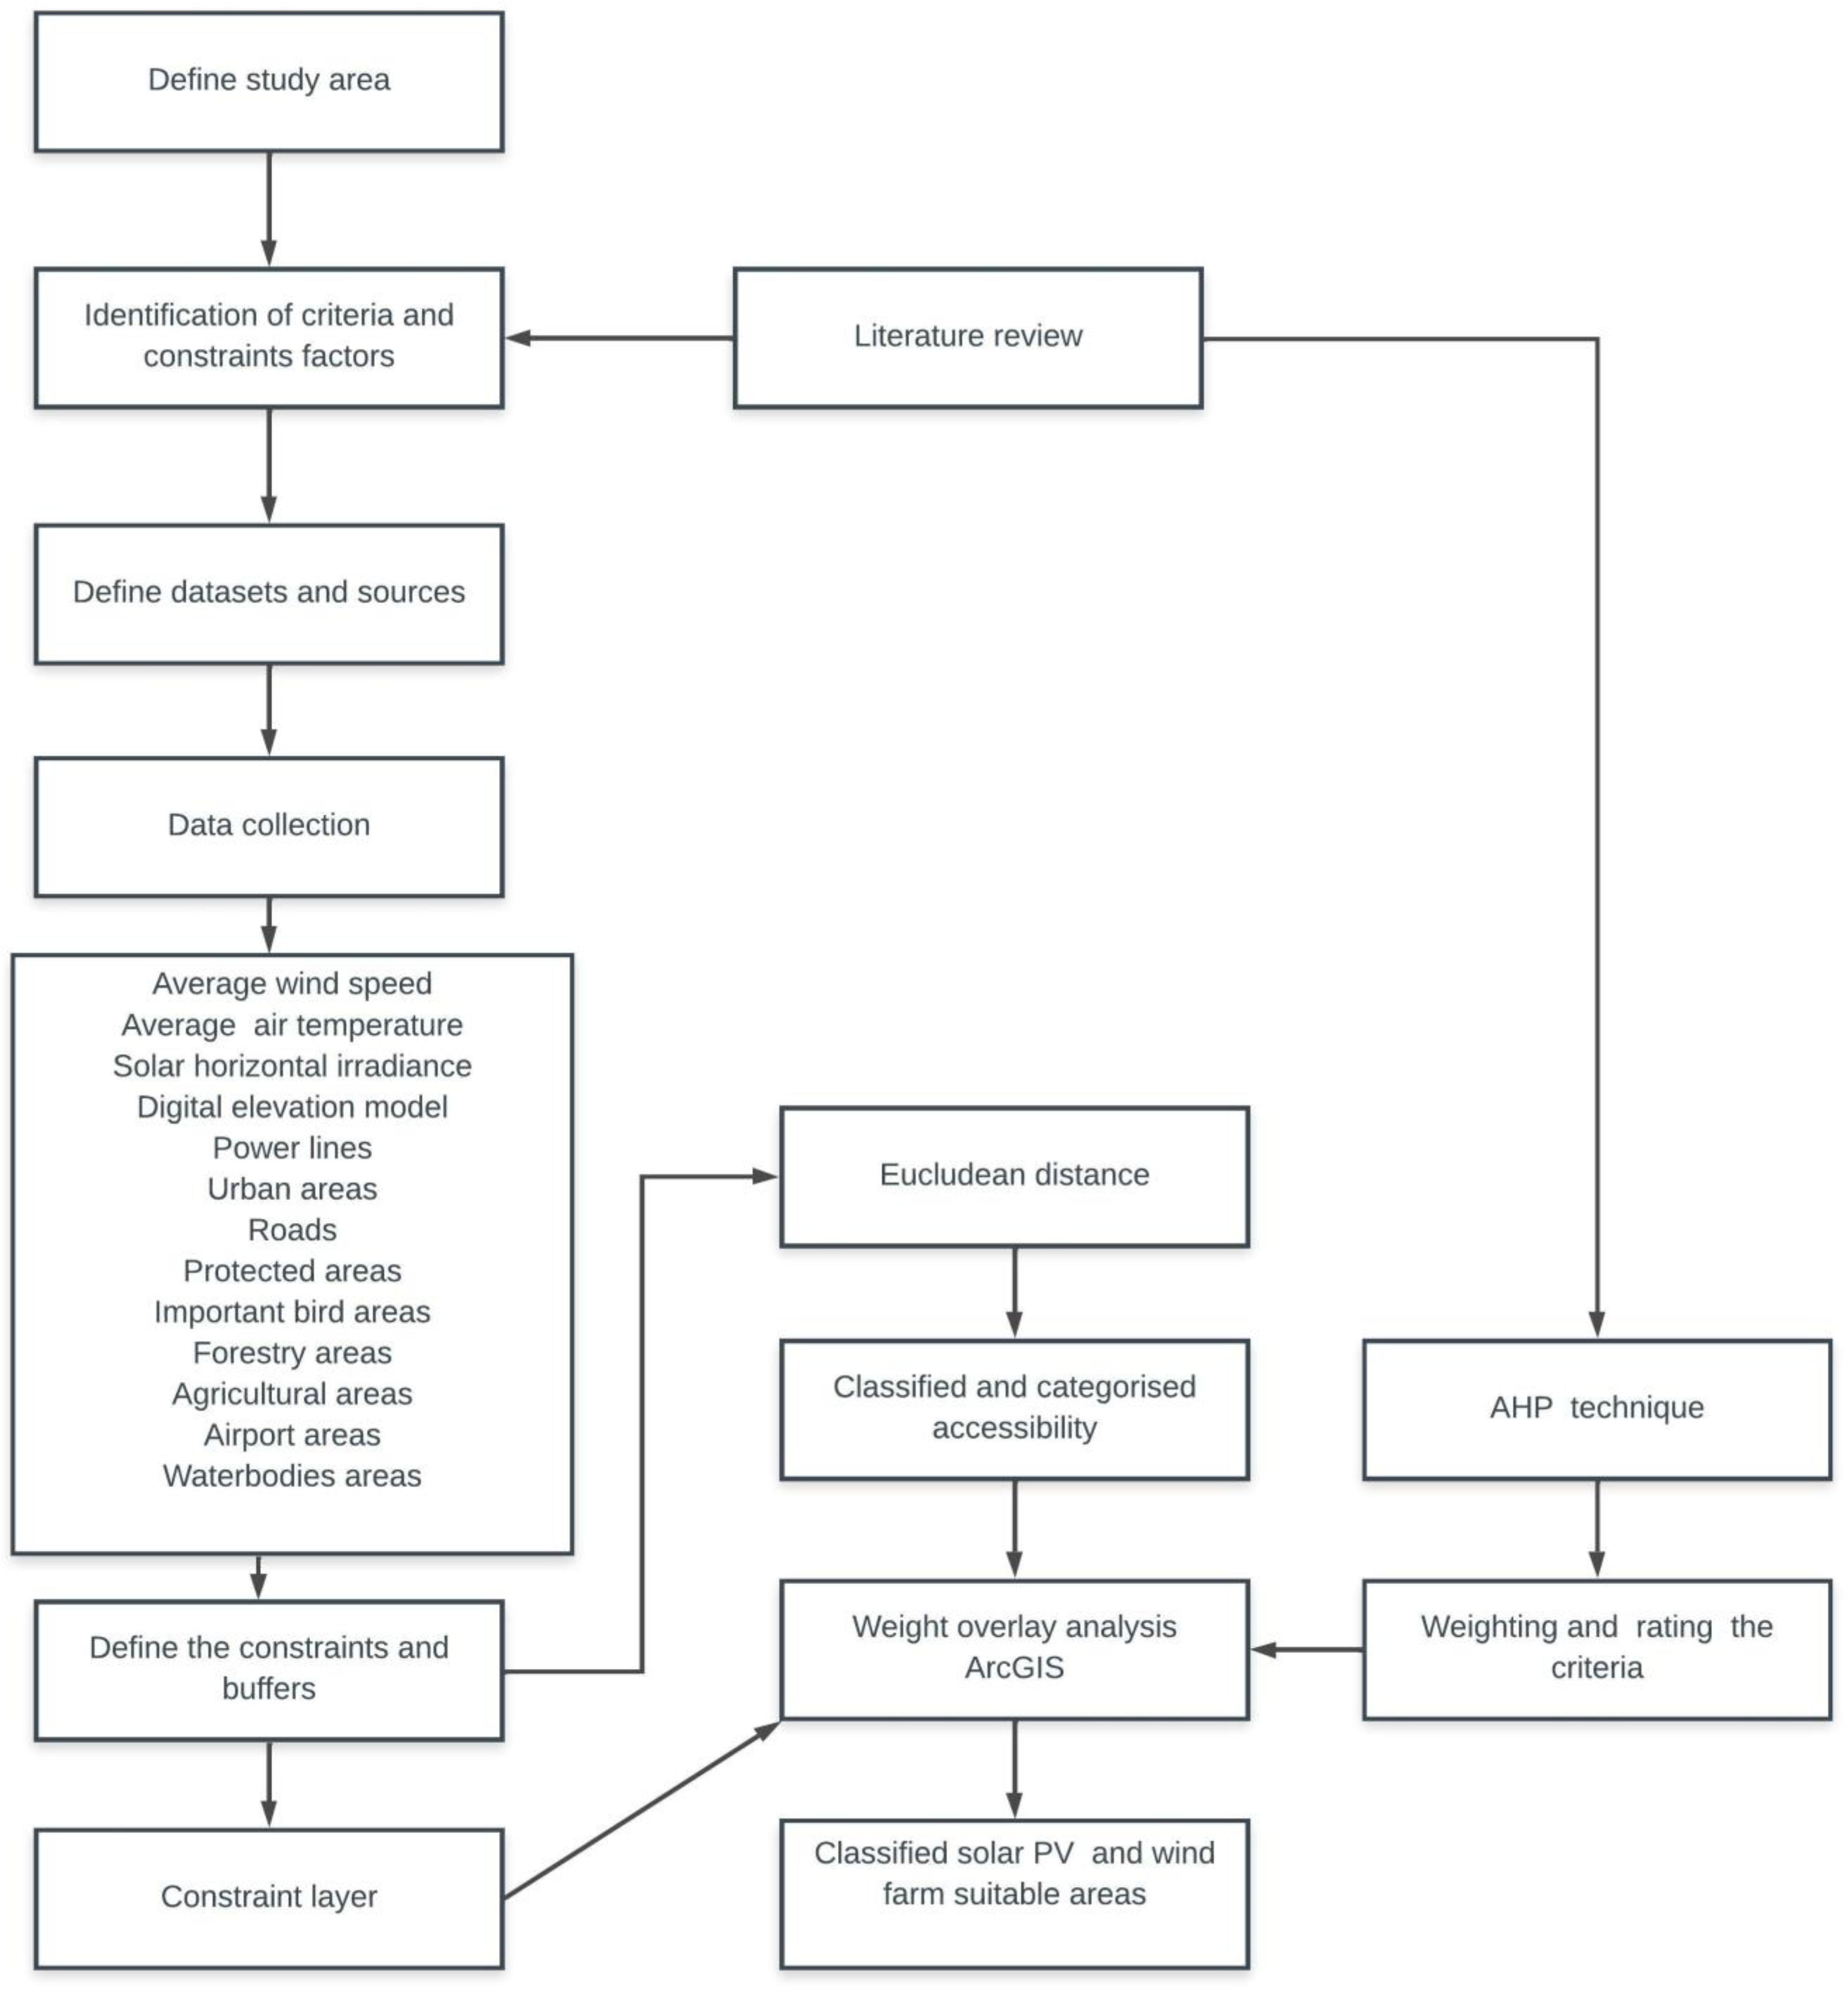
Figure 1 depicts the methodology used in the study. The elements of the figure are explained in the following sub-sections.
2.1. Study Area
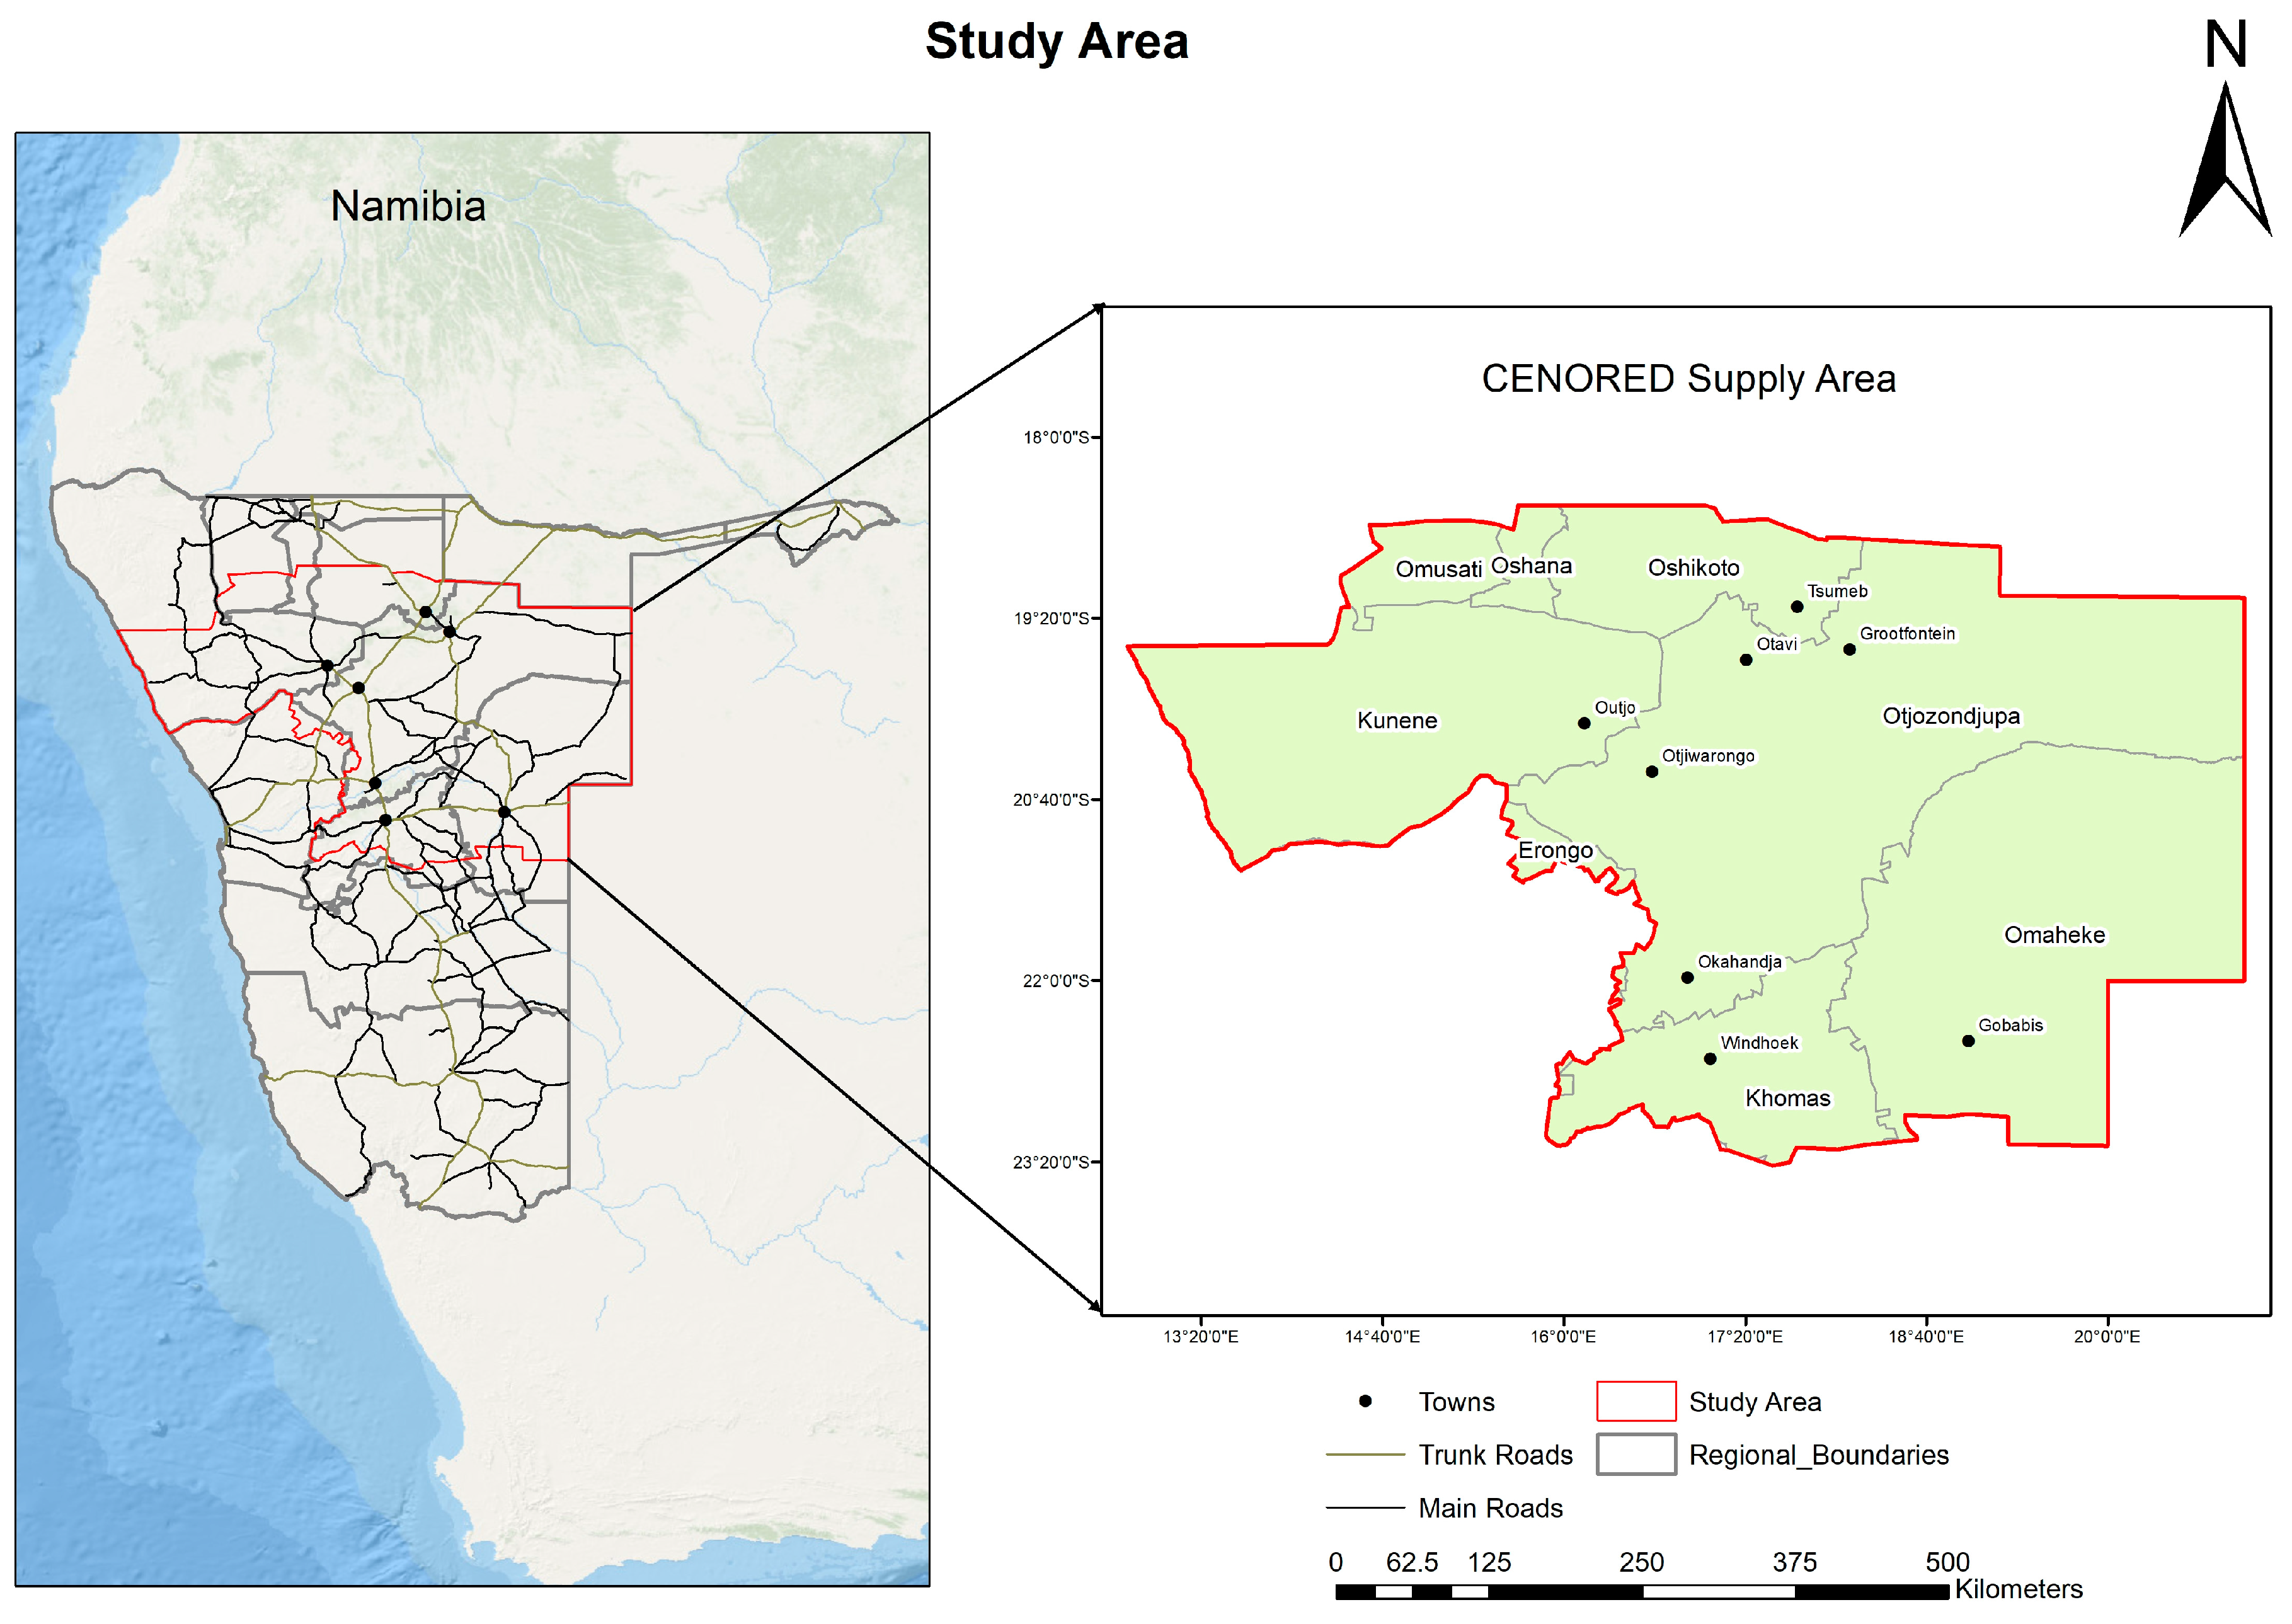
Central North Namibia is an area of about 120,000 km2, covering Otjozondjupa region and Kunene region and incorporating the Omaheke region (see Figure 2). It is characterised by highly mountainous areas and significant summer drought. Approximately 80% of the study area is covered by vegetation, mainly shrubland. Rainfall in the study region has historically been extremely variable. Normally, rain falls from October to March, sometimes extending into April and early May [21]. The study area is characterised by high temperature. The average minimum annual temperature is 11.0 °C, while the average maximum annual temperature is 24.0 °C [21]. Steeper slope and rough terrain are in the south-western and western regions of the study area while flat areas can be found all over the study area.
2.2. Identification of Criteria
At the outset, it is necessary to identify and define criteria that impact the site selection for wind and solar PV energy plant development based on previous research. The criteria below were derived from literature reviews. Google Scholar, Science Direct, and relevant online policy documentation were searched using keywords related to renewable energy, with emphasis on solar and wind energy site selection criteria. The criteria were thoroughly examined for their characteristics, benefits, and implications for wind and solar PV energy plant development. The detailed explanations of the thirteen considered criteria are given below.
- Average Wind Speed
For wind energy development, average wind speed is the most significant technical indicator, because average wind speed determines the best location for wind turbine installation [22]. A high average wind speed would indicate that wind resources are abundant and beneficial to increase power production. Wind speed increases with height, and since the turbine is mounted on the tower, the taller the tower, the more power is produced [23]. Even though wind availability is not the only factor contributing to the location of wind farms, it is the most significant criterion [16,24] and has been given the most weight in prior studies.
- 2.
- Distance to Protected Areas
According to the Environmental Management Act of 2007 of Namibia [25], solar PV and wind farms should be developed away from environmental protected areas such as national parks or inhabited areas as well as areas of historical importance. An appropriate buffer distance of 500 m needs to be maintained to protect environmentally sensitive areas [15,26]. The buffer is relevant because the construction of solar PV and wind farm power plants may possibly lead to unfavourable effects on threatened species.
- 3.
- Distance to Agricultural and Forestry Areas
The Namibian government has established policies to protect agricultural lands and forestry areas [27]. The goal is to increase farm incomes as well as food security on a national and household level by maintaining or increasing agricultural productivity. For this reason, agricultural land and forestry areas were excluded regardless of their other characteristics. As an additional constraint, a 100 m buffer zone around agricultural land and forestry areas was used to distance potential areas from restricted areas [28].
- 4.
- Distance to Waterbodies
To avoid any undesirable consequences of water overflow during rainy periods, RES plants should not be installed close to waterbodies [1,4,15]. In the present study, a buffer of 500 m was used as per Noorollahi et al. [4] and Sadeghi et al. [15].
- 5.
- Distance to Transportation
Roads are yet another important criterion to be considered while selecting potential locations for construction. The proximity of solar PV energy facilities to transport routes is regarded as an economic aspect [15,29]. The distance from the possible solar PV and wind power plant sites to roads should be minimised to lower the costs. Roads are needed for access to the site, transportation of material, and regular monitoring and maintenance of the RES energy plants. According to Uyan [26] and Sadeghi and Karimi [15], solar panels are best located more than 100 m from roadways to minimise the amount of non-natural dust that may be exposed to the PV modules, and to allow for possible future road expansion through the addition of carriageways and lanes on the road.
- 6.
- Distance to Existing Power Lines
Installing wind and solar PV energy plants close to the existing electrical network is cost-effective. This would aid in avoiding voltage drops, reducing energy loss due to the long distance travelled by generated energy, and lowering infrastructure costs such as the construction of a new power line [1,4]. The solar PV must be at least a few meters away from the edge of the power line servitude clearance, which ranges from 22 to 80 m depending on the voltage level of the power line. A safe distance between the electrical line and any other system should also be observed for safety operating purposes. Therefore, in the present study, areas less than 100 m from the power lines were considered as not suitable for solar PV plants, in accordance with the Electricity Act 4 of 2007 [30].
According to the North Rhine-Westphalia wind energy enactment [31], a minimum distance of one rotor diameter must be maintained between the rotor blade tip and the overhead power line. The rotor blade diameter of the reference wind turbine is 101 m. As a result, areas closer than 100 m to the electrical network are designated as restricted. However, per [15,32,33], wind development should be kept at least 250 m away from the electrical grid.
- 7.
- Distance to Urban Areas
Economically, installing solar PV power plants and wind farms close to the consumer is advantageous. Nevertheless, considering future expansion and development, it is necessary to specify a buffer distance from residential areas [1,15,26,34]. The location of a solar PV energy facility should be 500 m away from metropolitan areas [1,15,26]. The establishment of solar PV facilities near metropolitan areas may have a negative impact on population growth rates and dispersion. Wind farm societal effects, such as noise, visual intrusion, and aesthetics, are frequently cited as important constraints for wind development projects. In the current study, an 800 m buffer zone was used as recommended by CNdV Africa Planning and Design [33].
- 8.
- Distance to Airfield
As wind turbines are at such a height that they can affect airborne navigation, airports are among the most important factors to consider when identifying the optimal sites for wind energy plants. The aim is to address safety concerns [35], because wind turbines generate electromagnetic signals that can interfere with the surveillance radar signals used to control traffic at an airport [36]. Therefore, the wind farm locations should be 25,000 m away from primary airports with radar, 15,000 m from military airports, and at least 2500 m from local airports [32,33,37].
- 9.
- Important Bird Areas
Although wind power is generally thought to be environmentally favourable, its development has been linked to fatal bird and bat collisions with turbine blades. Birds have been recorded among the most common casualties of wind turbine accidents around the world [38]. In the United States, the Fish and Wildlife Service estimates that wind turbine blades kill between 140,000 and 500,000 birds each year [39]. Birdlife International has identified important bird areas (IBA) to recognise and protect birds. Previous studies discovered that wind energy plants located in unfavourable geographic areas might pose negative effects on birds and bats, such as the possibility of habitat destruction and rise in mortality rate [24,40]. Wind energy plants should, therefore, be positioned outside IBA and bat areas to ensure their preservation, lessen bird collisions, and decrease noise impacting fauna. As a result, the bird and bat habitats and their migration routes are ineligible for installation of large wind power facilities.
For this study, a 1000 m buffer zone from IBA-identified areas was considered as a constraint for wind energy development as suggested by previous studies [33,41]. Due to lack of a bird migratory route dataset and a bat area dataset, only IBA datasets were used in this study.
- 10.
- Average Solar Irradiation
Solar PV panels require at least 1300 kWh/m2/yr global solar irradiation (GHI) which is equivalent to 3.5 kWh/m2/day for cost-effective operation [42]. The amount of solar radiation that a site receives heavily influences its suitability for solar PV installation, therefore, solar irradiance and energy production are positively correlated [17,34,43]. For investors, it is preferable to build a solar PV energy plant in an area with a high potential for solar irradiance [14]. The inconsistency and variability of GHI, on the other hand, is one of the challenges in installing solar PV energy plants. In line with previous study findings—see, e.g., [1,2], regions with GHI below 1300 kWh/m2/yr were considered as unsuitable for this study.
- 11.
- Average Air Temperature
Air temperature is one of the main factors that should be considered for solar PV sites because the temperature of solar cells has a substantial effect on their performance. As the ambient temperature rises, solar module temperature increases, and the current output of the module increases exponentially while the voltage output decreases linearly. Therefore, high air temperatures have an adverse effect on the efficiency of solar module systems [44,45,46]. The optimal air temperature of solar PV cells ranges between 15 °C and 40 °C. When the cell’s temperature is 25 °C, the PV system produces at maximum efficiency, and when the temperature is raised above 25 °C the voltage output drops [45,47]. Solar PV cells produce more power on cold, sunny days and can outperform values obtained during the standard testing at 25 °C [48]. Therefore, in this study, areas with average temperatures less than 20 °C were considered as highly suitable.
- 12.
- Aspect
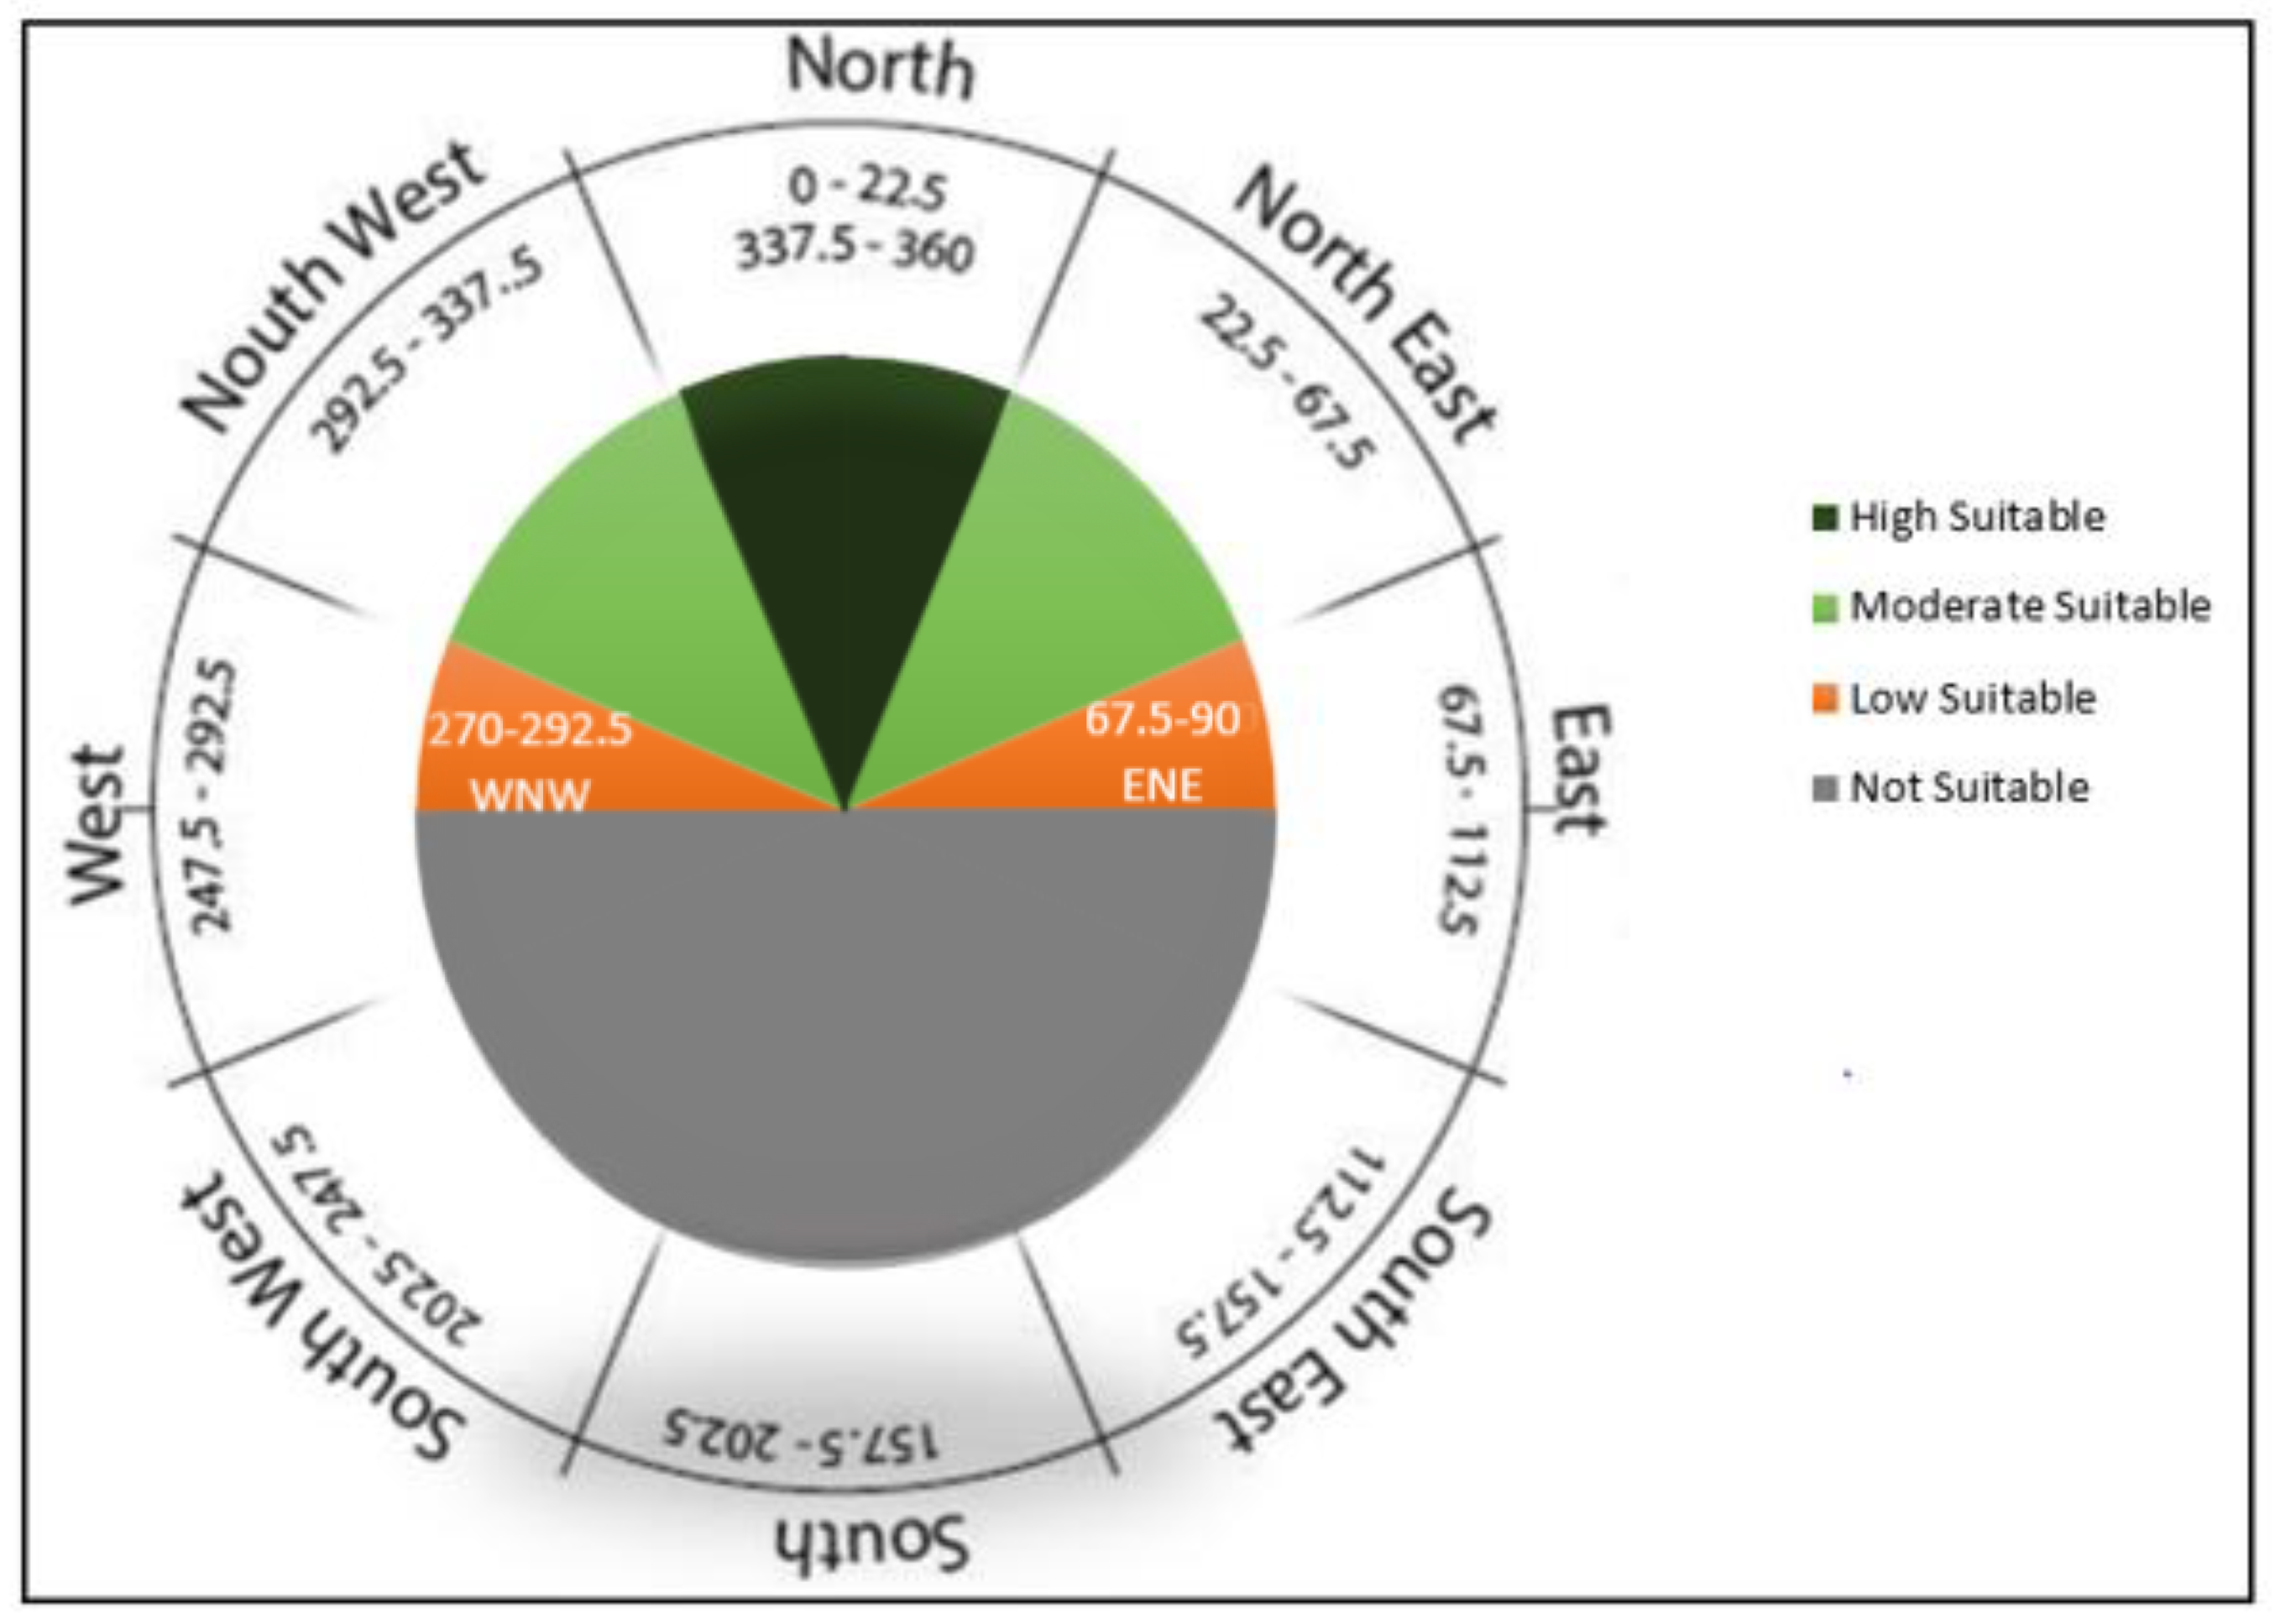
Aspect describes slope orientation, which is measured in degrees (0° to 359.9°) clockwise from north. Aspect is crucial since it determines a specific area’s solar potential. It determines how solar-efficient an area is due to its ability to reflect sunlight. In the southern hemisphere, the slopes facing north receive the most solar radiation, whereas slopes facing south receive the least solar radiation [13]. Therefore, for Namibia, surfaces facing the geographic north were prioritised. Throughout the year, these surfaces are much more exposed to the sun’s irradiation than those facing south. The areas facing directions from west to east through north were given the highest weighting—see Figure 3.
- 13.
- Slope
Slope is a critical criterion for construction as it is essential in evaluating the economic feasibility of the project; this is largely influenced by the accessibility of the construction site and ease of transportation during construction. The excavation or filling of the area becomes time consuming and costs more when the land does not meet the slope requirement. Areas with mild slopes will aid in avoiding the high construction costs associated with high slope areas. Areas with steeper slopes are unsuitable for RES energy plant development projects because of low economic viability. According to Uyan [26] it has been found that slopes below 3% are highly appropriate and ideal for locating solar PV sites.
2.3. Data Processing
In this study, raw datasets were obtained from open sources, and different datasets were explored. In comparison to other freely available data, we used the Global Solar Atlas dataset for wind and air temperature because it provided the most consistent and complete dataset. In locating the solar PV and wind energy power plants, all analyses were conducted using ArcMap software (desktop version), from the company Esri®, to perform a site-suitability analysis. Numerous datasets (see Table 1) were pre-processed. Others were derived from the available data, e.g., slope and aspect rasters were produced from the Digital Elevation Model. For this study, the GIS methods employed require vector data to be rasterized, making it easier to reclassify during further data processing. All datasets were reclassified before performing weighted overlay operation. In the weighted overlay approach, average solar irradiation, average wind speed, aspect, slope, average air temperature, powerline, and road data are the input rasters. Finally, using the weighted overlay method, various classes of suitable locations were discovered and segregated.
The restricted areas along with their buffers are identified and excluded from the analysis. This includes environmentally sensitive/protected land, urban areas, forestry lands, waterbodies, airports, and IBA.
2.4. Weighted Overlay
One of the most common approaches to overlay analysis is the weighted overlay method. It is used to combine the evaluation criteria layers with their associated weights to create a single map layer [49]. A weighted overlay approach makes it possible to calculate and perform a multiple-criteria analysis between sets of raster layers. The default evaluation scales range from one to nine, with one being the least suitable and nine being the most suitable. In the case where input rasters have already been reclassified to a common measurement scale, it is critical to choose an evaluation scale that corresponds to the reclassified raster layers. Each raster layer input might be given a percentage influence or weighted. All raster layers must have a total influence of 100 percent.
2.5. Analytical Hierarchy Process
The AHP method [13,50,51] is based on a series of pairwise comparisons that consider the researcher’s perception and evaluation. It is simple to use because of its hierarchical structure and pairwise comparison, which enable the researcher to assign different weights to each criterion. It can integrate quantitative and qualitative criteria into a unified decision framework [51].
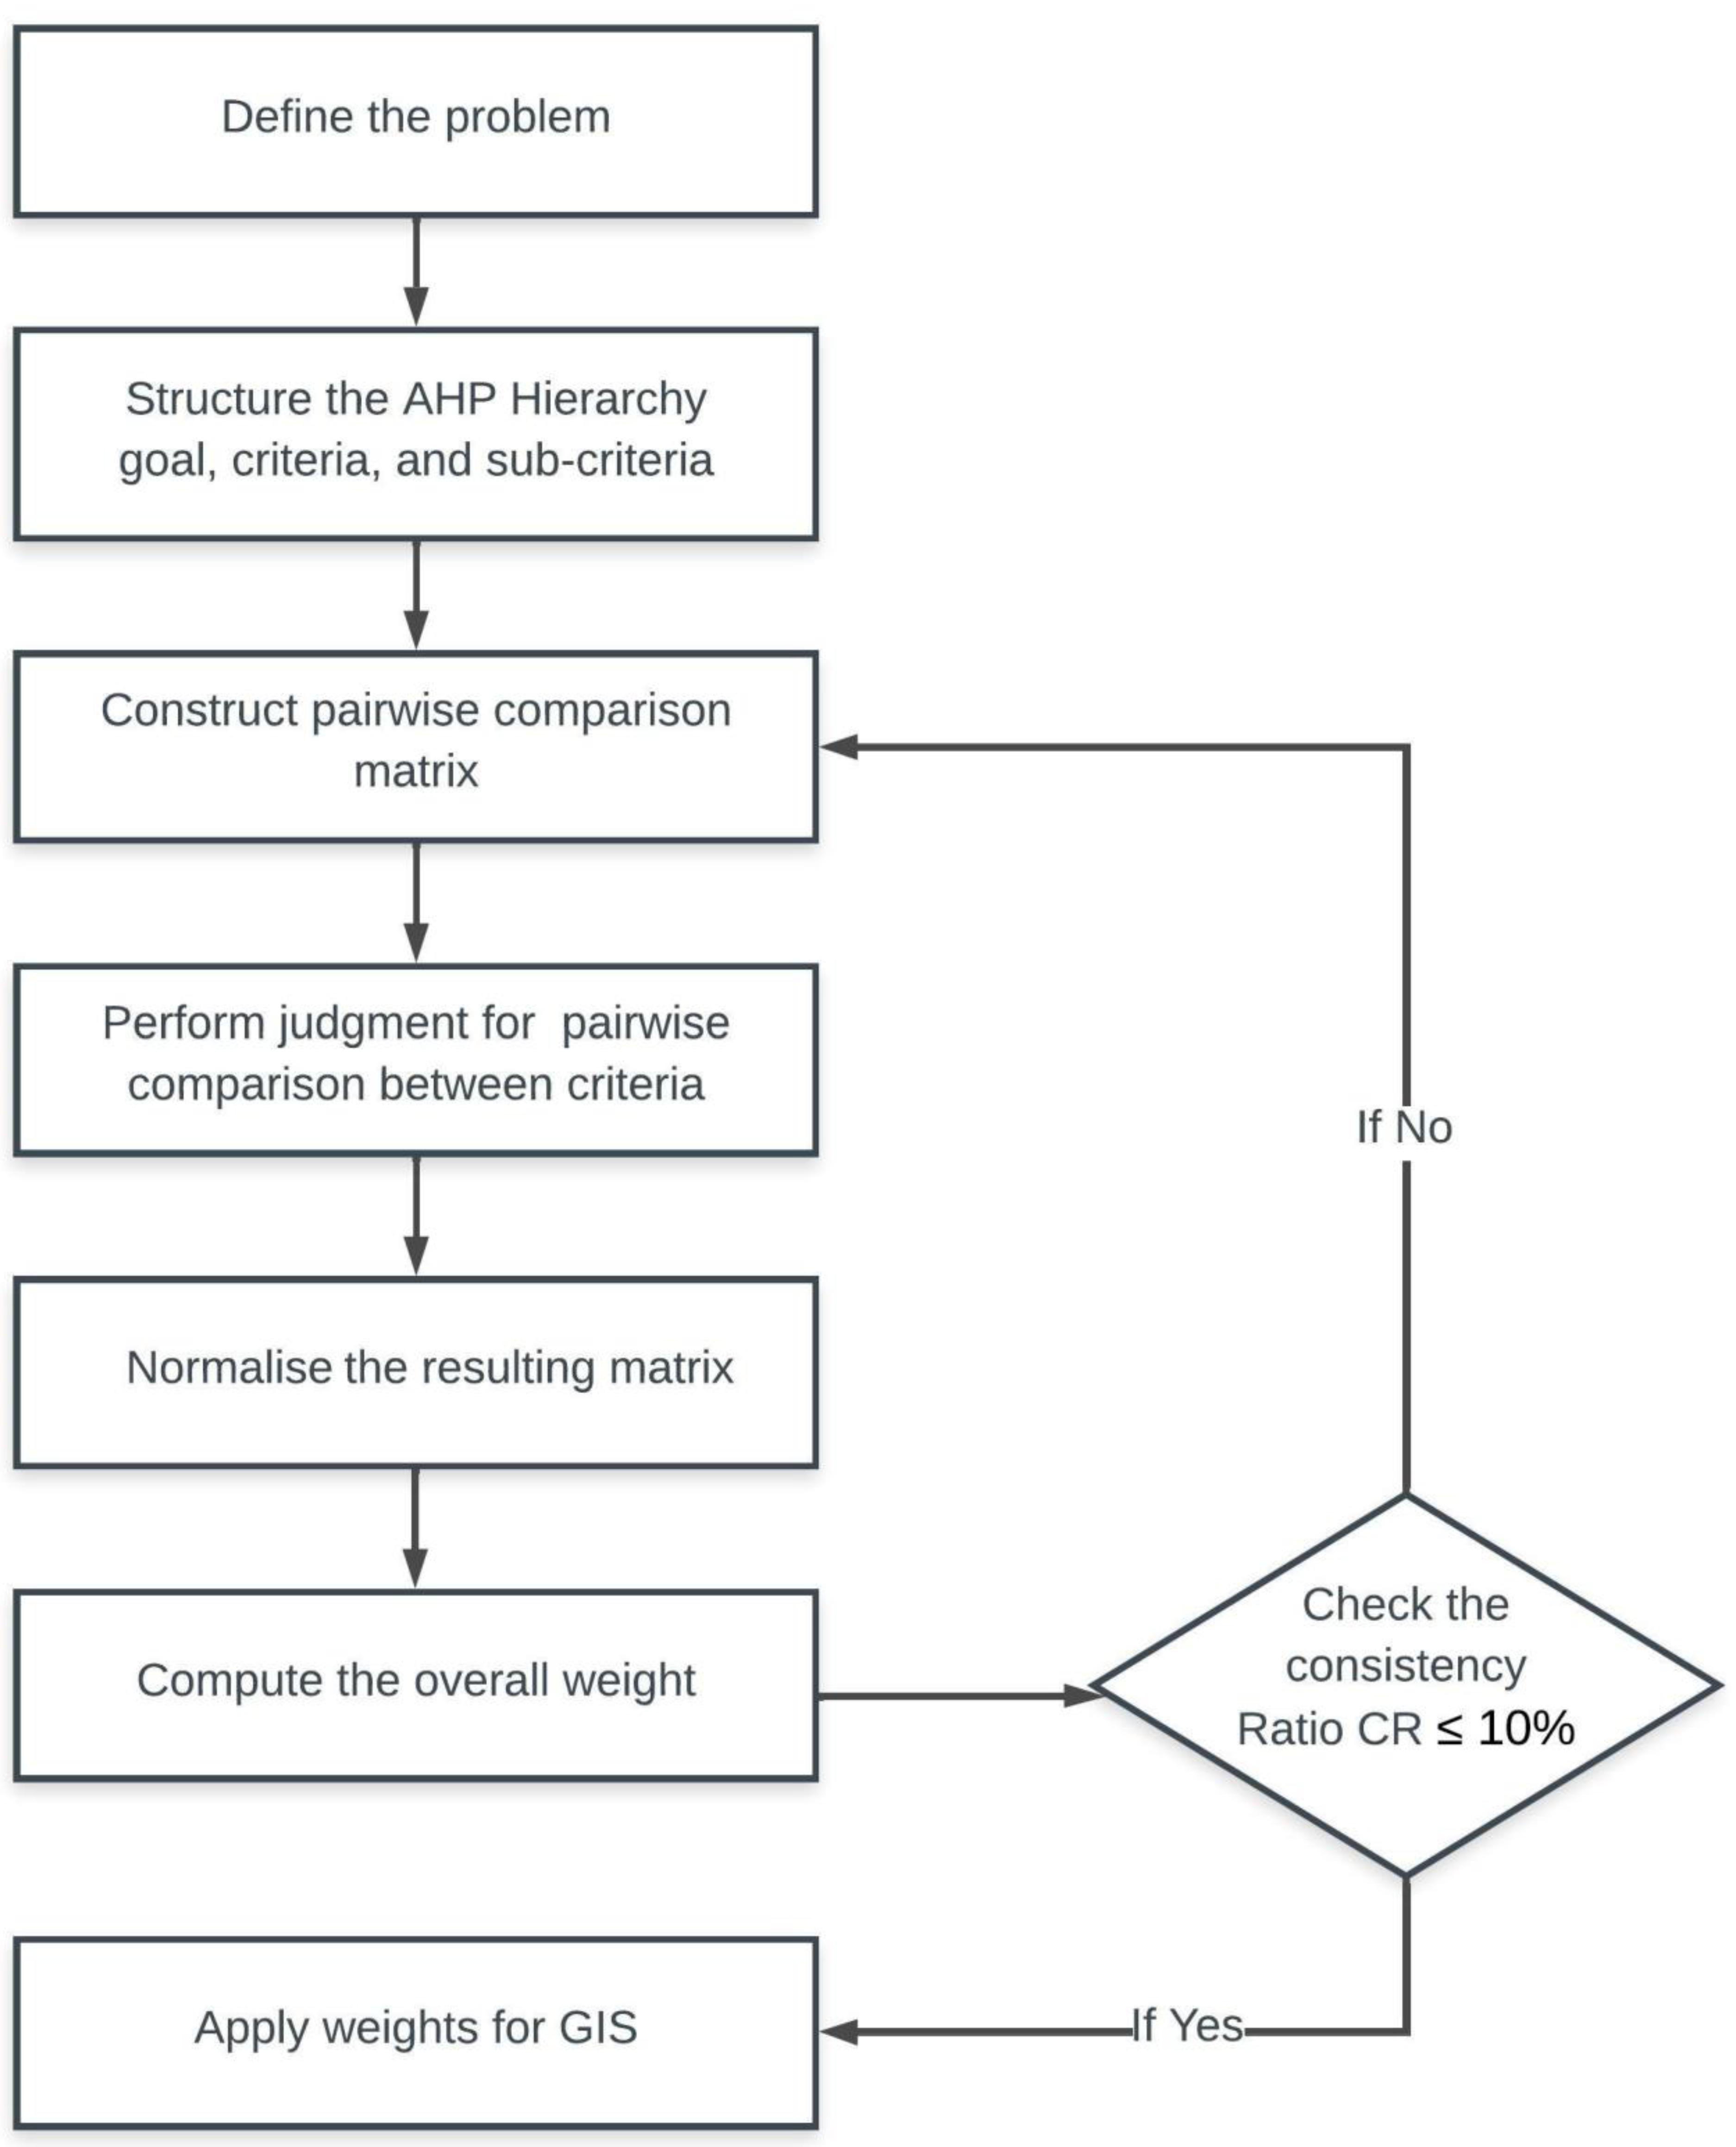
AHP is a procedure in which each criterion is assigned a level based on a pair-wise comparison in the matrix to determine the relative weights of each. The matrix allows for the comparison of the significance of each relative element and calculation of the weight of each index in relation to the general objectives, thus simplifying the decision-making process. The pairwise comparison matrix is generated using a numerical scale of degrees. The judgment of pairwise comparisons is made by using the sequence values of 1 (equal importance) to 9 (extreme importance). It reduces any possible error that may occur during multi-criteria evaluation and can deal with inconsistent judgments. Based on Saaty [51], the fundamental principles of AHP can be summarised in the phases as shown in Figure 3.
The following are the important steps in identifying the optimal sites for solar PV plant deployment using AHP technique: In the AHP process, the first stage is to structure the decision problem as a hierarchy by identifying the goal and criteria. In Figure 4, the decision problem was structured into a hierarchical model, with the goal representing the top level, which is to choose the optimal sites for installing PV utility-scale plants. In the second level, the decision criteria are listed. As indicated in Table 2, the pairwise comparisons of the criteria are determined on a numerical scale from one to nine depending on the importance of each criterion, as proposed by Saaty [51].
The second important step is to generate the pairwise comparison matrix. The pairwise comparison matrix, M, is the square matrix (n × n), where n is the number of criteria. Each cell ajk of matrix M represents the comparison values between the jth (row) criterion relative to the kth (column) criterion. If the cell ajk > 1, the jth criterion is more important than the kth criterion and vice versa.
The next step is to derive the normalised pairwise comparison matrix after constructing the preceding pairwise comparison matrices to obtain the priority (weights) of each criterion. The sum of each column in a normalised pairwise comparison matrix must equal 1. This may be derived by calculating sjk for each cell in the matrix using Equation (1).
To determine the criterion weight vector (Wj), Equation (2) was used. The criterion weight vector Wj is calculated by averaging across rows to obtain the relative weights, where m is the number of values in the row.
Finally, a consistency ratio (CR) needs to be computed for the matrix to assess the consistency of the experts’ judgement. The degree of consistency in the analysis is considered acceptable if the CR ≤ 10%. If CR > 10%, the judgments must be revised to identify and correct the source of the inconsistency; therefore, to provide an acceptable level of consistency, the CR value should be always ≤ 10% [51]. CR is given by Equations (3) and (4) below.
where is the maximum Eigen value of the comparison matrix and n is the size of the matrix. represents values of random consistency index depending on the number of criteria n considered in M. The RI value is shown in Table 3.
3. Results
3.1. Restricted Areas for Solar Pv and Wind Power Plant Development
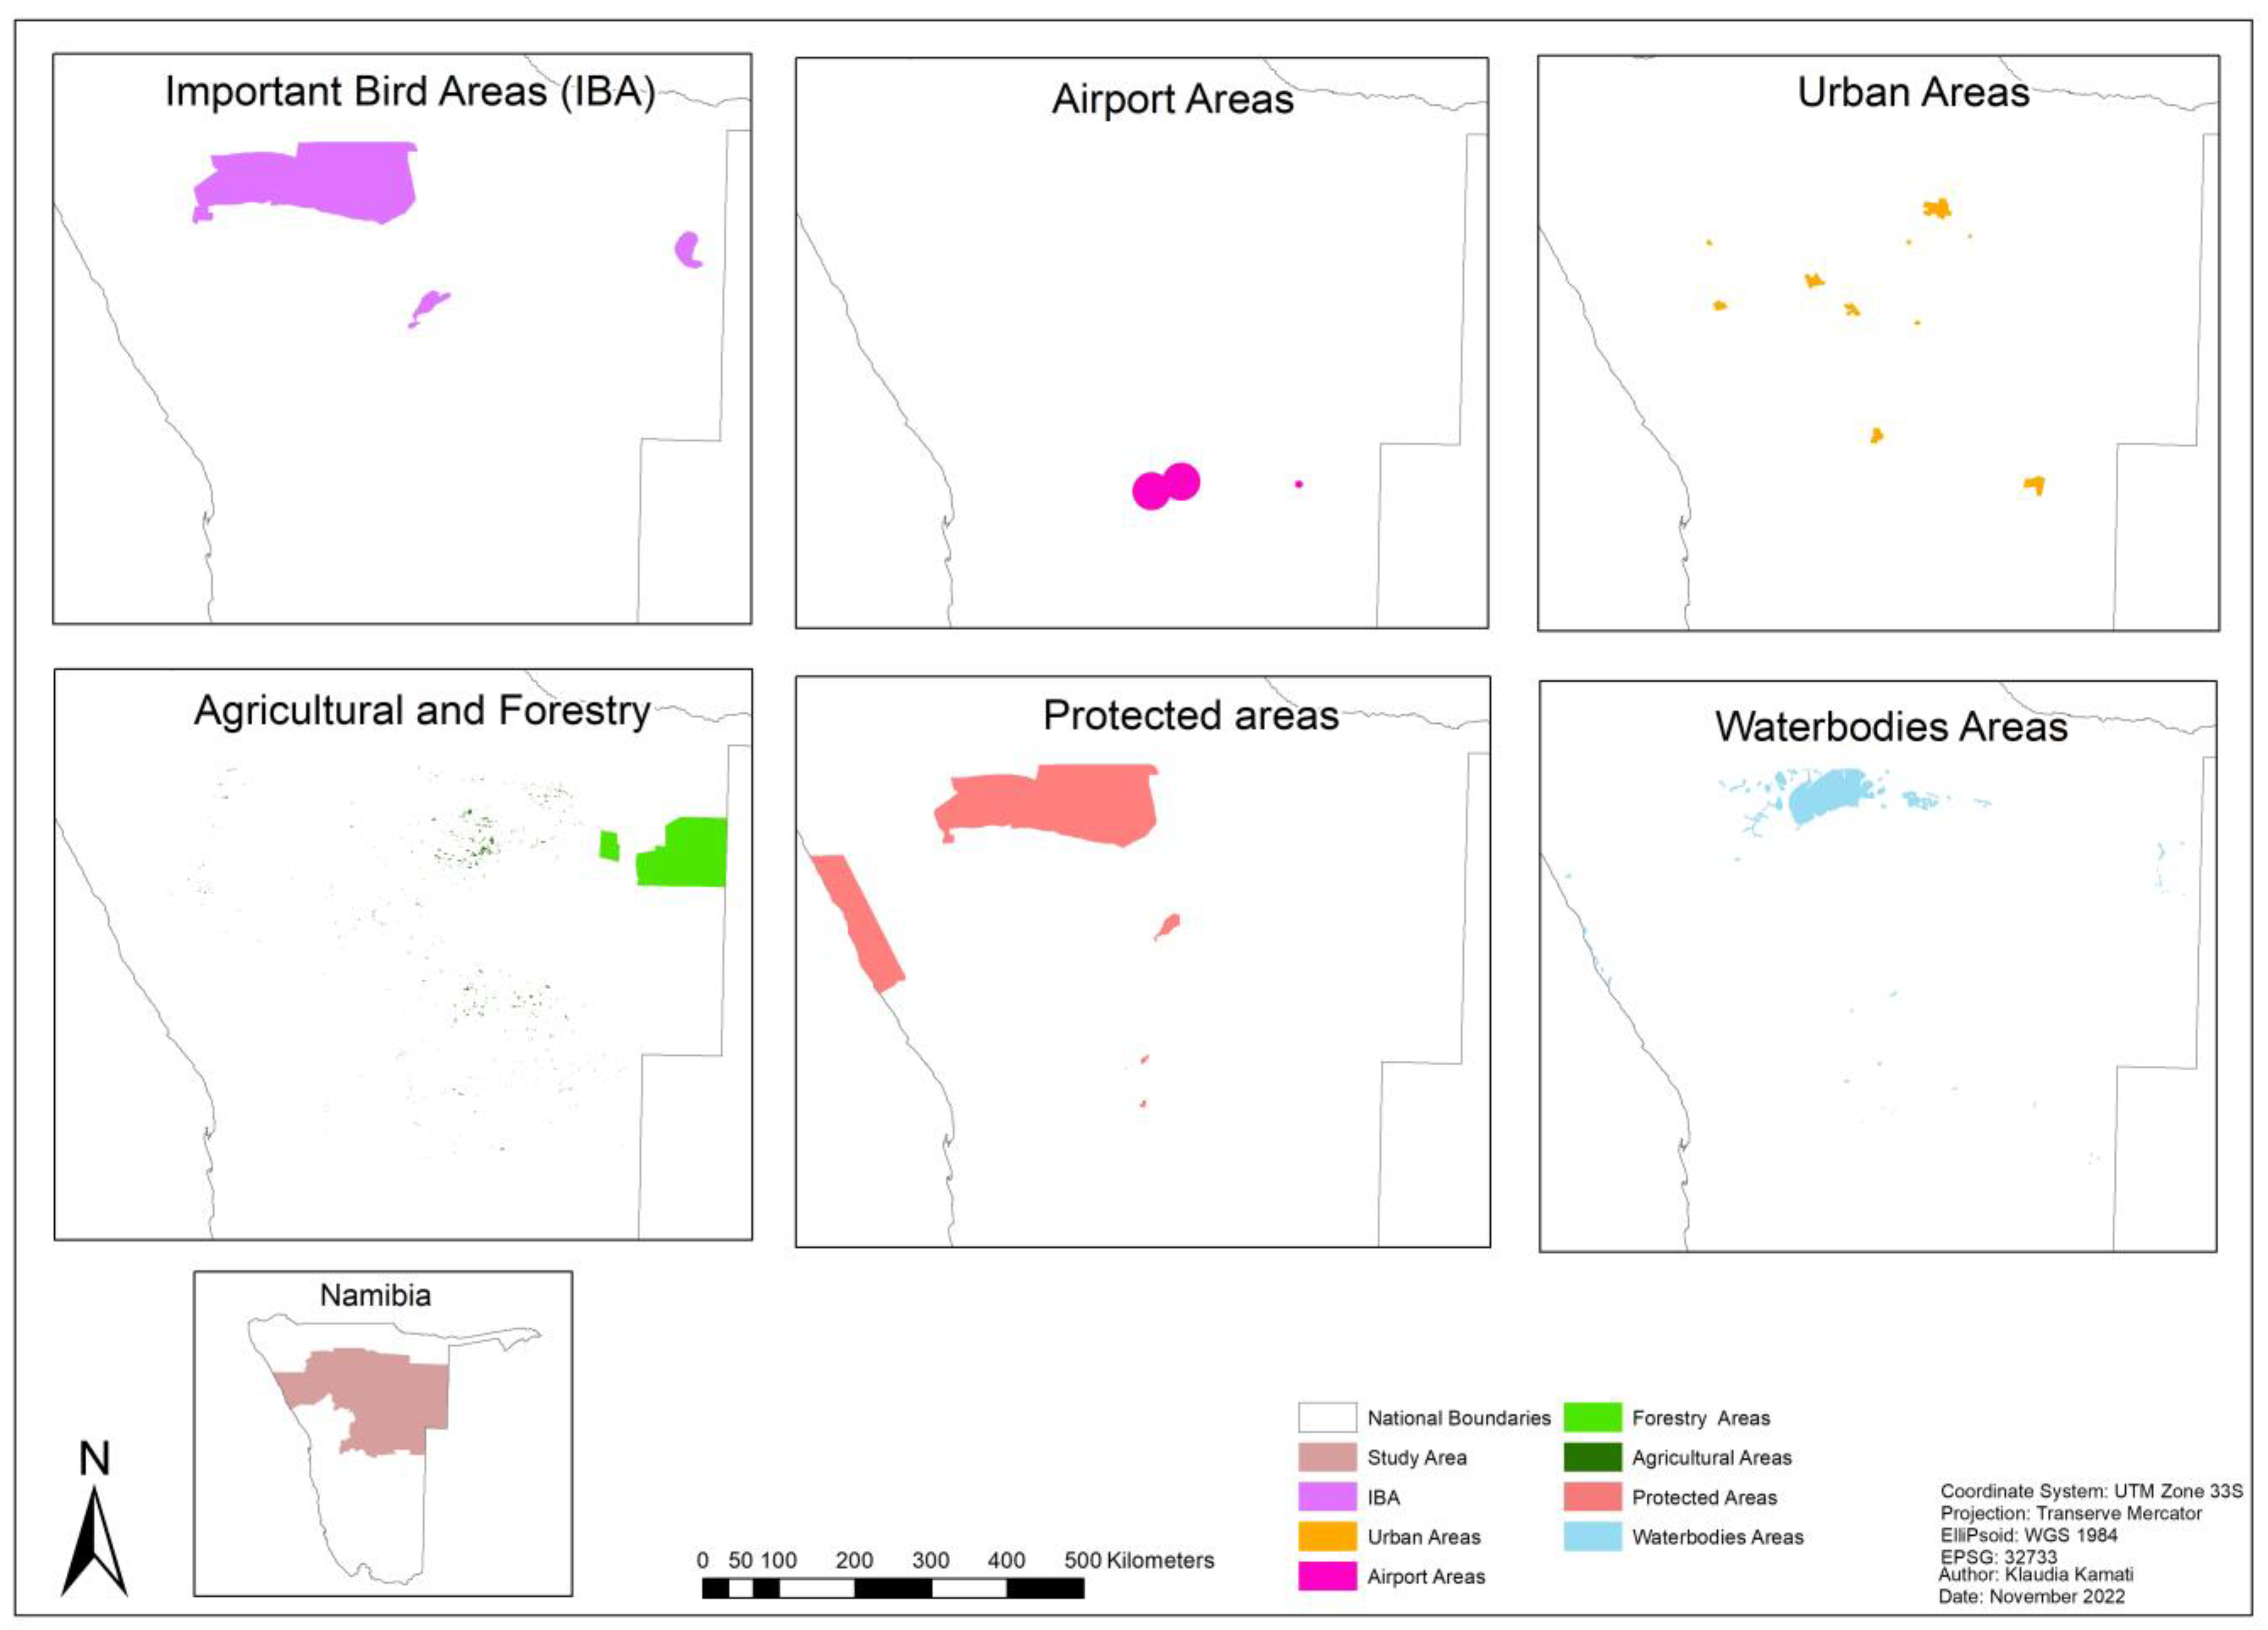
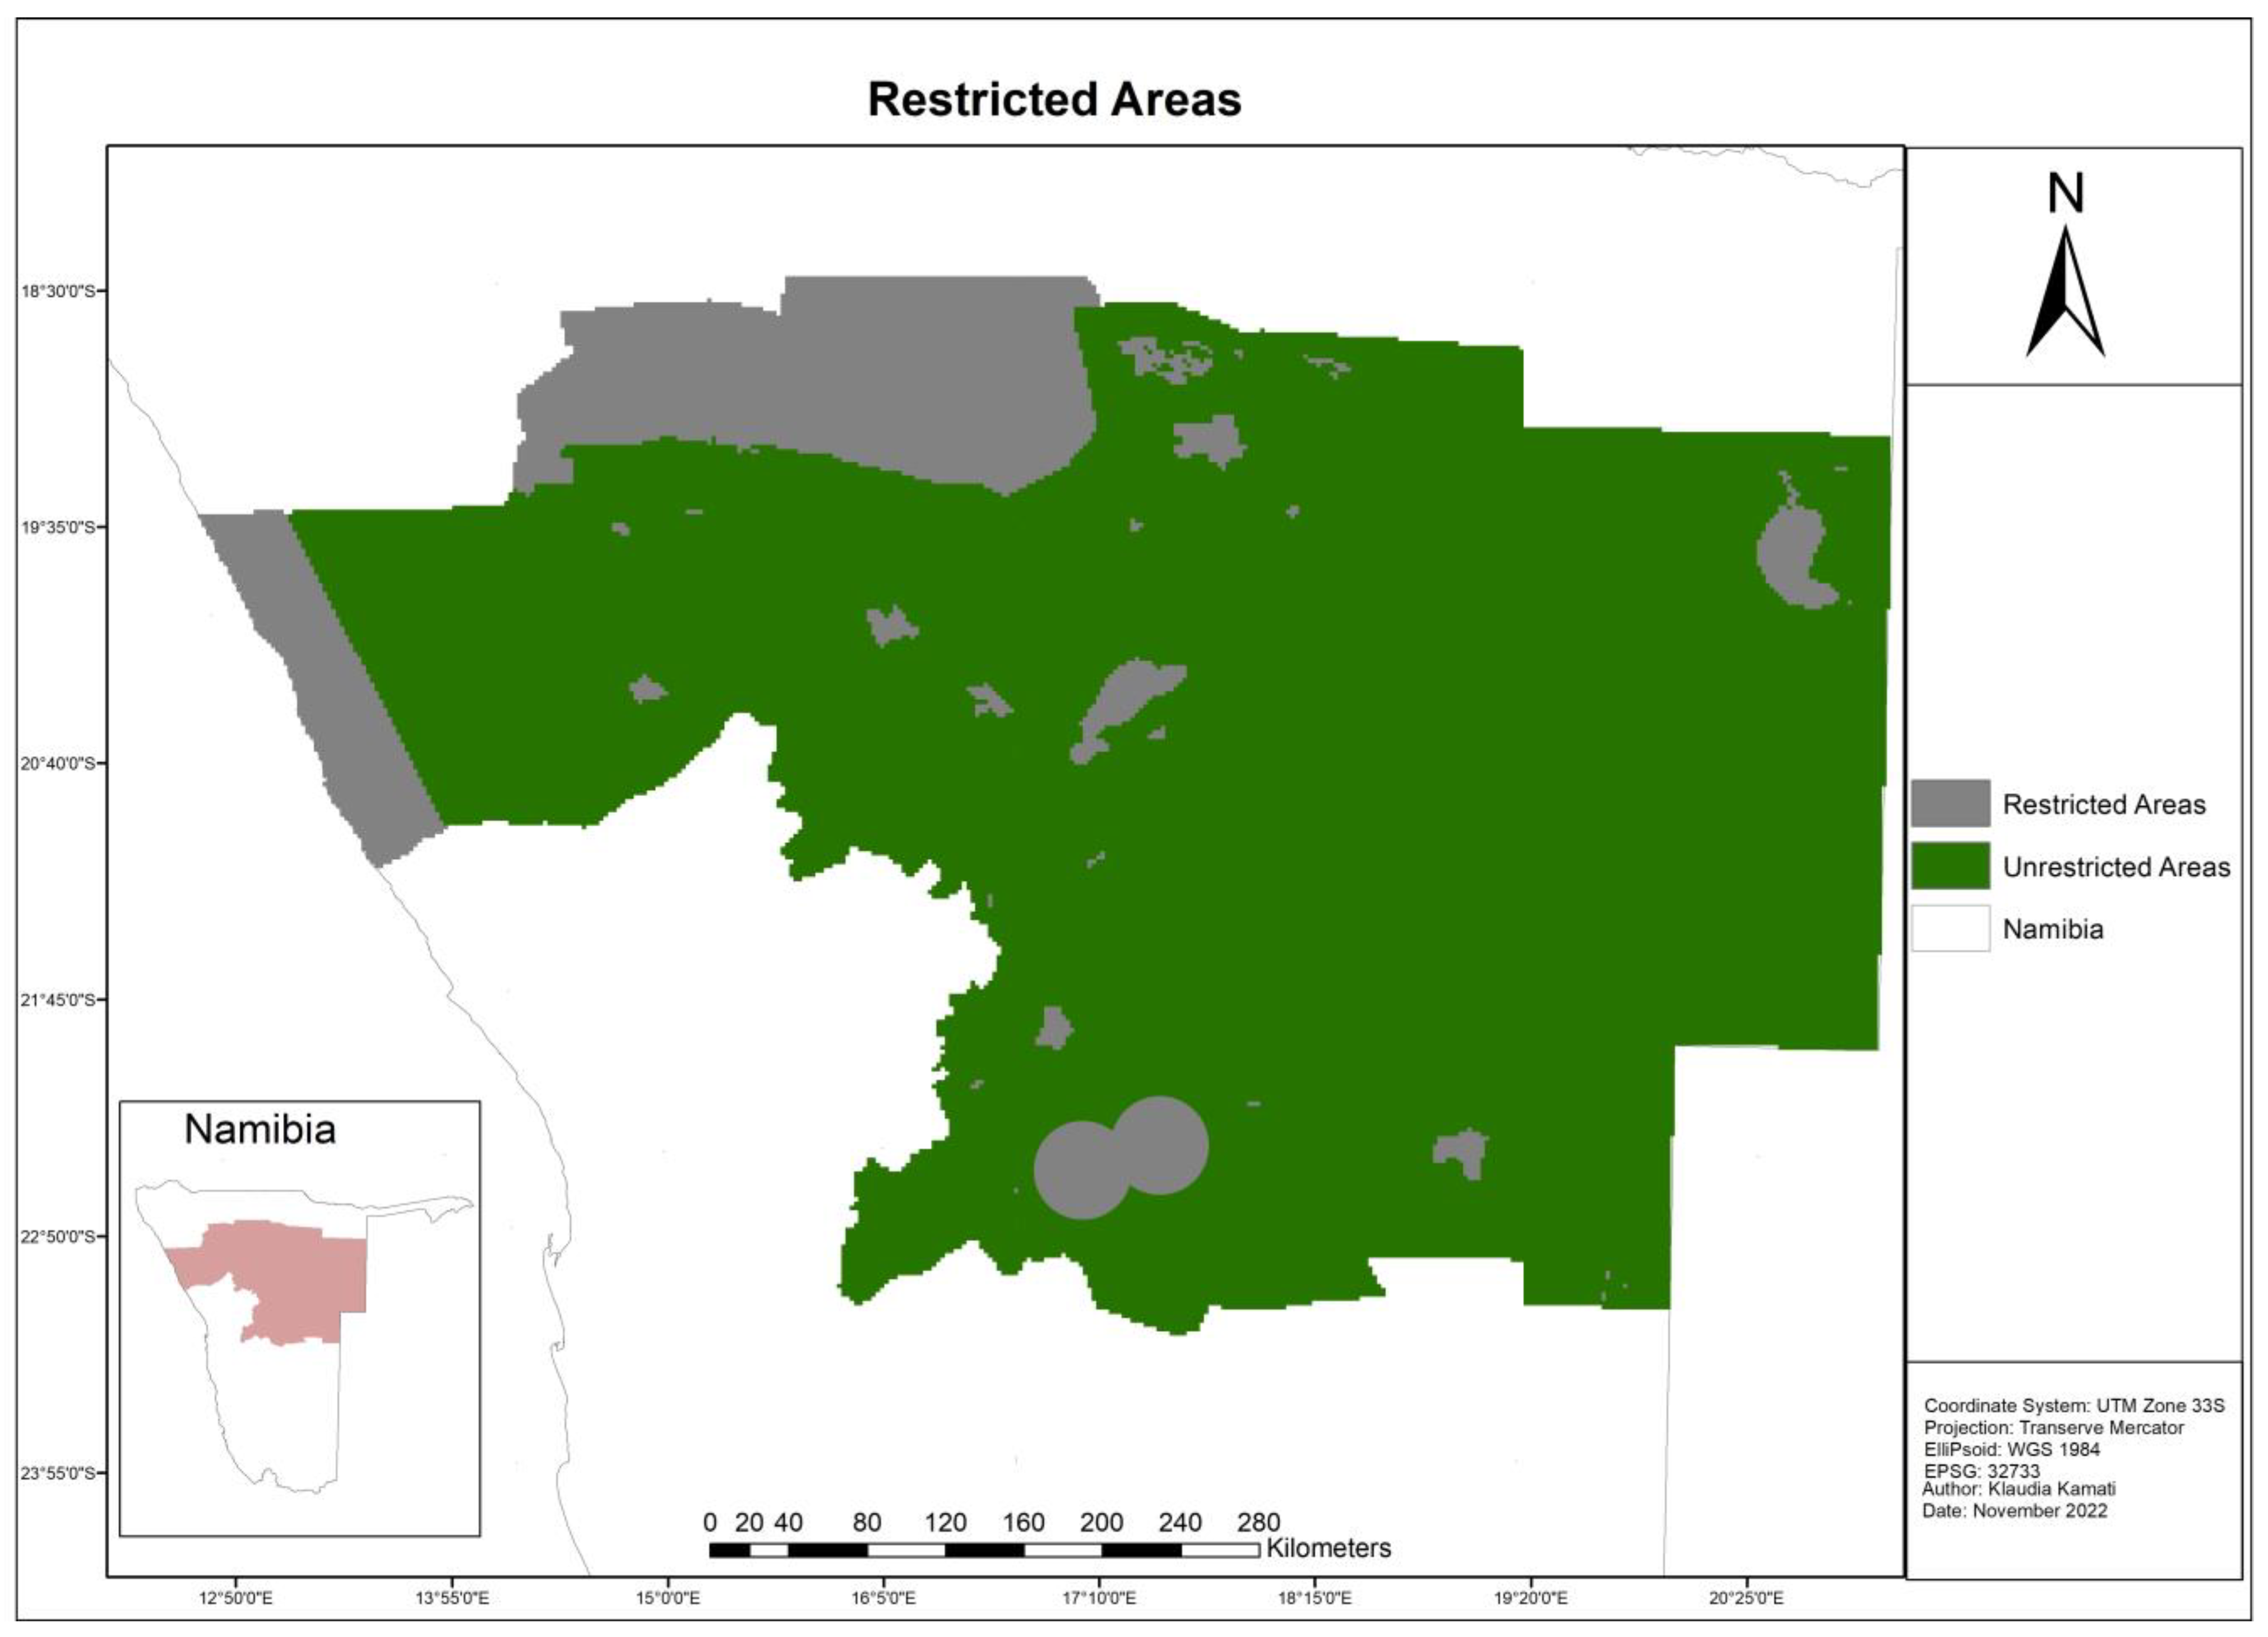
A constraint is used to narrow down the options being explored, excluding places that are undesirable. Forestry areas, agriculture, water bodies, metropolitan areas, IBA, and protected areas were imposed as limits. Table 4 presents a summary of threshold requirements for constraint criteria that impact an area’s suitability for developing solar PV and wind power plants. These are illustrated in Figure 5. Union analysis was used to combine these layers into a single, composite layer preserving all input feature boundaries and attributes with all the necessary buffers. Restricted areas are indicated in grey while the feasible areas are shown in dark green in Figure 6.
3.2. Solar Pv Power Plant Suitable Areas
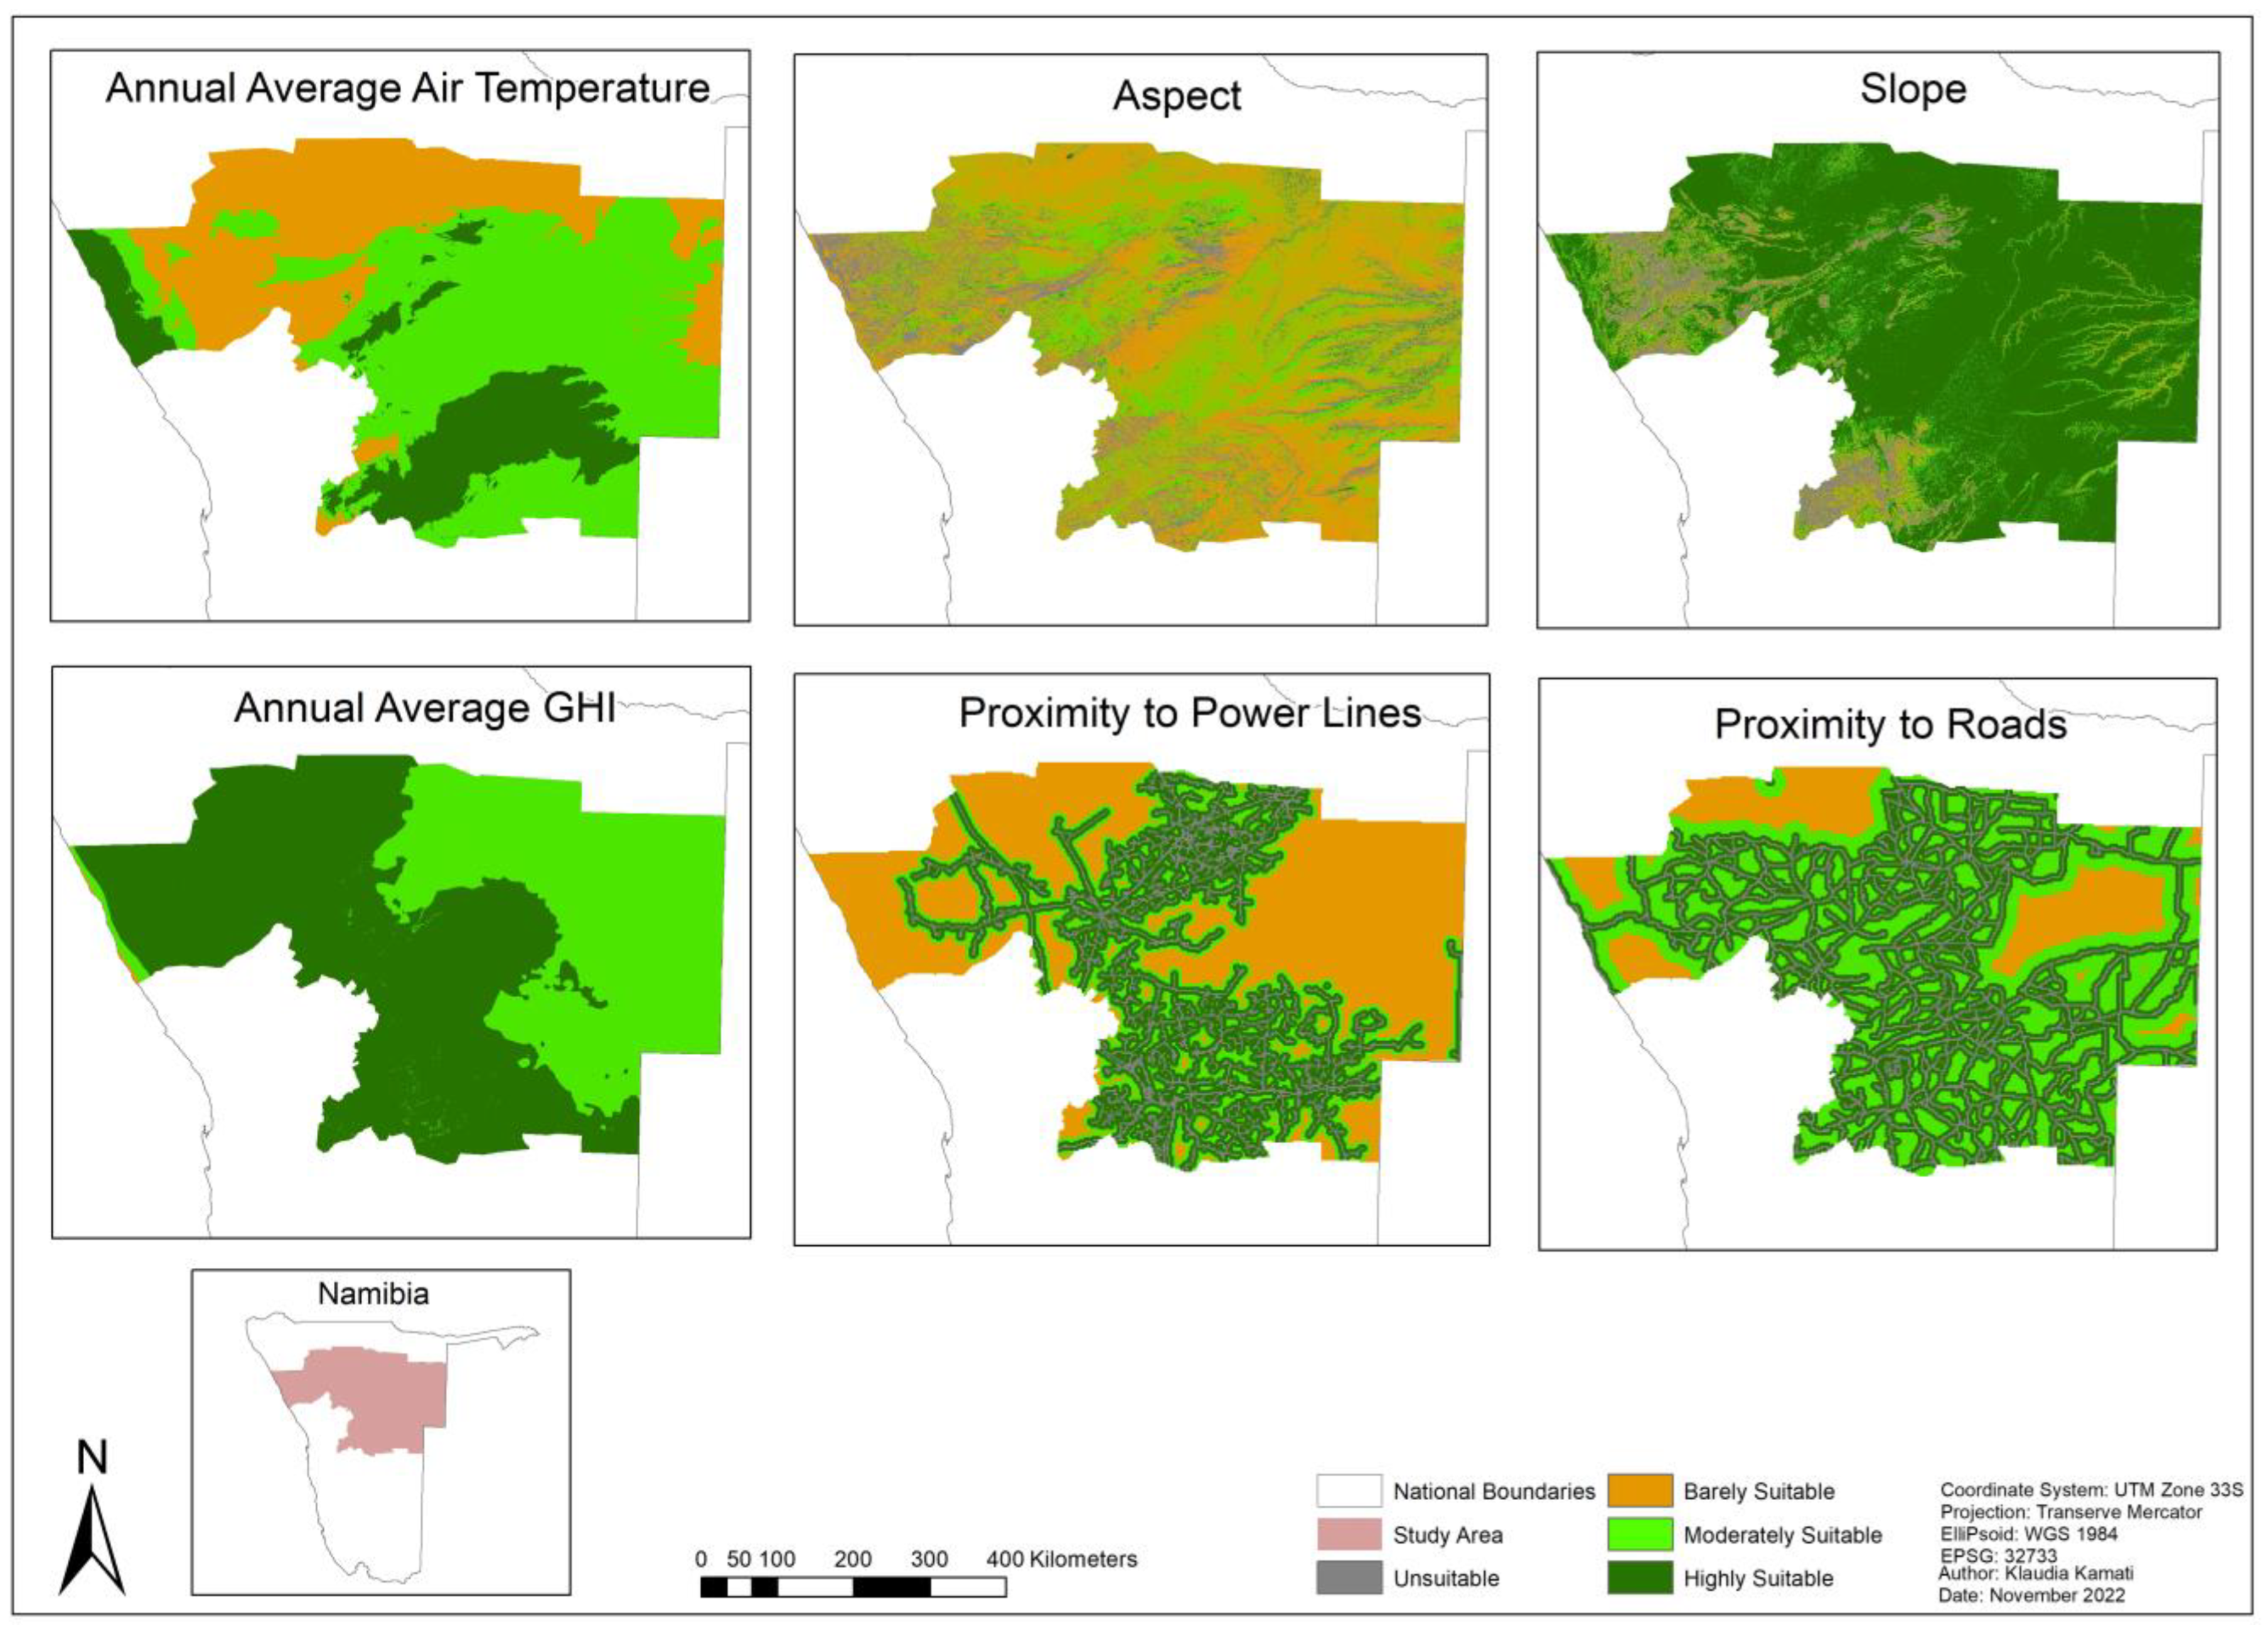
Table 5 presents threshold requirements for factors influencing the suitability of an area for solar energy plant development, with accompanying sources from which the criteria were derived. These are illustrated in Figure 7.
3.2.1. Analytical Hierarchy Process
The pairwise comparison matrix (Table 6) was generated per [40,59] using Table 2. Equations (1) and (2) were used to determine the weights for each criterion for the solar PV power plant. A higher weight indicates that the criterion has a greater influence on the location of the solar PV power plant. With reference to Table 6, average solar irradiation (C1) has a calculated weight of 0.39, and annual average air temperature (C2) has a calculated weight of 0.22; these are considered the most important criteria, because these two criteria determine the output energy capacity of PV power plants. Slope (C3) and aspect (C4) are equally important because they determine how much irradiance the solar panels receive. Lastly, the distance to power lines (C6) and roads (C5) are also equally important, as they influence the construction transmission cost and infrastructure. The calculated consistency using Equation (3) is acceptable (1.4%).
3.2.2. Weighted Overlay Tool
One of the most common approaches to overlay analysis is the weighted overlay method, and it is used to handle multi-criteria problems including suitability analysis and site selection. A weighted overlay approach makes it possible to calculate and perform a multiple-criteria analysis between sets of raster layers. The default evaluation scales range from one to nine, with one being barely suitable and nine being highly suitable [59]. All raster layers must have a total influence of 100 percent.
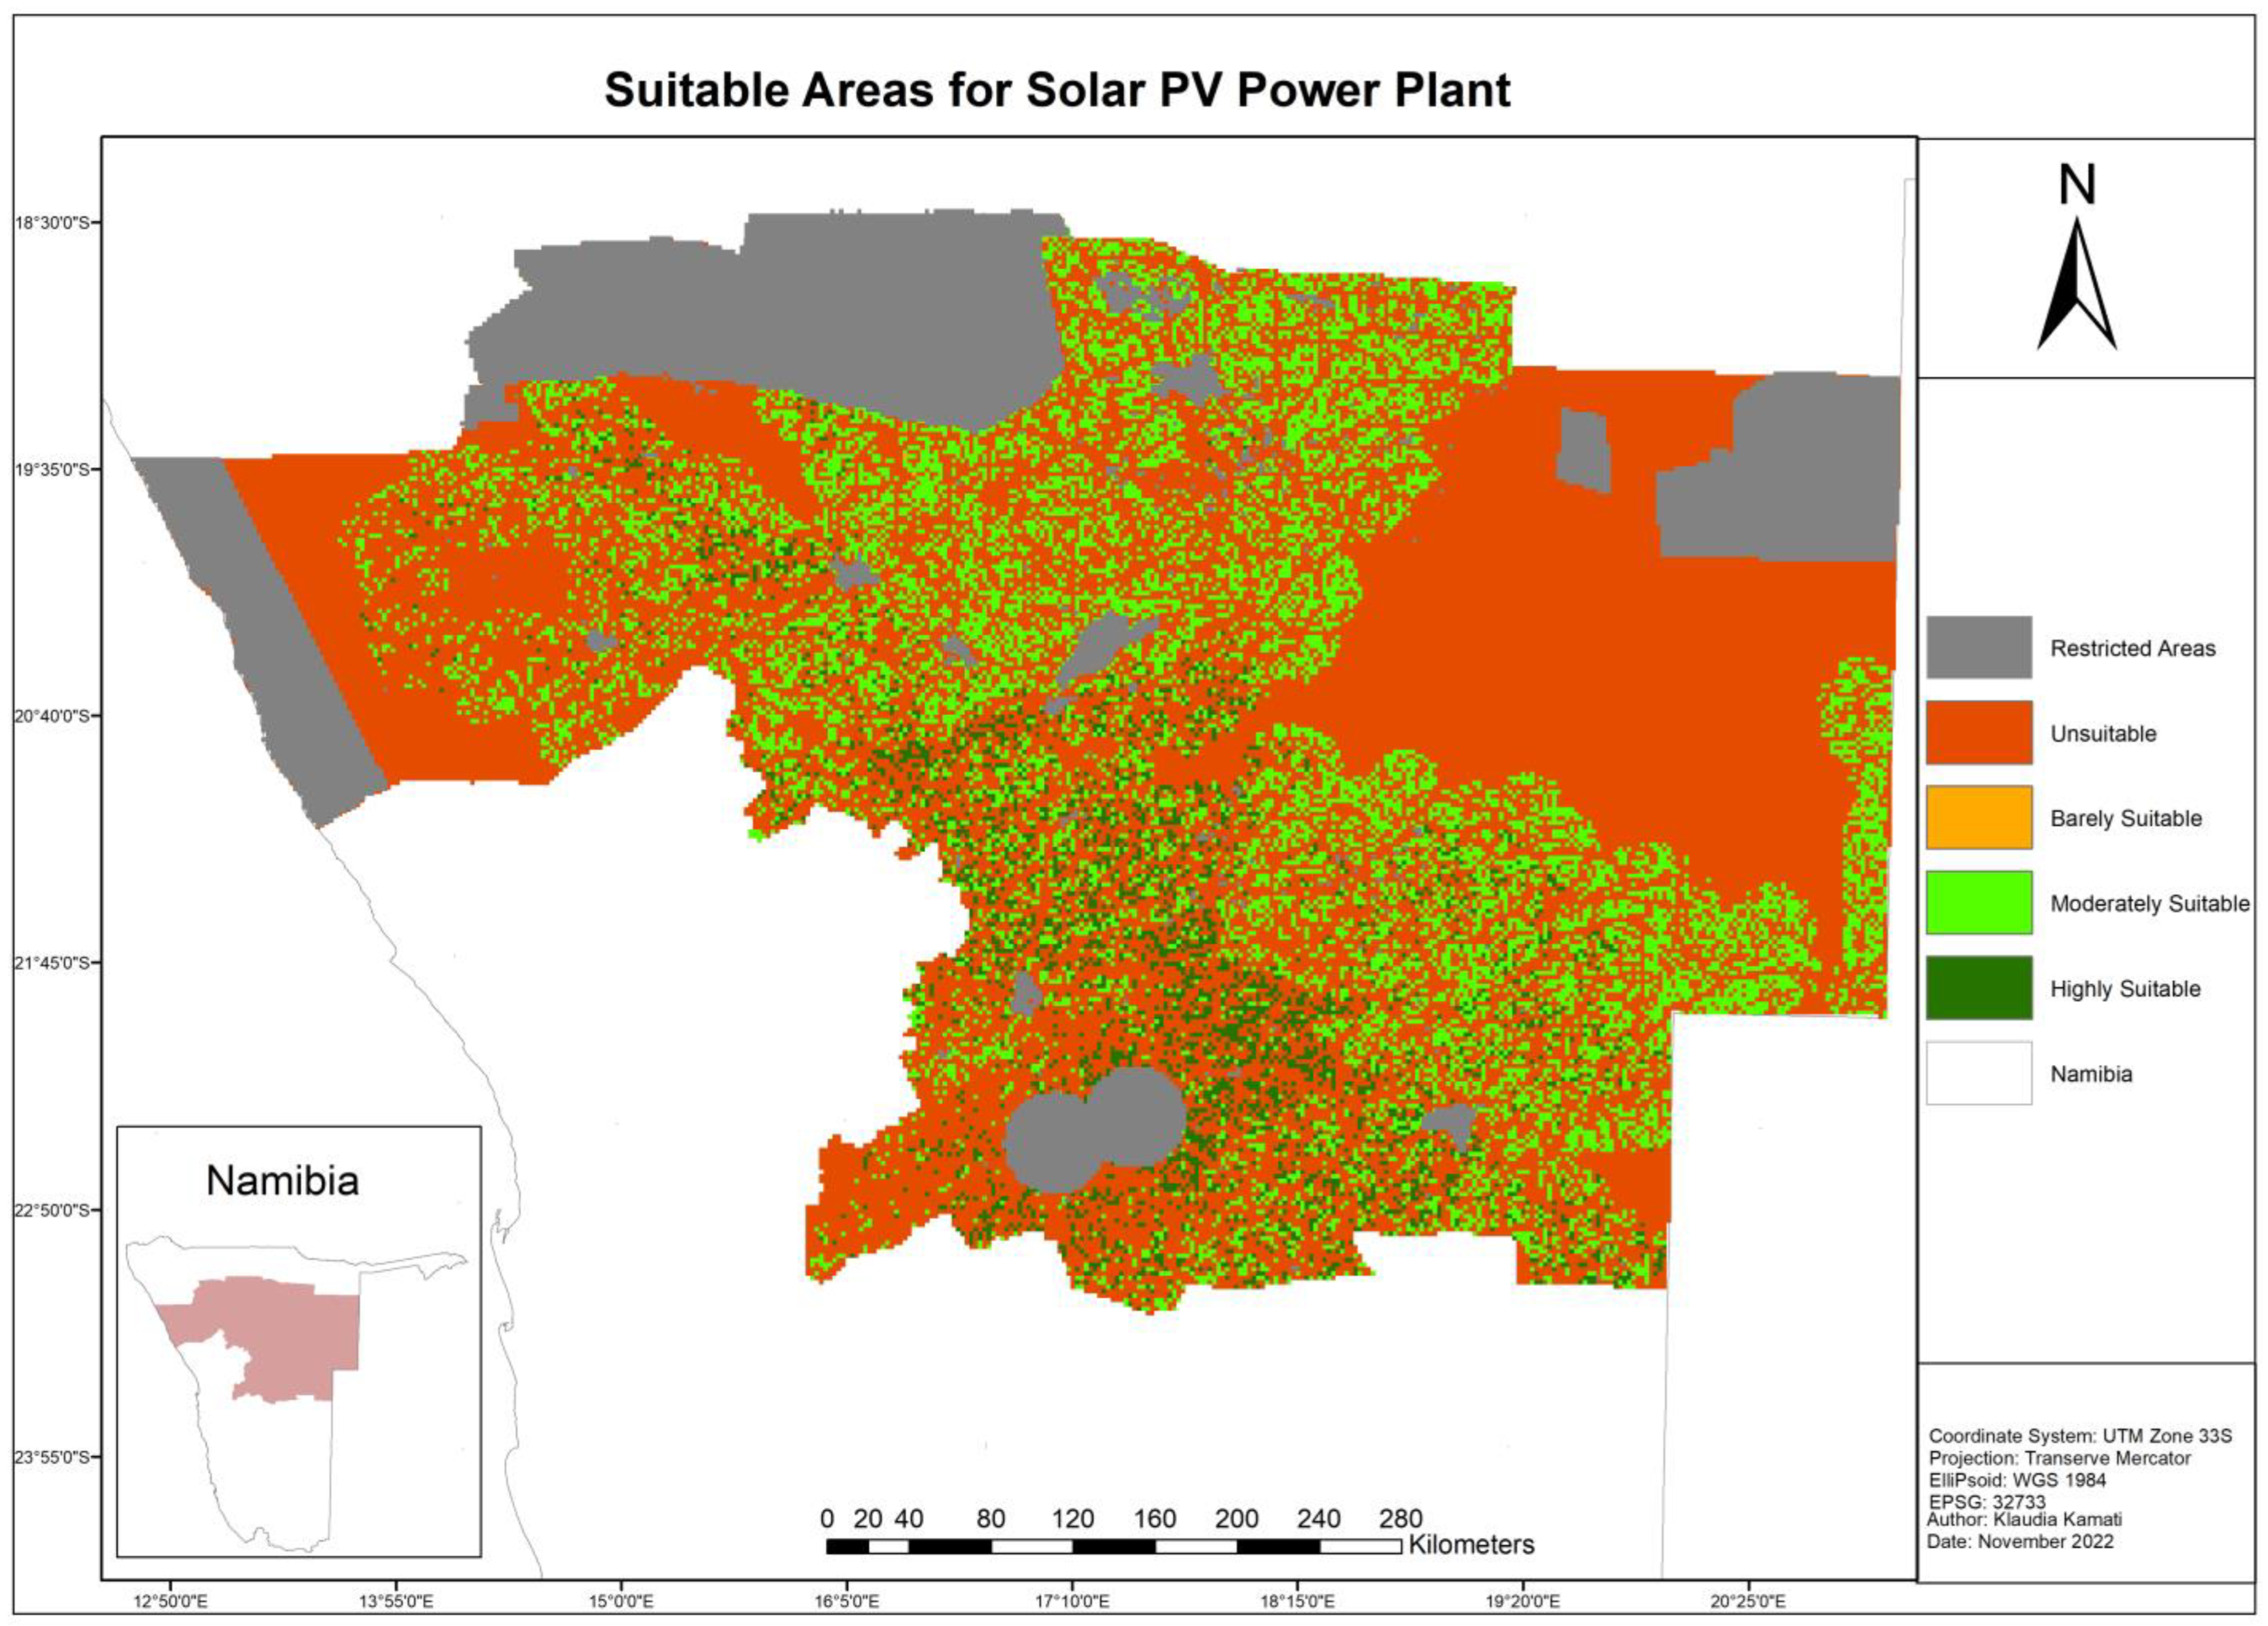
In the case where input rasters have already been reclassified to a common measurement scale using the reclassify tool, it is critical to choose an evaluation scale that corresponds to the reclassified raster layers. To combine raster layers in a single analysis, each cell criterion was reclassified into a common preference scale from 1 to 4, where 4 is the most favourable. Each raster layer input was given a percentage influence or weight derived from AHP by directly comparing the importance of one criterion to another criterion. Figure 8 depicts the resultant spatial distribution of potential sites for solar energy plant installation within the Central North region of Namibia.
3.3. Wind Power Plant Suitable Areas
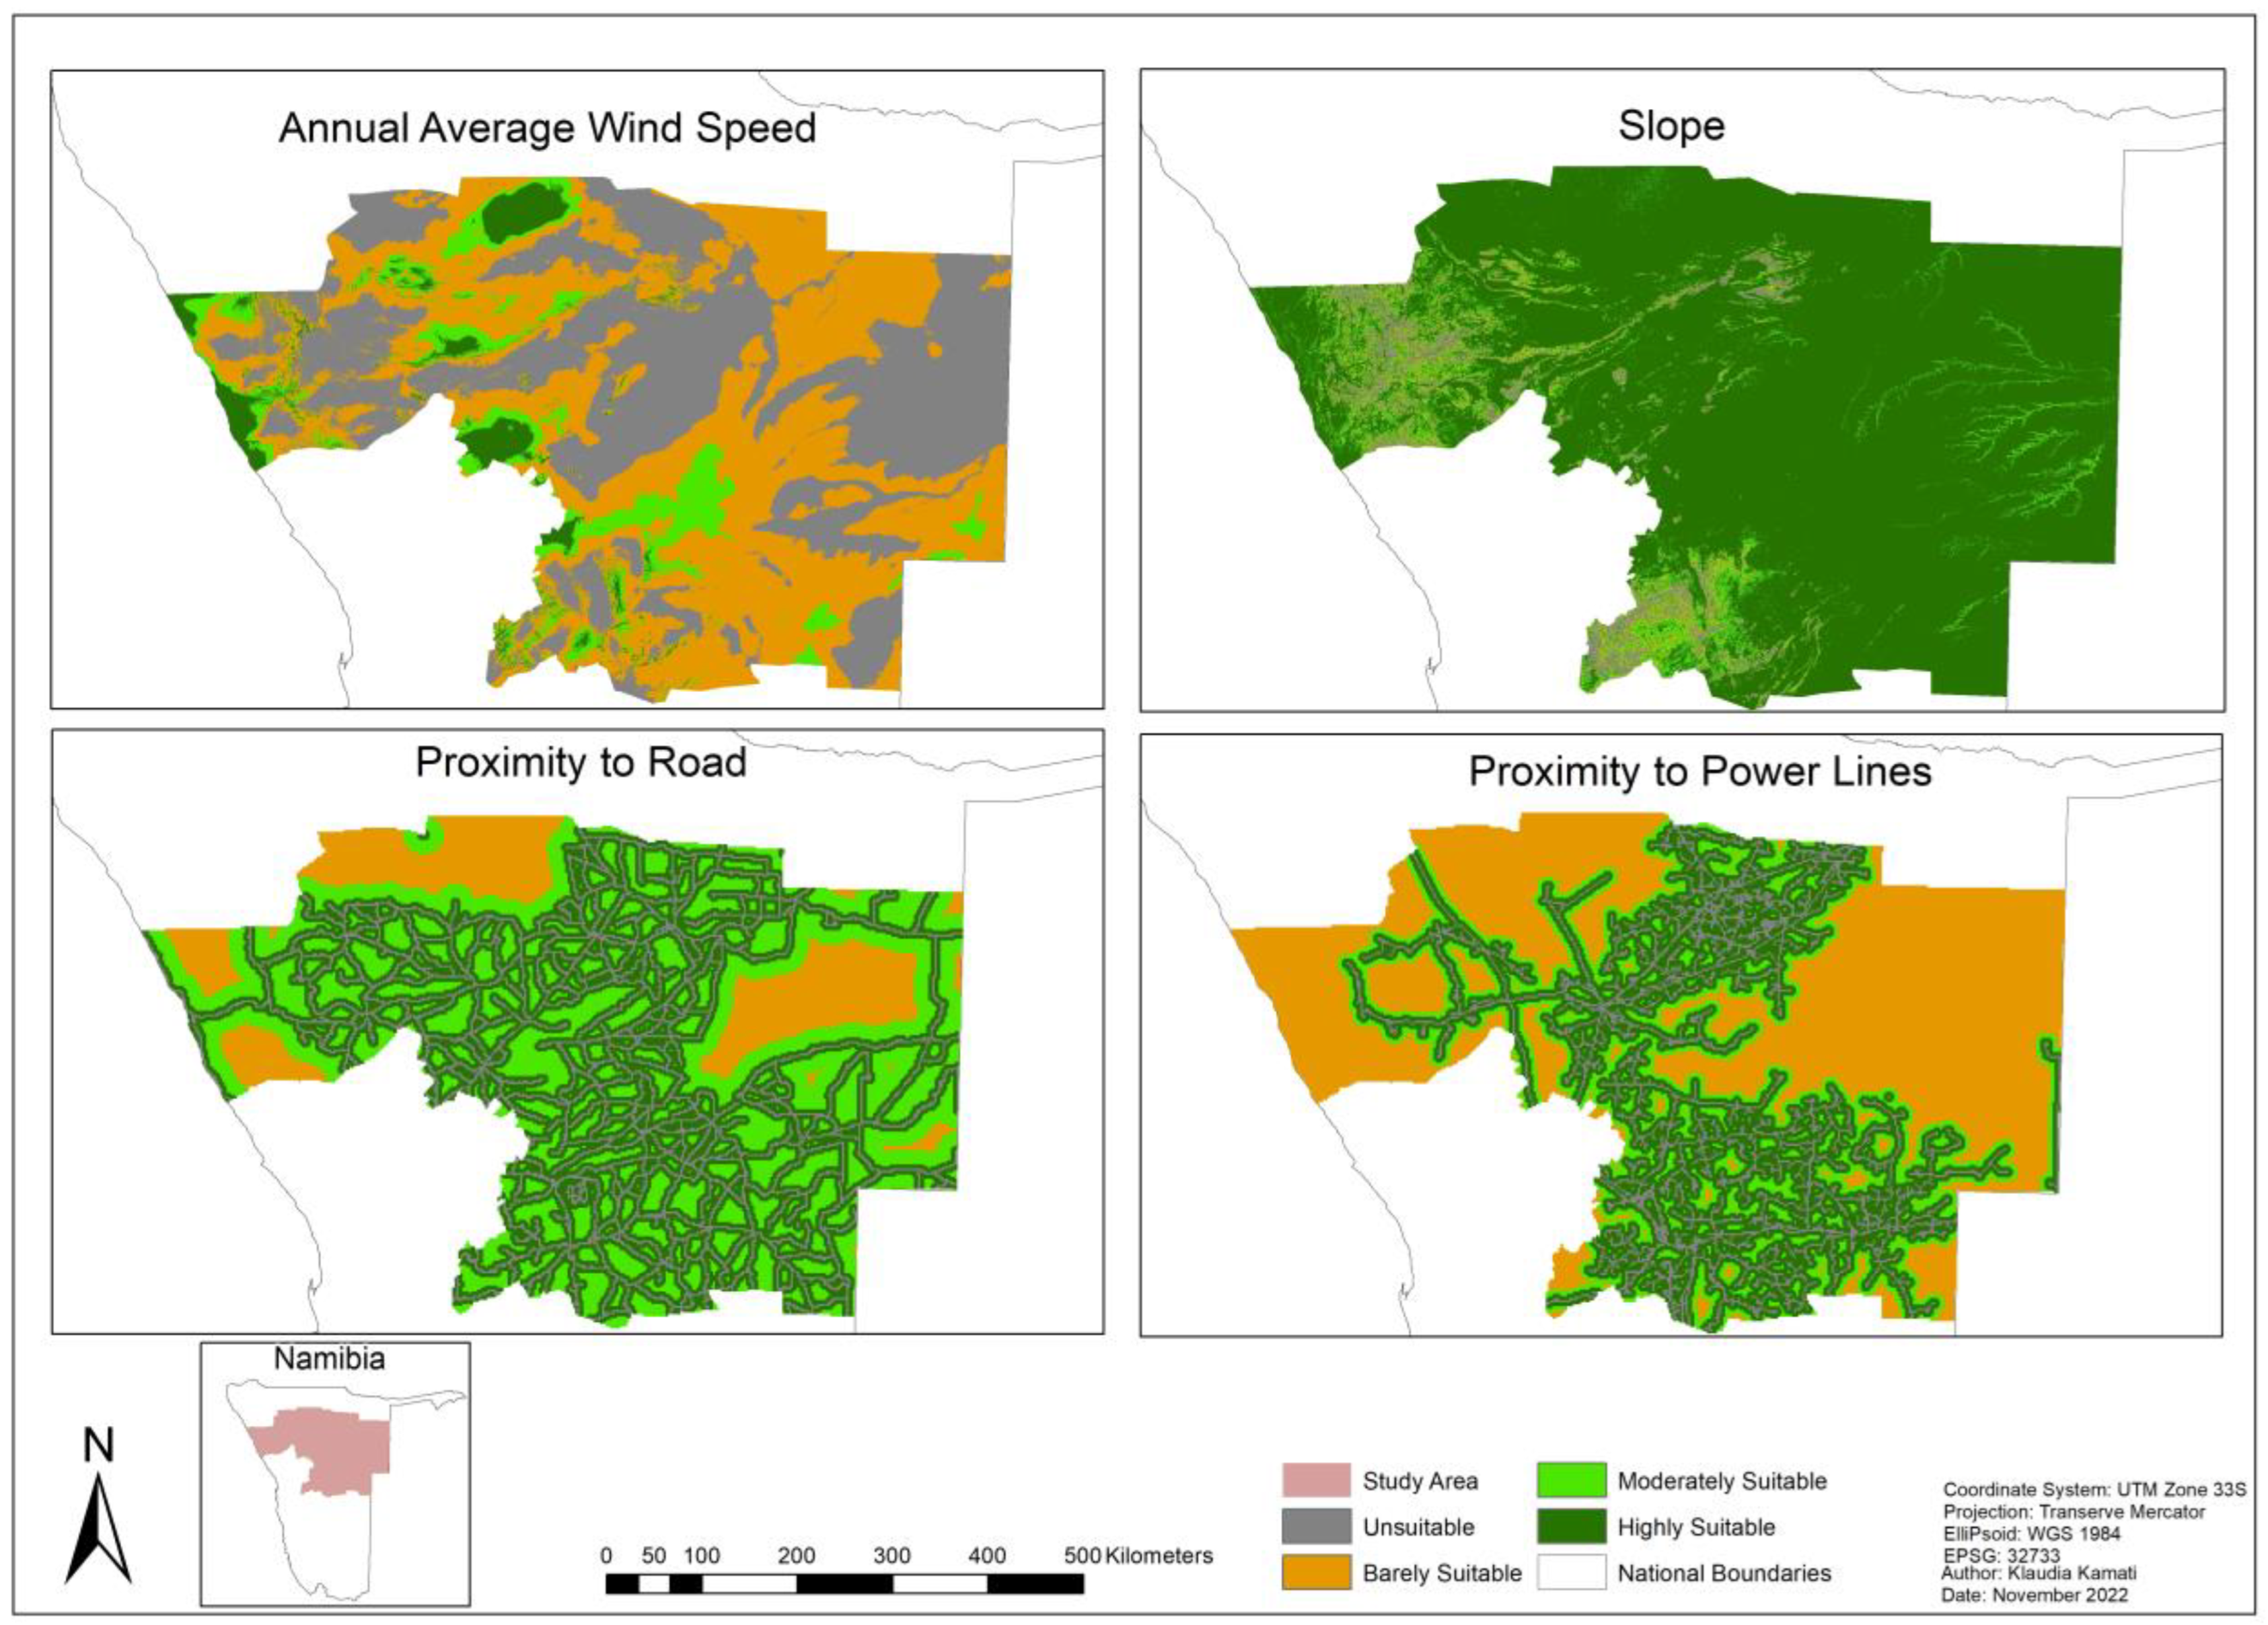
Site selection for wind energy plants also involves examination of a comprehensive set of factors. Several criteria, including slope, wind speed, road, and power lines, were identified in the literature to be considered in the development of wind energy site selection. Table 7 shows how identified criteria were classified into two key groups: technical (topographic and climatic) and economic. These criteria are illustrated in Figure 9.
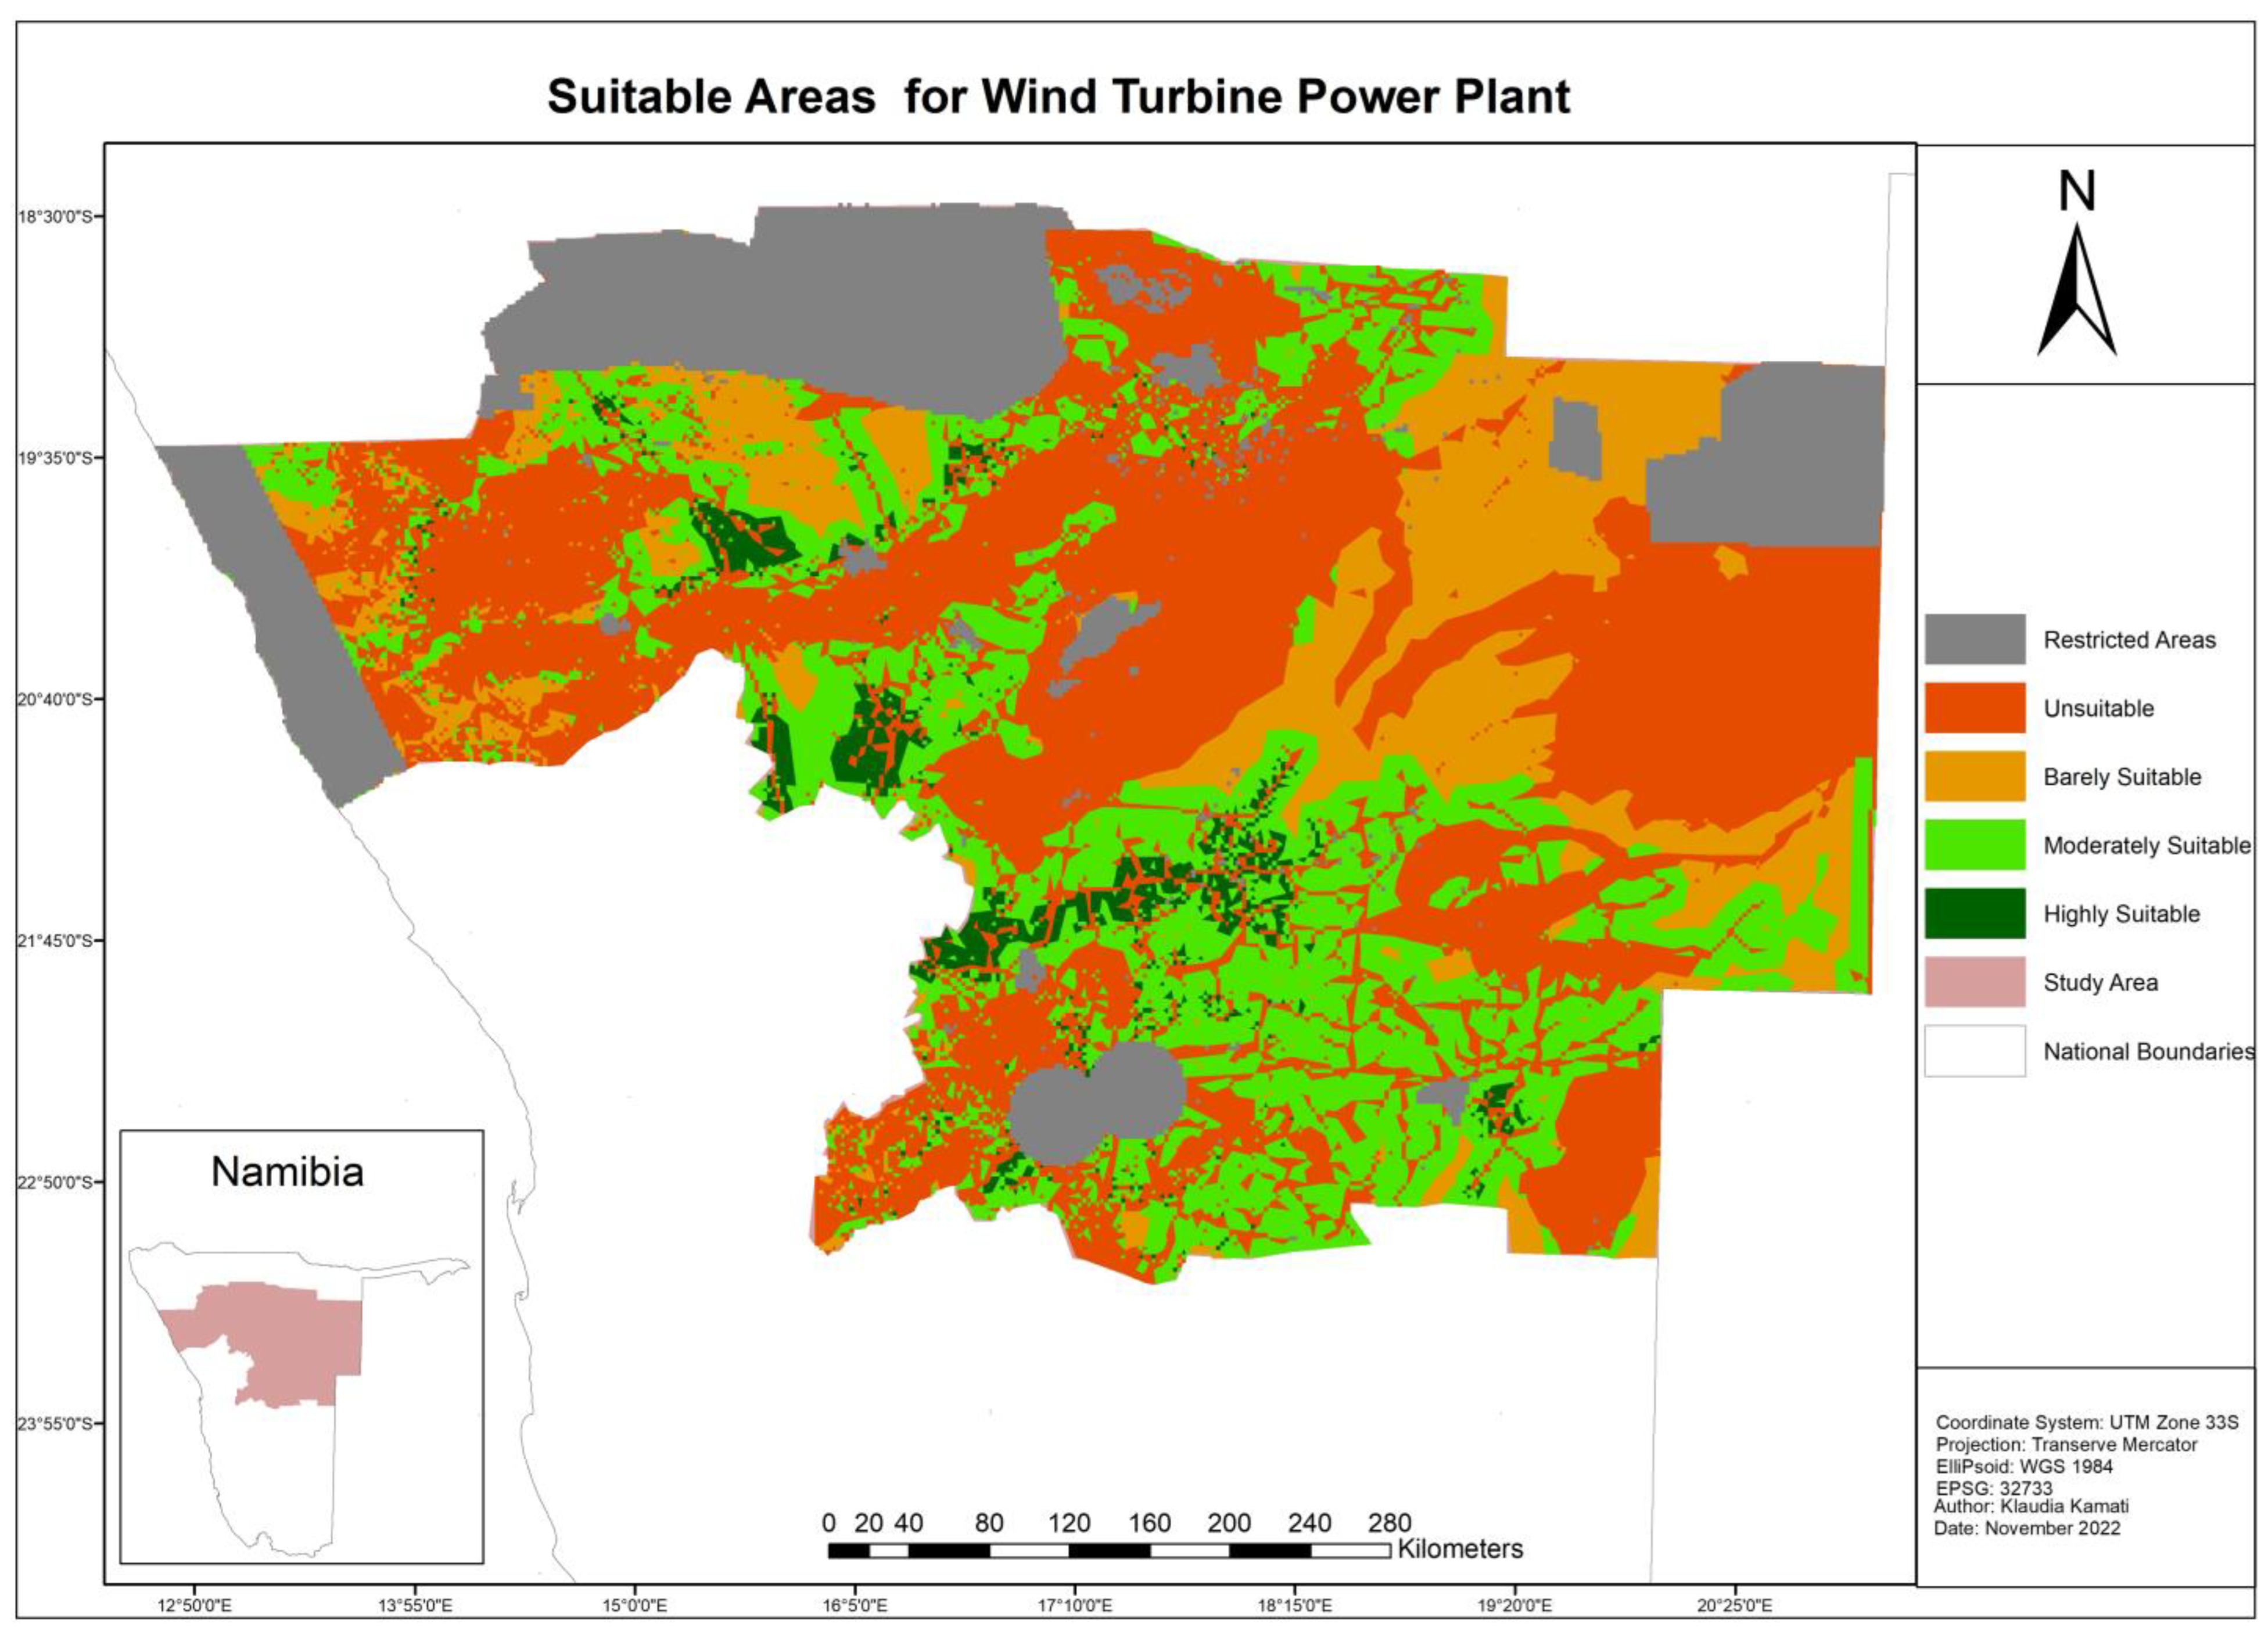
The same methods as described previously were utilised to determine the criteria weights. The CR was also calculated to assess the level of consistency in the pairwise comparison matrix shown in Table 8. Based on the output results of the AHP, wind speed (C1) is the most important evaluation criterion in wind turbine site selection and thus has the greatest influence on suitability evaluation. The final suitable areas were defined, as shown in Figure 10, by overlaying the output of the restrictive and classification methods.
3.4. Validation of Results
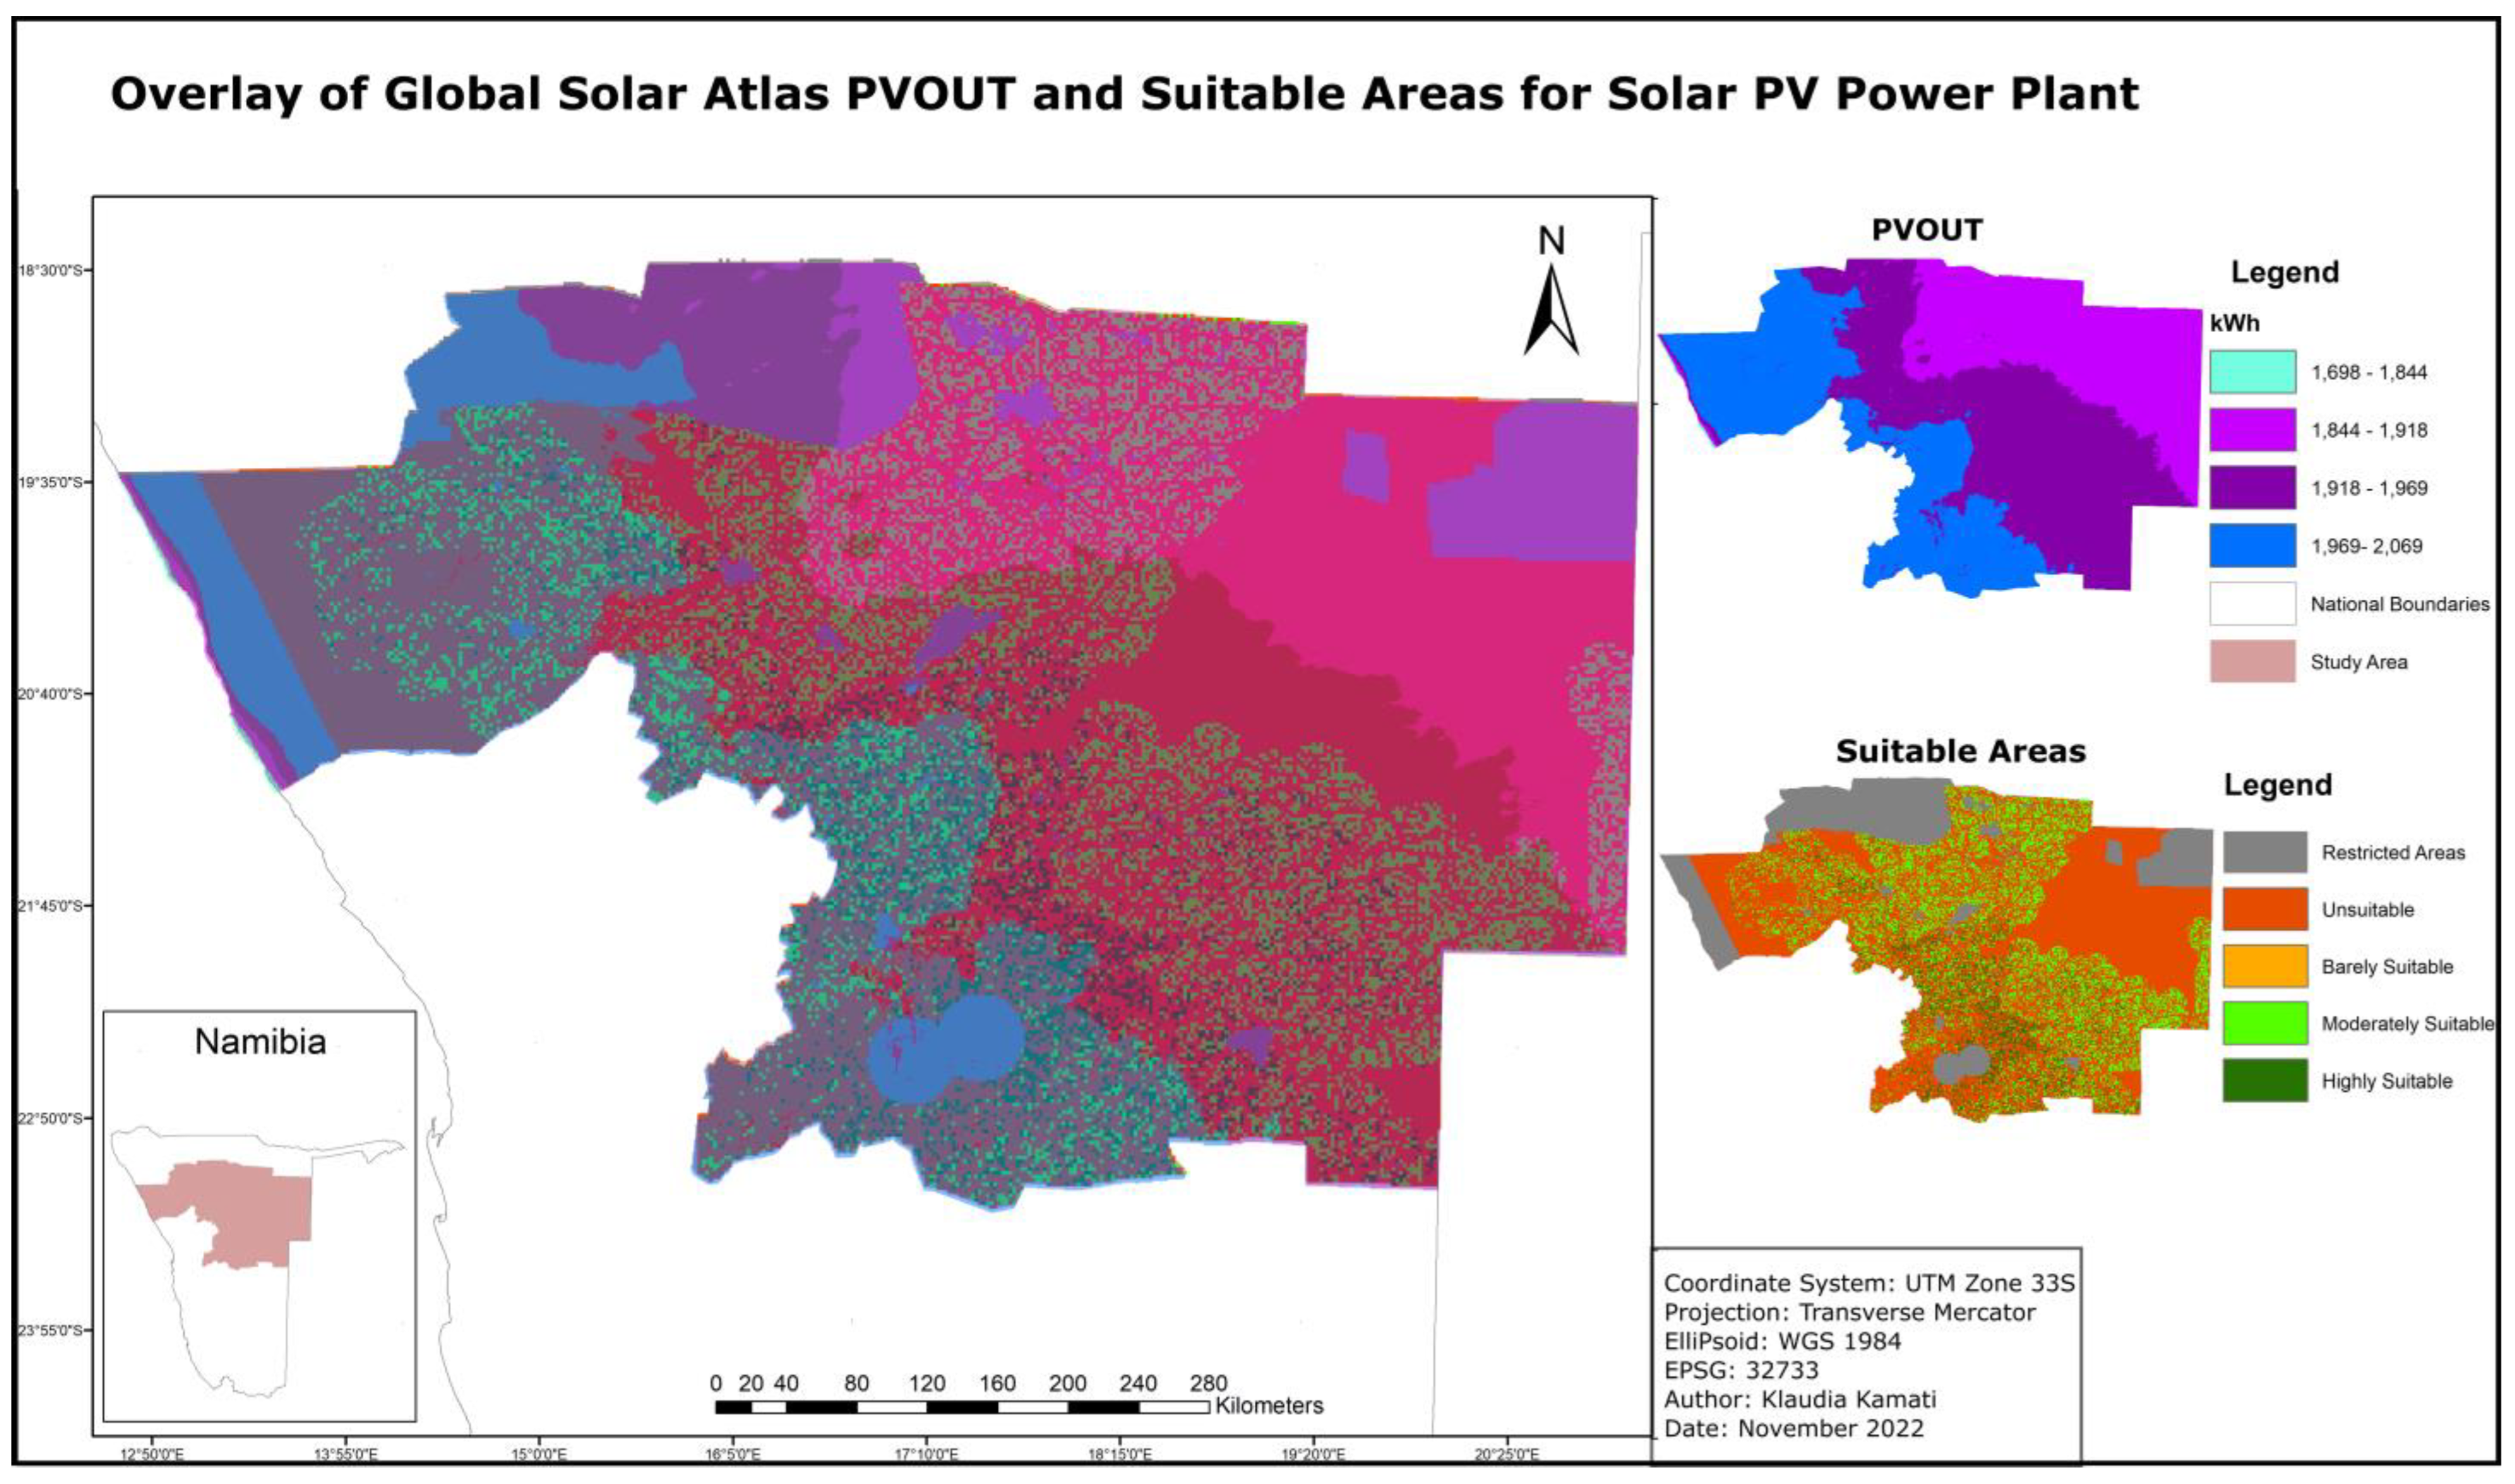
The results of the solar analysis are compared with previous research in establishing suitable and cost-effective locations for solar PV energy plants, namely the World Bank study on global PV power potential by country (see https://globalsolaratlas.info accessed on 22 December 2022). This provides a comprehensive and harmonised analysis of solar resources and the potential for installing PV power plants at a utility-scale. The outcome of the World Bank study is presented in Figure 11, clipped to the Central North Namibia study area to validate the findings attained in this project. Table 9 shows the percentage overlap of highly suitable to unsuitable regions of the two studies.
Although the World Bank study used a different method (SolarGIS algorithm) involving only two criteria (solar irradiation and air temperature), there is some similarity between their results and ours. The comparison of the two studies shows that there is an overlap of 56% between the highly suitable areas of the two studies. The present study is more detailed in its analysis as it considered and integrated several factors that can hinder the installations of solar PV power plants, while the World Bank study only considered two factors. This reveals the value of focused studies, taking multiple criteria into consideration over global studies.
Unfortunately, the maps or data showing the locations of actual solar PV power plants within the study area are not publicly available. Therefore, it is not possible to ensure the existing solar PV power plants in the study region are located at the most suitable areas.
As far as we know, no prior studies have been conducted on wind energy development within the study area. Hence, there is no study that could be used as a comparison to the current study to verify or validate the generated results pertaining to wind.
4. Discussion and Conclusions
The three objectives for this study were (1) to decide on the factors influencing the selection of solar PV and wind energy production sites, (2) to identify constraints on site selection, and (3) taking these factors and constraints into account, to identify suitable sites. Thirteen factors were considered in Section 2.2 and summarised in Table 5 and Table 7. Constraints were identified in Section 3.1 and summarised in Table 4. Suitable sites are identified in Figure 8 and Figure 10. All three objectives, and hence the overall aim, have been met. The study’s novelty lies in the identification of relevant criteria for renewable energy site selection, as well as in the identification and use of secondary, open-source data for this. Both the criteria and datasets can be used to repeat the study in other regions of Namibia.
As shown in Figure 8, highly suitable areas for solar PV power plants are mostly found in the southwest and southern regions, with a few scattered spots in the north-west of the study area. The areas of moderate suitability are located in the north and southeast parts of the study area, whereas unsuitable areas can be found scattered across the study area. Lastly, the restricted areas predominate the northwest and west regions of the study area, with some scattered in the middle section.
Most of the areas in the southern region and northeast region of Central North Namibia have been determined to be inconvenient for wind turbine installation. Lack of strong wind speed and the presence of steep terrain in the northeast and east regions make these regions unfavourable for wind turbine installation. The northwest region is a good potential area for the construction of wind energy plants. This is because of their abundant wind resources, flat terrain, and short distance from power lines.
These findings provide useful information that can be used as a guide by electrical companies, investors, and other stakeholders in the development of solar and wind energy plants, the conservation of energy for future demand, and the promotion of regional sustainable initiatives. The identification of suitable sites for RES production plants is the first step towards addressing SDG targets, 7.1 (by increasing the proportion of the population with access to clean electricity), 7.2 (by increasing the global share of renewable energy), 7.b (by increasing the number of installed RES production plants in developing countries like Namibia), and 13.2 (by reducing greenhouse gas emissions from coal-fired power stations).
The results presented here are derived from secondary, freely available data and should be validated by field measurements of solar irradiance and wind speed, as well as observation of any ecological variables that may exist in any specific place, such as migratory bird paths. In addition to the lack of bird migration datasets, additional investigation will be well worth conducting before making final decisions on wind turbine power plant site selection. The next step would be for all sites to complete an assessment, including environmental impact, to determine their viability.
In conclusion, this study is a first step towards the identification of sites suitable for solar PV and wind energy plants. The study suggests that there is great potential for energy production using solar and wind energy within the study area. In total, 67,070 km2 of land is deemed suitable for solar power plants and 143,821 km2 for wind turbines. These results may be used to increase the amount of renewable energy generated in Central North Namibia, allowing it to meet renewable energy targets while also reducing the carbon footprint, to establish a more sustainable energy future and achieve the 2030 sustainable development goals, especially goal 7 (affordable and clean energy) and goal 13 (climate action). While this study has focused on a particular region in Namibia, using appropriate data the methodology can be applied to the rest of the country to expand the identification of suitable sites.
Author Contributions
Conceptualization, K.K. and J.S.; methodology, K.K.; Validation, K.K.; formal analysis, K.K.; investigation, K.K.; resources, K.K. and J.S.; data curation, K.K.; writing—original draft preparation, S.H.; writing—review and editing, S.H.; visualization, K.K.; supervision, J.S. and S.H.; project administration, K.K., J.S. and S.H.; funding acquisition, K.K. All authors have read and agreed to the published version of the manuscript.
Funding
This research was funded by Central North Regional Electricity Distributor (CENORED).
Institutional Review Board Statement
Not applicable.
Conflicts of Interest
The authors declare no conflict of interest. The funders had no role in the design of the study; in the collection, analyses, or interpretation of data; in the writing of the manuscript; or in the decision to publish the results.
References
- Colak, H.E.; Memisoglu, T.; Gercek, Y. Optimal site selection for solar photovoltaic (PV) power plants using GIS and AHP: A case study of Malatya Province, Turkey. Renew. Energy 2019, 149, 565–576. [Google Scholar] [CrossRef]
- Morrissey, J. The Energy Challenge in Sub-Saharan Africa: A Guide for Advocates and Policy Makers: Part 2: Addressing Energy Poverty; Oxfam: Boston, MA, USA, 2017. [Google Scholar]
- Moradi, S.; Yousefi, H.; Noorollahi, Y.; Rosso, D. Multi-criteria decision support system for wind farm site selection and sensitivity analysis: Case study of Alborz Province, Iran. Energy Strat. Rev. 2020, 29, 100478. [Google Scholar] [CrossRef]
- Noorollahi, Y.; Senani, A.G.; Fadaei, A.; Simaee, M.; Moltames, R. A framework for GIS-based site selection and technical potential evaluation of PV solar farm using Fuzzy-Boolean logic and AHP multi-criteria decision-making approach. Renew. Energy 2022, 186, 89–104. [Google Scholar] [CrossRef]
- Saraswat, S.; Digalwar, A.K.; Yadav, S.; Kumar, G. MCDM and GIS based modelling technique for assessment of solar and wind farm locations in India. Renew. Energy 2021, 169, 865–884. [Google Scholar] [CrossRef]
- Kusch-Brandt, S. Urban Renewable Energy on the Upswing: A Spotlight on Renewable Energy in Cities in REN21′s “Renewables 2019 Global Status Report. Resources 2019, 8, 139. [Google Scholar] [CrossRef] [Green Version]
- The Ministry of Mines and Energy. National Renewable Energy Policy, no. January; Government of the Republic of Namibia: Windhoek, Namibia, 2017.
- The Ministry of Mines and Energy. National Energy Policy, no. July; Government of the Republic of Namibia: Windhoek, Namibia, 2017.
- NamPower. NamPower 2019 Annual Report; Namibia Power Corporation: Windhoek, Namibia, 2019. [Google Scholar]
- von Oertzen, D. Issues, Challenges and Opportunities to Develop Green Hydrogen in Namibia, no. October; Konrad-Adenauer-Stiftung: Windhoek, Namibia, 2021. [Google Scholar]
- Sun, L.; Jiang, Y.; Guo, Q.; Ji, L.; Xie, Y.; Qiao, Q.; Huang, G.; Xiao, K. A GIS-based multi-criteria decision making method for the potential assessment and suitable sites selection of PV and CSP plants. Resour. Conserv. Recycl. 2020, 168, 105306. [Google Scholar] [CrossRef]
- Heo, J.; Moon, H.; Chang, S.; Han, S.; Lee, D.-E. Case Study of Solar Photovoltaic Power-Plant Site Selection for Infrastructure Planning Using a BIM-GIS-Based Approach. Appl. Sci. 2021, 11, 8785. [Google Scholar] [CrossRef]
- Doorga, J.R.S.; Rughooputh, S.D.; Boojhawon, R. High resolution spatio-temporal modelling of solar photovoltaic potential for tropical islands: Case of Mauritius. Energy 2018, 169, 972–987. [Google Scholar] [CrossRef]
- Koc, A.; Turk, S.; Şahin, G. Multi-criteria of wind-solar site selection problem using a GIS-AHP-based approach with an application in Igdir Province/Turkey. Environ. Sci. Pollut. Res. 2019, 26, 32298–32310. [Google Scholar] [CrossRef]
- Sadeghi, M.; Karimi, M. Gis-based solar and wind turbine site selection using multi-criteria analysis: Case study Tehran, Iran. ISPRS—Int. Arch. Photogramm. Remote Sens. Spat. Inf. Sci. 2017, 42, 469–476. [Google Scholar] [CrossRef]
- Xu, Y.; Li, Y.; Zheng, L.; Cui, L.; Li, S.; Li, W.; Cai, Y. Site selection of wind farms using GIS and multi-criteria decision making method in Wafangdian, China. Energy 2020, 207, 118222. [Google Scholar] [CrossRef]
- Al Garni, H.Z.; Awasthi, A. Solar PV power plant site selection using a GIS-AHP based approach with application in Saudi Arabia. Appl. Energy 2017, 206, 1225–1240. [Google Scholar] [CrossRef]
- Ligus, M.; Peternek, P. Determination of most suitable low-emission energy technologies development in Poland using integrated fuzzy AHP-TOPSIS method. Energy Procedia 2018, 153, 101–106. [Google Scholar] [CrossRef]
- Sun, X.; Zhang, B.; Tang, X.; McLellan, B.C.; Höök, M. Sustainable Energy Transitions in China: Renewable Options and Impacts on the Electricity System. Energies 2016, 9, 980. [Google Scholar] [CrossRef] [Green Version]
- Aly, A.; Jensen, S.S.; Pedersen, A.B. Solar power potential of Tanzania: Identifying CSP and PV hot spots through a GIS multicriteria decision making analysis. Renew. Energy 2017, 113, 159–175. [Google Scholar] [CrossRef]
- World Bank Group. Namibia—Climatology|Climate Change Knowledge Portal. 2021. Available online: https://climateknowledgeportal.worldbank.org/country/namibia/climate-data-historical (accessed on 15 December 2022).
- Gorsevski, P.V.; Cathcart, S.C.; Mirzaei, G.; Jamali, M.M.; Ye, X.; Gomezdelcampo, E. A group-based spatial decision support system for wind farm site selection in Northwest Ohio. Energy Policy 2013, 55, 374–385. [Google Scholar] [CrossRef]
- Lackner, M.A.; Rogers, A.L.; Manwell, J.F.; McGowan, J.G. A new method for improved hub height mean wind speed estimates using short-term hub height data. Renew. Energy 2010, 35, 2340–2347. [Google Scholar] [CrossRef]
- Latinopoulos, D.; Kechagia, K. A GIS-based multi-criteria evaluation for wind farm site selection. A regional scale application in Greece. Renew. Energy 2015, 78, 550–560. [Google Scholar] [CrossRef]
- Republic of Namibia, Environmental Management Act 7 of 2007. Available online: http://www.ilo.org/dyn/natlex/docs/ELECTRONIC/82560/90507/F17802156/NAM82560.pdf (accessed on 22 December 2022).
- Uyan, M. GIS-based solar farms site selection using analytic hierarchy process (AHP) in Karapinar region, Konya/Turkey. Renew. Sustain. Energy Rev. 2013, 28, 11–17. [Google Scholar] [CrossRef]
- Government of Namibia. Namibia Agriculture Policy; Ministry of Agriculture, Water and Forestry: Windhoek, Namibia, 2015.
- Gašparović, I.; Gašparović, M. Determining Optimal Solar Power Plant Locations Based on Remote Sensing and GIS Methods: A Case Study from Croatia. Remote Sens. 2019, 11, 1481. [Google Scholar] [CrossRef]
- Shorabeh, S.N.; Firozjaei, M.K.; Nematollahi, O.; Firozjaei, H.K.; Jelokhani-Niaraki, M. A risk-based multi-criteria spatial decision analysis for solar power plant site selection in different climates: A case study in Iran. Renew. Energy 2019, 143, 958–973. [Google Scholar] [CrossRef]
- Republic of Namibia, Electricity Act 4 of 2007. Available online: https://www.lac.org.na/laws/annoSTAT/Electricity%20Act%204%20of%202007.pdf (accessed on 22 December 2022).
- Höfer, T.; Sunak, Y.; Siddique, H.; Madlener, R. Wind farm siting using a spatial Analytic Hierarchy Process approach: A case study of the Städteregion Aachen. Appl. Energy 2016, 163, 222–243. [Google Scholar] [CrossRef]
- Noorollahi, Y.; Yousefi, H.; Mohammadi, M. Multi-criteria decision support system for wind farm site selection using GIS. Sustain. Energy Technol. Assess. 2016, 13, 38–50. [Google Scholar] [CrossRef]
- CNdV Africa Planning and Design. Strategic Initiative to Introduce Commercial Land Based Wind Energy Development to the Western Cape; CNdV Africa Planning and Design: Cape Town, South Africa, 2006. [Google Scholar]
- Kocabaldir, C.; Yücel, M.A. GIS-Based Multi-Criteria Decision Analysis of Site Selection for Photovoltaic Power Plants in Çanakkale Province. Int. J. Environ. Geoinform. 2020, 7, 347–355. [Google Scholar] [CrossRef]
- Young, A. The Dangerous Relationship between Wind Turbines and Aviation to 70. 2018. Available online: https://to70.com/dangerous-relationship-wind-turbines-aviation/ (accessed on 2 November 2022).
- Ali, S.; Taweekun, J.; Techato, K.; Waewsak, J.; Gyawali, S. GIS based site suitability assessment for wind and solar farms in Songkhla, Thailand. Renew. Energy 2018, 132, 1360–1372. [Google Scholar] [CrossRef]
- Tercan, E.; Tapkın, S.; Latinopoulos, D.; Dereli, M.A.; Tsiropoulos, A.; Ak, M.F. A GIS-based multi-criteria model for offshore wind energy power plants site selection in both sides of the Aegean Sea. Environ. Monit. Assess. 2020, 192, 652. [Google Scholar] [CrossRef] [PubMed]
- Erickson, W.P.; Wolfe, M.M.; Bay, K.J.; Johnson, U.H.; Gehring, J.L. A Comprehensive Analysis of Small-Passerine Fatalities from Collision with Turbines at Wind Energy Facilities. PLoS ONE 2014, 9, e107491. [Google Scholar] [CrossRef]
- Kazilbash, S. The Realities of Birds and Bat Deaths by Wind Turbines, Reve. 2020. Available online: https://www.evwind.es/2020/10/01/the-realities-of-bird-and-bat-deaths-by-wind-turbines/77477 (accessed on 2 November 2022).
- Li, M.; Xu, Y.; Guo, J.; Li, Y.; Li, W. Application of a GIS-Based Fuzzy Multi-Criteria Evaluation Approach for Wind Farm Site Selection in China. Energies 2020, 13, 2426. [Google Scholar] [CrossRef]
- Díaz, H.; Soares, C.G. An integrated GIS approach for site selection of floating offshore wind farms in the Atlantic continental European coastline. Renew. Sustain. Energy Rev. 2020, 134, 110328. [Google Scholar] [CrossRef]
- US EPA; NREL. Best Practices for Siting Solar Photovoltaics on Municipal Solid Waste Landfills; Environmental Protection Agency: Washington, DC, USA, 2022.
- Akkaş, P.; Erten, M.Y.; Cam, E.; Inanc, N. Optimal Site Selection for a Solar Power Plant in the Central Anatolian Region of Turkey. Int. J. Photoenergy 2017, 2017, 7452715. [Google Scholar] [CrossRef]
- Almarshoud, A. Performance of solar resources in Saudi Arabia. Renew. Sustain. Energy Rev. 2016, 66, 694–701. [Google Scholar] [CrossRef]
- Popovici, C.G.; Hudişteanu, S.V.; Mateescu, T.D.; Cherecheş, N.-C. Efficiency Improvement of Photovoltaic Panels by Using Air Cooled Heat Sinks. Energy Procedia 2016, 85, 425–432. [Google Scholar] [CrossRef] [Green Version]
- Adeeb, J.; Farhan, A.; Al-Salaymeh, A. Temperature Effect on Performance of Different Solar Cell Technologies. J. Ecol. Eng. 2019, 20, 249–254. [Google Scholar] [CrossRef]
- Ramanathan, S.; Goel, S.; Alagumalai, S. Comparison of Cloud database: Amazon’s SimpleDB and Google’s Bigtable. In Proceedings of the 2011 International Conference on Recent Trends in Information Systems, Kolkata, India, 21–23 December 2011; pp. 165–168. [Google Scholar] [CrossRef]
- Valda Energy. Myth Busting: Solar Panels Do Not Produce Energy in the Winter. 2020. Available online: https://www.valdaenergy.com/blogs/myth-busting-solar-panels-do-not-produce-energy-in-the-winter (accessed on 23 November 2022).
- Shao, M.; Han, Z.; Sun, J.; Xiao, C.; Zhang, S.; Zhao, Y. A review of multi-criteria decision making applications for renewable energy site selection. Renew. Energy 2020, 157, 377–403. [Google Scholar] [CrossRef]
- Saaty, T. The Analytic Hierarchy Process (AHP) for Decision Making, Kobe, Japan, 1980. Available online: http://www.cashflow88.com/decisiones/saaty1.pdf (accessed on 22 December 2022).
- Saaty, T.L. The Analytic Hierarchy Process; McGraw-Hill: New York, NY, USA, 2008. [Google Scholar]
- Arnette, A.N.; Zobel, C.W. Spatial analysis of renewable energy potential in the greater southern Appalachian mountains. Renew. Energy 2011, 36, 2785–2798. [Google Scholar] [CrossRef]
- Sliz-Szkliniarz, B.; Vogt, J. GIS-based approach for the evaluation of wind energy potential: A case study for the Kujawsko–Pomorskie Voivodeship. Renew. Sustain. Energy Rev. 2011, 15, 1696–1707. [Google Scholar] [CrossRef]
- Villacreses, G.; Gaona, G.; Martínez-Gómez, J.; Jijón, D.J. Wind farms suitability location using geographical information system (GIS), based on multi-criteria decision making (MCDM) methods: The case of continental Ecuador. Renew. Energy 2017, 109, 275–286. [Google Scholar] [CrossRef]
- Anwarzai, M.A.; Nagasaka, K. Utility-scale implementable potential of wind and solar energies for Afghanistan using GIS multi-criteria decision analysis. Renew. Sustain. Energy Rev. 2017, 71, 150–160. [Google Scholar] [CrossRef]
- Ramachandra, T.; Jain, R.; Krishnadas, G. Hotspots of solar potential in India. Renew. Sustain. Energy Rev. 2011, 15, 3178–3186. [Google Scholar] [CrossRef]
- Habib, S.M.; Suliman, A.E.-R.E.; Al Nahry, A.H.; El Rahman, E.N.A. Spatial modeling for the optimum site selection of solar photovoltaics power plant in the northwest coast of Egypt. Remote Sens. Appl. Soc. Environ. 2020, 18, 100313. [Google Scholar] [CrossRef]
- Dawod, G.M.; Mandoer, M.S. Optimum Sites for Solar Energy Harvesting in Egypt Based on Multi-Criteria GIS. In Proceedings of the First Future University International Conference on New Energy and Environmental Engineering, Nasr City, Egypt, 11–14 April 2016; pp. 450–456. [Google Scholar]
- Esri. How Weighted Overlay Works—Help|ArcGIS for Desktop. 2016. Available online: https://desktop.arcgis.com/en/arcmap/10.3/tools/spatial-analyst-toolbox/how-weighted-overlay-works.htm (accessed on 15 December 2022).
Figure 1.
The methodological framework of the solar PV and wind turbine site selection.

Figure 2.
Central North region of Namibia—the study area.

Figure 3.
Suitable aspect directions for PV power plant.

Figure 4.
The steps of the AHP method.

Figure 5.
Restricted areas in the study region.

Figure 6.
Restricted and unrestricted areas in the study region.

Figure 7.
Solar PV plant criteria.

Figure 8.
Final solar PV power plant suitability.

Figure 9.
Wind power plant criteria.

Figure 10.
Wind turbine power plant suitability areas.

Figure 11.
Validation of solar site suitability results.


Table 1.
Data used in this study.
| Description | Data Type | Spatial Resolution | Data Provider |
|---|---|---|---|
| Digital elevation model (DEM) | Raster | 30 m | USGS Earth Explorer |
| Air temperature | Raster | 30 arc-sec | Global Solar Atlas |
| Solar Radiation | Raster | 9.0 arc-sec (nominally 250 m) | Global Solar Atlas |
| Wind Speed | Raster | 250 m | Global Wind Atlas |
| Agricultural | Raster | 10 m | European Space Agency |
| IBA | Vector | - | Birdlife International portal |
| Roads | Vector | - | NSA 1 |
| Forestry | Vector | - | NSA |
| Protected areas | Vector | - | NSA |
| Airport | Vector | - | NSA |
| Power line | Vector | - | CENORED |
| CENORED boundary | Vector | - | CENORED |
1 Namibia Statistic Agency.
Table 2.
Pairwise comparisons on a relative scale.
| Importance Scale of Criteria j to Criteria k | Equivalent Linguistic Judgment |
|---|---|
| 1 | The importance of criteria j and k is equal |
| 3 | The importance of criteria j is slightly higher than that of criteria k |
| 5 | The importance of criteria j is moderately more than of criteria k |
| 7 | The importance of criteria j is stronger than of criteria k |
| 9 | The importance of criteria j is extremely more than of criteria k |
| 2, 4, 6, 8 | Intermediate values |
Table 3.
Random consistency index values (RI) adapted from [51].
Table 3.
Random consistency index values (RI) adapted from [51].
| N | 1 | 2 | 3 | 4 | 5 | 6 | 7 | 8 |
| 0 | 0 | 0.58 | 0.90 | 1.12 | 1.24 | 1.32 | 1.41 |
Table 4.
Constraints involved in installing solar PV and wind power plants.
| Criteria | Delimitation (Buffer Zone) | Suitability | References |
|---|---|---|---|
| Distance from Water bodies (m) | ≤500 >500 | Not Suitable Suitable | [15,52] |
| Distance from Protected Areas (m) | ≤500 >500 | Not Suitable Suitable | [15,26] |
| Distance from Urban Areas (m) | ≤500 >500 | Not Suitable Suitable | [33] |
| Distance from Forestry Areas (m) | ≤100 >100 | Not Suitable Suitable | [53] |
| Distance from IBA | ≤1000 >1000 | Not Suitable Suitable | [54] |
| Distance from Airfield with Rader | ≤25,000 >25,000 | Not Suitable Suitable | [33] |
| Distance from Local Airfield | ≤2500 >2500 | Not Suitable Suitable | [33] |
| Distance from Agricultural Land | ≤100 >100 | Not Suitable Suitable | [28] |
Table 5.
Factors involved in installing solar PV systems.
| Factors | Criteria | Classes | Suitability | References |
|---|---|---|---|---|
| Topographical | C3 = Slope (°) | 0–1.73 1.73–2.8 2.8–5.7 >5.7 | Highly suitable Moderately Suitable Low Suitability Unsuitable | [34] |
| C4 = Aspect (°) | 0–22.5 and 337.5–360 22.5–67.5 and 292.5–337.5 67.5–90 and 270–292.5 90–270 | Highly Suitable Moderately Suitable Low Suitability Unsuitable | [13] | |
| Climatic | C1 = Solar Irradiation (kWh/m2/d) | 1953.36–2153.5 2153.5–2263 2263–2465.44 | Low Suitability Moderately Suitable Highly Suitable | [36,55] |
| C2 = Air Temperature (°C) | 14.7–20 20–22 22–24.1 | Highly Suitable Moderately Suitable Low Suitability | [45,56,57] | |
| Economic | C5 = Distance from Roads (m) | 0–100 100–5000 5000–20,000 >20,000 | Low Suitability Highly Suitable Moderately Suitable Unsuitable | [3,15,32] |
| C6 = Distance from Power lines (m) | 0–5000 5000–10,000 10,000–20,000 >20,000 | Highly Suitable Moderately Suitable Low Suitability Unsuitable | [1,58] |
Table 6.
The adopted decision criteria for solar plants evaluated in a matrix.
| Criteria | C1 | C2 | C3 | C4 | C5 | C6 | Weighted |
|---|---|---|---|---|---|---|---|
| C1 | 1 | 2 | 3 | 4 | 5 | 9 | 0.39 |
| C2 | 1/2 | 1 | 2 | 2 | 4 | 5 | 0.23 |
| C3 | 1/3 | 1/2 | 1 | 1 | 3 | 5 | 0.14 |
| C4 | 1/2 | 1/2 | 1 | 1 | 3 | 7 | 0.15 |
| C5 | 1/5 | 1/2 | 1/3 | 1/3 | 1 | 1 | 0.05 |
| C6 | 1/9 | 1/2 | 1/5 | 1/7 | 1 | 1 | 0.04 |
| 6.091 | |||||||
| CI | 0.018 | ||||||
| CR | 0.014 |
Table 7.
Factors for wind turbine power plant installation.
| Factors | Criteria | Classes | Suitability | References |
|---|---|---|---|---|
| Topographical | C2 = Slope (°) | 0–2.9 2.9–5.7 5.7–8.5 >8.5 | Highly suitable Moderately Suitable Low Suitability Unsuitable | [15,32] |
| Climatic | C1 = Wind Speed (m/s) | 0–5.6 5.6–6.9 6.9–9.5 >9.5 | Unsuitable Low Suitability Moderately Suitable Highly Suitable | [22,24,32] |
| Economic | C3 = Distance from Roads (m) | 0–100 100–5000 5000–20,000 >20,000 | Low Suitability Highly Suitable Moderately Suitable Unsuitable | [3,15,32] |
| C4 = Distance from Power lines (m) | 0–250 250–5000 5000–20,000 >20,000 | Unsuitable Highly Suitable Moderately Suitable Unsuitable | [15,32,33] |
Table 8.
The adopted decision criteria for wind plant comparison matrix.
| Criteria | C1 | C2 | C3 | C4 | Weighted |
|---|---|---|---|---|---|
| C1 | 1 | 3 | 5 | 9 | 0.50 |
| C2 | 1/3 | 1 | 3 | 7 | 0.24 |
| C3 | 1/5 | 1/5 | 1 | 5 | 0.21 |
| C4 | 1/9 | 1/7 | 1/5 | 1 | 0.038 |
| 5.22 | |||||
| CI | 0.055 | ||||
| CR | 0.049 |
Table 9.
Area overlapped between the World Bank study and this study.
| Suitability | Overlapped Area (ha) | Percentage Overlap (%) |
|---|---|---|
| Not Suitable | 25,885.41 | 0 |
| Low Suitable | 4760.71 | 55 |
| Moderate Suitable | 273,568.55 | 53 |
| High Suitable | 705,967.59 | 56 |
Disclaimer/Publisher’s Note: The statements, opinions and data contained in all publications are solely those of the individual author(s) and contributor(s) and not of MDPI and/or the editor(s). MDPI and/or the editor(s) disclaim responsibility for any injury to people or property resulting from any ideas, methods, instructions or products referred to in the content. |
© 2022 by the authors. Licensee MDPI, Basel, Switzerland. This article is an open access article distributed under the terms and conditions of the Creative Commons Attribution (CC BY) license (https://creativecommons.org/licenses/by/4.0/).
Share and Cite
MDPI and ACS Style
Kamati, K.; Smit, J.; Hull, S. Multicriteria Decision Method for Siting Wind and Solar Power Plants in Central North Namibia. Geomatics 2023, 3, 47-67. https://doi.org/10.3390/geomatics3010002
AMA Style
Kamati K, Smit J, Hull S. Multicriteria Decision Method for Siting Wind and Solar Power Plants in Central North Namibia. Geomatics. 2023; 3(1):47-67. https://doi.org/10.3390/geomatics3010002
Chicago/Turabian StyleKamati, Klaudia, Julian Smit, and Simon Hull. 2023. "Multicriteria Decision Method for Siting Wind and Solar Power Plants in Central North Namibia" Geomatics 3, no. 1: 47-67. https://doi.org/10.3390/geomatics3010002