Article

The Effect of the Isolator Design on the Efficiency of Rotary Piston Compressors

by
Savvas Savvakis
*,
Georgia Dimopoulou
and
Konstantinos Zoumpourlos
The SARM Project, Leoforos Syggrou 196, 17671 Athens, Greece
*
Author to whom correspondence should be addressed.
Thermo 2023, 3(2), 216-231; https://doi.org/10.3390/thermo3020013
Submission received: 14 January 2023 / Revised: 14 March 2023 / Accepted: 24 March 2023 / Published: 4 April 2023

Abstract

:
The current work investigates the relationship between the shape of an isolator of a concentric rotary piston compressor and the secondary peak pressure developed during each operating cycle. This peak pressure is developed when the piston passes through the isolator cavity, and it is negative for compressor efficiency. The aim of this paper is to identify the isolator cavity shape that minimizes this secondary peak to improve compressor efficiency. This study covers five different cavities that may be used in such compressors. Contrary to our expectations, the conclusion is that the best geometry is the one that can be manufactured with CNC machining. The geometry that can be manufactured with 3D printing also produces a significantly lower secondary peak pressure, but it is not cost-efficient. Another limitation of the 3D printing design is the thin walls that this cavity creates. Very thin walls may cause significant deformation during the compression cycle. The conclusion is that there is a CNC machining design that is cost-efficient and allows for higher compressor performance.

1. Introduction

A compressor is a device that is used to reduce the volume of a gas or vapor by increasing its pressure.
Compressors come in many different types, including positive displacement compressors and dynamic compressors. Positive displacement compressors work by trapping gas in a chamber and then reducing the volume of that chamber, while dynamic compressors work by imparting kinetic energy to the gas and then converting that energy into pressure. Positive displacement compressors are characterized by a higher compression ratio and lower mass flow compared to dynamic compressors such as turbo-compressors with axial or radial flow configurations [1].
Compressors are an important component in many systems that require high-pressure gases, and they are widely used in industries such as petrochemicals, power generation and manufacturing, refrigeration, air conditioning, and natural gas processing. Compressed gas accounts for approximately 10% of global industrial electric energy consumption [2]. This share may reach 20% if commercial and residential needs are included, such as portable tools, air pumps, pneumatic heating, ventilation, air conditioning, etc. [3]. To reduce energy consumption, energy-saving measures are a key factor for the gas-compression industry, alongside the continuously increasing demand for compressed gas worldwide. Many energy-saving measures have been applied recently upstream and downstream of the gas compressor, such as pipeline leakage reduction, frictional losses reduction, optimization of end-use devices, etc., in the compressed gas system (CGS). However, for existing compressor technology, future saving potentials are estimated to be no higher than 15% (740 TWh in 2012) [4], with an established maximum power and power-to-weight ratio.
The maximum pressure that can be generated in the compression process end (minimum volume) is a major concern regarding compressor technology. Therefore, their design optimization is a constant R&D process for all compressor types. In a recent market analysis, rotary compressors were found to hold the largest share of the global compressor market and are expected to maintain their lead position until 2028 (according to Grand View Research, 2021) [5]. As a result, significant research efforts have been focused on enhancing the performance of rotary compressors. It is worth mentioning that in some cases, such as in the current study, design optimization can lead to significant improvements in efficiency. For instance, Ooi did a theoretical study that predicted a 50% reduction in mechanical loss, leading to an improvement in the coefficient of a rolling piston compressor performance of more than 14% [6]. Liu et al. optimized the bearing components of a scroll compressor using the gradient-search method and reported that the optimization resulted in at least a 14.1% reduction in frictional losses at the bearing components [7]. Etemad and Nieter identified that the most important geometry parameters of scroll compressors are the starting angle and wrap height, but they did not give any numerical data. They just identified which parameters affect efficiency the most [8]. Hirayama et al. concluded that adding a third cylinder in rotary vane compressors for refrigeration applications and an extra bearing on the main shaft could increase the capacity, reliability, and efficiency of the compressor (up to a 9% efficiency increase) [9]. Meng et al. proposed a new design for the cylinder of rolling piston rotary compressors and they managed to increase their electric efficiency by 4.43% [10]. Noh et al. (2016) studied the impact of the cylinder slenderness ratio on the performance of a rolling piston compressor. The researchers found that reducing the cylinder slenderness ratio led to an increase in volumetric efficiency by 6.3%, resulting in an overall efficiency improvement of 3.7% [11]. Gu et al. investigated the sensitivity of the gap heights at vane tips and they concluded that as the gap increases (0.01–0.05 mm), the isentropic efficiency decreases by 18.26% [12].
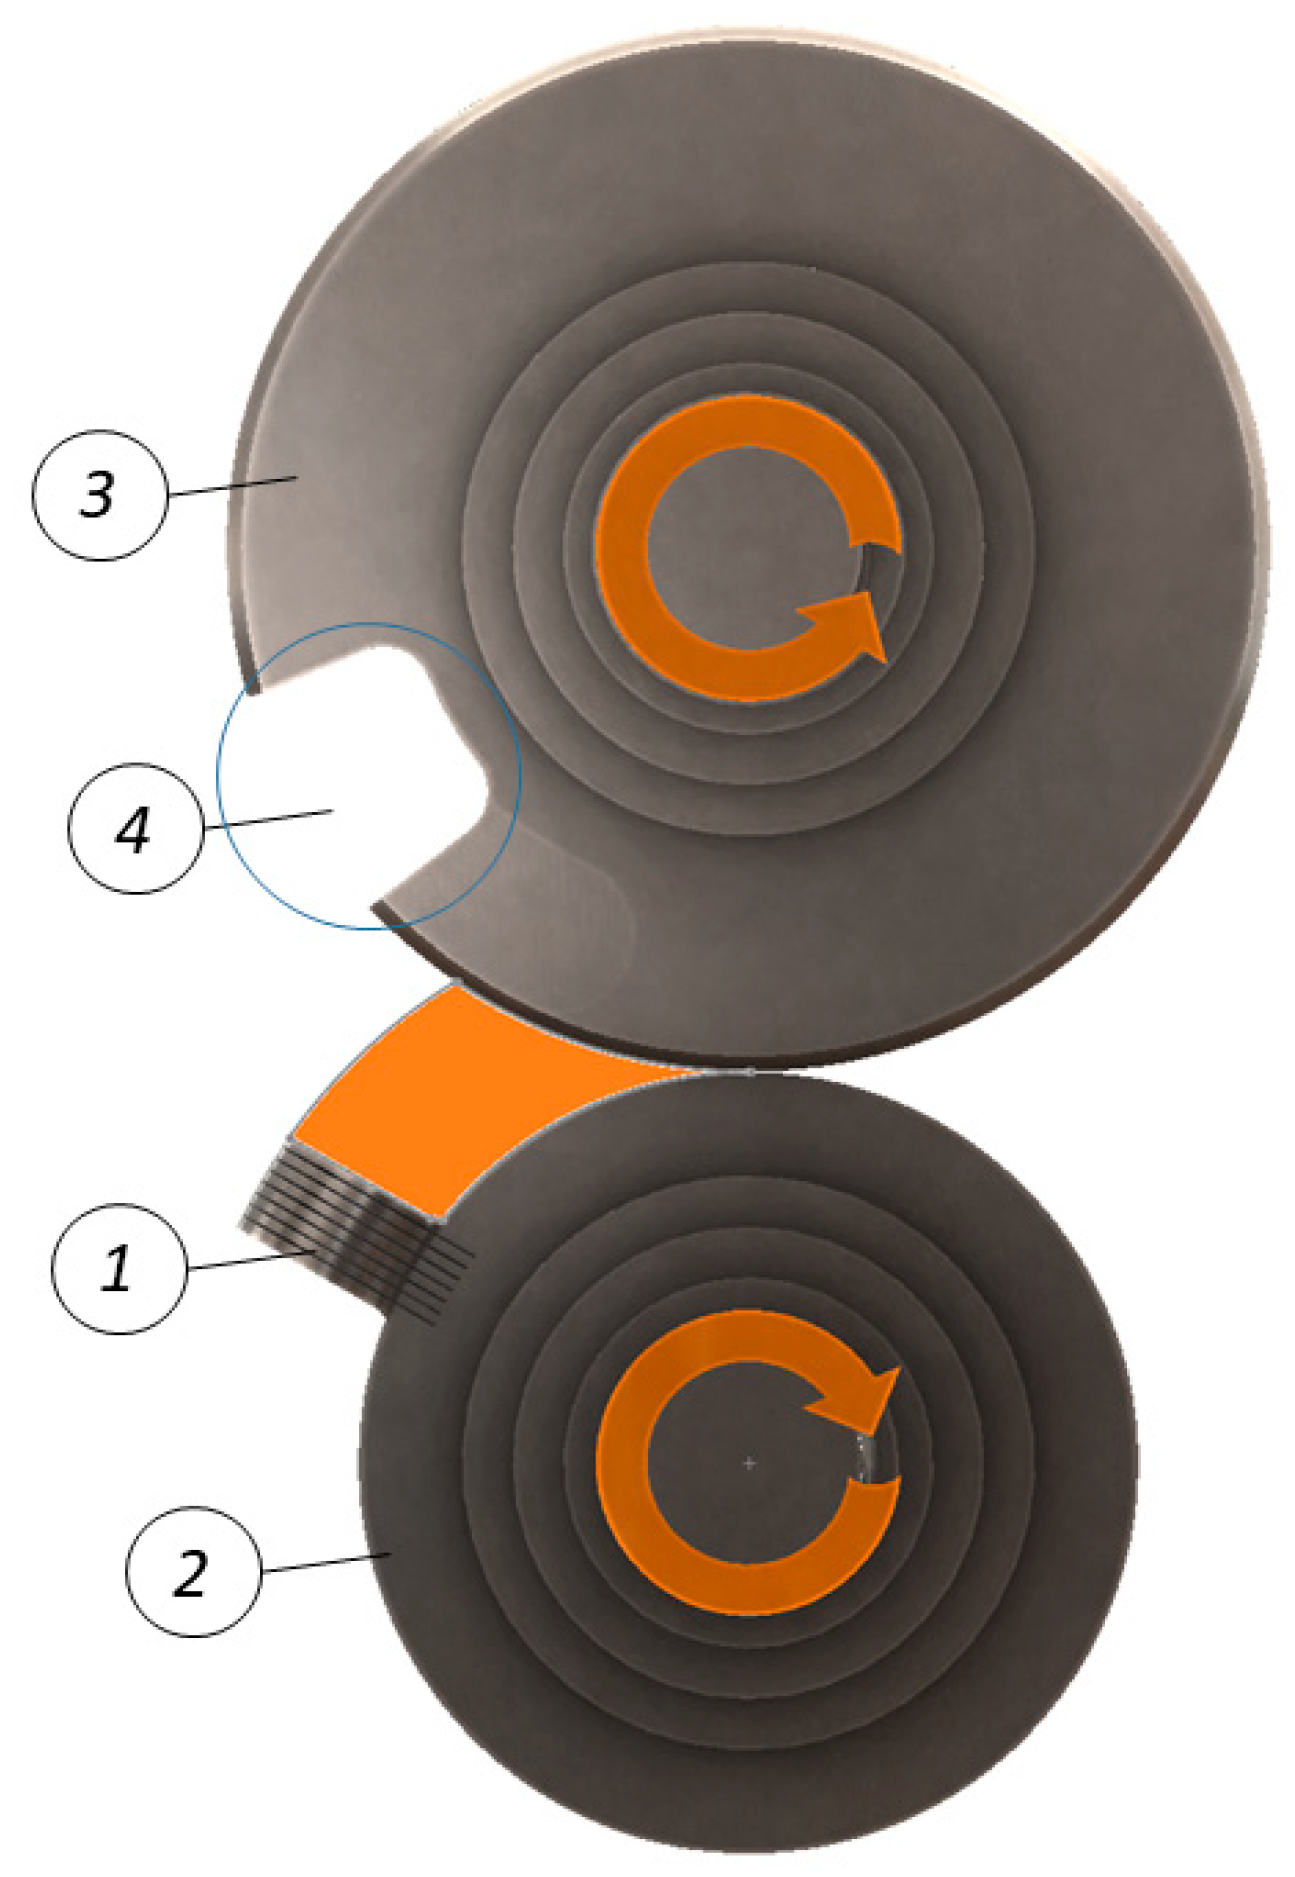
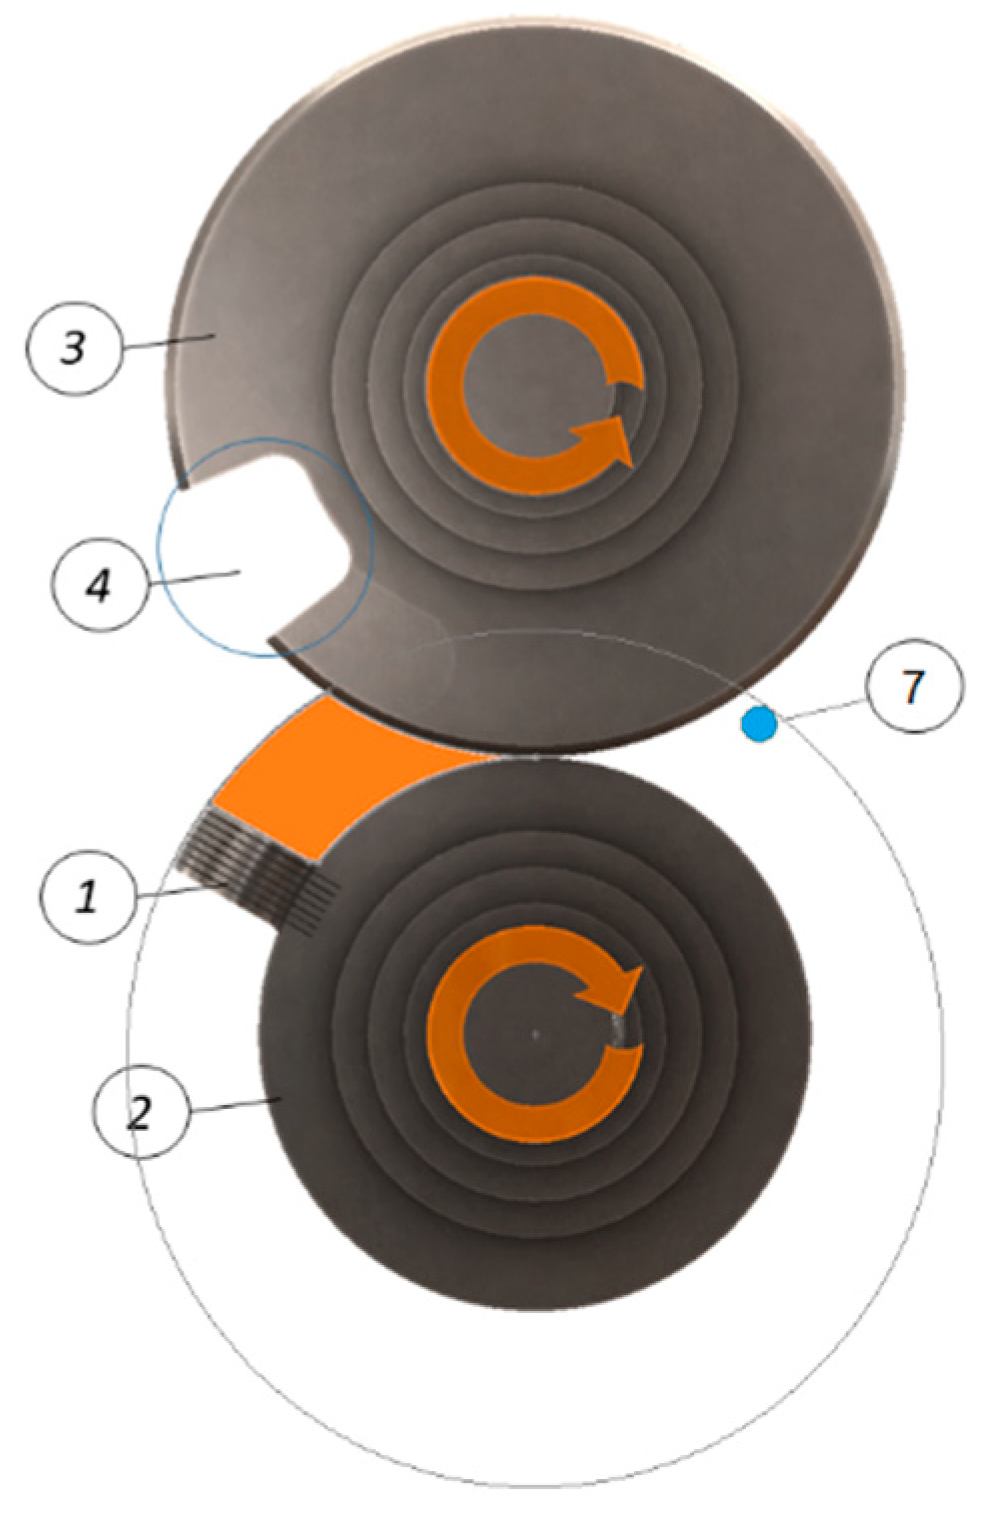
The piston rotary technology described herein belongs to the category of positive displacement compressors. The concept idea is a concentric rotary technology that has existed for 40 years and finds application in internal combustion engines, pumps, expanders, and compressors. The design of this concentric rotary machine consists of four main parts; two rotors, a piston, and a housing. The piston (1) is attached to one rotor (2) (called a piston rotor), and the other rotor (3) (called an isolator rotor) has a cavity (4) for hosting the piston (1) when the latter meets the periphery of the isolator rotor (3) (Figure 1). The role of the isolator rotor (3) is to trap the working fluid in front of the piston (1), creating a compression chamber (orange region in Figure 1) between the piston, the isolator rotor periphery, and the housing.
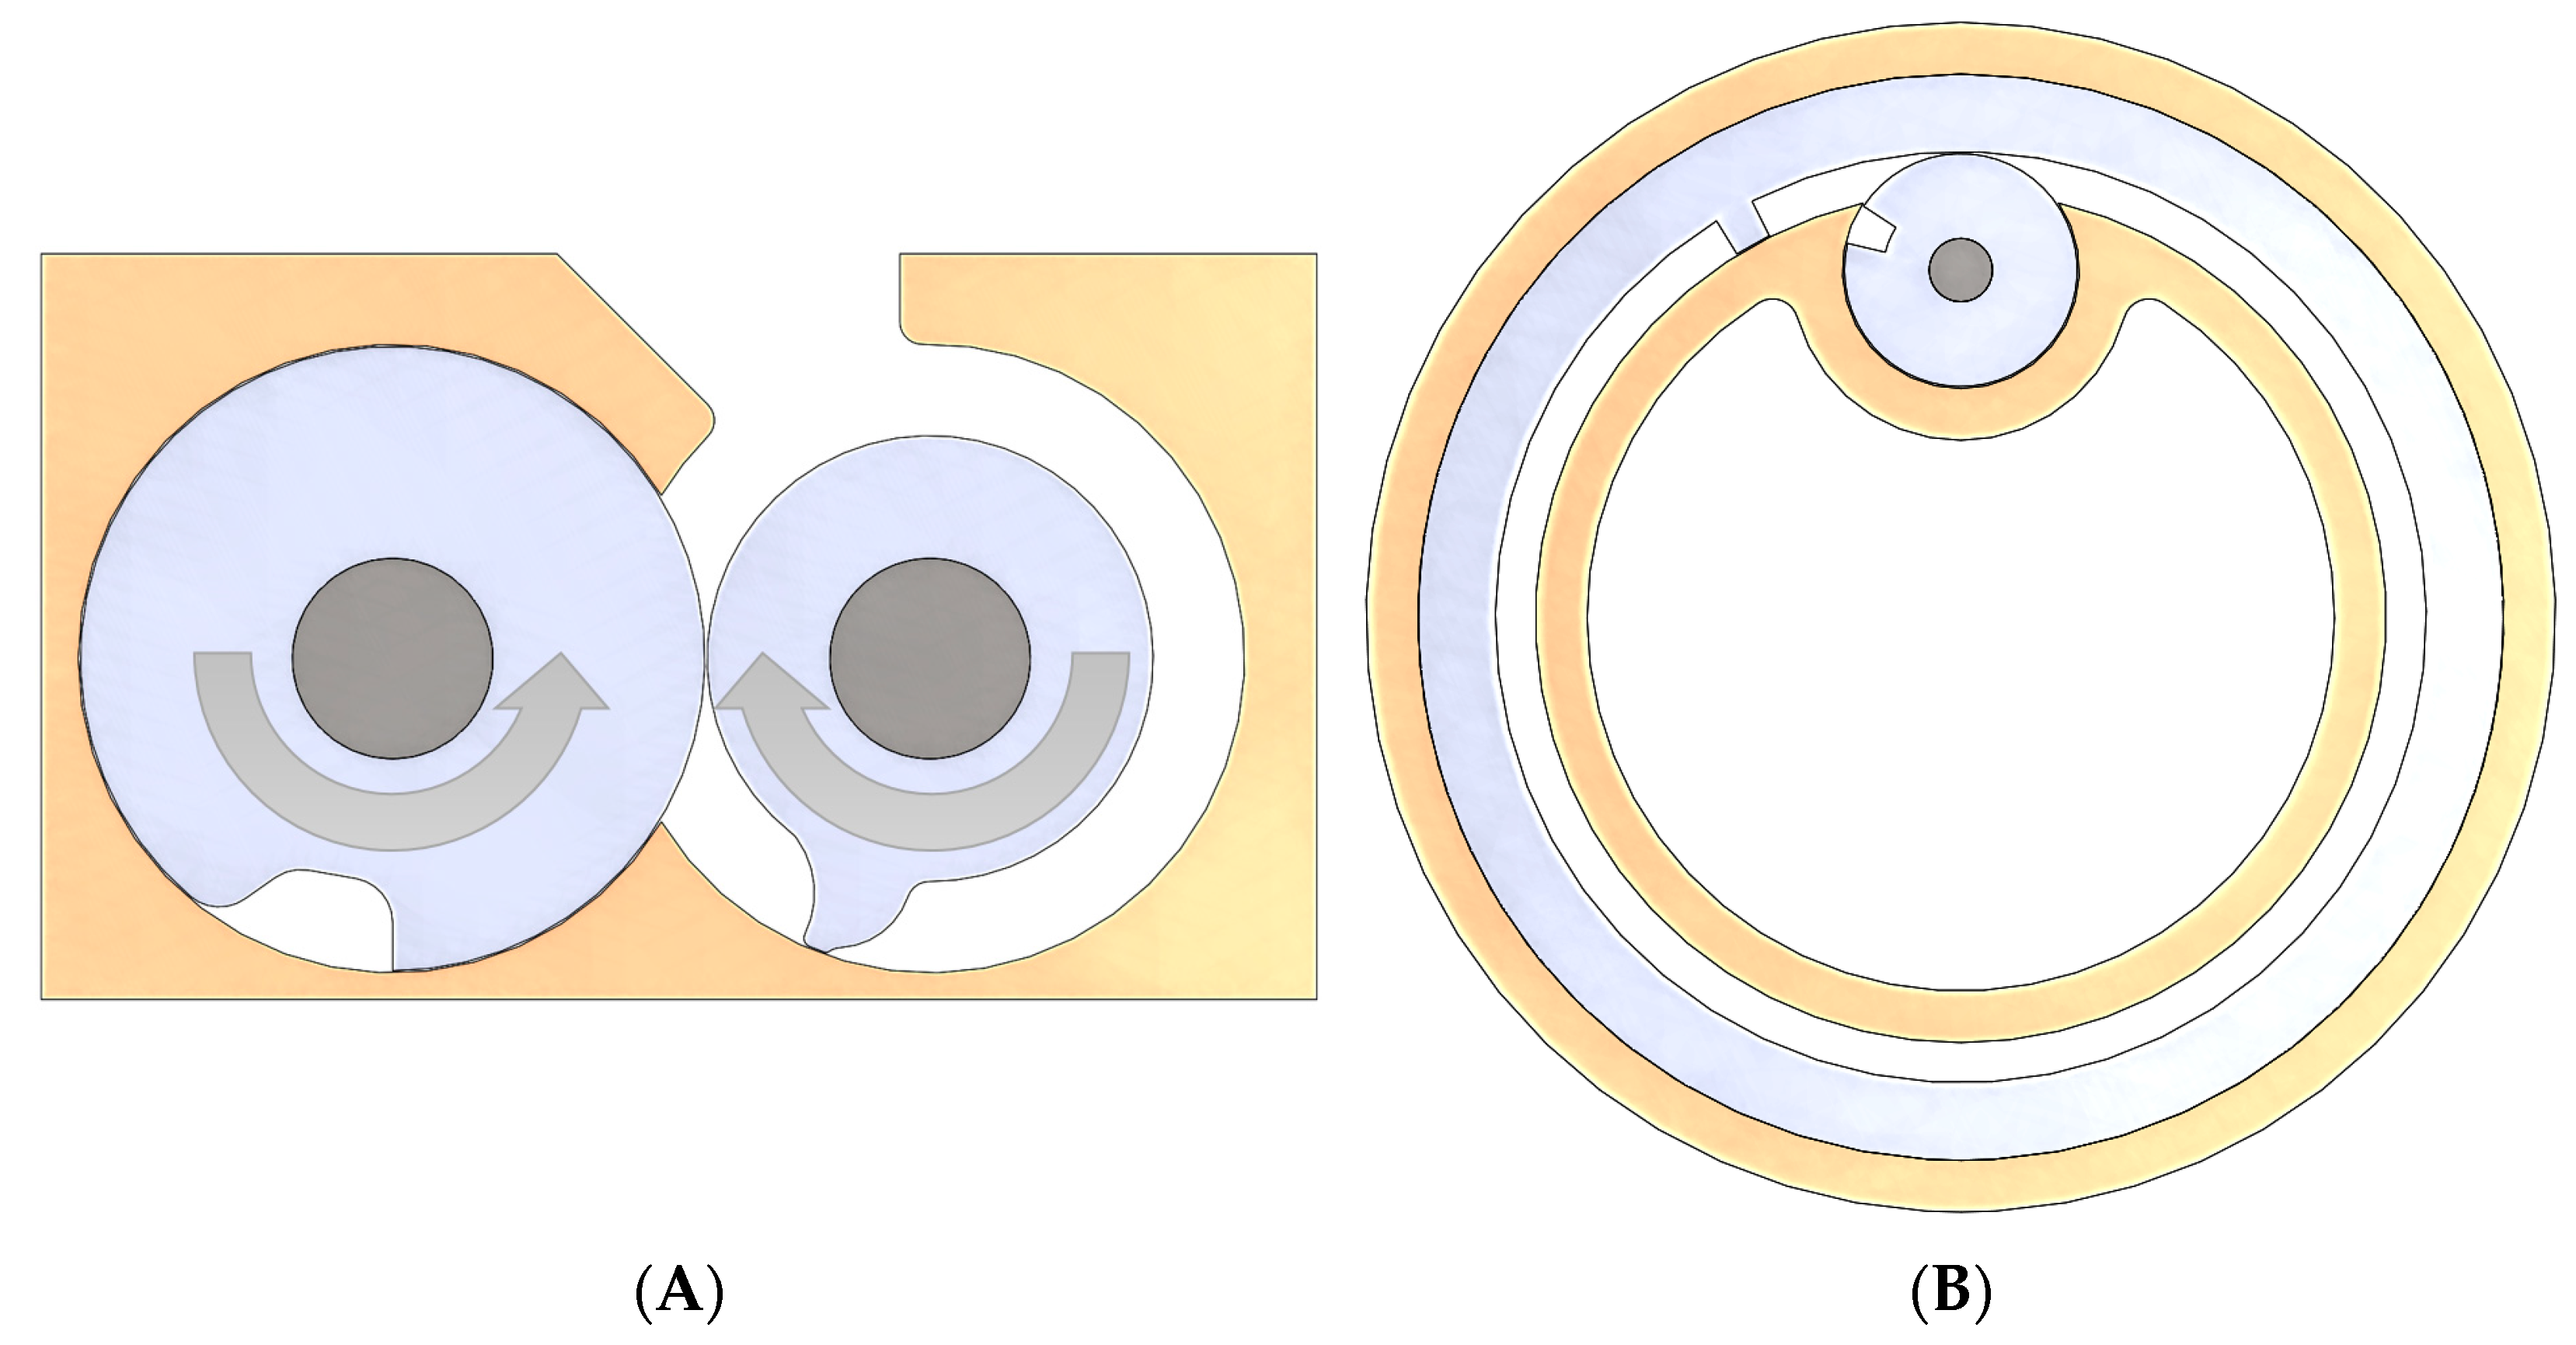
Four rotary technologies are based on this operating principle, with the oldest one developed and patented by Emmanouil Andreas Pelekis in 1980 [13]. His patent refers to an apparatus that performs compression through the circular concentric motion of a piston (letters A and B) inside a segmented annular region until it reaches the cavity. The compressed chamber is the region symbolized by the letters A, B, C, and D, as shown in Figure 2.
Ronnie Duncan patented the second concentric rotary internal combustion engine in 2005 [14], intending to downsize the already existing rotary Pelekis technology by putting a smaller isolator rotor inside the piston-rotor space (Figure 2).
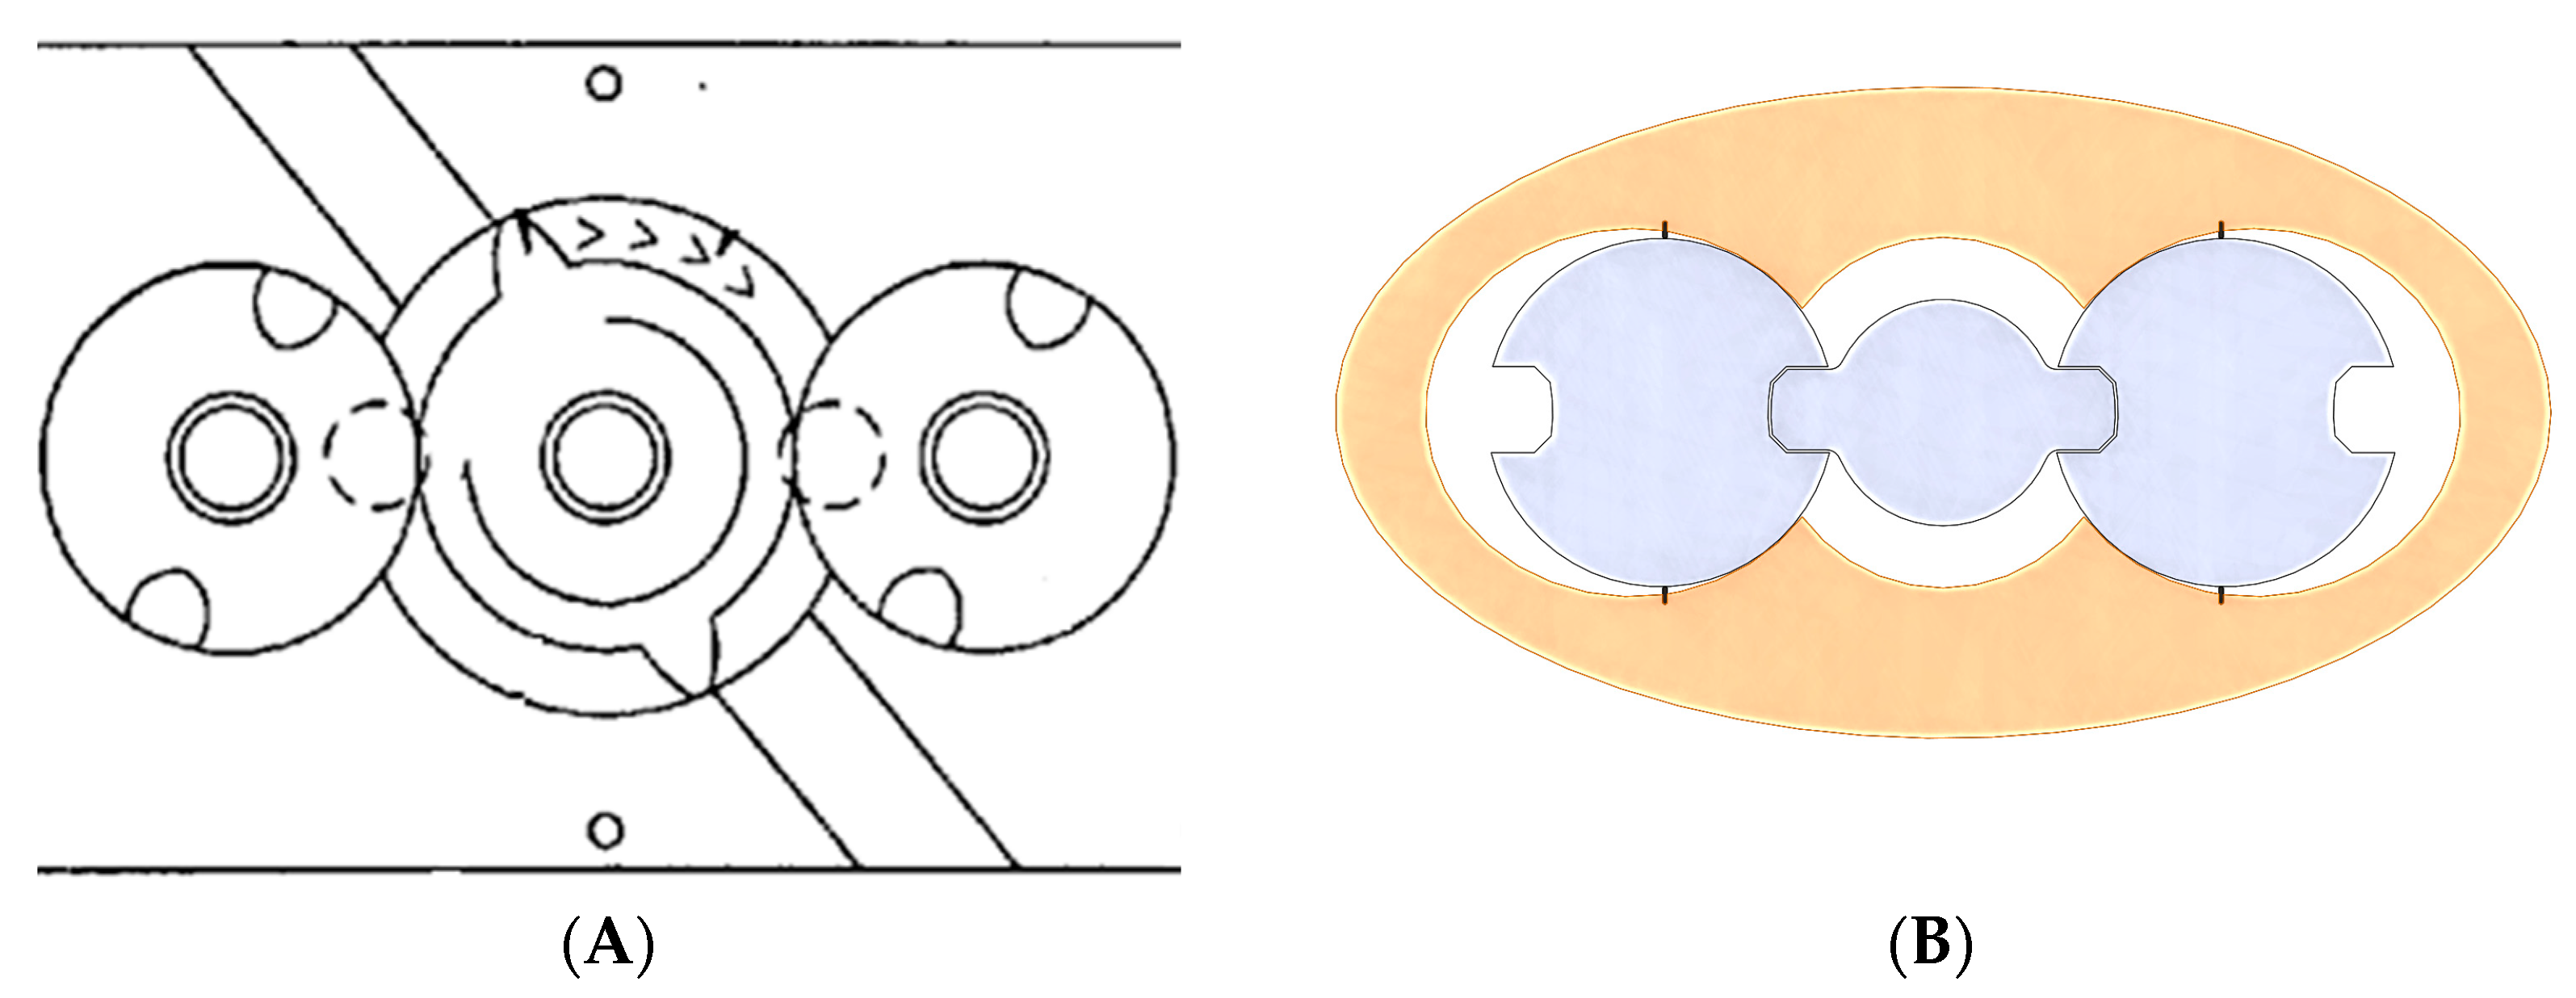
The third rotary technology was patented in 2006 by Jerome Lurtz [15], and, in this particular invention, the mechanism consists of three rotors that perform the concentric synchronized motion. The central rotor has two pistons attached with a 180° angle between them, and the side rotors have two cavities each (Figure 3).
The latest technology developed was by ASTRON AEROSPACE LLC in 2021, and the mechanism is similar to Jerome Lurtz’s rotary machine, as shown in Figure 3 [16]. The main difference between the patents is their insulation method.
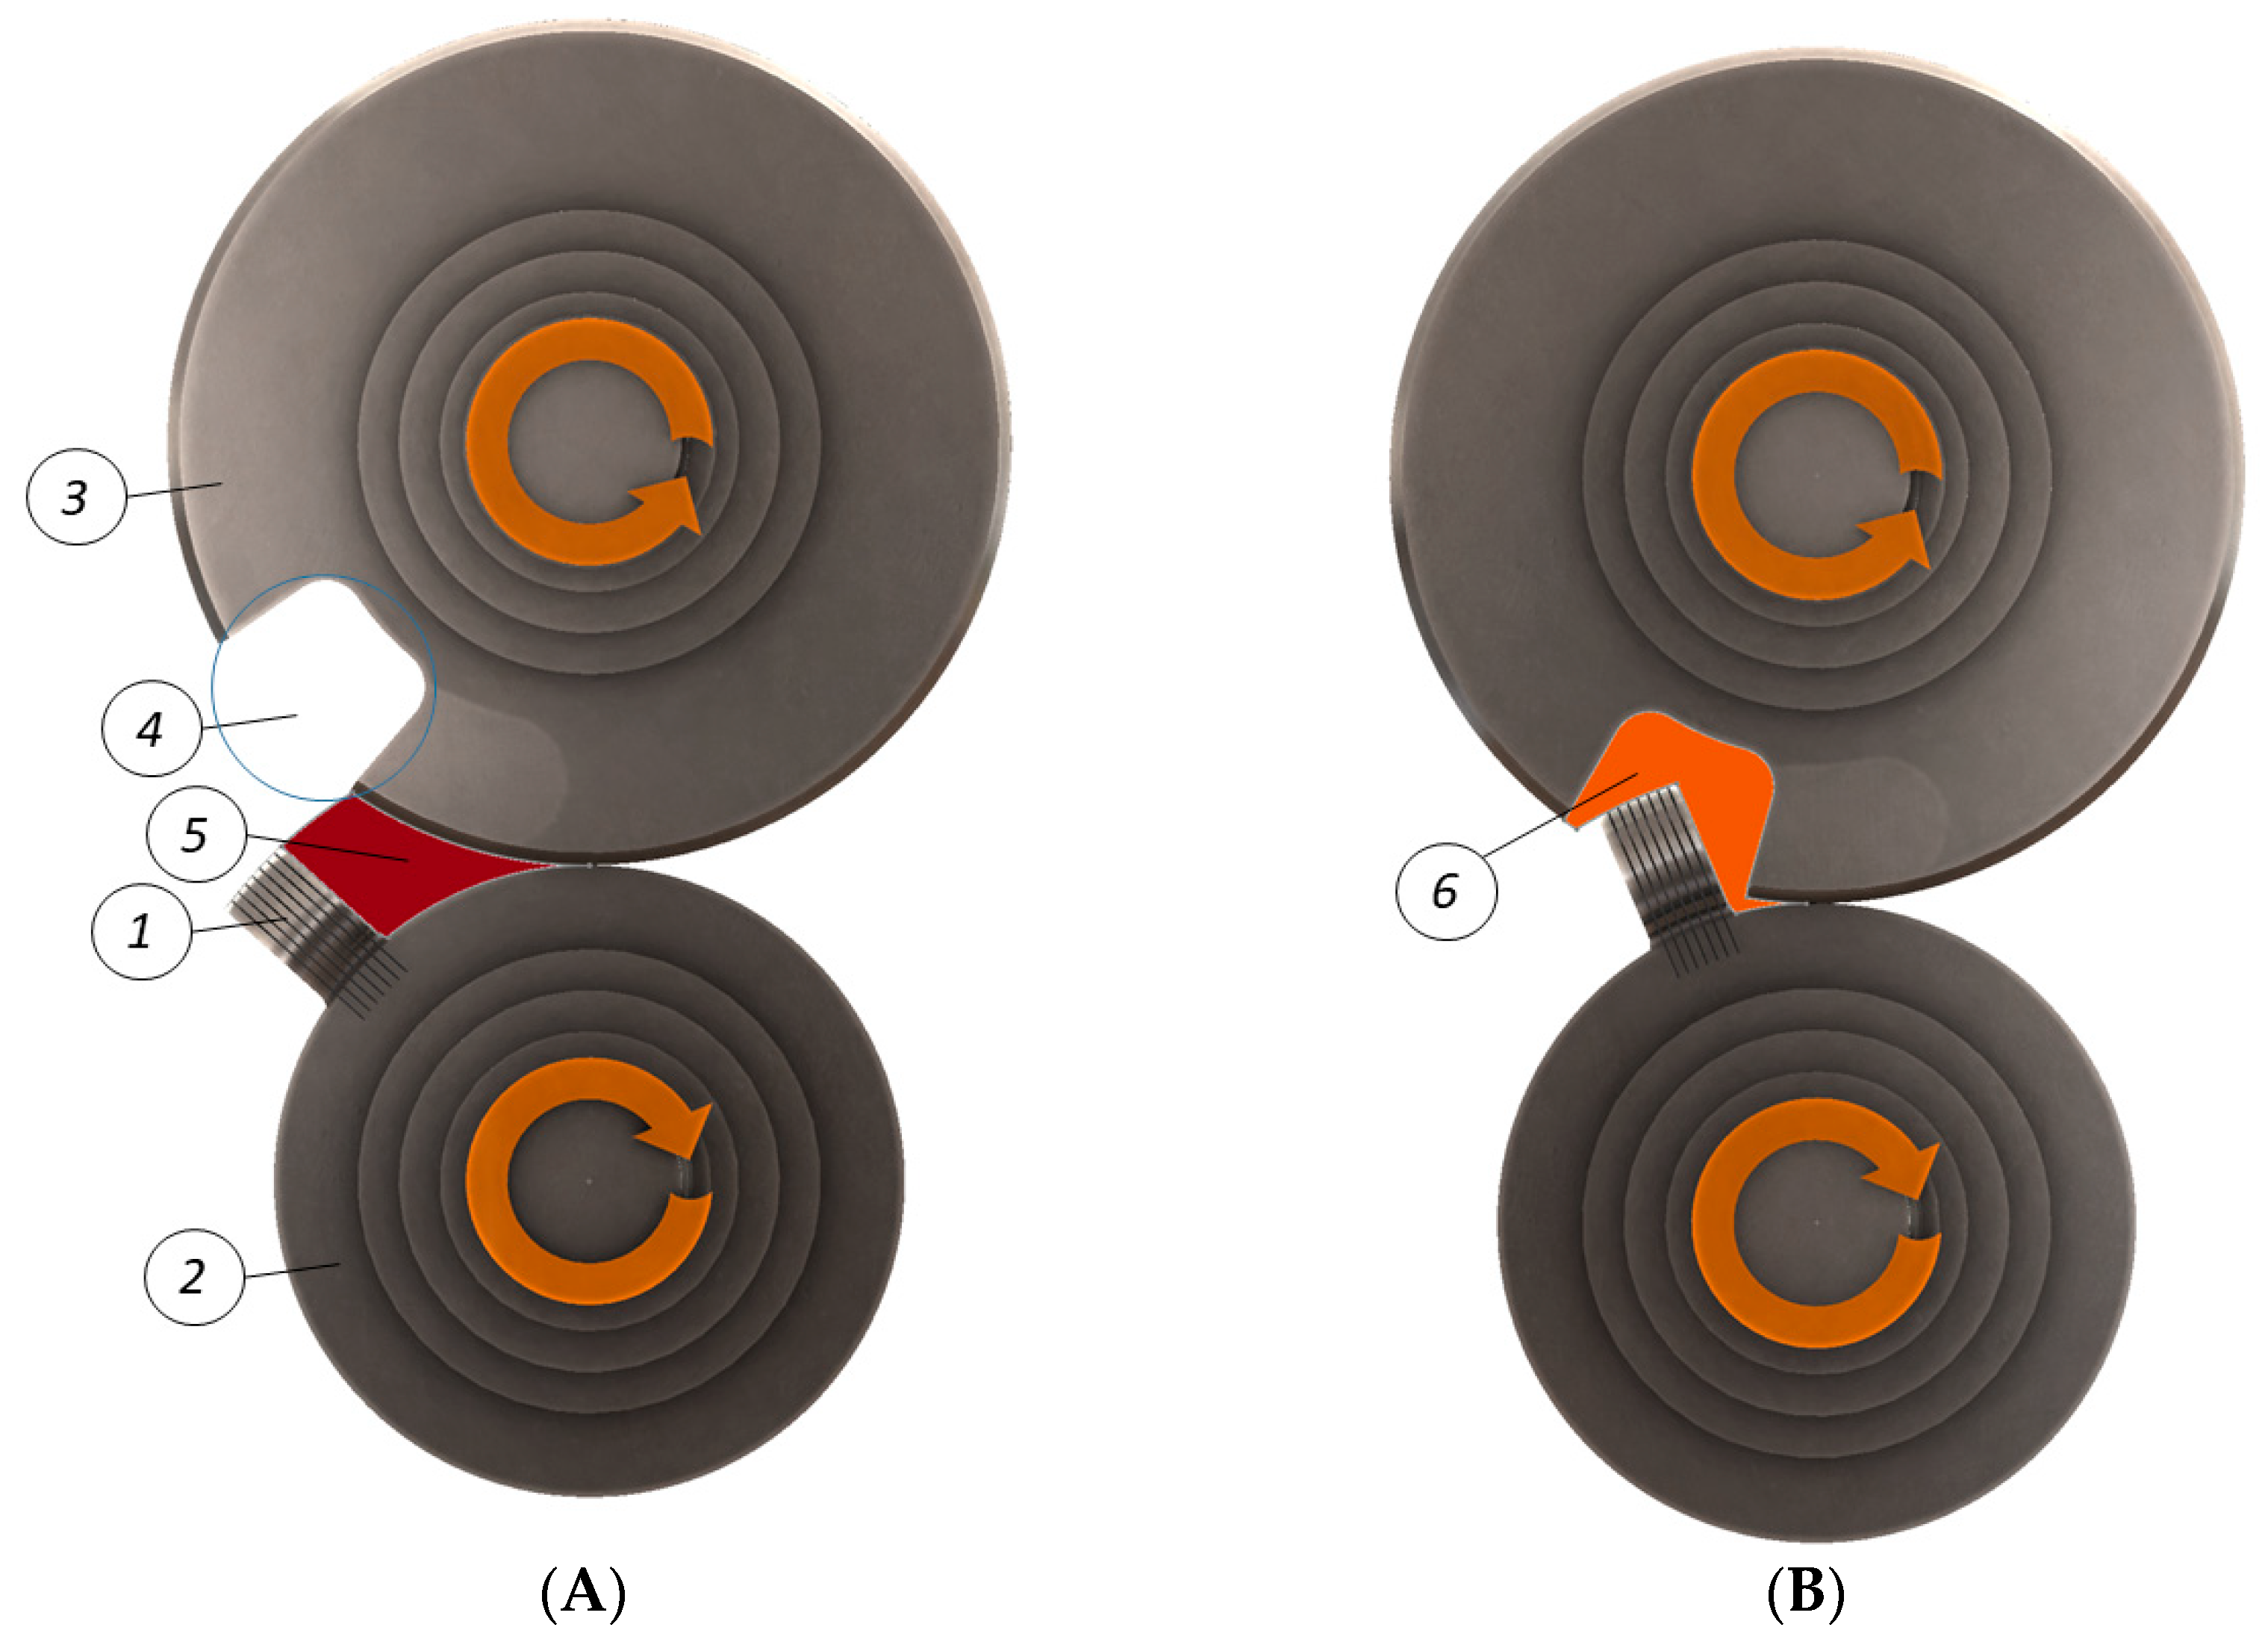
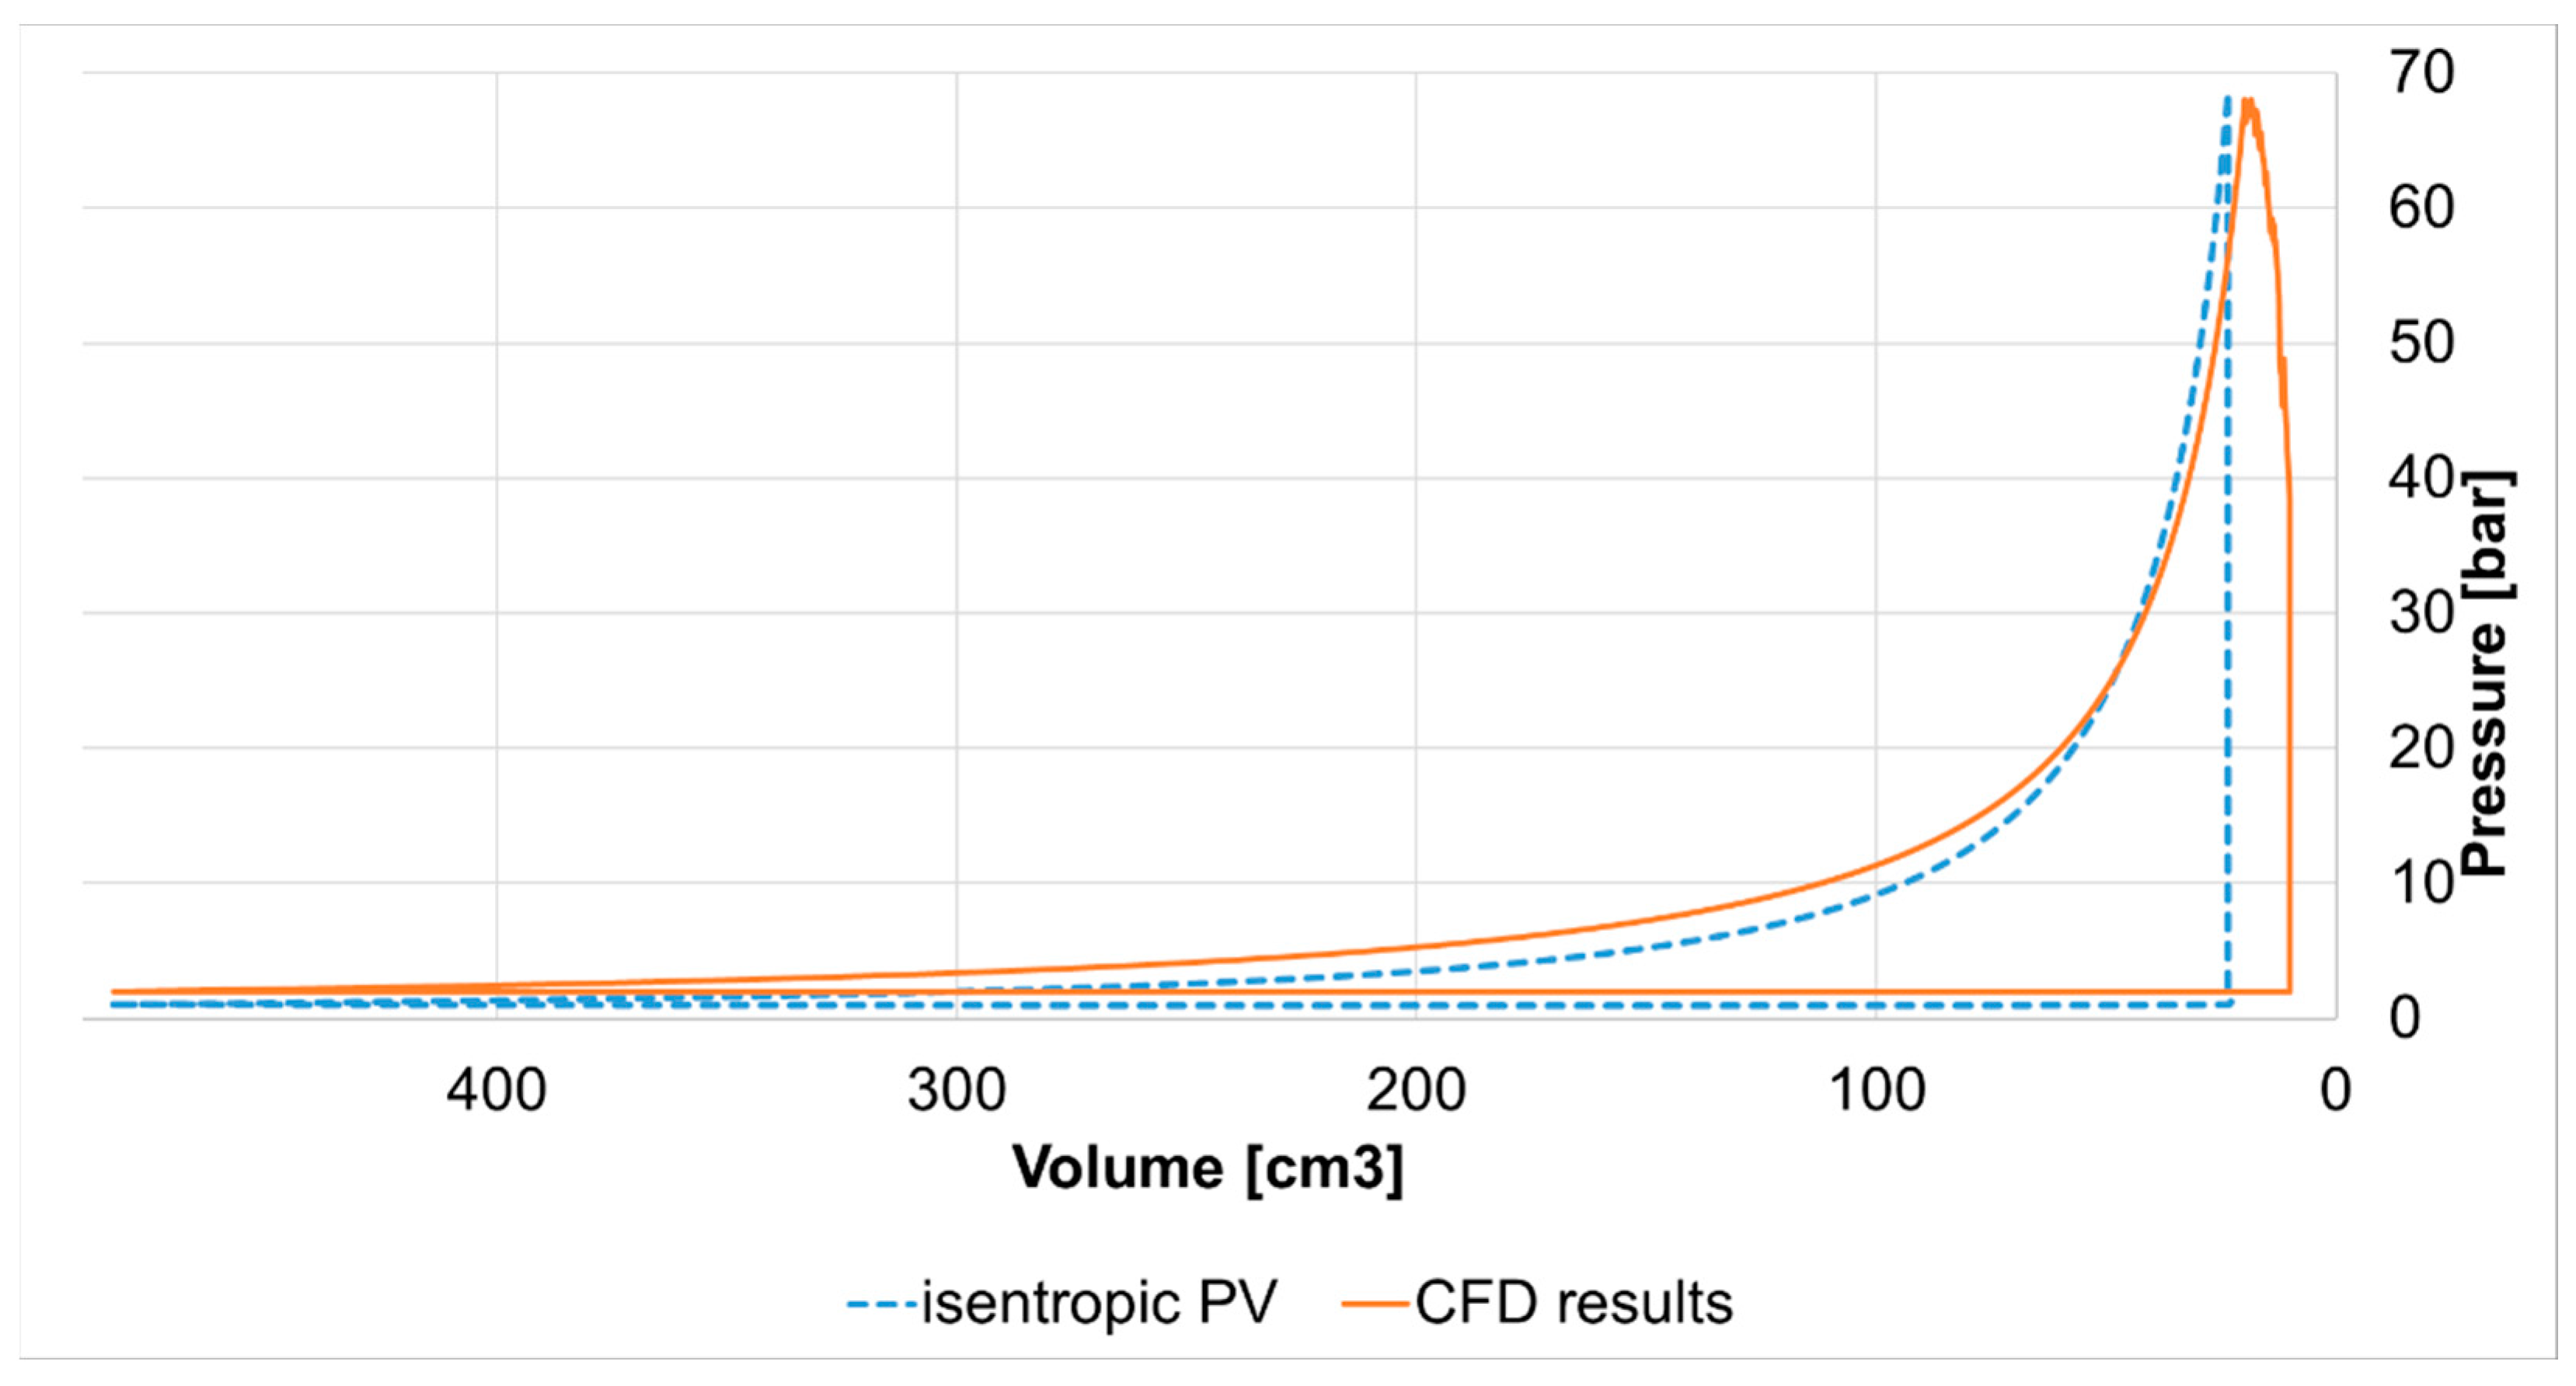
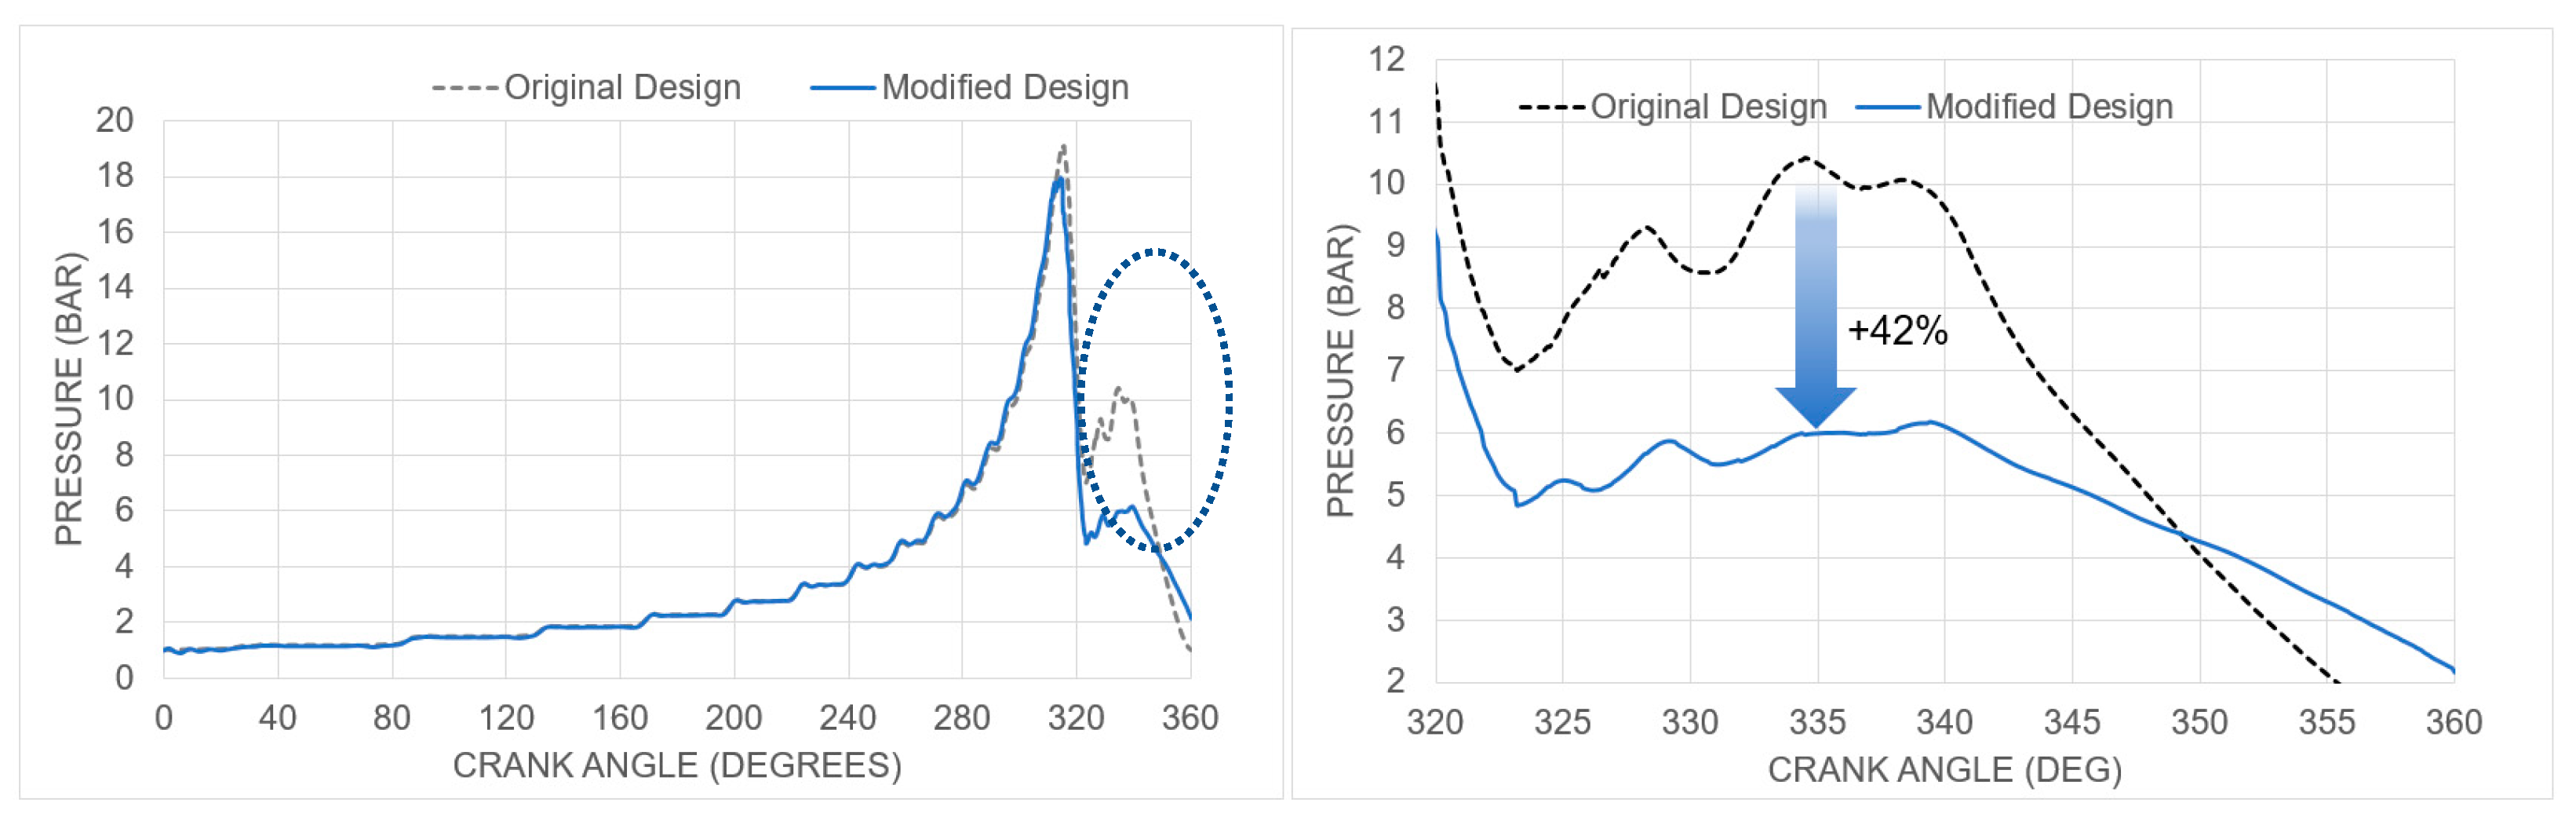
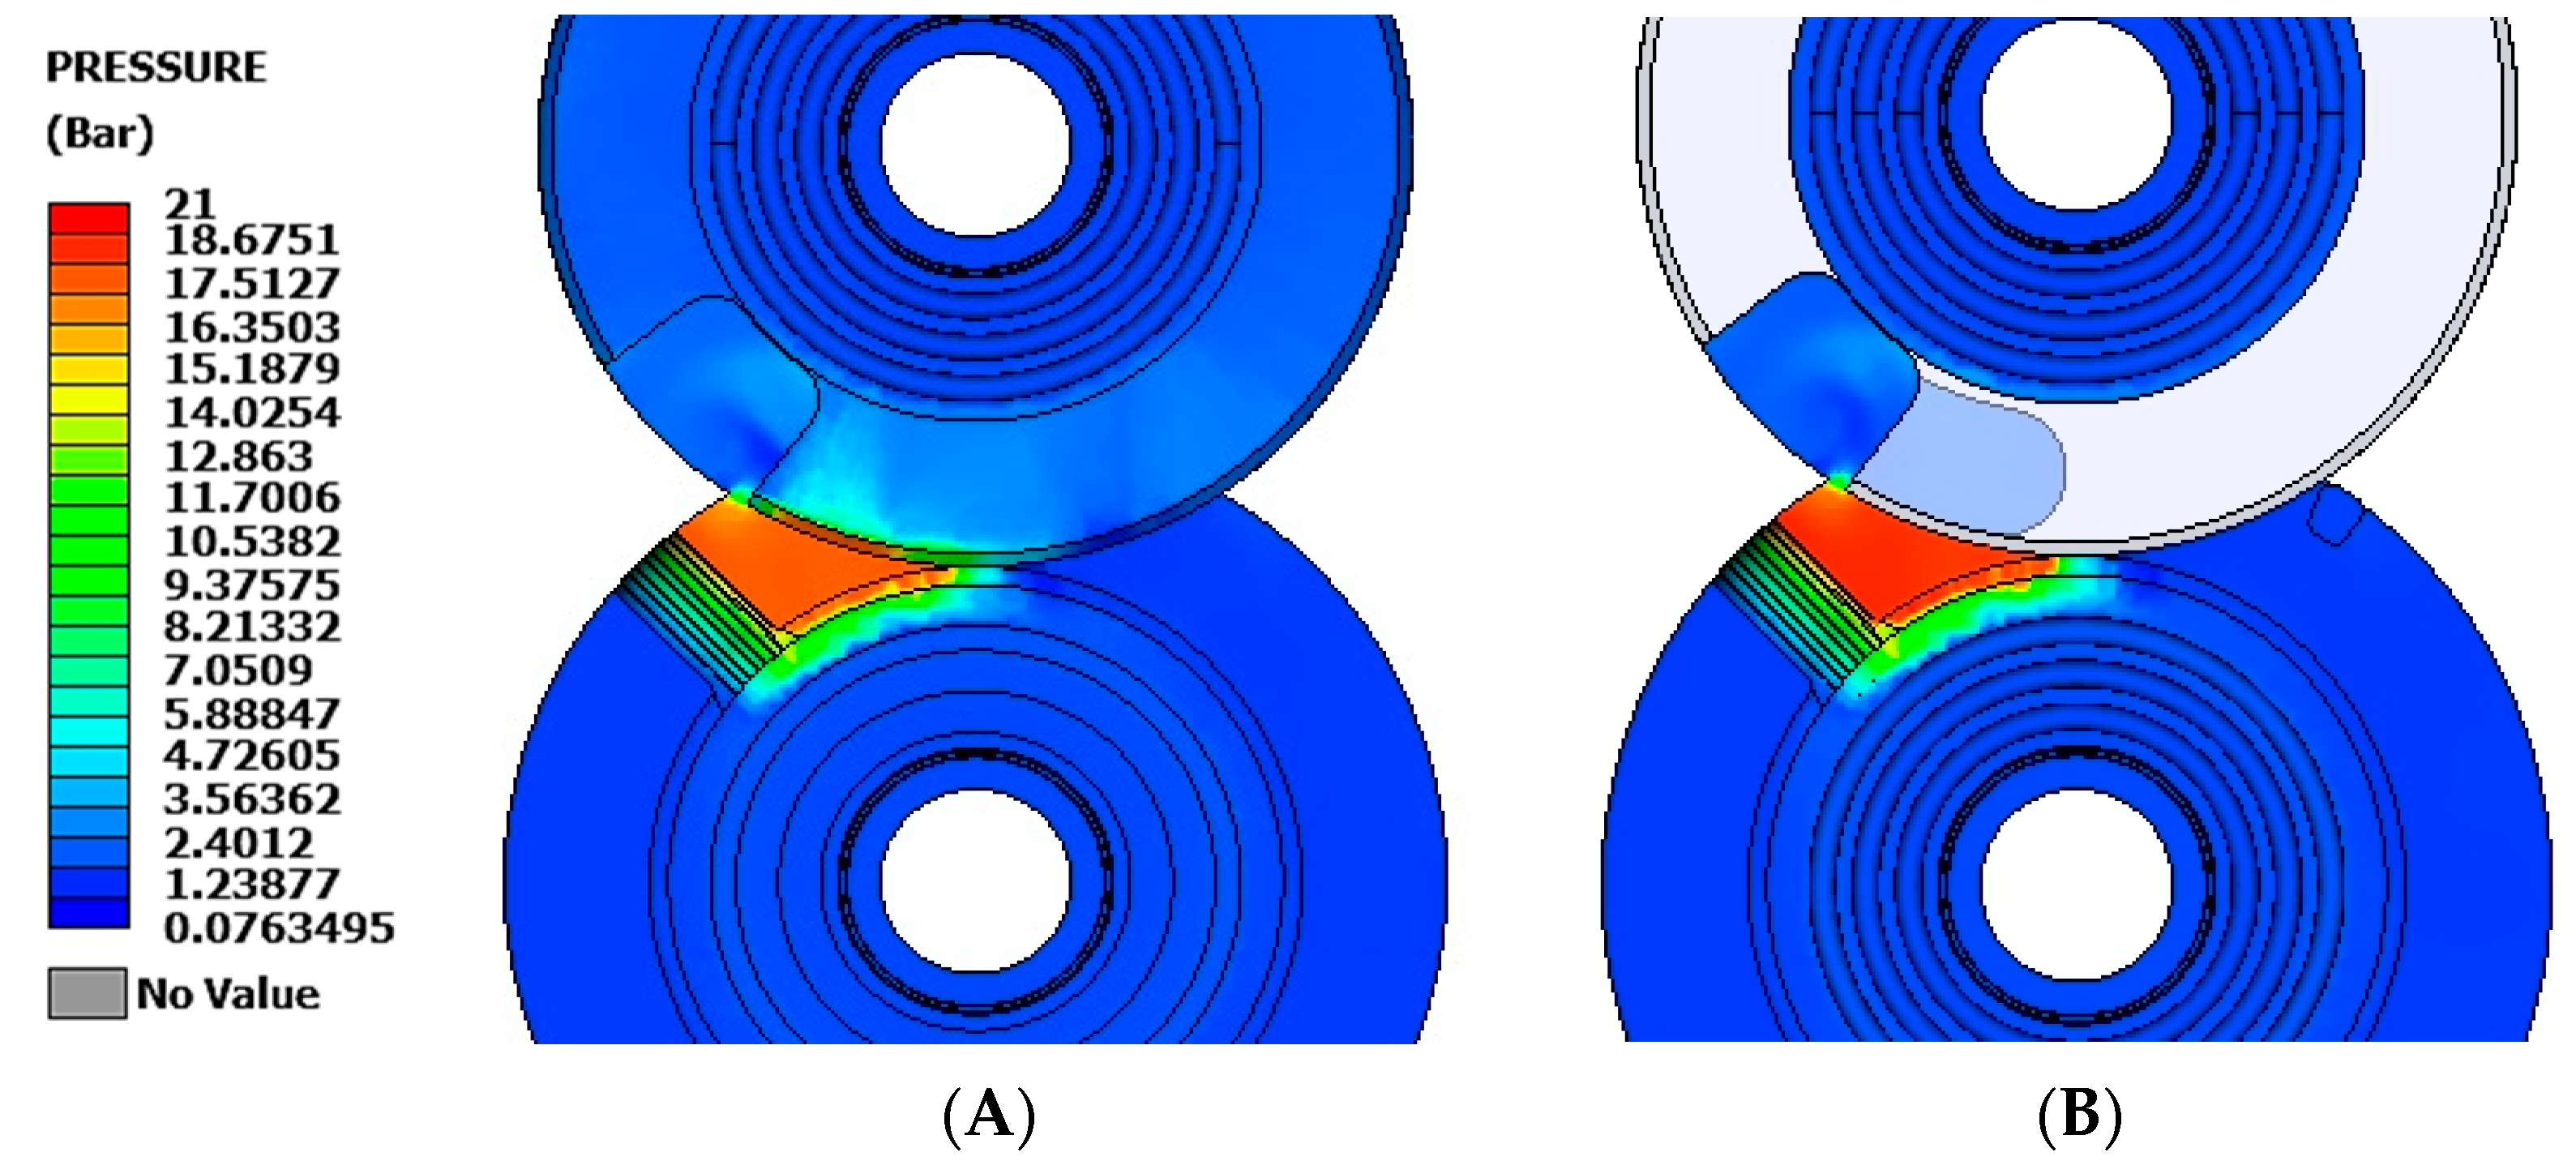
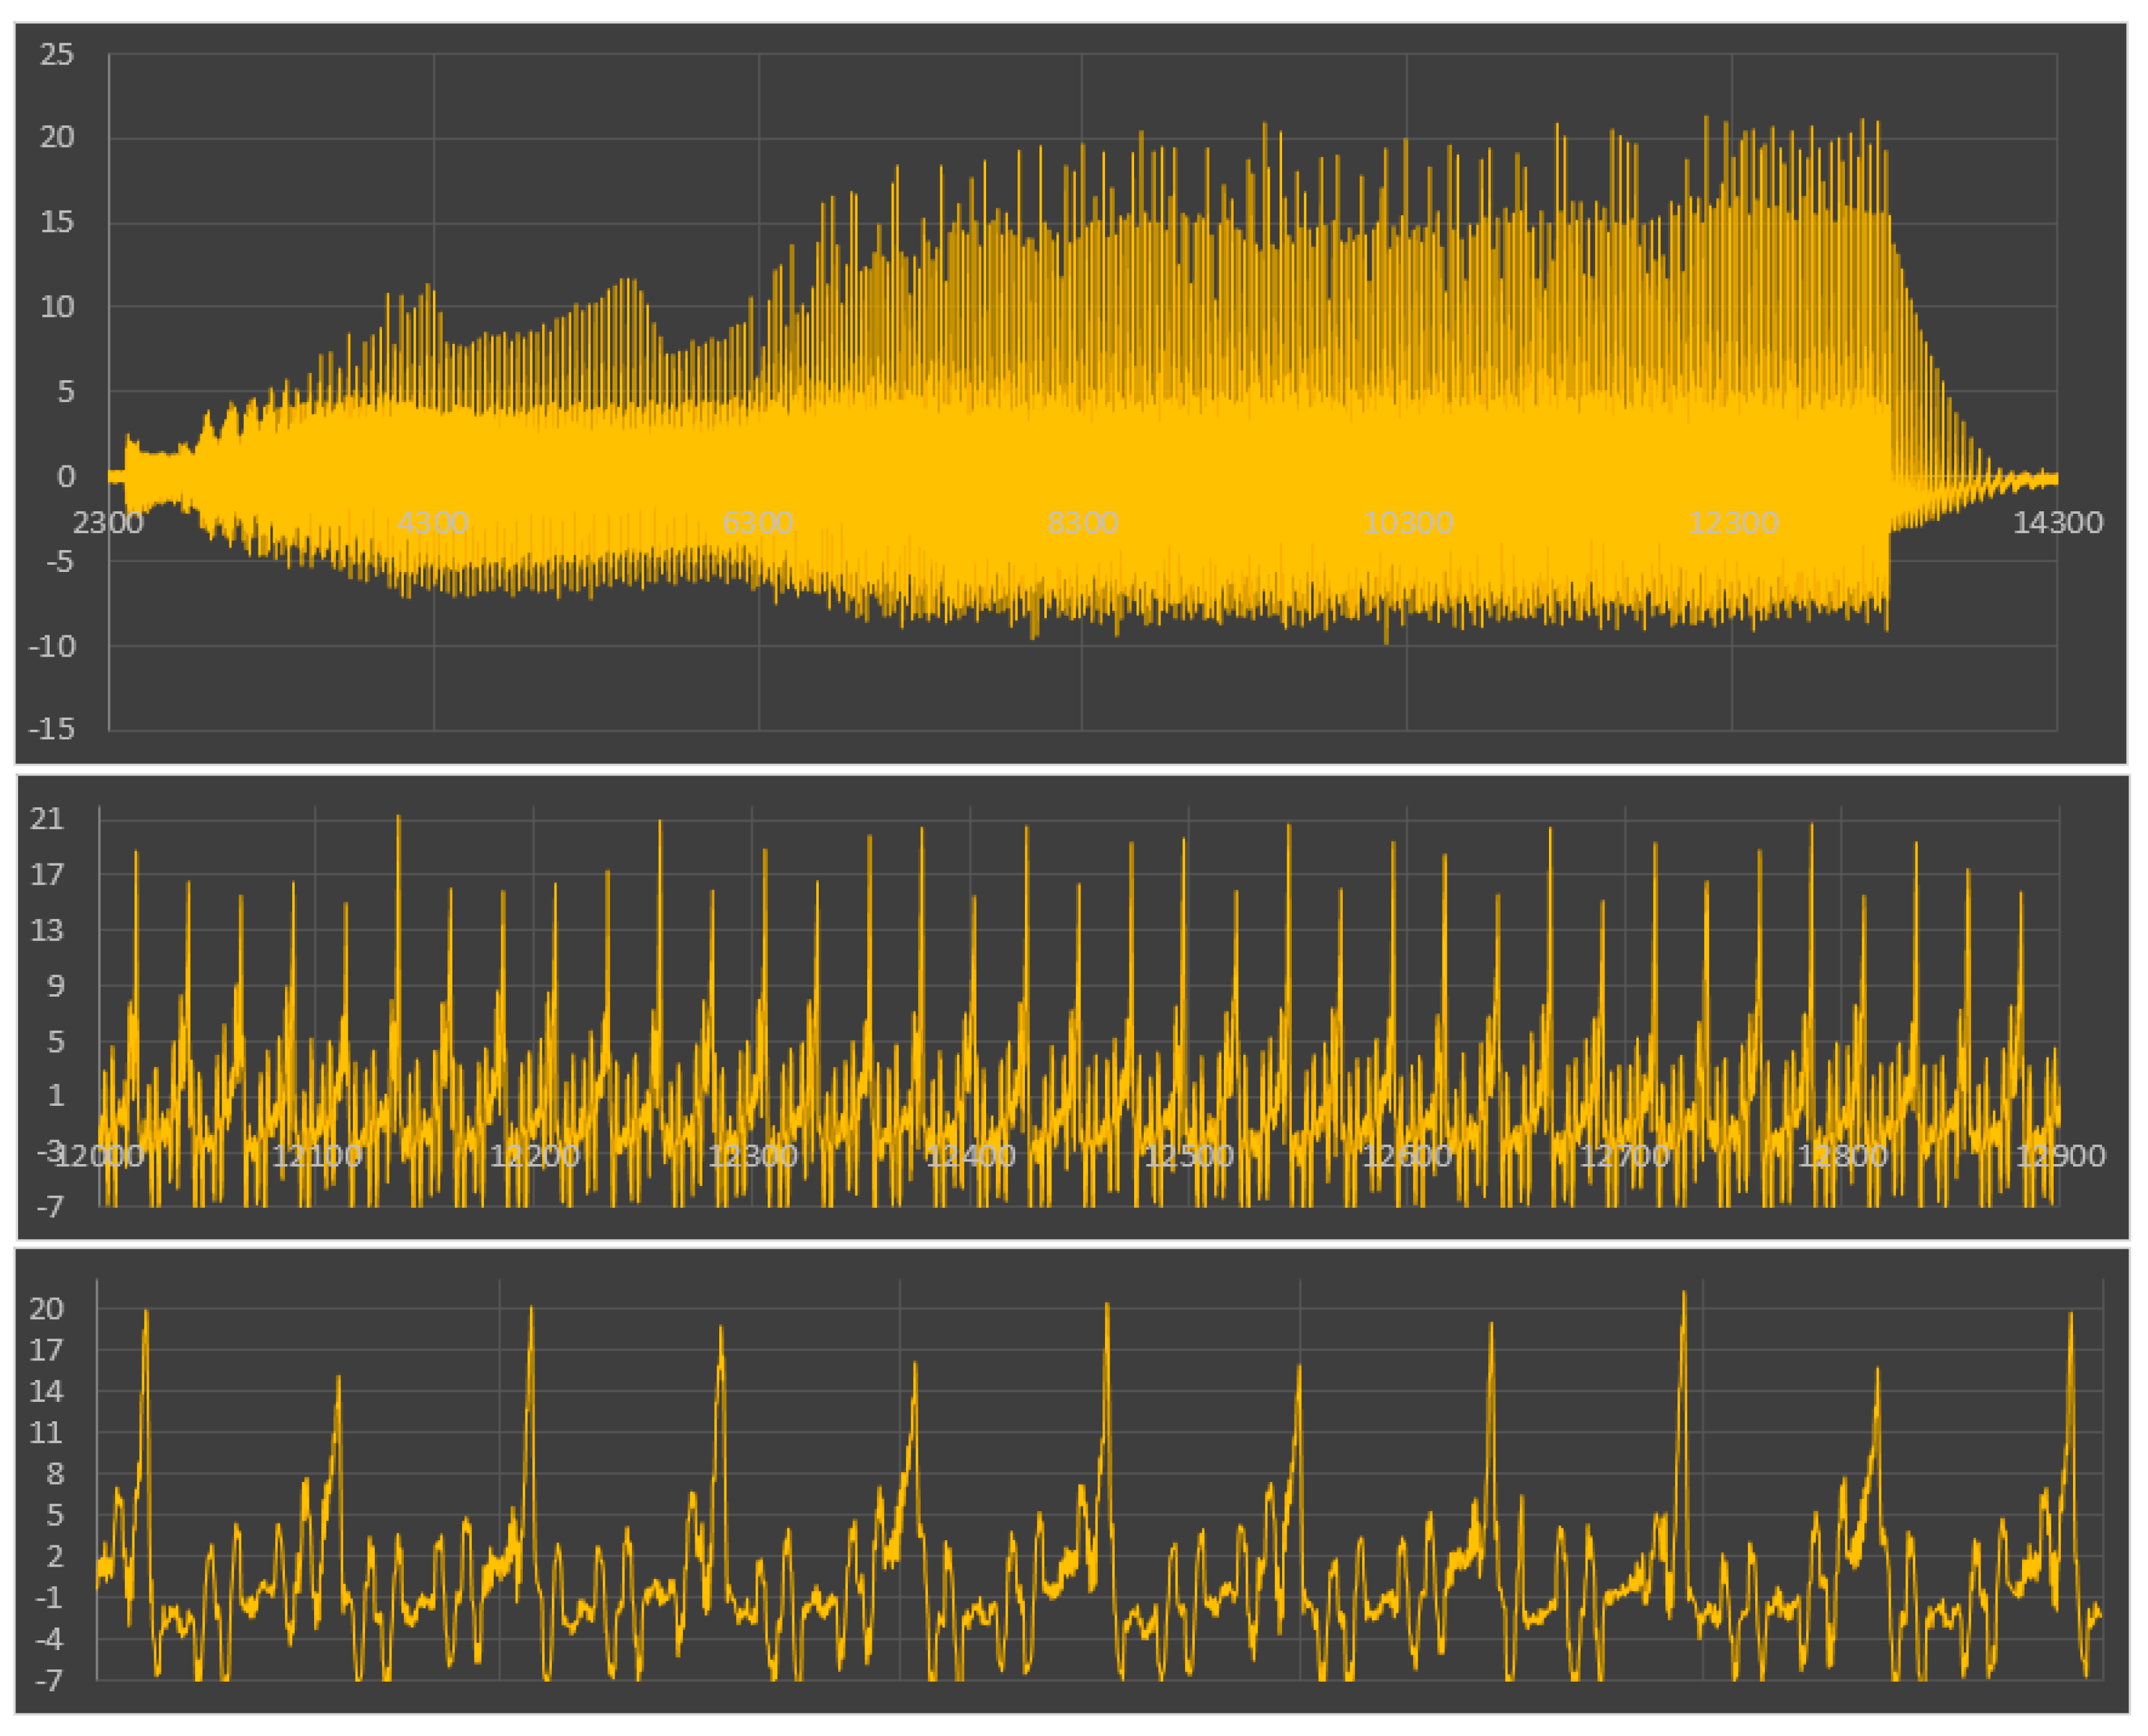
The main drawback of all these designs is related to the shape of the isolator rotor cavity. The rotor rotates by being attached to two different shafts that are coupled together with a pair of gears. The piston compresses the working fluid, and it reaches the primary peak pressure (shown in 
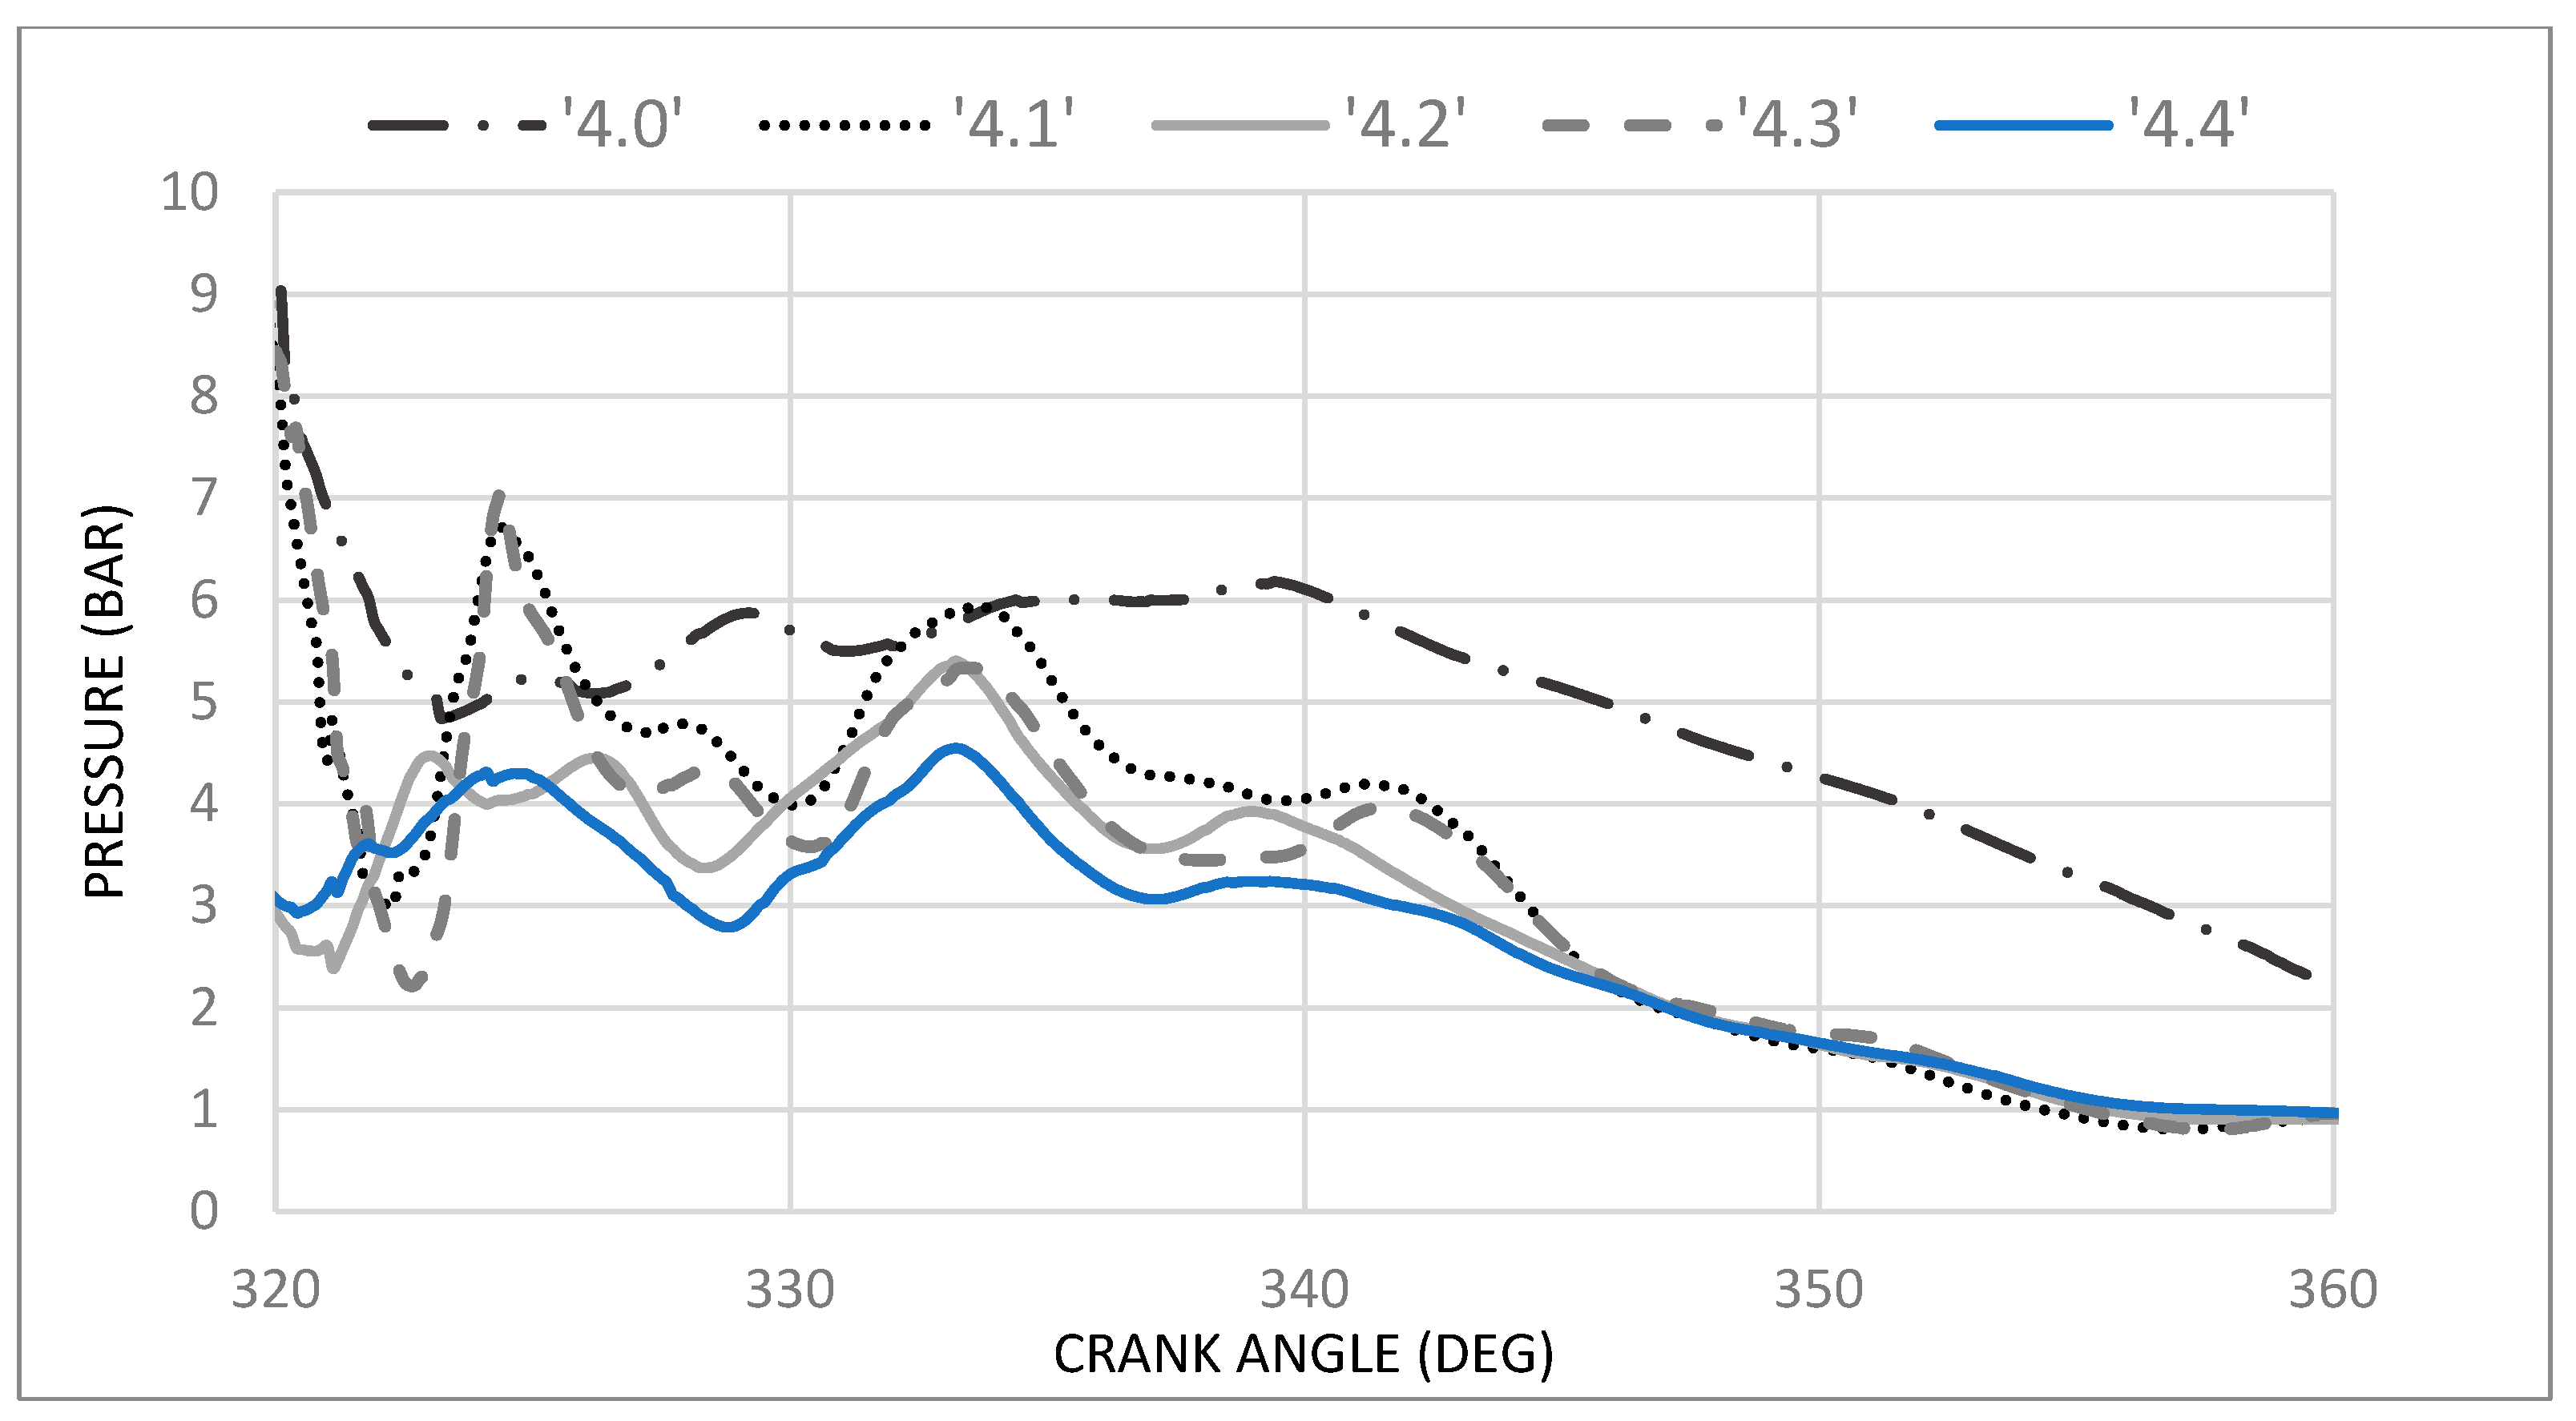
Figure 4 with label 5), which is also the compressor output pressure, at the end of the compression process. This peak pressure is also the output pressure of the compressor.
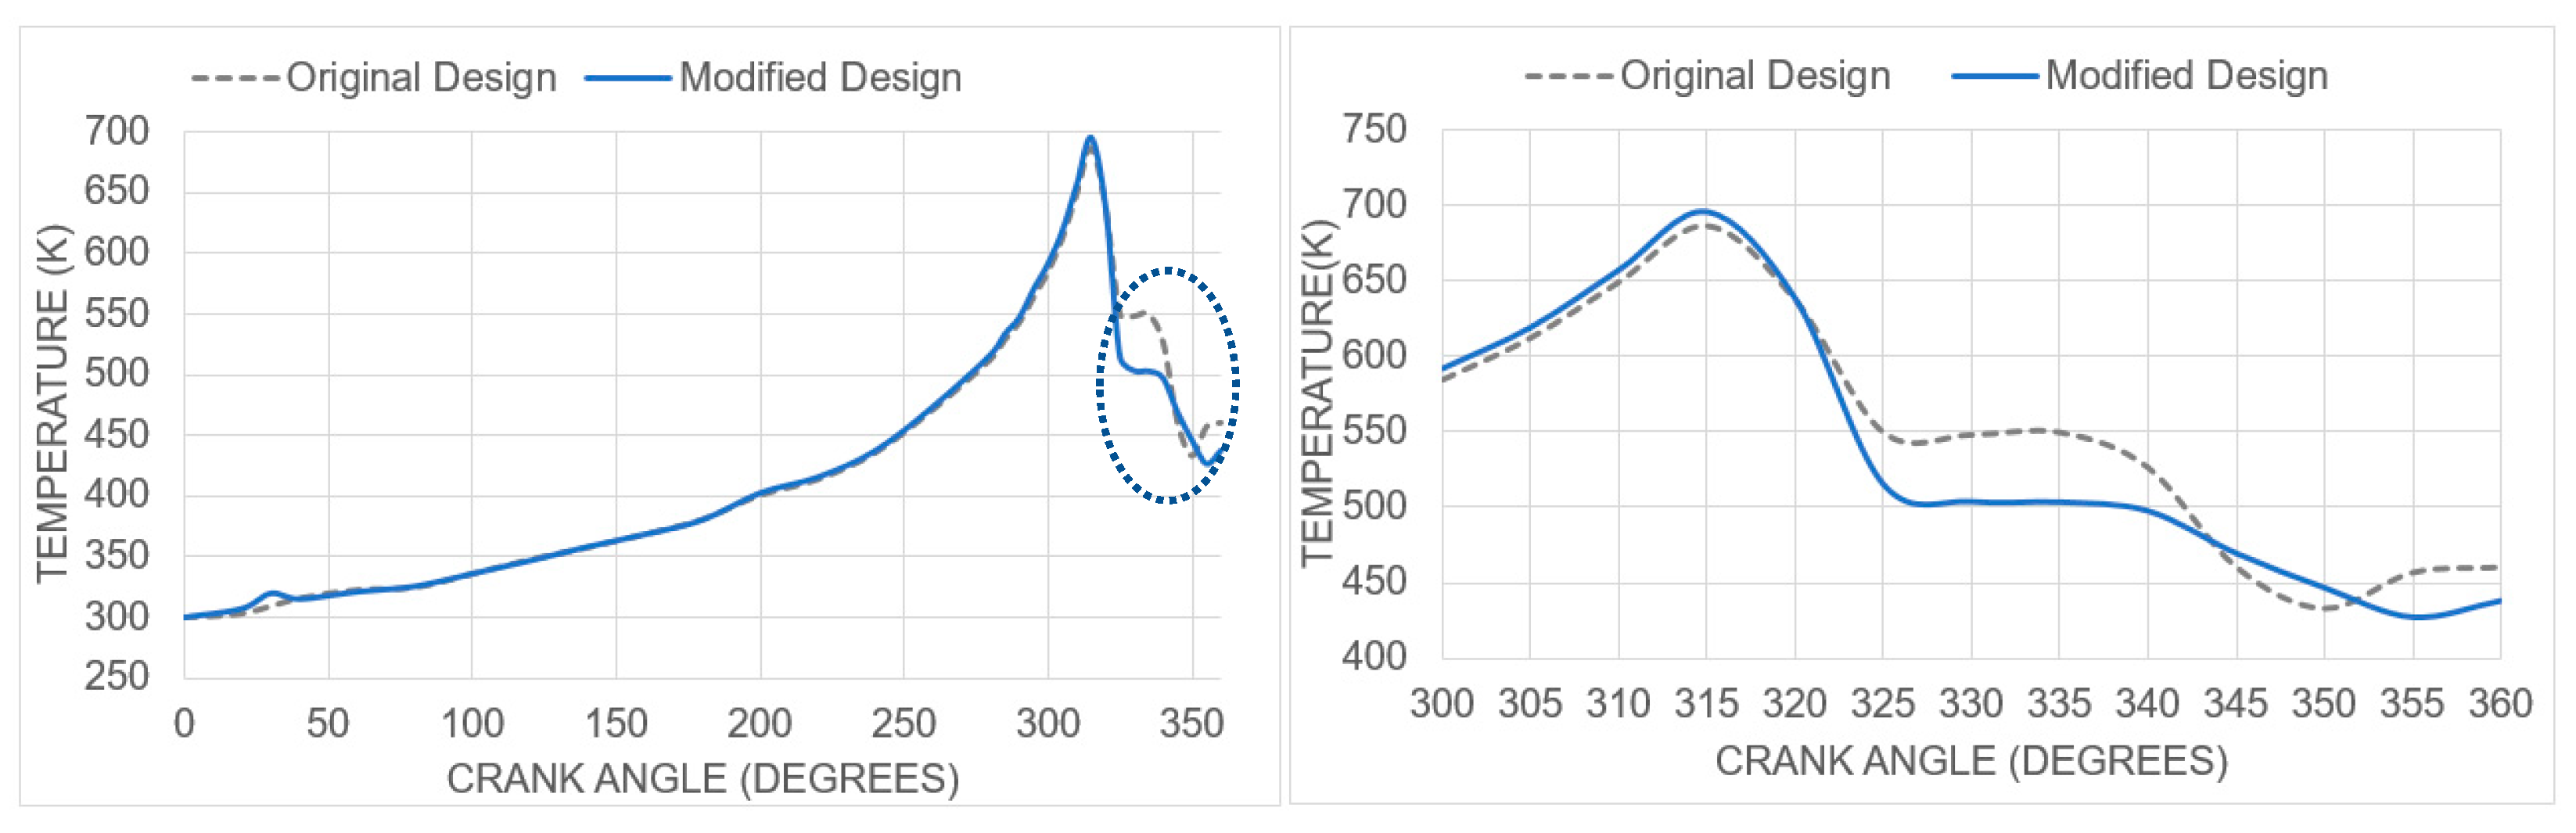
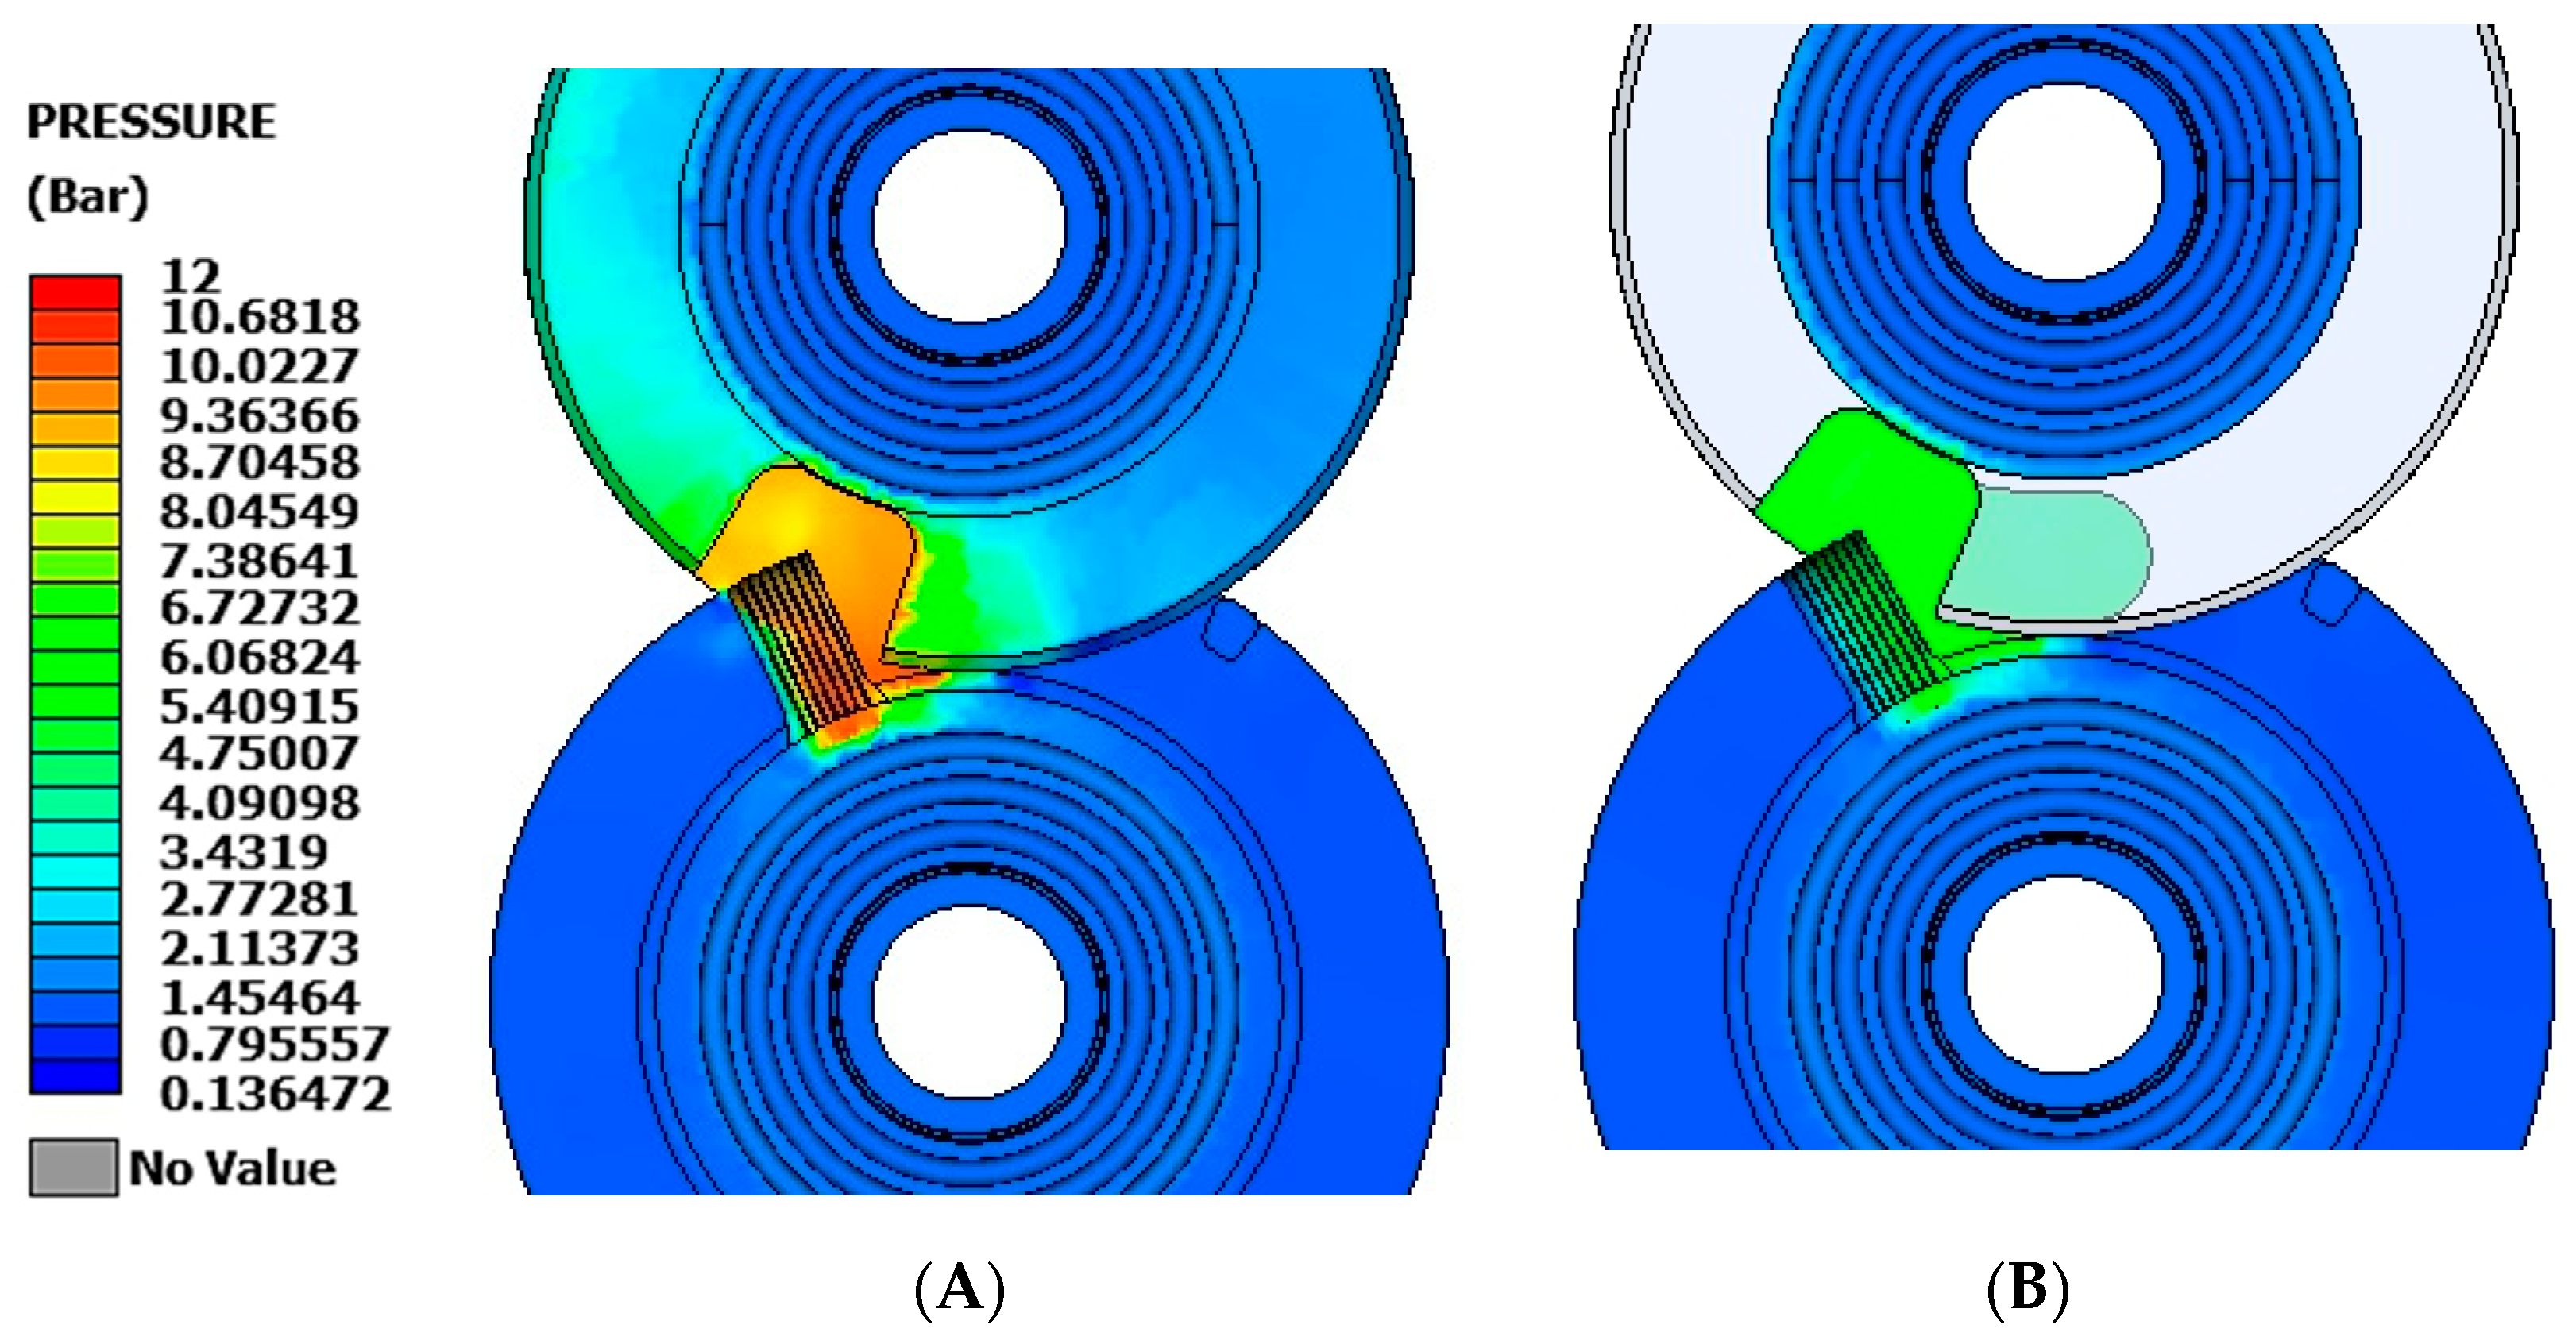
However, when the piston enters the cavity, the air trapped between the front side of the piston (1) and the cavity (4) develops a secondary peak pressure (as shown in Figure 4, labeled as 6). This secondary peak pressure creates an undesired negative torque that resists the free motion of the piston before the compression process starts again. As a result, this torque leads to energy loss and an undesired temperature rise at the front side of the piston, which requires an additional cooling load for the piston.
To address this issue, this paper presents four cavity designs that reduce the secondary peak pressure and further enhance the efficiency of this rotary technology. Three of the designs involve a cavity created through CNC machining, while the fourth is produced using a 3D printing process.
The study will use the SARC compressor design, which was developed by the SARM project company, for all case studies. In the SARC compressor, the rotating components do not come into contact with any stationary parts of the machine, resulting in low friction only at the bearings. The frictionless motion of the rotating components and oil-free operation of the assembly lead to low construction and maintenance costs. Additionally, it is worth noting that this concentric rotary technology can achieve higher speeds than reciprocating and eccentric rotary compressors since it does not experience any inertial forces that alter their direction during operation. This rotary technology has a compact and simple design with high isentropic efficiency.

2. Materials and Methods

First, a watertight 3D fluid model was created in the pre-processor ANSA [17], and after the property IDs and boundary conditions were defined, the file was exported in an STL format to use in the CFD solver (here, CONVERGE) [18]. This solver can construct a polyhedral mesh automatically, accelerating the pre-processing procedure. The machine speed was set to 4000 rpm, and the base grid size was defined as 0.02 m in each of the three Cartesian directions (X, Y, Z). Unlike eccentric rotary compressors such as variable displacement vane pumps [19], the concentricity of this compressor enables it to operate at high speeds. However, even rotary vane compressors [9] run at speeds higher than 4000 rpm, and screw compressors exceed 6000 rpm [20]. For this compressor, 4000 rpm is not the highest possible speed. Its weight-balanced design, which is pending patent submission before publishing the design, allows for even higher speeds. Theoretically, it can run at the same rotational speed as a gas turbine (e.g., 30,000 rpm). However, according to CFD simulations, the current compressor design shows its highest pressure ratio (22.8) at 4000 rpm and its highest efficiency at 6400 rpm. High speed is essential to maintain sealing efficiency. Furthermore, a high flow rate is beneficial for heavy-duty industrial applications. A high flow rate due to high speeds results in a smaller and lighter machine compared to other commercially available compressors. On the other hand, the higher the speed, the higher the flow rate. Therefore, if the application requires a low flow rate, the piston should rotate on a smaller circular orbit around the main compressor shaft or even have a smaller diameter to maintain high speed. Concerning the boundary conditions, the walls were considered without roughness to achieve faster convergence. The zero roughness does not negatively influence the result’s accuracy because the focus is on the different geometries and not the most realistic possible simulation result approach. The working fluid was air, which obeys the Redlich-Kwong equation of state because it is more accurate than the Van der Waals or the ideal gas equations [21].
As shown in Table 1, to improve computational accuracy and efficiency, a grid-independent analysis was performed using three mesh refinements. Specifically, the mesh was doubled after each refinement stage (1M, 2M, 4M). The density of the grid has an important effect on the simulation results. The Gird Convergence Index (GCI) of the peak pressure was calculated for the three different meshes, based on the Richardson extrapolation method [22]. Finally, the 2M cells grid was selected for the final simulations.
The grids near the walls were refined to better capture the boundary-layer flow due to the high-velocity gradient at the wall [23]. To meet the turbulence model requirements for the boundary-layer mesh, the average y+ of all labyrinth walls at the rated flow rate was set to 75, while the average y+ around the piston side walls was 150, and on the chamber walls was 35. The acceptable range of y+ values for a Reynolds-averaged Navier–Stokes (RANS) turbulence model such as the RNG k-epsilon model is generally between 30 and 300. At very low y+ values, the near-wall region is highly influenced by viscous effects, and the wall functions used in the RNG k-epsilon model may not be valid. On the other hand, at high y+ values, the turbulence model may not accurately capture the near-wall flow physics, which could result in inaccurate predictions of the flow behavior. Therefore, it is essential to ensure that the y+ values for the RNG k-epsilon model fall within the acceptable range to ensure accurate and reliable simulations of the turbulent flow.
The solvers, solver parameters, turbulence models, and relevant assumptions made in this study are summarized in Table 2.
The turbulence model comprises the RNG k-ε equations since it has been proven that those equations can improve the accuracy in the cases of rotating flows [21].
The post-processor META was used for the model visualization and animation. The geometry and the results files were loaded into the software, and after analyzing each state with the old and the new geometry proposed, the primary and the secondary peak pressure points were recognized and compared. The same procedure was followed for the temperature.
The number of cycles convergence criterion was the calculation of the maximum pressure and temperature observed at the end of each compression cycle, and an acceptable difference between the calculated pressure and temperature for the different cycles was 3%. Each case was simulated for five or six cycles for the primary peak pressure to reach a constant value.
There is no discharge port in the compression chamber; it is chosen to be blind because the position, size, and timing of a discharge port significantly affects the performance of a rotary compressor. After the piston completes the compression process, the isolator connects the two chambers. This approach was chosen to create a proof of concept for the sealing method of the compressor and to minimize uncertainties. The goal of the proof of concept was to achieve the highest possible pressure with no leakage to the environment and minimal leakage around the piston’s toroidal wall.
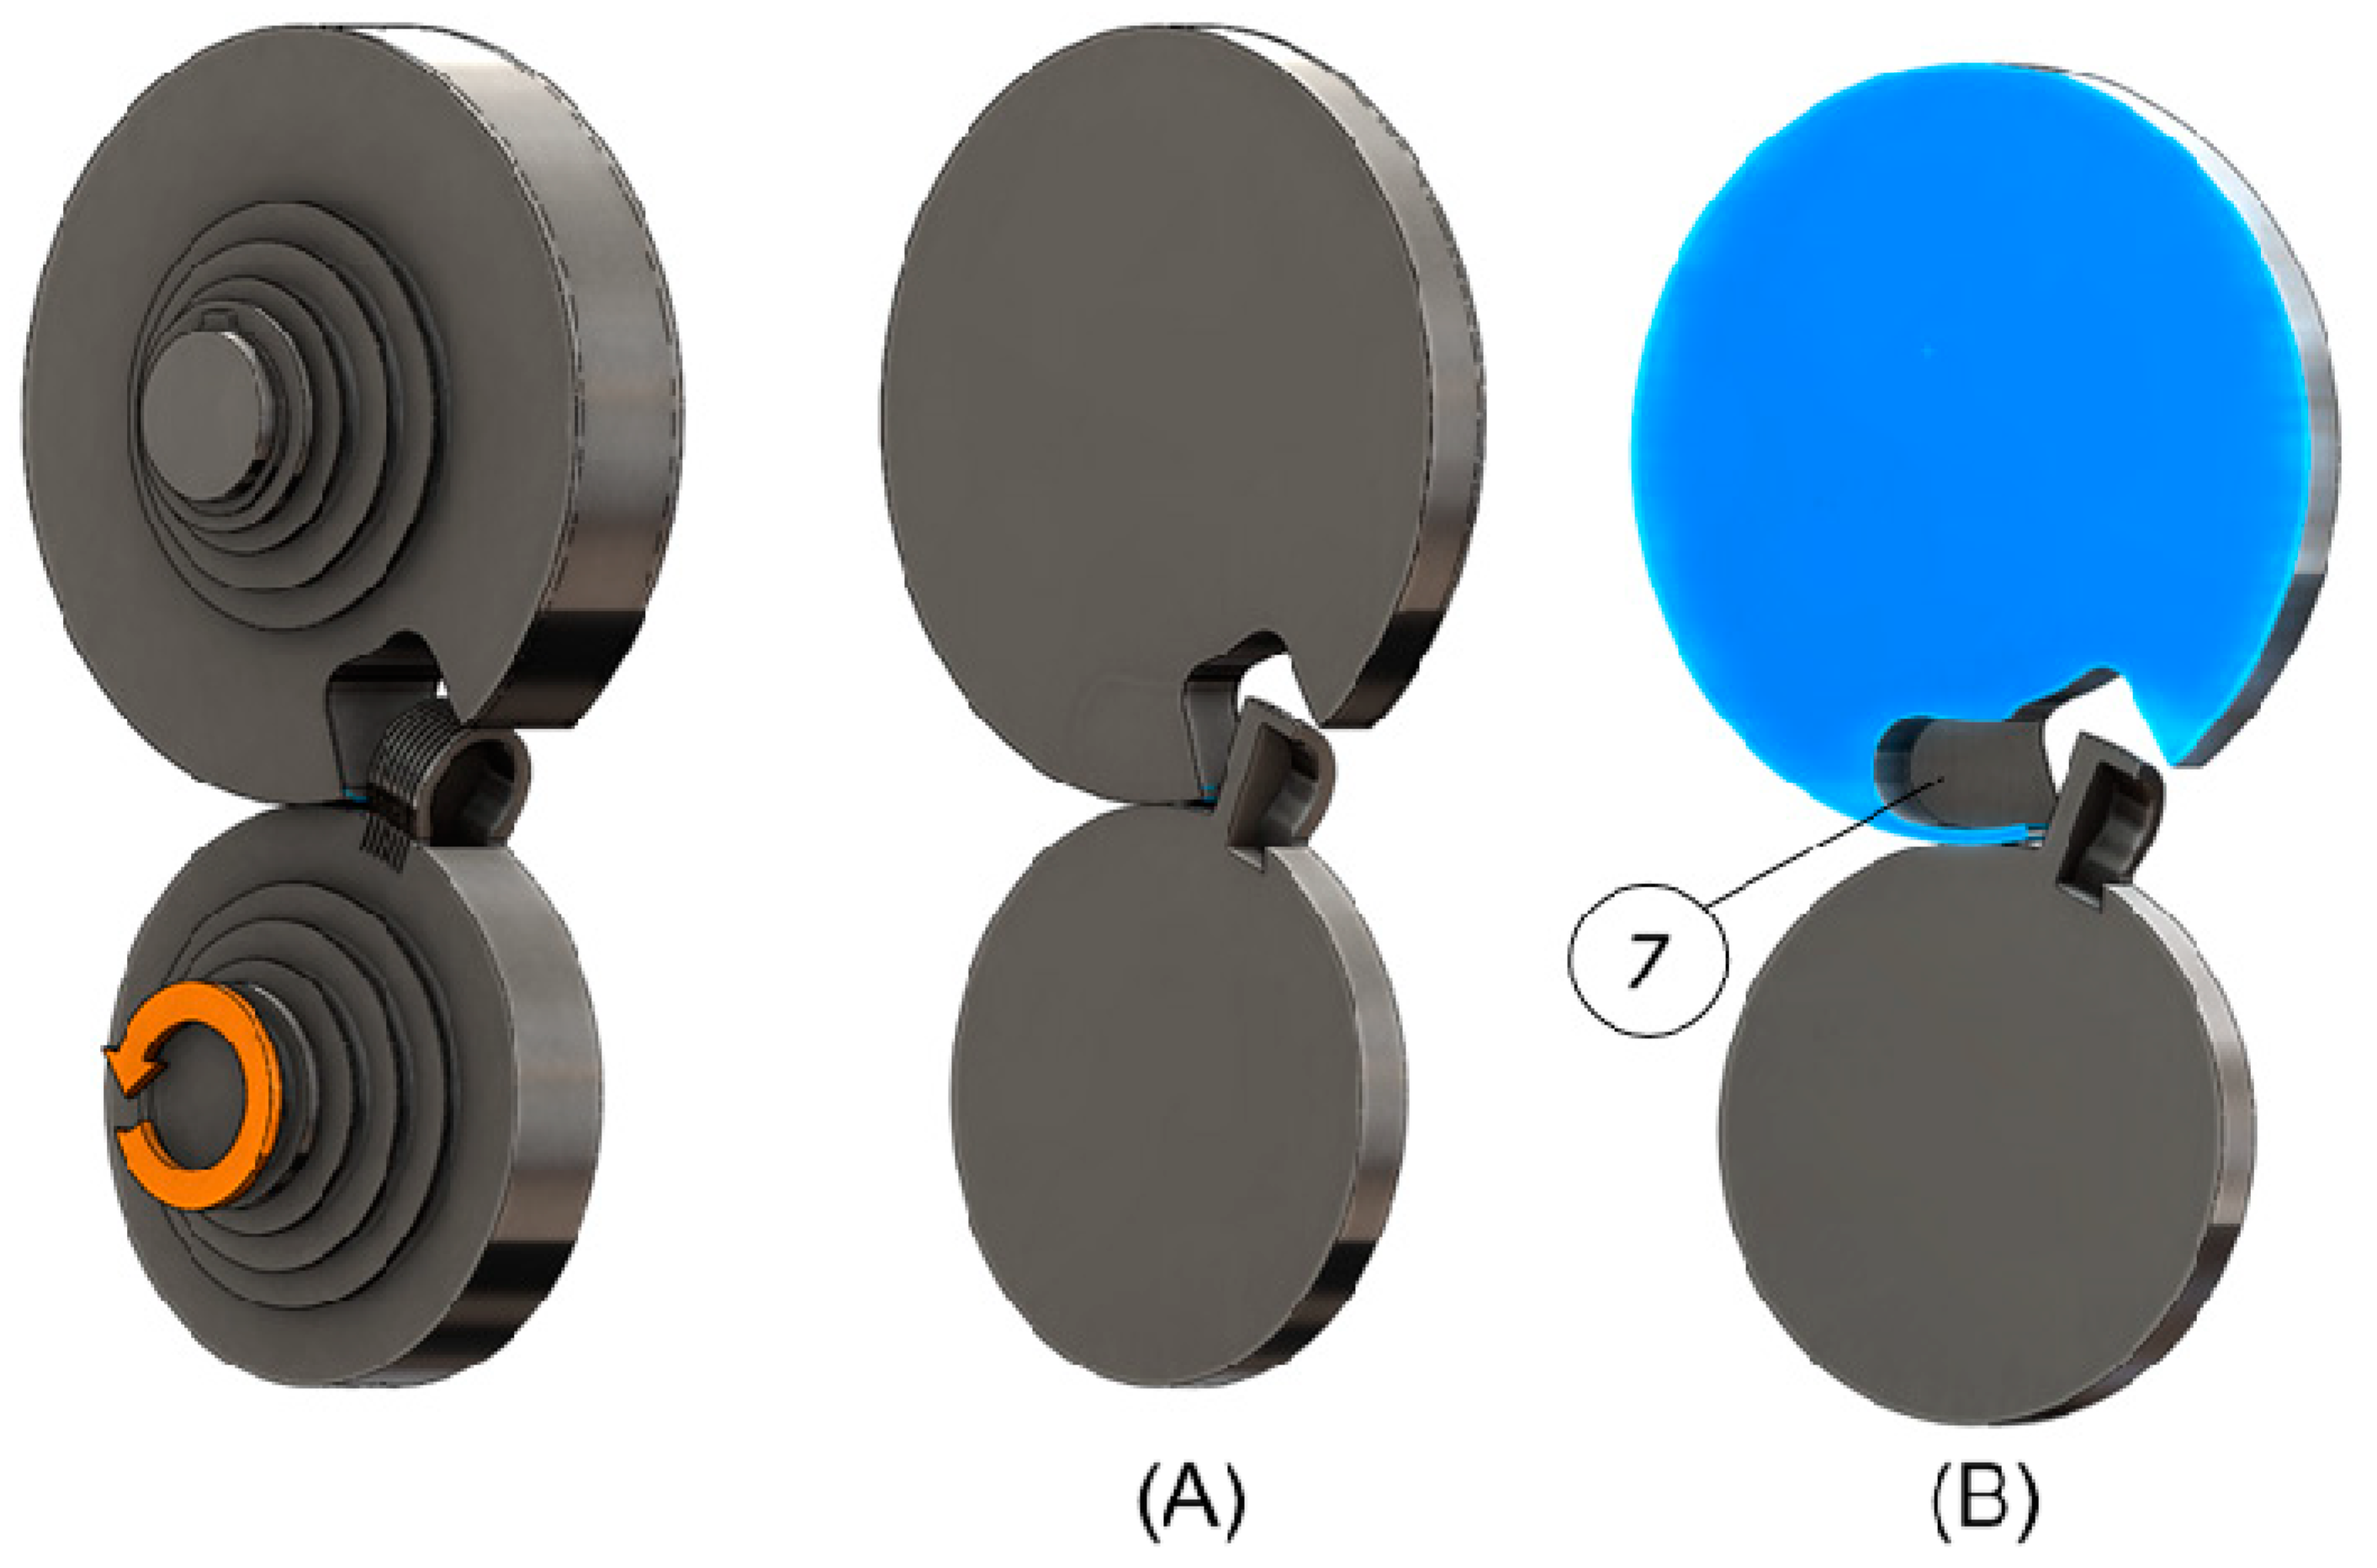
The position and size of the suction port were chosen based on an optimization study conducted before this study (pending paper approval). The optimal position for the suction port (7) is tangential to the outer periphery of the intake chamber and as close as possible to the isolator periphery. Its design should be circular and as small as possible, given the specific compressor size (in this case, the diameter is 12.5 mm—Figure 5).
The secondary cavity wall thickness of 5 mm was determined to be the minimum acceptable thickness after conducting structural analysis for the specific isolator size and the pressures and temperatures calculated for the optimized cavity design (design 4.4—please see the results and conclusions section for more details). 
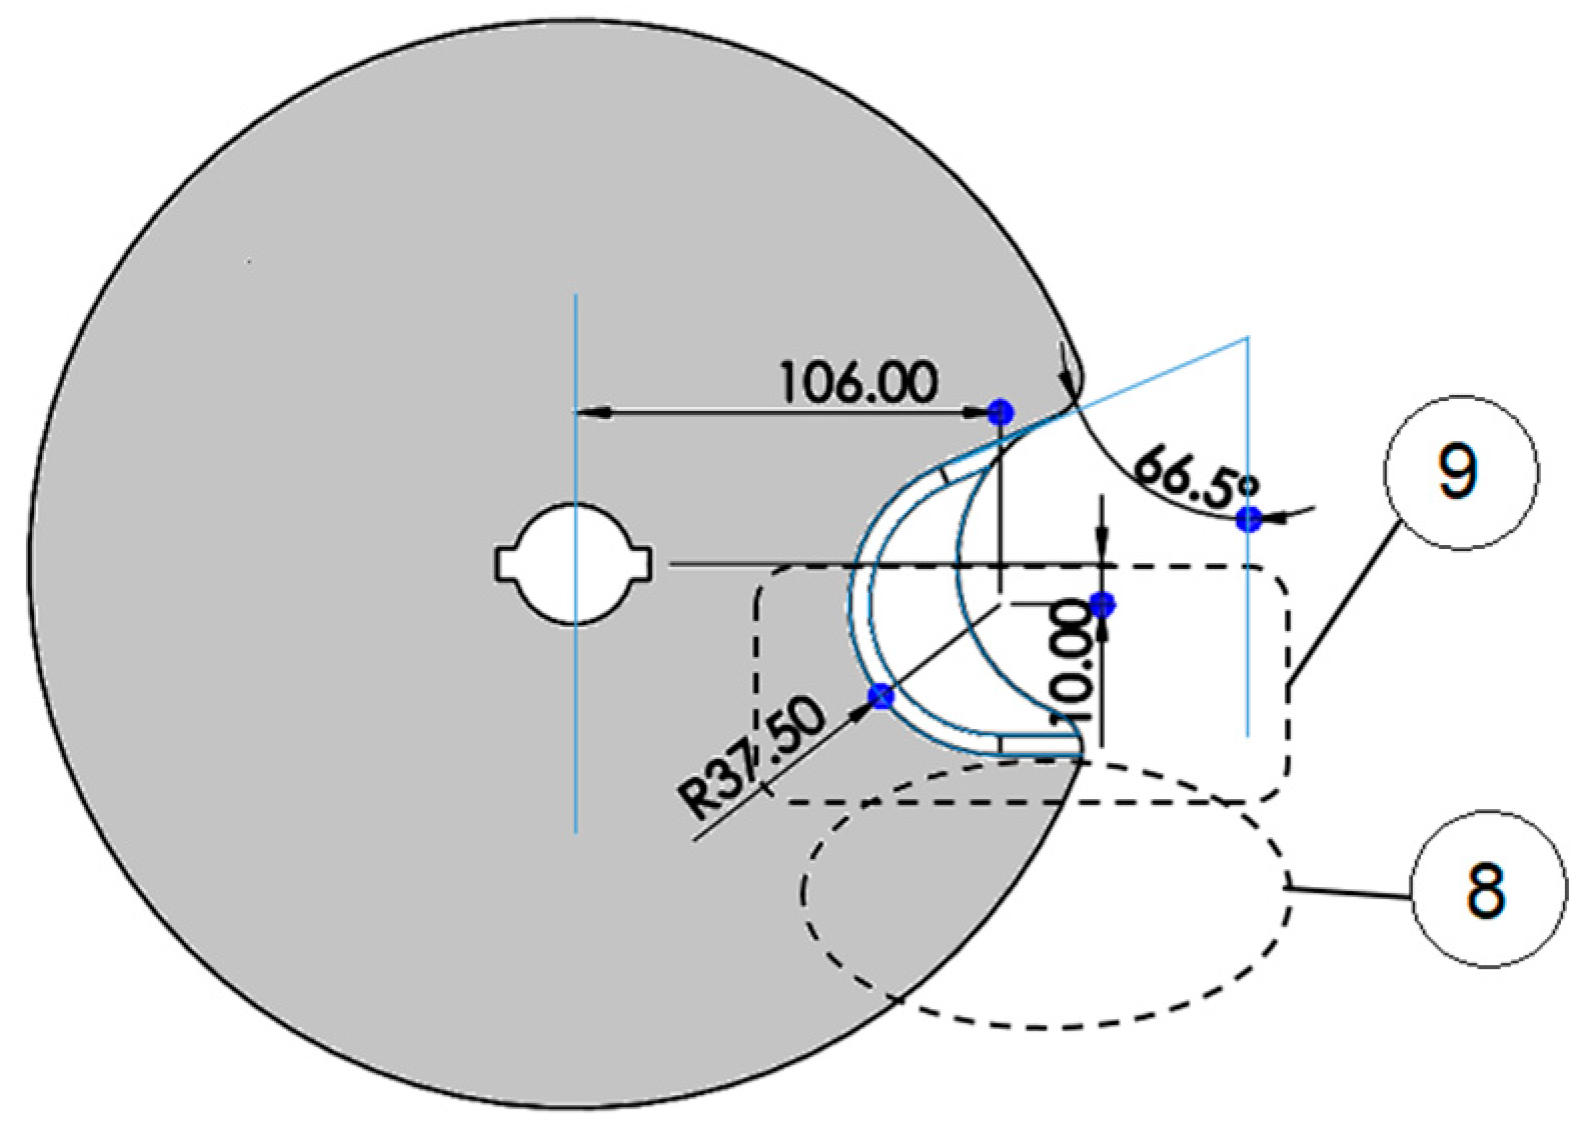
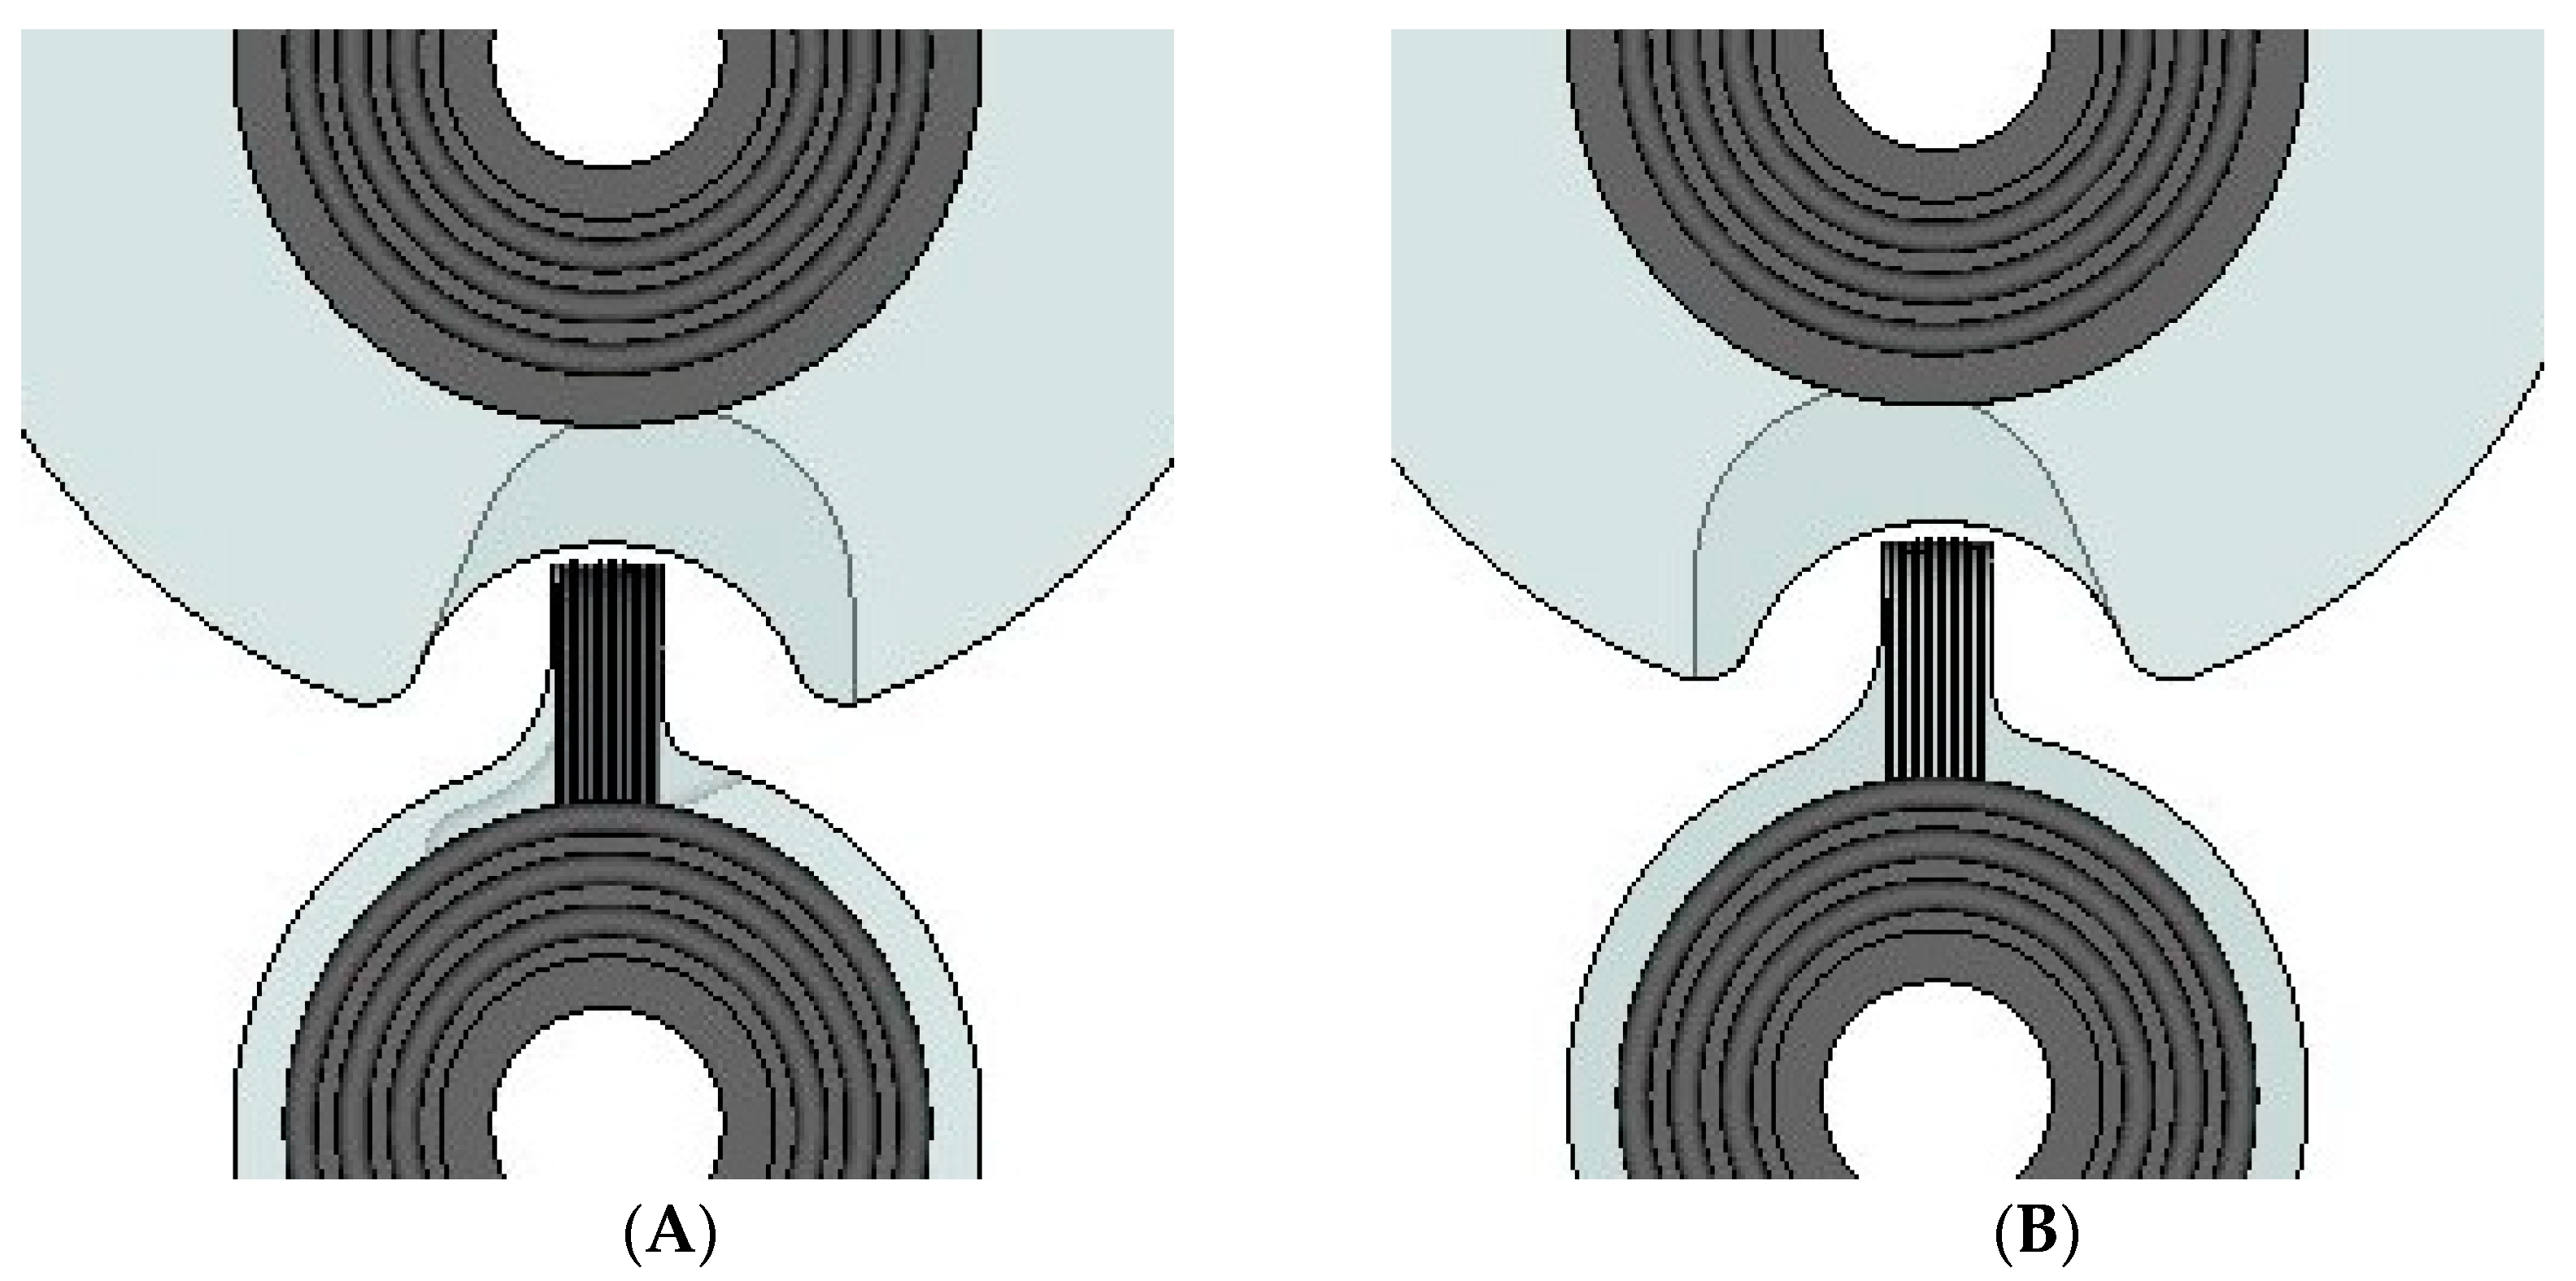
Figure 6 illustrates the structure and dimensions of the isolator cavity. The design was based on the goal of creating a cost-effective design for CNC manufacturing. Therefore, it was crucial to enable an accessible approach for the cutting tools, and tangential directions were chosen for all direction changes to simplify the cutting process, avoiding the use of a complex 3-axis or higher-axis cutting process. The region (8) is where the peak pressure is developed. The cavity is asymmetric to offer more free space at the front side of the piston so that the air trapped at the piston’s front to expand inside the region (9).

3. Results

3.1. Proposed Solution

The study aims to offer a new perspective on improving the isentropic efficiency of concentric rotary technology by reducing the negative torque created when the piston passes through the isolator rotor. For this purpose, a secondary cavity in the isolator rotor, presented with four different designs, is proposed to reduce the secondary peak pressure. This way, the air trapped between the piston and the main cavity can expand inside the second cavity, decreasing the negative torque created when the piston enters the isolator cavity. Additionally, the temperature stays lower when the secondary cavity is present, resulting in lower cooling needs for the entire system. This study compares the original isolator rotor without a secondary cavity with four other cavity designs. One design is possible to create only with 3D printing technology, and the other three with CNC machining. This study compares the different designs to evaluate the best possible solution.
The isentropic efficiency was calculated by comparing the PV diagram obtained from the simulation results with the PV diagram obtained from the isentropic process. The isentropic process was calculated based on the final peak pressure achieved at the end of the compression process. In other words, the isentropic PV diagram represents the theoretical minimum energy required to achieve the peak pressure attained during the simulated compression process. For instance, for the final best geometry at 7000 rpm, the CFD analysis estimated a peak pressure of 68 bar. Based on the CFD results, the red PV diagram was created, and then the blue PV diagram of the isentropic compression process was created for the same peak pressure (Figure 7). The consumed work was estimated based on these PV diagrams, and the isentropic efficiency was defined as the fraction of the two works (95.66%).
Observing Figure 7, it is worth noting that the isentropic process starts from ambient pressure, while the simulated process starts from higher pressure (3.15 bar). This is because of the specific compressor design which creates a pressure wave when the isolator communicates the compression with the intake chamber. This wave, while traveling along the intake chamber, drags extra intake air, supercharging the compressor. After five to six cycles, this phenomenon stops effectively supercharging the intake chamber due to the chosen sealing method’s efficiency. The higher the speed, the higher the achieved intake pressure. For instance, at 10,000 rpm, this phenomenon can reach an intake pressure of 7 bar. For the same reason, the volumetric efficiency is over 100%, something not necessarily new for rotary compressors [9].

3.2. Initial Geometries

Figure 4 presents the rotary machine with the common cavity (5) (met in all existing patents) that has the smallest possible size just to prevent the piston to meet the isolator walls.
Figure 8 shows an alternative design that has an extra, secondary cavity (7). The rotation of the mechanism is clockwise. Therefore, the second design has the appropriate extra space at the front side of the piston to allow the trapped air for entering this secondary cavity and expand without increasing its pressure.
Figure 9 and Figure 10 are the results of a CFD analysis and present the pressure and temperature developed during one compression cycle at the front side of the piston as a function of the rotation angle. The two plots compare the two geometries (Figure 1 (original design) and Figure 8 (modified design)). There is a significant drop of nearly 4 bars (41%) in the secondary peak pressure when an extra cavity is present (Figure 9). The same phenomenon appears with the temperature, with a difference of 46.79 Kelvin (8.51%) (Figure 10).
Table 3 compares the two peak pressure points (primary and secondary) along with the crank angle for the two different geometries.
Figure 11 shows that in the primary peak pressure point, the pressure in the modified design does not differ from that of the original design. However, Figure 12 shows that the secondary peak pressure decreases significantly when an extra cavity is present (modified design). In other words, the only significant difference occurs at the secondary peak pressure point, and the inserted extra cavity does not affect the pressure and temperature at any other crank angle position.
Figure 12 depicts how the pressure of each design is developed at the secondary peak pressure point. The best design is 4.4 presenting the lowest secondary pressure.

3.3. Alternative Geometries

The 3D printing technique is undoubtedly less cost-efficient than CNC machining when manufacturing a part of such a large size. Four different geometries that can be manufactured with the CNC machining technology were created and presented below to balance the cost along with the secondary peak pressure drop.
For a better understanding, the 3D printed geometry (modified design) will be referred to as design 4.0 and the others created by CNC machining will be referred to as designs 4.1, 4.2, 4.3 and 4.4, as depicted in Figure 13 and Figure 14. It is important to mention that the 4.1, 4.2, 4.3 and 4.4 designs perform counterclockwise concentric rotary motion.
The idea behind the first two geometries (4.1 and 4.2 in Figure 13), was to create an asymmetric cavity, examining its orientation in relationship with the rotary motion (counterclockwise) as it plays a fundamental role in the development of the primary and secondary peak pressure. Design 4.1 gives more space to the compressed air to expand at the front side of the piston, and design 4.2 gives more space to the compressed air to expand at the back side of the piston. In Figure 14, designs 4.3 and 4.4 are the same designs as 4.1 and 4.2, but the side walls around the extra cavity are removed to make the CNC machining more cost-efficient. If the secondary peak pressure does not differ significantly from design 4.3 or 4.4, then it is preferable to use design 4.3 or 4.4 rather than any other proposed modified design. Eventually, as depicted in Figure 15, design 4.4 is not only a cost-efficient solution but also the best solution as far as the secondary peak pressure is concerned.
Table 4 presents the exact pressure values at the secondary peak pressure point for the five different modified designs.
As also observed in Table 4, design 4.4 appears to have the lowest secondary peak pressure compared to all five geometries.

4. Experimental Setup and Validation

All parts were constructed from Aluminum 7075-T6 and assembled in the rotary compressor, as shown in Figure 16. The experiments are conducted in the Laboratory of Applied Thermodynamics (Aristotle University of Thessaloniki), an associate member of EARPA (European Automotive Research Partners Association) that is also certified by QMS, conforming to the requirements of ISO 9001:2008. For measuring the pressure, the AVL X-Ion high-speed, modular data acquisition system and power analyzer were used. The AVL X-Ion is capable of reading signals at very high-frequency sampling rates (>100 kHz in this case) provided by the Kistler 5011 signal amplifier connected to the in-cylinder pressure sensor. The compressor was driven by a variable frequency motor which is set to a constant speed of 2576 rpm in the experiment. The outlet pressure was measured by the outlet pressure sensor, located at the position where theoretically the peak pressure would be developed. Interestingly, the measured peak pressure at 2576 rpm did not differ essentially from the CFD results. CFD simulations refer to the first five rotations with a peak pressure of 20.477 bar, whereas the measured rotations during the test were more than 1000. As shown in Figure 17, the peak pressure fluctuates between the values of 15.53 and 21.29 bar.

5. Discussion

Table 4 shows the best design (4.4) with a 3.54% decrease in the primary peak pressure and 130% in the secondary peak pressure (from 10.41 bar to 4.52 bar), compared to the commonly used tight cavities of the patents (Figure 1). Design 4.4 has no extra cavity but a bigger cavity (extended cavity) than the tight cavity of Figure 1. Although the primary peak pressure point slightly decreases, there is a significant difference at the secondary peak pressure point. Similar to pressure, the temperature drops to 80.83 K (16.7%) at the secondary peak pressure point compared to the tight cavity geometry. The results verify the initial assumption, and it is worth mentioning that as the volume of the extra or extended cavity increases, the secondary peak pressure and temperature decrease even more. As a result, there is a decrease in the cooling needs of the system as well. Sensitivity analysis between the size of the cavity and the pressure/temperature drop is the next step for future work.
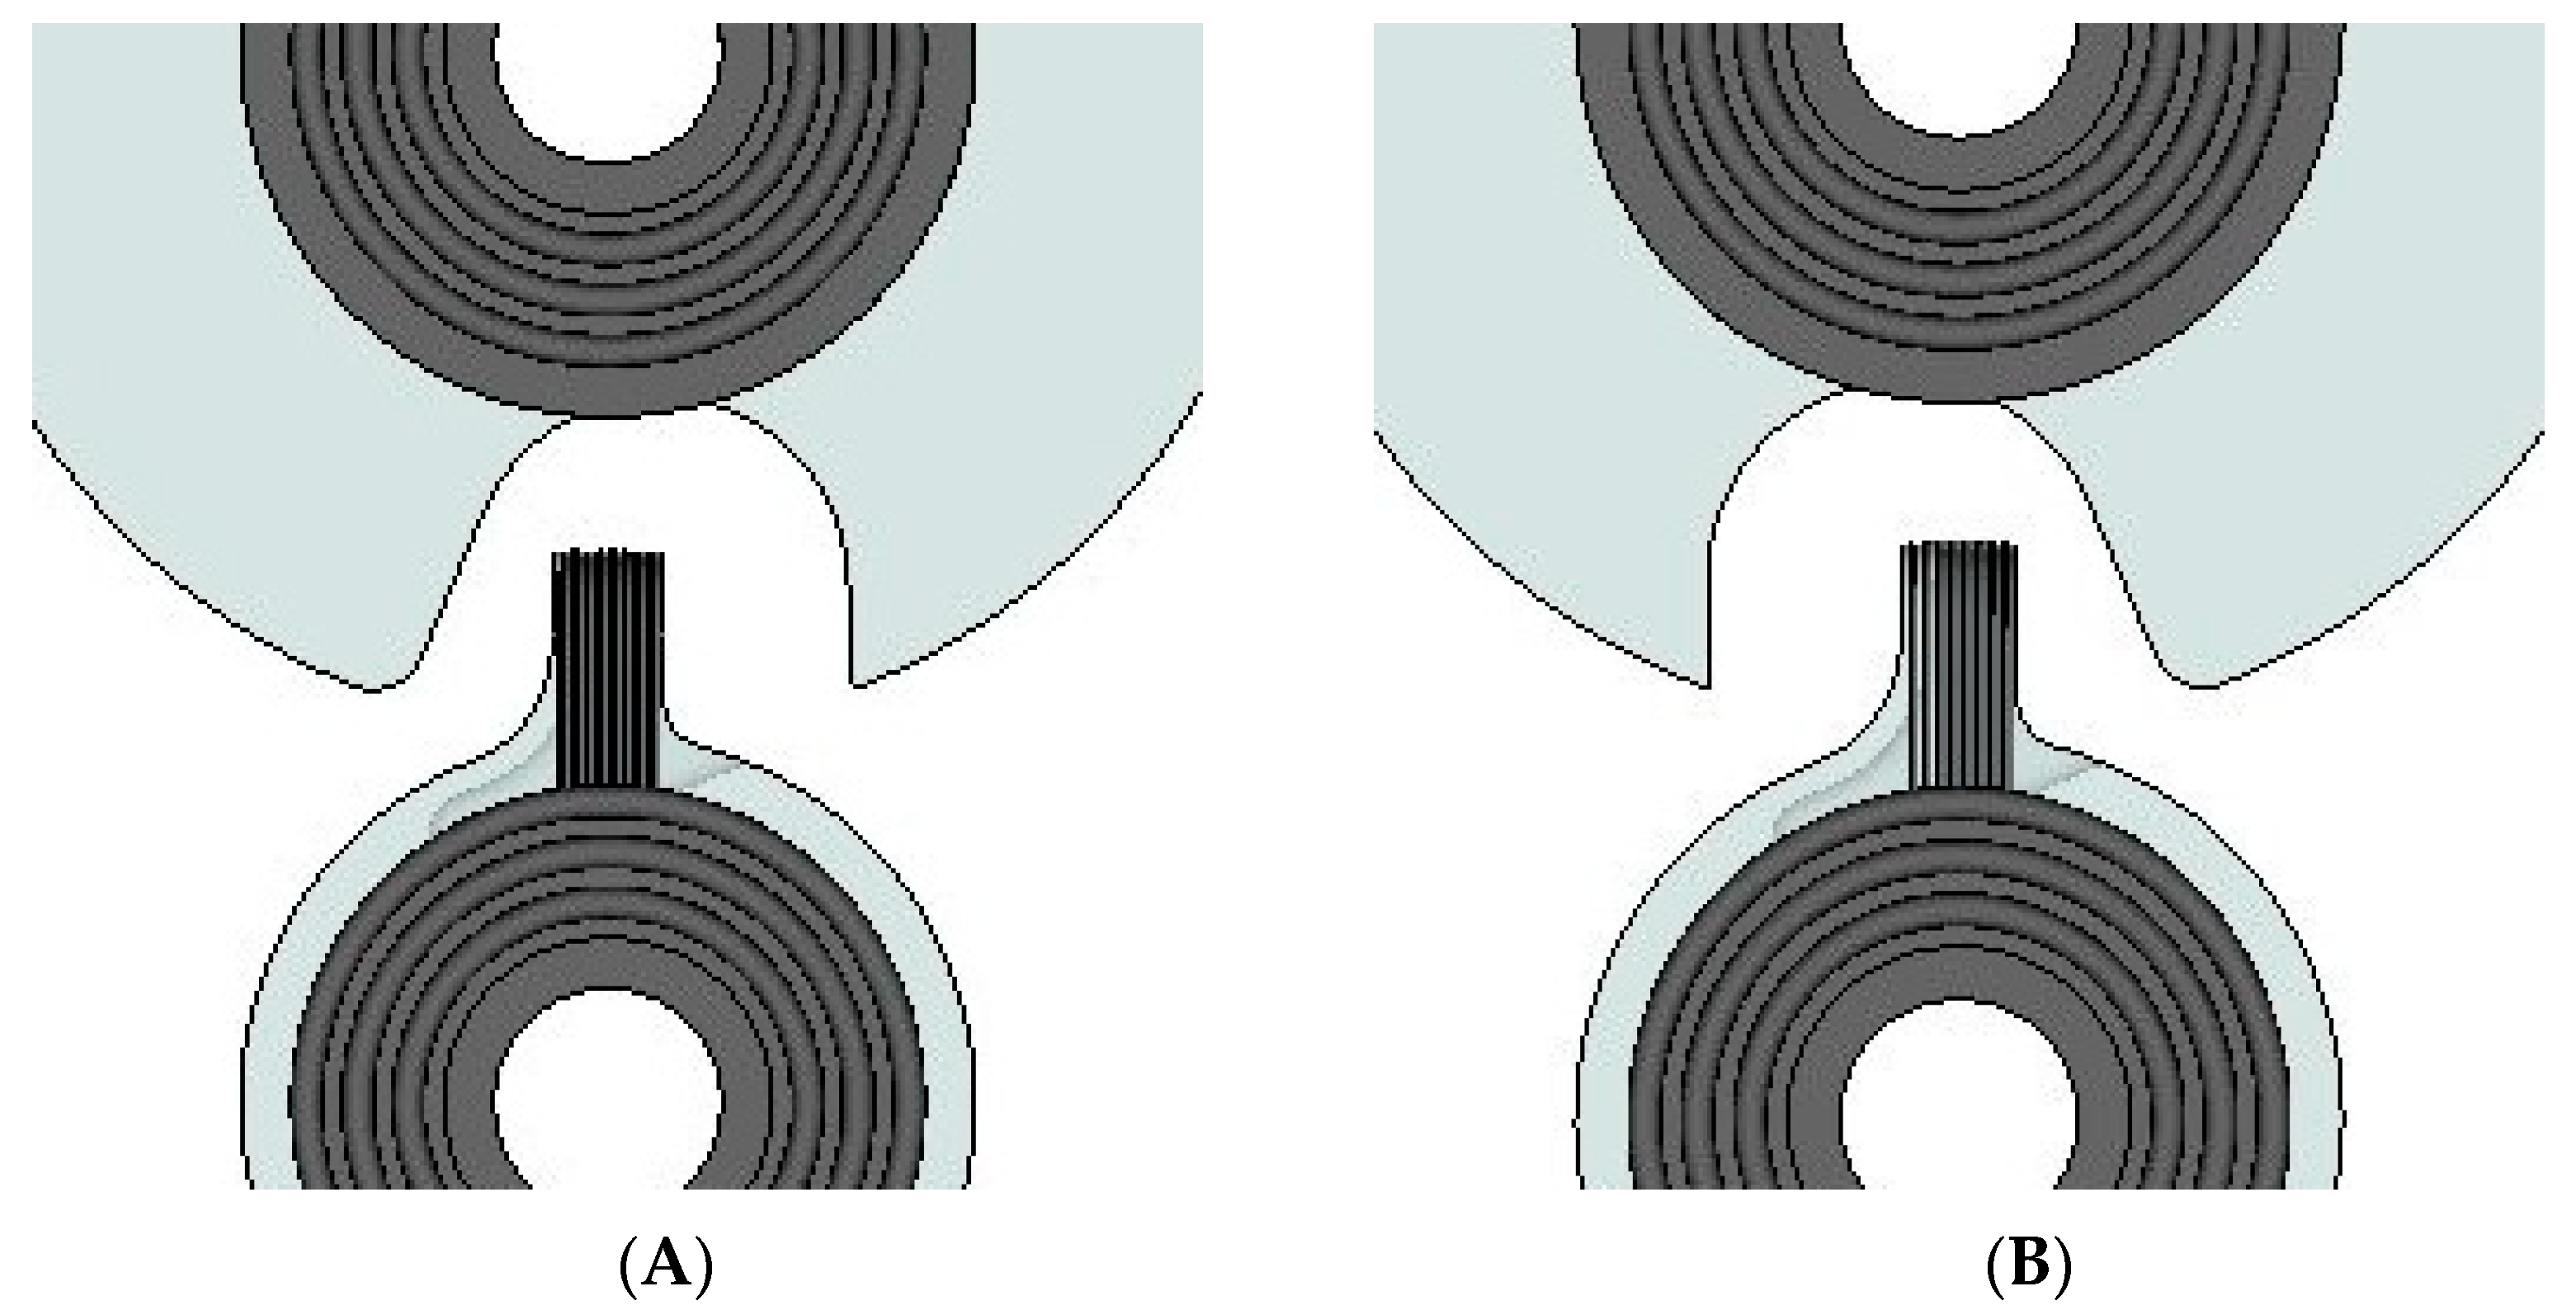
When comparing the extended cavity created by 3D printing (Figure 8) with the cavities created by CNC machining (Figure 13 and Figure 14), only 4.2 and 4.4 geometries have a lower secondary peak pressure compared to 4.0. Since the 4.4 design has the lowest secondary peak pressure and can be manufactured with CNC machining at the lowest cost compared to the other alternatives, it is attracting the most interest of all.
This approach is qualitative, but the cavity size has an upper limit because when the cavity size increases, the weight balance of the part becomes more challenging. Moreover, 3D printing is a very costly technique for such big parts, and from Table 4, it is clear that it does not offer any additional drop at the secondary peak pressure, compared to the geometries that can be created with CNC machining.
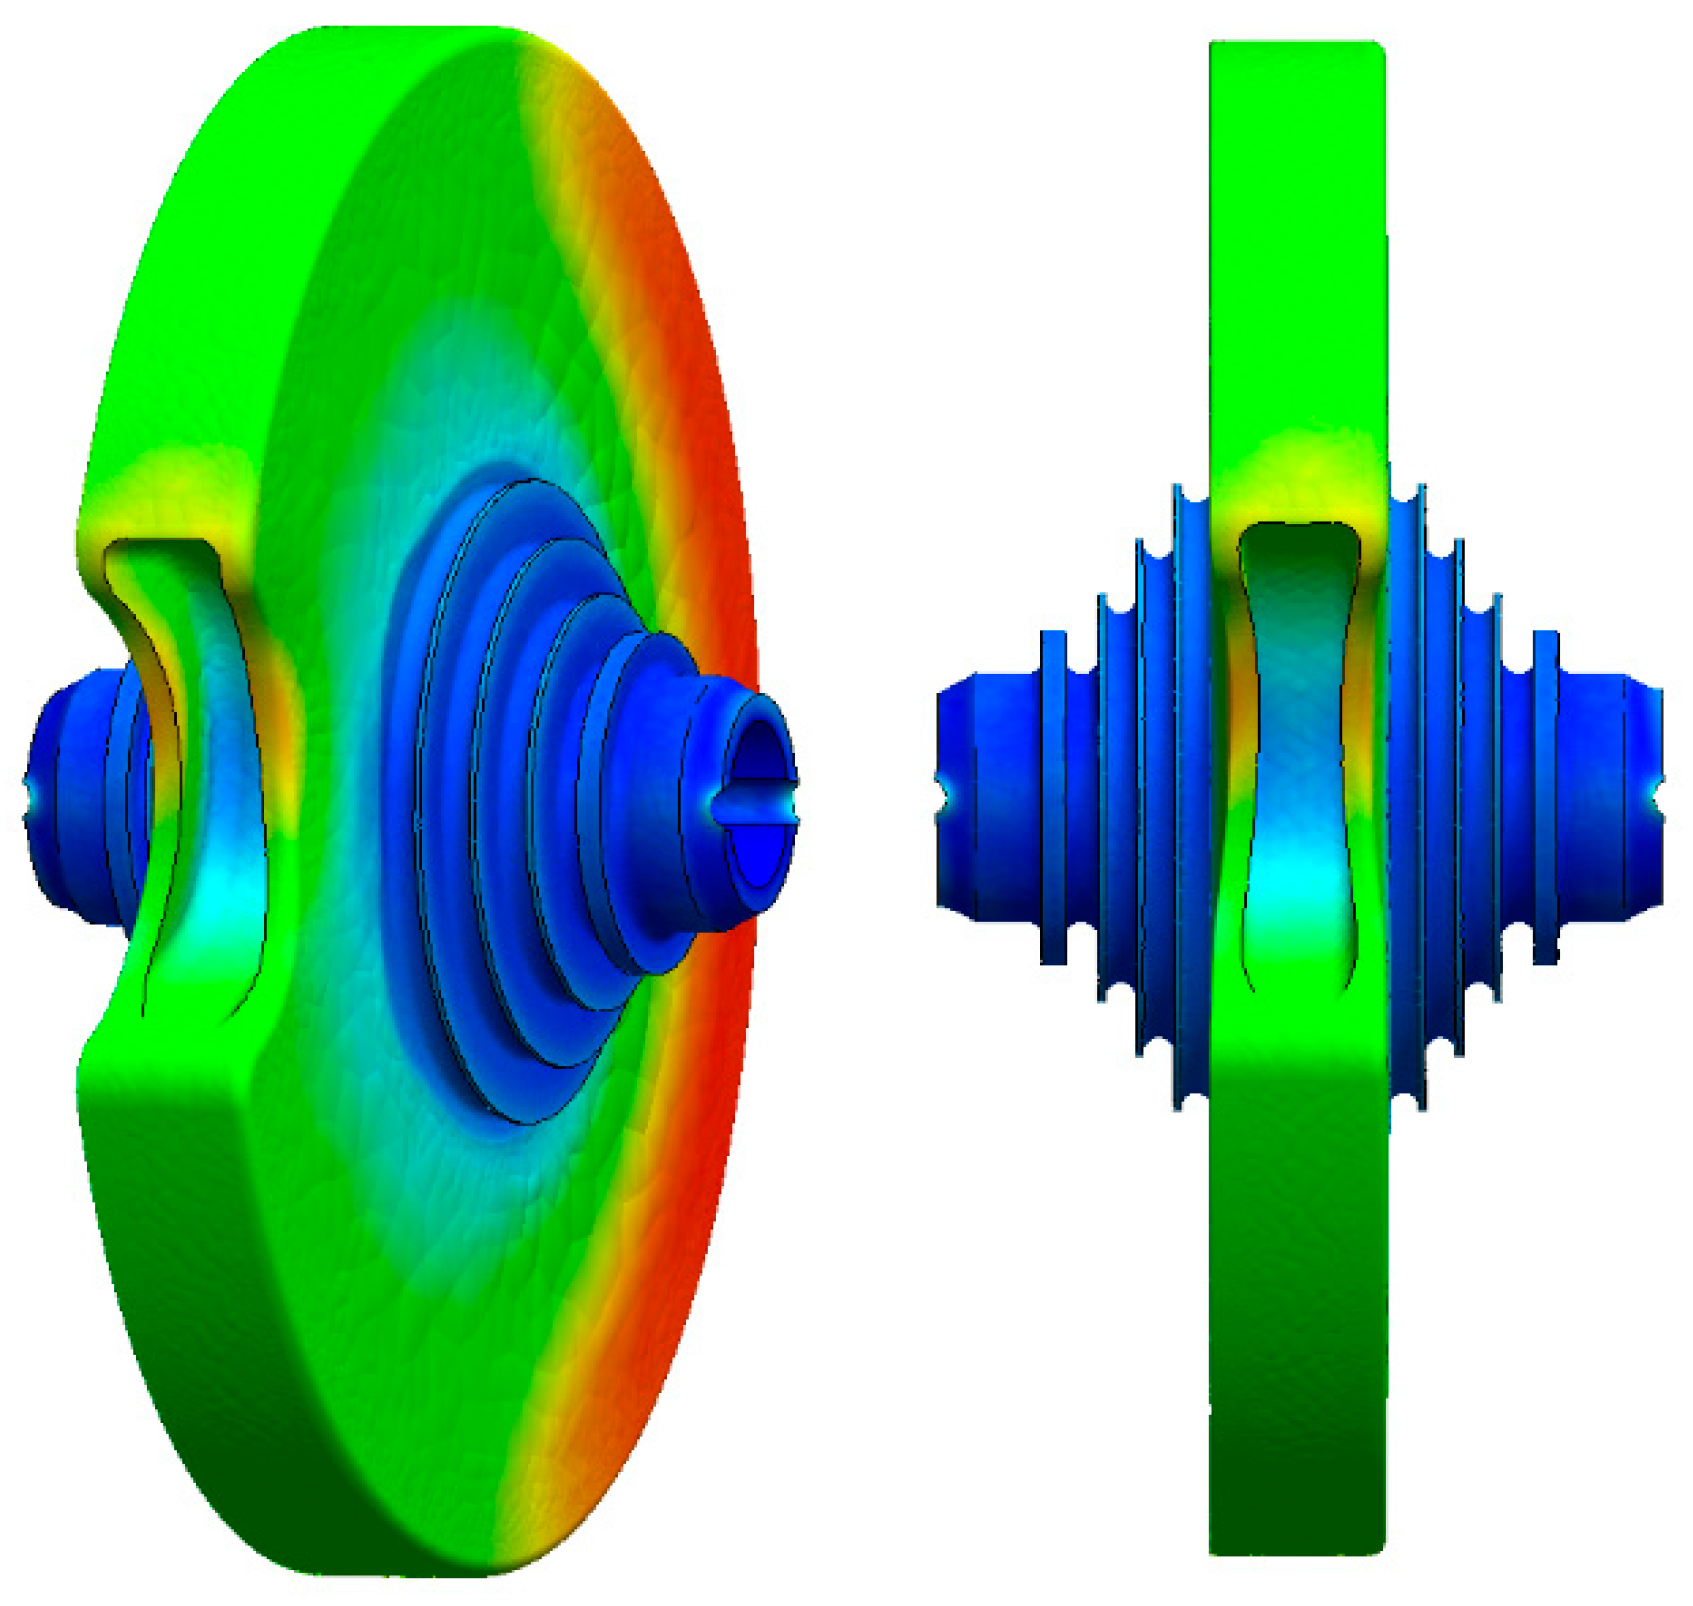
Finally, regarding designs 4.1 and 4.2, there is a limitation regarding the side walls of the cavity. As shown in Figure 18, these designs have a secondary cavity with walls around them. Thus, the thickness of these walls cannot exceed a minimum value. Otherwise, the applied stresses on those walls will cause significant deformation. Figure 18 below depicts a possible scenario of extreme deformation when the wall thickness is below a minimum value. The minimum value of the secondary cavity thickness needs to be defined in further study and the CFD contour plot presented below only represents a qualitative approach to an extreme case scenario. This can be achieved by changing the thickness of the side walls and conducting simulations and eventually observing the stresses at certain points of the cavity.

6. Conclusions

The main goal of this study was to decrease the effect of negative torque developed when a cavity hosts a piston, by proposing an optimized design for the compressor isolator. This torque develops when secondary peak pressure appears. To decrease this effect, the isolator rotor may have an extended or even secondary cavity that allows air trapped and compressed between the front side of the piston and the main cavity to expand inside the secondary or extended cavity.
This cavity results in the development of significantly lower pressure and temperature when the piston passes through the isolator rotor cavity. Lowering this pressure keeps the compressor efficiency high, and the lower temperature decreases the cooling needs of the system. The used geometries present the problem qualitatively. The secondary cavity size and shape do not represent an optimized result, but it points out the direction in which further research should be conducted. A much lower secondary peak pressure is expected, after optimizing the design. The next step is to define the optimized cavity shape that will also be cost-efficient and reliable, as far as a fatigue analysis is concerned.

Author Contributions

Conceptualization, S.S. and K.Z.; methodology, S.S., K.Z. and G.D.; software, K.Z. and G.D.; validation, S.S., G.D. and K.Z.; formal analysis, G.D.; investigation, G.D. and K.Z.; resources, G.D. and K.Z.; data curation, G.D. and K.Z.; writing—original draft preparation, G.D.; writing—review and editing, G.D. and S.S.; visualization, G.D. and S.S.; supervision, S.S.; project administration, S.S. All authors have read and agreed to the published version of the manuscript.

Funding

This research received no external funding.

Data Availability Statement

Not applicable.

Acknowledgments

We would like to thank BETA CAE Systems & Convergent Science for the offer of their software (ANSA, META and CONVERGE) and their technical support for the accomplishment of this research. ANSA was used for the geometry creation and pre-processing of the CFD model, CONVERGE for the CFD simulations, and META for the post-processing/visualization of the results. Their support was essential and crucial to complete this research. We also would like to thank Z. Samaras and the Laboratory of Applied Thermodynamics for supporting us during our research process by conducting experimental campaigns in their facilities.

Conflicts of Interest

The authors declare no conflict of interest. There are no funders, it is a self-funded study.

References

  1. Bloch, H.P. A Particular Guide to Compressor Technology; John Wiley & Sons, Inc.: Hoboken, NJ, USA, 2006. [Google Scholar]
  2. Radgen, P.; Blaustein, E. Compressed Air Systems in the European Union: Energy, Emissions, Savings Potential and Policy Actions; LOG_X Verlag GmbH: Stuttgart, Germany, 2001. [Google Scholar]
  3. US Department of Energy and Energy Efficiency and Renewable Energy. Improving Compressed Air System Performance: A Sourcebook for Industry; US Department of Energy: Washington, DC, USA, 2003. [Google Scholar]
  4. Cipollone, R.; Vittorini, D. Energy saving potential in existing compressors. In Proceedings of the 22nd International Compressor Engineering Conference, West Lafayette, IN, USA, 14–17 July 2014. [Google Scholar]
  5. Grand View Research, Air Compressor Market Size Analysis Report, 2021–2028. 2021. Available online: https://www.grandviewresearch.com/industry-analysis/air-compressor-market (accessed on 25 July 2022).
  6. Ooi, K.T. Design optimization of a rolling piston compressor for refrigerators. Appl. Therm. Eng. 2005, 25, 813–829. [Google Scholar] [CrossRef]
  7. Liu, Y.; Hung, C.; Chang, Y. Design optimization of scroll compressor applied for frictional losses evaluation. Int. J. Refrig. 2010, 33, 615–624. [Google Scholar] [CrossRef]
  8. Etemad, S.; Nieter, J. Design optimization of the scroll compressor. Int. J. Refrig. 1989, 12, 146–150. [Google Scholar] [CrossRef]
  9. Hirayama, T.; Ito, Y.; Shida, S.; Kawabe, I.; Hirano, K. Development of large capacity rotary compressor with three cylinders. First report: Prototype designs and their efficiencies. Int. J. Refrig. 2021, 130, 278–287. [Google Scholar] [CrossRef]
  10. Meng, X.; Qi, Y.; Sheng, L.; Li, Q.; Su, L. Investigations on efficiency improvement of rolling piston type rotary compressor with a new-designed cylinder. Appl. Therm. Eng. 2023, 222, 119920. [Google Scholar] [CrossRef]
  11. Noh, K.-Y.; Min, B.-C.; Song, S.-J.; Yang, J.-S.; Choi, G.-M.; Kim, D.-J. Compressor efficiency with cylinder slenderness ratio of rotary compressor at various compression ratios. Int. J. Refrig. 2016, 70, 42–56. [Google Scholar] [CrossRef]
  12. Gu, H.; Ye, F.; Chen, Y.; Wu, J.; Li, W.; Sundén, B. Performance investigation and design optimization of novel rotating-cylinder sliding vane rotary compressors. Int. J. Refrig. 2022, 142, 137–147. [Google Scholar] [CrossRef]
  13. Pelekis, Emmanouil Andreas, General Supply (Constructions) Co. Ltd., 22 August 1980. Available online: https://patentimages.storage.googleapis.com/52/03/a0/d6a3adfa53238a/EP0046586A2.pdf (accessed on 25 July 2022).
  14. Duncan, R.J. 26 5 2005. Available online: https://patentimages.storage.googleapis.com/27/7a/af/e922e7025ac297/US20050284440A1.pdf (accessed on 25 July 2022).
  15. Lurtz, J.R. 8 6 2006. Available online: https://patentimages.storage.googleapis.com/27/98/25/0aff3dd7f209ff/US20060120910A1.pdf (accessed on 25 July 2022).
  16. ASTRON AEROSPACE LLC, 18 2 2021. Available online: https://patentimages.storage.googleapis.com/05/ec/2f/3c5a66694e42df/WO2021029906A1.pdf (accessed on 25 July 2022).
  17. BETA CAE Systems International AG. ANSA 21.1.3 User’s Guide; BETA CAE Systems: Luzern, Switzerland, 2021. [Google Scholar]
  18. Sullivan, P.E.; Sehmby, M. Internal Force Analysis of a Variable Displacement Vane Pump; SAE International: Warrendale, PA, USA, 2012. [Google Scholar]
  19. Stosic, N. On heat transfer in screw compressors. Int. J. Heat Fluid Flow 2015, 51, 285–297. [Google Scholar] [CrossRef]
  20. Smith, H.I.C.P.R. Supercritical Fluid Science and Technology; Elsevier: Amsterdam, The Netherlands, 2013. [Google Scholar]
  21. Yakhot, V.; Orszag, S.A.; Thangam, S.; Gatski, T.B.; Speziale, C.G. Development of turbulence models for shear flows by a double expansion technique. Phys. Fluids A 1992, 4, 1510–1520. [Google Scholar] [CrossRef] [Green Version]
  22. Roache, P.J. Perspective: A Method for Uniform Reporting of Grid Refinement Studies. J. Fluids Eng. 1994, 116, 405–413. [Google Scholar] [CrossRef]
  23. Lin, Y.; Li, X.; Zhu, Z.; Wang, X.; Lin, T.; Cao, H. An energy consumption improvement method for centrifugal pump based on bionic optimization of blade trailing edge. Energy 2022, 246, 123323. [Google Scholar] [CrossRef]
Figure 1. The piston-rotor position near the end of the compression process (some degrees before the primary peak pressure is developed).
Thermo 03 00013 g001
Figure 2. (A) A section view of the Emmanouil Andreas Pelekis apparatus (EP0046586A2) [13]; (B) A section view of the Duncan engine (US20050284440A1) [14].
Thermo 03 00013 g002
Figure 3. (A) Jerome Lurtz’s rotary technology (US20060120910A1) [15]; (B) An apparatus by ASTRON AEROSPACE LLC (WO2021029906A1) [16].
Thermo 03 00013 g003
Figure 4. (A) the moment the primary (5) peak pressure is reached during the operating cycle and (B) the moment the secondary (6) peak pressure is reached during the operating cycle.
Thermo 03 00013 g004
Figure 5. Suction port position and size.
Thermo 03 00013 g005
Figure 6. Structure and size of the isolator cavity.
Thermo 03 00013 g006
Figure 7. PV diagrams of the theoretical isentropic (blue) and simulated (red) compression process.
Thermo 03 00013 g007
Figure 8. The original (A) and modified design ((B) = 3D printing design with the extra, secondary cavity (7)).
Thermo 03 00013 g008
Figure 9. The pressure developed during one full compression cycle for the two initial geometries.
Thermo 03 00013 g009
Figure 10. Temperature rise during a full compression cycle for the two initial geometries.
Thermo 03 00013 g010
Figure 11. (A) End of compression process with original design (primary peak pressure); (B) End of compression process with modified design (primary peak pressure).
Thermo 03 00013 g011
Figure 12. (A) The secondary peak pressure contour plot of the original design of the geometry; (B) The secondary peak pressure contour plot of the modified geometry.
Thermo 03 00013 g012
Figure 13. (A) The alternative geometry with the extended cavity, called 4.1; (B) The alternative geometry with the extended cavity, called 4.2.
Thermo 03 00013 g013
Figure 14. (A) The alternative geometry with the extended cavity, called 4.3; (B) The alternative geometry with the extended cavity, called 4.4.
Thermo 03 00013 g014
Figure 15. Pressure developed around the secondary peak pressure point for the four different designs.
Thermo 03 00013 g015
Figure 16. The final assembly of the rotary piston compressor and photographs from the experimental campaign.
Thermo 03 00013 g016
Figure 17. Test results at 2756 rpm.
Thermo 03 00013 g017
Figure 18. An extreme deformation of the secondary cavity (geometry is created with CNC machining).
Thermo 03 00013 g018
Table 1. Calculations of the discretization error based on the Richardson extrapolation method.
Φ = Pressure (Pa)
N1 (×106)4
N2 (×106)2
N3 (×106)1
GCI210.093%
GCI230.78%
Table 2. CFD model setup in the CONVERGE software.
SetupParameters
SolverNavier–Stokes density-based
Pressure inlet (bar)1.01
Temperature inlet (K)300
Fluid flow assumptionRedlich-Kwong equation/compressible gas
MaterialAir
Wall propertiesAbsolute roughness = 0
ModelsRNG k-ε, RANS
Solution method schemeTransient
Convergence criterionPISO/Tolerance: 10 3
Table 3. The exact primary and secondary peak pressure is presented along with the crank angle.
Primary Peak PressureSecondary Peak Pressure
Pressure (Bar)Crank Angle
Degree (Deg)
Pressure (Bar)Crank Angle
Degree (Deg)
Modified Design 18.39313.516.18339.4
Original Design17.74313.5110.41334.5
Table 4. The exact secondary peak pressure is presented along with the crank angle.
DesignPressure (bar)Temperature (K)Crank Angle Degree (deg)
4.06.18515.8339.4
4.16.47530.24324.6
4.25.35507.43333.4
4.37.07547.54324.4
4.44.52481.76333.4
Disclaimer/Publisher’s Note: The statements, opinions and data contained in all publications are solely those of the individual author(s) and contributor(s) and not of MDPI and/or the editor(s). MDPI and/or the editor(s) disclaim responsibility for any injury to people or property resulting from any ideas, methods, instructions or products referred to in the content.

