

Experimental Work on Salt-Based Cooling Systems


Chemical and Materials Engineering Department, University of Auckland, Auckland 1010, New Zealand
*
Author to whom correspondence should be addressed.
Thermo 2023, 3(1), 200-215; https://doi.org/10.3390/thermo3010012
Submission received: 7 February 2023
/
Revised: 13 March 2023
/
Accepted: 20 March 2023
/
Published: 22 March 2023
(This article belongs to the Special Issue Advances in PCMs as Thermal Energy Storage in Energy Systems)
Abstract
:The energy consumption for space cooling is progressively increasing. Integrating renewable energy into space cooling systems is critical for reducing CO2 emissions from the building sector. The salt-based cooling system is an appealing alternative as it can be charged by solar energy. This system is based on the characteristic of endothermic salts, which generate a considerable cooling effect when dissolved in water. A screening test was performed in this work to evaluate the cooling performance of several endothermic salts. Furthermore, a laboratory-scale system was developed to demonstrate the endothermic salt-based thermal storage and cooling generation system. Temperature decreases up to 12.3 °C were observed in the system containing Potassium Chloride salt. The temperature drop was maintained after the system underwent a charging/discharging cycle; however, the cooling period was shortened. The system demonstrated an inherent low efficiency due to the large volume of water required in the discharging phase, demanding a considerable amount of energy to evaporate the water in the charging phase. As a result, the application of this system will be restricted to the usage of low-grade energy during the charging phase.
1. Introduction
The energy consumption for space cooling has increased significantly, and it has more than tripled within the span of 16 years (1990–2016) [1]. In the United States alone, space cooling consumes 2.34 quadrillion BTU of energy annually [2]. Currently, most space cooling systems are powered by electricity generated from coal-fired power plants [1], which is directly correlated with increased greenhouse gas (GHG) emissions. Efforts to minimize GHG emissions from space cooling can be made by lowering energy usage or employing renewable energy sources. Energy consumption for space cooling may be reduced using phase change materials (PCM) to enhance thermal comfort and shift the building’s cooling peak load [3]. Approximately 10% energy saving during summer months was reported by employing an active PCM system for space cooling applications [4].
On the other hand, for the utilization of renewable energy in space cooling systems, solar energy is one of the renewable energy sources potentially to be deployed [5]. Solar thermal energy can be captured by concentrating solar of an evacuated tube to drive a refrigeration or cooling unit and produce cool air or chilled water to supply the building’s cooling demand [5,6]. However, solar energy is unstable and intermittent because of its dependency on location and seasonal weather conditions. As a result, to provide a constant and uninterruptible cooling supply, a solar energy-based cooling system will need to be integrated with an energy storage system.
Thermochemical energy storage (TCES) is one of the technologies that can store thermal energy for later utilization to generate cooling. Currently, TCES has the lowest technology readiness level compared to other forms of thermal energy storage (latent and sensible) [7]. Nonetheless, it theoretically possesses the highest energy density and nearly no heat loss during the storage period [8], making it appealing as a long-term energy storage solution. There are three methods for a TCES system to perform the space cooling function. In the first method, the cooling effect is produced during the endothermic decomposition reaction of a thermochemical material (TCM). For example, the heat from ambient air absorbed during the decomposition of metal hydride into metal alloy and hydrogen can generate a cooling effect in indoor space [9]. In the second method, the cooling effect is generated during the evaporation phase of one of the TCM components. For example, the cooling effect is produced during the evaporation of liquid NH3 into gaseous NH3 before it reacts with BaCl3 to form BaCl3·8NH3 in a TCES reactor [10]. The third method is based on the phenomenon that certain salts, such as NPK fertilizer salt, have an endothermic property and dissolving these salts in water can generate a substantial cooling effect [11]. The experiment conducted in this paper is based on the last method.
The notion of a space cooling system based on the theory of endothermic heat of solution of salt material was established by Telkes [12] in the 1970s. The heat of solution is defined as “the quantity of heat evolved or absorbed in the dissolution of one gram-molecule of substance in a quantity of solvent so large that any further dilution would cause no thermal effect” [13]. In her patented space cooling system [12], the cooling effect formed by adding water to a salt or salt combination is transferred to air passing through the solution and provided to a building for air conditioning. After the cooling potential of the solution has been depleted, it is regenerated by flowing hot air partly heated by solar to evaporate the water from the solution and leave the dry salt for reuse. The recommended salt material for this application is salt having a high cooling effect per gram solute, low molecular weight, and high solubility. Based on Telkes’ experiment, the highest temperature drop achieved by ammonium chloride is 18.5 °C. Meanwhile, the combination of ammonium chloride and ammonium nitrate resulted in a maximum temperature drop of 31 °C.
In a more recent patent document [14], endothermic salts were proposed to be used as cooling agents, which can be activated by mixing them with water. This patent addressed the toxicity, reactivity and combustibility of several salt materials that make them unsuitable for consumer products. Non-toxic salt compositions that can produce at least a 14 °C temperature drop and can be reused as fertilizer are presented as the invention in this document. The utilization of salt solution’s endothermic properties was applied in another patent to develop a dry instant cold pack [15]. The dry cold pack is pre-filled with 50 g of urea, ammonium nitrate, or calcium ammonium nitrate. By adding 50 g water to this cold pack, an instant cooling effect of up to −5 °C can be achieved in 30 s.
The above patents show the potential of endothermic salt to generate a cooling effect but do not emphasize the thermal storage application of these salts. A conceptual design of solar energy storage combined with the generation of a cooling effect for buildings by employing endothermic fertilizer salt is suggested by Desai et al. [16]. The proposed system has two operating phases. In the charging phase, solar energy is used to heat the salt solution so that water is evaporated, and salt is dried. This phase also represents the thermal storage phase, as after the salt is entirely dried, it may be stored at ambient temperature for an indefinite time. Then, when there is a demand for space cooling, the discharging phase can be started by adding water to the salt, leading to an endothermic reaction and a cooling effect. The challenges identified in this system include the characteristics of the salt material (solubility, agglomeration, thermal stability, recyclability, non-toxicity, availability and cost), the system coolness storage capacity, heat of evaporation and resulted coefficient of performance (COP) [11].
The experimental work in this paper was built upon the above conceptual design. In this paper, a small-scale system was developed in the laboratory to model the endothermic salt-based thermal storage and cooling generation system. Before running the small-scale system, the salt screening and charging/discharging cycle experiment were conducted. Additionally, the effect of salt morphology and using seawater for salt dissolution was also investigated. The main objective of this study is to evaluate the potential endothermic salt utilization for thermal storage and space-cooling applications based on the performance of the small-scale system.
2. Materials and Methods
2.1. Experiment 1: Screening of Salt
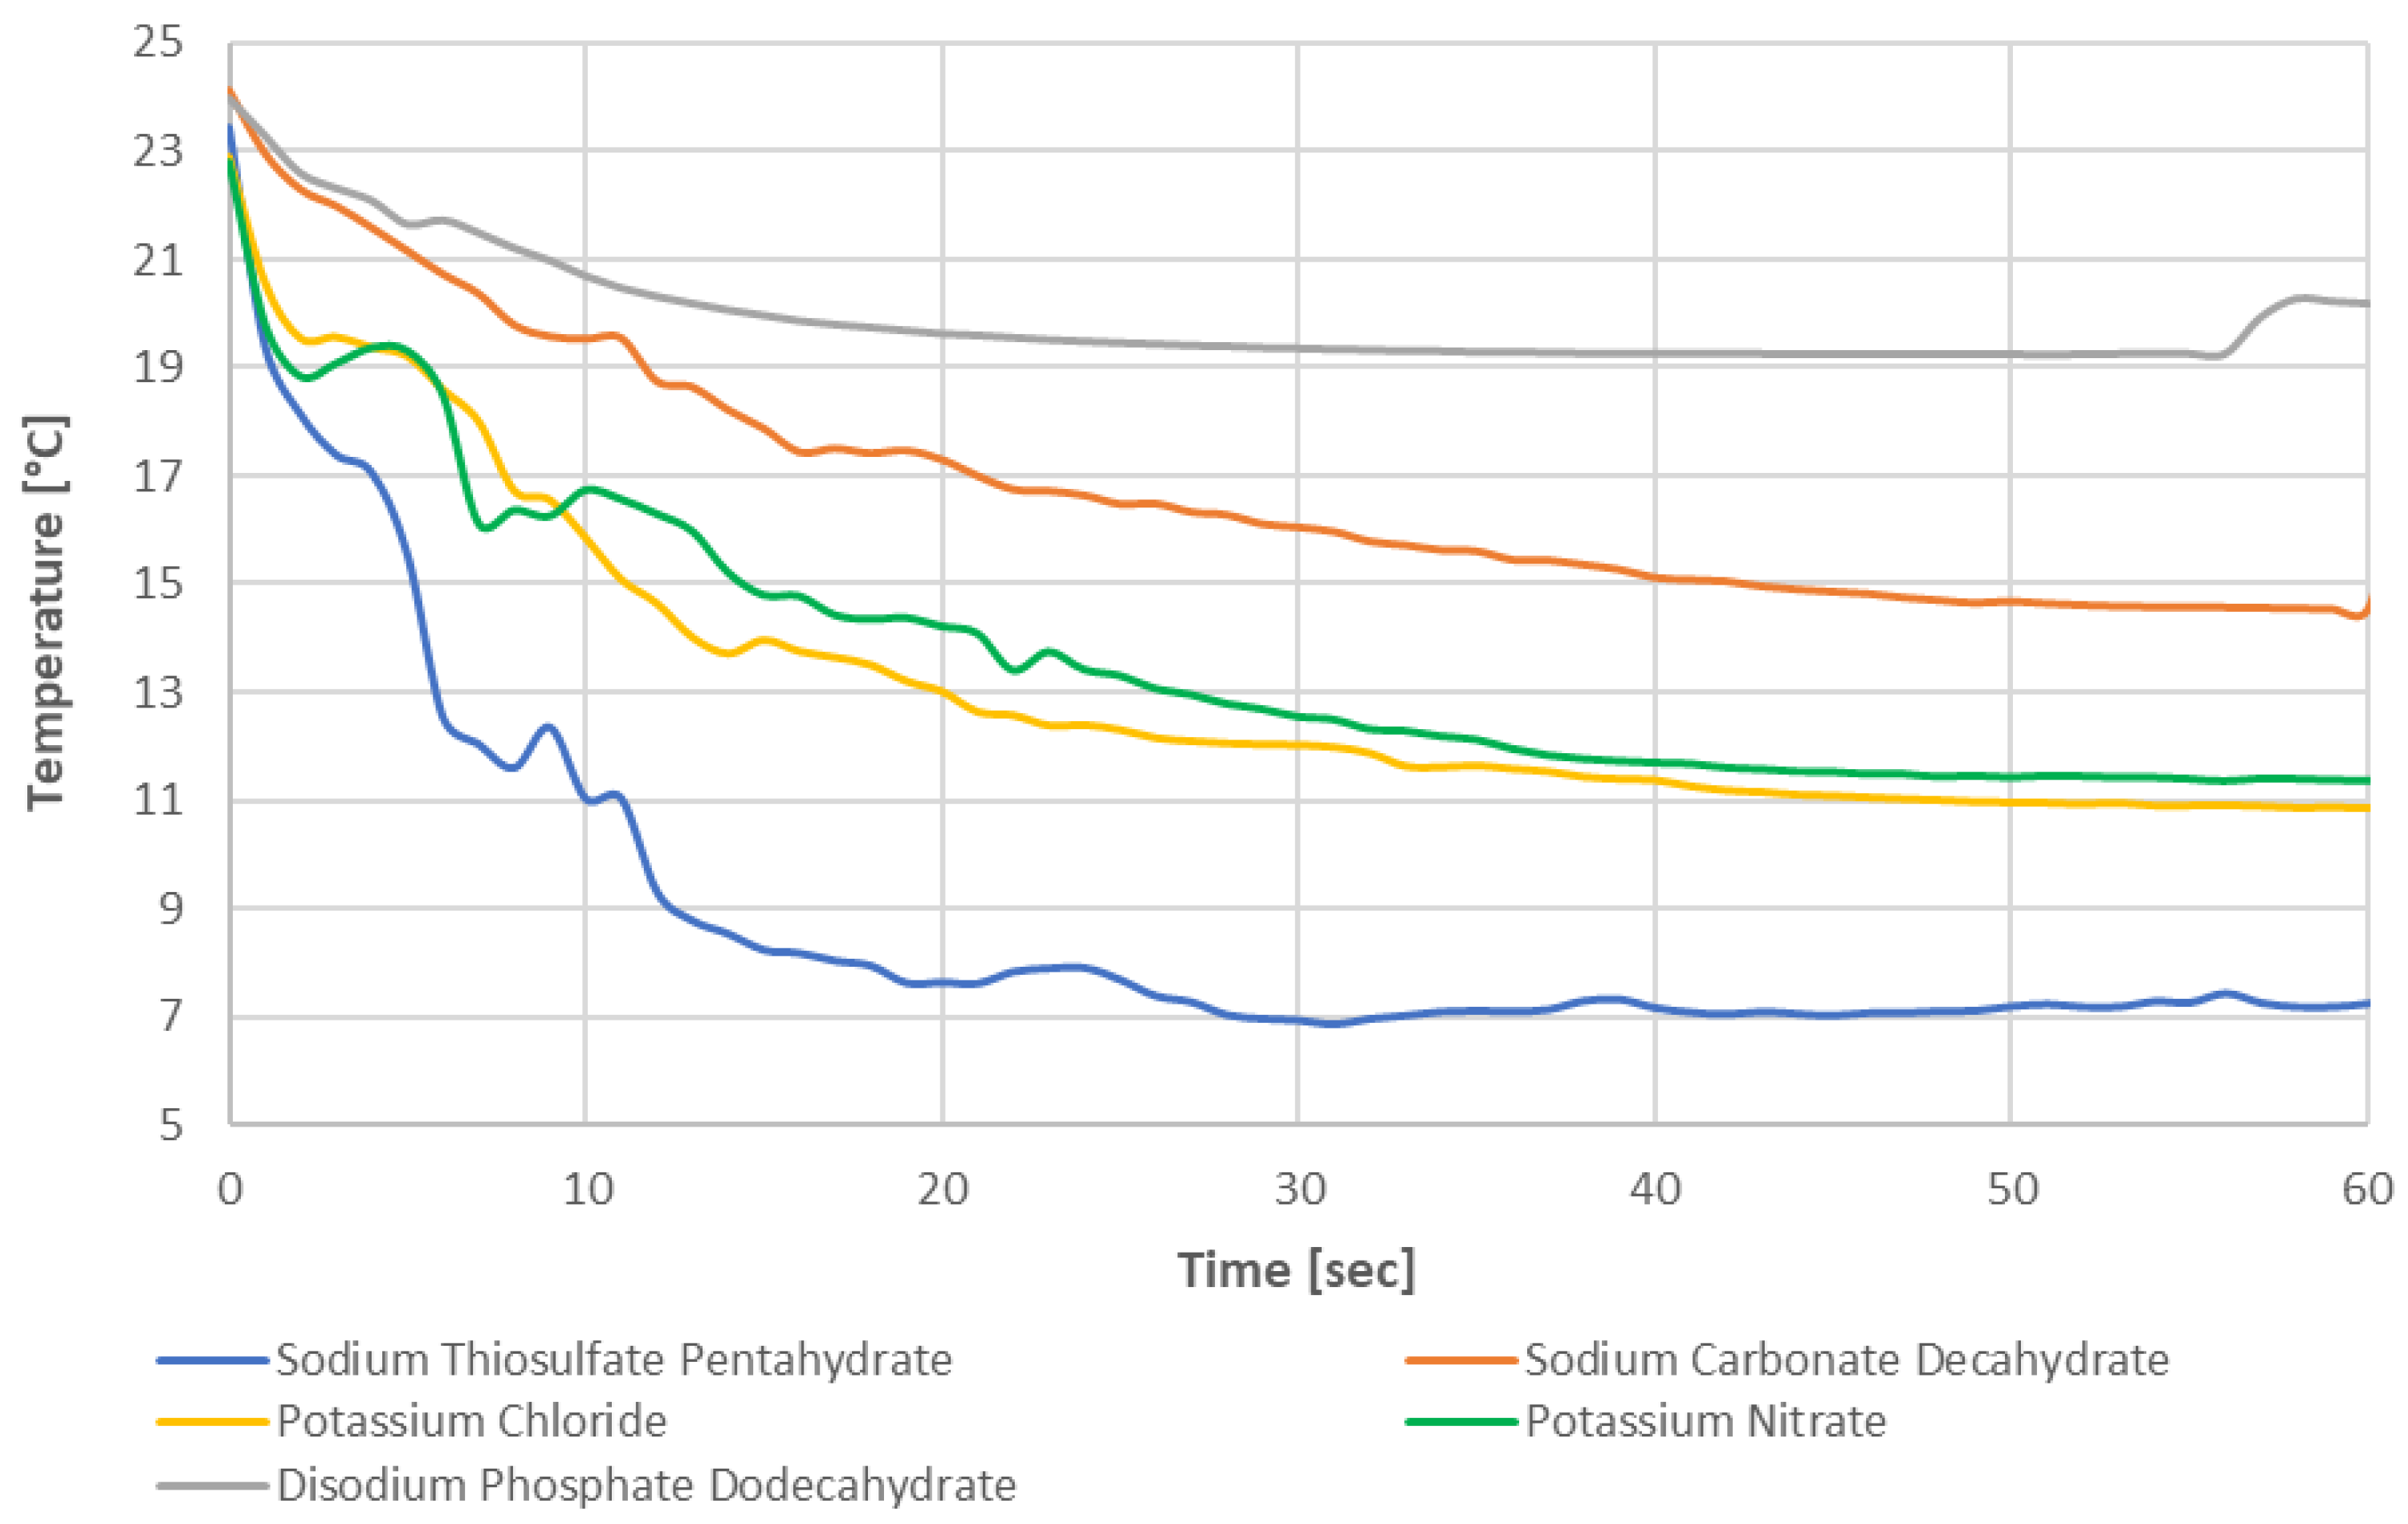
The objective of the first experiment is to investigate the potential of the cooling effect generated by several endothermic salts. The criteria for the salts included in the screening process are energy density, solubility, safety/non-toxicity, cost, and largely available in the industry. Based on these criteria, five salts were selected for the screening experiment: Sodium Thiosulfate Pentahydrate (Na2S2O3·5H2O), Disodium Phosphate Dodecahydrate (Na2HPO4·12H2O), Sodium Carbonate Decahydrate (Na2CO3·10H2O), Potassium Chloride (KCl), and Potassium Nitrate (KNO3). The salts were supplied by Sigma Aldrich.
The screening experiment was conducted for each salt as follows: the salt material was placed in a small, insulated beaker. Water was then added up to reach the saturation points based on the salt’s solubility at 20 °C. Table 1 details the salt’s solubility data, weight and the amount of water added to the salt during the experiment. After the water had been added to the salt, the temperature of the solution was measured and recorded for 60 s.
2.2. Experiment 2: Charging and Discharging Experiment
Two salts showing the highest potential of cooling effect from Experiment 1 proceeded to the charging (water evaporation/salt drying) and discharging (salt dissolution) experiment. The focus of the experiments was to analyze the initial temperature drop upon the discharging phase. Therefore, the thermal insulation of the samples was not crucial as the cooling period was not measured. The MA35 Infrared Moisture Analyzer from Sartorius was used in this experiment. A 60 mm aluminum petri dish held the salt and solution. Each sample used 5 g of salt material. After the salt was placed into the aluminum dish, the tare weight on the moisture analyzer was reset to account for both the dish and the salt. The water was then added to each salt sample to reach the salt’s saturation point based on the salt solubility at 20 °C.
The samples were then dried at 80 °C to achieve 0%, 5% and 10% of the original water content to investigate the change in performance due to partially drying the salt before starting the discharging phase. The dried samples were then allowed to rest until they were cooled to room temperature before re-dissolving them in water. A simple rig was used to keep the thermocouple steady during the discharging phase to measure and record the temperature change continuously. The temperature drop data were compared between two salts in this experiment. The salt showed a better performance and then advanced to the subsequent experiments.
2.3. Experiment 3: Effect of Salt Morphology
A change in the salt morphology after charging (salt drying) was observed in Experiment 2. Therefore, in this experiment, the effect of a salt morphology on the generated cooling effect is evaluated. The experimental method is almost identical to Experiment 2; only in this experiment, after the charging phase, the samples were crushed, so they returned to the powder form. The same technique and crushing period were applied to each sample to ensure a similar particle size. After the crushing process, the samples were mixed with water (discharging phase), and temperatures were measured identically to the method used in Experiment 2.
2.4. Experiment 4: Use of Sea Water for Discharging Phase
This experiment aims to investigate the salt-cooling effect when seawater is used for salt dissolution during the discharging phase. This experiment did not use actual seawater; instead, it was created by mixing 4 wt% sodium chloride (NaCl) and 96 wt% distilled water. A large batch of 2 L was made and was well-shaken before every application to ensure a homogeneous seawater solution. This experiment used the same crushed salt samples from Experiment 3. The charging and discharging phase were conducted using an identical methodology as Experiment 2.
2.5. Experiment 5: Small-Scale System
The main objective of Experiment 5 was to simulate a small-scale system in which the salt-based thermal storage can be charged and discharged on demand. Due to the technical complexity of using a solar energy source to charge the salt inside the lab, a thermal oil bath was used to provide the heat instead. Although a coherent system could not be tested, this experiment aimed to give insight into the expected power output of various-sized systems.
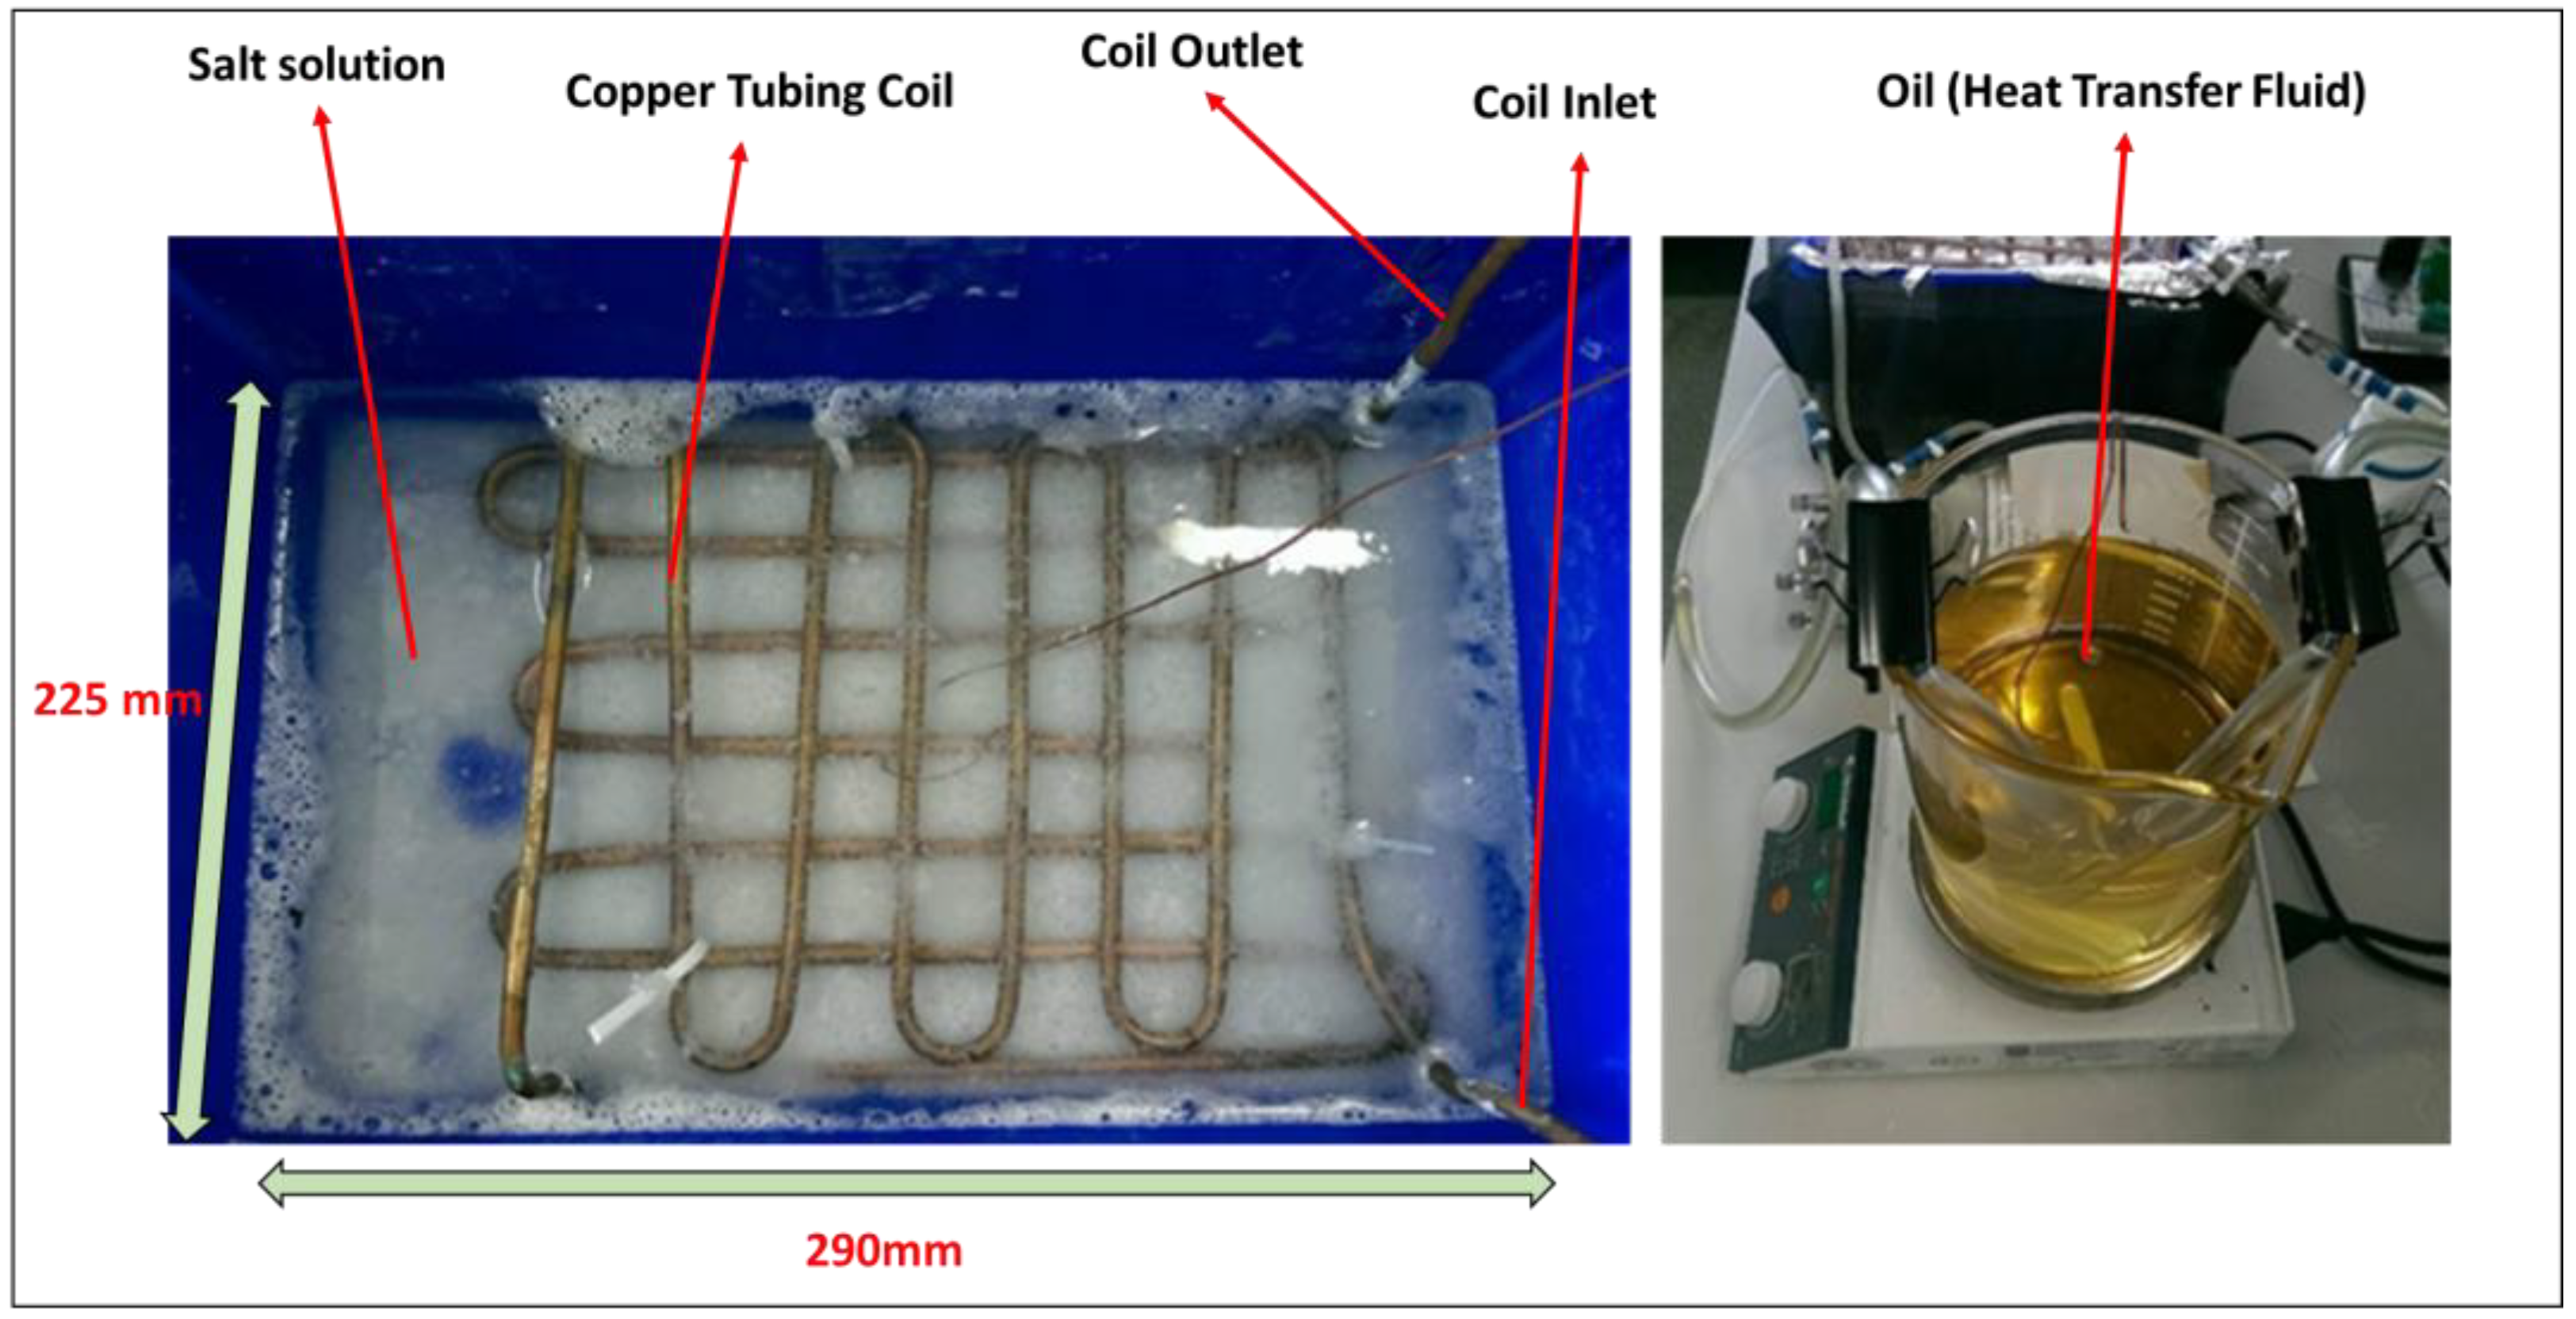
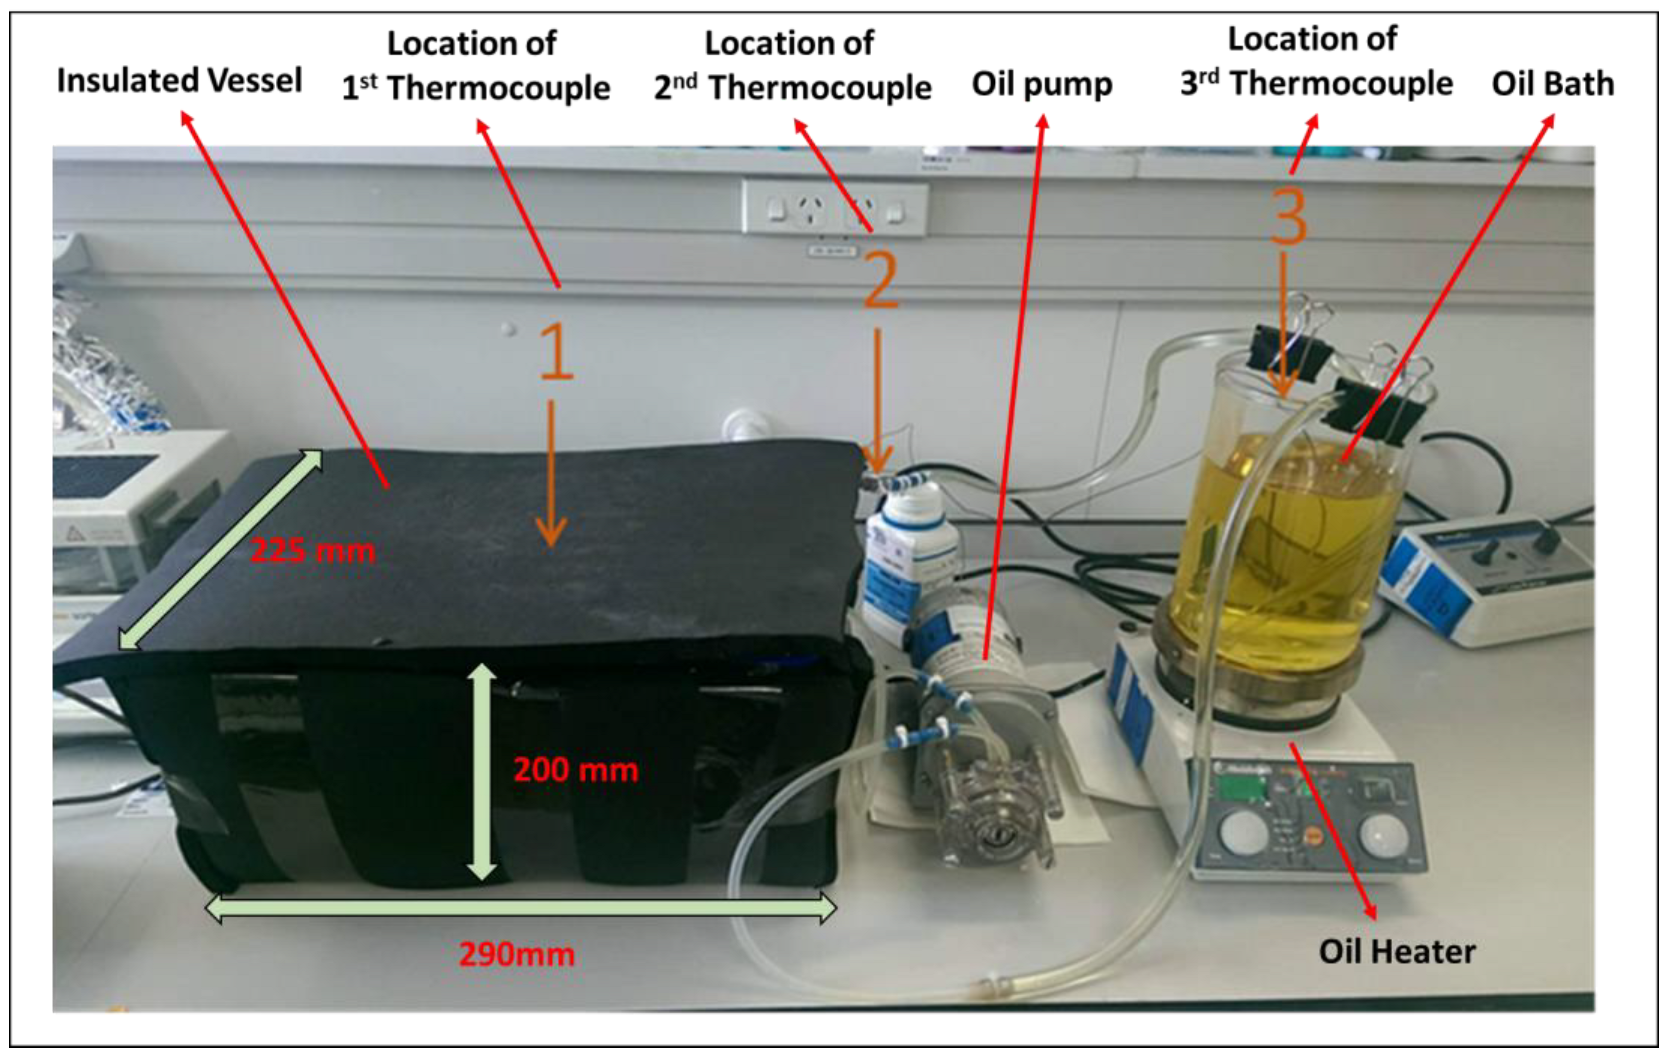
The experiment set-up consisted of a heat transfer coil and an oil bath, which allowed the oil (heat transfer fluid) to be pumped through the coil at temperatures above 100 °C to simulate the charging process by solar. A medium-sized insulated vessel would essentially hold the coil and the salt solution, while the oil would be pumped through the coils to and from the oil bath. The oil bath acts as a temperature regulator as well as a heat load. Approximately 3600 cm of 5 mm diameter copper tubing in a zigzag formation was placed inside the vessel of the dimensions 290 mm × 225 mm × 200 mm (L × W × H). The amount of salt used in this experiment was 850 g. The experimental set-up can be seen in Figure 1 and Figure 2.
Following the equipment set-up, the trials comprised three steps: discharging (salt dissolution), thermal testing, and charging (salt re-drying). After the dry salt was placed within the vessel, water was dripped up to the saturation point at 10 °C. A slow water drip rate of 20 mL/s and a fast water drip rate of 100 mL/s was used for the salt dissolution (discharging phase) to measure the change in the cooling rate. A total of three runs were undertaken due to time constrains of laboratory access hours and extended charging time. The first run was performed using fresh salt, while the subsequent two runs used dried salt from the previous run. Three 0.5 mm Type K thermocouples were placed along the heat transfer fluid pathway: one in the vessel, one on the coil exit, and one in the oil bath. The exact locations of the thermocouples and system set-up can be seen in Figure 2.
During the discharging phase, the peristaltic pump was calibrated to 0.24 L/min, and the oil heater was set to 25 °C with the magnetic stirrer rotating at 1000 rpm. The discharging phase was commenced by adding water to the vessel. The temperature of the oil (heat transfer fluid) was measured and recorded for the entire duration of the discharging process. Once the difference in inlet and outlet temperatures was within 1 °C, the cooling process was assumed to be completed.
The charging process was initially intended to use the same system by flowing the oil at a temperature above 100 °C. However, the desired drying level was not achieved after running the procedure for 12 h, while this high-temperature operation cannot be left unattended, the charging method was changed. The method was substituted by draining the salt solution from the vessel to a tray and then continuing the salt drying process in the convection oven.
3. Results and Discussion
3.1. Salt Screening Result
The temperature profile from the salt screening experiment is shown in Figure 3.
Key values from Experiment 1 are shown in Table 2 below. It indicates that the Sodium Thiosulfate Pentahydrate gave the highest temperature drop of 14.1 °C, followed by Potassium Chloride at 10.2 °C temperature drop. The resulted temperature drop of these two salts is close to the predicted temperature change in the literature [14] for saturated salt solution (assuming 30% heat loss), which are 14 °C for Sodium Thiosulfate Pentahydrate and 10 °C for Potassium Chloride. In addition to giving the highest temperature drops, these two salt materials represented salt hydrate and anhydrous salt. Therefore, Sodium Thiosulfate Pentahydrate and Potassium Chloride were selected to advance to Experiment 2.
3.2. Charging and Discharging Experiment Result
3.2.1. Sodium Thiosulfate Pentahydrate
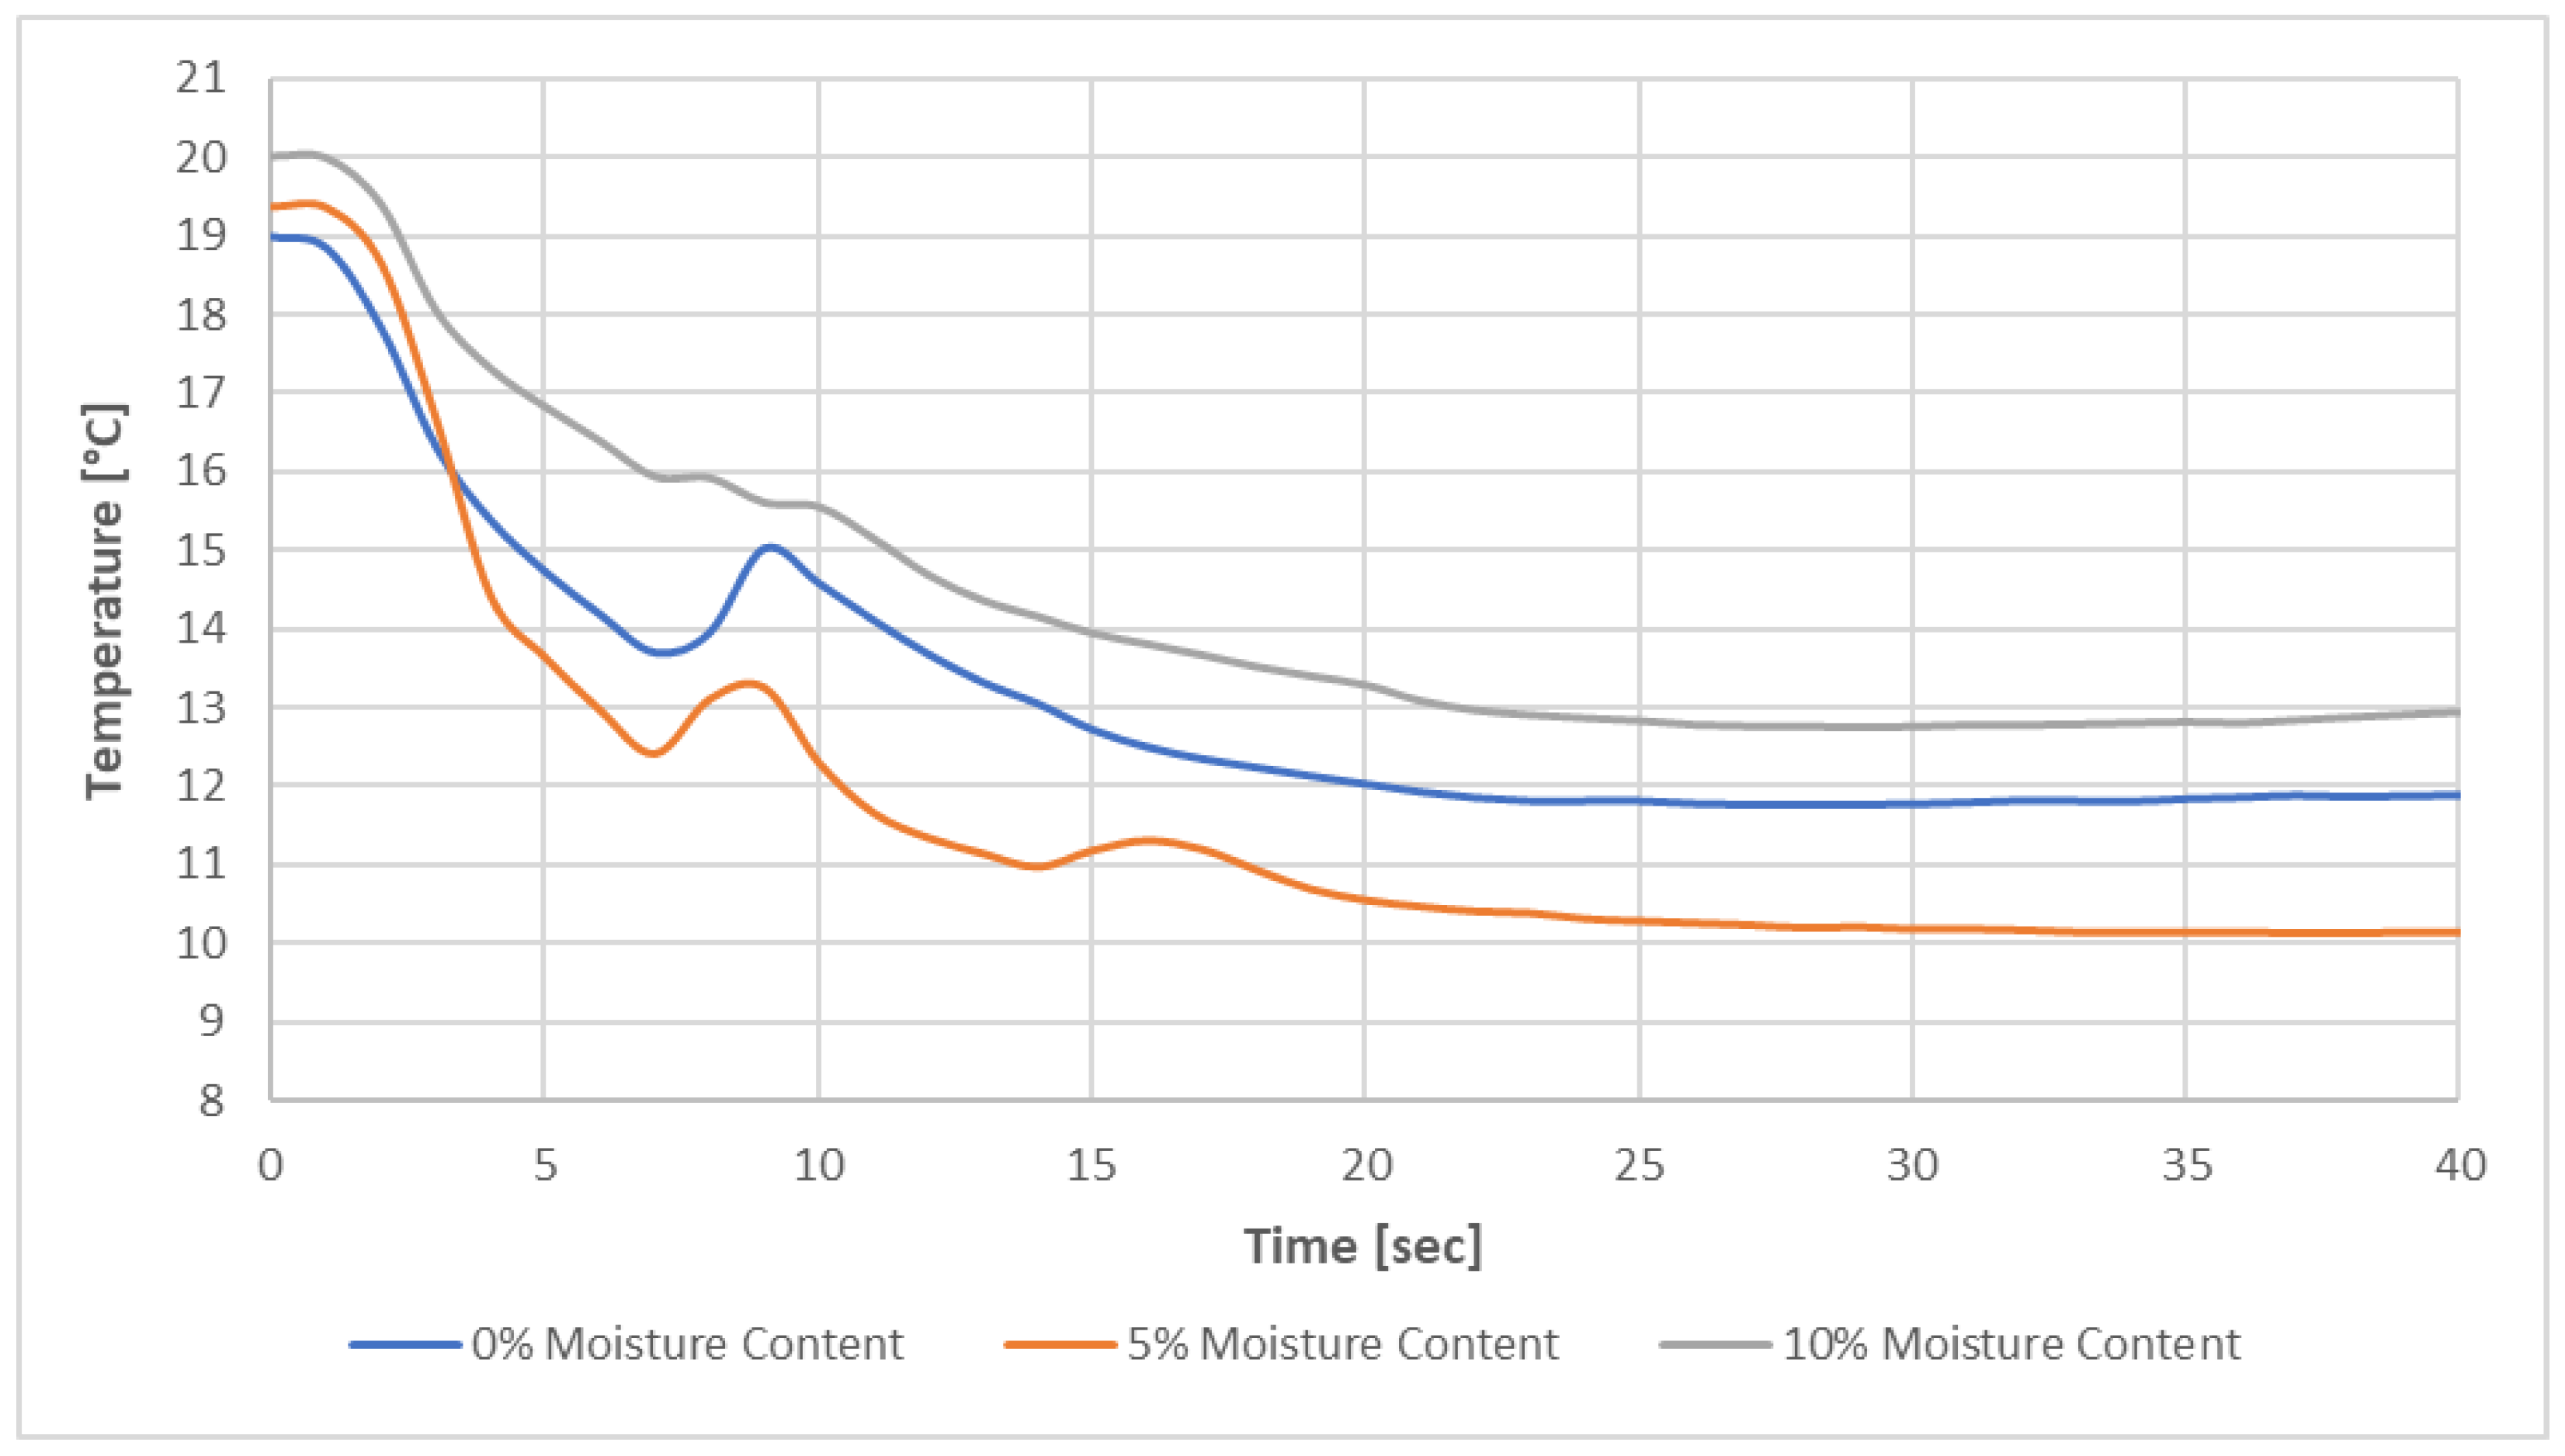
Figure 4 shows the temperature profile during the discharging phase of Sodium Thiosulfate Pentahydrate containing 0%, 5% and 10% moisture. Each of the temperature profiles shown in the graph is the average (means) value of multiple runs of the discharging process at the respective moisture level. Upper and lower bounds of three standard deviations were also calculated to give 99.7% confidence intervals for each temperature profile.
Table 3 provides the range of final temperature and time of Sodium Thiosulfate Pentahydrate from the multiple runs in this experiment. The final temperatures were based on the lowest temperatures that the solutions achieved, and the time to reach this point was also recorded.
There are two essential points observed from the results shown above. Firstly, the initial temperature drop is attained over a more extended period than the profile obtained in Experiment 1, which uses a fresh Sodium Thiosulfate Pentahydrate. Compared to the temperature drop of 14.1 °C resulted in Experiment 1, the sample with 0% moisture content only achieved 38% to 48% of the original temperature drop. It also took substantially longer to reach the final temperature. The details of the temperature drop and performance change of dried samples compared to fresh samples (Experiment 1) are shown in Table 4 below.
The second observation from this experiment is the cooling effect increased with increasing moisture content in the dried Sodium Thiosulfate Pentahydrate. The improved performance with partially dried salt suggests two potential explanations. The first one is the change in the physical characteristic of the dried salt. For instance, the sample with lower moisture content may have been ‘overdried’ and baked into a harder solid. It was observed during this experiment that the dried salt samples appear to be a single porous solid compared to the fine powder of the fresh salt. This physical change may have reduced the rate of diffusion of water into significant portions of the salt. In addition, the salt did not break apart with the introduction of water. Agitation was avoided as it decreased the efficiency of the system. Although the additional water principle could be applied in this situation to relieve this issue to an extent, the underlying problem of salt agglomerating into a dense mass would not be able to be avoided in an actual system.
Another possible explanation is related to the salt hydrate characteristic of Sodium Thiosulfate Pentahydrate. A salt hydrate material has a multitude of hydration levels. The inevitable concentration gradient and temperature gradient across the vessel could result in unpredictable solution composition. Unless it is in a closed, controlled, well-mixed container, it is doubtful that sodium thiosulfate would move just between the saturated solution and the pentahydrate. In this experiment, the salt was dried from top to bottom, meaning the sample’s top layer was likely to have a lower hydrate than the bottom layer.
Furbo [18] explained that inconsistencies in phase change during the melting and crystallization of the salt hydrate would result in the formation of three layers within the vessel. Due to the difference in densities of the salt hydrate and the crystal water, the bottom layer is composed of relatively anhydrous salt, precipitating out of the solution during cooling. This layer is sealed from the top layer of the saturated solution by a middle layer of precipitated salt hydrate. Subsequent heating and cooling cycles continue to grow the bottom layer and reduce the overall concentration of salt available in the system; this results in the loss of efficiency of the reversibility of the system. Therefore, the extra water principle is applicable for salt hydrate, whereby adding extra water ensures that any premature anhydrous salt precipitates are dissolved at the melting point, allowing fully hydrated salt precipitates to preferentially crystalize when further cooled.
One of the problems that could render Sodium Thiosulfate Pentahydrate or salt hydrates, in general, unusable was supercooling. Almost all the samples did not precipitate any solids during the drying process and were completely liquid even at the end of the process after cooling down to room temperature. These samples had to be shaken until crystallization could occur, at which point the samples produced a significant amount of heat. This phenomenon was expected as hydration is always exothermic. However, the salt being unable to crystalize naturally was an unexpected behavior. Two situations may occur if Sodium Thiosulfate Pentahydrate were used in a system. The system would either unexpectedly produce no cooling, and a whole cycle of charging and discharging would be wasted, or the supercooled solution would crystallize at an unknown time and produce heating rather than cooling.
This experiment cannot determine whether this occurs in a range of conditions or all conditions. However, this problem would be another long list of potential issues with using salt hydrate for a cooling system with endothermic salts. One of the essential aspects of this idea was the simplicity of the final system. Trying to account for these complications would only make the initial system more complicated and, therefore, more expensive. It would raise a question about the suitability of using salt hydrate for cooling purposes.
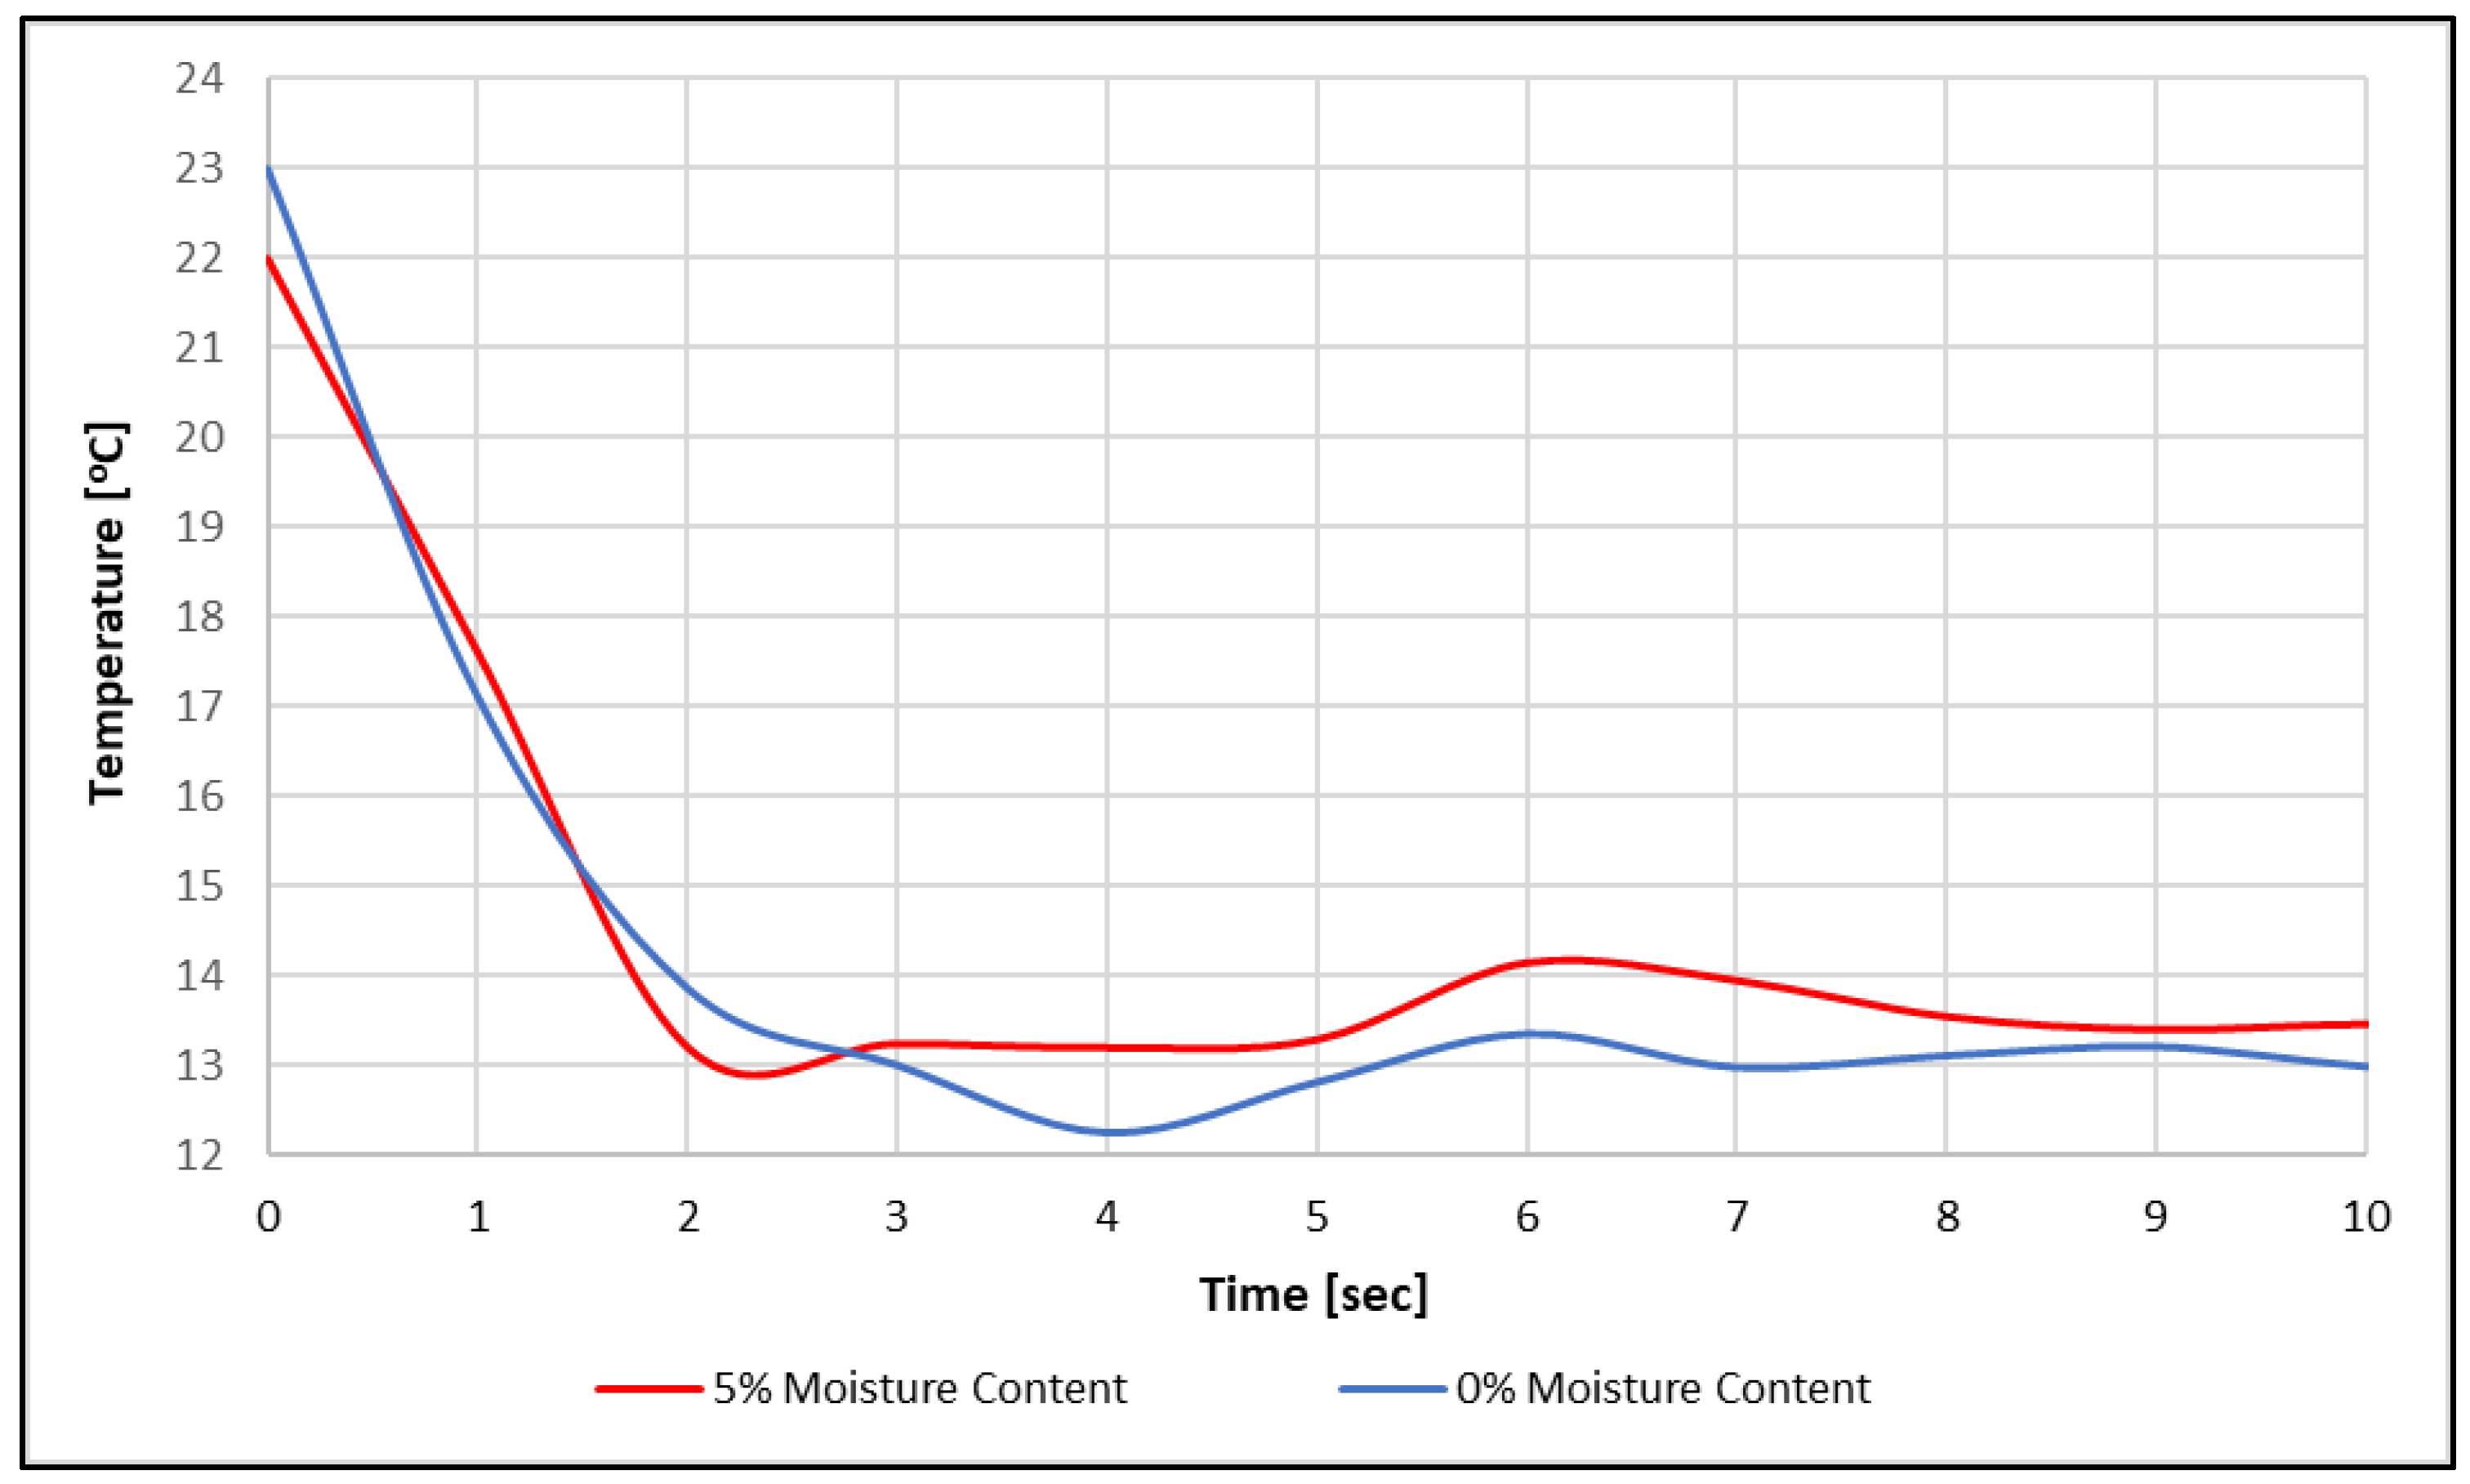
3.2.2. Potassium Chloride
Figure 5 shows the temperature profile during the discharging phase of Potassium Chloride containing 0%, 5% and 10% moisture. Each of the temperature profiles shown in the graph is the average (means) value of multiple runs of the discharging process at the respective moisture level. Upper and lower bounds of three standard deviations were also calculated to give 99.7% confidence intervals for each temperature profile.
Similarly, Table 5 provides the range of final temperature and time range of Potassium Chloride from the multiple runs in this experiment. The final temperatures were based on the lowest temperatures that the solutions achieved, and the time to reach this point was also recorded.
Unlike Sodium Thiosulfate Pentahydrate, the temperature drop of Potassium chloride did not increase with increasing moisture content. The sample with 5% moisture content outperformed 0% and 10% and obtained the highest temperature drop. This result suggests that Potassium Chloride faced similar issues to Sodium Thiosulfate Pentahydrate. Potassium Chloride is not a salt hydrate, so there would be no compositional changes (concerning hydration levels). It would suggest that the inconsistent order of performance may be due to the physical characteristic changes undergone during evaporative drying. Therefore, the issue of ‘over drying’ appears less severe than Sodium Thiosulfate Pentahydrate, as the 10% samples performed worse than the 0% samples.
Similar to Sodium Thiosulfate Pentahydrate, the dried Potassium Chloride formed a porous solid. However, it is evident from the final temperature shown in Table 3 and Table 5 that the Potassium Chloride allowed an easier diffusion of water throughout the solid as the final temperature was reached two to five times faster. Overall, comparing the temperature drop result with the fresh Potassium Chloride sample in Experiment 1, the Potassium Chloride performed much closer to fresh salt than Sodium Thiosulfate Pentahydrate. The 0% moisture content sample of Potassium Chloride reached 90.4% to 95.7% of the temperature drop obtained from the fresh salt experiment (10.2 °C). The details of the temperature drop and performance change of dried samples compared to fresh samples (Experiment 1) are shown in Table 6 below.
3.2.3. Comparison of Sodium Thiosulfate Pentahydrate and Potassium Chloride
Comparing the performance change values shown in Table 4 and Table 6, it is obvious that Potassium Chloride has a better cooling performance after the charging and discharging cycle. A performance increase was recorded for the Potassium Chloride with 5% moisture content samples compared to the fresh salt with 7.4% to 11.6%. The complications caused by the salt hydrates end up counteracting the theoretically better performance of these salts. When used in a well-controlled environment, salt hydrates have shown the potential to outperform anhydrous salts such as potassium chloride.
One of the main attractions of the studied salt hydrates was that it generally has a higher solubility than the anhydrous salts. The solubility of the salt is crucial to the overall performance of the salt. In the thermal storage and cooling application, the charging and discharging process involves the evaporation and dilution of the salt solution. Therefore, the thermal efficiency of the system can be measured as the energy release during cooling generation over the energy required for evaporation. This means that to effectively increase the efficiency, the amount of water in the solution should be minimum. The higher solubility means less water has to be evaporated during the charging phase, leading to a higher overall efficiency. However, the complications shown so far have resulted in sub-optimal performances.
Many design considerations would have to be made for Sodium Thiosulfate Pentahydrate to operate in a system setting. The temperature during salt drying (charging phase) would have to be homogeneous to sustain the reaction pathway only between saturated solution and pentahydrate. It could be performed by having a sufficiently large surface area so that the solution layer is thin or using an outside heat source with evenly spaced coils. In addition, due to the phase properties of sodium thiosulfate pentahydrate, the operating temperatures are limited to within the pathway described above. In contrast, Potassium Chloride could operate over a broader range of conditions as its use is limited by vessel construction material considerations. Potassium Chloride offers a performance consistent with theory, and its behavior can be better predicted. Considering the result of Experiment 2, Potassium Chloride is selected to proceed to the subsequent experiments.
3.3. Effect of Potassium Chloride Salt Morphology
As described in Section 2.3, in this experiment, the dried salt was crushed before being subjected to the discharging phase. Figure 6 shows the temperature profile of crushed Potassium Chloride containing 0% and 5% moisture during the discharging phase. The same with Experiment 2 result, each of the temperature profiles shown in the graph is the average (means) value from multiple runs. The 10% samples were excluded from this experiment as the focus was to see if over-drying, as discussed in the previous experiment, occurs. The final temperature reached in this experiment appears to be higher than the results shown in Figure 5. However, it was observed that the ambient temperature was higher during the day of this experiment. The temperature of the distilled water at room temperature was approximately 2 °C higher than the usual temperature of 21 °C. Table 7 shows in detail the ranges of temperature drop from this experiment compared to the fresh Potassium Chloride in Experiment 1.
By comparing the percentage of performance change in Table 6 and Table 7, it can be concluded that the change in the salt morphology after being dried can significantly affect the cooling effect performance. By crushing the solid porous block back to fine powder form, a higher temperature drop is achieved than the un-crushed salt or fresh salt.
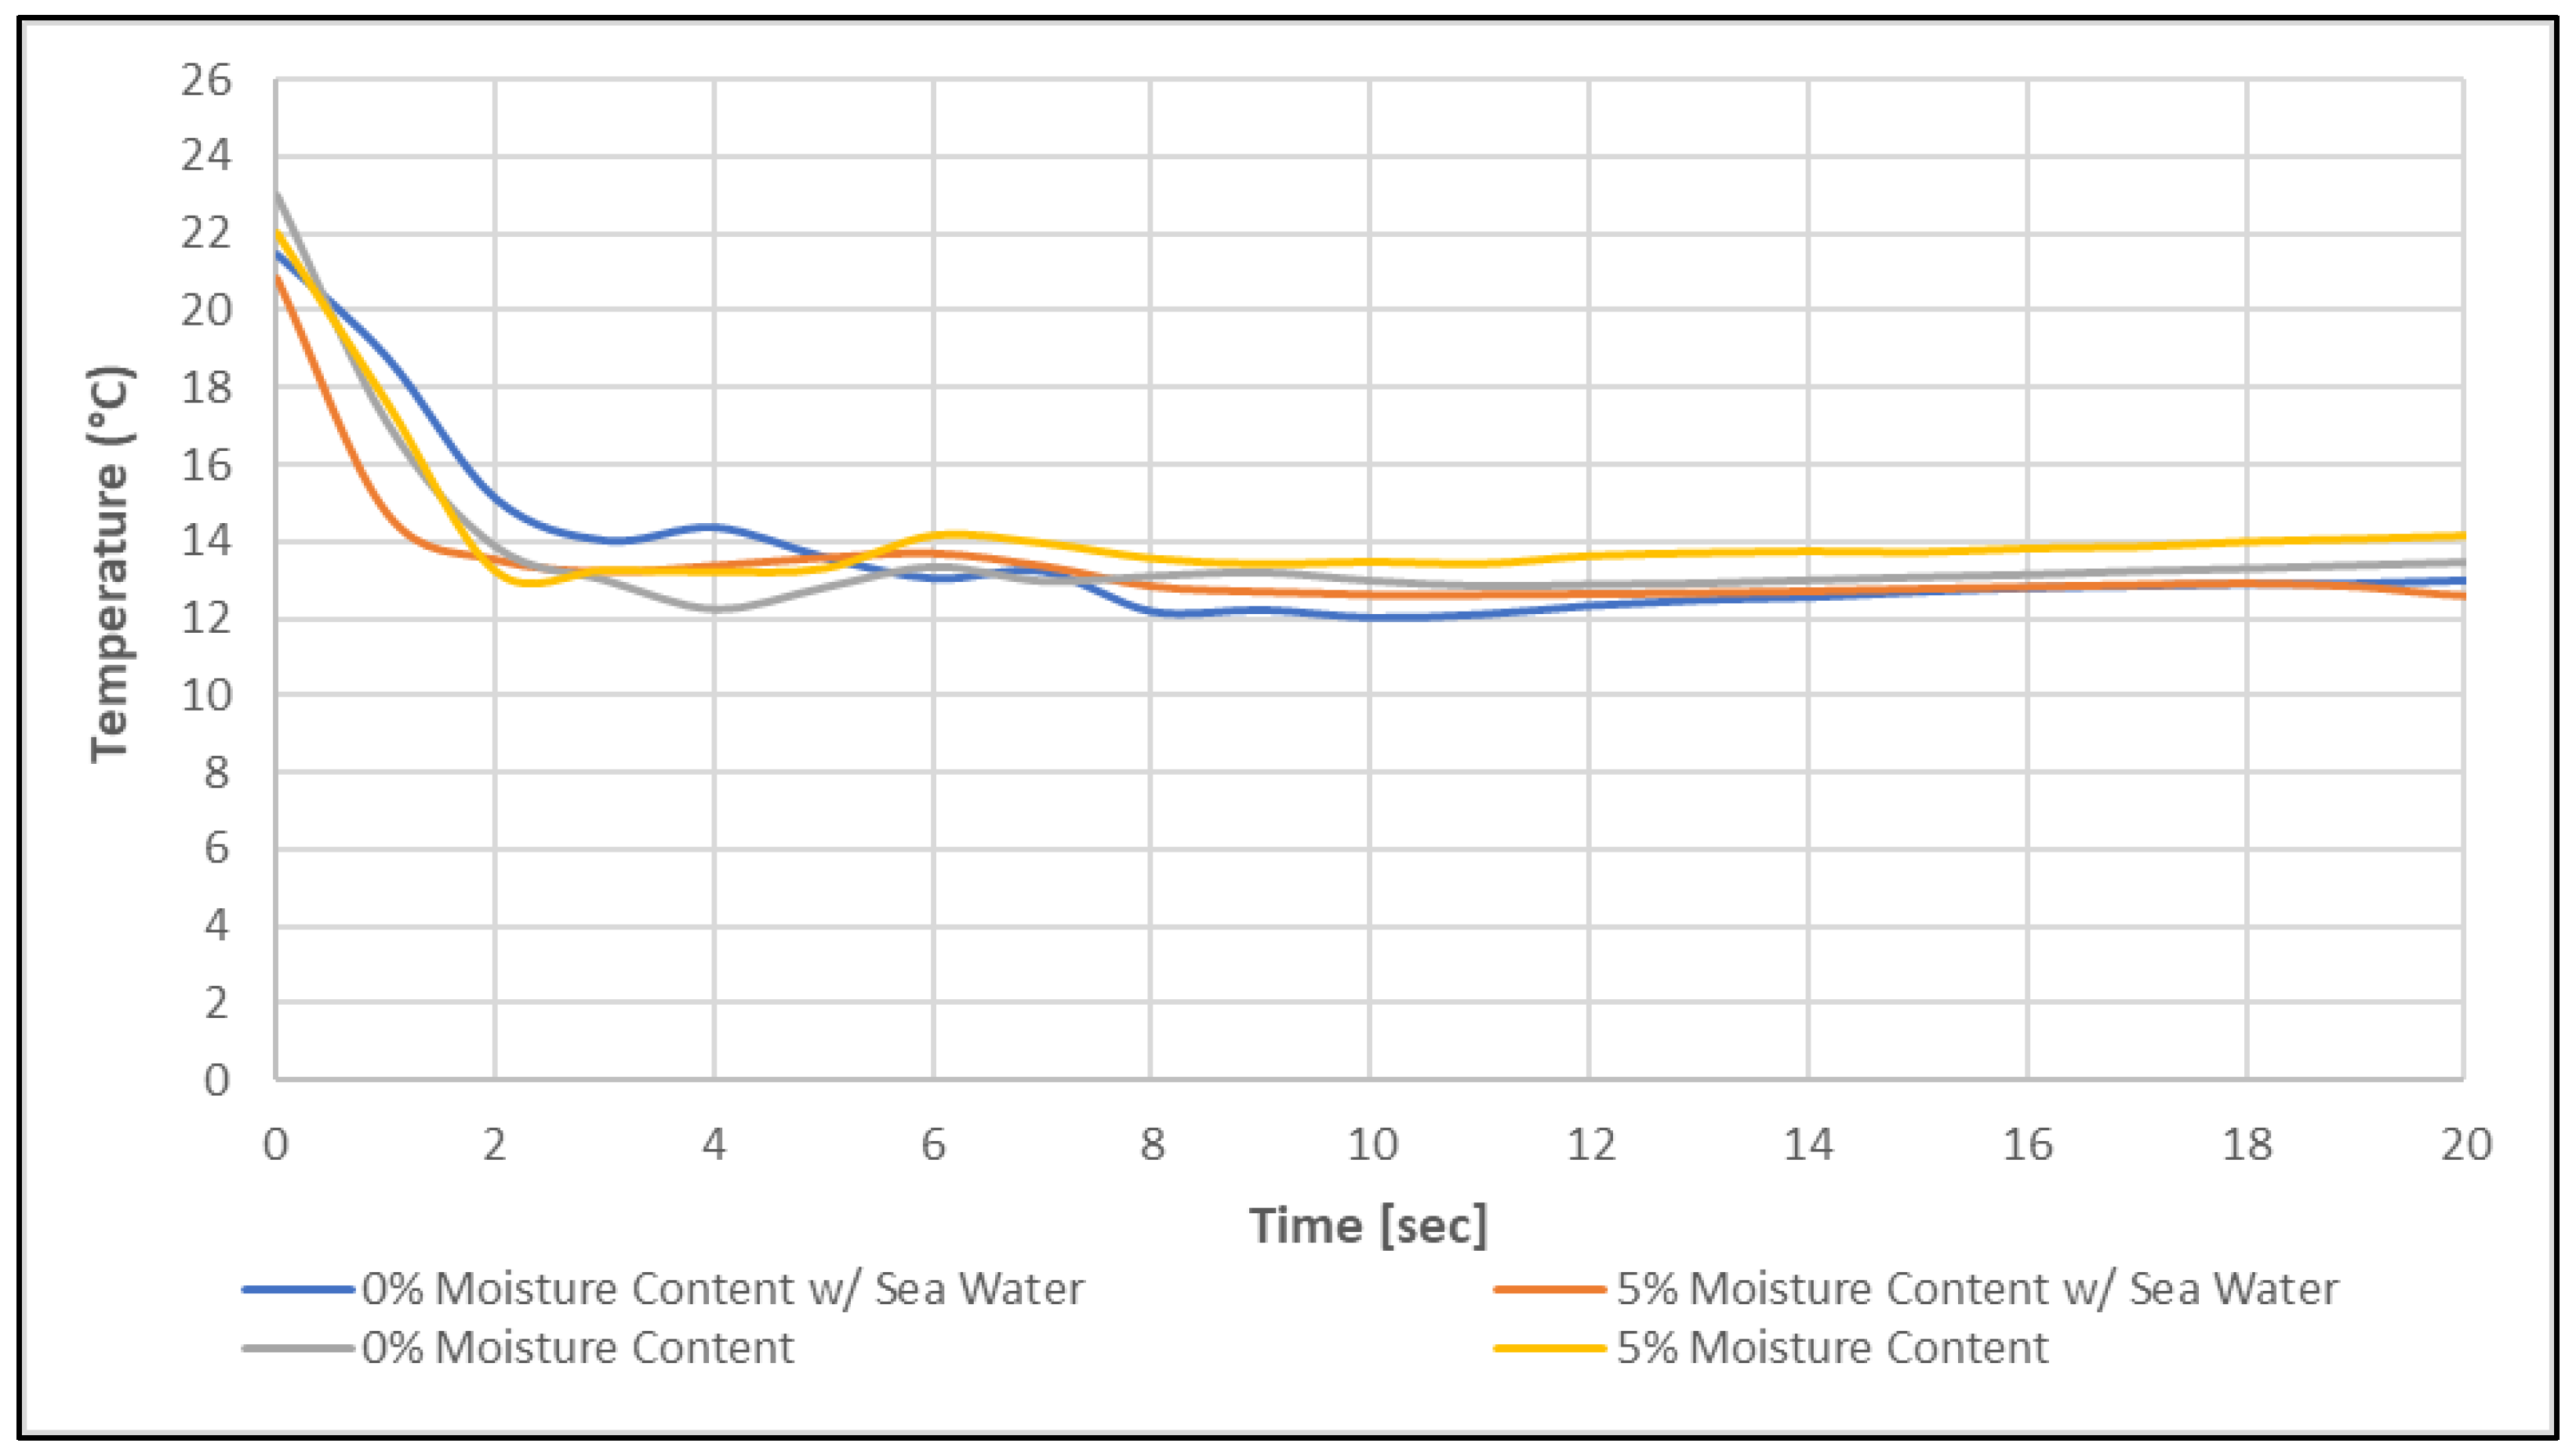
3.4. Performance of Salt Water as an Alternative Water Source
Figure 7 compares the resulting temperature drops when the crushed Potassium Chloride discharging phase was performed using distilled water (Experiment 3 result) and seawater. The temperature response shown in this figure appears to be similar, and no discernible difference can be seen from visual observations. When inspected after the charging phase, the samples did not appear to be any different in color or form.
Table 8 compares the result between the distilled water and seawater.
The temperature drop when distilled water was used has a more extensive range, but both results have a similar range and the averages lie within 0.4 °C of each other. The average final temperatures of the distilled water experiments were 11.5 °C and 12.2 °C for 0% and 5% samples, respectively. For the seawater experiment, the average final temperatures were 11.9 °C and 12.3 °C for 0% and 5% samples, respectively.
As presented above, no discernible difference in performance is a positive result for the overall research as it allows more flexibility for designing the final system. Distilled water is more costly than seawater, so a system employing seawater will be more economical. However, seawater’s salt content accumulation and corrosion effect should also be considered in such a system.
3.5. Small-Scale System Performance of Potassium Chloride
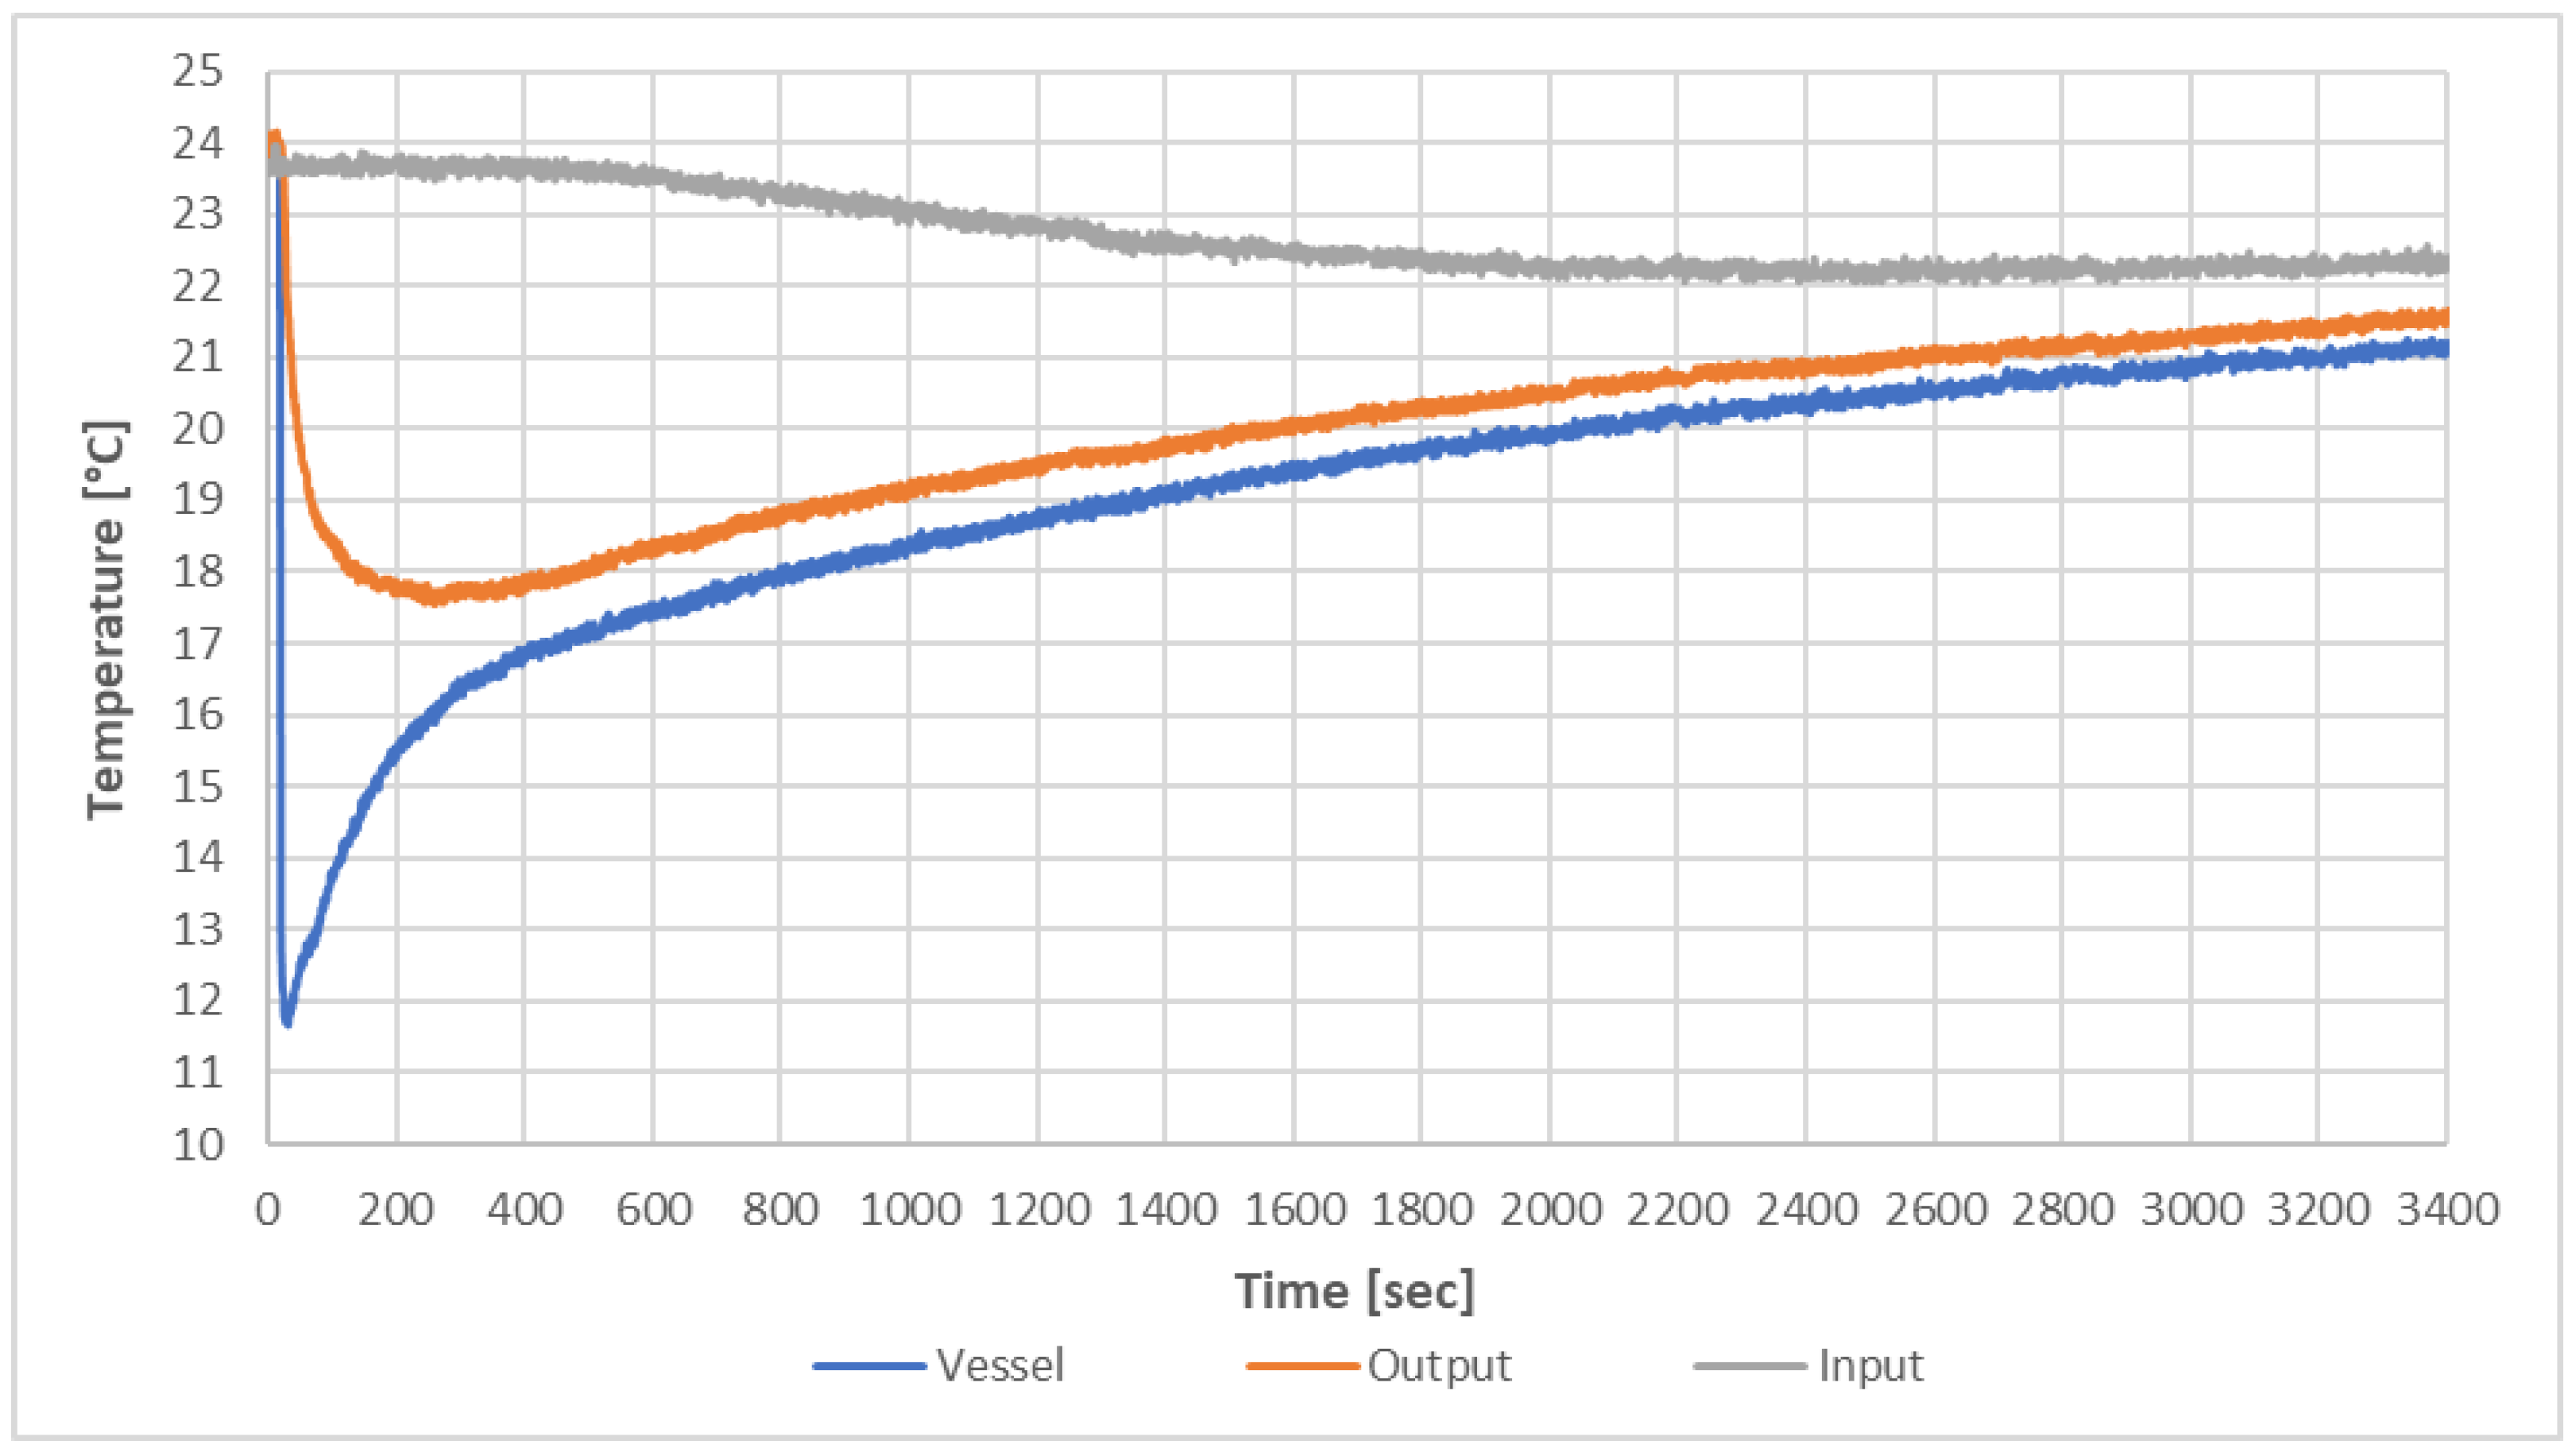
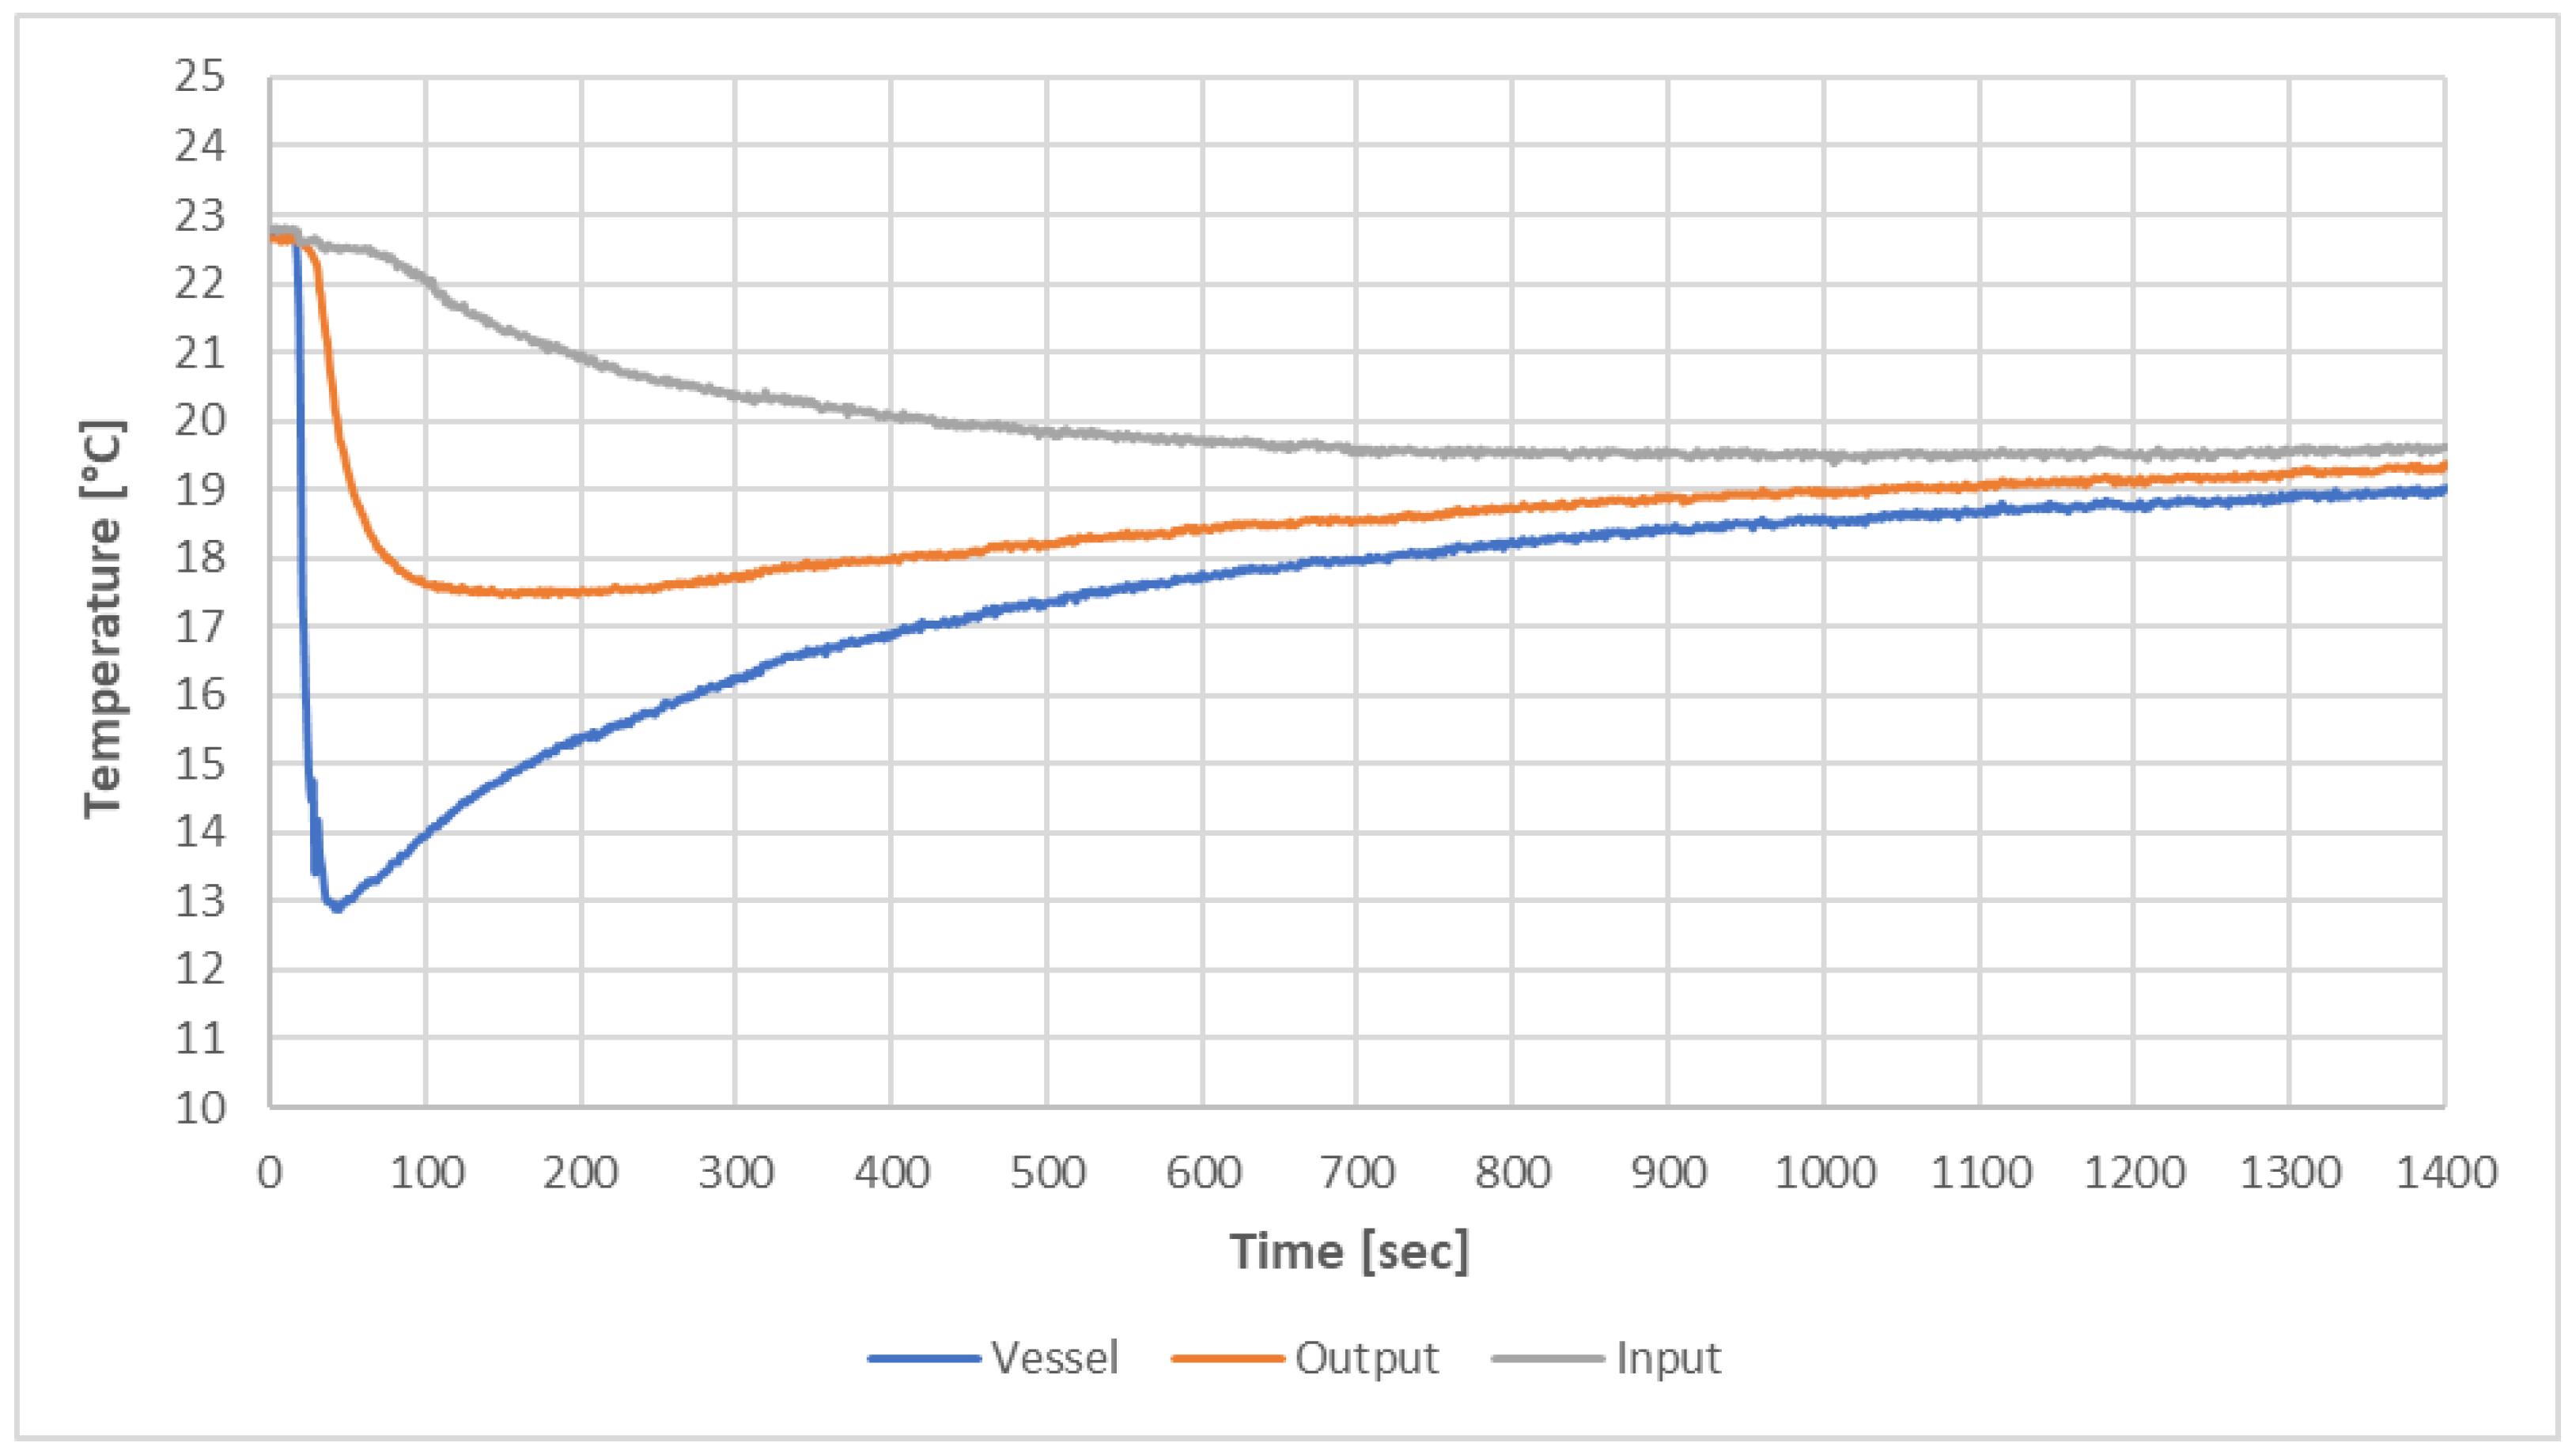
This experiment investigated the temperature response of Potassium Chloride within a small-scale system. The first trial was performed with 850 g of fresh Potassium Chloride and 2050 mL of distilled water dripped over approximately 20 s at a flow rate of 100 mL/s. The result is shown in Figure 8. The vessel temperature quickly dropped to 11.7 °C reducing the outlet water temperature from the coil to 17.6 °C within 241 s after water was dripped into the salt.
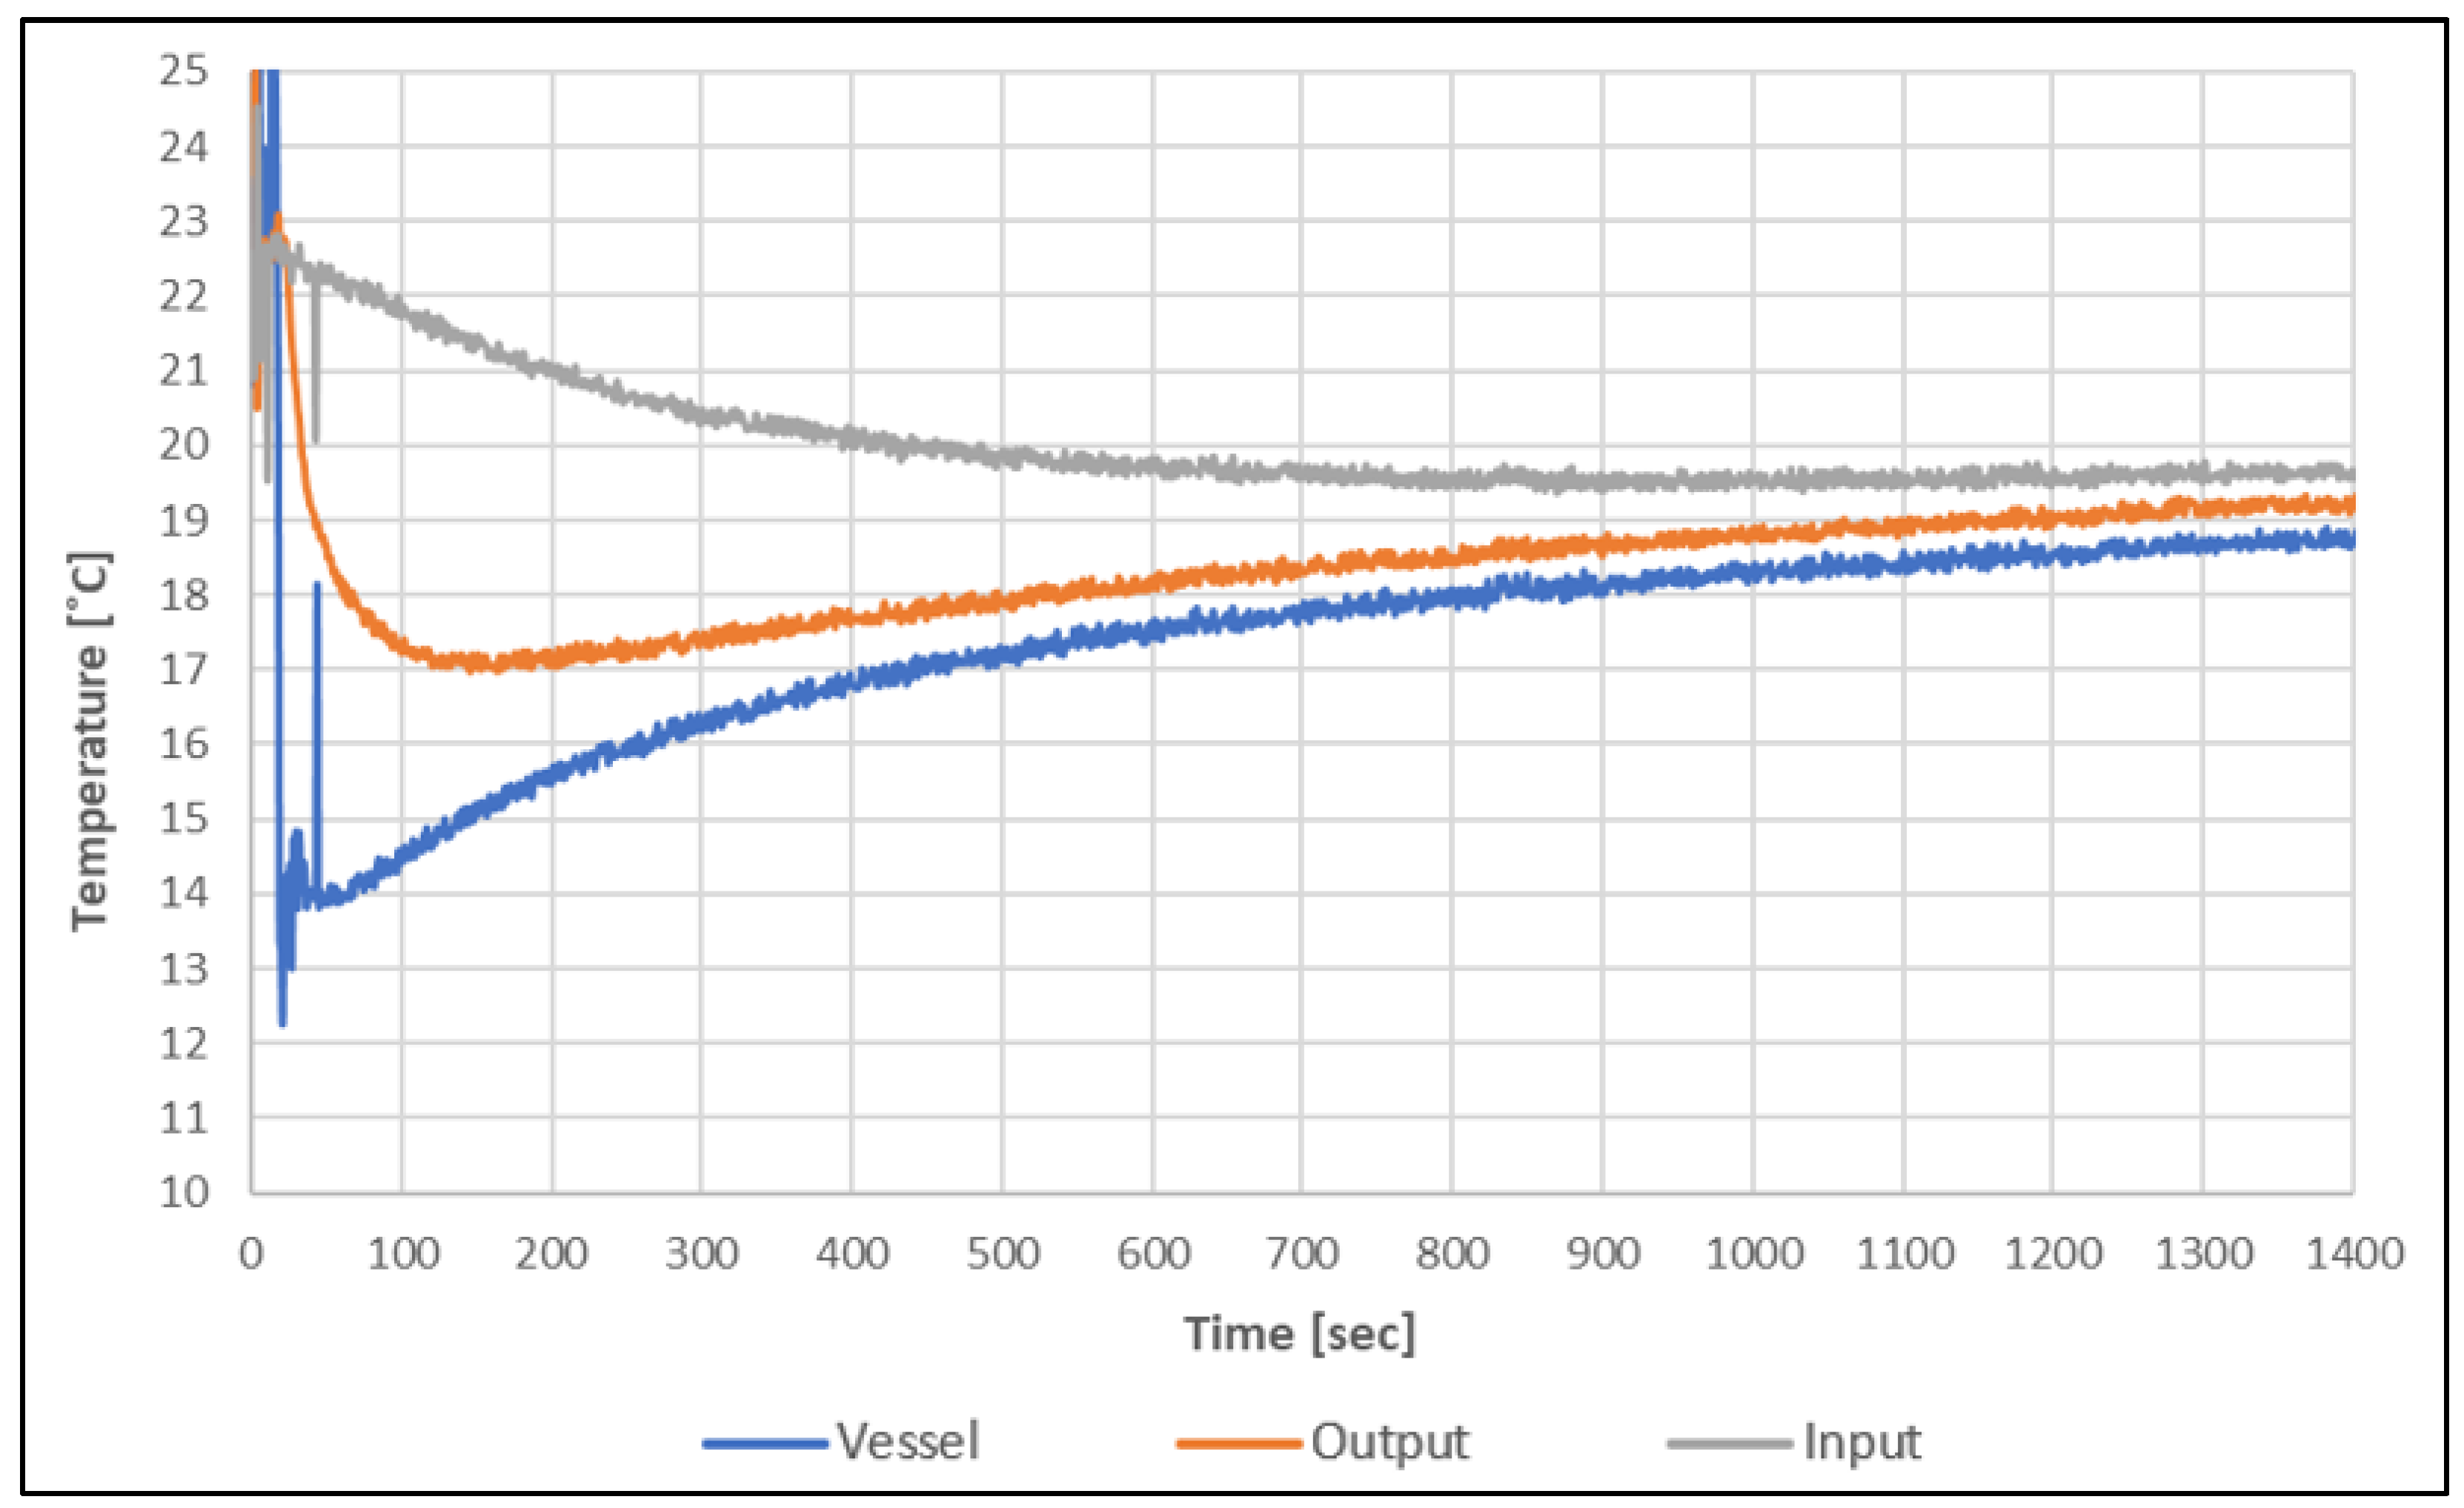
Following the completion of the discharging in the first trial, the potassium chloride slurry was poured into a tray and dried in the convection oven. After the dried salt was put back into the vessel, the second trial of the discharging phase was commenced by adding distilled water to the dried salt at a drip rate of 100 mL/s. The test using the dried salt is a more accurate representation of an actual system, as, in reality, the system will be operated for more than one cycle throughout its life span. The result of the second trial is shown in Figure 9 below.
By comparing the results in Figure 8 and Figure 9, it can be seen that dried salt’s cooling availability period is shorter than fresh potassium chloride’s. As the ambient temperature during the period of these experiments had remained constant, the cooling period was calculated from when water was introduced to the moment the output temperature reached 19 °C. Another trial was conducted using the dried Potassium Chloride but employing a slower water drip rate of 20 mL/s. The trial result is shown in Figure 10.
Table 9 details the key findings of the final two trials with the slow and fast water drip rates.
The variation in the temperature drop suggests that the water drip rate will affect the solution’s minimum temperature and, subsequently, output temperature. In addition, the drip rate of water also appears to influence the longevity of the cooling effect. As shown in Table 9 above, a 20 mL/s drip rate resulted in a 9.4% shorter cooling period and a 7.4% lower performance.
Table 10 and Table 11 show the calculated peak and average output power if soya oil or water were used as heat transfer fluid in the system.
Water performs better than soya oil for the transfer of the generated cooling effect. However, water is limited to transferring heat required for the charging phase, as the required temperature can be higher than 100 °C. From the calculations above, a higher drip rate resulted in a higher peak performance of the system, showing an increase of 14.3%. However, it is at the cost of the ‘average’ performance over the cooling period in which the high drip rate system displayed a performance decrease of 7%. As discussed previously, the extra water principle preferentially leans towards the slow drip rate system, and the drip rate would have to be balanced for the application of the system for the highest possible output. The drip rate is limited by the initial temperature drop; a higher average does not mean anything for cooling applications if the heat transfer medium is not cold enough to be useful.
There are two other key points noted in this experiment. Firstly, a larger surface area is required for the vessel to ensure the highest possible efficiency. Each trial left a bed of Potassium Chloride that was yet to solubilize. In addition, it goes hand in hand with intending to utilize solar energy as the energy source for the charging phase, as a larger surface area will result in a faster salt drying/water evaporation process. However, this will be at the cost of heat loss through the vessel. Depending on how long the system is expected to operate, the heat loss through the vessel’s walls will introduce a breakpoint at which the loss becomes more significant than the gain.
Secondly, the charging method must be chosen carefully depending on the heat load available on site and the cooling load required. In this experiment, oil at 100 °C was initially pumped through the coils to evaporate the water from the solution. It was estimated that the evaporation time would require approximately 6 to 7 h. In reality, the evaporation time was found to be much longer. It was observed that after employing this method for 12 h, less than half the water evaporated. Charging using a heat load rather than solar energy should be avoided when the heat load is less than 100 °C. In the case that a suitable heat load is available, for example, in an industrial application, surface area should continue to be maximized to maximize the solubility of the system. Like the system described in this experiment, a separate heating loop will be required as well as a cooling coil. However, if a suitable heat load is unavailable, for example, in a residential application, the system would become simpler as only the cooling loop will be required.
Efficiency-wise, this experimental set-up showed extremely low efficiency. In this system, 2050 mL of water was used for salt dissolution. Using 2257 kJ/kg as the enthalpy of vaporization, approximately 4500 kJ of energy is required. Therefore, using the highest ‘average’ performance power of 5.46 W, the efficiency would be only 0.12%. Even using the peak performance power of 24.3 W, the efficiency would be 0.57%. Although this efficiency figure has a lot of potential to improve using the methods discussed previously in this section, it is not expected to be significantly higher. It is limited to the theoretical heat of solution and solubility of potassium chloride. An upper limit of 3.63% efficiency can be achieved if 100% of the heat of the solution is extracted. Auckland’s average available solar energy is approximately 13 MJ/m2/day [19]. If this experimental system were applied using solar energy, the required area would be approximately 0.347 m2 and produce between 15.73 W/m2/day and 70 W/m2/day.
4. Conclusions
This paper aimed to investigate the potential of endothermic salt utilization for thermal storage and space-cooling applications. In the salt screening experiment, Sodium Thiosulfate Pentahydrate and Potassium Chloride showed the highest temperature drop among other salts. The performance of these two salts was then compared after being subjected to the charging/discharging cycle. The result showed that dried Potassium Chloride samples have a better cooling performance since they exhibited a smaller cooling effect reduction when compared to the fresh sample.
The Potassium Chloride salt was then experimented in a small-scale system that was developed in the laboratory to model the endothermic salt-based thermal storage and cooling generation system. Using the fresh Potassium Chloride and an initial system temperature of 24 °C, the lowest temperature recorded was 11.7 °C (in the container) and 17.6 °C (at heat transfer fluid). A similar temperature was obtained with the dried Potassium Chloride after it underwent a charging phase; however, the cooling duration was significantly shorter than the fresh salt. A variation of water drip rate during the discharging phase in this system revealed that a slower drip rate at 20 mL/s resulted in a shorter cooling period and lower cooling performance than a 100 mL/s drip rate by 9.4% and 7.4%, respectively.
The experiment shows that a thermal storage and cooling system based on endothermic salt is possible. However, as it has low efficiency, its application is highly limited to low-grade energy for charging processes, such as solar energy and waste heat. Further work is required to improve the system efficiency, such as implementing a higher surface area and better insulation and improving the salt solubility to reduce the energy and time needed for charging (water evaporation/salt drying) phase.
Author Contributions
Conceptualization, D.P., A.A. and M.F.; methodology, D.P., A.A. and M.F.; formal analysis, D.P., A.A. and M.F.; investigation, D.P.; writing—original draft preparation, D.P. and I.H.; writing—review and editing, I.H., A.A. and M.F. All authors have read and agreed to the published version of the manuscript.
Funding
This research received no external funding.
Data Availability Statement
Data sharing is not applicable.
Conflicts of Interest
The authors declare no conflict of interest.
Nomenclature
| BTU | British Thermal Unit |
| COP | International Energy Agency |
| GHG | Greenhouse gas |
| IEA | Coefficient of Performance |
| PCM | Phase Change Material |
| TCES | Thermochemical Energy Storage |
| TCM | Thermochemical material |
| TES | Thermal Energy Storage |
| US EIA | United States of America Energy Information Administration |
| US EPA | United States of America Environmental Protection Agency |
References
- IEA. The Future of Cooling—Opportunities for Energy-Efficient Air Conditioning; IEA: Paris, France, 2018; Available online: https://iea.blob.core.windows.net/assets/0bb45525-277f-4c9c-8d0c-9c0cb5e7d525/The_Future_of_Cooling.pdf (accessed on 1 February 2023).
- US EIA. Annual Energy Outlook 2022 Narrative; US EIA: Washington, DC, USA, 2022. Available online: https://www.eia.gov/outlooks/aeo/narrative/consumption/sub-topic-01.php (accessed on 1 February 2023).
- Thangam, A.; Auckaili, A.; Farid, M. Combination of Passive and Active Solar Heating with Thermal Energy Storage. Molecules 2022, 27, 4386. [Google Scholar] [CrossRef] [PubMed]
- Farid, M.; Auckaili, A.; Gholamibozanjani, G. Thermal Energy Storage with Phase Change Materials; CRC Press: Boca Raton, FL, USA, 2021; pp. 331–358. [Google Scholar]
- US EPA. Renewable Space Cooling. Available online: https://www.epa.gov/rhc/renewable-space-cooling (accessed on 2 February 2023).
- Maidment, G.G.; Paurine, A. Solar Cooling and Refrigeration Systems. In Comprehensive Renewable Energy; Elsevier Ltd.: Amsterdam, The Netherlands, 2012; Volume 3, pp. 481–494. ISBN 9780080878737. [Google Scholar]
- Hayatina, I.; Auckaili, A.; Farid, M. Review on the Life Cycle Assessment of Thermal Energy Storage Used in Building Applications. Energies 2023, 16, 1170. [Google Scholar] [CrossRef]
- N’Tsoukpoe, K.E.; Osterland, T.; Opel, O.; Ruck, W.K.L. Cascade Thermochemical Storage with Internal Condensation Heat Recovery for Better Energy and Exergy Efficiencies. Appl. Energy 2016, 181, 562–574. [Google Scholar] [CrossRef]
- Park, J.-G.; Han, S.-C.; Jang, H.-Y.; Lee, S.-M.; Lee, P.S.; Lee, J.-Y. The Development of Compressor-Driven Metal Hydride Heat Pump (CDMHHP) System as an Air Conditioner. Int. J. Hydrogen Energy 2002, 27, 941–944. [Google Scholar] [CrossRef]
- Ferrucci, F.; Stitou, D.; Ortega, P.; Lucas, F. Mechanical Compressor-Driven Thermochemical Storage for Cooling Applications in Tropical Insular Regions. Concept and Efficiency Analysis. Appl. Energy 2018, 219, 240–255. [Google Scholar] [CrossRef]
- Desai, F.; Atayo, A.; Prasad, J.S.; Muthukumar, P.; Rahman, M.; Asmatulu, E. Experimental Studies on Endothermic Reversible Reaction of Salts for Cooling. Heat Transf. Eng. 2021, 42, 1107–1116. [Google Scholar] [CrossRef]
- Telkes, M. Cooling System. U.S. Patent No. US 4010620, 8 March 1977. [Google Scholar]
- Landau, L.D.; Akhiezer, A.I.; Lifshitz, E.M. SOLUTIONS §77. Solubility. In General Physics; Landau, L.D., Akhiezer, A.I., Lifshitz, E.M., Eds.; Pergamon: Oxford, UK, 1967; pp. 230–251. ISBN 9780080091068. [Google Scholar]
- Leavitt, D.D.; Bergida, J.R. Cooling Agent for Cold Packs and Food and Beverage Containers. U.S. Patent No. US 2012/0138848 A1, 7 June 2012. [Google Scholar]
- Kruckman, J.; Chang, J. Dry Instant Cold Pack and Method of Use. U.S. Patent No. US 2016/0258667 A1, 8 September 2016. [Google Scholar]
- Desai, F.; Sunku Prasad, J.; Muthukumar, P.; Rahman, M.M. Thermochemical Energy Storage System for Cooling and Process Heating Applications: A Review. Energy Convers Manag. 2021, 229, 113617. [Google Scholar] [CrossRef]
- Felder, R.M. Elementary Principles of Chemical Processes, 4th ed.; Wiley: Hoboken, NJ, USA, 2018; ISBN 9781119192138. [Google Scholar]
- Furbo, S. Heat Storage Units Using a Salt Hydrate as Storage Medium Based on the Extra Water Principle; Technical University of Denmark: Kongens Lyngby, Denmark, 1982; Available online: https://backend.orbit.dtu.dk/ws/portalfiles/portal/234633119/lfv_116.pdf (accessed on 1 February 2023).
- Liley, B.; Tait, A.; Bodeker, G. Solar Energy; NIWA: Auckland, New Zealand, 2005; Volume 13, Available online: https://niwa.co.nz/publications/water-and-atmosphere/vol13-no4-december-2005/solar-energy (accessed on 1 February 2023).
Figure 1.
Copper coil and experimental set-up configuration.

Figure 2.
Experimental System Configuration and Thermocouple Locations.

Figure 3.
Temperature profile of saturated salt solution during salt screening experiment.

Figure 4.
Temperature profile of Sodium Thiosulfate Pentahydrate.

Figure 5.
Temperature profile of potassium chloride.

Figure 6.
Temperature profile of crushed Potassium Chloride.

Figure 7.
Temperature response of dried and crushed Potassium Chloride using seawater.

Figure 8.
Temperature profile of small-scale system containing fresh Potassium Chloride.

Figure 9.
System temperature response of dried Potassium Chloride at 100 mL/s water drip rate.

Figure 10.
System temperature response of dried Potassium Chloride at 20 mL/s water drip rate.


Table 1.
Salt solubility and water added during Experiment 1.
| Material | Solubility (20 °C) [17] | Salt Weight (g) | Water Used for Hydration (mL) | Water Added for Saturation (mL) |
|---|---|---|---|---|
| Sodium Thiosulfate Pentahydrate (Na2S2O3·5H2O) | 70.1 g/100 mL | 6.4 | 3.6 | 5.46 |
| Disodium Phosphate Dodecahydrate (Na2HPO4·12H2O) | 7.7 g/100 mL | 1.9 | 8.1 | 17.1 |
| Sodium Carbonate Decahydrate (Na2CO3·10H2O) | 21.8 g/100 mL | 3.8 | 6.3 | 10.7 |
| Potassium Chloride (KCl) | 34.2 g/100 mL | 10.0 | 0 | 29.2 |
| Potassium Nitrate (KNO3) | 33.0 g/100 mL | 10.0 | 0 | 30.3 |
Table 2.
Temperature response of saturated solution.
| Sample (10 g of Salt) | Final Temp (°C) | Final Time (s) | Temp Drop (°C) |
|---|---|---|---|
| Sodium Thiosulfate Pentahydrate | 6.9 | 31 | 14.1 |
| Sodium Carbonate Decahydrate | 14.2 | 127 | 6.8 |
| Disodium Phosphate Dodecahydrate | 19.2 | 51 | 1.8 |
| Potassium Chloride | 10.8 | 60 | 10.2 |
| Potassium Nitrate | 11.3 | 73 | 9.7 |
Table 3.
Final temperature and time of dried Sodium Thiosulfate Pentahydrate samples.
| Sample | Final Temperature (°C) | Final Time (s) |
|---|---|---|
| 0% Moisture Content | 14.2–15.7 | 94.9–186.4 |
| 5% Moisture Content | 13.5–14.1 | 49.8–104.2 |
| 10% Moisture Content | 12.6–12.7 | 266.8–288.3 |
Table 4.
Temperature drops of dried Sodium Thiosulfate Pentahydrate samples.
| Sample | Temp. Drop (°C) | Performance Change (Compared to Fresh Sample) |
|---|---|---|
| 0% Moisture Content | 5.3–6.8 | −63–−52% |
| 5% Moisture Content | 7.0–7.5 | −51–−47% |
| 10% Moisture Content | 8.4–8.5 | −40% |
Table 5.
Final temperature and time of dried Potassium Chloride samples.
| Sample | Final Temperature (°C) | Final Time (s) |
|---|---|---|
| 0% Moisture Content | 11.3–11.8 | 19.68–42.32 |
| 5% Moisture Content | 9.7–10.1 | 13.76–52.24 |
| 10% Moisture Content | 11.6–13.8 | 25.61–32.39 |
Table 6.
Temperature drops of dried Potassium Chloride samples.
| Sample | Temp. Drop (°C) | Performance Change (Compared to Fresh Sample) |
|---|---|---|
| 0% Moisture Content | 9.2–9.7 | −10–−4% |
| 5% Moisture Content | 10.9–11.3 | 7–12% |
| 10% Moisture Content | 7.2–9.4 | −30–−7% |
Table 7.
Final temperature and temperature drop of crushed potassium chloride.
| Sample | Final Temp. (°C) | Temp. Drop (°C) | Performance Change (Compared to Fresh Salt) |
|---|---|---|---|
| 0% Moisture Content | 9. 8–13.1 | 9.9–13.2 | −2.8–30.2% |
| 5% Moisture Content | 9.7–14.6 | 8.4–13.3 | −17.4–31.0% |
Table 8.
Comparison of performance of dried and crushed Potassium Chloride using seawater.
| Sample | Final Temp. (°C) | Temp. Drop (°C) (Distilled Water) | Temp. Drop (°C) (Seawater) |
|---|---|---|---|
| 0% Moisture Content | 11.4–13.0 | 9.9–13.2 | 10.5–11.8 |
| 5% Moisture Content | 13.3–13.9 | 8.4–13.3 | 9.4–10.0 |
Table 9.
System temperature drops at both drip rates.
| Drip Rate (mL/s) | Temp. Drop of Vessel (°C) | Temp. Drop of Output (°C) | Time to Reach 19 °C (s) |
|---|---|---|---|
| 100 | 11.7 | 7.0 | 1060 |
| 20 | 11.1 | 6.5 | 960 |
Table 10.
System power output (peak).
| Drip Rate (mL/s) | ∆T1 | ∆T2 | ∆TLMTD | Qoil (W) | Qwater (W) |
|---|---|---|---|---|---|
| 20.00 | 9.2 | 8.9 | 9.1 | 10.95 | 21.3 |
| 100.00 | 10.5 | 10.2 | 10.4 | 12.5 | 24.3 |
Table 11.
System power output (average over the cooling period).
| Drip Rate (mL/s) | ∆T1 | ∆T2 | ∆TLMTD | Qoil (W) | Qwater (W) |
|---|---|---|---|---|---|
| 20.00 | 1.5 | 3.4 | 2.3 | 2.8 | 5.5 |
| 100.00 | 1.2 | 3.5 | 2.2 | 2.6 | 5.1 |
Disclaimer/Publisher’s Note: The statements, opinions and data contained in all publications are solely those of the individual author(s) and contributor(s) and not of MDPI and/or the editor(s). MDPI and/or the editor(s) disclaim responsibility for any injury to people or property resulting from any ideas, methods, instructions or products referred to in the content. |
© 2023 by the authors. Licensee MDPI, Basel, Switzerland. This article is an open access article distributed under the terms and conditions of the Creative Commons Attribution (CC BY) license (https://creativecommons.org/licenses/by/4.0/).
Share and Cite
MDPI and ACS Style
Park, D.; Hayatina, I.; Farid, M.; Auckaili, A. Experimental Work on Salt-Based Cooling Systems. Thermo 2023, 3, 200-215. https://doi.org/10.3390/thermo3010012
AMA Style
Park D, Hayatina I, Farid M, Auckaili A. Experimental Work on Salt-Based Cooling Systems. Thermo. 2023; 3(1):200-215. https://doi.org/10.3390/thermo3010012
Chicago/Turabian StylePark, Damian, Isye Hayatina, Mohammed Farid, and Amar Auckaili. 2023. "Experimental Work on Salt-Based Cooling Systems" Thermo 3, no. 1: 200-215. https://doi.org/10.3390/thermo3010012