1. Introduction
Glycolic acid (GA), the smallest α-hydroxy acid, is a suitable prototype molecule for photochemical studies. The molecular structure of GA, with functional OH groups at both ends of the molecule, and its ability to form inter- and intramolecular hydrogen bonds gives versatile possibilities to investigate how vibrational energy relaxes and redistributes in the molecule and how hydrogen bonding affects these relaxation processes [
1,
2]. The three lowest energy conformers of GA are populated at room temperature, and they offer a set of probe conformers for both dissociative and non-dissociative photochemical studies.
Most photochemical studies have focused on the vibrational excitations on the electronic ground state, both in the gas phase and in low temperature matrices [
3,
4,
5,
6,
7,
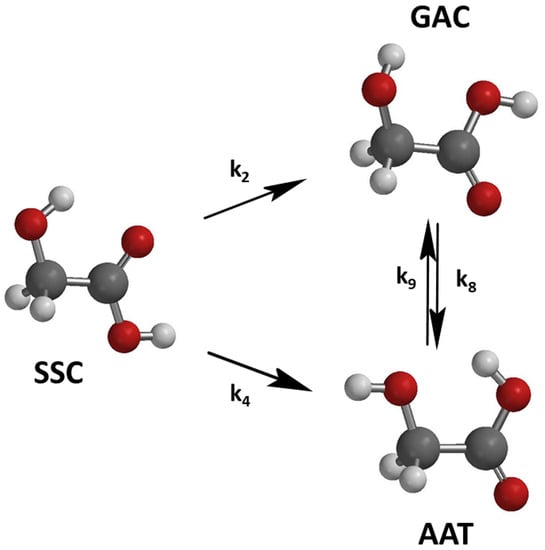
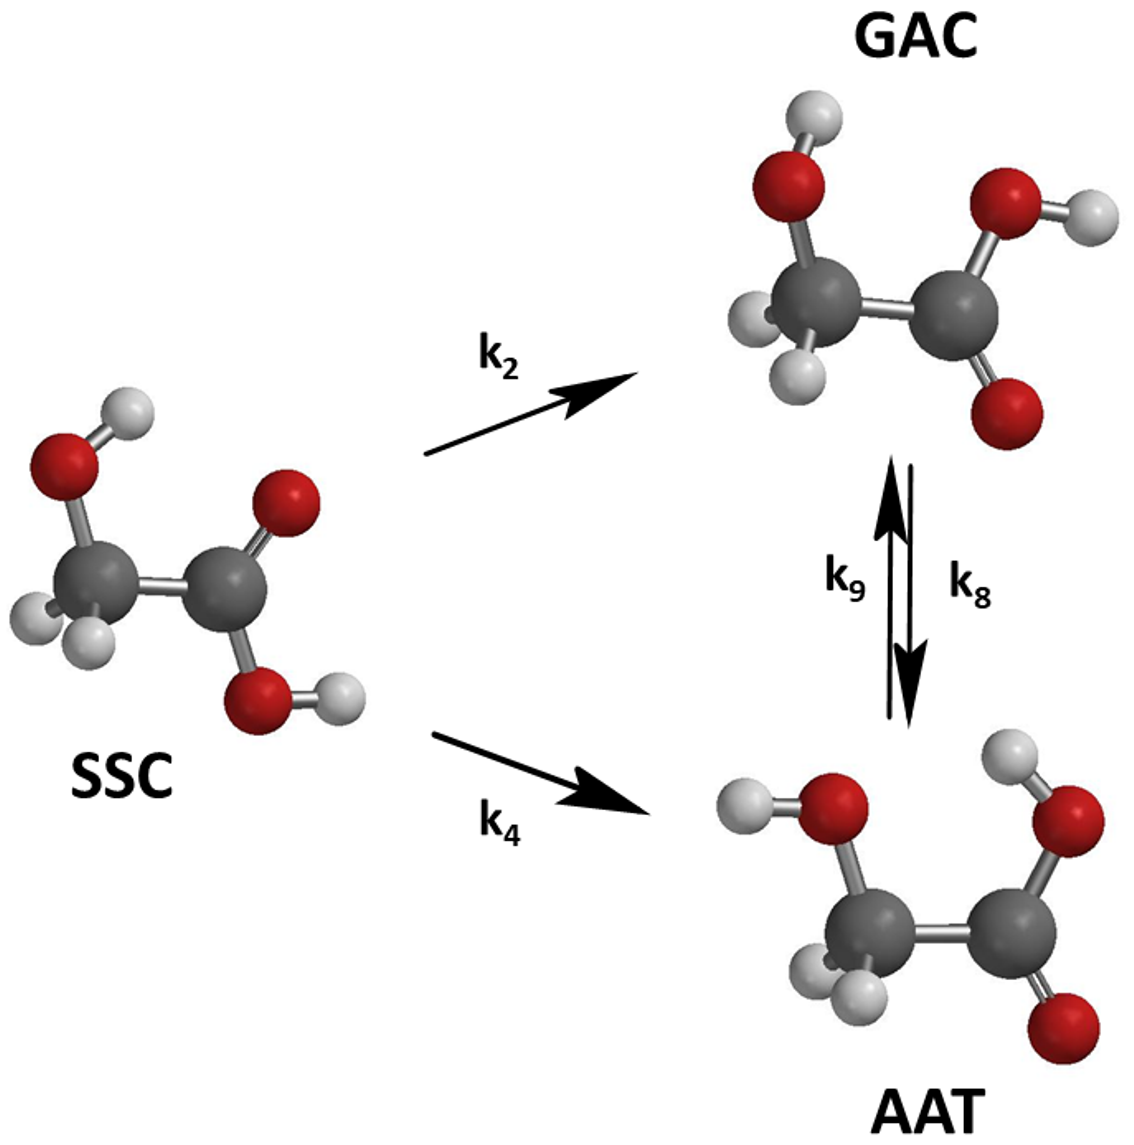
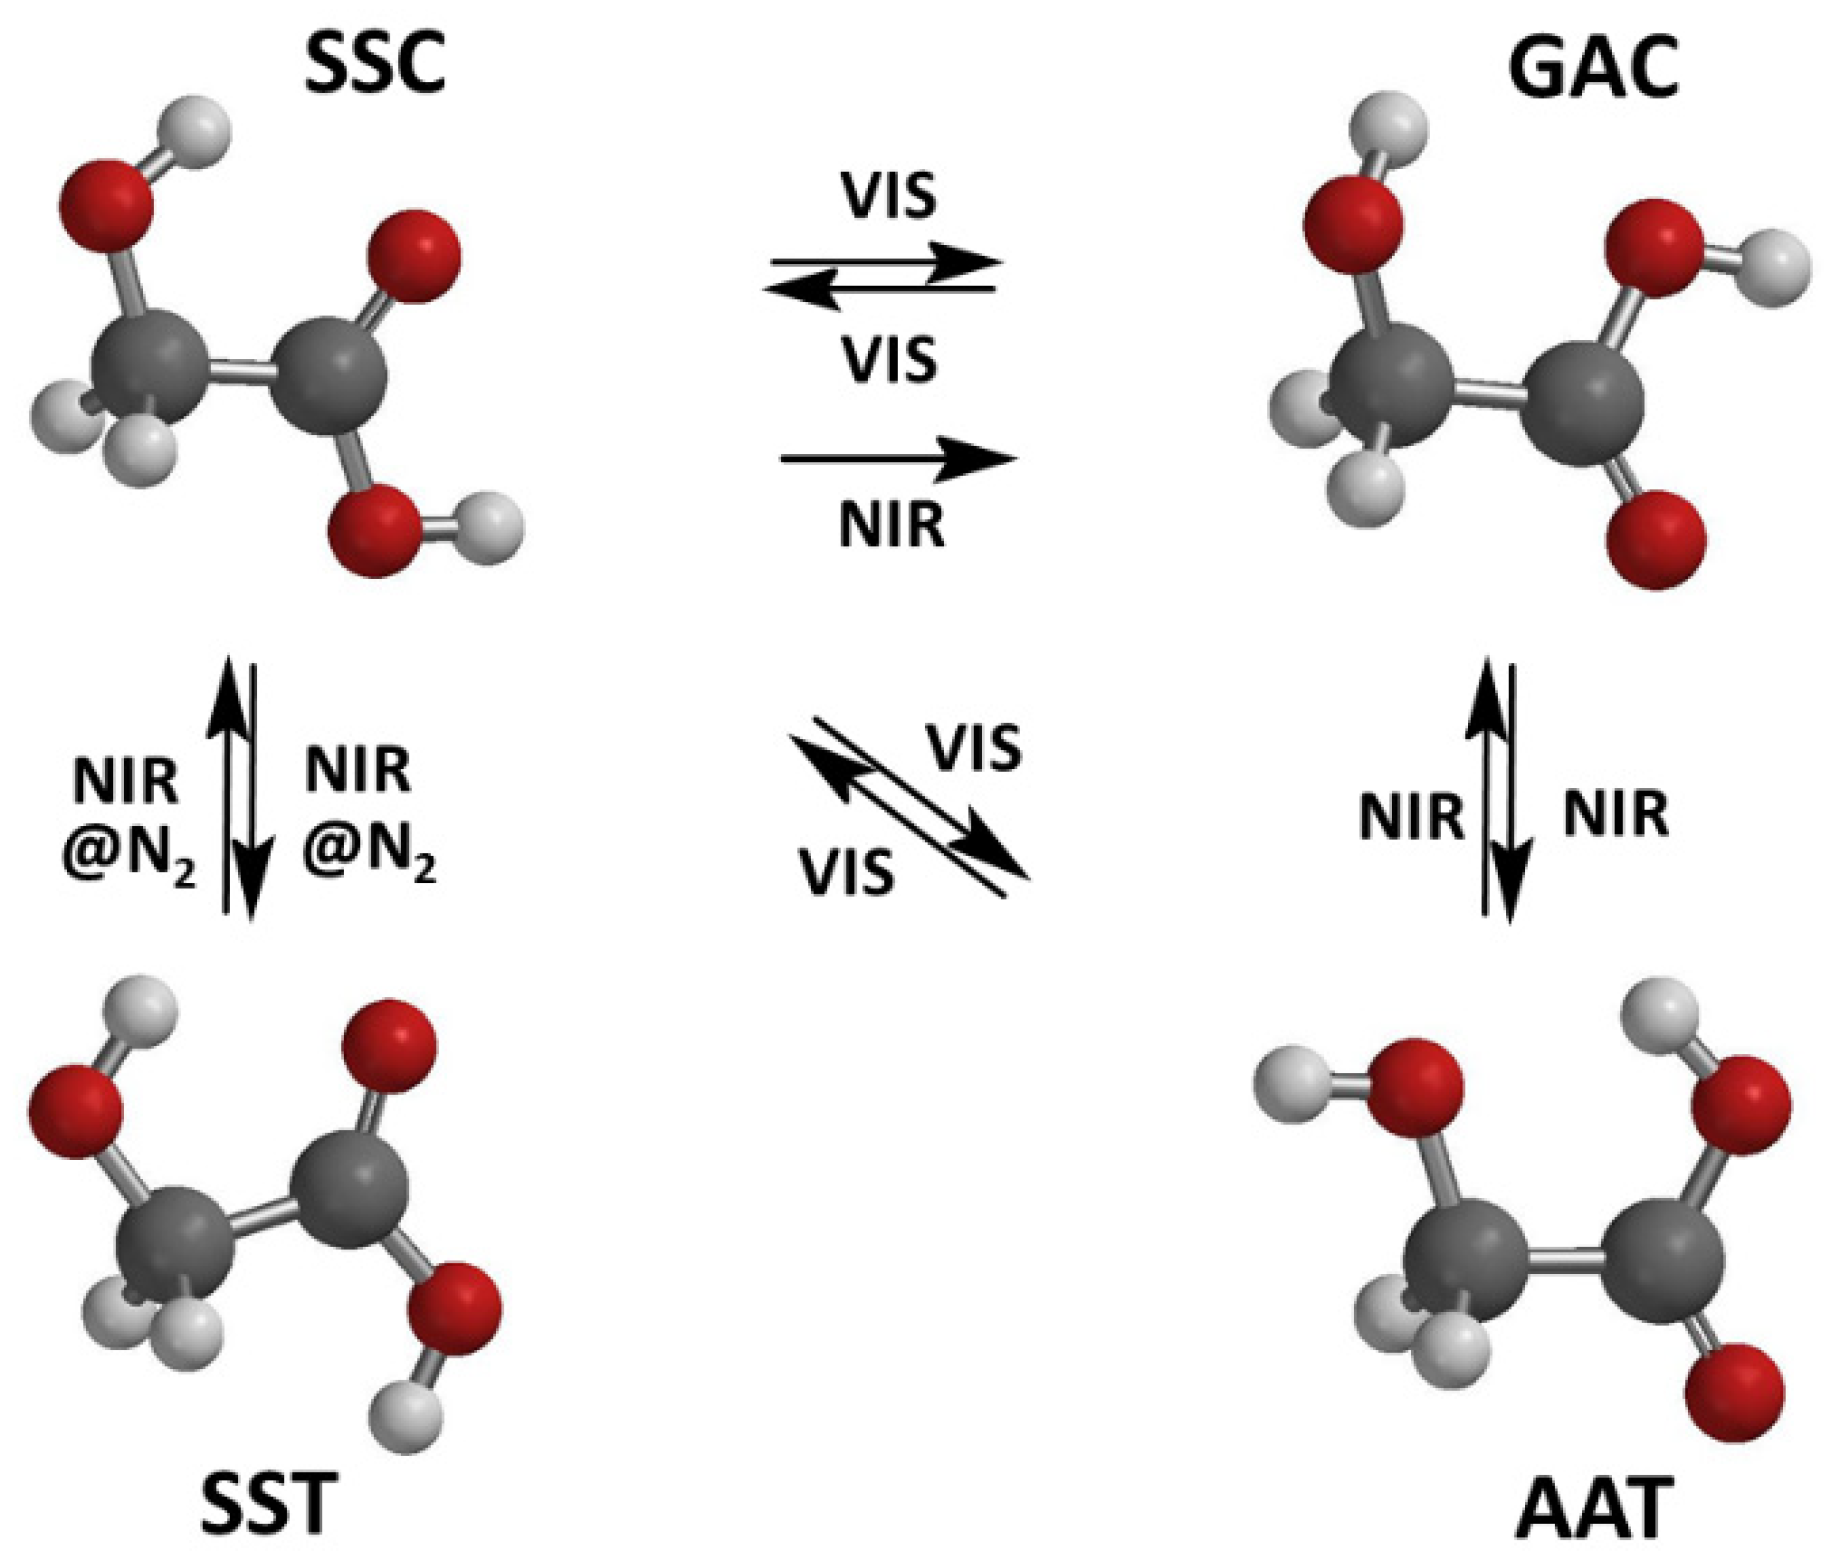
8]. The reported light-induced processes reported in the literature for glycolic acid isolated in low-temperature matrix experiments are shown in
Figure 1. Broadband infrared excitation of GA initiates conformational photo-isomerization reactions [
3,
4,
5]. Selective conformational photo-isomerization reactions between the conformers can be initiated by near-infrared excitation of first and second OH stretching overtones [
6,
7]. At shorter wavelengths, the excitation of high OH stretching overtones by visible light, at 532 nm, is also followed by conformational photo-isomerization reactions [
8]. Photons from visible to infrared light were then found to be capable of vibrationally exciting GA in the electronic ground state and, thus, capable of initiating isomerization processes. Recently, Krupa et al. [
8] widened the wavelength range of the photochemical studies of GA to ultraviolet radiation. They investigated the photochemistry of GA in an argon matrix using laser light at 212 and 226 nm. The ultraviolet excitation led to the photo-isomerization and photodissociation of GA. The main dissociation channels produced molecular complexes of formaldehyde and water with carbon monoxide [
9].
Previous photochemical studies show that the conformational photo-isomerization of GA can be initiated by both vibrational excitations on the electronic ground state and electronic excitations, while only the latter also leads to photodissociation. The competing isomerization and dissociation reactions raise an exciting research question: what are the photodissociation and photo-isomerization kinetics of individual conformers? The kinetics of individual conformers is essential information to estimate how changes in relative concentrations of the conformers affect the ultraviolet photokinetics of GA. For example, in some instances, such as atmospheric or interstellar environments, longer wavelengths can also be available for vibrational excitation. GA is present in the atmosphere [
10], where the wavelength intensity distribution repeatedly changes so that a wide variety of excitations can happen depending on the sunlight spectrum and the conditions of a specific atmospheric region [
11,
12,
13]. The mechanisms in narrow wavelength ranges are of prime importance for understanding the overall photochemical mechanisms in the case of broad spectral range excitations. So far, only a kinetic model for the high overtone excitation-induced isomerization reactions of GA has been proposed [
8].
The present study aims to develop a kinetic model to describe the ultraviolet-induced photochemistry of GA. The model provides a better understanding of the processes that follow the electronic excitation of the molecule. Together with the previous studies on the electronic ground state photochemistry of GA, the present work promotes an understanding of how different mechanisms could affect the photochemistry of a single molecule when photons from infrared to ultraviolet are available for excitations.
2. Materials and Methods
The GA/argon matrices were prepared by passing an argon gas (Messer 5.0) flow over solid GA (Janssen Chimica, Warsaw, Poland, purity 99% or Sigma-Aldrich, Lisbon, Portugal, Reagent Plus®, purity 99%) at room temperature. This method yields suitable monomeric matrices, even though the guest-to-host ratio can be controlled only by the gas flow rate and temperature of the substrate. A precise guest-to-host ratio is unspecified throughout the study. The typical deposition temperature was 15 K, and measurements were performed at 10–15 K.
Ultraviolet photolysis at 212, 226, and 230 nm was performed in Wrocław, and near-infrared photolysis with subsequent 230 nm photolysis experiments were carried out in Coimbra. The experimental setup in Wrocław consisted of a closed-cycle helium cryostat APD-Cryogenics (ARS-2HW), equipped with CsI windows; a Bruker IFS 66 FTIR spectrometer, equipped with a liquid N
2 cooled MCT detector; a Scientific Instruments 9700 temperature controller, equipped with a silicon diode; a UV radiation source; and the frequency-doubled signal beam of a pulsed (7 ns, repetition rate of 10 Hz) optical parametric oscillator Vibrant (Opotek Inc., Carlsbad, CA, USA), pumped with an Nd:YAG laser (Quantel, Lannion, France). For more details, refer to Ref. [
9].
The experimental setup in Coimbra consisted of a closed-cycle helium cryostat APD-Cryogenics (DE-202A), equipped with external KBr windows and with a CsI substrate mounted at the cold tip of the cryostat; a Thermo Nicolet 6700 FTIR spectrometer, purged through the optical path with dry, CO2-filtered air to avoid interference of atmospheric H2O and CO2, equipped with a deuterated triglycine sulfate detector (DTGS) and a KBr beam splitter; and a Scientific Instruments, model 9650-1 temperature controller, equipped with a silicon diode; NIR radiation source: tunable narrowband (∼0.2 cm−1 spectral width) light generated by the idler beam of a Quanta-Ray MOPO-SL optical parametric oscillator (OPO), pumped by a pulsed Nd:YAG laser (pulse duration: 10 ns; repetition rate: 10 Hz). UV radiation source: same as for the NIR irradiation, but in this case, the frequency-doubled signal beam of the OPO has been used.
Mathematica software was used for the analytical solutions of the differential equations and data fitting [
14]. The built-in functions DSolve and NonLinearModelFit of the software were utilised.
3. Results
We studied the UV photochemistry of the three most abundant conformers of GA (SSC, GAC, and AAT) in low-temperature argon matrices. Three different laser wavelengths (212, 226, and 230 nm) were used in the photodissociation studies. The initial relative concentrations of the conformers were varied before ultraviolet photodissociation using NIR irradiation with the photon energies of 6954 cm−1.
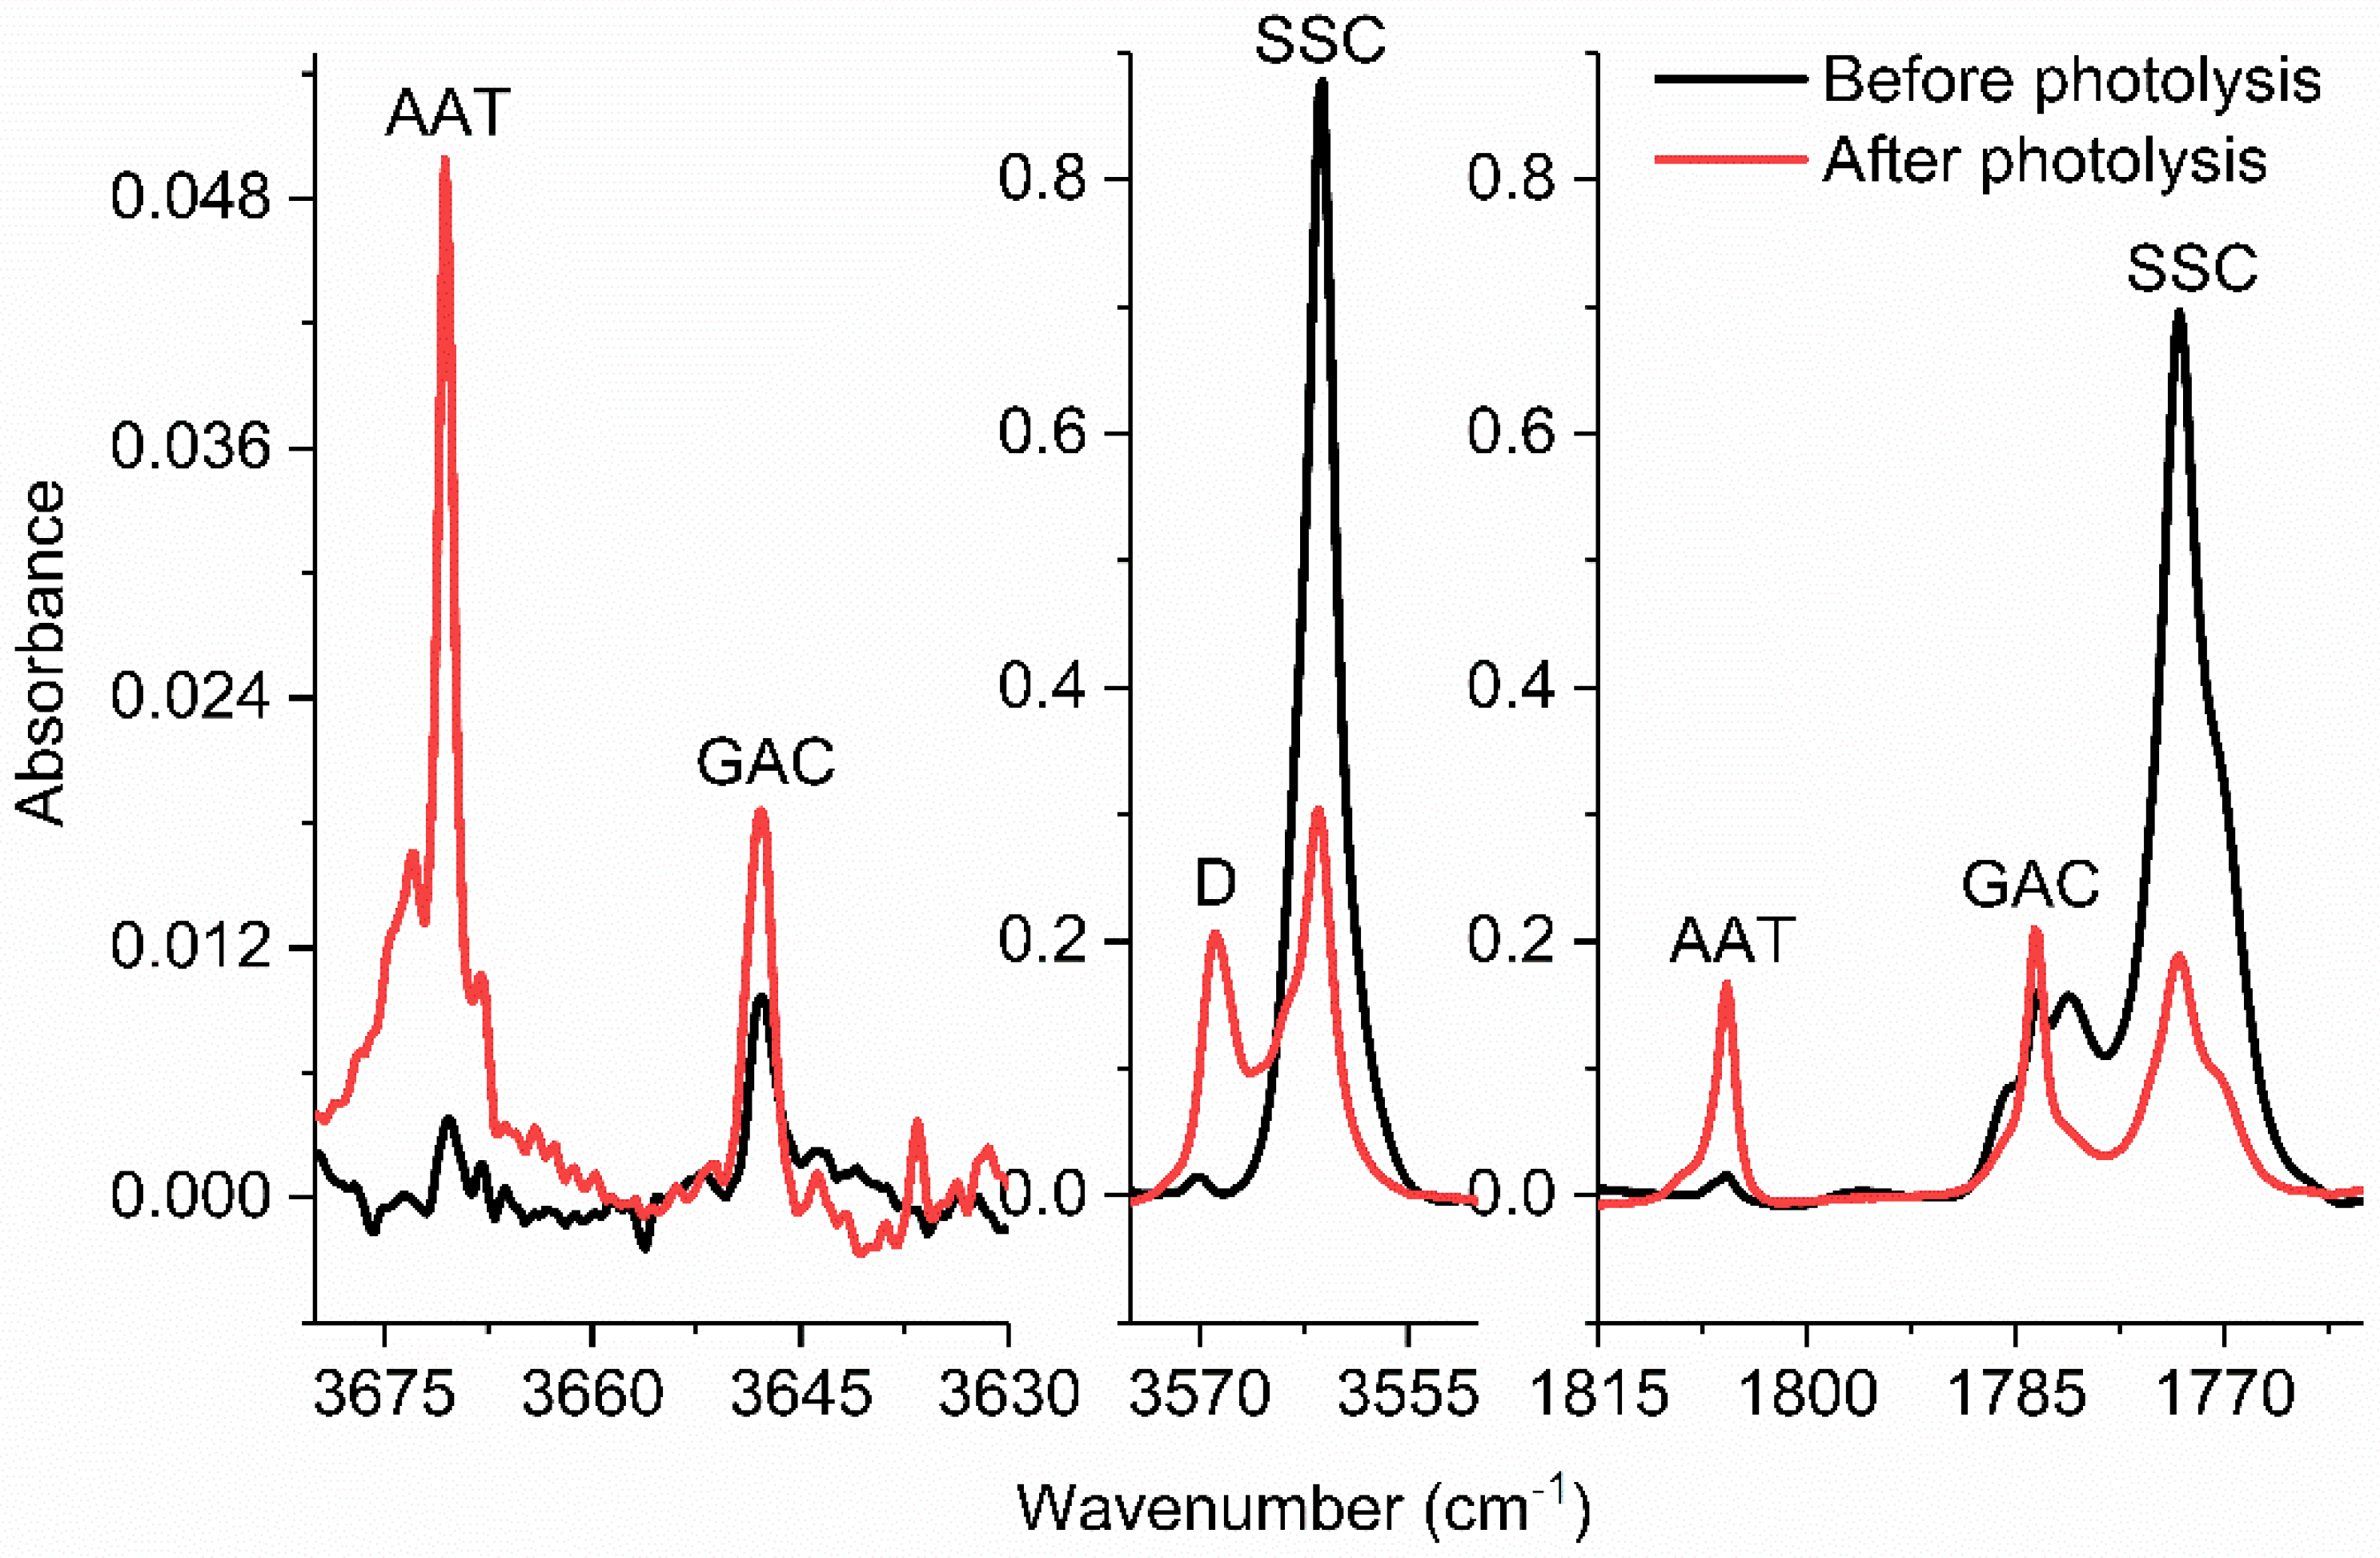
The first set of photodissociation experiments consisted of UV photodissociation of freshly deposited samples of GA in an argon matrix. After deposition, three conformers of GA were identified in the IR spectra (
Figure 2) [
3,
6]. The SSC conformer shows the strongest absorbance, reflecting its higher relative concentration than the other conformers used under the experimental conditions. The relative populations of the SSC, GAC, and AAT conformers at room temperature, obtained from a previous computational study, are 94.8, 3.7, and 1.3%, respectively [
8]. The photolysis of GA in an argon matrix at 212 and 226 nm yielded similar results, in agreement with a recent report [
9].
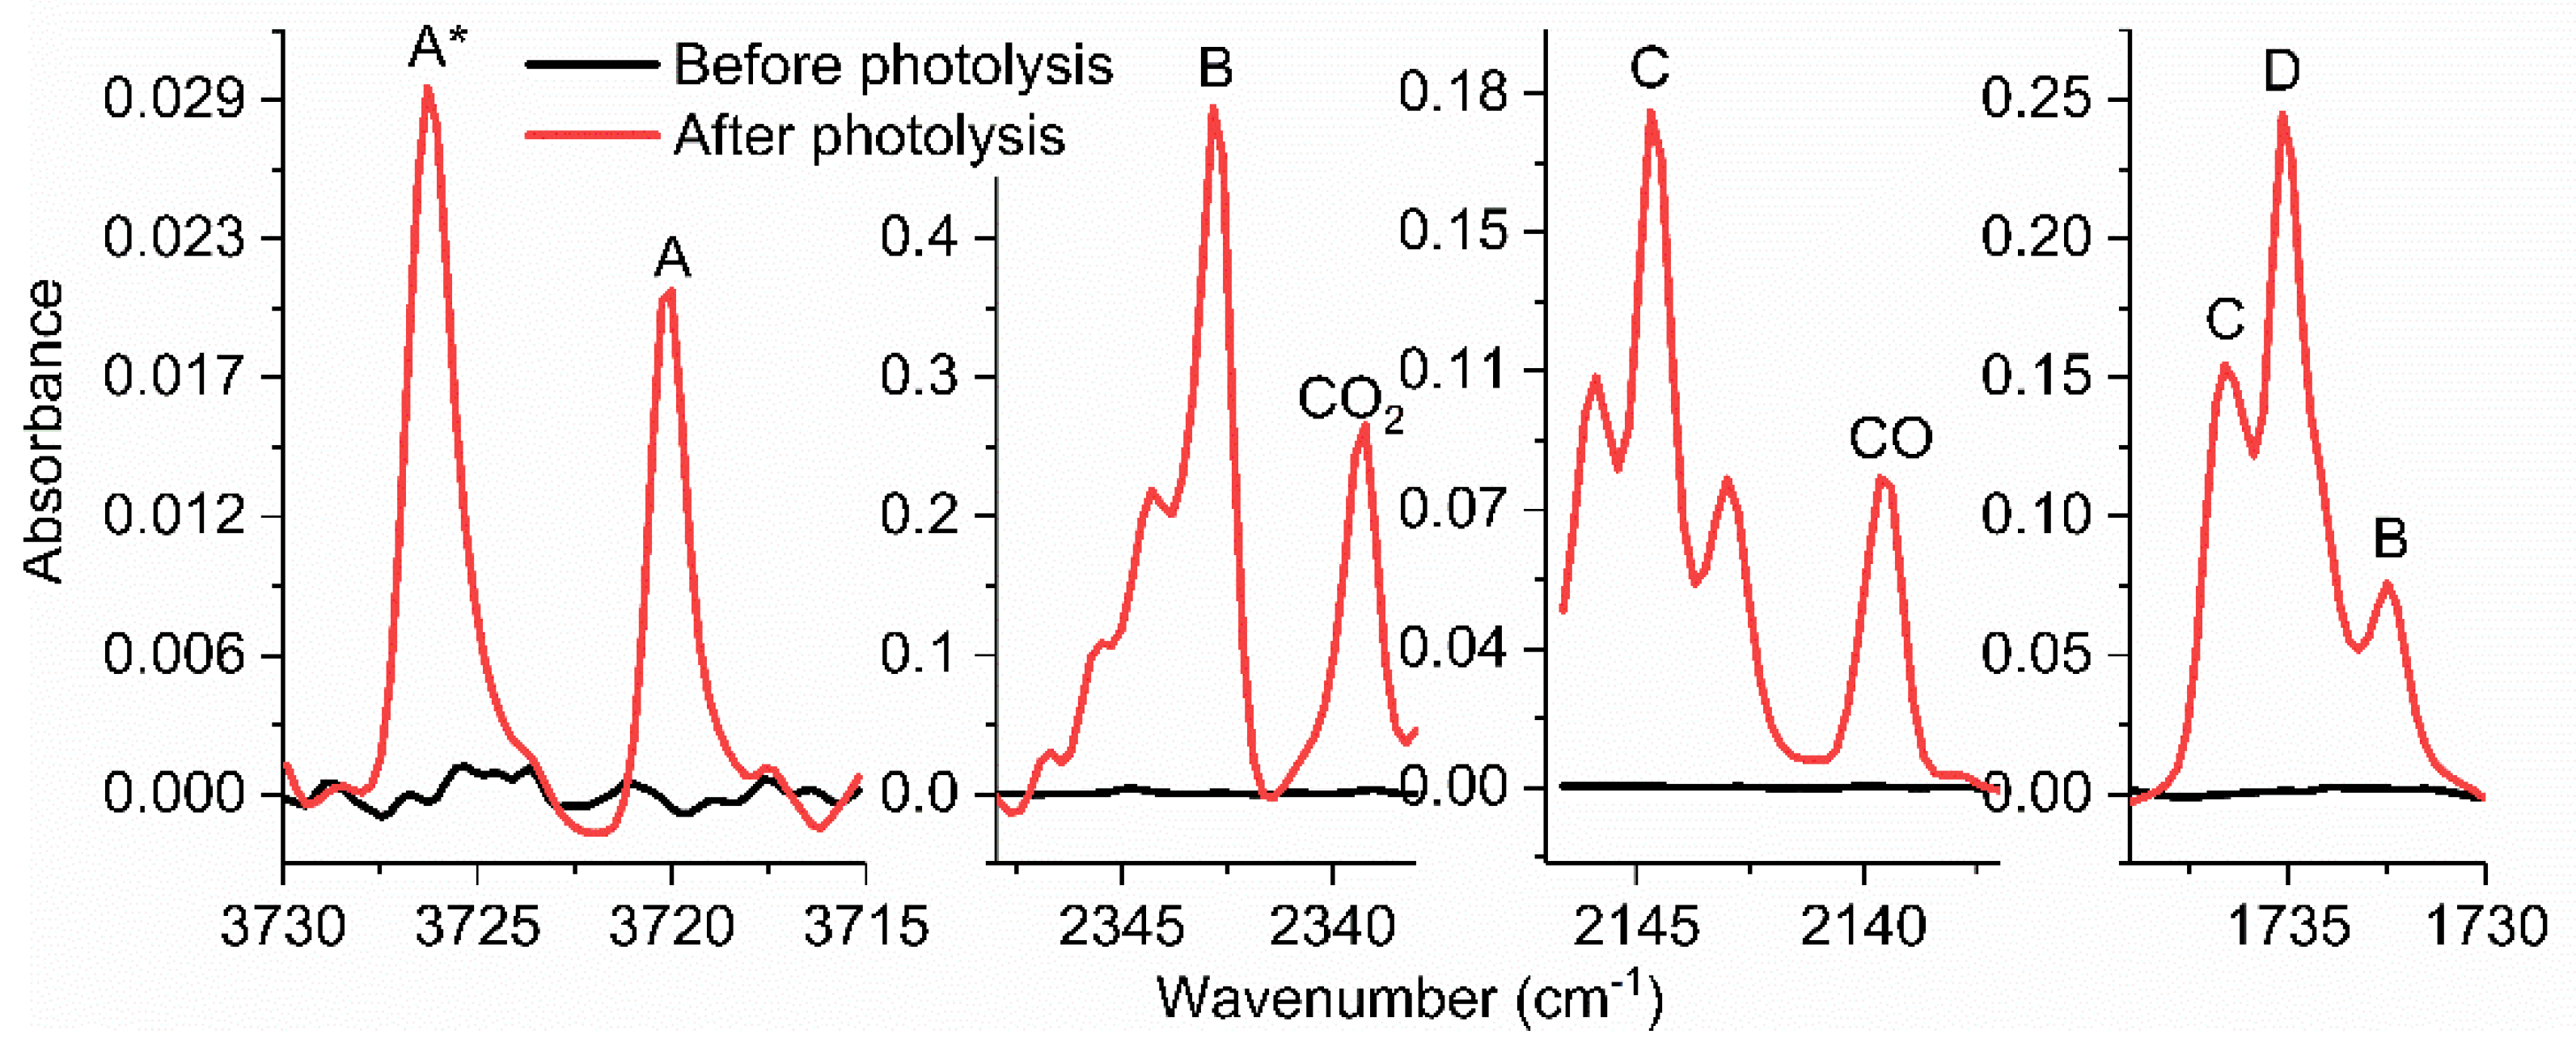
Figure 2 shows the main changes in the IR spectra of GA upon UV irradiation of the sample at 212 nm. The increase in the absorbances of the GAC and AAT conformers follows the photo-induced decrease of those ascribed to the SSC conformer, which suggests a significant conformational photo-isomerization channel of the SSC conformer.
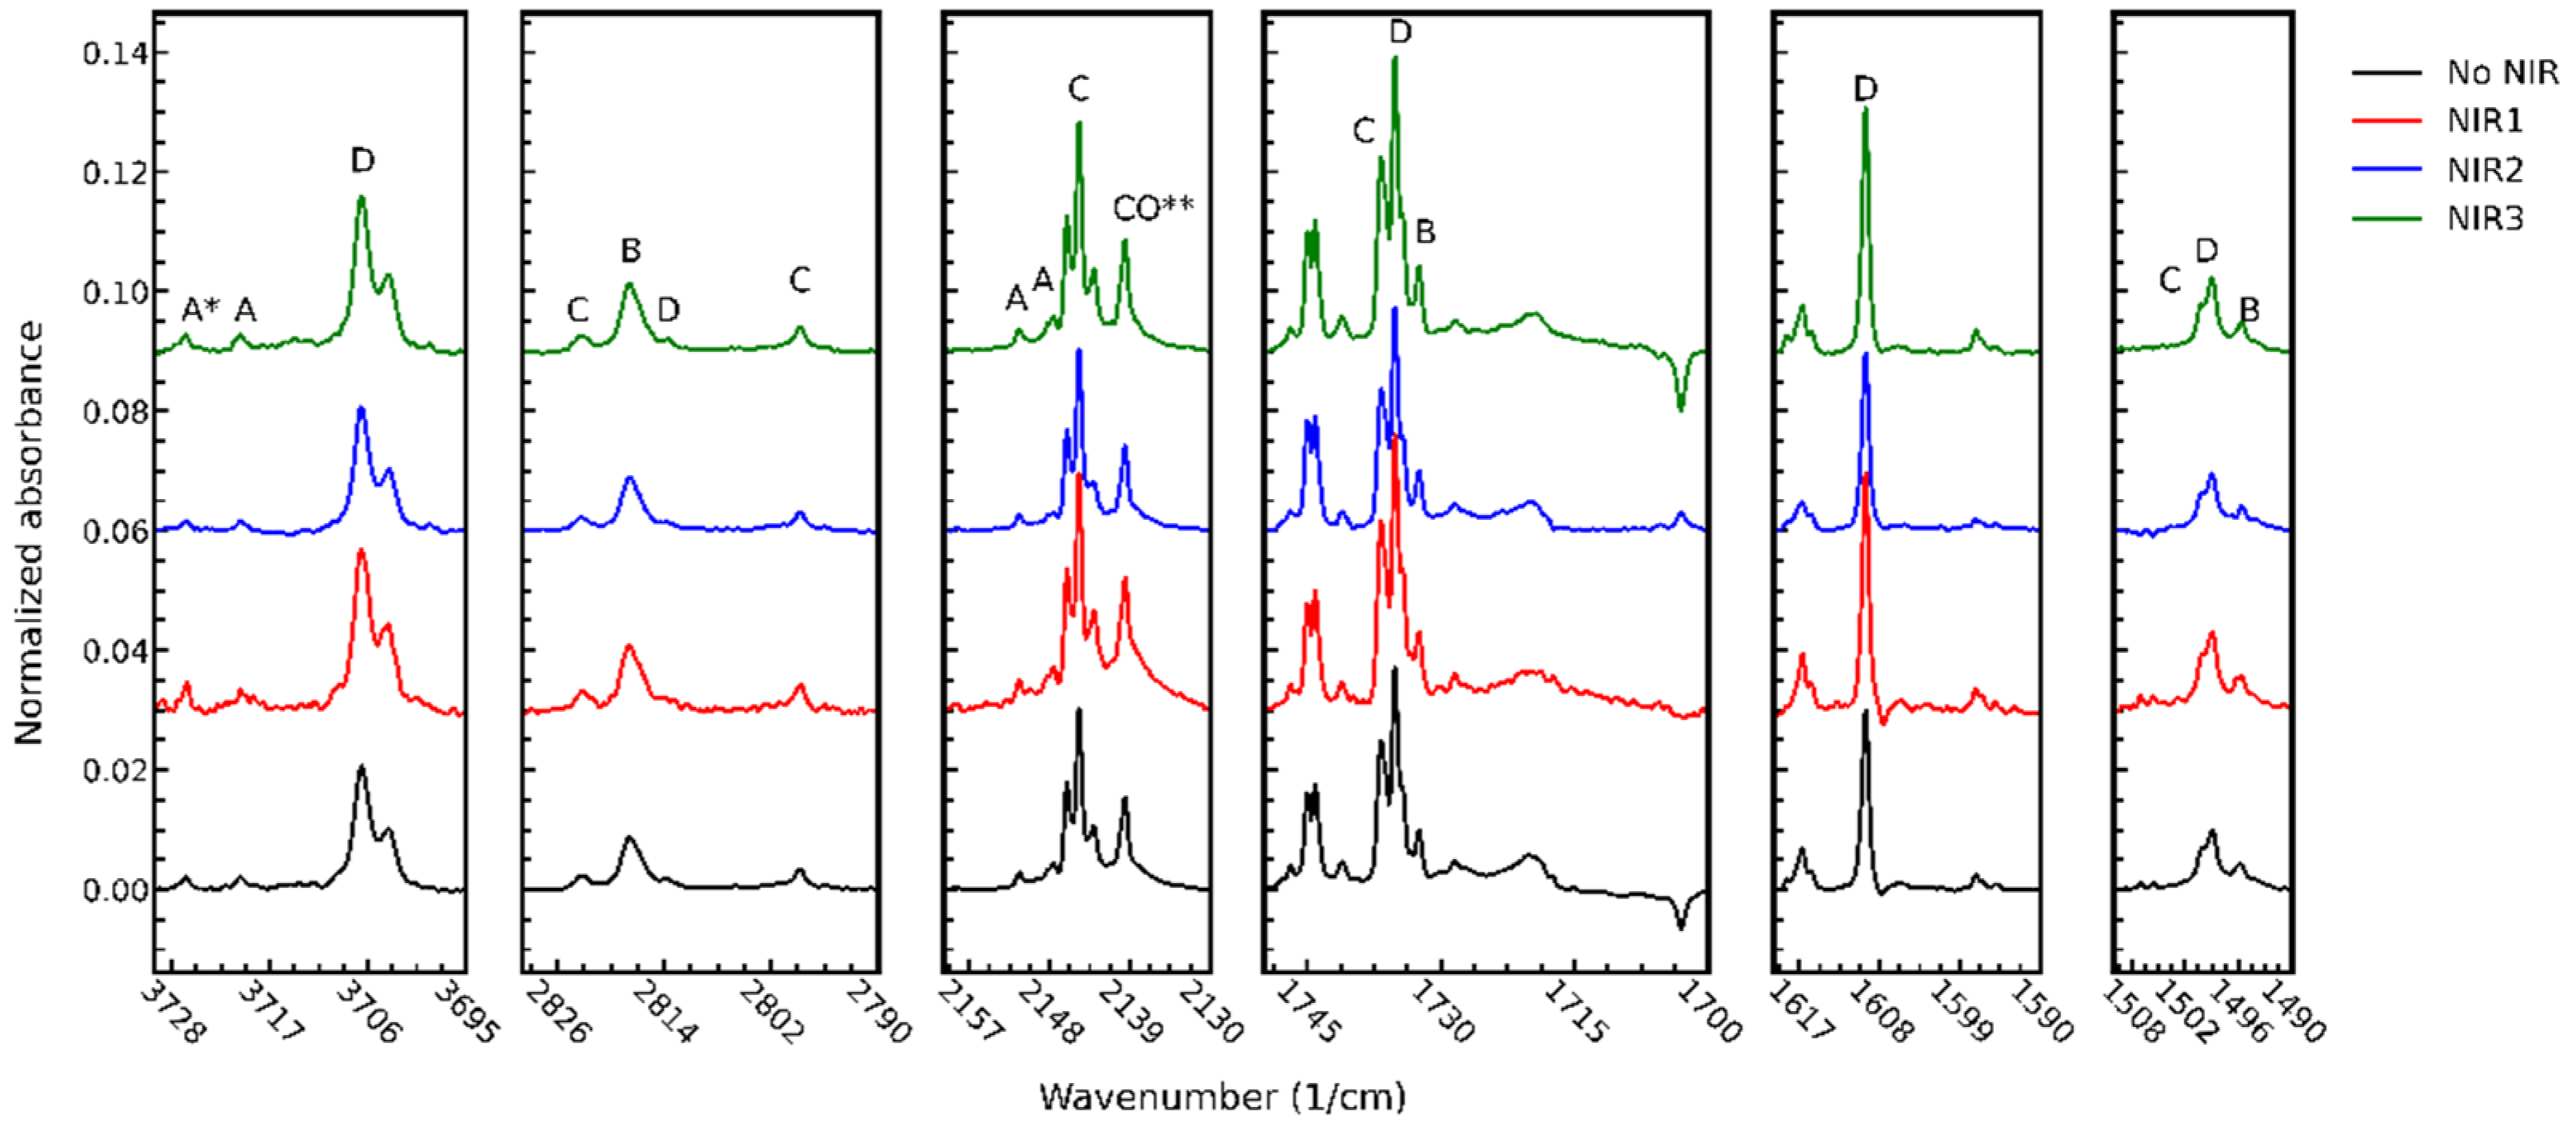
The generation of the photoproducts upon photolysis at 212 nm is illustrated in
Figure 3. The main photoproducts were the molecular complexes H
2O–CO, HCHO–H
2O, HCHO–CO
2, and HCHO–CO. There was no qualitative difference between the photolysis at 212 nm and 226 nm, in agreement with a precedent study [
9].
In the present study, we extended the wavelength range used in the photolysis to 230 nm to study the photo-induced kinetics in more detail. Qualitatively, the same products appeared in the photolysis at 230 nm as at 212 nm and 226 nm.
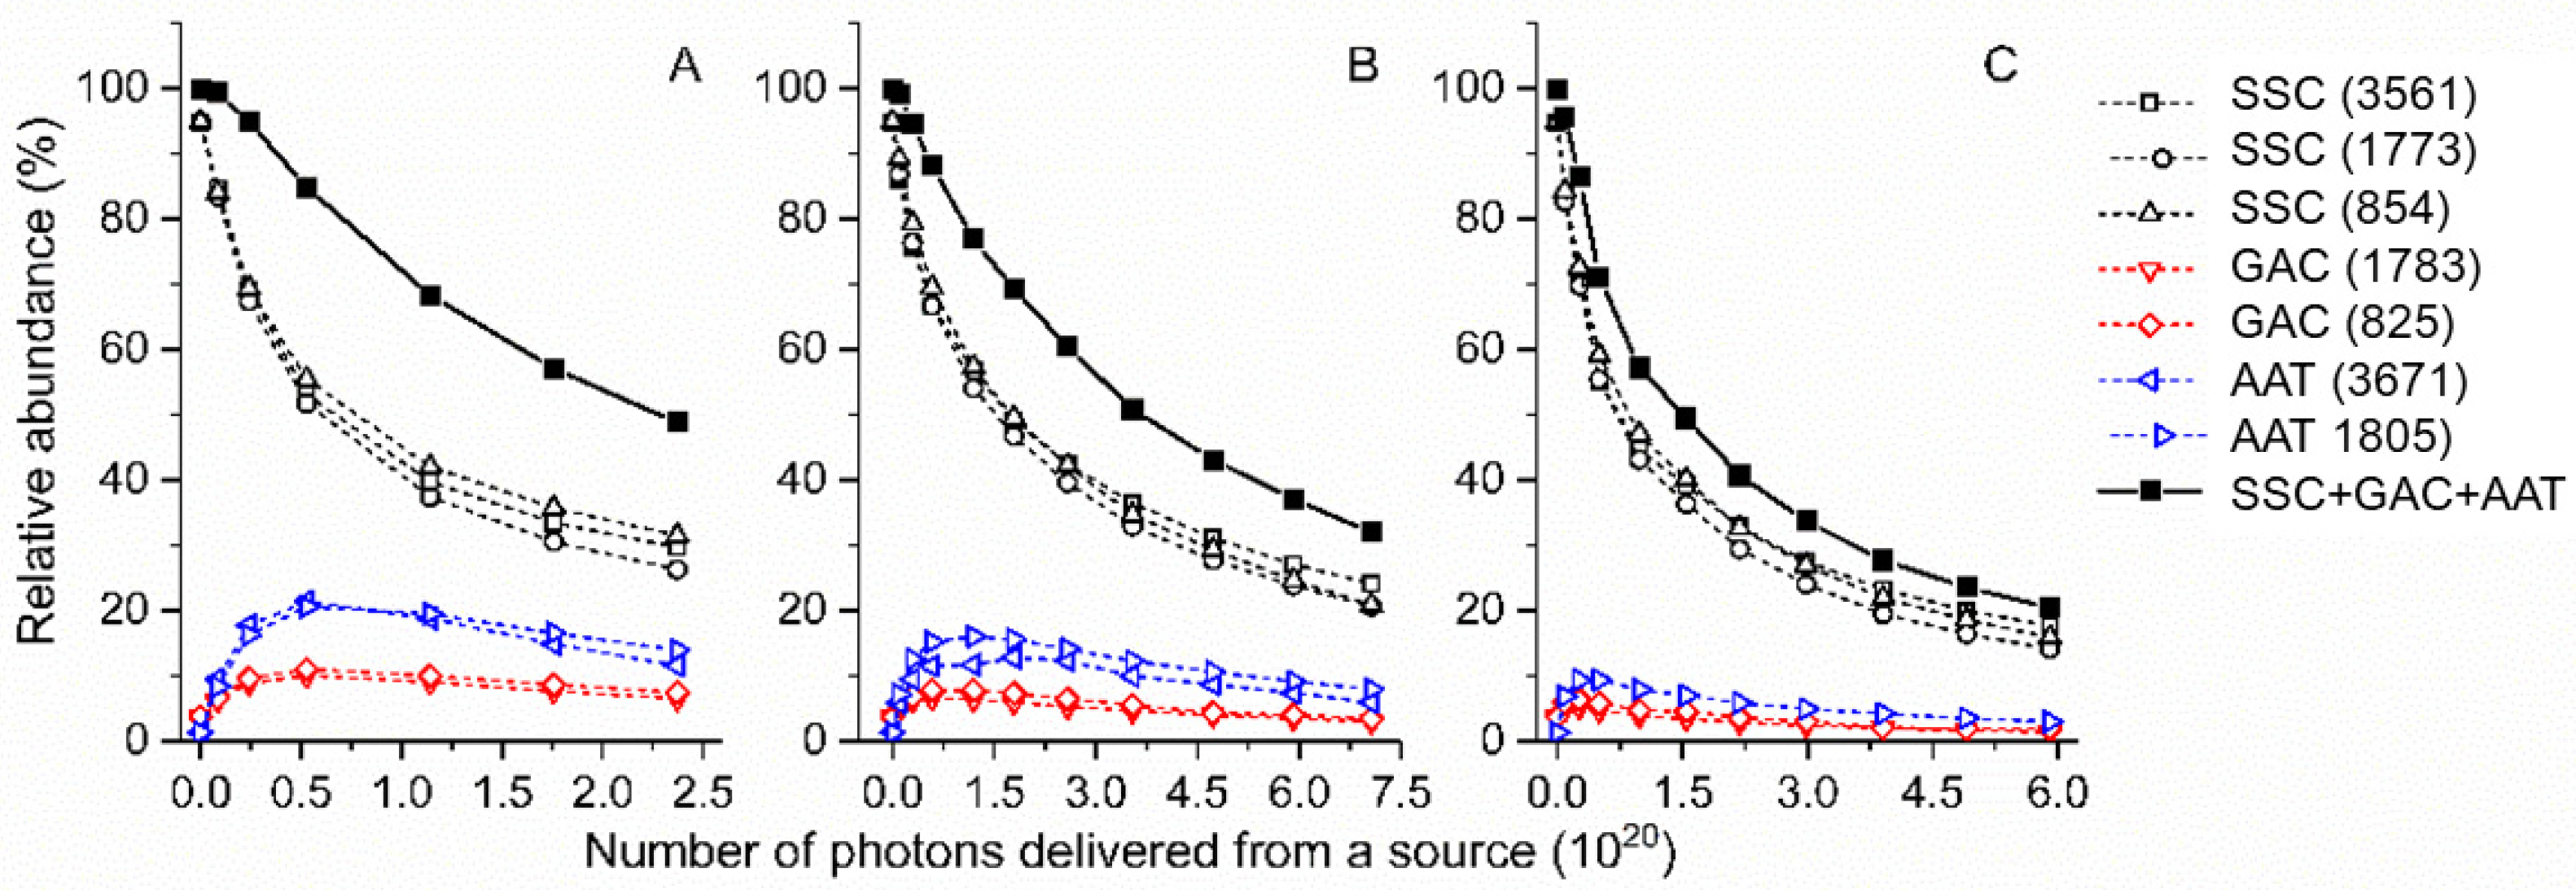
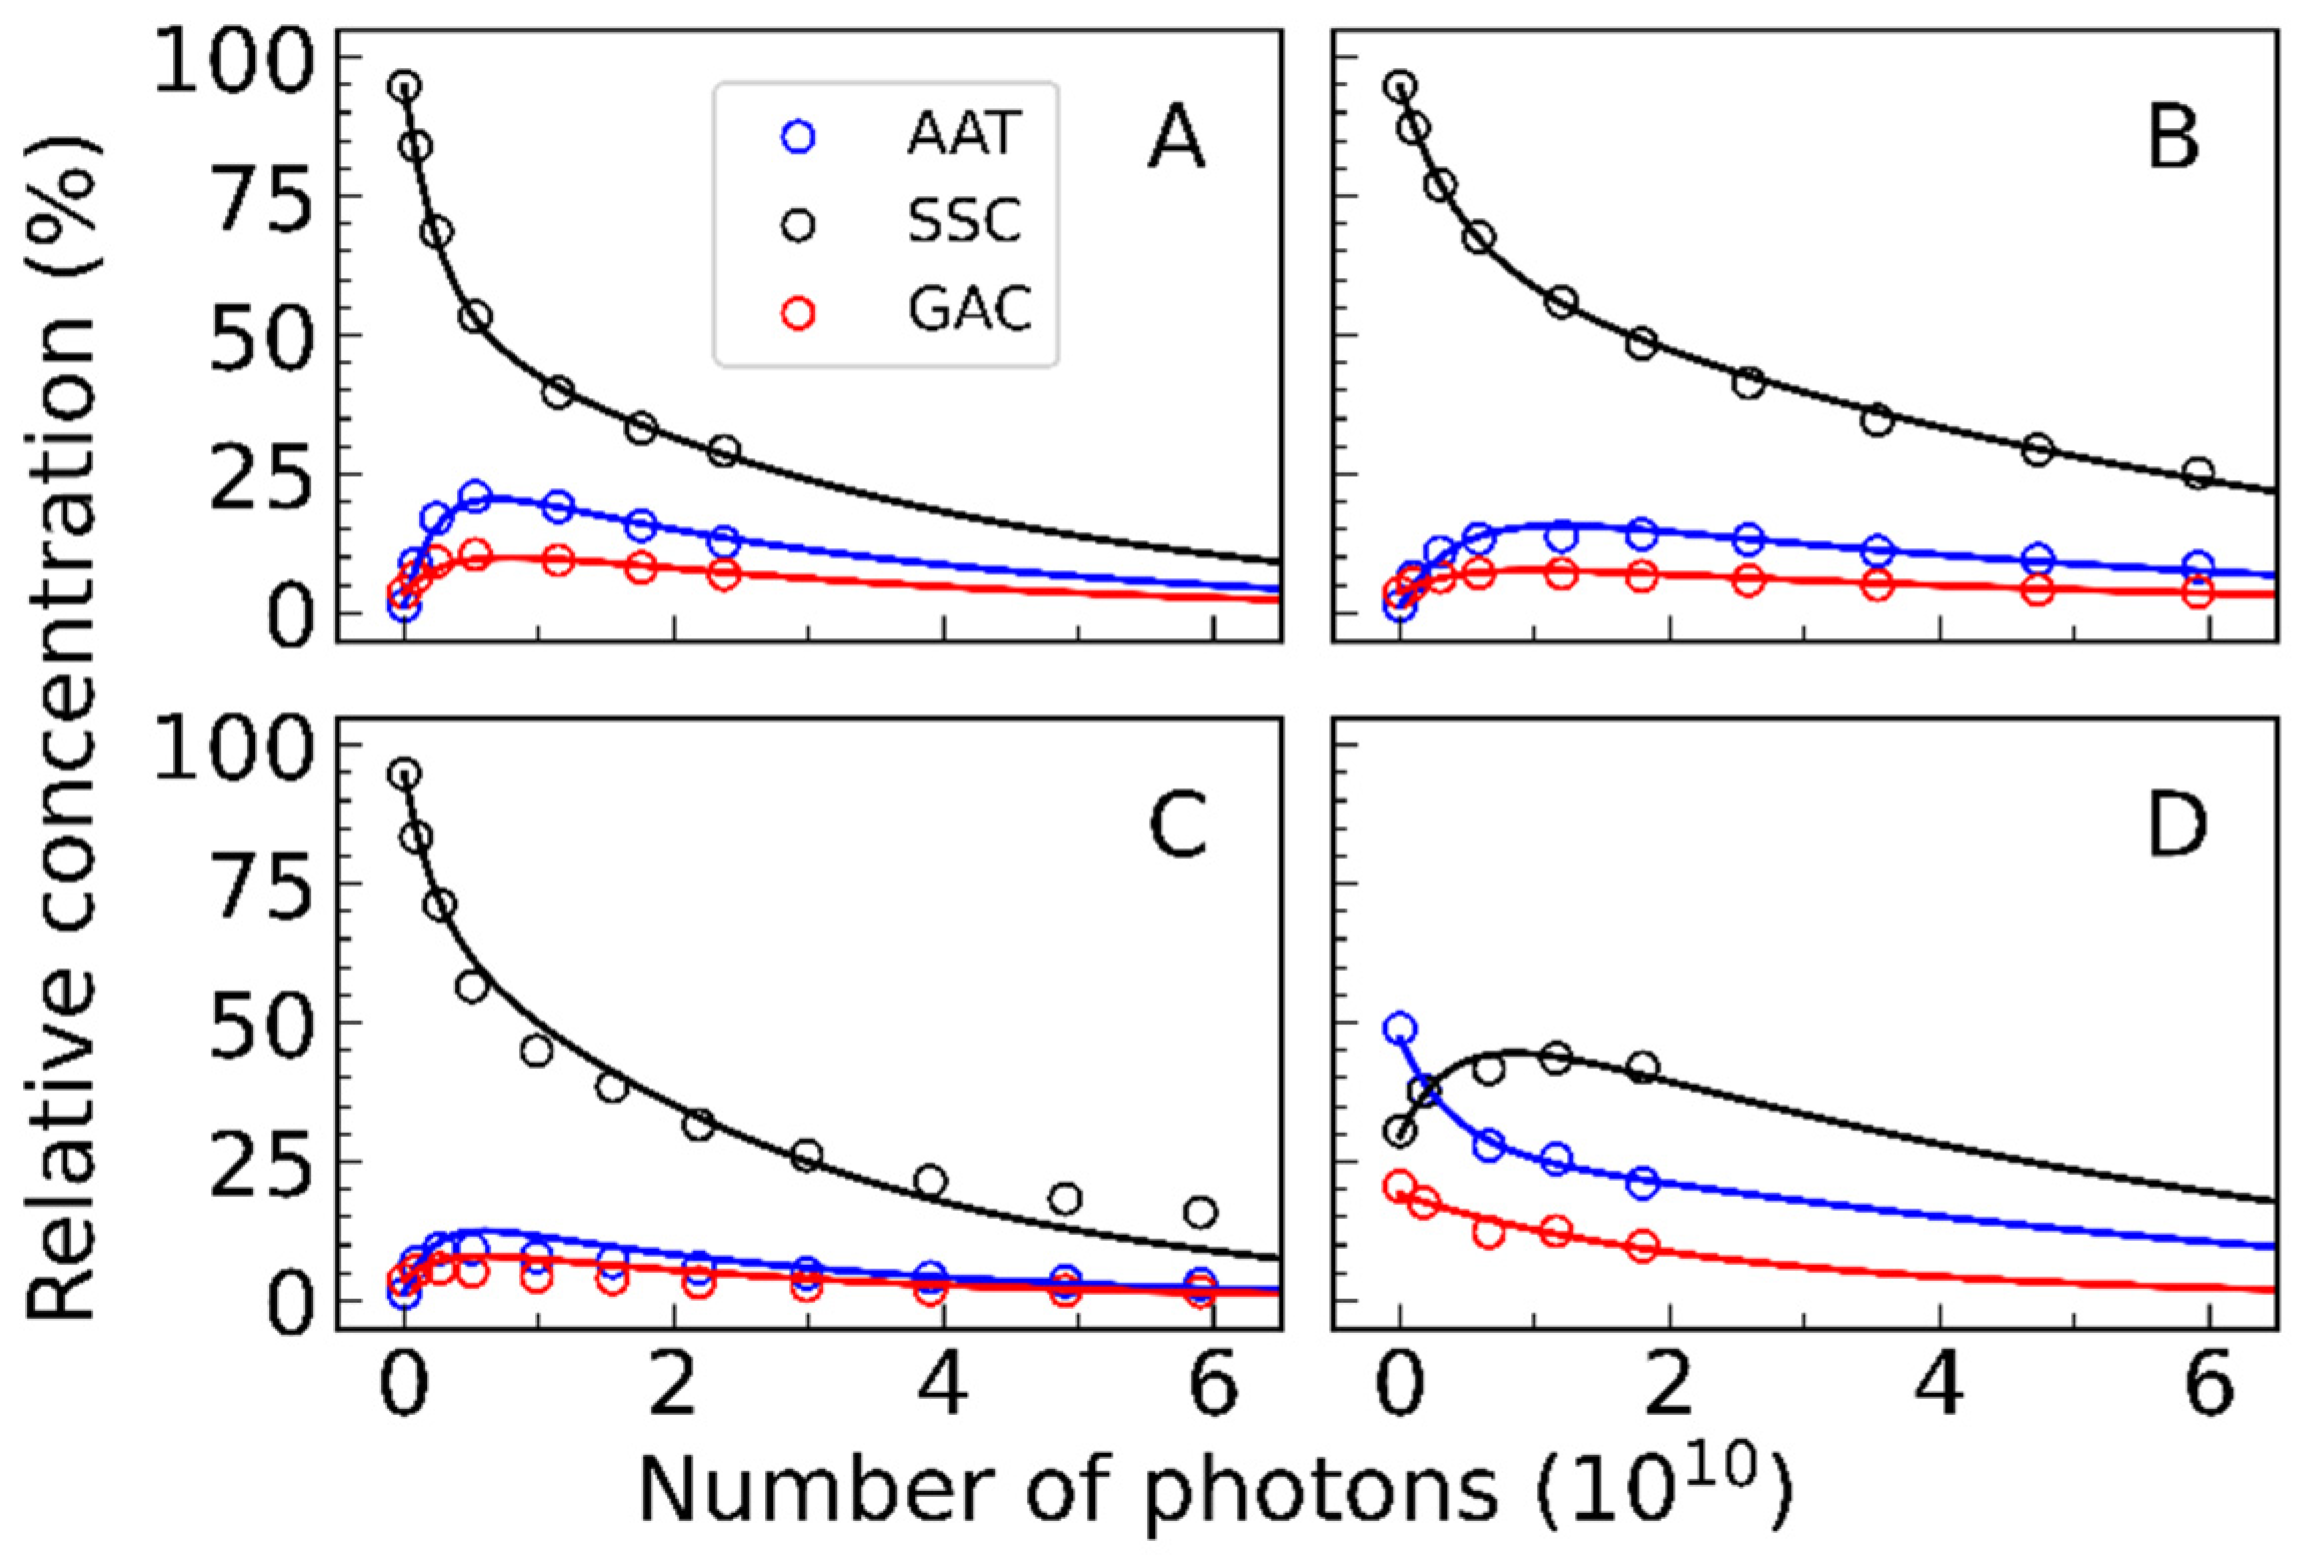
Figure 4 shows the relative abundance kinetic curves for the SSC, GAC, and ATT conformers upon irradiation at different wavelengths. The initial relative concentration of each conformer was set according to the above-mentioned computational values. The computational abundances have been successfully used in the kinetic analysis of high overtone-induced isomerization of GA isolated in solid argon [
8]. The main differences observed in the photodissociation and photo-isomerization kinetic curves along an increasing wavelength of irradiation are: (i) The lowering of the relative concentrations of both GAC and ATT conformers, (ii) The approach of the decay curves of the SSC conformer to the total decay curve of GA (see
Figure 4). The former observation suggests that the possible photo-equilibrium between the SSC and the other conformers changes as the wavelength changes. The latter observation suggests that the total dissociation of GA proceeds via the SSC conformer. This also indicates that the photodissociation of GAC and AAT conformers could be hindered. However, these findings do not fully exclude the existence of possible photodissociation channels also for GAC and AAT conformers.
Inspection of the distributions of photodissociation products was expected to shed more light on the photo-induced kinetics of the conformers. Remarkably, the IR spectra of the photoproducts were found to be almost identical when about 50 percent of the GA was dissociated, despite using different wavelengths in the photolysis (
Figure 5). The similarity of the spectra suggests that the main photodissociation channel remains almost the same when the photolysis wavelength is varied. At this point, the main dissociation channel seems to proceed mainly via the SSC conformer. The kinetics of the SSC conformer in the 230 nm photolysis supports this assumption. These findings suggest that the photodissociation of the GAC and AAT conformers is indeed hindered in an argon matrix.
In the next series of experiments, we varied the relative populations of the conformers via NIR-induced conformational isomerization. The NIR excitation band centered at 6954 cm
−1 overlaps the first OH stretching overtones of the SSC and GAC conformers at 6954 cm
−1 and 6958 cm
−1, respectively. The excitation at 6954 cm
−1 led to SSC → GAC and GAC → AAT isomerizations [
6].
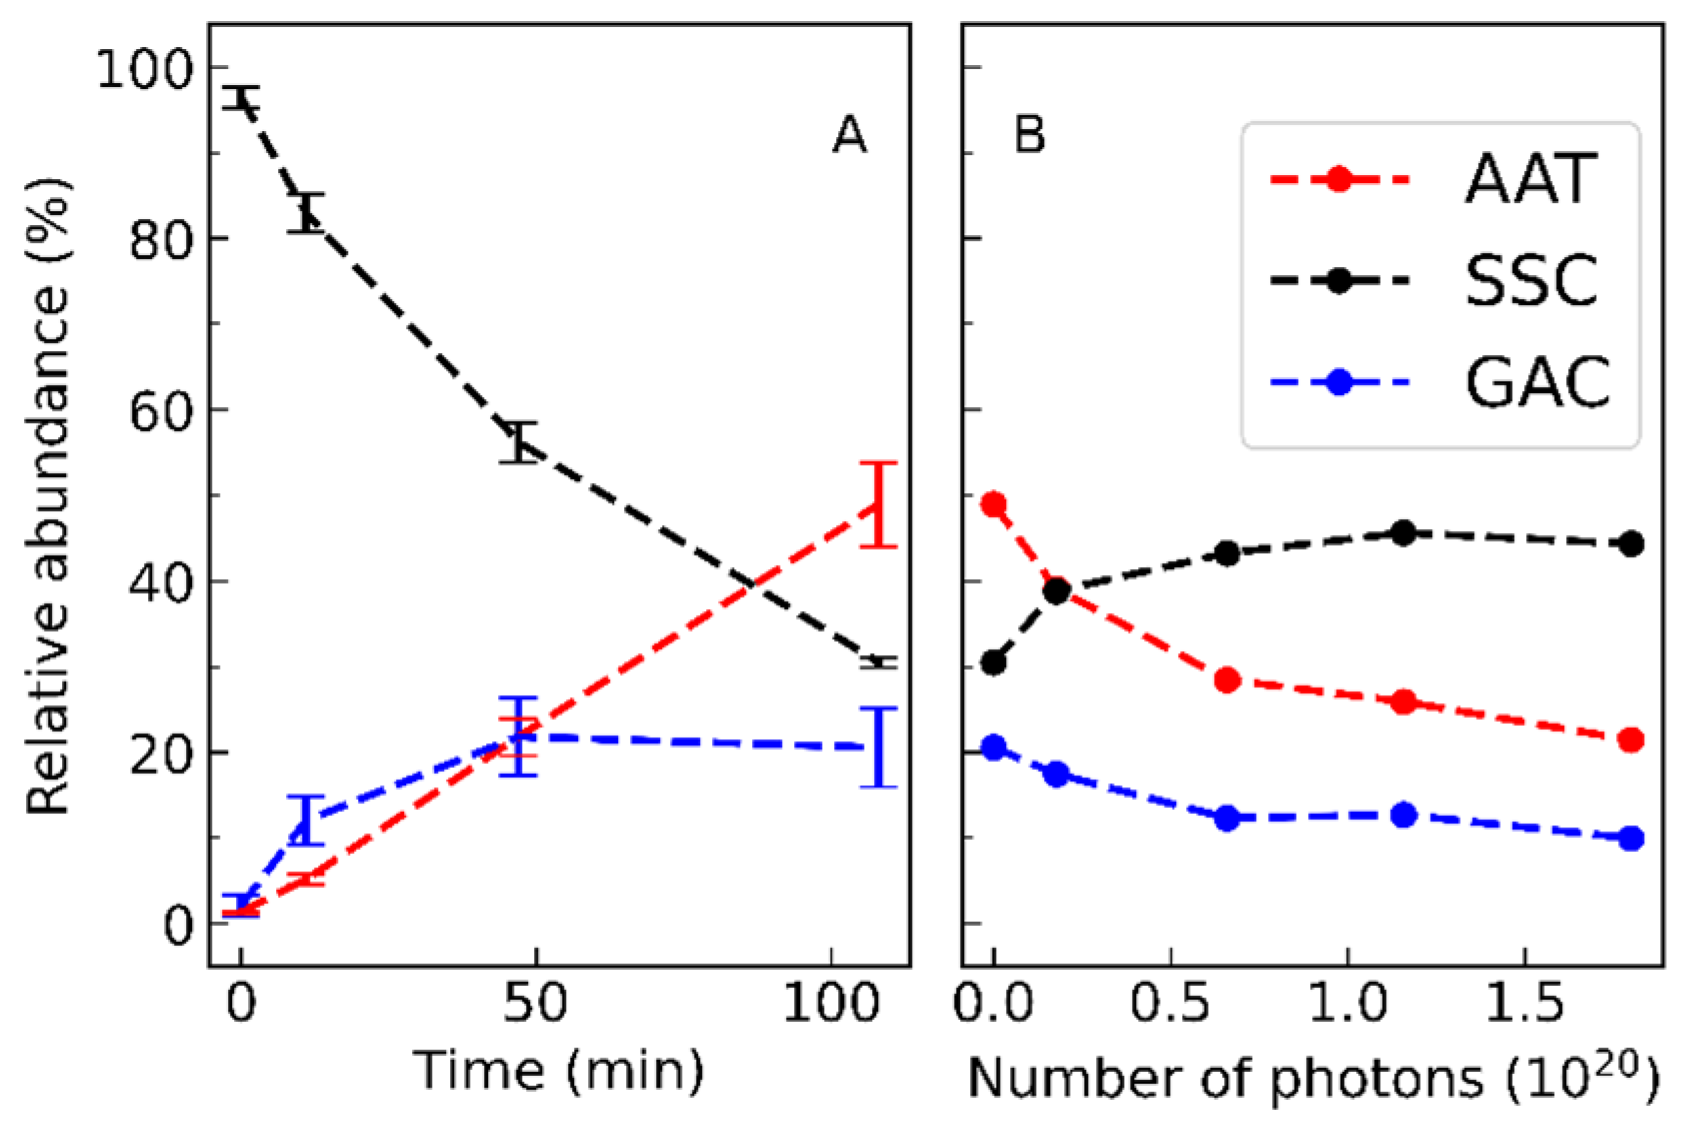
Figure 6 shows the variation of the relative populations of the conformers in the NIR-induced isomerization and subsequent UV photolysis experiments. Upon NIR irradiation, SSC isomerizes to GAC, which subsequently isomerizes to AAT. Therefore, the prolonged NIR exposure yields a high AAT concentration.
The NIR irradiation experiments allowed us to test our assumption of the initial concentrations of the conformers. There is strong evidence that the NIR irradiation does not cause photodissociation of GA or the formation of other conformers than SSC, GAC, and AAT in the argon matrix [
6]. Therefore, one may expect the total GA concentration to remain unchanged, and only the relative concentrations of the SSC, GAC, and AAT vary. At each phase of the NIR irradiation, the sum of the relative concentrations of the conformers must obey the equation:
where
is the conversion coefficient to convert the IR intensity,
, of a certain IR band to the relative concentration of the conformer, and
is the phase of the photolysis. Here, the three conformers (SSC, GAC and AAT) are assumed to exist in the present experimental conditions. The system of linear equations was solved for the three cases where different NIR doses were applied to the samples. The coefficients are also solved for different IR band combinations of the conformers. The experimental errors for the concentrations were calculated as a standard deviation of the results from the different combinations. The experimental concentrations agree well with the computational values (
Table 1). Experimentally, the SSC concentration is only about 2 percent higher, and the GAC concentration is about 2 percent lower than the computational values suggest [
4,
8]. The AAT concentration does not show significant deviation from the computational values. The computational values refer to 298 K, whereas the present experiments were carried out at ca. 15 K. Lower temperature favors the lowest energy SSC conformer, and conformational cooling can
a priori be expected to take place to some extent during deposition. However, the good agreement between the calculated and observed relative populations demonstrates that the population of the conformers practically did not change upon deposition, allowing us to conclude that the conformational cooling during matrix deposition was, in fact, negligible, justifying the use of the calculated relative conformational concentrations in
Figure 6.
After different NIR exposures, the samples were UV-irradiated (λ = 230 nm). The increase in the concentration of the SSC conformer was evident at the early stages of the 230 nm photolysis (see
Figure 6). This finding supports the assumption of the existence of significant GAC/AAT → SSC isomerization channels in the UV irradiation of matrix-isolated GA. Remarkably, the UV irradiation performed after the NIR conformational conversions led to similar amounts of the photodissociation products as obtained in the UV photolysis carried out without preceding NIR irradiation (
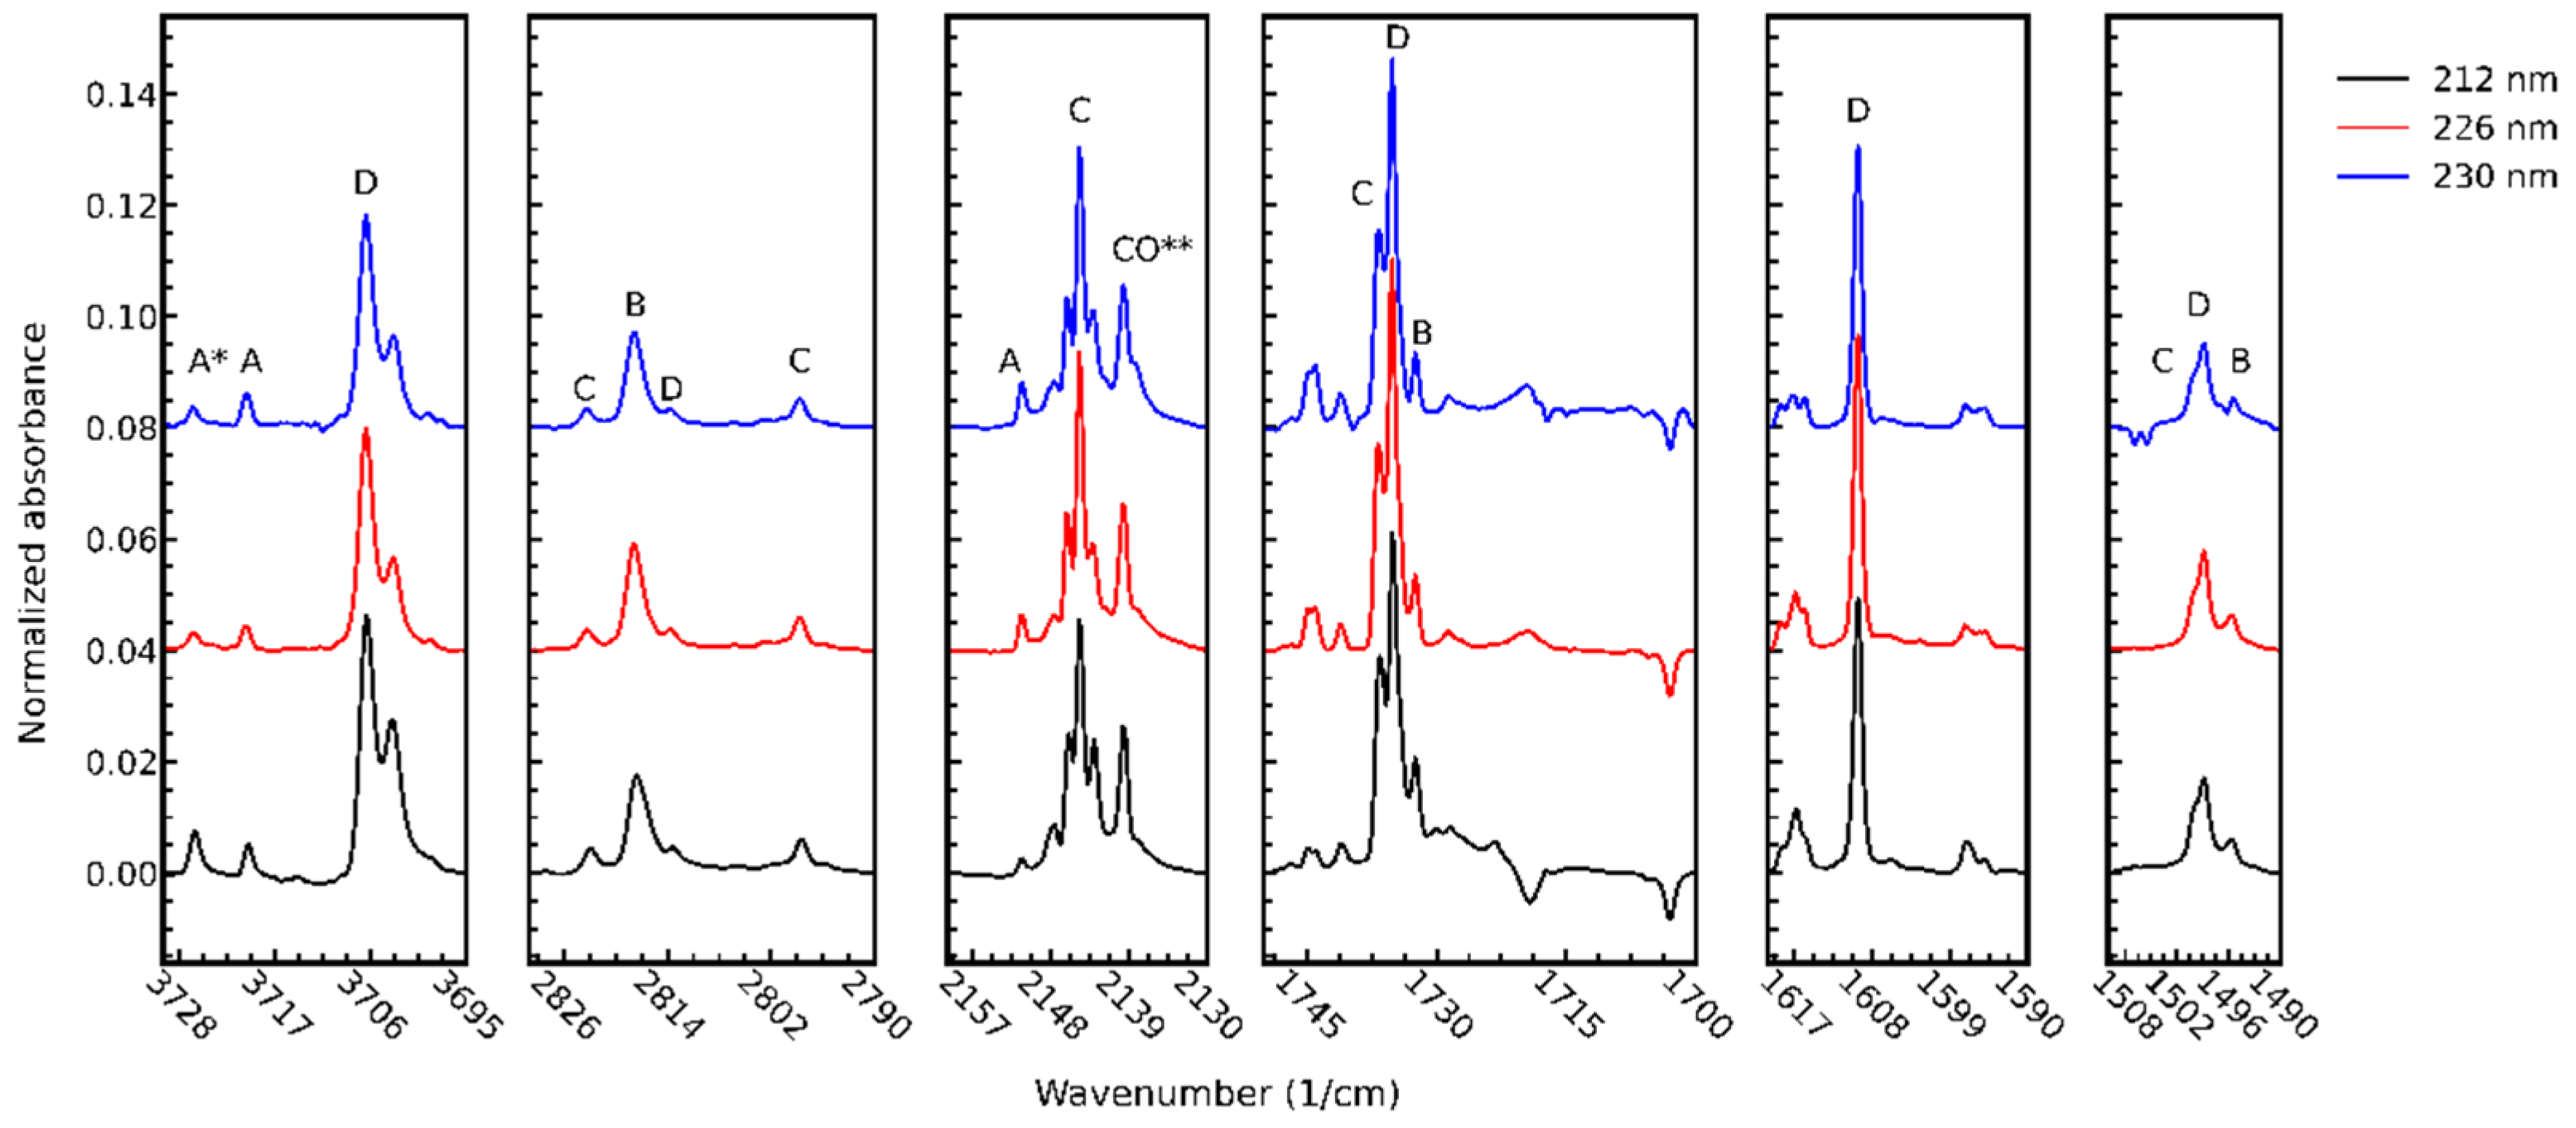
Figure 7). These results suggest that only one dissociation channel exists since the dissociation of different conformers is supposed to yield a somewhat different distribution of the photodissociation products. However, as mentioned above, the distribution of the products seems to be very similar in the different experiments. These findings strongly support the significance of the SSC products’ photodissociation channel within the 212–230 nm wavelength range.
Combining all the findings, we may assume that the photo-induced kinetics proceeds via five channels: SSC
GAC, SSC
AAT, and SSC → products. Nevertheless, the possible existence of the GAC
AAT channels cannot be neglected here, as there is no direct evidence for their non-existence. The direct photodissociation of the GAC and AAT conformers is also possible a priori. The simplest reaction scheme, including all these reaction channels, can be described with the following equations, where
represents a reaction rate constant:
and
These reaction equations lead to the reaction rate equations:
The variable in the above equations is a general (time) variable representing the number of photons delivered from a source.
The analytical solutions of the differential equations were obtained with the Mathematica software with and without the optional photodissociation and equilibrium channels of the GAC and ATT conformers. The solution functions were fitted simultaneously to the experimental kinetic data of the conformers with shared parameters
to
. The model without the optional photodissociation and equilibrium channels of the GAC and AAT conformers fits well with the experimental kinetic curves of 212 nm and 226 nm photodissociation experiments. The 230 nm photodissociation curves modeled slightly deviate from the model without pre-NIR photolysis. However, the model fits well to 230 nm data when the relative concentrations of the conformers are varied prior to the 230 nm irradiation (NIR3 in
Figure 7 was used in the fitting). The results of the data fitting are shown in
Figure 8.
When all the optional reactions in the reaction rate equations were used in the data fitting procedure, the solutions became more uncertain, and the problem seemed to have approached over-parametrisation. The increasing complexity of the model, with more parameters, did not, in fact, show any improvement in the data fitting. To avoid over-parametrisation, we sought acceptable solutions with the minimum number of parameters. The best solutions were obtained with the model, including the reactions described by the rate coefficients to , i.e., when the photodissociation and equilibrium channels of the GAC and AAT conformers were not accounted for. The results supported the above assumption of the conformer-dependent photodissociation of GA.
It needs to be mentioned that some experiments suffered from fluctuating laser power during the photolysis. We controlled the laser power during the experiments, but we believe that in some cases (specifically the experiments designated as “No NIR”, “NIR1”, and “NIR2”, see
Figure 7), the laser power fluctuations were the main problem for the poorer data fitting. The small number of data points also increased the risk of over-parameterization in these cases. The obtained parameters are collected in
Table 2.
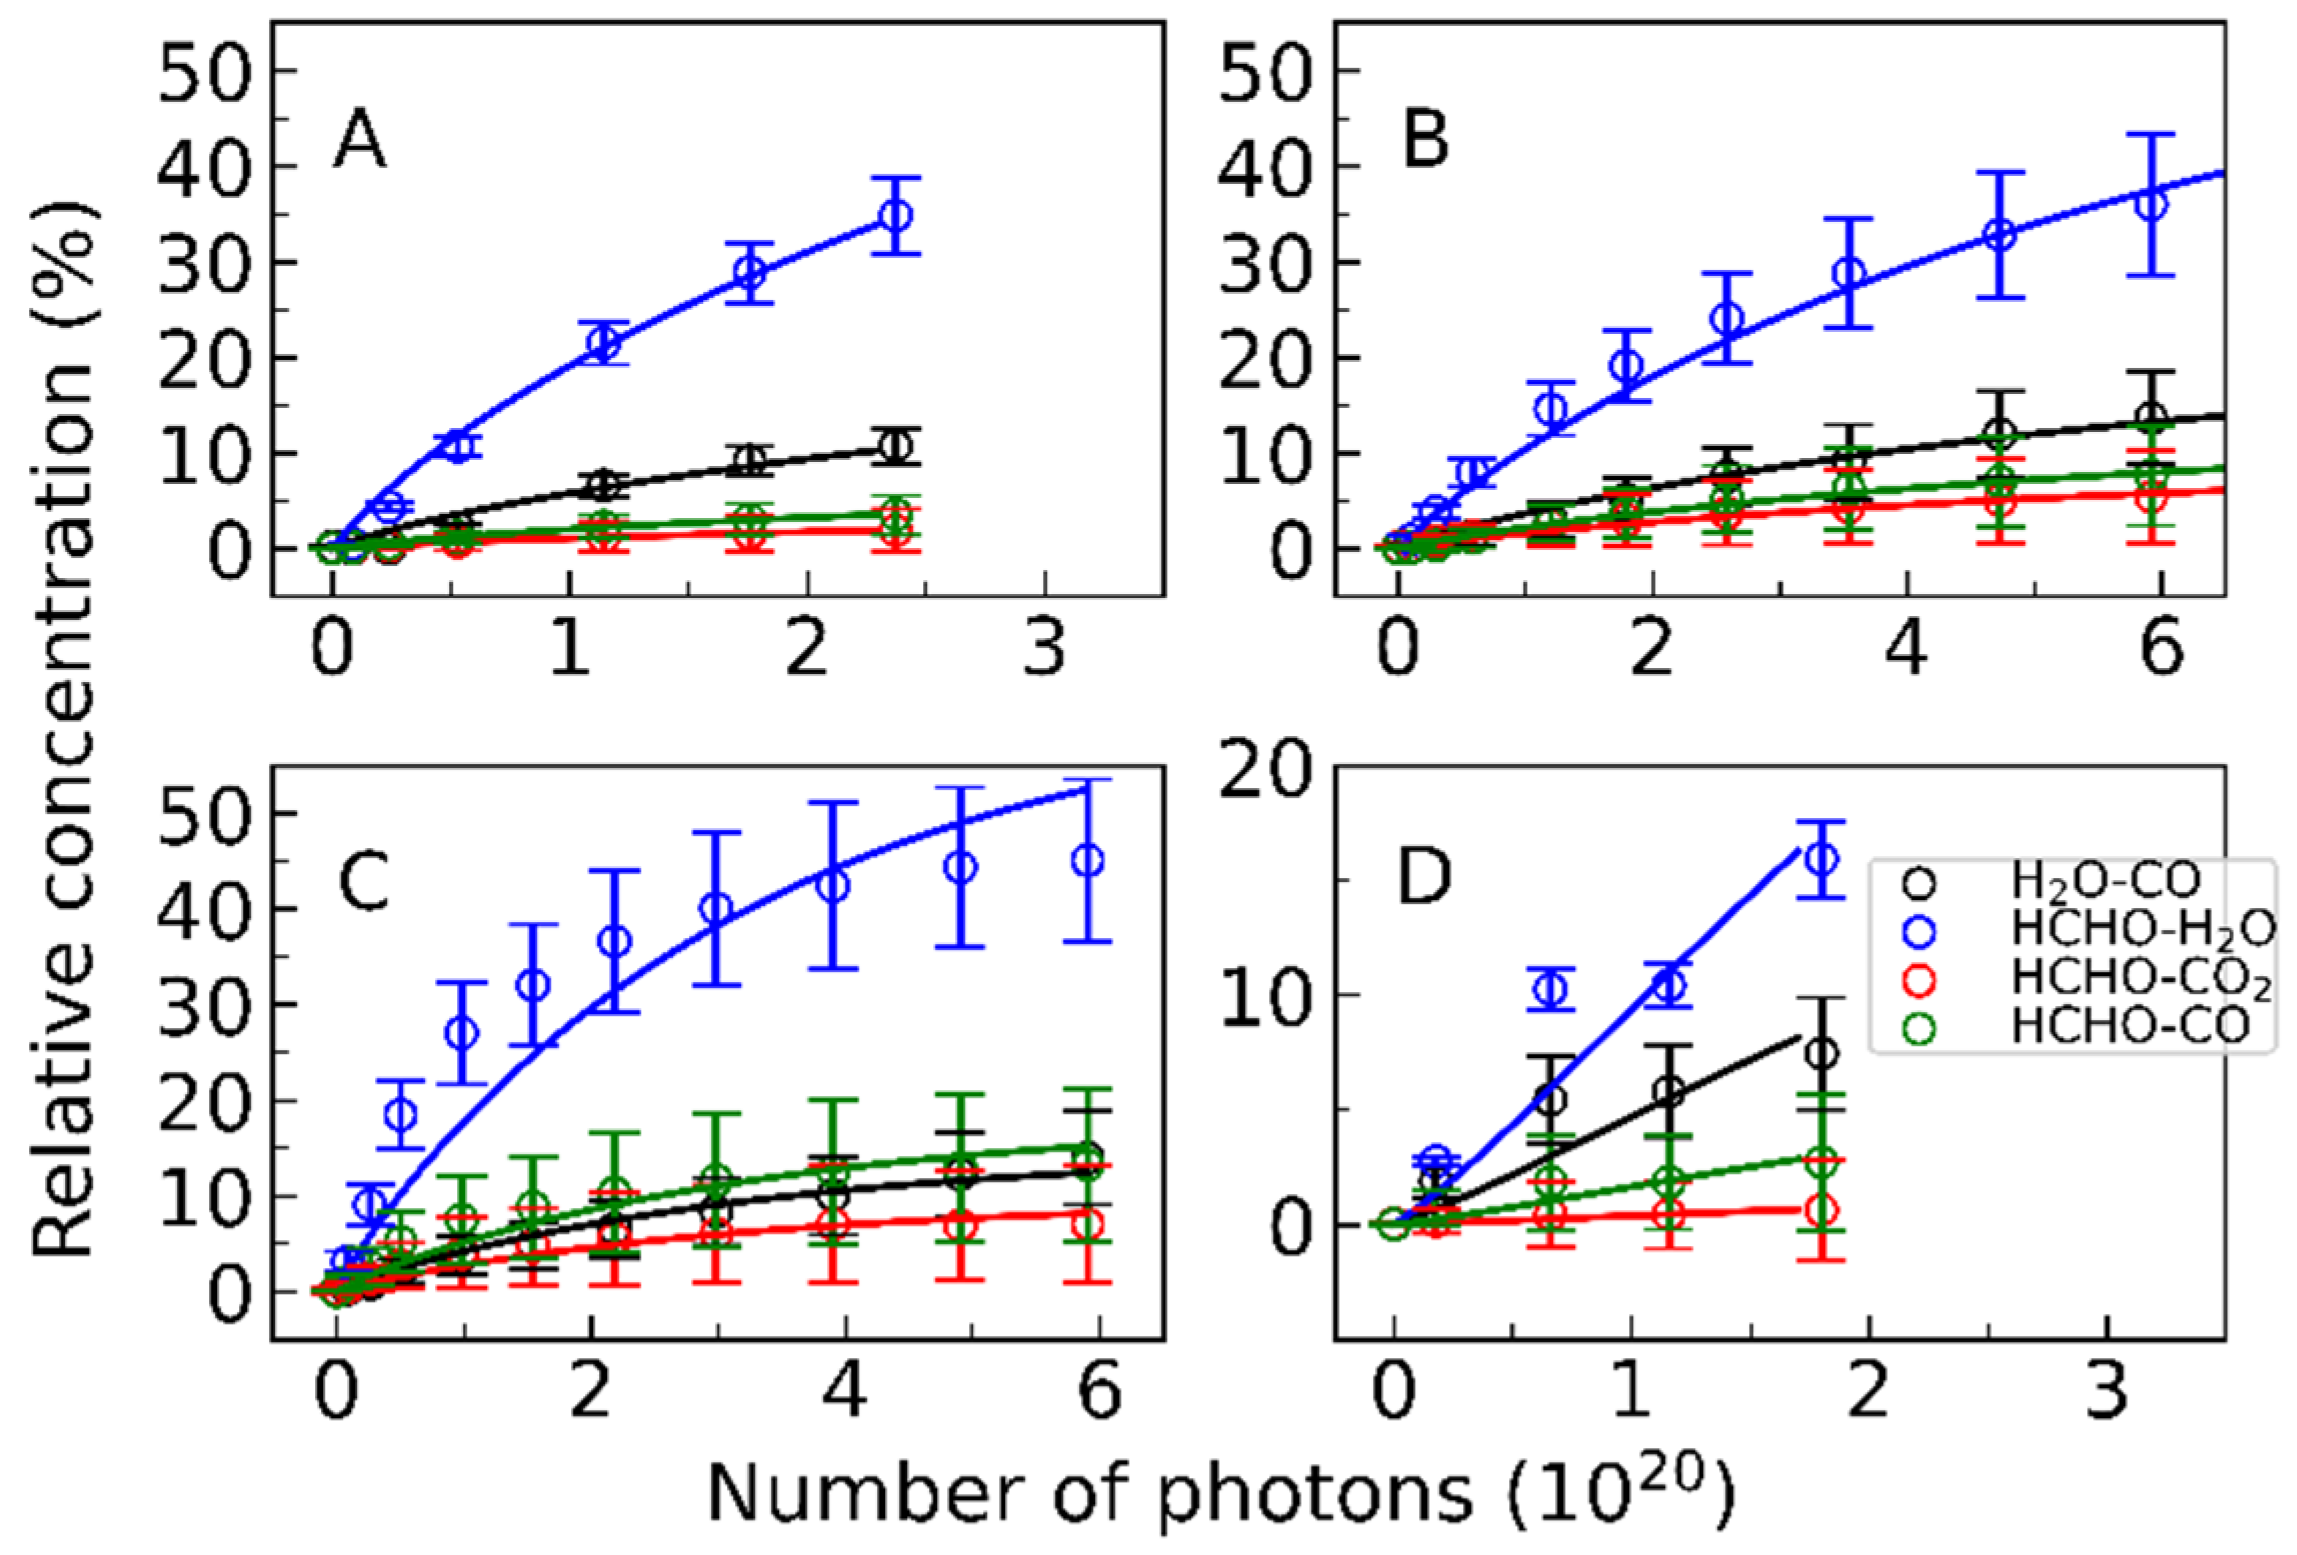
The final test of the chosen kinetic model was the data fitting of the kinetic curves of the photodissociation products. According to the observations and analyses described above, the photodissociation products were assumed to form from the SSC conformer. We have not yet discussed the possible photodissociation of the primary photoproducts of the SSC conformer, but it must be included optionally in the kinetic model of the photoproducts. Then, the primary (
and secondary (
photoproducts are formed as
The rate equation of the primary photoproducts can be written as
where
and
are the rate coefficients of the growth and decay of the photodissociation product
. The [SSC] function is obtained from the kinetic analysis of the precursor conformer. Before the analysis, the IR intensities of the photoproducts were converted to percentages. We used a similar approach here as we used with the GA conformers (Equation (1)). The total concentration of the photoproducts was assumed to be equal to the loss of the GA concentration. At each experimental phase, the total concentration of photoproducts must obey the equation
where the
is the conversion coefficient from the IR intensity,
, to concentration for the product
at the phase of the experiment
. At each phase, the lefthand side of the equation must equal the total loss of the GA. For this, we analysed a large number of IR bands of the photoproducts. The IR bands were assigned according to Ref. [
9]. However, most bands overlap with the bands of other absorbers, and spectral simulations were needed to extract each component from the bands. All the acceptable solutions for Equation (9), with all possible peak combinations, suggested that HCHO–H
2O is the main photoproduct. Thus, we filtered the solutions that agreed with the assumption of the main photoproduct. The concentrations were taken as an average over the satisfactory results. Then, the solution of the rate Equation (8) was fitted to the experimental data. The results are shown in
Figure 9 and
Table 2. The best fits were obtained by setting
, as the experiments did not show further photodissociation of the primary photoproducts. The validity of the results was supported by
. This analysis supports the assumption of the single photodissociation channel of the GA via the SSC conformer and the formation of four primary photoproducts with branching ratios of


 ,
, 


