
Spectroscopic and DFT Study of Alizarin Red S Complexes of Ga(III) in Semi-Aqueous Solution


CQC-IMS, Department of Chemistry, University of Coimbra, Rua Larga, 3004-535 Coimbra, Portugal
*
Author to whom correspondence should be addressed.
Photochem 2023, 3(1), 61-81; https://doi.org/10.3390/photochem3010005
Submission received: 16 December 2022
/
Revised: 25 January 2023
/
Accepted: 26 January 2023
/
Published: 31 January 2023
(This article belongs to the Special Issue Photochemistry of Organic Molecules and of Matrix-Isolated Reactive Intermediates: Themed Issue Honoring Professor Rui Fausto for His Contributions to the Field)
Abstract
:A combined spectroscopic and computational approach has been used to study in detail the complexation between Ga(III) and ARS in solution. The NMR results revealed the formation of four Ga(III)/ARS complexes, at pH 4, differing in their metal:ligand stoichiometries or configuration, and point to a coordination mode through the ligand positions C-1 and C-9. For equimolar metal:ligand solutions, a 1:1 [Ga(ARS)(H2O)4]+ complex was formed, while for 1:2 molar ratio solutions, a [Ga(ARS)2(H2O)2]− complex, in which the two ligands are magnetically equivalent, is proposed. Based on DFT calculations, it was determined that this is a centrosymmetric structure with the ligands in an anti configuration. For solutions with a 1:3 molar ratio, two isomeric [Ga(ARS)3]3− complexes were detected by NMR, in which the ligands have a mer and a fac configuration around the metal centre. The DFT calculations provided structural details on the complexes and support the proposal of a 1,9 coordination mode. The infrared spectroscopy results, together with the calculation of the infrared spectra for the theoretically proposed structures, give further support to the conclusions above. Changes in the UV/vis absorption and fluorescence spectra of the ligand upon complexation revealed that ARS is a highly sensitive fluorescent probe for the detection of Ga(III).
1. Introduction
Gallium is widely distributed in the earth’s crust and has a variety of applications in industry, such as in semiconductor materials for red, orange, and yellow light-emitting diodes (LEDs) [1], and in the production of low melting point alloys [2]. The antineoplastic potential of compounds of gallium, in particular of some simple salts such as Ga(III) nitrate, was also recognized soon after the discovery of the antitumor properties of cisplatin. Ga(III) shows coordination properties similar to other group IIIa metal ions, such as Al(III) and In(III), and it also shares some properties with Fe(III) in terms of ligand affinity, coordination geometry, ionic radius, electronegativity, etc. This is thought to enable its ability to interfere with the cellular iron metabolism and seems to be crucial for its antineoplastic effects [3,4,5]. Although gallium has gained relevance in the biomedical area by presenting anti-proliferative activity in some malignant tumours in humans, its presence in water for human consumption can cause immune system diseases and reduced blood leukocyte counts [6]. Its use in industry may lead to contamination of groundwater and its possible impact on human health and the environment makes it important to develop methods capable of detecting and quantifying the distribution of gallium in view of its remediation.
The use of molecular chemosensors that show fluorescence responses modulated by the interaction with metal ions has numerous advantages, such as high sensitivity and specificity, low cost, simplicity of operation, as well as the possibility of monitoring biological samples in real time with fast responses [7], and has application in many diverse areas, from analytical chemistry, medicinal chemistry, and biochemistry, to clinical and environmental sciences.
Anthraquinones and their derivatives are organic compounds that are highly relevant due to their enormous versatility in many diverse applications, such as in industry as dyes [8,9,10], in medicine as pharmaceutical drugs [11,12], and in chemistry as analytical reagents [13,14]. Hydroxyanthraquinones are particularly important for applications based on chromatic properties, since their lowest excited singlet state, with π,π* character, enables them to absorb visible light and have bright colours, contrary to anthraquinone which has a n,π* lowest excited singlet state [15,16]. The optical properties of the substituted anthraquinones depend on factors such as the nature and position of the substituents and the establishment of hydrogen bonds and other intermolecular interactions [15]. Alizarin, (1,2-di-hydroxyanthraquinone, 1,2-HAQ) is one of the most stable natural pigments and the main colouring component (together with purpurin, 1,2,4-HAQ) of the natural pigment madder, extracted from Rubia tinctorum L., and is widely used to dye textiles. Nowadays, alizarin is usually obtained from synthesis. Alizarin has also been investigated as a photosensitizer in dye-sensitized solar cells, showing high incident photon-to-current conversion efficiencies [17,18,19]. By introducing a sulfonate group into the alizarin structure, a derivative with greater water solubility is obtained (1,2-dihydroxyanthraquinone-3-sulfonate, or alizarin red S (ARS)), whose photophysics and photochemistry has been extensively studied due to its chromatic and fluorescence properties. ARS also shows interesting electrochemical behaviour and its performance as a negolyte in redox flow batteries has been investigated recently [20]. Its complexation behaviour with various metal ions has also been the subject of intense investigation, since its phenolic and carbonyl groups (Scheme 1) offer the possibility for metal–ligand complexation.
For a bidentate chelation with ARS, two coordination modes are possible: (i) via the (deprotonated) hydroxyl groups in positions 1 and 2 or (ii) via the (deprotonated) hydroxyl group in position 1 and the adjacent carbonyl group in position 9. Both modes of coordination have been proposed, depending on the metal ion, and in some cases related with the solution’s pH. Coordination through positions 1,9 has been proposed to be favoured in aqueous acidic solution, while coordination through positions 1,2 has been associated with alkaline media. With Al(III), in acidic solution, it was suggested that ARS forms 1:1 and 1:2 (Al(III):ARS) complexes [21,22,23] coordinating to the metal through positions 1 and 2 [22,23] or through positions 1 and 9 [24]; a 1:3 complex, with 1,9-chelation, has also been suggested for the Al(III)/alizarin system in alkaline water suspensions [25]. Fewer studies are found concerning the In(III) and Ga(III) alizarinate complexes. The kinetic and thermodynamic parameters were studied for the 1:1 In(III):ARS complex in highly acidic aqueous solution, and a 1,2-chelation mode was proposed [26]. An early spectrophotometric study [27] showed that Ga(III) can bind to ARS forming a reddish chelate in the pH range of 3.0–5.0 in water. A 1:2 stoichiometry was proposed for the Ga(III)/ARS complex, and a tentative suggestion that ARS may bind Ga(III) in a 1,2 coordination mode was made.
Taking into account the importance of understanding the coordination chemistry of ARS, from both an analytical and fundamental point of view, and the relevance of studying Ga(III) compounds, we have carried out a speciation and structural characterization study of the complexes formed in the Ga(III)/ARS system in a water:methanol (1:1, v/v) solution. We have used a variety of spectroscopic and computational methods that can bring additional insight on the number, type, and structure of the complexes formed in this system. The structural characterization studies were carried out both in solution, using nuclear magnetic resonance spectroscopy (NMR), and in the solid state, using infrared spectroscopy. These studies were complemented with density functional theory (DFT) and time-dependent DFT quantum chemical calculations which allowed a detailed structural characterization of the ligand and complexes and the interpretation of their spectroscopic properties. Additionally, the absorption and fluorescence properties of the system were also studied, with the purpose of evaluating the potential of ARS as a sensor for Ga(III) ions.
2. Materials and Methods
2.1. Starting Materials and Preparation of Samples
Analytical grade gallium nitrate and commercially available 1,2-Dihydroxy-9,10-anthraquinone-3-sulfonate (Alizarin Red S, ARS) were used as received. For the NMR experiments, as the ligand and the mixtures of the ligand with metal have low solubility in H2O and consequently in D2O, the solutions were tentatively prepared in other solvents as well as in mixtures of solvents. Although the mixture D2O/CD3OD (50%:50%) was found to be the most appropriate for this study, additional experiments were also carried out in DMSO. For solutions in D2O/CD3OD, the pH was adjusted by the addition of DCl and NaOD; the pH* values quoted are the direct pH meter readings (at room temperature) after standardization with aqueous (H2O) buffers. The solvents from the samples used in the NMR experiments were subsequently evaporated at room temperature and the resulting red powder was used in the ATR-FTIR experiments. For the UV/vis experiments, a sodium alizarin sulfonate solution of concentration 4.67 × 10⁻⁵ mol/dm3 and a gallium(III) nitrate solution (2.46 × 10⁻⁵ mol/dm3) were prepared in CH3OH:H2O 1:1 (v/v). The pH of the solutions was adjusted to pH 4 by the addition of HClO4 and NaOH. The samples were stored in the dark until used.
2.2. Instrumentation
The 1H and 13C NMR spectra were obtained on a Bruker Avance 500 NMR spectrometer. The 13C spectra were recorded using proton decoupling techniques (Waltz-16) taking advantage of the nuclear Overhauser effect. The methyl signal of tert-butyl alcohol was used as the internal reference for 1H (δ 1.20) and 13C (δ 31.20) for the spectra of solutions in D2O/CD3OD, and the residual signals of the solvent were used for 1H (δ 2.50) and 13C (δ 39.51), relative to TMS, for the spectra of solutions in DMSO. The ATR-FTIR spectra were obtained using a Thermoscientific Fourier Transform Infrared Spectrometer—Nicolet iS5 iD7 ATR (resolution 1 cm−1), with the aid of the OMNIC program for spectral visualization. The vibrational modes were assigned with the help of visualization with the animation module of the GaussView program. The ultraviolet/visible absorption spectra were obtained using a Shimadzu spectrometer UV-2100 and the fluorescence spectra were obtained using a Horiba-Jobin-Yvon Fluorolog 3.2.2 spectrometer. The fluorescence emission spectra were recorded with excitation at 447 nm.
2.3. Computational Details
The geometries of the conformers and tautomers of ARS were optimized at the density functional (DFT) level of theory, using the B3LYP [28,29,30,31] hybrid exchange and correlation functional and the extended split-valence triple-ζ plus polarization 6-311++G(2d,2p) basis set. The geometries considered for the complexes were optimized with the same functional and also with the B3PW91 [29,32,33,34,35,36] hybrid functional, the CAM-B3LYP [37] long-range corrected hybrid functional, and the wB97X-D [38] long-range corrected hybrid functional which includes dispersion corrections, and the split-valence triple-ζ plus polarization 6-311G(d,p) basis set. All the structures were optimized considering the bulk solvent effects of water through the IEFPCM (“integral equation formalism variant of the polarizable continuum model”) [39,40]. The vibrational frequencies were calculated for all the optimized geometries to verify the nature of the stationary points and ensure that they are energy minima. The structures proposed for the complexes were then reoptimized at the B3LYP/6-311++G(d,p) level and their harmonic vibrational frequencies were calculated and scaled with a factor of 0.978. This is the standard scale factor used for this calculation method, and aims to correct limitations introduced by the incomplete basis set used, the incomplete treatment of electronic correlation, and vibrational anharmonicity [41]. The theoretical infrared spectra presented were simulated using Lorentzian functions with a full-width-at-half-maximum (FWHM) of 6 or 4 cm−1, centred at the scaled calculated frequencies. The B3LYP/GIAO (“gauge-including atomic orbital”) method was used for the calculation of the 1H and 13C nuclear magnetic shielding constants (σ) of the lowest energy conformer of the ligand, using the 6-311++G(d,p) basis set. The nuclear magnetic shielding constants of tetramethylsilane (TMS) were calculated at the same theoretical level and the NMR chemical shifts were obtained relative to TMS from the equation δ = σTMS − σ. Time-dependent DFT (TD-DFT) was used to calculate the UV/vis absorption spectra of the ligand and complexes using the CAM-B3LYP functional [37]. This long-range corrected hybrid functional, in which the amount of Hartree–Fock exchange interaction increases with the interelectronic distance, provides values of the vertical excitation energies which are in good agreement with the experimental ones for a wide variety of organic molecules [42]. The 6-311++G(d,p) basis set was used in these calculations. DFT and TD-DFT calculations were carried out with the Gaussian16 [43] quantum chemistry program and the GaussView 6.0 program was used to visualize the structures and molecular orbitals.
3. Results and Discussion
3.1. Structure and Energetics of Alizarin Red S
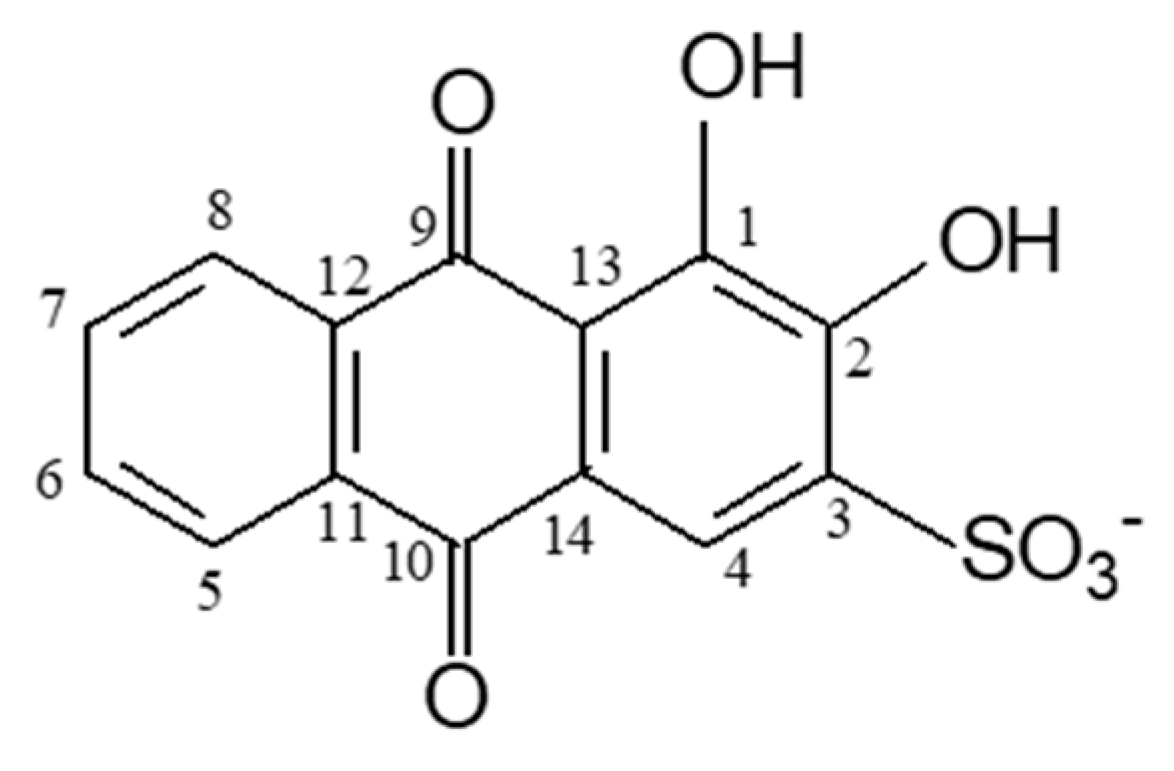
1,2-dihydroxyanthraquinone-3-sulfonate (ARS) is a polycyclic aromatic compound composed of three fused six-member rings, with two carbonyl groups in the central ring at the C-9 and C-10 positions. Additionally, one of outer rings bears two hydroxyl groups at the C-1 and C-2 positions and a sulfonate group at position C-3 (Scheme 1). Taking into account the pKa values reported for the two phenolic protons (pKa2 = 5.8 and pKa3 = 10.8) [44] and that the sulfonate group ionizes at very low pH, the monoanionic form of ARS (Scheme 1) is the dominant form in the pH region explored in this work (pH~4). Its structure, in addition to presenting several conformers formed by rotation of the CC-OH coordinates, may also present tautomerism involving the transfer of hydrogen atoms between the carbonyl and hydroxyl groups (keto–enol tautomerism). The structures and relative zero-point-corrected electronic energies of the different forms of ARS in water were previously studied by Joó et al. using DFT calculations (6-311+G(d,p) and TZVP basis sets and several different functionals) [45]. In our work, we have carried out additional studies on the structures and energetics of these species to determine their relative Gibbs energies (which include thermal corrections) which enable us to calculate their populations in water solutions at room temperature. These are essential for our theoretical studies of the spectroscopic properties of the ligand and Ga(III) complexes of ARS. Additionally, analysis of the structural details of the intramolecular hydrogen bonding in the most stable forms was also carried out.
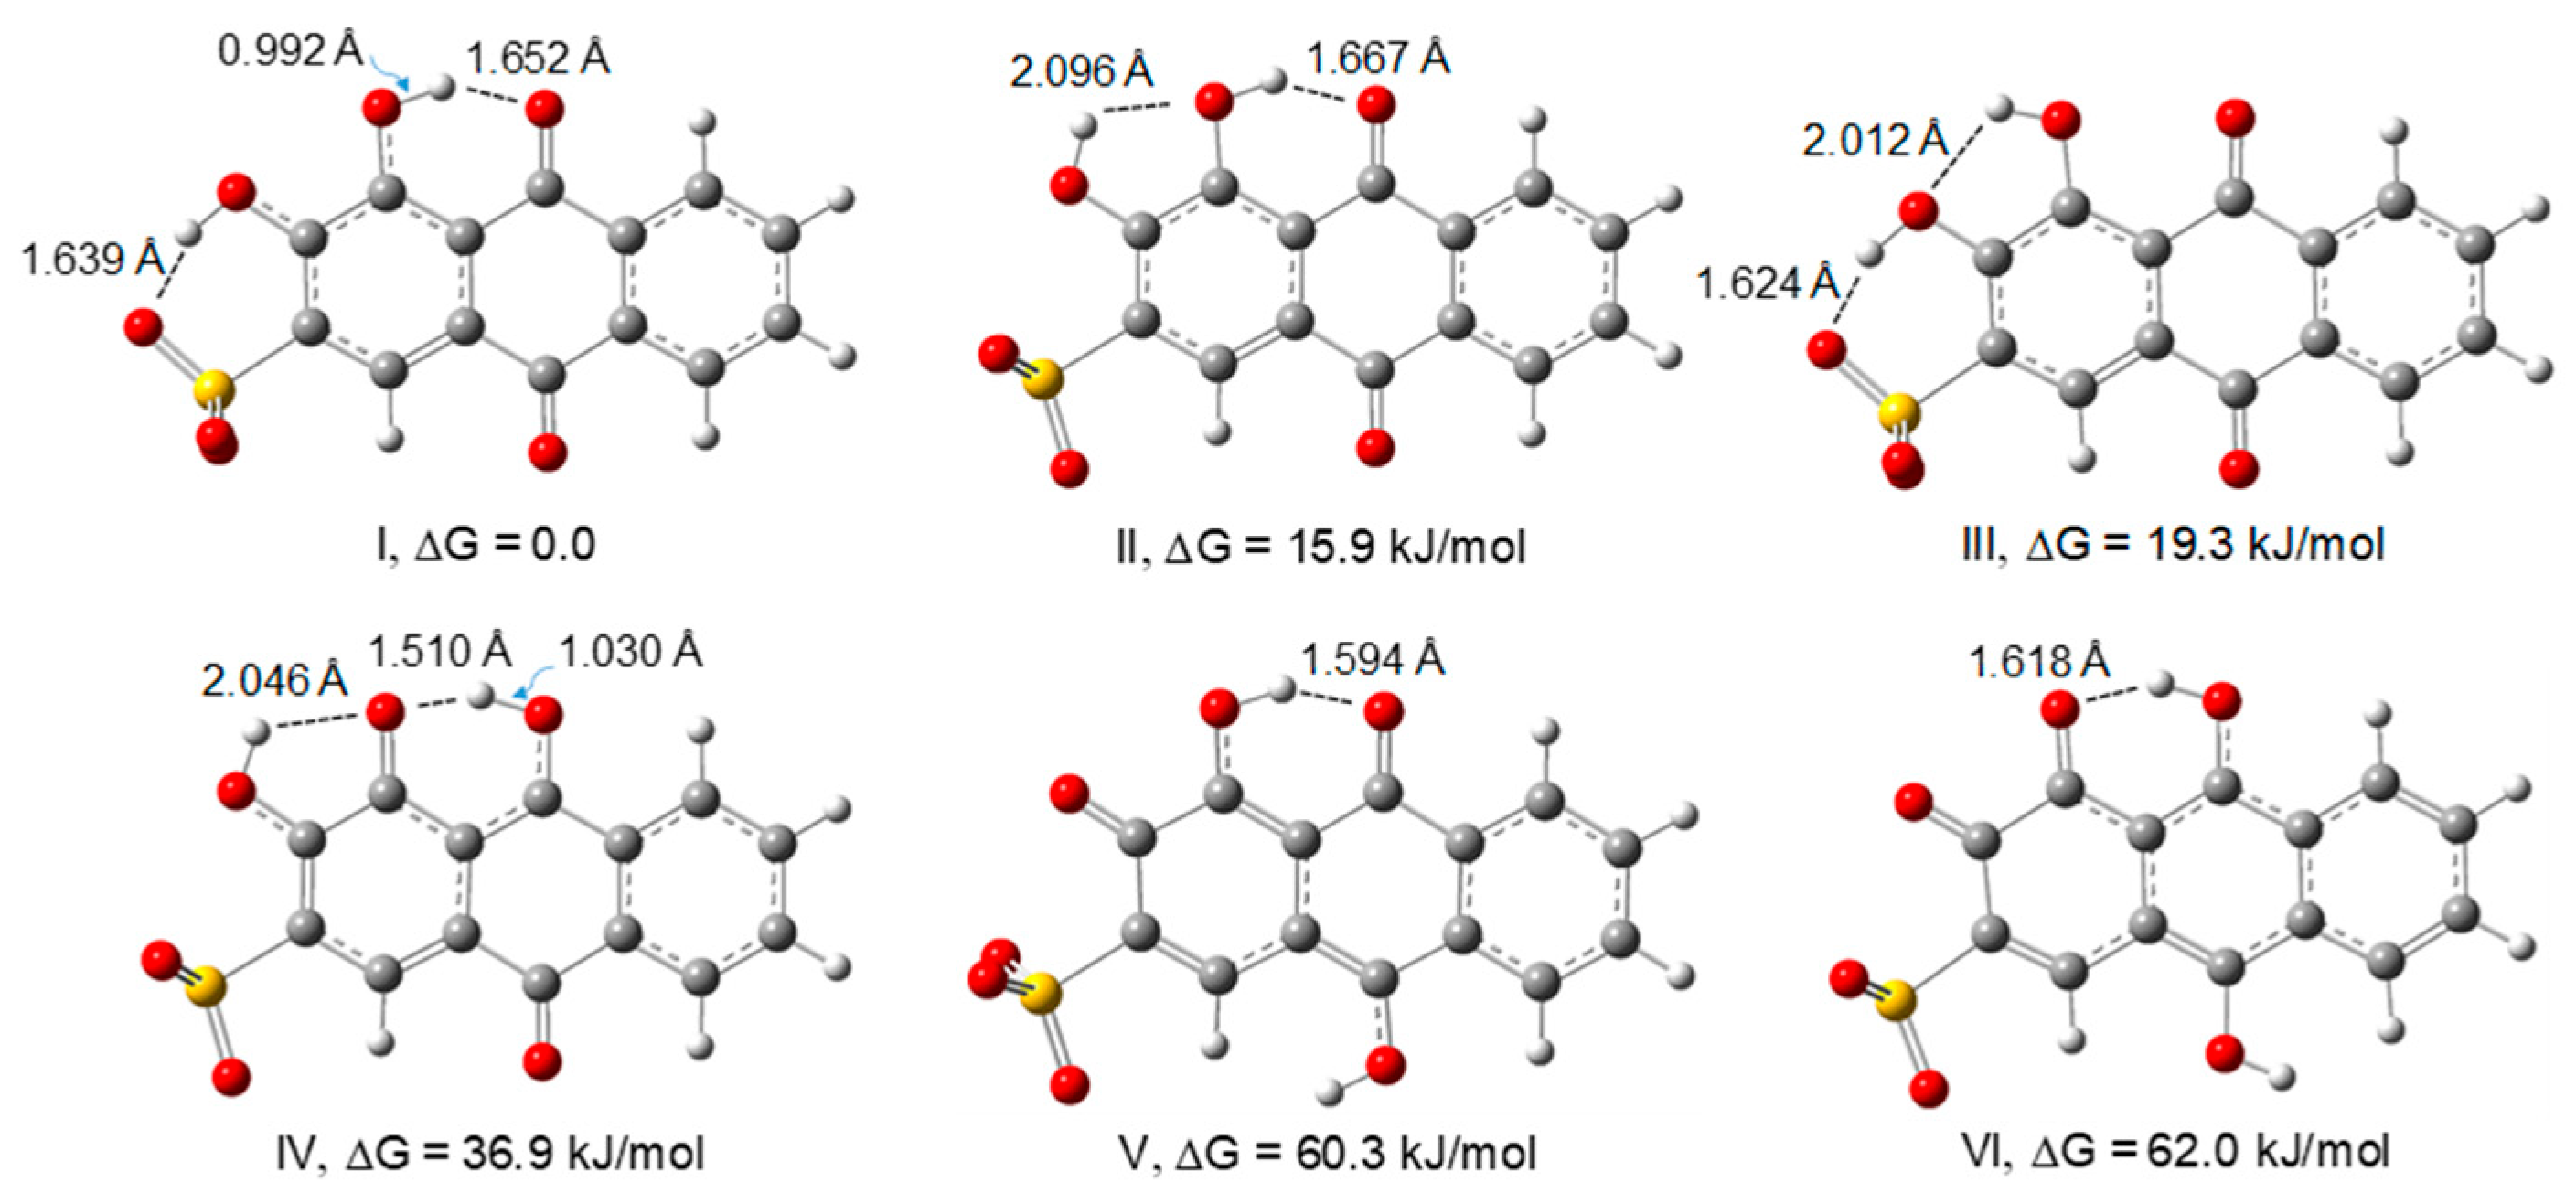
In order to determine the most stable forms of ARS in aqueous solution, we have optimized the structures of the possible conformers and tautomers of the monoanionic form by DFT at the B3LYP/6-311++G(2d,2p) level of theory, considering the bulk solvent effects of water. The optimized structures of the most stable forms of ARS in water, and a summary of their relative electronic energies, zero-point corrected electronic energies, Gibbs energies, symmetries, and equilibrium populations at 298.15 K are given in Figure 1 and Table 1, respectively. The equilibrium populations were estimated from the Boltzmann equation and calculated relative Gibbs energies.
Besides conformers I, II and III, an additional conformer, in which the two hydroxyl hydrogen atoms point to each other, was also optimized, but it converged to structure III. The additional tautomers calculated, with higher energies, are presented in the supplementary material (Figure S1). Structure I is stabilized by two strong intramolecular hydrogen bonds, with O–H…O distances of 1.639 and 1.652 Å. The strongest hydrogen bond involves the hydroxyl group in position 2 as the H-donor and the oxygen atom of the sulfonate group lying in the plane of the rings as the acceptor, and the second hydrogen bond is established between the oxygen atom of the carbonyl group in position 9 and the hydrogen atom of the hydroxyl group in position 1. The structure is very close to planar, however the corresponding structure with Cs symmetry is not a minimum. Therefore, the lowest energy conformer belongs to the C1 point group. Structures II, III, and IV also present two intramolecular hydrogen bonds; however, in these conformers (II, III) and tautomer (IV), one of the bonds is relatively weaker, with OH…O bond lengths close to 2 Å, making these structures significantly less stable, with ΔG values of 15.9, 19.3, and 36.9 kJ/mol, respectively, relative to conformer I. Tautomers V and VI present only one intramolecular hydrogen bond and, consequently, have very high energies. These results allow the conclusion that the dominant conformer of ARS in solution, with an estimated population of 99.8% at 298.15 K, is conformer I. The ordering of stabilities of the different structures in Figure 1 is in agreement with the results obtained by Joó et al. [45] at the B3LYP/TZVP level of theory. The structure of conformer I will be considered for the calculation of the spectroscopic properties of the free ligand in solution presented in the following sections in this work.
3.2. Complexation between Ga(III) and 1,2-Dihydroxy-9,10-anthraquinone-3-sulfonate (ARS)
3.2.1. NMR Studies on the Ga(III)/ARS System
Clear indications of metal–ligand binding are seen from broadening or coordination-induced shifts of the 1H and 13C signals of the ligand in the presence of the metal ion, compared with those of the free ligand, as well as, in favourable cases of slow exchange rate, from conformational changes after ligand complexation as indicated from the proton–proton coupling constants (JH-H). This, together with the metal ion NMR when NMR active metallic isotopes are present, can provide valuable structural information, including the type of metal centre present in the complexes, as widely exemplified in our previous work on the complexation of metal ions, such as aluminium, gallium, and metal oxoions of vanadate, molybdate, and tungstate with relevant ligands [46,47,48,49,50,51,52,53,54,55,56]. Furthermore, the valuable structural information obtained from NMR and other spectroscopic techniques in this study, combined with the structural details accessible through DFT calculations, allow the complete structural understanding of the complexation [57,58].
For a complete structural characterization of the interaction of Ga(III) ions with ARS in aqueous solution, we have obtained 1H NMR spectra for solutions having an ARS concentration of 5 mmol dm−3 and Ga(III) concentrations ranging from 0 to 5 mmol dm−3, giving metal:ligand molar ratios from 1:1 to 1:3 at pH* 4. As the 1H signals observed appear to be very broadened, probably due to exchange processes dependent on the temperature, the NMR spectra were obtained both at room and low temperature. Although it is more difficult to have a reasonable signal/noise ratio due to its lower abundance, we have also obtained 13C spectra for the same solutions at 298.15 K. The results are shown in Figure 2 and Figure 3 for the 1H and 13C NMR spectra of ARS alone and in the presence of gallium(III) nitrate, respectively. The 1H and 13C NMR experimental and calculated (DFT) spectral parameters for ARS are shown in Table S1.
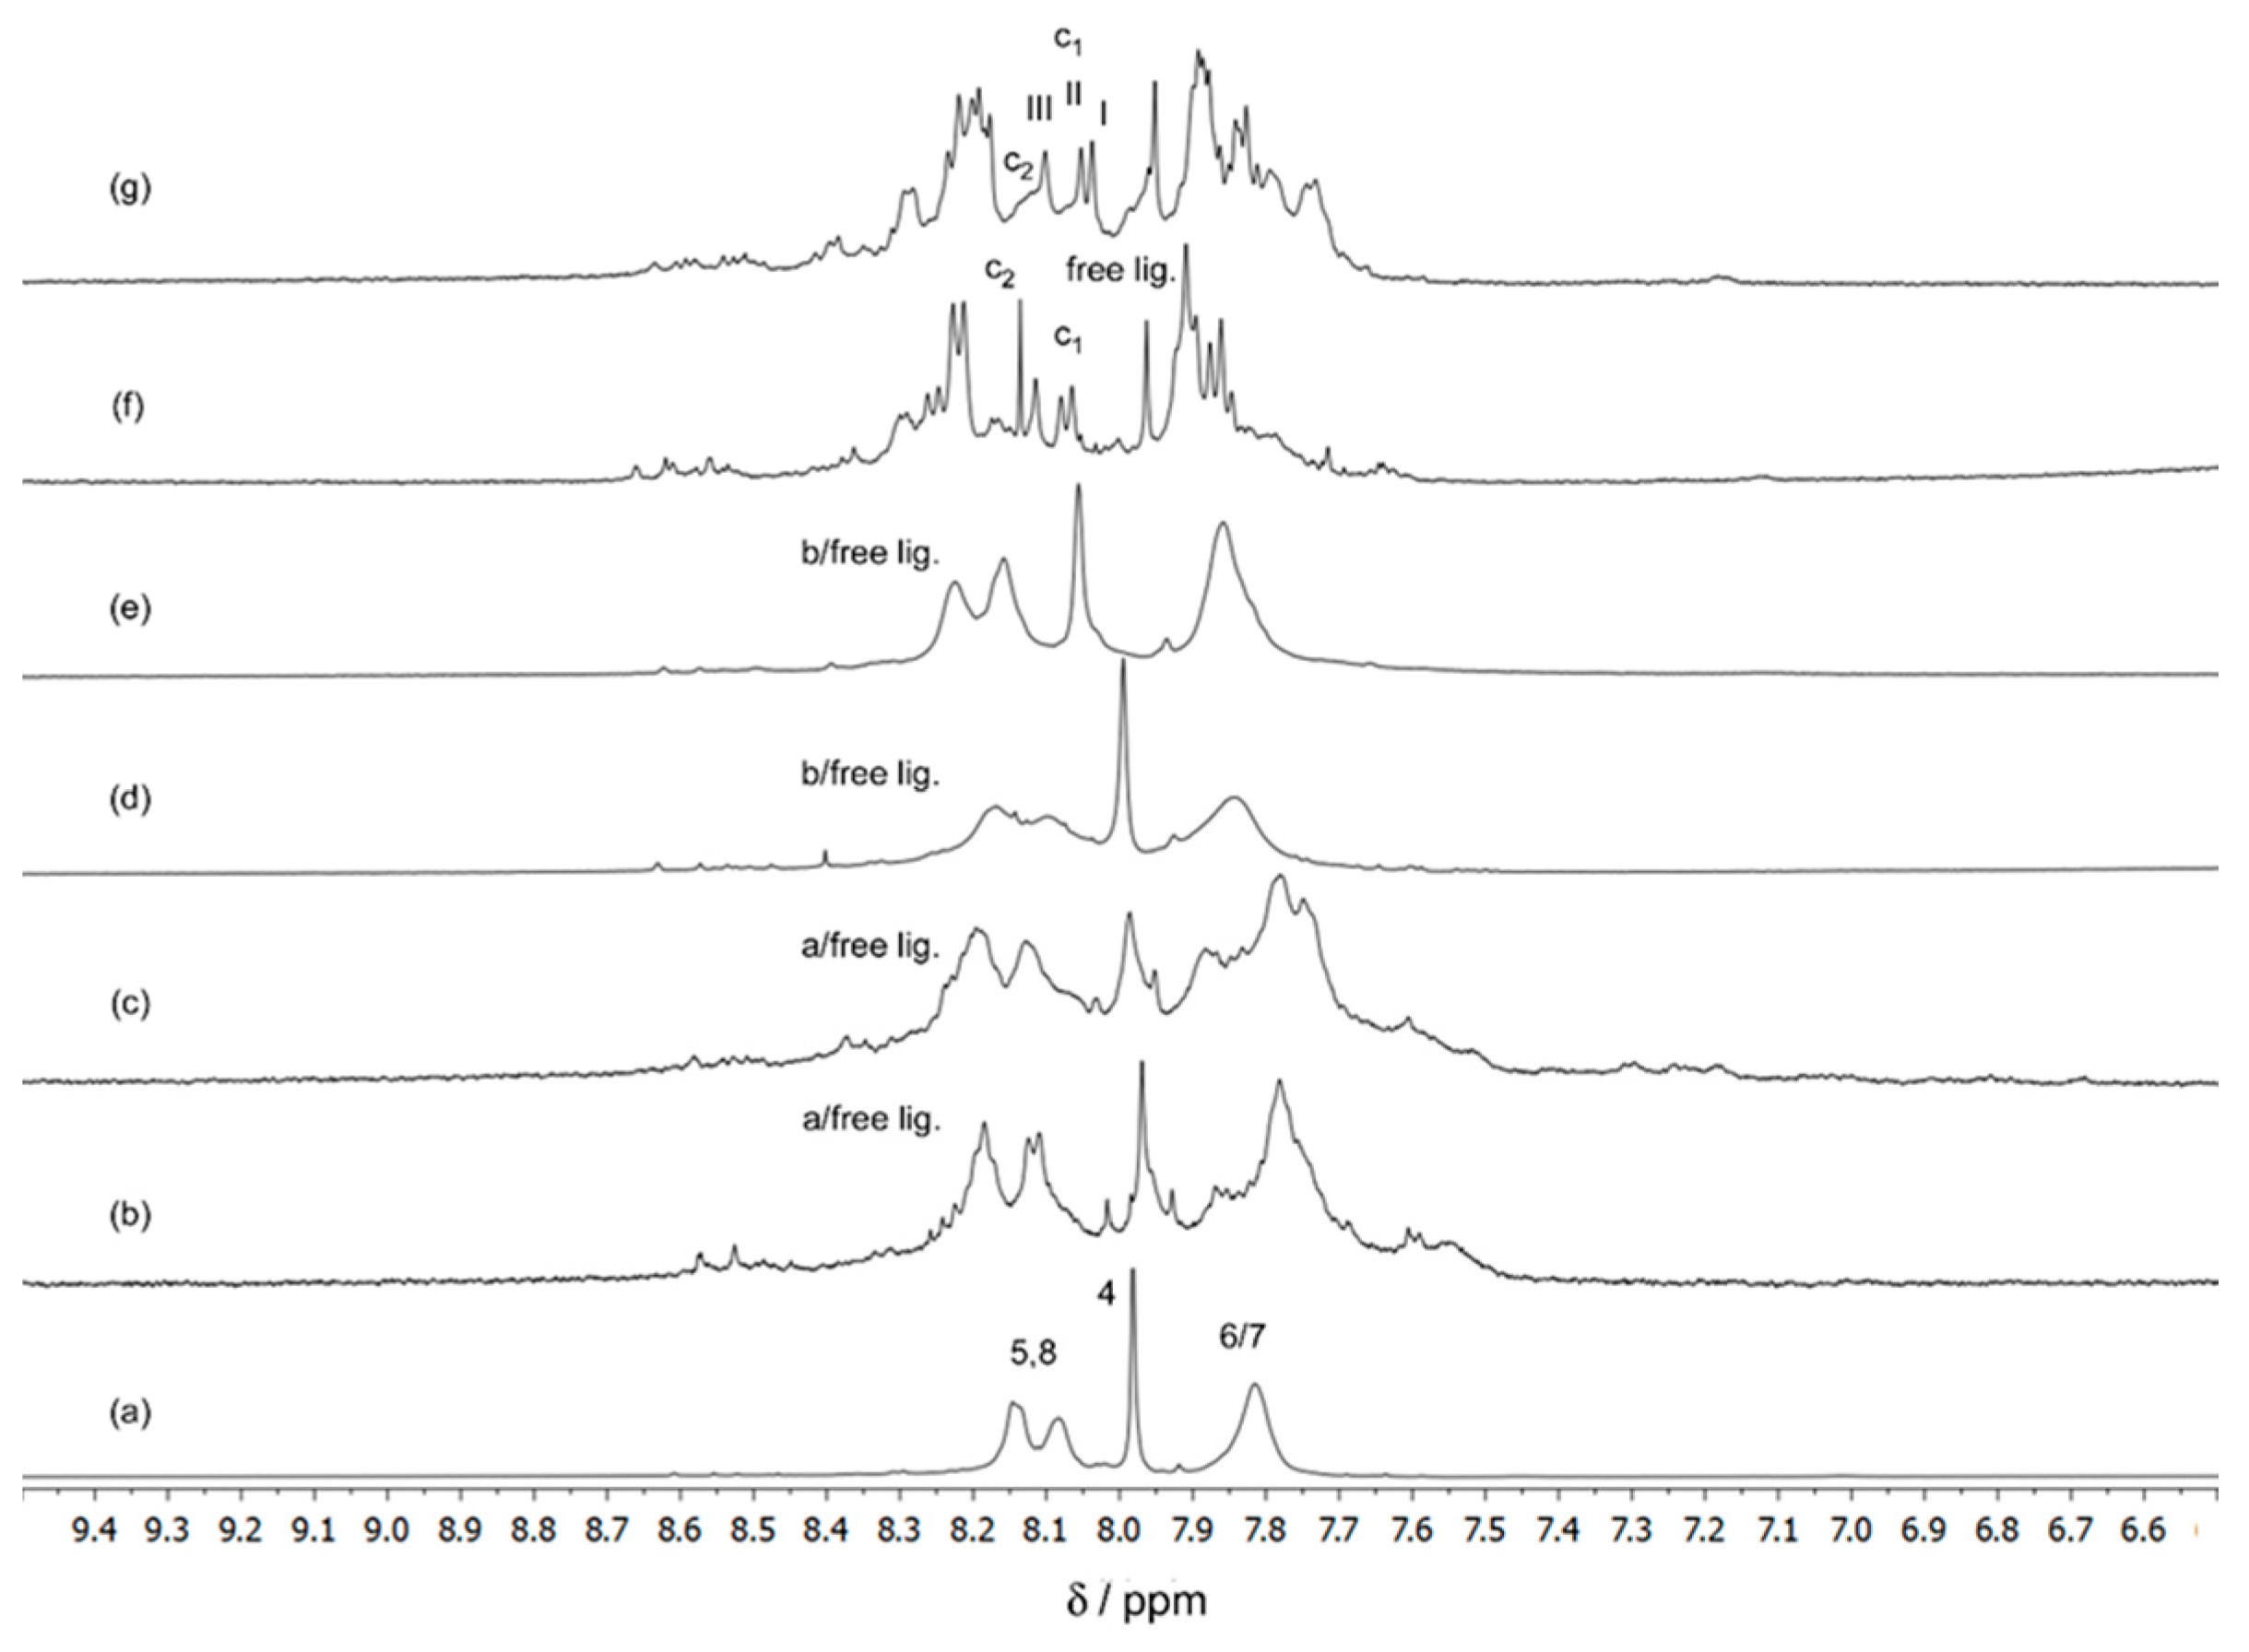
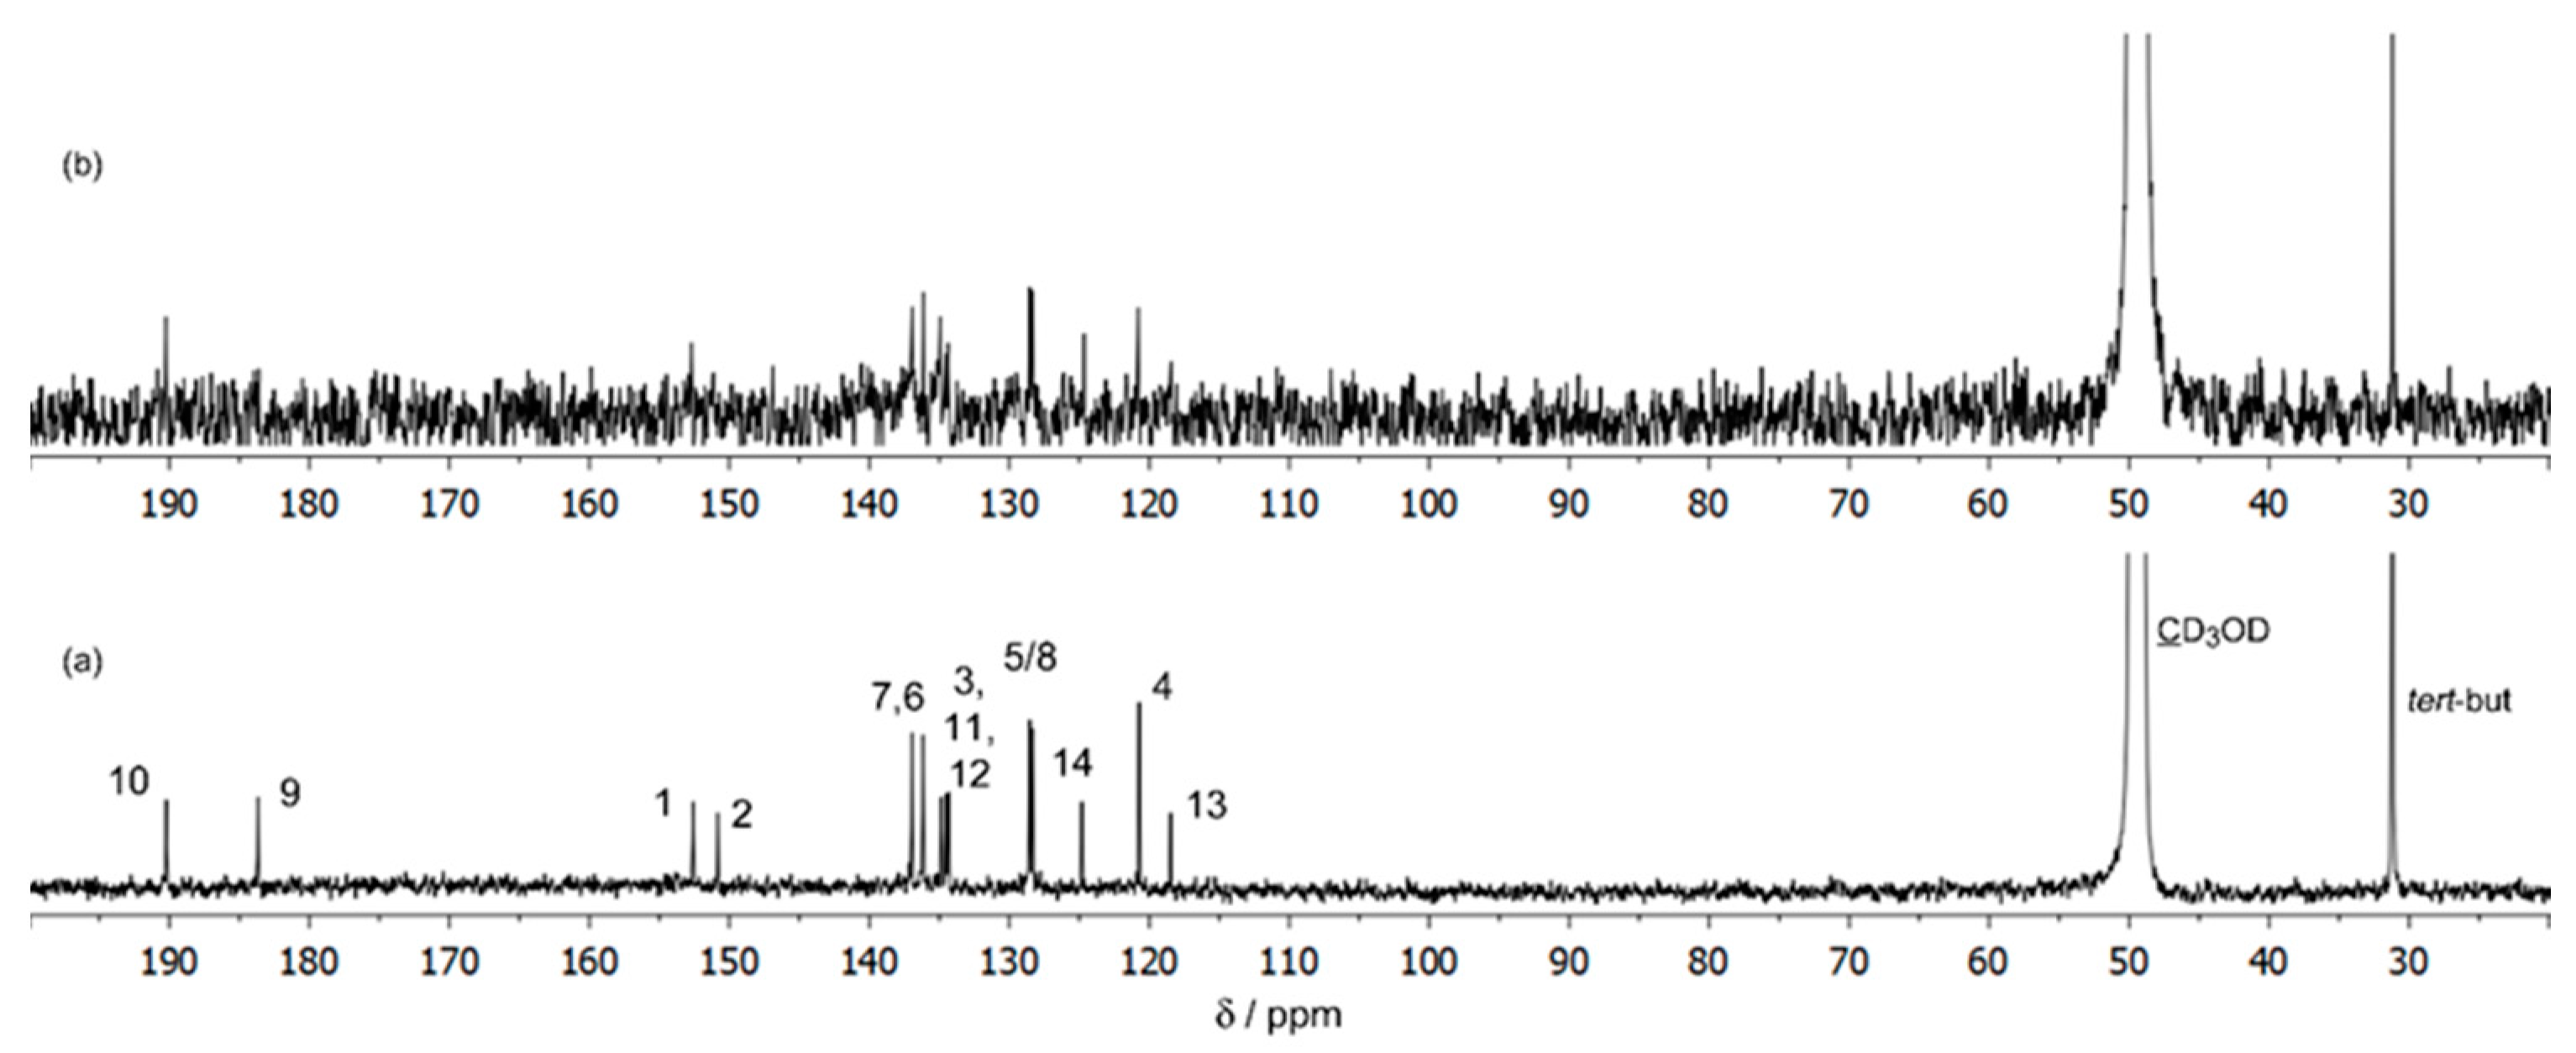
The 1H NMR spectrum of the free ligand (ARS) in D2O/CD3OD (1:1, v/v) at pH 3.96 showed a set of four signals (Figure 2a). The singlet at δ = 7.98 ppm was assigned to the H-4 proton. The multiplet centred at 7.82 ppm was assigned to protons 6 and 7, and the doublets (with low resolution) centred at 8.08 and 8.15 ppm were assigned to protons 5 and 8. The assignment of the 13C signals is shown in Figure 3a. The assignment of the 1H and 13C NMR signals of ARS was completed with the help of the calculation of the nuclear magnetic shielding constants for the lowest energy conformer of ARS (conformer I, Figure 1) in aqueous solution that were subsequently converted into chemical shifts by subtraction from those calculated at the same theoretical level for TMS (Table S1).
As seen in Figure 2, upon addition of the Ga(III) metal ion, very broadened 1H NMR signals were observed, particularly in 1:1 and 1:2 solutions, at both temperatures, suggesting the formation of 1:1 and/or 1:2 complexes strongly affected by the exchange processes (on the NMR time scale) between the free and complexed ligands. The corresponding spectra of the 1:3 molar ratio solutions showed, on the other hand, individual and distinct signals, even though they appeared to be slightly broadened (suggesting also some exchange on the NMR time scale). Although the signals in the 1:1 and 1:2 solutions became narrower with the decreasing temperature, it was not possible to detect distinct signals for the free and complexed ligands, probably due to the low concentration of the complexes and exchange, on the NMR time scale, between them and/or with the free ligand (more evident in solutions with 1:2 metal:ligand molar ratio). The corresponding spectra of the 1:3 (metal:ligand) molar ratio solutions showed, at 298.15 K, (besides the single signal at δ = 7.95, corresponding to proton H-4 of the free ligand) three additional single signals with similar intensities at δ values of 8.04, 8.05, and 8.10 ppm, suggesting the formation of one complex of 1:3 stoichiometry (complex c1), in which the three ligands present a mer configuration (Figure 2g). It is proposed that this complex is in equilibrium with another isomer possessing fac configuration (complex c2), according with the additional single signal detected (δ value of 8.14 ppm). The 1H NMR spectra obtained at the lower temperature (280.15 K) showed narrower signals, the effect being visible in the spectrum of Figure 2f, suggesting a decrease of the exchange rate between the species present, allowing the detection of more separated individual signals. This observation gives further consistency to the suggestion that in solutions having a 1:3 (metal:ligand) molar ratio composition, two dominant 1:3 complexes (c1 and c2) having 1:3 stoichiometry were detected, in which the three coordinated ligands display mer and fac configurations around the metal centre, respectively. Complex c1 (mer) was shown to be more stable than c2 (fac) in the mixture of 50% D2O/50% CD3OD solvents, and in the temperature range from 280.15 K to 298.15 K, although the concentrations of c1 and c2 decreased and increased, respectively, with increasing temperature, as indicated by the intensities of the 1H NMR signals of the H-4 protons of the spectra obtained at 280.15 K and 298.15 K (Table 2).
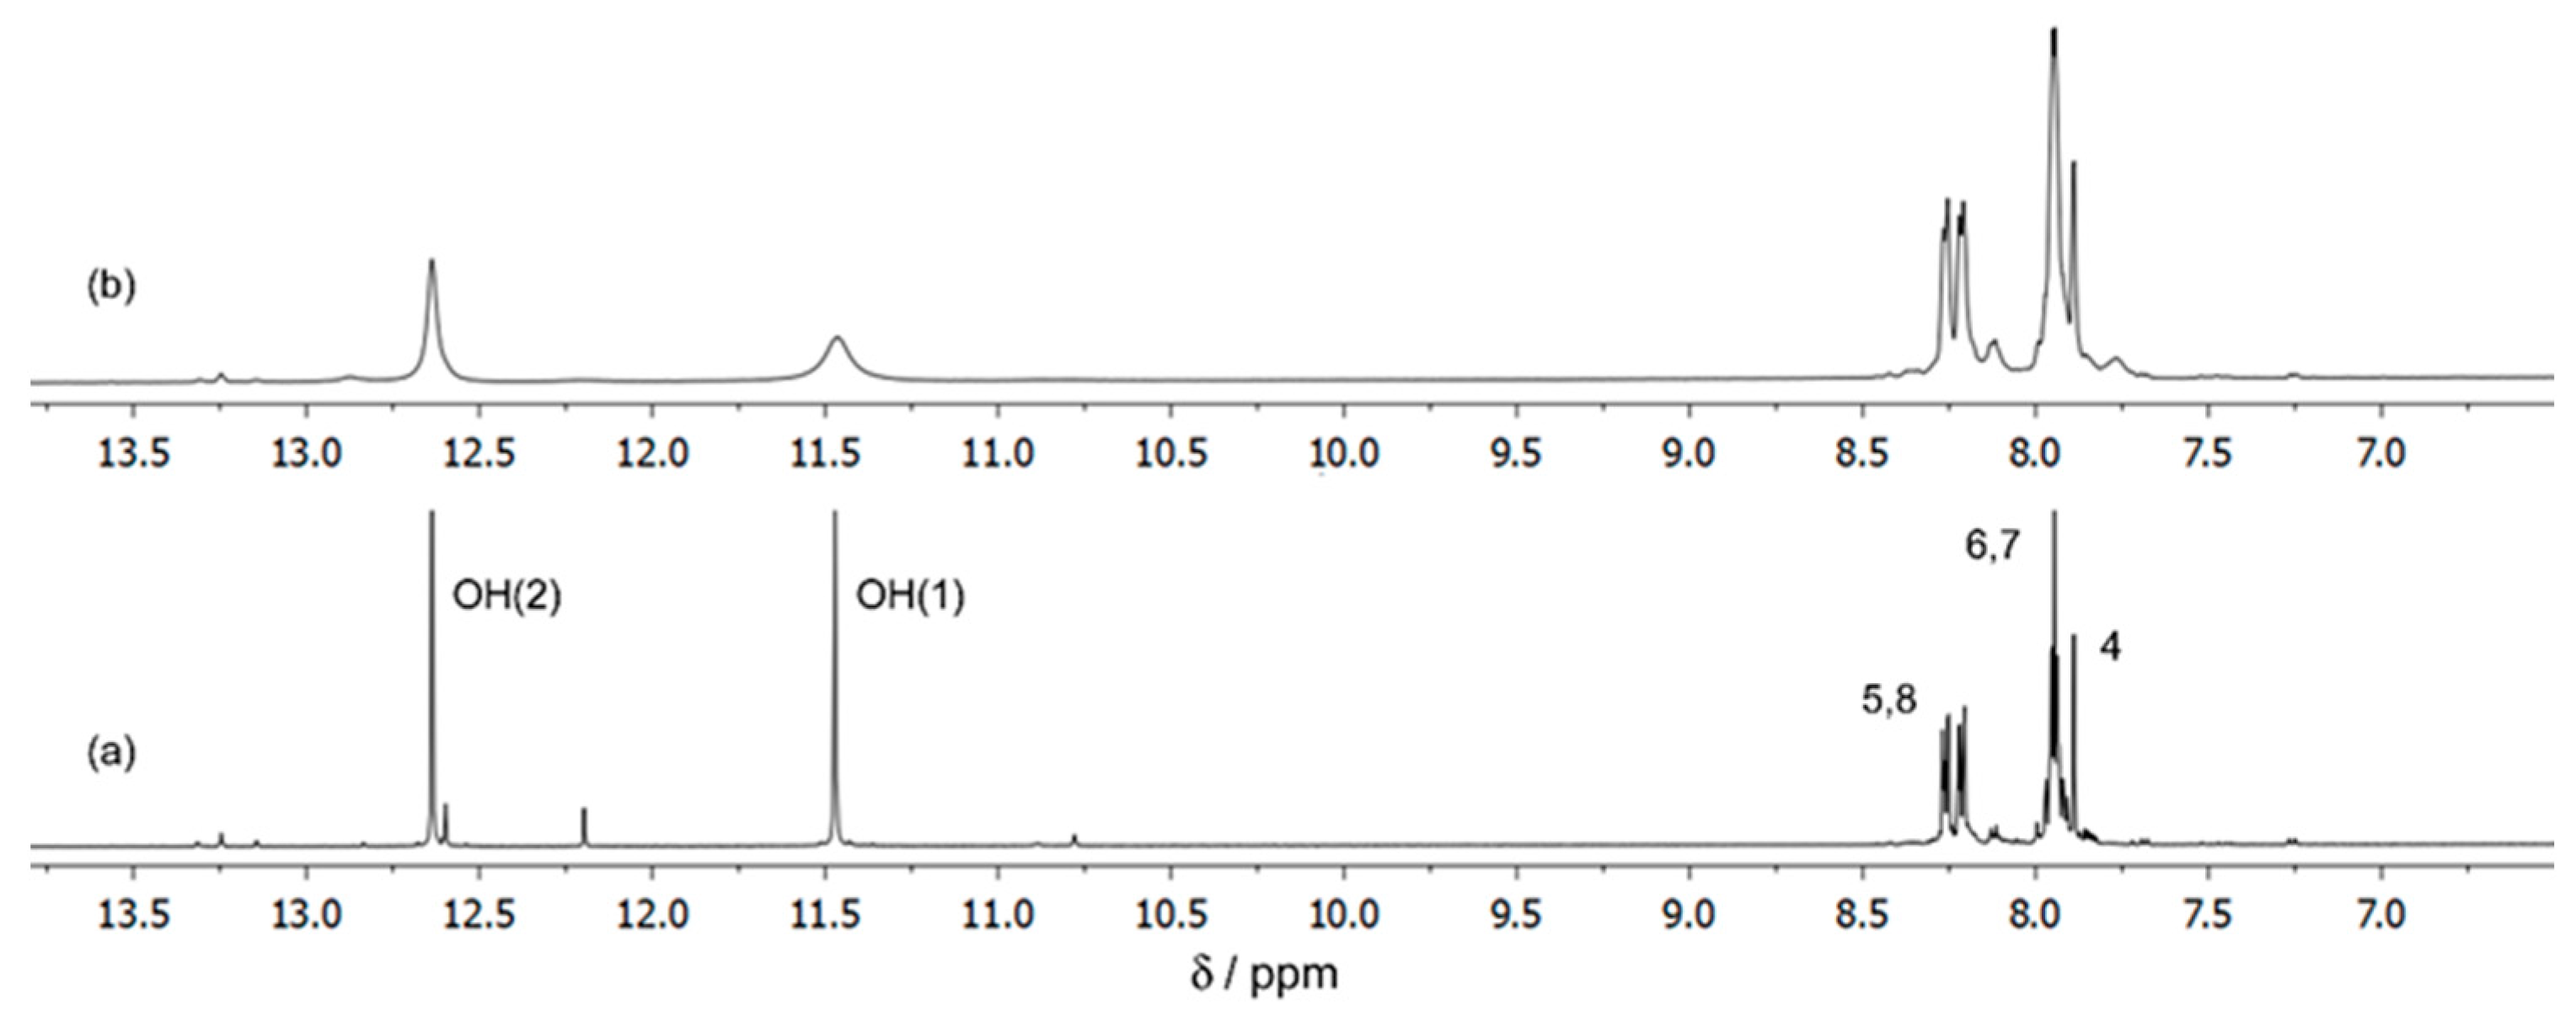
We have also obtained 13C spectra for the same solutions and the spectrum of the 1:1 solution is shown for illustration in Figure 3. It was not possible to achieve for this solution (1:1) a signal/noise ratio adequate to easily detect all the signals and increased difficulties were also found for the 1:2 and 1:3 solutions, due to the low abundance of the 13C isotope, the low concentration of the complexed species and the associated exchange processes between them. The 13C NMR spectrum of the solution of Ga(III)/ARS 5.0:5.0 mmol dm−3 (1:1) (Figure 3b) showed that, relative to the free ligand (Figure 3a), intensity changes in the signals corresponding to the 13C nuclei of C-1, C-9, and C-13, suggesting the presence of one or more complexes in which the ligand was coordinated to the metal through the OH-1 and C(9)=O groups, with the intensity of C-13 also being affected as it is adjacent to both the C-1 and the C-9 atoms. Further support comes from the 1H spectra of Ga3+/ARS 5:5 mmol dm−3 solutions at temp. 298.15 K in DMSO, as shown in Figure 4, taking into account the intense broadening of the OH-1 signal in comparison with the slight broadening of OH-2, in the presence of the metal, suggesting that the coordination of the ligand through the OH-2 group will be unlikely at low pH, in accordance with the pKa values of the two phenolic protons (pKa2 = 5.8 and pKa3 = 10.8) [44].
Considering now the geometrical details, one, two, and three molecules of ARS coordinated one mononuclear Ga3+ metal centre through the deprotonated OH-1 and carbonyl (C(9)=O) groups, forming six coordinated near-octahedral complexes with the minor species a and b and the dominant species, the isomers c1 and c2, respectively, as will be discussed in the DFT calculations section. One and two molecules of ARS coordinated the Ga3+ metal ion in complexes a and b, respectively, with the remaining positions occupied by coordinated water molecules. For complex a, [Ga(ARS)(H2O)4]+, a single set of 1H signals was observed as expected, taking into account that a single molecule of ARS was coordinated. Complex b is expected to be a 1:2 (metal:ligand) species, [Ga(ARS)2(H2O)2]−. The observation of only one set of 1H signals, although very broadened, means that the two complexed ligand moieties are magnetically equivalent (i.e., they have the same 1H and 13C chemical shifts), and indicates a symmetrical 1:2 complex. Several different structures can be proposed for complex b (different arrangements of cis or trans structures). However, it is not straightforward to definitively assign its structure from the NMR data. To determine which of the forms is the most stable, the structures of the 1:2 isomers were optimized at the DFT level, as will be discussed in detail below. With 1:3 (metal:ligand) complexes, although the two isomers detected, complexes c1 and c2, have a 1:3 (metal:ligand) stoichiometry [Ga(ARS)3]3−, the dominant isomer c1 shows a mer geometry of the three coordinated ligands around the metal centre, while the fac geometry was observed for the minor complex c2, as will be discussed in detail in the DFT calculations section. The coexistence of fac and mer isomers, with the mer isomer being more stable than the fac, was found in previous studies on the complexation of the Ga(III) metal ion with maltolate and hydroxythiopyrone [59,60]. For 1:3 (metal:ligand) Ga(III) metal ion complexes, the mer isomers were found to be generally more stable than their respective fac congeners and the relative stabilities have been found to be associated with the balance between bonding and steric factors. The mer isomer reduces intra-ligand repulsions, while the fac isomer is favoured where stronger covalent M–ligand bonds can be formed due to more extensive through-ligand conjugation mediated by metal d orbitals [61]. While previous studies on the complexation of Ga3+ with 8-HQS [47] and 8-HQ [61,62] in solution are consistent with only mer-isomers being present in significant amounts at room temperature for 8-HQ and, for Ga3+/8-HQS, over the whole temperature range up to 353.15 K [47], a mixture of mer and fac isomers has been identified, at room temperature, for the system Ga(III)/maltolate, both in solution and in the solid state (showing in the solid state the proportion of 0.67 for mer and 0.33 for fac) [59]. A mixture of mer and fac isomers has also been found for Ga(III)/hydroxythiopyrone, whose complexes can undergo fast isomerization in aqueous solution resulting in the coexistence of the fac and mer isomers, in spite of the fac geometry present in the solid state [60].
3.2.2. DFT Structural Characterization of the Ga(III)/ARS Complexes
Taking into account the structural information provided by the NMR results, which suggests the formation of complexes with 1:1, 1:2, and 1:3 Ga(III):ARS stoichiometries, DFT studies were carried out to obtain additional details on their geometries. To determine the lowest energy structures, several isomers were considered for each stoichiometry and, for the 1:2 complex, the requirement of a symmetrical structure in which the two ligands are magnetically equivalent was also taken into account. Additionally, since our NMR results suggest a 1,9 coordination mode, which is in contrast with the previous proposal [27] of coordination though positions 1 and 2, in order to bring additional insight on this question, the two potential modes of coordination for alizarinate complexes were investigated in these calculations: (i) chelation through the carbonyl in position C-9 and the adjacent hydroxyl group in position C-1 (labelled hc), or (ii) chelation through the hydroxyl groups in positions C-1 and C-2 (labelled hh). Given that the literature value for the pKa3 of ARS is 10.8 [44], and considering the pH range in which our experiments were carried out, the hydroxyl group in position C-2 was set as protonated in these calculations. Whenever relevant, structures involving tautomerization of the ligand were also optimized. Several functionals were used in these calculations, in order to benchmark their ability to reproduce the experimental NMR results. The calculations were carried out with the B3LYP [28,29,30,31] and B3PW91 [29,32,33,34,35,36] hybrid functionals and with the long-range corrected CAM-B3LYP [37] and wB97X-D [38] functionals (wB97X-D includes additional dispersion corrections). The bulk solvent effects of water were taken into account in all cases; however, for the B3PW91 and wB97X-D calculations in water, the 1:3 fac-hc structures did not converge to a minimum in the potential energy surface, and therefore, for these two functionals, the relative Gibbs energies (ΔG) given in Table 3 for the 1:3 structures were obtained from gas phase calculations. Table 3 summarizes the relative Gibbs energies and populations of the isomers at 298.15 K, and their point group symmetries. The comparison of the predicted populations of complexes with the NMR results revealed that, in general, the B3LYP functional allows a better reproduction of the experimental data, as it correctly predicted the formation of a dominant 1:1 complex, a dominant 1:2 complex, and significant amounts of both the fac and mer 1:3 isomers, as detected by NMR. In contrast, functionals CAM-B3LYP, B3PW91, and w-B97X-D predicted significant amounts of the hh 1:1 complex (not detected by NMR). Concerning the 1:2 stoichiometry, all functionals correctly predict the formation of one dominant complex, as found by NMR. For the 1:3 stoichiometry, and considering the calculations in water, both B3LYP and CAM-B3LYP overestimated the amount of the fac-hc isomer relatively to the mer-hc isomer; however, the error was smaller with B3LYP. The gas phase results obtained with functionals B3PW91 and w-B97X-D will be discussed and compared with those obtained with B3LYP later in this section. Taking into account these conclusions, the following discussion of the structures of complexes will be based on the B3LYP results. The optimized geometries obtained with the B3LYP functional are depicted in Figure 5, Figure 6 and Figure 7.
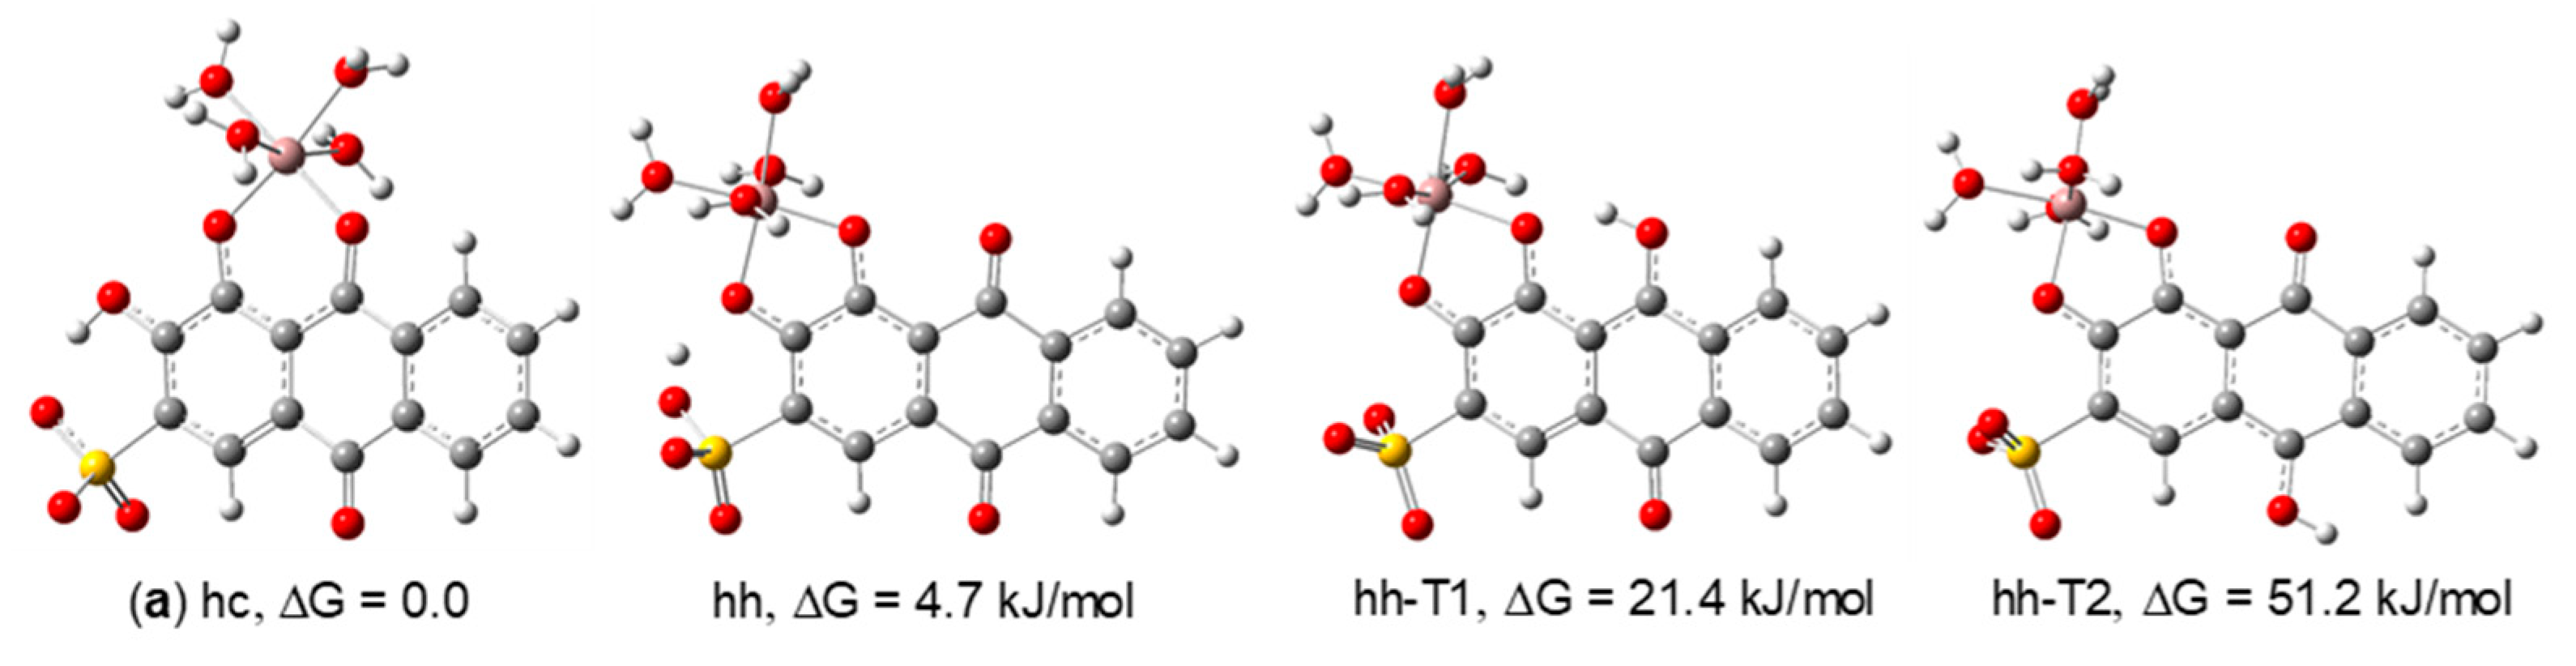
The relative Gibbs energies of the structures considered for the 1:1 stoichiometry (Figure 5) indicate that, in this case, the structure involving coordination through the carbonyl in position C-9 and the adjacent hydroxyl group in position 1 (structure a, hc) is the most stable, with a population of 86.8% at the B3LYP/6-311G(d,p) level. Structure hh, in which there is coordination to the metal through both hydroxyl groups in positions 1 and 2 is 4.7 kJ/mol higher in energy and has a population of 13.1%. In structure hh, the hydrogen atom of the hydroxyl group in C-2 is involved in weak interactions with both the coordinated oxygen atom in C-2 and one of the oxygen atoms from the sulfonate group. Due to the lability of these interactions, we have also optimized the geometries of the tautomers hh-T1 and hh-T2; however, these were found to be much higher in energy and not relevant from an experimental point of view. On the other hand, it is not expected that the oxygen atom in position C-2 remains protonated after binding to the metal. It is possible, therefore, that in acidic solution a weak interaction between H+ and the O− in position C-2 persists in structure hh, as suggested by these calculations. Therefore, we propose structure a for the complex of 1:1 stoichiometry observed in the NMR spectra. According to its relative Gibbs energy, the hh structure may also be present in very low concentration. Its population is, however, too low to allow its detection in a mixture where complex a is dominant and there are exchange processes (on the NMR time scale) between the free and complexed ligand molecules.
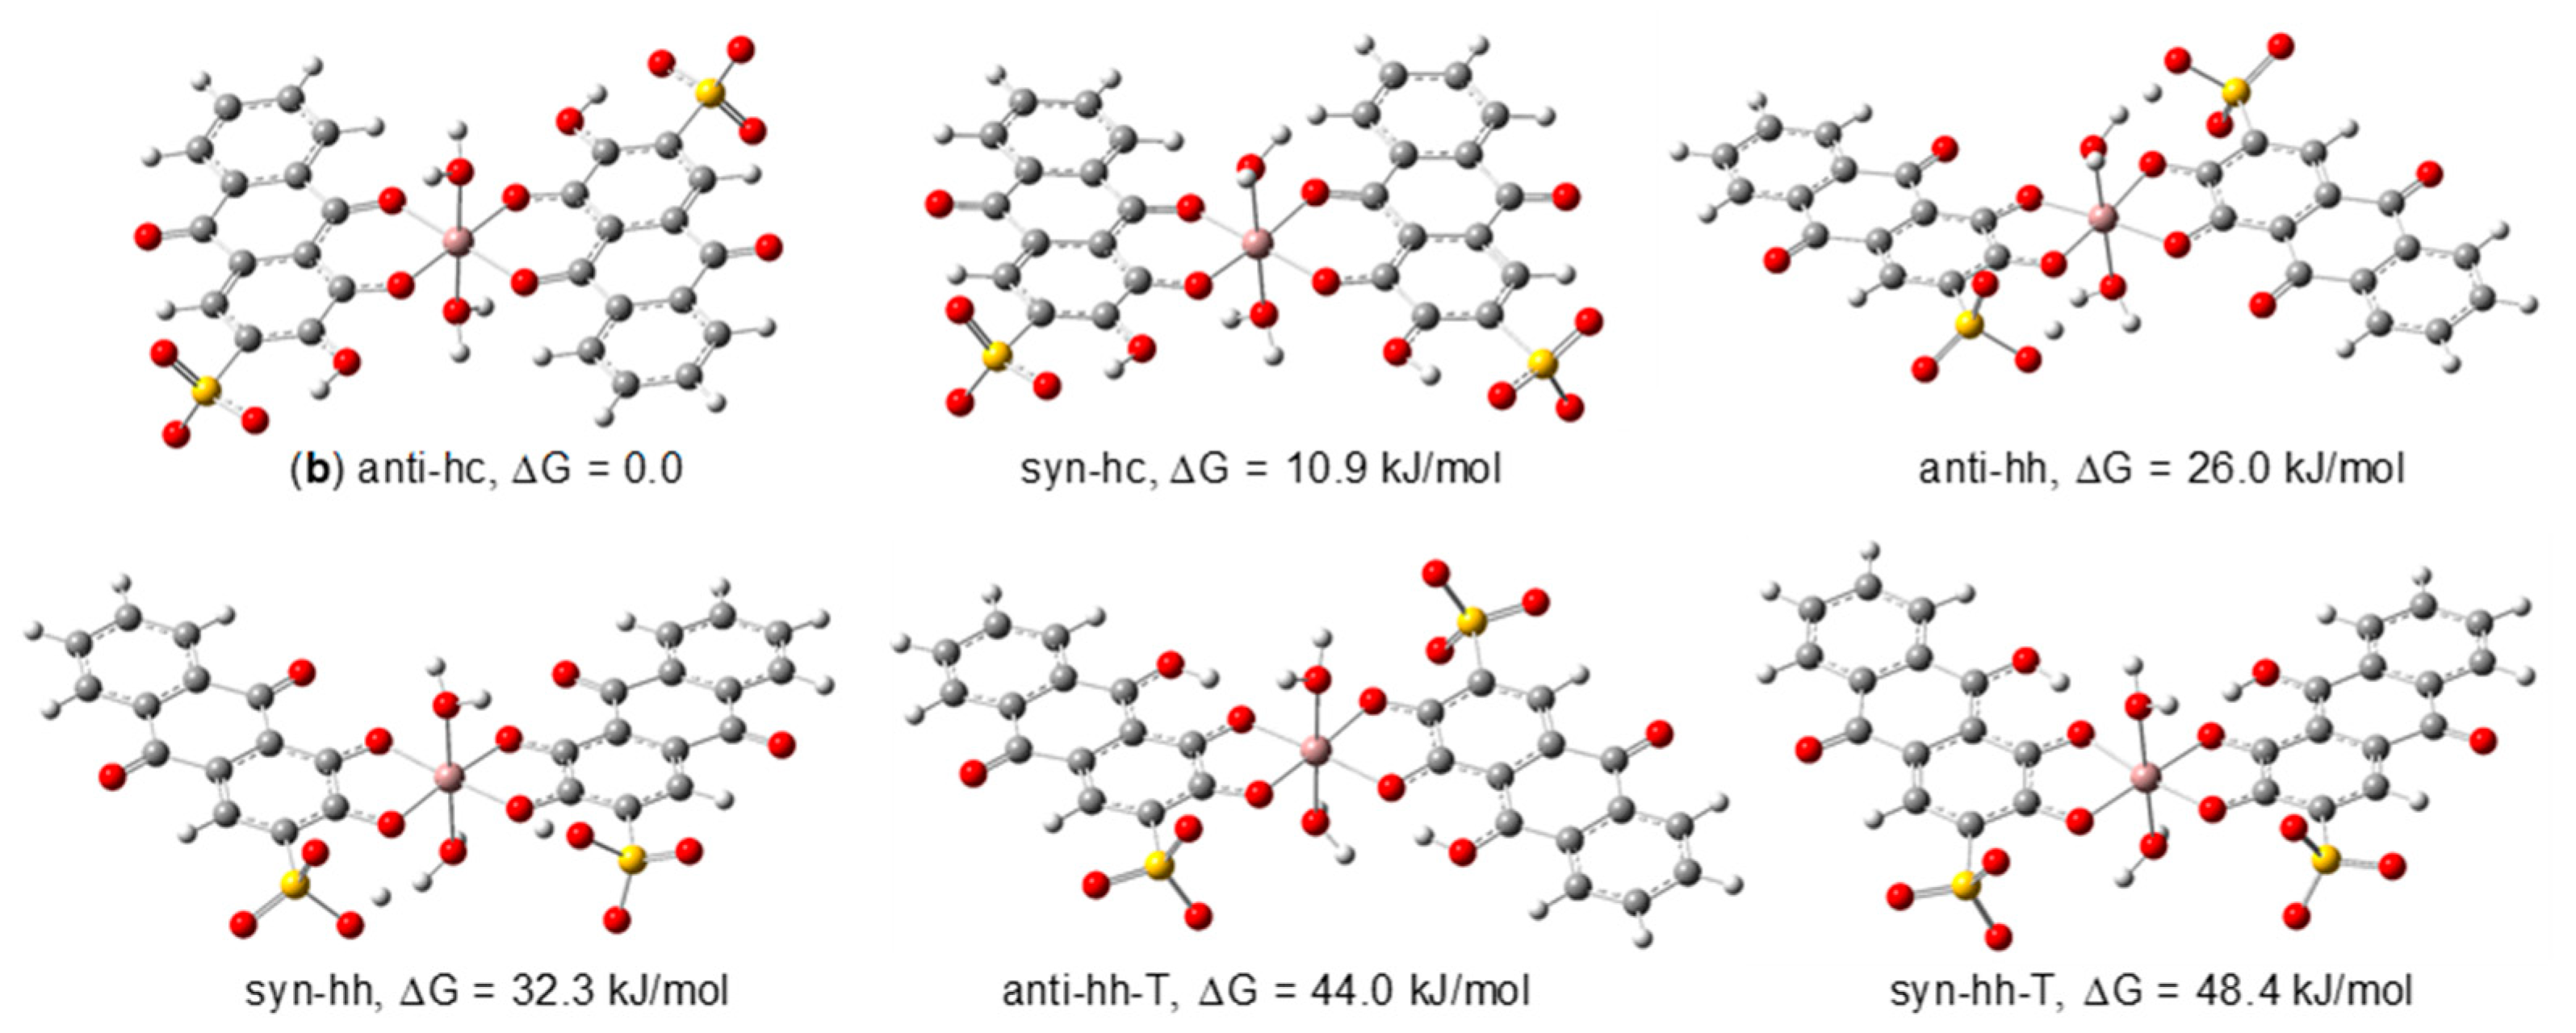
To determine the geometry of the 1:2 (metal:ligand) complex we have considered six possible structures (Figure 6), with Ci or Cs symmetry, in accordance with the NMR data which points to a structure in which the two ligands are magnetically equivalent. Besides the two possible modes of coordination (hc or hh), the anti (ligands pointing in opposite directions) or syn (ligands pointing in the same direction) relative arrangements of the ligands were also analysed. The tautomers of the hh isomers were considered, as before for the 1:1 structures.
From the analysis of the relative energies of the isomers, we can conclude that the anti-hc (b) structure is the most stable one, with a population of 98.8% (B3LYP/6-311G(d,p). This suggests that in acidic solutions of 1:2 (metal:ligand) molar ratio, one dominant complex, coordinating to the metal through positions C-1 and C-9, should be present, in total accordance with the NMR findings for the 1:2 solutions at 298.15 and 280.15 K.
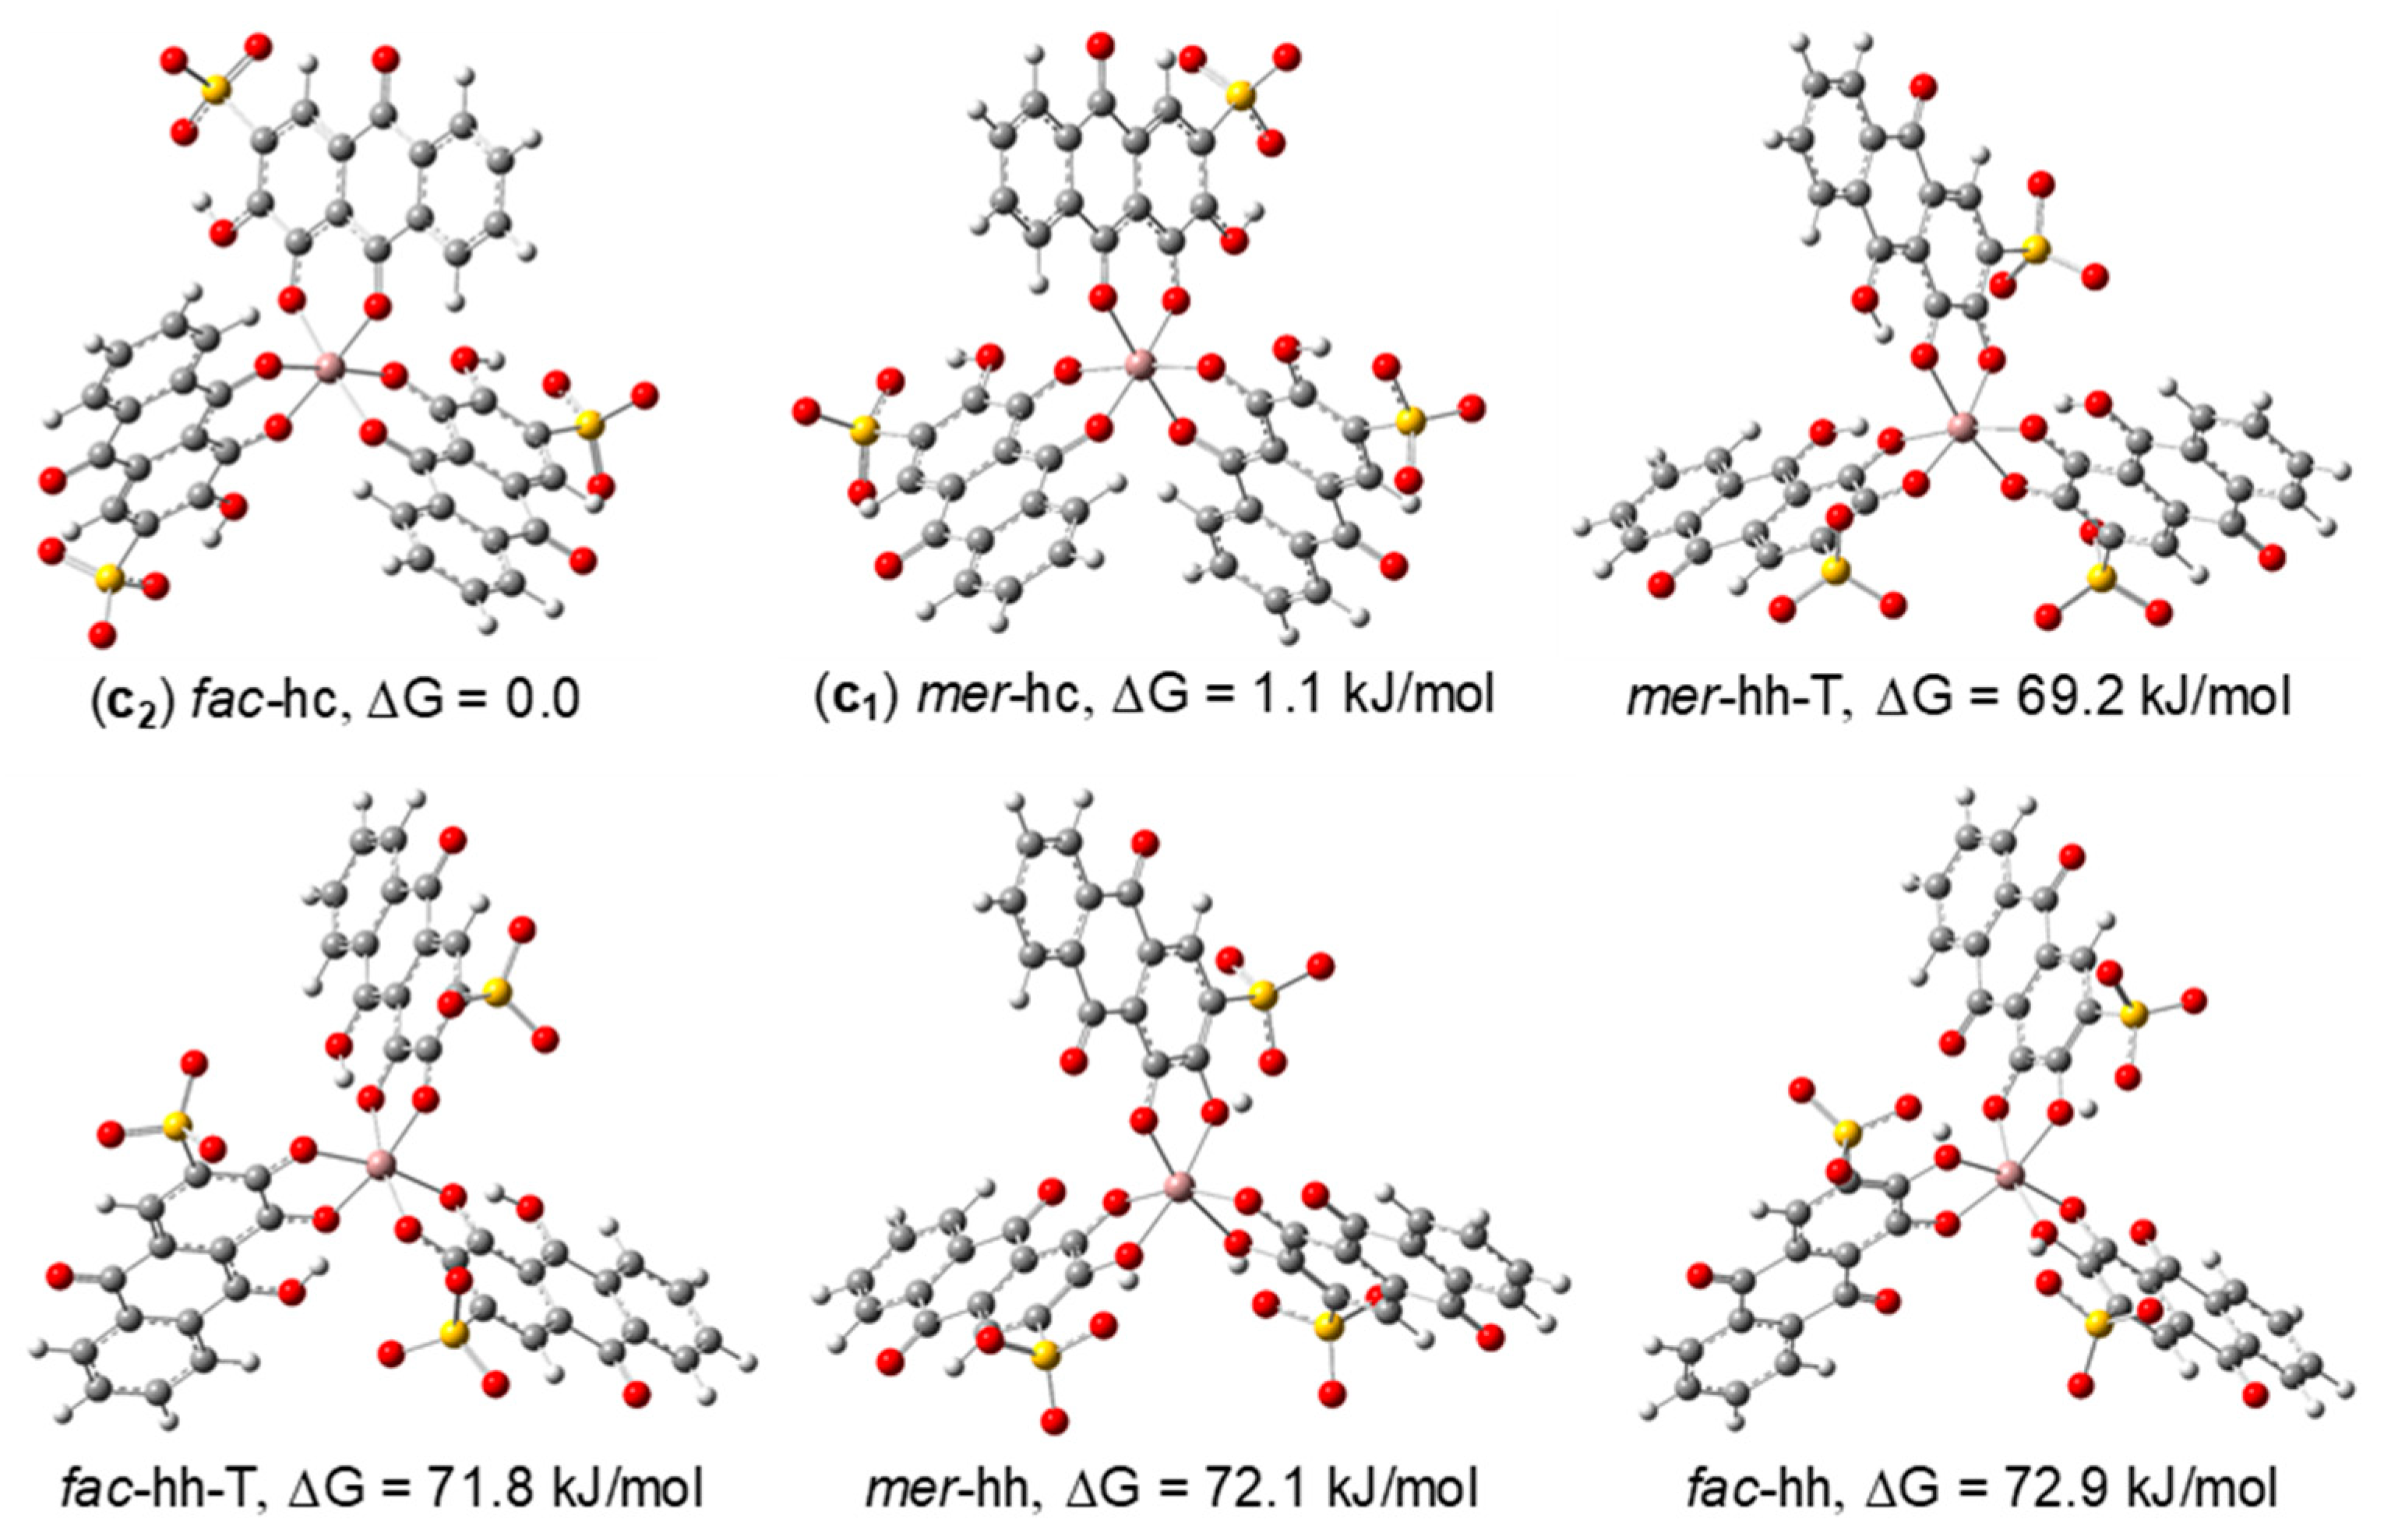
Finally, for the 1:3 stoichiometry complexes, six possible structures were optimized, in which mer (C1 symmetry) and fac (C3 symmetry) configuration structures with hh or hc coordination were considered. Additionally, tautomers of the hh-type structures were also calculated (Figure 7). The results obtained for the relative Gibbs energies and populations in water at 298.15 K indicate that it is possible that the fac-hc and mer-hc structures coexist in solution, with populations of 61.4 and 38.6% (B3LYP/6-311G(d,p), respectively. Again, the DFT results are consistent with the NMR data which shows that the fac and mer isomers of Ga(III)/ARS coexist in solutions of molar ratio 1:3. The calculated mer/fac ratio does not, however, reproduce the experimental ratio estimated from the NMR spectra, which favours the mer isomer instead. Nonetheless, the B3LYP calculations correctly predicted significant amounts of both complexes in equilibrium. This discrepancy is most likely due to the limitations of the solvation model used in the DFT calculations, which does not treat specific interactions (such as H-bonding) between the solvent and complexes and can easily change the relative thermodynamic stability between structures. Furthermore, also due to restrictions of the computational methods, we have considered water as the only solvent, not taking into account the less polar mixture of CH3OH/H2O (1:1) used in the solution studies. Support for this conjecture comes from additional calculations at the B3LYP/6-311G(d,p) level in gas phase, for which the population of the mer isomer is 96,4% and that of the fac isomer is 3,6% (the B3PW91 and the w-B97X-D functionals gave similar results), reversing the stability predicted for water solutions, and suggesting that the mer isomer is favoured in less polar media. This seems to suggest that the solvent polarity is an important factor in the stabilization of these two isomers.
3.2.3. ATR-FTIR Studies on the Ga(III)/ARS System
The Ga(III)/ARS 1:1, 1:2, and 1:3 molar ratio samples used in the NMR experiments (solutions in CD3OD/D2O) were left at room temperature until the solvents were completely evaporated and, in all cases, a red powder was obtained. These solids were then studied using ATR-FTIR and the spectra of the solid reagents, ARS and Ga(NO3)3, were also obtained for comparison.
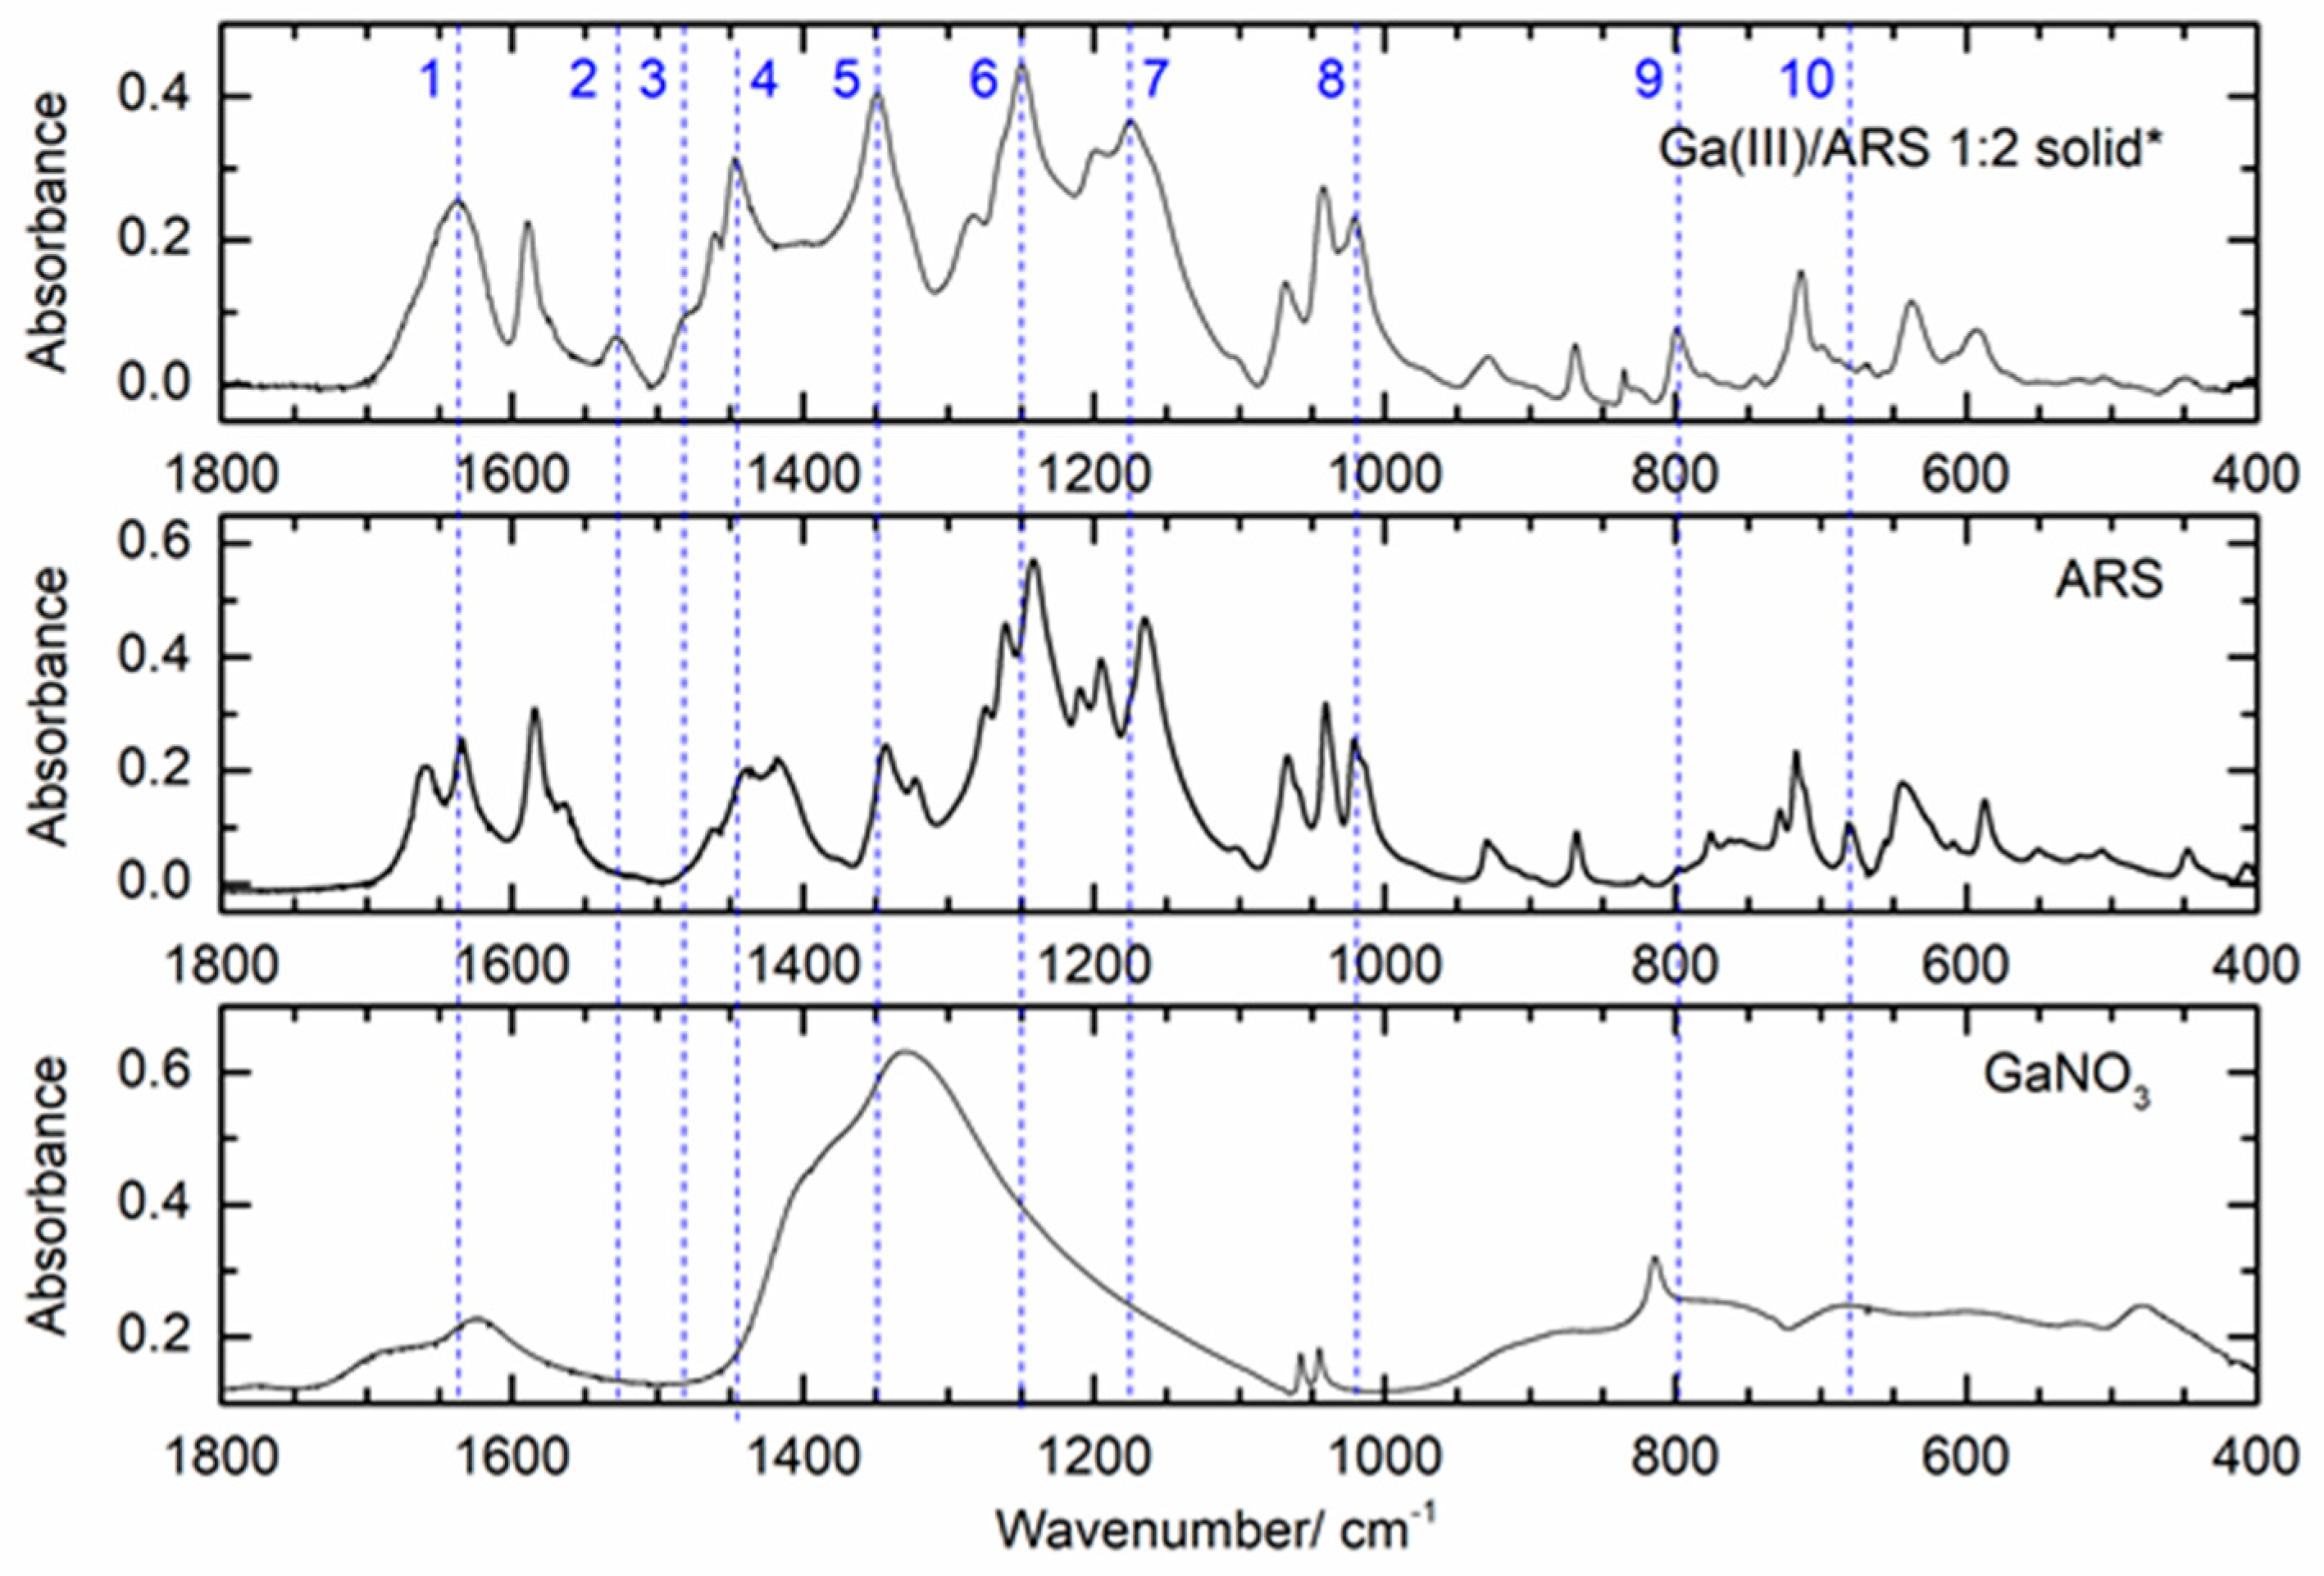
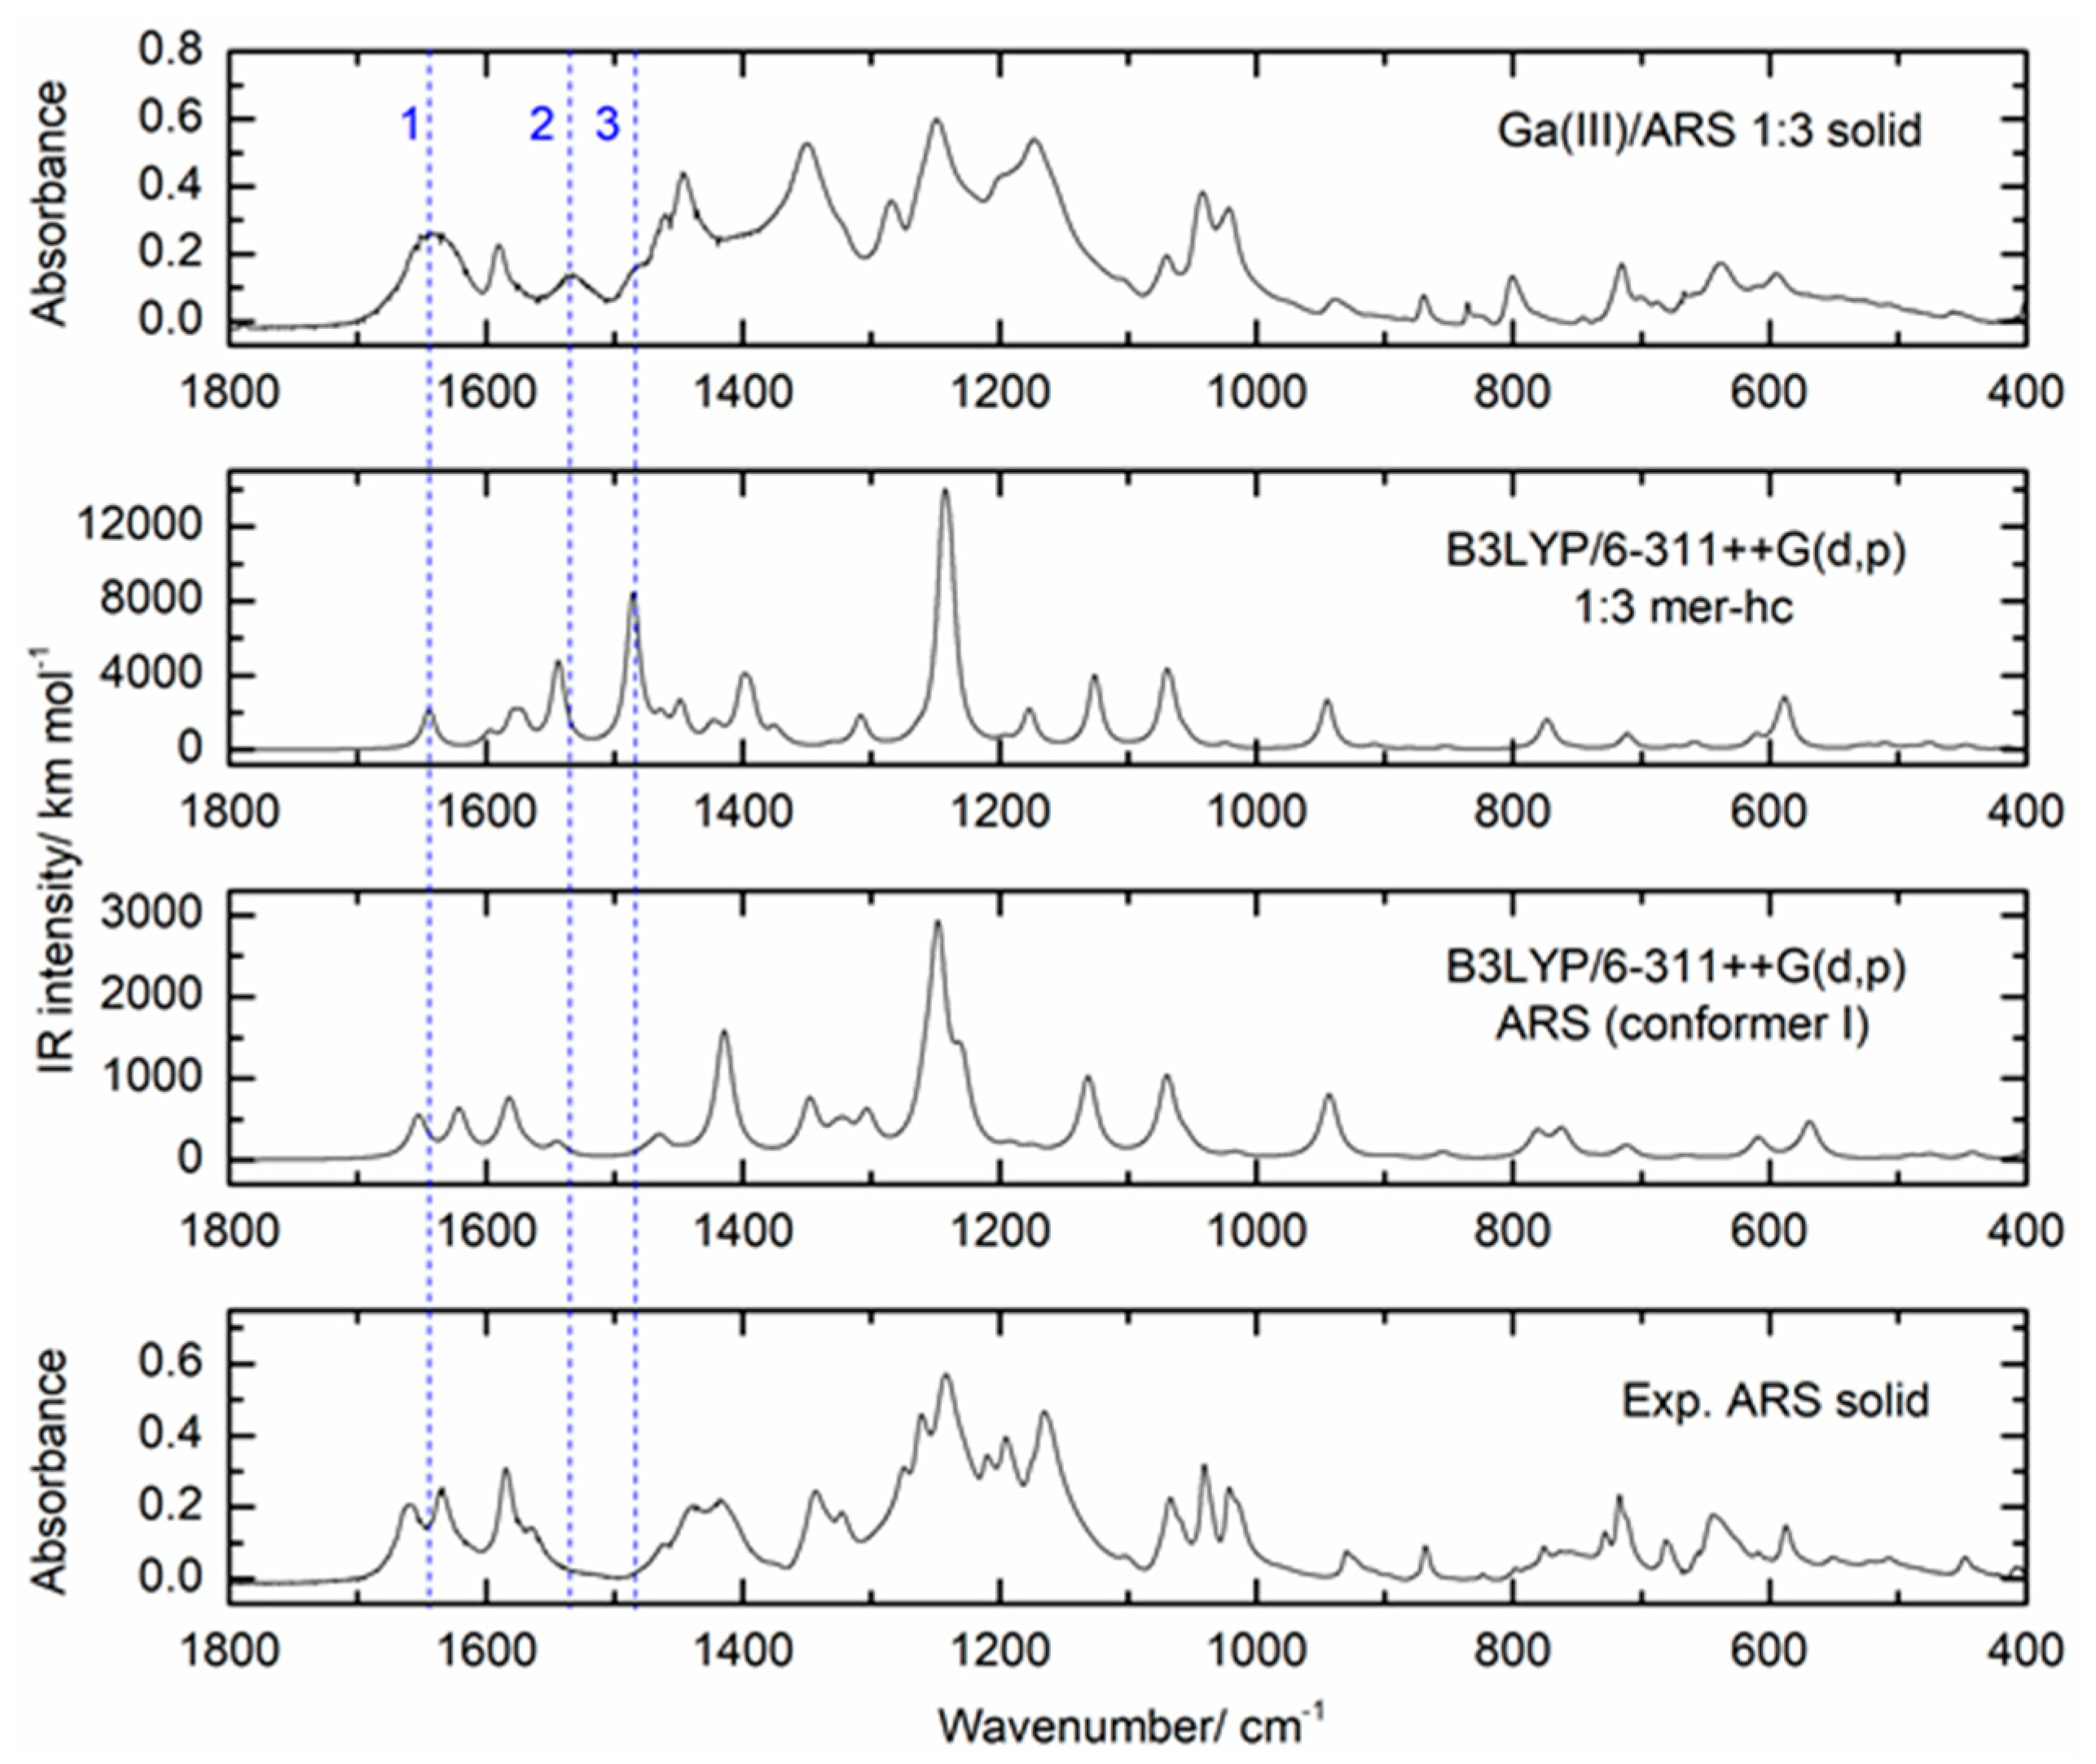
Figure 8 shows the ATR-FTIR spectrum in the 1800 to 400 cm−1 region of the 1:2 molar ratio solid sample (top spectrum), in comparison with the spectra of solid ARS and solid gallium nitrate. The top spectrum shows evidence of complexation between Ga(III) and the ligand, as demonstrated by the presence of the new bands at 1527.3 (band 2), 1482.1 (band 3), and 796.2 cm−1 (band 9) and the changes in the intensity or shape of the bands at 1660.6 (band 1), 1445.7 (band 4), 1019.9 (band 8), and 680.1 cm−1 (band 10). Moreover, the shape and intensity of band 5 at 1348.8 cm−1 is probably also an indication of complexation, since it is much stronger than the free ligand band at this wavelength and much narrower than the metal salt band with a maximum at 1327.9 cm−1. Additionally, bands 6 (1250.5 cm−1) and 7 (1175.7 cm−1) are slightly shifted relative to the ligand bands (1241.2 and 1164.5 cm−1). All these changes are a clear indication of the formation of one or more complexes between Ga(III) and ARS. The assignment of these bands based on DFT calculations will be discussed in the following sections. The spectra obtained for the powder samples of the solutions with 1:1 and 1:3 Ga(III)/ARS molar ratios (Figure S2) showed the same type of features described above for the 1:2 powder sample, with slight changes relative to the latter. The band profile was similar in all these samples (Figure S2), with three bands in the region between 1700 and 1500 cm−1, followed by a region of intense bands between 1500 and 1000 cm−1, and less intense bands in the region between 900 and 500 cm−1. The spectra of the ligand and complexes in the 2500–3700 cm−1 region (Figure S3) were dominated by wide and intense bands that are due to the symmetrical and anti-symmetrical stretching vibrations of the OH groups of ARS, of coordinated H2O molecules in complexes, and of the hygroscopic H2O present in the samples. The CH vibrations were observed close to 3000 cm−1. To provide a detailed analysis of the FTIR-ATR spectra of the samples, the vibrational frequencies and intensities were calculated by DFT at the B3LYP/6-311++G(d,p) theory level for the ARS ligand (conformer I) and for the optimized structures of the complexes. The calculated spectra for the ligand and for the 1:3 mer complex are shown in Figure 9 (the full spectrum can be seen in Figure S4) in comparison with the experimental spectra. The spectra calculated for the remaining complexes are given in Figure S5.
The vibrational spectrum calculated for the most stable conformer of ARS, conformer I, reproduced the main bands of the experimental spectrum of the solid ARS reasonably well, particularly in the spectral region above 1200 cm−1. In the 1700–1500 cm−1 spectral range, three bands were observed in the experimental spectrum at 1660, 1635, and 1584 cm−1, which were predicted at 1653, 1621, and 1582 cm−1, respectively, at the B3LYP/6-311++G(d,p) level of theory. The good agreement between the calculated and the experimental frequencies allowed the assignment of these bands with a good degree of confidence. According to the calculations, the band observed at 1660 cm−1 in the experimental spectrum (predicted at 1653 cm−1) has a predominant contribution from the υC10=O stretching mode, while the band observed at 1635 cm−1 (predicted at 1621 cm−1) is due to the υC9=O stretching mode combined with the bending of the C–OH groups. The lower frequency observed for the υC9=O stretching (relative to the υC10=O stretching) is reasoned by the fact that the C9=O group is involved in an intramolecular H-bond. The band predicted at 1582 cm−1 and observed at 1584 cm−1 has a major contribution from the bending of the C–OH groups. Regarding the changes observed in the experimental spectrum of the solid Ga(III):ARS 1:3 sample in comparison with the experimental spectrum for ARS (Figure 9), the most significant differences are the presence of the two new bands observed at 1533 cm−1 (band 2) and 1480 cm−1 (band 3) in the spectrum of the solid Ga(III):ARS 1:3 sample, which are absent from the ARS experimental spectrum. Accordingly, these bands, being absent from the theoretical spectrum of ARS, are predicted for the complex at 1543 cm−1 and 1486 cm−1, respectively, and correspond to the most important differences between the theoretical spectra of the complex and ligand. Band 2, predicted at 1543 cm−1, is due to the υC9=O and υC1–O stretching modes, combined with ring υCC stretching. Band 3, predicted at 1486 cm−1, involves contributions from these three modes, together with an additional contribution from the υC2–O stretching mode. These results are particularly relevant since they confirm the involvement of the C9=O group in the coordination to the metal, in complete agreement with the NMR and DFT findings. The shift of the υC9=O stretching mode to a lower wavelength upon complexation is expected, taking into account the weakening of the C9=O bond occurring with the ligand–metal electron donation and has also been reported for related complexes, such as the In(III)/ARS complex [26].
The bands in the region below 1200 cm−1 in the spectra of the ligand and complex were somewhat more difficult to assign, due to some differences between the theoretical and the experimental spectra. These differences are ascribable to intermolecular interactions, such as H-bonding, involving the polar groups of the ligand and also, possibly, hygroscopic water. Nonetheless, a tentative assignment of the bands of the complex can be made based on the calculations. Thus, the experimental broad bands with maxima at 1445 cm−1 and 1249 cm−1 correspond most likely to the bands predicted at 1401 cm−1 and 1244 cm−1, respectively, which have major contributions from ring υCC stretching vibrations. Additionally, the bands observed at 1070, 1042, and 1019 cm−1 were assigned to the vibrational modes of the sulfonate group based on the calculated wavelengths for the anti-symmetrical stretching (1126 cm−1), anti-symmetrical stretching combined with ring vibrations (1070 cm−1), and symmetrical stretching combined with ring vibrations (945 cm−1).
3.2.4. UV-Visible Absorption and Fluorescence Studies on the Ga(III)/ARS System
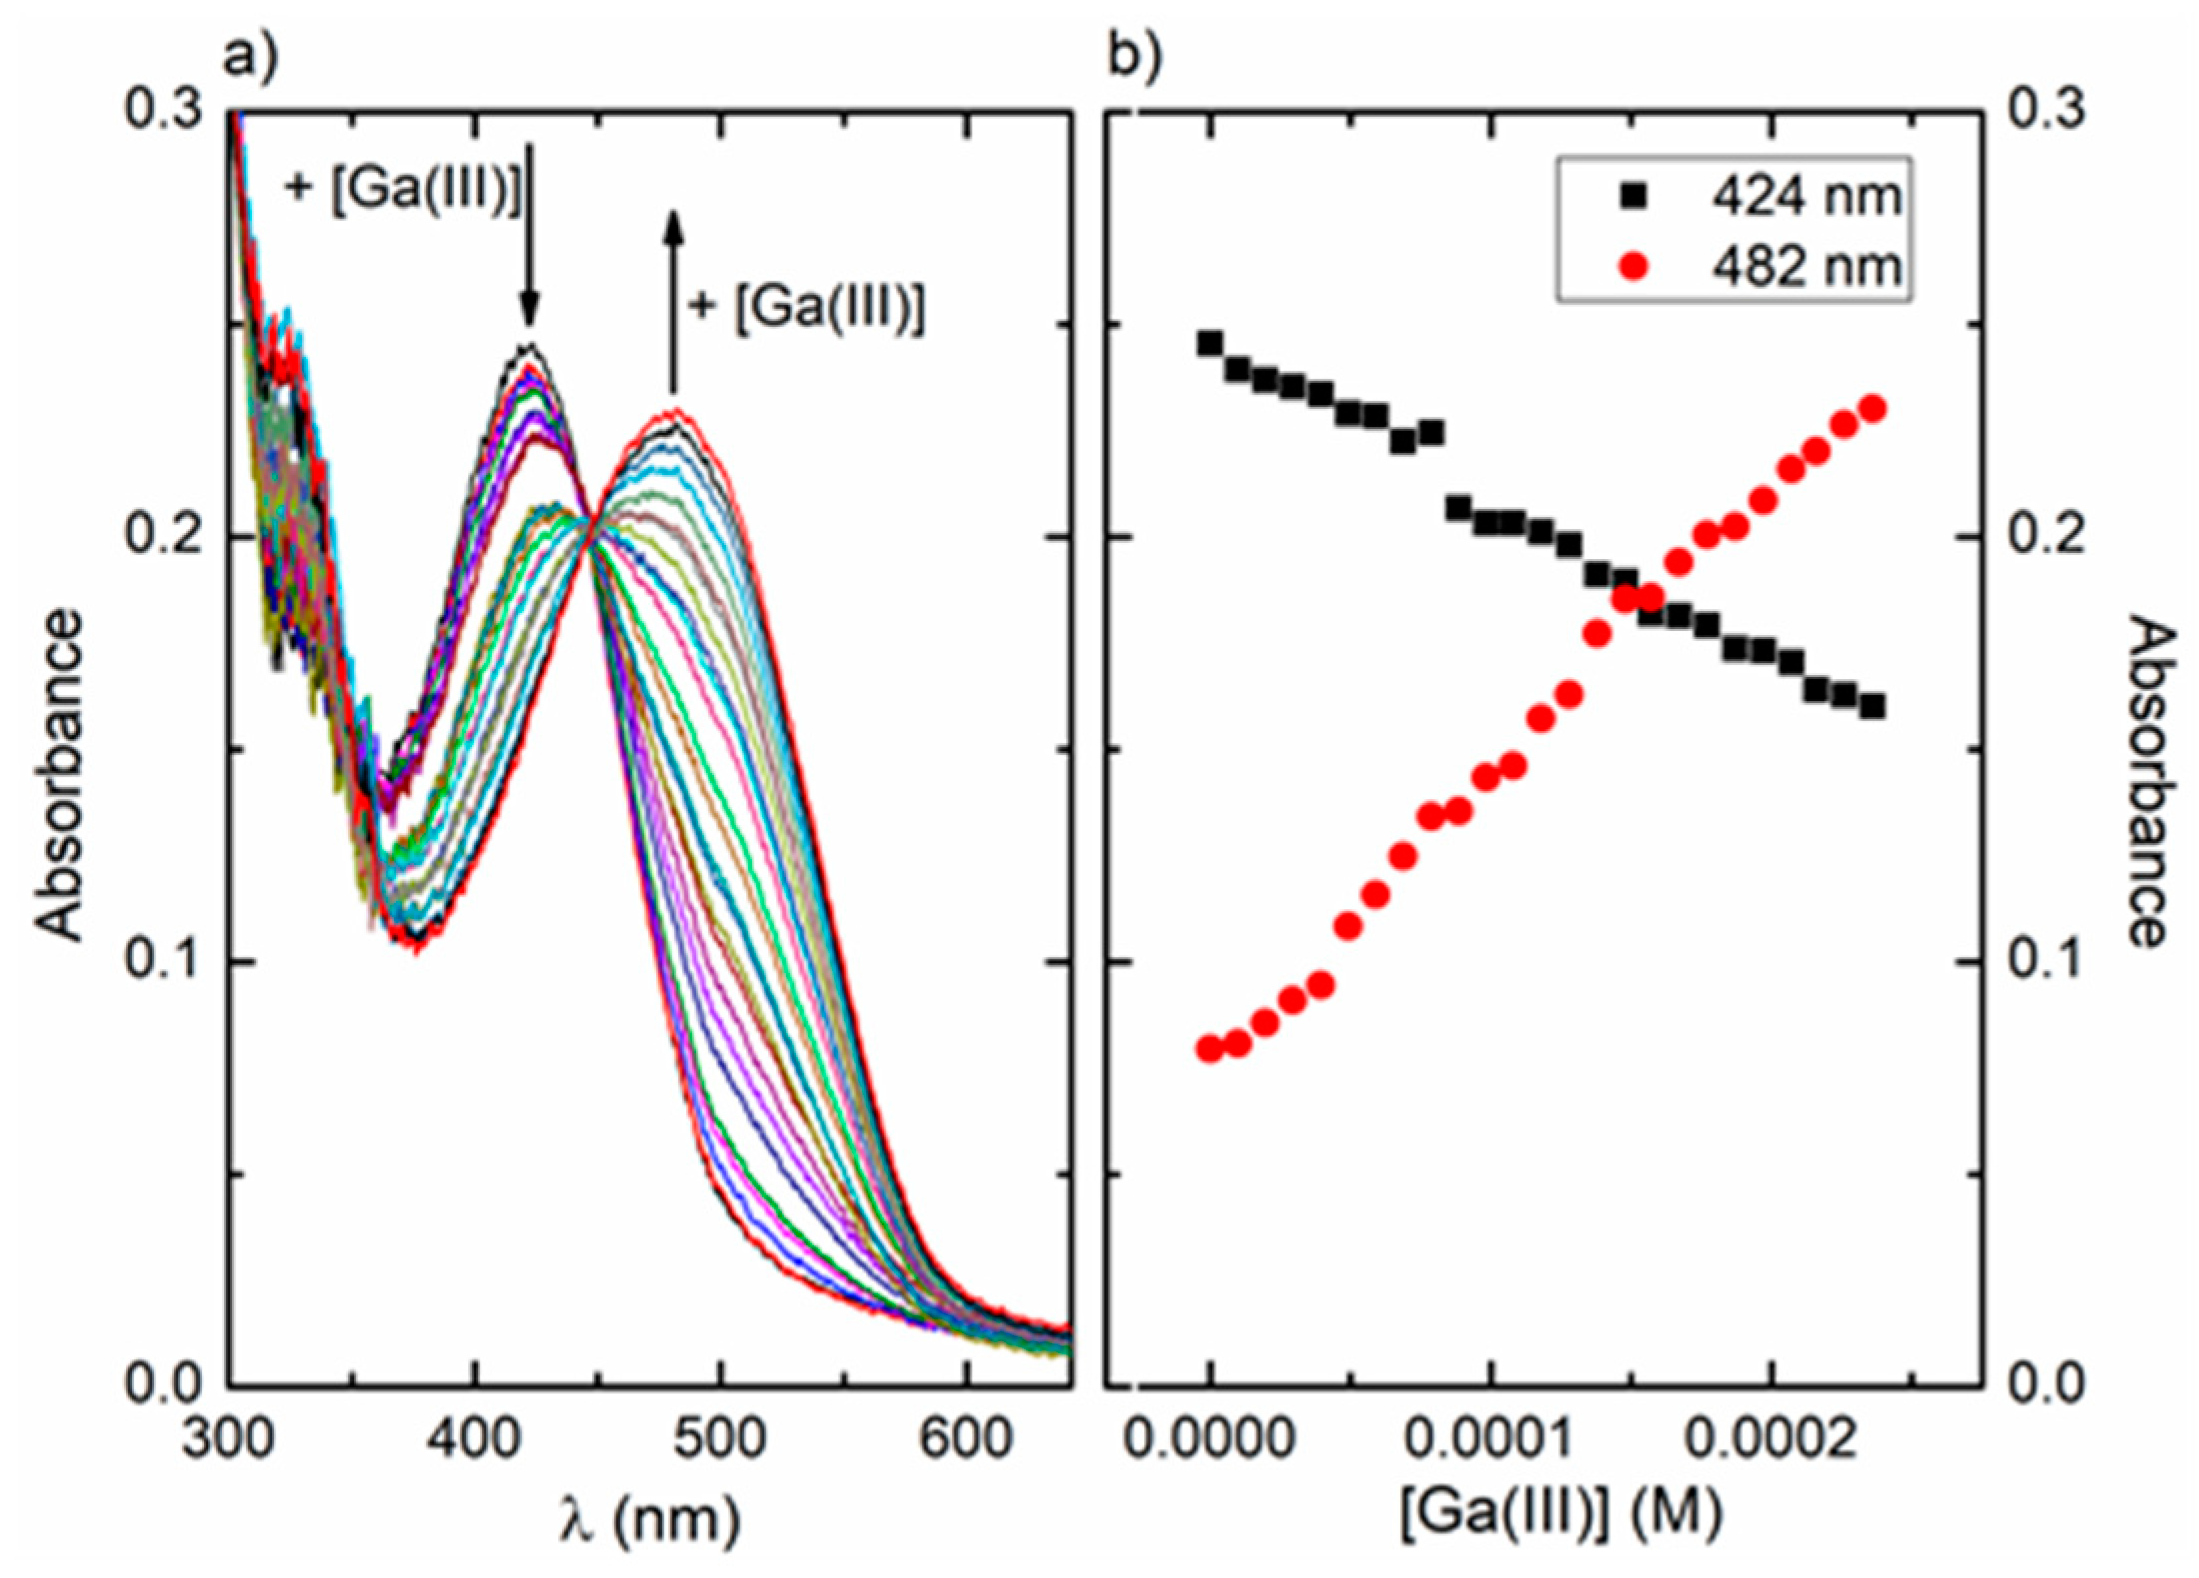
An early spectrophotometric study of the Ga(III)/ARS system in water [27] has suggested the formation of a 1:2 complex between the metal and ARS, with λmax at 490 nm, for pH values between 3 and 5. In the present work, UV-vis absorption spectra were obtained for a solution of ARS in water:methanol (1:1, v/v) at pH 4, with increasing concentrations of Ga(III) (Figure 10a). The absorption spectrum of ARS at pH 4 showed a maximum in the visible region at 424 nm. With the addition of Ga(III), a decrease in the intensity of the 424 nm band and the appearance of a new band with maximum at 482 nm were observed (Figure 10b), suggesting the formation of one or more Ga(III)/ARS complexes. The red shift observed upon complexation is probably due to the decrease of the frontier orbitals energy gap involved in the ligand-based transition (this will be analysed in detail in the following section based on TD-DFT calculations). A relatively well-defined isosbestic point can be identified at 447 nm, suggesting that under the conditions of our study, there is a dominant complex in equilibrium with the remaining species and the free ligand. Looking at the metal:ligand molar ratio range covered in our UV/vis study, the mer and fac complexes will be favoured at the beginning of the titration, when the ligand is in excess relatively to the metal; the 1:1 complex may be favoured at latter stages in conditions of excess of metal, and the dominant species will probably be the 1:2 complex, previously proposed to form in water [27].
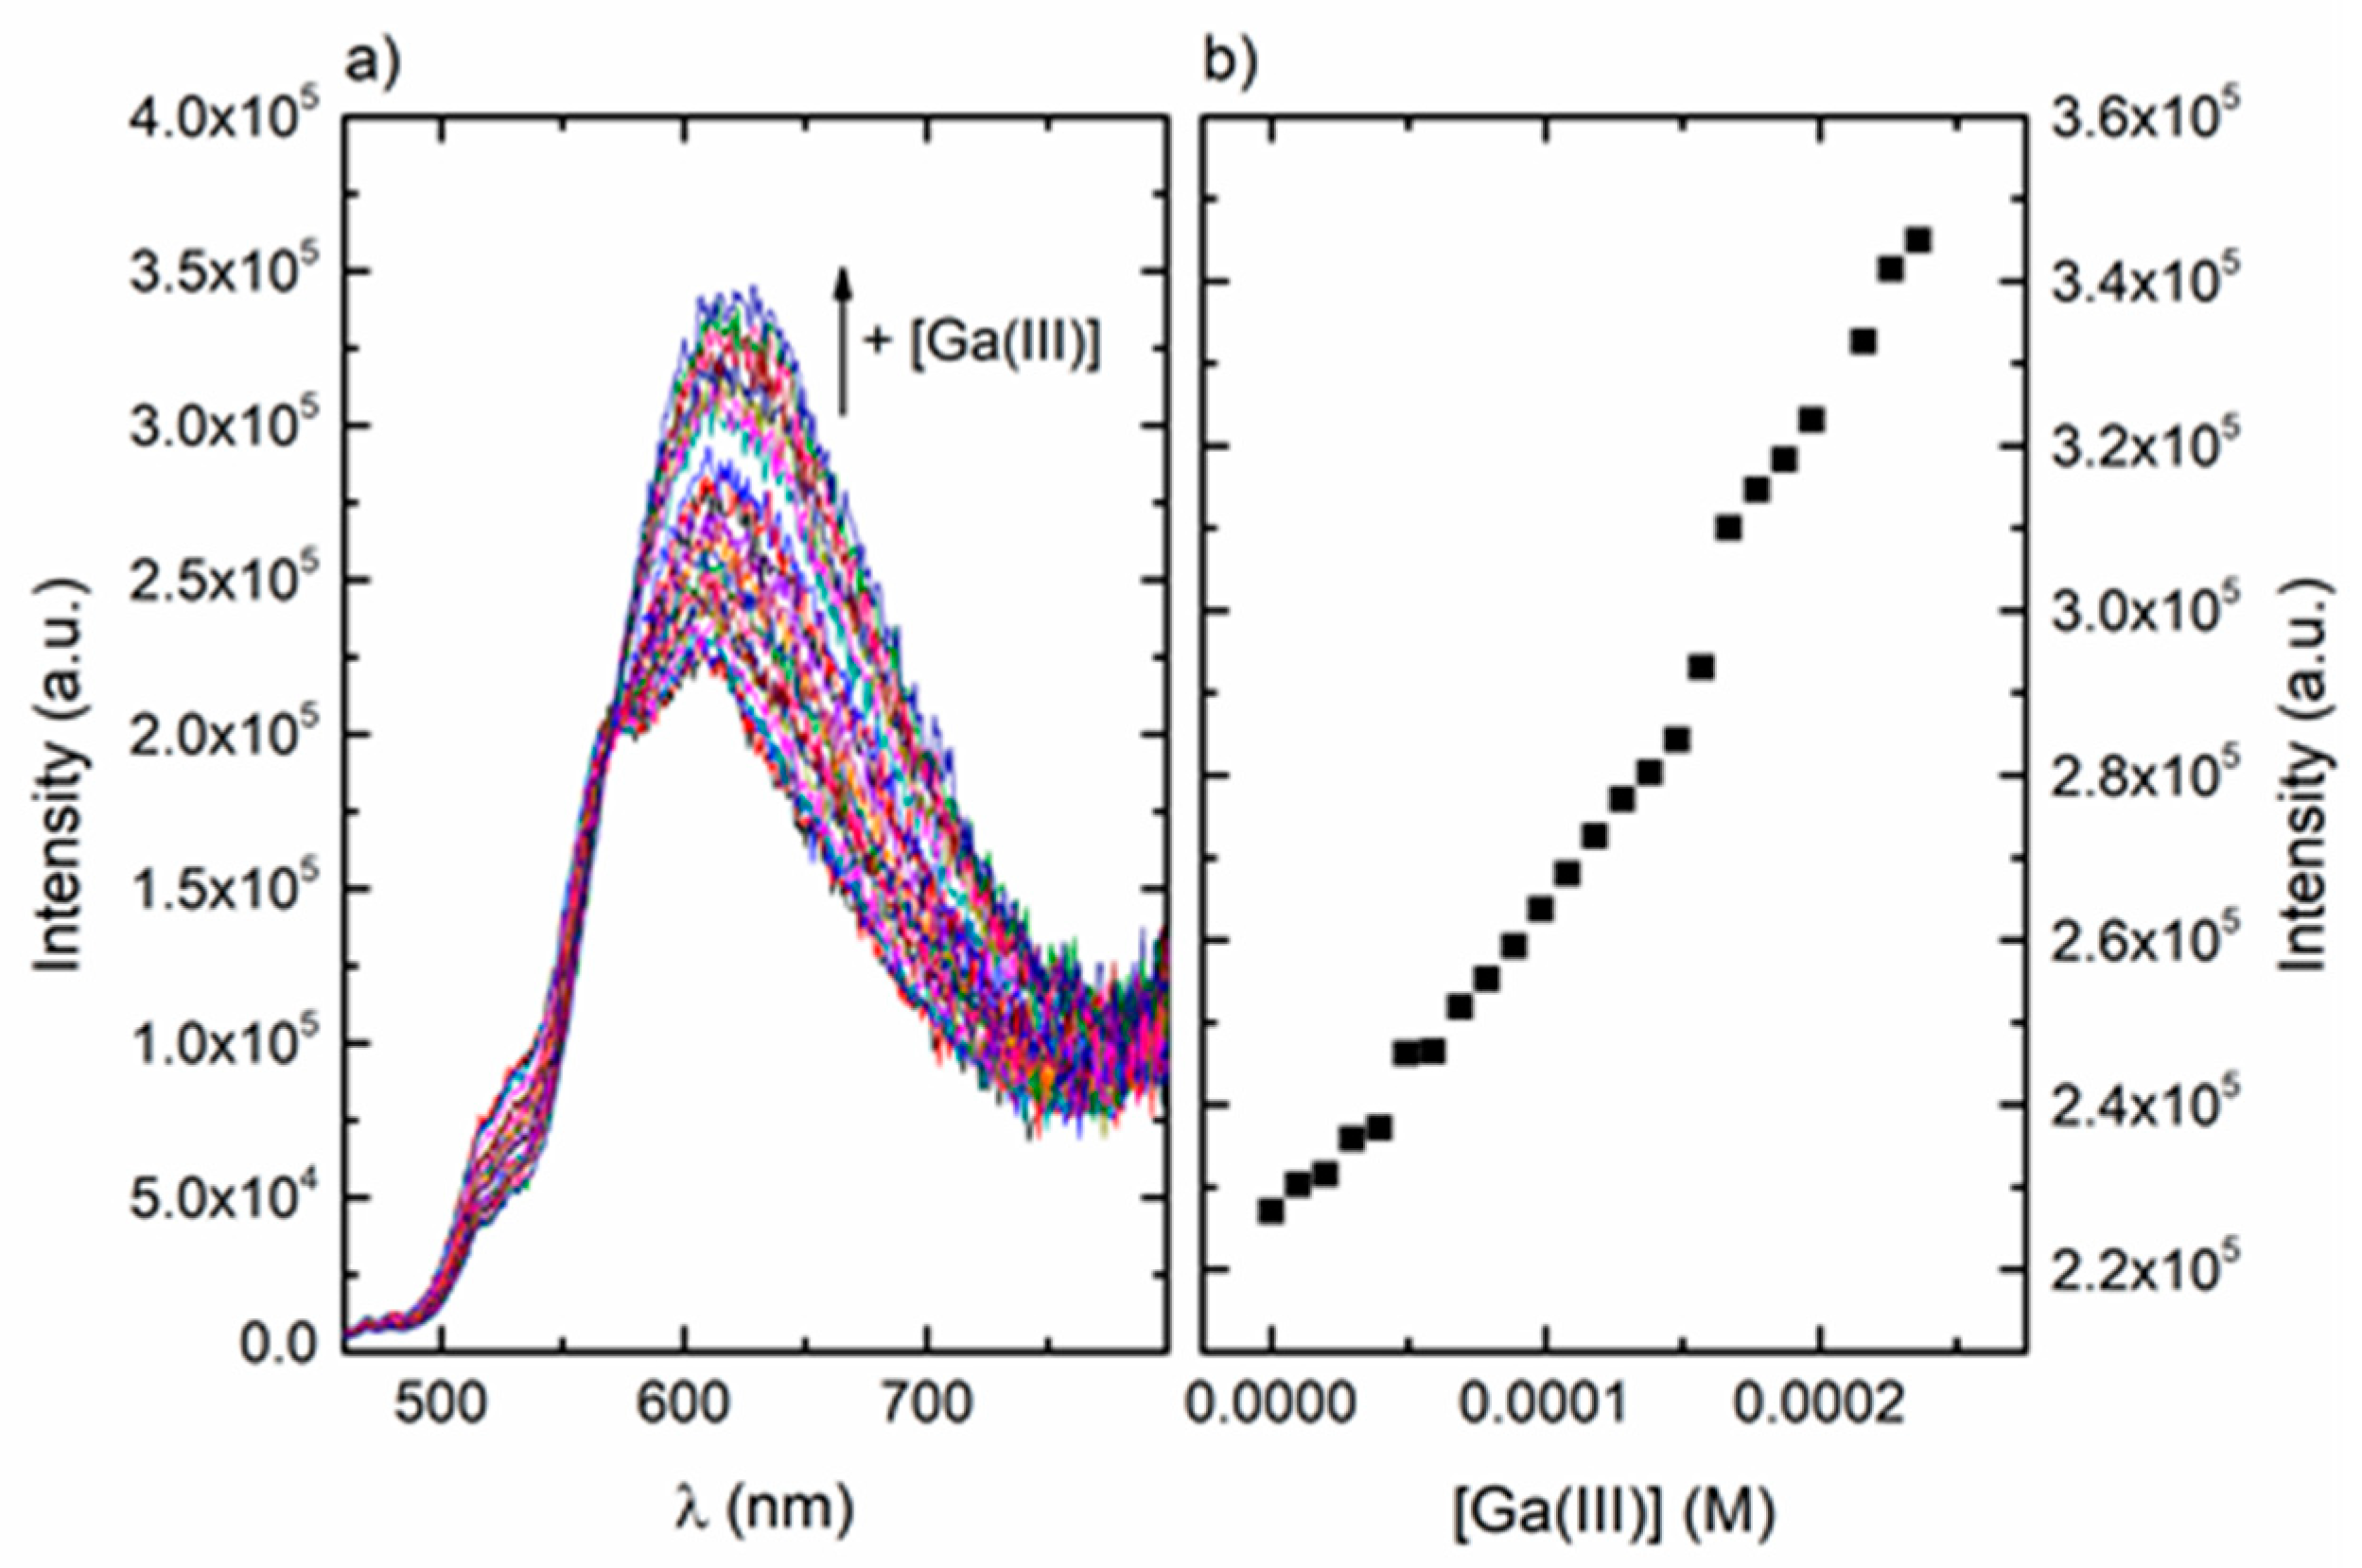
The fluorescence behaviour of ARS upon complexation with Ga(III) was studied with excitation at the absorption isosbestic point, 447 nm. Upon complexation with Ga(III), a decrease in the vibrational structure of the characteristic ARS emission band and an increase in the fluorescence at 625 nm were observed (Figure 11a). With the addition of an amount of Ga(III) as small as 9.84 × 10⁻⁶ mol/dm3, an increase of the fluorescence could already be observed (Figure 11b), indicating that ARS has high sensitivity for the detection of Ga(III) ions.
3.2.5. TD-DFT Studies on the Ga(III)/ARS System
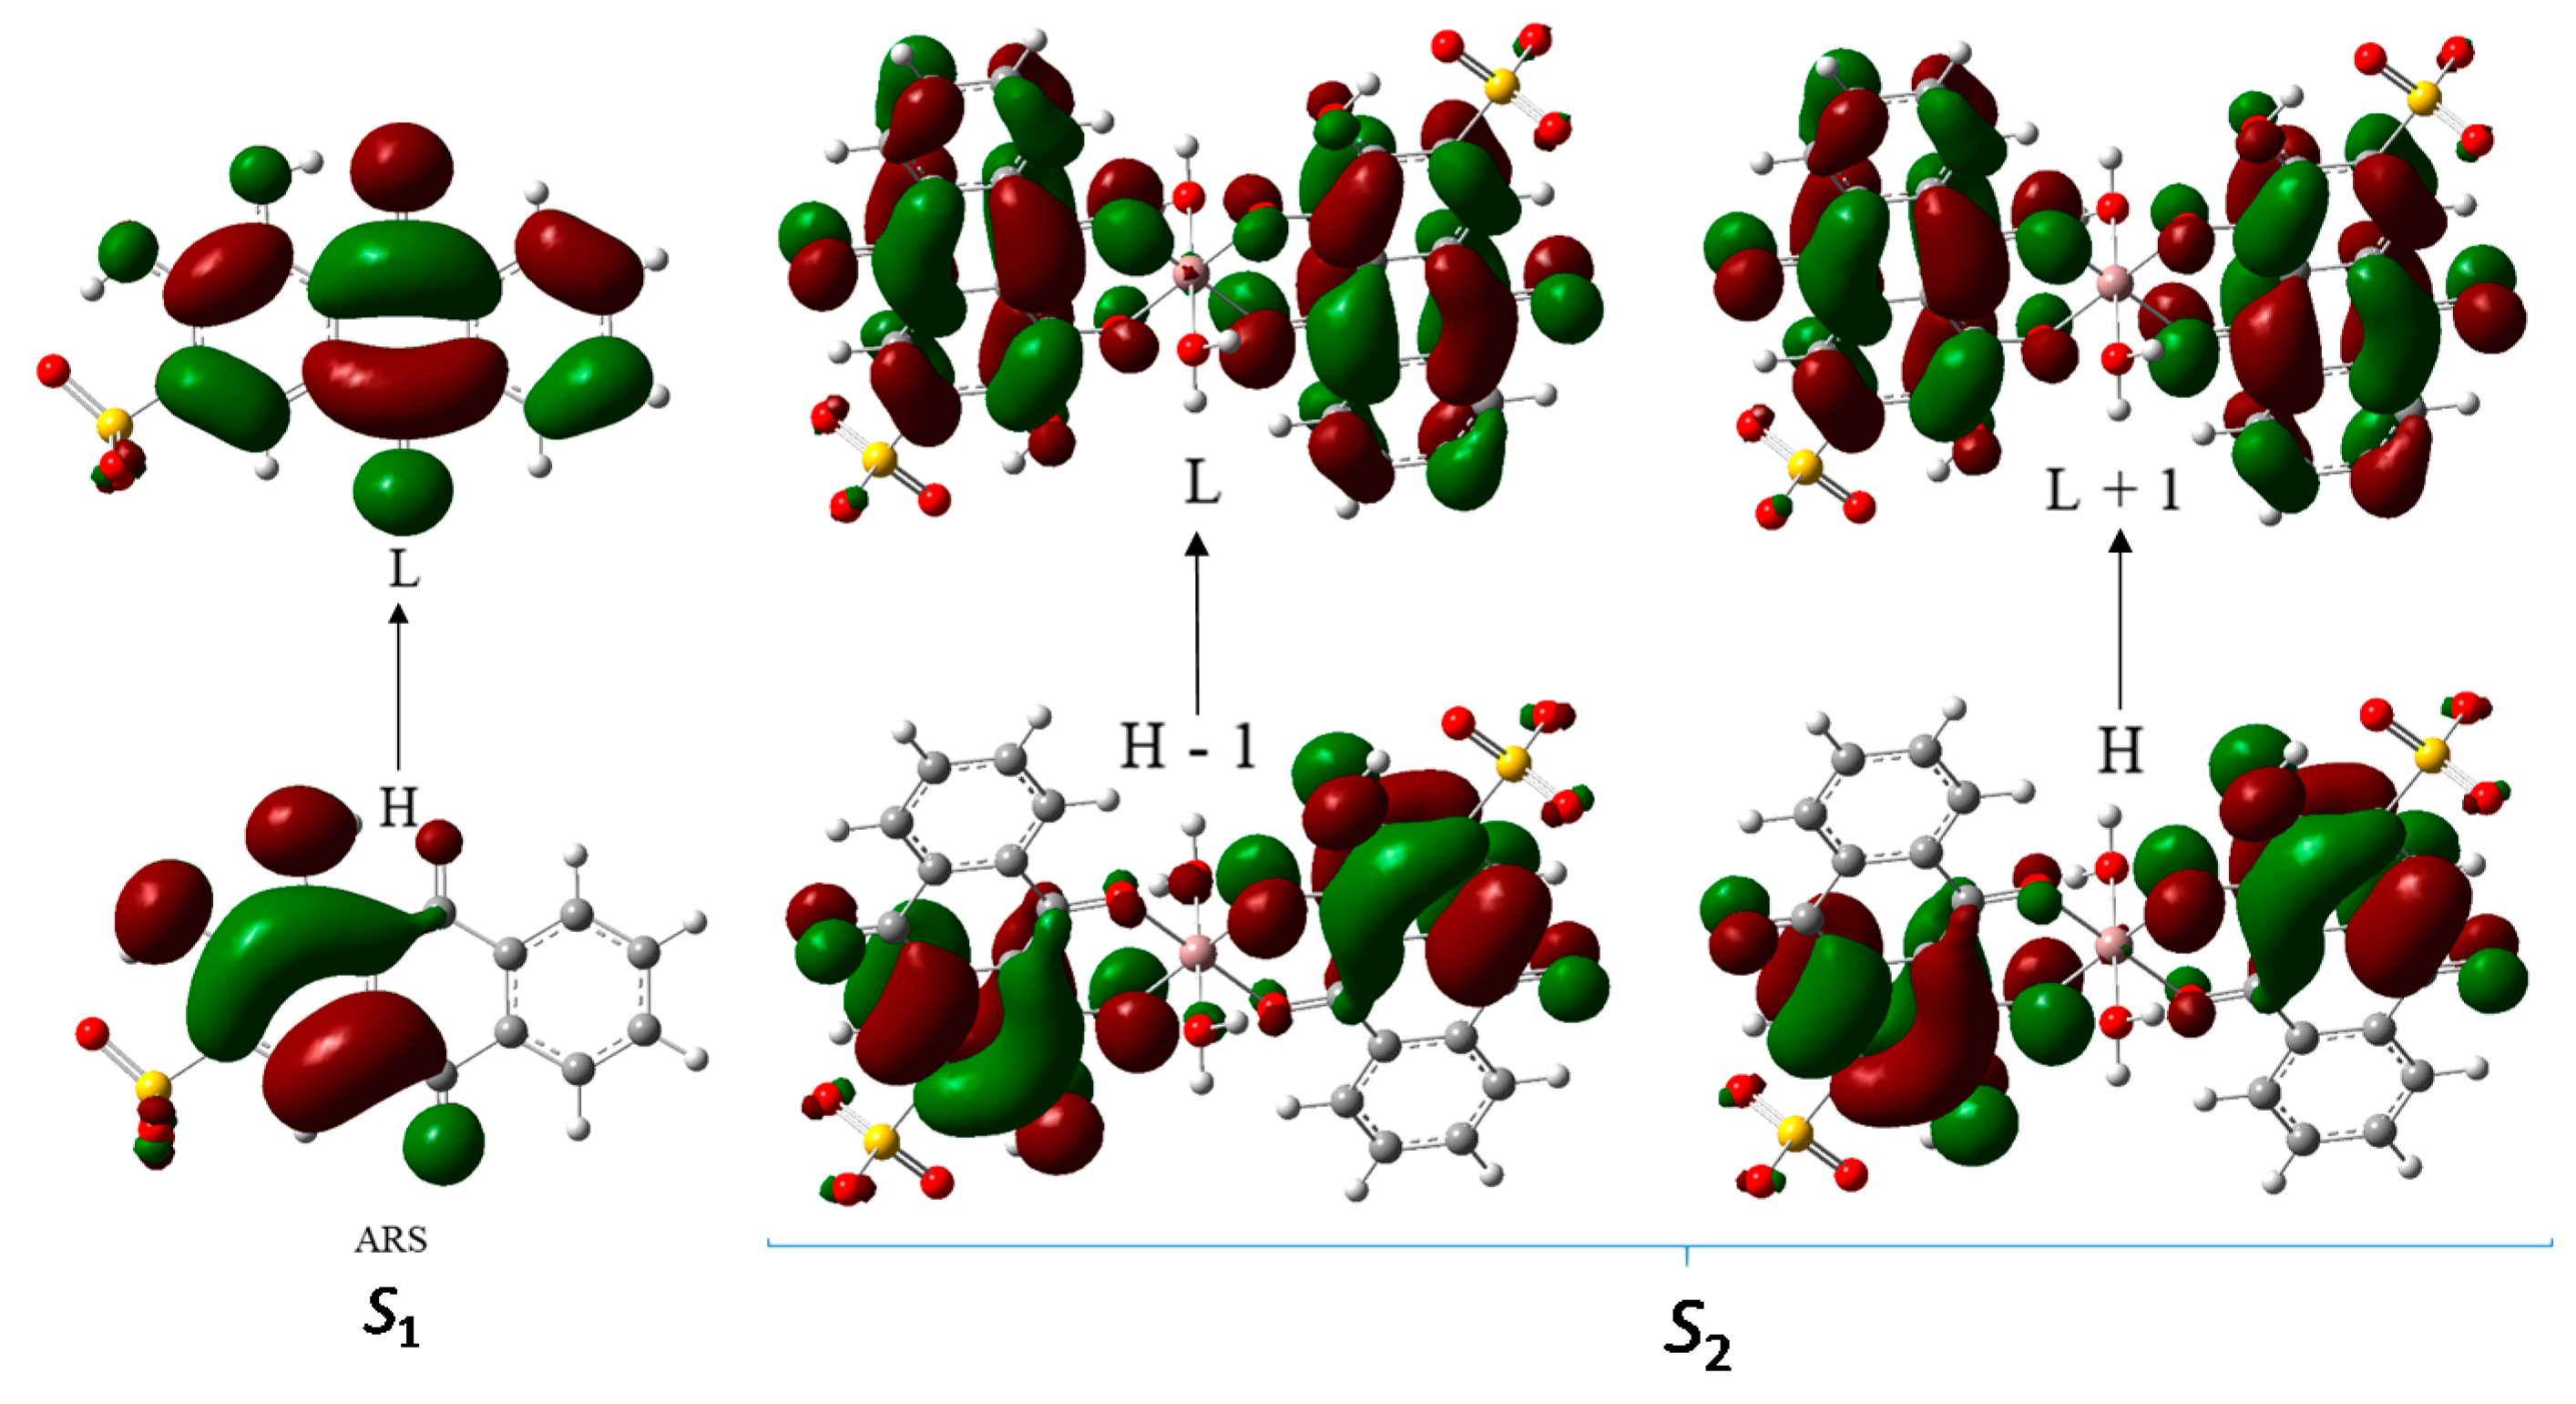
The UV-visible absorption and fluorescence results can be analysed using TD-DFT calculations, which can help understand the underlying mechanism leading to the observed increase in fluorescence upon complexation. Calculations have been carried out for ARS (conformer I) and for the structures a, b, c1, and c2 (Figure 5, Figure 6 and Figure 7) and will be discussed in detail for the free ligand and the 1:2 anti-hc complex. Table 4 presents the vertical excitation energies, oscillator strengths, wavelengths, and major contributions to the first excited state of the free ligand and to some of the lowest energy excited states of the complexes. The calculations predicted an absorption band at 377 nm for the ligand, which corresponds to the experimental band observed at 424 nm. This band is due to excitation from the highest occupied molecular orbital, HOMO (H), to the lowest unoccupied molecular orbital, LUMO (L), of the ligand and has π → π* character (Figure 12). On the other hand, the S1 excited state of the centrosymmetric 1:2 anti-hc complex involves parity-forbidden transitions (the H-1, L+1, H and L orbitals can be seen in Figure 12, in the description of the S2 excited state), and has an oscillator strength of zero. For this complex, an intense band was predicted at 426 nm (S2 excited state), which corresponds to the experimental band observed at 482 nm, and involves electronic excitation from the H and H-1 orbitals, with π character, to the L+1 and L orbitals, with π* character (Figure 12). These calculations predict a red shift of approximately 49 nm of the absorption maximum upon complexation, which is in good agreement with the experimental red shift of 58 nm observed when comparing the experimental absorption maxima for the ligand and complexes. It is also significant that the absorption maxima calculated for the 1:2 anti-hc and the fac and mer complexes have very similar values (a strong band at 426/427 nm, with a smaller contribution at 435/436 nm) indicating that it is possible that a mixture of these complexes in solution give rise to similar spectra in this region.
The π → π* character of the transitions involved in the S1 excited state of the 1:2 anti-hc complex (and in the 1:1 and 1:3 complexes) also reveals that the observed increase in fluorescence with complexation to the metal is possibly related, among other factors, with the decrease in non-radiative relaxation processes associated with the increased flexibility of the uncomplexed ligand.
4. Conclusions
A detailed study of the complexation between Ga(III) and alizarine red S was carried out using both spectroscopic and computational methods. The behaviour of the system was analysed at pH 4 in a water:methanol (1:1, v/v) solution for a variety of ligand:metal molar ratios, as well as in the solid state. This allowed to us to understand that, besides the previously 1:2 (metal:ligand) complex [27] reported for pH values between 3 and 5 in water, an additional 1:1 and two 1:3 complexes were formed in the conditions of our study. The structures of all the complexes were characterized in detail. The 1:1 complex was proposed to be a near-octahedral species with the formula [Ga(ARS)(H2O)4]+. The 1:2 complex is a centrosymmetric species with two magnetically equivalent ARS ligands in an anti relative arrangement. The two 1:3 complexes have, respectively, mer and fac configurations of the ligands around the metal centres. A 1,9 coordination mode between alizarine red S and Ga(III) was proposed for all the complexes. This conclusion obtains support from the different techniques used, namely from the NMR results, which showed significant effects on the intensity of the C-9 and C-1 carbon atoms and the C-1 hydroxyl proton; from the DFT calculations, which indicate that, irrespective of the stoichiometry, the structures with a 1,9 coordination mode were more stable than the analogous structures with a 1,2 coordination mode; and from the comparison of the infrared spectra calculated for the proposed structures with a 1,9 coordination mode with the experimental spectra with a good agreement between them. Our proposal is, however, in contrast with the previous tentative suggestion of a 1,2 coordination mode for the 1:2 Ga(III)/ARS complex in water [27]. Although our experimental studies have been carried out in water:methanol, the DFT relative energies calculated for the 1,2 and 1,9 structures in water (assuming a monoanionic ARS ligand in acidic medium) point to an increased stability of the Ga(III)/ARS complexes with a 1,9 coordination mode. Therefore, we believe this is the also most probable mode of coordination in these systems in water. Marked changes were observed in the UV/vis absorption spectra of ARS upon the addition of Ga(III), as well as in its fluorescence emission spectra, which shows a strong increase in the fluorescence intensity. These results support the use of ARS as a potential sensor for the detection of Ga(III).
Supplementary Materials
The following supporting information can be downloaded at: https://www.mdpi.com/article/10.3390/photochem3010005/s1, Figure S1: B3LYP/6-311++G(2d,2p)-optimized geometries of additional tautomers of ARS; Figure S2: ATR-FTIR spectra (1800–400 cm–1) of the solid powder samples obtained from the Ga(III):ARS 1:3, 1:2, and 1:1 molar ratio solutions; Figure S3: ATR-FTIR spectra (4000–400 cm–1) of the solid powder samples obtained from the Ga(III):ARS 1:3, 1:2, and 1:1 molar ratio solutions; Figure S4: ATR-FTIR spectra (4400–400 cm–1) of the solid powder samples of ARS and of the 1:3 Ga(III)/ARS sample compared with the B3LYP/6-311++G(d,p) calculated spectra for the same compounds; Figure S5: ATR-FTIR spectra (4400–400 cm–1) calculated at the B3LYP/6-311++G(d,p) level of theory for the 1:3 fac-hc, 1:2-hc, 1:1-hc, and 1:1-hh structures; Table S1: Experimental (D2O/CD3OD, pH* 3,96) and calculated (B3LYP/GIAO/6-311++G(d,p) level in water) 1H and 13C NMR chemical shifts (δ/ppm) for the free ligand ARS.
Author Contributions
Conceptualization, L.L.G.J. and M.L.R.; methodology, L.L.G.J. and M.L.R.; validation, L.L.G.J., S.B. and M.L.R.; formal analysis, L.L.G.J., S.B. and M.L.R.; investigation, L.L.G.J., S.B. and M.L.R.; resources, L.L.G.J. and M.L.R.; data curation, L.L.G.J., S.B. and M.L.R.; writing—original draft preparation, L.L.G.J., S.B. and M.L.R.; writing—review and editing, L.L.G.J. and M.L.R.; visualization, L.L.G.J., S.B. and M.L.R.; supervision, L.L.G.J. and M.L.R.; project administration, L.L.G.J. and M.L.R.; funding acquisition, L.L.G.J. and M.L.R. All authors have read and agreed to the published version of the manuscript.
Funding
The CQC-IMS is supported by Fundação para a Ciência e a Tecnologia (FCT) through projects UI0313B/QUI/2020, UI0313P/QUI/2020, and LA/P/0056/2020.
Acknowledgments
The authors thank the Laboratory for Advanced Computing at the University of Coimbra for providing computing resources that have contributed to the reported research results and the UC-NMR facility which is supported in part by FEDER through the COMPETE Programme and by National Funds from FCT through grants REEQ/481/QUI/2006, RECI/QEQ-QFI/0168/2012, CENTRO-07-CT62-FEDER-002012, and Rede Nacional de Ressonância Magnética Nuclear (RNRMN).
Conflicts of Interest
The authors declare no conflict of interest.
References
- Sato, T.; Imai, M. Characteristics of nitrogen-doped GaAsP light-emitting diodes. Jpn. J. Appl. Phys. 2002, 41, 5995–5998. [Google Scholar] [CrossRef]
- Borra, E.F.; Tremblay, G.; Huot, Y.; Gauvin, J. Gallium liquid mirrors: Basic technology, optical-shop tests and observations. Astron. Soc. Pac. 1997, 109, 319–325. [Google Scholar] [CrossRef]
- Chua, M.-S.; Bernstein, L.R.; Li, R.; So, S.K.S. Gallium maltolate is a promising chemotherapeutic agent for the treatment of hepatocellular carcinoma. Anticancer Res. 2006, 26, 1739–1744. [Google Scholar] [PubMed]
- Jakupec, M.A.; Galanski, M.; Arion, V.B.; Hartingerand, C.C.; Keppler, B.K. Antitumour metal compounds: More than theme and variations. Dalton Trans. 2008, 2, 183–194. [Google Scholar] [CrossRef]
- Baran, E.J. La nueva farmacoterapia inorgánica XIX. Compuestos de galio. Latin Am. J. Pharm. 2008, 27, 776–779. [Google Scholar]
- Chen, H.-W. Gallium, indium, and arsenic pollution of groundwater from a semiconductor manufacturing area of taiwan. Bull. Environ. Contam. Toxicol. 2006, 77, 289–296. [Google Scholar] [CrossRef]
- Powe, A.M.; Das, S.; Lowry, M.; El-Zahab, B.; Fakayode, S.O.; Geng, M.L.; Baker, G.A.; Wang, L.; McCarroll, M.E.; Patonay, G.; et al. Molecular fluorescence, phosphorescence, and chemiluminescence spectrometry. Anal. Chem. 2010, 82, 4865–4894. [Google Scholar] [CrossRef]
- Novotná, P.; Pacáková, V.; Bosáková, Z.; Štulík, K. High-performance liquid chromatographic determination of some anthraquinone and naphthoquinone dyes occurring in historical textiles. J. Chromatogr. A 1999, 863, 235–241. [Google Scholar] [CrossRef]
- Orska-Gawryś, J.; Surowiec, I.; Kehl, J.; Rejniak, H.; Urbaniak-Walczak, K.; Trojanowicz, M. Identification of natural dyes in archeological Coptic textiles by liquid chromatography with diode array detection. J. Chromatogr. A 2003, 989, 239–248. [Google Scholar] [CrossRef]
- Szostek, B.; Orska-Gawrys, J.; Surowiec, I.; Trojanowicz, M. Investigation of natural dyes occurring in historical Coptic textiles by high-performance liquid chromatography with UV–Vis and mass spectrometric detection. J. Chromatogr. A 2003, 1012, 179–192. [Google Scholar] [CrossRef]
- Alves, D.S.; Perez-Fons, L.; Estepa, A.; Micol, V. Membrane-related effects underlying the biological activity of the anthraquinones emodin and barbaloin. Biochem. Pharmacol. 2004, 68, 549–561. [Google Scholar] [CrossRef]
- Norton, S.A. Useful plants of dermatology. IV. Alizarin red and madder. J. Am. Acad. Dermatol. 1998, 39, 484–485. [Google Scholar] [CrossRef]
- Diaz, A.N. Analytical applications of 1,10-anthraquinones: A review. Talanta 1991, 38, 571–588. [Google Scholar] [CrossRef]
- Ghosh, A.; Jose, D.A.; Kaushik, R. Anthraquinones as versatile colorimetric reagent for anions. Sens. Actuators B Chem. 2016, 229, 545–560. [Google Scholar] [CrossRef]
- Diaz, A.N. Absorption and emission spectroscopy and photochemistry of 1,10-anthraquinone derivatives: A review. J. Photochem. Photobiol. A Chem. 1990, 53, 141–167. [Google Scholar] [CrossRef]
- Miliani, C.; Romani, A.; Favaro, G. Acidichromic effects in 1,2-di- and 1,2,4-trihydroxyanthraquinones. A spectrophotometric and Fuorimetric study. J. Phys. Org. Chem. 2000, 13, 141–150. [Google Scholar] [CrossRef]
- Duncan, W.R.; Prezhdo, O.V. Temperature independence of the photoinduced electron injection in dye-sensitized TiO2 rationalized by ab initio time-domain density functional theory. J. Am. Chem. Soc. 2008, 130, 9756–9762. [Google Scholar] [CrossRef]
- Kaniyankandy, S.; Verma, S.; Mondal, J.A.; Palit, D.K.; Ghosh, H.N. Evidence of multiple electron injection and slow back electron transfer in alizarin-sensitized ultrasmall TiO2 particles. J. Phys. Chem. C 2009, 113, 3593–3599. [Google Scholar] [CrossRef]
- Nawrocka, A.; Krawczyk, S. Electronic excited state of alizarin dye adsorbed on TiO2 nanoparticles: A study by electroabsorption (stark effect) spectroscopy. J. Phys. Chem. C 2008, 112, 10233–10241. [Google Scholar] [CrossRef]
- Lima, A.R.F.; Pereira, R.C.; Azevedo, J.; Mendes, A.; de Melo, J.S.S. On the path to aqueous organic redox flow batteries: Alizarin red S alkaline negolyte. Performance evaluation and photochemical studies. J. Mol. Liq. 2021, 336, 116364. [Google Scholar] [CrossRef]
- Safavi, A.; Abdollahi, H.; Mirzajani, R. Simultaneous spectrophotometric determination of Fe(III), Al(III) and Cu(II) by partial least-squares calibration method. Spectrochim. Acta Part A 2006, 63, 196–199. [Google Scholar] [CrossRef]
- Sathish, R.S.; Kumar, M.R.; Rao, G.N.; Kumar, K.A.; Janardhana, C. A water-soluble fluorescent fluoride ion probe based on Alizarin Red S–Al(III) complex. Spectrochim. Acta Part A 2007, 66, 457–461. [Google Scholar] [CrossRef] [PubMed]
- Wang, Y.; Xiong, L.; Geng, F.; Zhang, F.; Xu, M. Design of a dual-signaling sensing system for fluorescent ratiometric detection of Al3+ ion based on the inner-filter effect. Analyst 2011, 136, 4809. [Google Scholar] [CrossRef] [PubMed]
- Supian, S.M.; Ling, T.L.; Heng, L.Y.; Chong, K.F. Quantitative determination of Al(III) ion by using alizarin red S including its microspheres optical sensing Material. Anal. Methods 2013, 5, 2602–2609. [Google Scholar] [CrossRef]
- Epstein, M.; Yariv, S. Visible-spectroscopy study of the adsorption of alizarinate by Al-montmorillonite in aqueous suspensions and in solid state. J. Colloid Interface Sci. 2003, 263, 377–385. [Google Scholar] [CrossRef]
- Biver, T.; Kraiem, M.; Secco, F.; Venturini, M. On the mechanism of indium(III) complex formation with metallochromic indicators. Polyhedron 2018, 156, 6–13. [Google Scholar] [CrossRef]
- Dwivedi, C.D.; Munshi, K.N.; Dey, A.K. Chelate formation of trivalent gallium with 1,2-dihydroxy-3-anthraquinone sulfonic acid. Microchem. J. 1965, 9, 218–226. [Google Scholar] [CrossRef]
- Becke, A.D. Density-functional exchange-energy approximation with correct asymptotic behavior. Phys. Rev. A 1988, 38, 3098–3100. [Google Scholar] [CrossRef]
- Becke, A.D. Density-functional thermochemistry. III. The role of exact exchange. Chem. Phys. 1993, 98, 5648–5652. [Google Scholar] [CrossRef] [Green Version]
- Lee, C.T.; Yang, W.; Parr, R.G. Development of the Colle-Salvetti correlation-energy formula into a functional of the electron density. Phys. Rev. B 1988, 37, 785–789. [Google Scholar] [CrossRef] [Green Version]
- Vosko, S.H.; Wilk, L.; Nusair, M. Accurate spin-dependent electron liquid correlation energies for local spin density calculations: A critical analysis. Can. J. Phys. 1980, 58, 1200–1211. [Google Scholar] [CrossRef]
- Perdew, J.P. Electronic Structure of Solids ’91; Ziesche, P., Eschrig, H., Eds.; Akademie Verlag: Berlin, Germany, 1991; Volume 11. [Google Scholar]
- Perdew, J.P.; Chevary, J.A.; Vosko, S.H.; Jackson, K.A.; Pederson, M.R.; Singh, D.J.; Fiolhais, C. Atoms, molecules, solids, and surfaces: Applications of the generalized gradient approximation for exchange and correlation. Phys. Rev. B 1992, 46, 6671–6687. [Google Scholar] [CrossRef]
- Perdew, J.P.; Chevary, J.A.; Vosko, S.H.; Jackson, K.A.; Pederson, M.R.; Singh, D.J.; Fiolhais, C. Erratum: Atoms, molecules, solids, and surfaces–Applications of the generalized gradient approximation for exchange and correlation. Phys. Rev. B 1993, 48, 4978. [Google Scholar] [CrossRef]
- Perdew, J.P.; Burke, K.; Wang, Y. Generalized gradient approximation for the exchange-correlation hole of a many-electron system. Phys. Rev. B 1996, 54, 16533–16539. [Google Scholar] [CrossRef] [Green Version]
- Burke, K.; Perdew, J.P.; Wang, Y. Derivation of a Generalized Gradient Approximation: The PW91 Density Functional. In Electronic Density Functional Theory: Recent Progress and New Directions; Dobson, J.F., Vignale, G., Das, M.P., Eds.; Plenum Press: New York, NY, USA, 1998; pp. 81–111. [Google Scholar]
- Yanai, T.; Tew, D.P.; Handy, N.C. A new hybrid exchange–correlation functional using the Coulomb-attenuating method (CAM-B3LYP). Chem. Phys. Lett. 2004, 393, 51–57. [Google Scholar] [CrossRef] [Green Version]
- Chai, J.-D.; Head-Gordon, M. Long-range corrected hybrid density functionals with damped atom–atom dispersion corrections. Phys. Chem. Chem. Phys. 2008, 10, 6615–6620. [Google Scholar] [CrossRef] [Green Version]
- Miertus, S.; Scrocco, E.; Tomasi, J. Electrostatic interaction of a solute with a continuum. A direct utilization of ab initio molecular potentials for the prevision of solvent effects. J. Chem. Phys. 1981, 55, 117–129. [Google Scholar]
- Tomasi, J.; Mennucci, B.; Cammi, R. Quantum mechanical continuum solvation models. Chem. Rev. 2005, 105, 2999–3093. [Google Scholar] [CrossRef]
- Justino, L.L.G.; Reva, I.; Fausto, R. Thermally and vibrationally induced conformational isomerizations, infrared spectra, and photochemistry of gallic acid in low-temperature matrices. J. Chem. Phys. 2016, 145, 014304. [Google Scholar] [CrossRef] [Green Version]
- Jaquemin, D.; Perpète, E.A.; Scuseria, G.E.; Ciofini, I.; Adamo, C. TD-DFT Performance for the Visible Absorption Spectra of Organic Dyes: Conventional versus Long-Range Hybrids. J. Chem. Theory Comput. 2008, 4, 123–135. [Google Scholar] [CrossRef]
- Frisch, M.J.; Trucks, G.; Schlegel, H.B.; Scuseria, G.E.; Robb, M.A.; Cheeseman, J.R.; Scalmani, G.; Barone, V.; Petersson, G.; Nakatsuji, H.; et al. Gaussian 16, Revision B.01; Gaussian, Inc.: Wallingford, CT, USA, 2016.
- Shalaby, A.A.; Mohamed, A.A. Determination of acid dissociation constants of alizarin red S, methyl orange, bromothymol blue and bromophenol blue using a digital camera. RSC Adv. 2020, 10, 11311–11316. [Google Scholar] [CrossRef] [PubMed] [Green Version]
- Fehér, P.P.; Purgel, M.; Joó, F. Performance of exchange–correlation functionals on describing ground state geometries and excitations of alizarin red S: Effect of complexation and degree of deprotonation. Comput. Theor. Chem. 2014, 1045, 113–122. [Google Scholar] [CrossRef]
- Ramos, M.L.; Justino, L.L.G.; Salvador, A.I.N.; de Sousa, A.R.E.; Abreu, P.E.; Fonseca, S.M.; Burrows, H.D. NMR, DFT and luminescence studies of the complexation of Al(III) with 8-hydroxyquinoline-5-sulfonate. Dalton Trans. 2012, 41, 12478–12489. [Google Scholar] [CrossRef] [PubMed]
- Ramos, M.L.; Justino, L.L.G.; de Sousa, A.R.E.; Fonseca, S.M.; Geraldes, C.F.G.C.; Burrows, H.D. Structural and photophysical studies on gallium(III) 8-hydroxyquinoline-5-sulfonates. Does excited state decay involve ligand photolabilisation? Dalton Trans. 2013, 42, 3682–3694. [Google Scholar] [CrossRef] [PubMed]
- Ramos, M.L.; Justino, L.L.G.; Fonseca, S.M.; Burrows, H.D. NMR, DFT and luminescence studies of the complexation of V(V) oxoions in solution with 8-hydroxyquinoline-5-sulfonate. New J. Chem. 2015, 39, 1488–1497. [Google Scholar] [CrossRef]
- Ramos, M.L.; Justino, L.L.G.; Abreu, P.E.; Fonseca, S.M.; Burrows, H.D. Oxocomplexes of Mo(VI) and W(VI) with 8-hydroxyquinoline-5-sulfonate in solution: Structural studies and the effect of the metal ion on the photophysical behavior. Dalton Trans. 2015, 44, 19076–19089. [Google Scholar] [CrossRef]
- Caldeira, M.M.; Ramos, M.L.; Cavaleiro, A.M.; Gil, V.M.S. Multinuclear NMR study of vanadium(V) complexation with tartaric and citric acids. J. Mol. Struct. 1988, 174, 461–466. [Google Scholar] [CrossRef]
- Ramos, M.L.; Caldeira, M.M.; Gil, V.M.S. NMR study of the complexation of D-galactonic acid with tungsten(VI) and molybdenum(VI). Carbohydr. Res. 1997, 297, 191–200. [Google Scholar] [CrossRef]
- Ramos, M.L.; Caldeira, M.M.; Gil, V.M.S. Multinuclear NMR study of complexation of D-galactaric and D-mannaric acids with tungsten(VI) oxoions. J. Coord. Chem. 1994, 33, 319–329. [Google Scholar] [CrossRef]
- Ramos, M.L.; Caldeira, M.M.; Gil, V.M.S. NMR spectroscopy study of the complexation of L-mannonic acid with tungsten(VI) and molybdenum(VI). Carbohydr. Res. 1997, 299, 209–220. [Google Scholar] [CrossRef]
- Ramos, M.L.; Caldeira, M.M.; Gil, V.M.S. NMR spectroscopy study of the complexation of D-gluconic acid with tungsten(VI) and molybdenum(VI). Carbohydr. Res. 1997, 304, 97–109. [Google Scholar] [CrossRef]
- Ramos, M.L.; Pereira, M.M.; Beja, A.M.; Silva, M.R.; Paixão, J.A.; Gil, V.M.S. NMR and X-ray diffraction studies of the complexation of D-(–)quinic acid with tungsten(VI) and molybdenum(VI). J. Chem. Soc. Dalton Trans. 2002, 10, 2126–2131. [Google Scholar] [CrossRef]
- Ramos, M.L.; Caldeira, M.M.; Gil, V.M.S. Multinuclear NMR study of the complexation of D-glucaric acid with molybdenum(VI) and tungsten(VI). Inorg. Chim. Acta 1991, 180, 219–224. [Google Scholar] [CrossRef]
- Justino, L.L.G.; Ramos, M.L.; Kaupp, M.; Burrows, H.D.; Fiolhais, C.; Gil, V.M.S. Density functional theory study of the oxoperoxo vanadium(V) complexes of glycolic acid. Structural correlations with NMR chemical shifts. Dalton Trans. 2009, 44, 9735–9745. [Google Scholar] [CrossRef] [Green Version]
- Justino, L.L.G.; Ramos, M.L.; Nogueira, F.; Sobral, A.J.F.N.; Geraldes, C.F.G.C.; Kaupp, M.; Burrows, H.D.; Fiolhais, C.; Gil, V.M.S. Oxoperoxo vanadium(V) complexes of L-lactic acid: Density functional theory study of structure and NMR chemical shifts. Inorg. Chem. 2008, 47, 7317–7326. [Google Scholar] [CrossRef] [Green Version]
- Bernstein, L.R.; Tanner, T.; Godfrey, C.; Noll, B. Chemistry and pharmacokinetics of gallium maltolate, a compound with high oral gallium bioavailability. Met.-Based Drugs 2000, 7, 33–47. [Google Scholar] [CrossRef] [Green Version]
- Enyedy, É.A.; Dömötör, O.; Varga, E.; Kiss, T.; Trondl, R.; Hartinger, C.G.; Keppler, B.K. Comparative solution equilibrium studies of anticancer gallium(III) complexes of 8-hydroxyquinoline and hydroxy(thio)pyrone ligands. J. Inorg. Biochem. 2012, 117, 189–197. [Google Scholar] [CrossRef] [Green Version]
- Lima, C.F.R.A.C.; Taveira, R.J.S.; Costa, J.C.S.; Fernandes, A.M.; Melo, A.; Silva, A.M.S.; Santos, L.M.N.B.F. Understanding M–ligand bonding and mer-/fac isomerism in tris(8-hydroxyquinolinate) metallic complexes. Phys. Chem. Chem. Phys. 2016, 18, 16555–16565. [Google Scholar] [CrossRef] [Green Version]
- Costa, J.C.S.; Lima, C.F.R.A.C.; Santos, L.M.N.B.F. Electron transport materials for organic light-emitting diodes: Understanding the crystal and molecular stability of the tris(8-hydroxyquinolines) of Al, Ga, and In. J. Phys. Chem. C 2014, 118, 21762–21769. [Google Scholar] [CrossRef]
Scheme 1.
Monoanionic form of alizarin sulfonate (ARS) and numbering scheme used in the discussion of results.
Scheme 1.
Monoanionic form of alizarin sulfonate (ARS) and numbering scheme used in the discussion of results.

Figure 1.
DFT/B3LYP/6-311++G(2d,2p) optimized geometries of the most stable conformers and tautomers of the monoanionic structure of ARS, considering the bulk effects of the water solvent.
Figure 1.
DFT/B3LYP/6-311++G(2d,2p) optimized geometries of the most stable conformers and tautomers of the monoanionic structure of ARS, considering the bulk effects of the water solvent.

Figure 2.
1H NMR spectra of the solutions (50% D2O/50% CD3OD) of (a) ARS 5 mmol dm−3, pH* = 3.96, temp. 298.15 K; (b) Ga/ARS 5:5 mmol dm−3, pH* = 3.95, temp. 280.15 K; (c) Ga/ARS 5:5 mmol dm−3, pH* = 3.95, temp. 298.15 K; (d) Ga/ARS 2.5:5 mmol dm−3, pH* = 4.06, temp. 280.15 K; (e) Ga/ARS 2.5:5 mmol dm−3, pH* = 4.06, temp. 298.15 K; (f) Ga/ARS 1.67:5.0 mmol dm−3, pH* = 3.94, temp. 280.15 K; (g) Ga/ARS 1.67:5.0 mmol dm−3, pH* = 3.94, temp. 298.15 K.

Figure 3.
13C NMR spectra of the solutions (50% D2O e 50% CD3OD) of (a) ARS 5 mmol dm−3, pH* = 3.96; (b) Ga/ARS 5:5 mmol dm−3, pH* = 3.95, temp. 298.15 K.
Figure 3.
13C NMR spectra of the solutions (50% D2O e 50% CD3OD) of (a) ARS 5 mmol dm−3, pH* = 3.96; (b) Ga/ARS 5:5 mmol dm−3, pH* = 3.95, temp. 298.15 K.

Figure 4.
1H NMR spectra of the solutions of (a) ARS 5 mmol dm−3, pH* = 3.96; (b) Ga/ARS 5:5 mmol dm−3 in DMSO, temp. 298.15 K.
Figure 4.
1H NMR spectra of the solutions of (a) ARS 5 mmol dm−3, pH* = 3.96; (b) Ga/ARS 5:5 mmol dm−3 in DMSO, temp. 298.15 K.

Figure 5.
[Ga(ARS)(H2O)4]+ isomeric structures considered to determine the structure of the 1:1 Ga(III)/ARS complex (optimized at the B3LYP/6-311G(d,p) in water).
Figure 5.
[Ga(ARS)(H2O)4]+ isomeric structures considered to determine the structure of the 1:1 Ga(III)/ARS complex (optimized at the B3LYP/6-311G(d,p) in water).

Figure 6.
[Ga(ARS)2(H2O)2]− isomeric structures considered to determine the structure of the 1:2 Ga(III)/ARS complex (optimized at the B3LYP/6-311G(d,p) in water).
Figure 6.
[Ga(ARS)2(H2O)2]− isomeric structures considered to determine the structure of the 1:2 Ga(III)/ARS complex (optimized at the B3LYP/6-311G(d,p) in water).

Figure 7.
[Ga(ARS)3]3− isomeric structures considered to determine the structure of the 1:3 Ga(III)/ARS complexes (optimized at the B3LYP/6-311G(d,p) in water).
Figure 7.
[Ga(ARS)3]3− isomeric structures considered to determine the structure of the 1:3 Ga(III)/ARS complexes (optimized at the B3LYP/6-311G(d,p) in water).

Figure 8.
ATR-FTIR spectra (1800–400 cm–1) of solid Ga(NO3)3 (bottom), solid ARS (middle), and the solid sample obtained from a 2.5:5 mmol dm−3 Ga(III):ARS solution at pH = 4 (top); (*solid obtained after evaporation of the solvents from the Ga(III):ARS sample).
Figure 8.
ATR-FTIR spectra (1800–400 cm–1) of solid Ga(NO3)3 (bottom), solid ARS (middle), and the solid sample obtained from a 2.5:5 mmol dm−3 Ga(III):ARS solution at pH = 4 (top); (*solid obtained after evaporation of the solvents from the Ga(III):ARS sample).

Figure 9.
ATR-FTIR spectra (1800–400 cm–1) of the solid powder samples of ARS and of the 1:3 Ga(III)/ARS sample (bottom and top spectra, respectively), compared with the B3LYP/6-311++G(d,p) calculated spectra for conformer I of ARS (middle bottom) and for the 1:3 mer structure (middle top). The calculated spectra were simulated using Lorentzian functions with a full-width-at-half-maximum (FWHM) of 6 cm−1, centred at the scaled calculated frequencies.

Figure 10.
(a) Absorption spectra of ARS (4.67 × 10⁻⁵ mol/dm3) in H2O:CH3OH 1:1 (v/v) in the presence of increasing concentrations of Ga(III) (0–2.36 × 10⁻⁴ mol/dm3; steps of 9.84 × 10⁻⁶ mol/dm3) at pH 4; (b) absorbance intensity at 424 nm (black squares) and 482 nm (red circles) as a function of Ga(III) concentration at pH 4.

Figure 11.
(a) Fluorescence emission spectra of ARS (4.67 × 10⁻⁵ mol/dm3) in H2O:CH3OH 1:1 (v/v) at pH 4, collected with λexc = 447 nm in the presence of increasing concentrations of Ga(III) (0–2.36 × 10⁻⁴ mol/dm3; steps of 9.84 × 10⁻⁶ mol/dm3); (b) fluorescence intensity at 625 nm as a function of Ga(III) concentration at pH 4.

Figure 12.
Dominant contributions to the S1 excited state of the ligand (experimental band observed at 424 nm) and the S2 excited state of the 1:2 anti-hc complex (experimental band observed at 482 nm) (TD-DFT CAM-B3LYP/6-311++G(d,p), IEFPCM, H2O).
Figure 12.
Dominant contributions to the S1 excited state of the ligand (experimental band observed at 424 nm) and the S2 excited state of the 1:2 anti-hc complex (experimental band observed at 482 nm) (TD-DFT CAM-B3LYP/6-311++G(d,p), IEFPCM, H2O).


Table 1.
Relative electronic energies (ΔEel) (kJ mol−1), zero-point-corrected electronic energies (ΔETotal), Gibbs energies at 298.15 K (ΔG298K), and equilibrium populations (%) estimated from the relative Gibbs energies (P298), calculated for the lowest energies conformers and tautomers of the monoanionic structure of ARS (B3LYP/6-311++G(2d,2p), considering the bulk effects of the H2O solvent.
| Structure | I | II | III | IV | V | VI |
|---|---|---|---|---|---|---|
| Symmetry | C1 | C1 | Cs | C1 | Cs | Cs |
| ΔEel | 0.0 | 18.8 | 26.0 | 40.7 | 71.8 | 73.6 |
| Δ(ETotal) | 0.0 | 18.1 | 24.8 | 38.1 | 70.4 | 71.0 |
| ΔG298K | 0.0 | 15.9 | 19.3 | 36.9 | 60.3 | 62.0 |
| P(%)298 | 99.8 | 0.2 | 0.0 | 0.0 | 0.0 | 0.0 |
Table 2.
1H NMR chemical shifts (δ/ppm) of the H-4 proton for the free ligand ARS and isomers c1 and c2, and relative concentrations (in D2O/CD3OD, pH* 3,96) (the numbering is in accordance with Scheme 1).
Table 2.
1H NMR chemical shifts (δ/ppm) of the H-4 proton for the free ligand ARS and isomers c1 and c2, and relative concentrations (in D2O/CD3OD, pH* 3,96) (the numbering is in accordance with Scheme 1).
| δ 1H RMN (exp.) a (H4) | Relative Concentration (%) | δ 1H RMN (exp.) a (H4) | Relative Concentration (%) | ||
|---|---|---|---|---|---|
| Temp. 280.15 K | Temp. 298.15 K | ||||
| c1 | 8.07 (I) | 57.5 | c1 | 8.04 (I) | 51.4 |
| 8.08 (II) | 8.05 (II) | ||||
| 8.11 (III) | 8.10 (III) | ||||
| c2 | 8.14 | 17.2 | c2 | 8.14 (broad) | 24.0 |
| Free lig. | 7.96 | 25.3 | Free lig. | 7.96 | 24.6 |
a The numbering is based on the carbon atom to which the H atom is attached.
Table 3.
Relative Gibbs energies between isomers at 298.15 K (ΔG298/kJ mol−1) and corresponding equilibrium populations (P298/%) estimated from the relative Gibbs energies calculated using different functionals and the 6-311G(d,p) basis set (symmetries of structures are also indicated).
Table 3.
Relative Gibbs energies between isomers at 298.15 K (ΔG298/kJ mol−1) and corresponding equilibrium populations (P298/%) estimated from the relative Gibbs energies calculated using different functionals and the 6-311G(d,p) basis set (symmetries of structures are also indicated).
| M:L | Structure a | Sym | B3LYP | CAM-B3LYP | B3PW91 | w-B97X-D | ||||
|---|---|---|---|---|---|---|---|---|---|---|
| ΔG298 | P298 | ΔG298 | P298 | ΔG298 | P298 | ΔG298 | P298 | |||
| 1:1 | hc (a) | C1 | 0.0 | 86.8 | 0.0 | 69.8 | 0.0 | 77.6 | 0.0 | 52.2 |
| hh | C1 | 4.7 | 13.1 | 2.1 | 30.2 | 3.1 | 22.4 | 0.2 | 47.8 | |
| hh-T1 | C1 | 21.4 | 0.0 | 21.7 | 0.0 | 18.3 | 0.0 | 23.7 | 0.0 | |
| hh-T2 | C1 | 51.2 | 0.0 | 58.8 | 0.0 | 51.0 | 0.0 | 58.1 | 0.0 | |
| 1:2 | anti-hc (b) | Ci | 0.0 | 98.8 | 0.0 | 96.7 | 0.0 | 97.5 | 0.0 | 87.3 |
| syn-hc | Csb | 10.9 | 1.2 | 8.3 | 3.3 | 9.1 | 2.5 | 4.8 | 12.7 | |
| anti-hh | Ci | 26.0 | 0.0 | 27.1 | 0.0 | 24.3 | 0.0 | 23.0 | 0.0 | |
| syn-hh | Csb | 32.3 | 0.0 | 30.5 | 0.0 | 28.9 | 0.0 | 36.9 | 0.0 | |
| anti-hh-T | Ci | 44.0 | 0.0 | 53.5 | 0.0 | 40.2 | 0.0 | 51.8 | 0.0 | |
| syn-hh-T | Csb | 48.4 | 0.0 | 58.1 | 0.0 | 44.1 | 0.0 | 58.0 | 0.0 | |
| 1:3 | fac-hc (c2) | C3b | 0.0 | 61.4 d | 0.0 | 76.7 | 12.2 c | 0.7 | 29.8 c | 0.0 |
| mer-hc (c1) | C1 | 1.1 | 38.6 d | 3.0 | 23.3 | 0.0 c | 99.3 | 0.0 c | 100 | |
| mer-hh | C1 | 72.1 | 0.0 | 63.9 | 0.0 | 73.4 c | 0.0 | 139.4 c | 0.0 | |
| mer-hh-T | C1 | 69.1 | 0.0 | 92.0 | 0.0 | 256.3 c | 0.0 | 316.6 c | 0.0 | |
| fac-hh | C3b | 72.9 | 0.0 | 67.2 | 0.0 | 78.5 c | 0.0 | 144.5 c | 0.0 | |
| fac-hh-T | C3b | 71.8 | 0.0 | 92.2 | 0.0 | 285.9 c | 0.0 | 204.7 c | 0.0 | |
a The label “hc” indicates coordination through the carbonyl and the adjacent hydroxyl group; the label “hh” indicates coordination through both hydroxyl groups. b The symmetry in these structures is approximately Cs and C3, respectively. c For the B3PW91 and wB97X-D functionals, the 1:3 fac-hc structure did not converge to a minimum; therefore, for the 1:3 structures, the ΔG values presented were obtained from gas phase calculations. d The corresponding gas phase populations are 3.6% and 96.4% for the fac and mer isomers, respectively.
Table 4.
Vertical excitation energies, oscillator strengths (f), wavelengths (λ), and major contributions calculated for ARS and the Ga(III)/ARS complexes (TD-DFT CAM-B3LYP/6-311++G(d,p), IEFPCM (H2O)).
Table 4.
Vertical excitation energies, oscillator strengths (f), wavelengths (λ), and major contributions calculated for ARS and the Ga(III)/ARS complexes (TD-DFT CAM-B3LYP/6-311++G(d,p), IEFPCM (H2O)).
| Excited State | Energy (eV) | λcalc. (nm) | λexp. (nm) | f | Major Contributions (%) | Character |
|---|---|---|---|---|---|---|
| ARS | ||||||
| S1 | 3.29 | 377 | 424 | 0.2267 | H→L (100%) | π → π* |
| 1:1 hc complex (a) | ||||||
| S1 | 2.78 | 446 | 482 | 0.1901 | H→L (100%) | π → π* |
| 1:2 anti-hc complex (b) | ||||||
| S1 | 2.84 | 436 | 482 | 0.0000 | H-1→L+1 (41%) + H→L (59%) | π → π* |
| S2 | 2.91 | 426 | 0.4307 | H-1→L (52%) + H→L+1 (48%) | π → π* | |
| 1:3 mer (c1) | ||||||
| S1 | 2.85 | 436 | 482 | 0.2675 | H-1→L (26%) + H-1→L+2 (20%) | π → π* |
| S3 | 2.90 | 427 | 0.4348 | H→L (24%) + H-1→L (21%) | π → π* | |
| 1:3 fac (c2) | ||||||
| S1 | 2.85 | 435 | 482 | 0.1532 | H-2→L (34%) + H→L+1 (22%) | π → π* |
| S2 | 2.85 | 435 | 0.1548 | H-1→L (33%) + H→L+2 (23%) | π → π* | |
| S3 | 2.91 | 426 | 0.4244 | H→L (46%) + H-1→L+2 (28%) | π → π* |
Disclaimer/Publisher’s Note: The statements, opinions and data contained in all publications are solely those of the individual author(s) and contributor(s) and not of MDPI and/or the editor(s). MDPI and/or the editor(s) disclaim responsibility for any injury to people or property resulting from any ideas, methods, instructions or products referred to in the content. |
© 2023 by the authors. Licensee MDPI, Basel, Switzerland. This article is an open access article distributed under the terms and conditions of the Creative Commons Attribution (CC BY) license (https://creativecommons.org/licenses/by/4.0/).
Share and Cite
MDPI and ACS Style
Justino, L.L.G.; Braz, S.; Ramos, M.L. Spectroscopic and DFT Study of Alizarin Red S Complexes of Ga(III) in Semi-Aqueous Solution. Photochem 2023, 3, 61-81. https://doi.org/10.3390/photochem3010005
AMA Style
Justino LLG, Braz S, Ramos ML. Spectroscopic and DFT Study of Alizarin Red S Complexes of Ga(III) in Semi-Aqueous Solution. Photochem. 2023; 3(1):61-81. https://doi.org/10.3390/photochem3010005
Chicago/Turabian StyleJustino, Licínia L. G., Sofia Braz, and M. Luísa Ramos. 2023. "Spectroscopic and DFT Study of Alizarin Red S Complexes of Ga(III) in Semi-Aqueous Solution" Photochem 3, no. 1: 61-81. https://doi.org/10.3390/photochem3010005