Article

Application of Zirconia/Alumina Composite Oxide Ceramics as Photocatalysts for Removal of 2,4,6-Trichlorophenol from Water

by
Tatjana D. Vulić
1,
Milica V. Carević
1,
Nadica D. Abazović
1,
Tatjana B. Novaković
2,
Zorica D. Mojović
2 and
Mirjana I. Čomor
1,*
1
Vinča Institute of Nuclear Sciences, National Institute of RS, University of Belgrade, Mike Petrovića Alasa 12-14, 11000 Belgrade, Serbia
2
Institute of Chemistry, Technology and Metallurgy-Department of Catalysis and Chemical Engineering, National Institute of RS, University of Belgrade, Njegoševa 12, 11000 Belgrade, Serbia
*
Author to whom correspondence should be addressed.
Photochem 2022, 2(4), 905-917; https://doi.org/10.3390/photochem2040058
Submission received: 5 October 2022 / Revised: 17 November 2022 / Accepted: 22 November 2022 / Published: 28 November 2022

Abstract

:
The mesoporous zirconia/alumina composites were synthesized via a sol–gel method, followed by heat treatment at 500 °C for 5 h. The effect of the ZrO2/Al2O3 ratio on the structural and textural properties of the obtained composites was explored. Sorption analysis has confirmed that all samples have a mesoporous structure whose parameters (SBET, Vp and Dmax) strongly depend on the ZrO2/Al2O3 ratio. The XRD pattern of composites has shown that the addition of zirconia disrupts the crystallinity of alumina. The composites with higher zirconia content (50% ZrO2 and 67% ZrO2) are characterized by peaks related only to the zirconia phase. UV/Vis diffuse reflection spectra of all samples revealed that composites have more intensive absorption compared to pure oxides for wavelengths larger than 250 nm and similar band gaps. Photoluminescence measurements showed presence of defects in all samples, which are responsible for photocatalytic activity. All samples showed significant adsorption/photocatalytic efficacy for the removal/degradation of 2,4,6 -trichlorophenol (TCP). Results obtained using HPLC and TOC techniques showed that between 70 and 80% of the initial TCP concentration was removed/degraded after 4 h of illumination. These results were corelated with flat, conduction and valence band potentials of synthesized pure and binary oxides, calculated using Mott–Schottky plots.

Graphical Abstract

1. Introduction

In order to overcome the present strong dependence on fossil fuels, the whole planet is turning to an ever-present, clean and abundant source: the Sun, which irradiates the Earth’s surface with approximately 100,000 TW on an annual basis [1]. Bearing in mind that current projections of the global annual energy consumption will reach 20 TW in 2030, about three orders of magnitude less than Earth’s gain from the Sun [2], it would be of great interest for industry and everyday life to make the exploitation of Solar energy as commercial as possible. Among various ways for Solar energy application, an environmental photocatalysis has special significance. This process covers air purification [3] and water decontamination [4]. The main part of the photocatalytic system is the semiconductor able to produce charge separation after absorption of light [5]. The photogenerated charges: an electron in the conduction band and a hole formed in the valence band, which are reactive species that can lead to reduction and oxidation reactions, respectively. To achieve high performance in the photocatalytic system, it is necessary to use semiconductor with strictly defined electronic properties. The ideal candidate should be inexpensive, environmentally harmless, chemically inert with the broad spectral response and appropriate valence and conduction band potentials for useful oxidation and reduction reactions—in short, it is impossible to find everything in one material [5]. The most studied photocatalysts are from the group of transition metal oxides (TiO2, ZnO, ZrO2, etc.), although their spectral response (wide band gaps with energy in UV spectral range) must be corrected/lowered using different approaches. For example, in our previous publications we used the following methods: doping with metal [6,7,8] or nonmetal ions [9,10]; surface modification with coordinating ligands [11]; constructing nanocomposites with other semiconductors [12] or polymers [13].
Zirconia is ceramic material mostly used as catalyst/catalyst support [14], an adsorbent [15], an oxygen sensor [16] or solid oxide fuels [17], among others. Zirconia can be considered also as an n-type, direct band, semiconductor with wide band gap energy. When it is between 3.25–5.10 eV [18] it has been considered a photocatalyst, with suitable conduction and valence band potentials of −1.0 V and +4.0 V, respectively, vs. NHE at pH 0 [18]. It can be found in the literature that the photocatalytic efficacy of zirconia depends on its crystalline structure [18,19], and it can be used for photodegradation of phenolic compounds [7,8,12]. Alumina, on the other hand, a ceramic insulator transparent in the visible, UVA and UVB spectral ranges (band gap > 8 eV [20]), can help in increasing the adsorption of the pollutant molecules onto the surface of the composite and in decreasing the charge recombination. It is easily available, non-toxic and harmless for people and the environment. Additionally, it is proposed that in the wide band gap of alumina various defect states, acceptor and donor states can be formed due to synthesis conditions [20] and hydroxylation. Due to this statement, the photocatalytic properties of alumina are the subject of recent papers [21,22,23,24]. Especially interesting can be the synergistic effect of a combination of different semiconductors with alumina [21].
The subject of this study was the synthesis and characterization of pure ZrO2 and Al2O3 and their binary oxide nanocomposites, as novel photocatalysts for degradation of pollutants. All samples were characterized by XRD techniques, UV/Vis diffuse reflection and PL spectroscopy and SEM measurements. In addition, flat band potentials of synthesized pure and binary oxides, had been calculated using Mott–Schottky plots. These results together with obtained textural properties, were used to determine the correlation between the composition of the samples and their properties. Special attention was devoted to the photocatalytic efficacy of the nanocomposite ceramics in the photodegradation reaction of 2,4,6-trichlorophenol (TCP) as a model compound. We hope these results will open broader usage of ceramic materials for environmental remediation, not just as adsorbers but also as photocatalysts

2. Materials and Methods

The following commercial reagents were used: aluminum isopropoxide (Sigma Aldrich, Darmstat, Germany, 98%), zirconyl nitrate hydrate (SigmaAldrich, p.a.), 2,4,6-Trichlorophenol (TCP, Alpha Aesar, Karlsruhe, Germany, 98%) and Methanol (Panreac, Barselona, Spain, 99.9%). All chemicals were used as received. In all experiments, deionized water from the Mili Q system was used.
Boehmite sol was prepared by the hydrolysis of aluminum isopropoxide according to the procedure given by Yoldas [25]. Briefly, in order to obtain Al/Zr-composite samples (atomic ratios 1/0.5, 1/1 and 1/2), appropriate concentrations of zirconium nitrate solution were mixed with freshly prepared boehmite sol; after that mixtures were gelled at 40 °C and thermally treated at 500 °C for 5 h. Samples were denoted as: ZrO2, Al2O3, 2Al:1Zr, 1Al:1Zr and 1Al:2Zr.
The nitrogen sorption was performed at −196 °C and a relative pressure interval between 0.05 and 0.98 in an automatic sorption apparatus (Sorptomatic 1990 Thermo, Finningen, Italy). The specific surface areas SBET and C were calculated by the BET method [26] from nitrogen adsorption–desorption isotherms, using data up to p/po = 0.3, and the pore size distribution has been computed from the desorption branch of the isotherms [27]. The X-ray powder diffraction measurements were performed on a PHILIPS 1050 X-ray diffractometer (Eindhoven, The Netherlands) using Ni-filtered Cu Kα radiation. The patterns were taken in the 10–70° 2θ range with a step length of 0.05° and exposure time of 5 s per step.
UV/Vis Diffuse reflectance spectra (DRS) of the obtained powders were obtained using a Shimadzu UV-2600 spectrophotometer (S. Corp. Tokyo, Japan) equipped with an integrated sphere (ISR-2600 plus for UV-2600). Default Kubelka–Munk transformation was used for the automatic calculation of absorption spectra from reflectance. Photoluminescence measurements were performed using a PerkinElmer LS 45 fluorescence spectrometer (Waltham, MA, USA).
The morphology and microstructure of the samples were observed by scanning electron microscope JEOL, JSM-6390 LV (USA) coupled with energy-dispersive X-ray spectroscopic mapping (EDS, Oxford Instruments X-MaxN, Abingdon, UK). The samples were covered with a Au film to improve the conductivity during recording.
The photocatalytic degradation procedure was carried out as follows: at atmospheric pressure and room temperature 20 mg of catalyst was added to 40 mL of TCP aqueous solution (5 × 10⁻⁴ mol/L). Before illumination, the mixture was stirred in the dark for one hour in order to achieve the adsorption–desorption equilibrium. The reaction suspension was constantly bubbled with O2 and magnetically stirred during irradiation. The bubbling with O was necessary for formation of O2- radical anion which is the main radical species for the degradation of TCP [7]. Suspensions were placed into a vessel which was exposed to white light from an Osram Vitalux lamp (Augsburg, Germany, 300 W, Sun light simulation, white light: UVB radiated power from 280–315 nm 3.0 W; UVA radiated power 315–400 nm 13.6 W; the rest is visible light and IR). Optical power was measured using an R-752 Universal Radiometer (New York, NY, USA) read out with sensor model PH-30, DIGIRAD (New York, NY, USA) and it was ~30 mW cm−2 at a distance of 30 cm from experimental solutions (used in this study) [7,12]. The aliquots (1 mL) were taken from the suspension at regular time intervals and centrifuged.
For kinetic studies of TCP photodegradation, liquid chromatography with diode array detection (HPLC) was used, aliquots (1 mL) of the reaction mixture were taken at the beginning of the experiment (C0) and at regular time intervals (Ct). Aliquots extracted from TCP/catalyst suspensions were diluted with 1ml of methanol and filtered through an Agilent Technologies Econofilter 25/0.2 μm PTFE (syringe filter, Bremen, Germany). The absence of the TCP adsorption on the filter was preliminarily checked [7,12].
After that, a 10–30 μL sample was injected and analyzed on an UltiMate 3000 HPLC System (Thermo Scientific, Waltham, MA USA), equipped with a UV/Vis DAD set at the characteristic wavelength of the absorption maximum of TCP (224 nm, 292 nm and whole spectrum) and a Hypersil GOLD (Thermo Scientific, Waltham, MA, USA, 250 mm × 4.6 mm i.d., particle size 5 μm, 21 °C) column. The mobile phase (flow rate 1 mL/min) was a mixture of methanol and water (7:3) [7,12]. In repeated runs, the results agreed within 5–10%. Kinetic curves were drowned as Ct/C0 = F(t).
Total Organic Carbon (TOC) was measured using TOC-LCSH/CSN Shimadzu (S. Corp. Tokyo, Japan). Samples prepared for the photocatalytic degradation of TCP, before the analysis of samples (after 4 h of illumination), were filtrated so results should be treated as so-called Total dissolved Organic Carbon.
Mott–Schottky plots were recorded by an Autolab electrochemical workstation (Autolab PGSTAT302N, Metrohm-Autolab BV, Eindhoven, The Netherlands). The three-electrode cell used for the electrochemical experiment consisted of a Ag/AgCl in 3 M KCl (E0Ag/AgCl = 0.210 V vs. SHE) as reference electrode, a platinum rod as the counter electrode and a glassy carbon electrode (GCE) coated with the investigated sample as the working electrode. The coating of GCE was performed in the following manner: 10 mg of sample was homogeneously dispersed in 0.95 mL of ethanol and 0.05 mL of 5 wt.% Nafion using an ultrasonic bath. A total of 10 μL of suspension was placed on the surface of the GCE (0.071 cm2). A uniformly distributed sample was obtained at the surface of GCE after solvent evaporation. Mott–Schottky measurements were performed at the frequency of 100 Hz, with the voltage applied at successive steps of 50 mV from 1 V to −1 V. The measurements were performed in 0.1 M Na2SO4 (pH = 5.6).

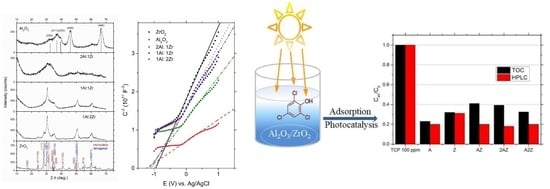
3. Results and Discussion

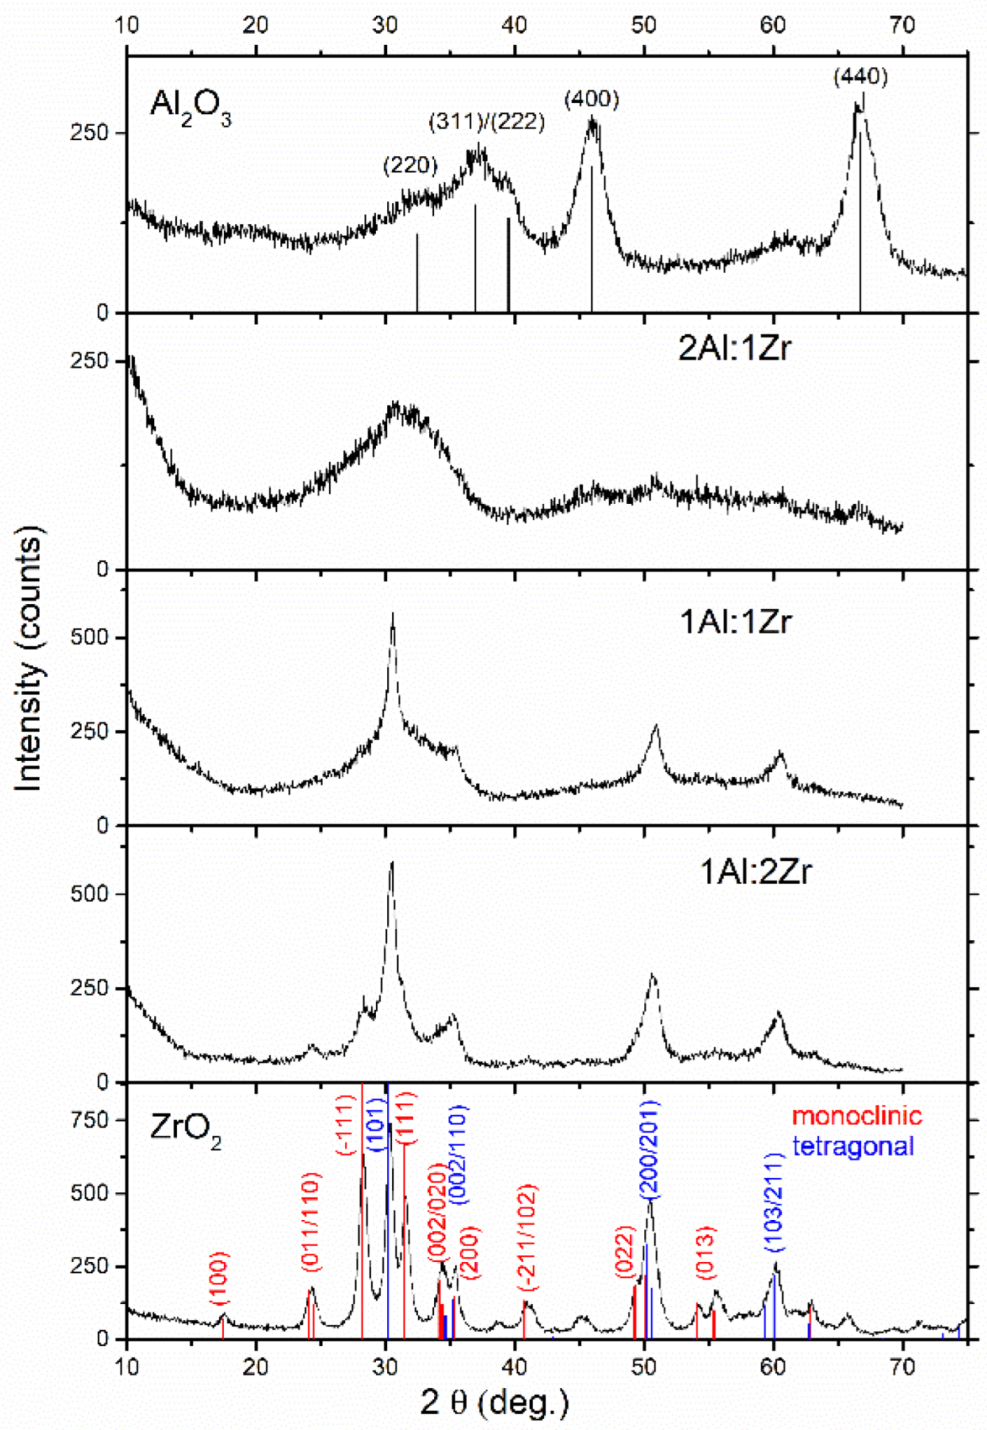
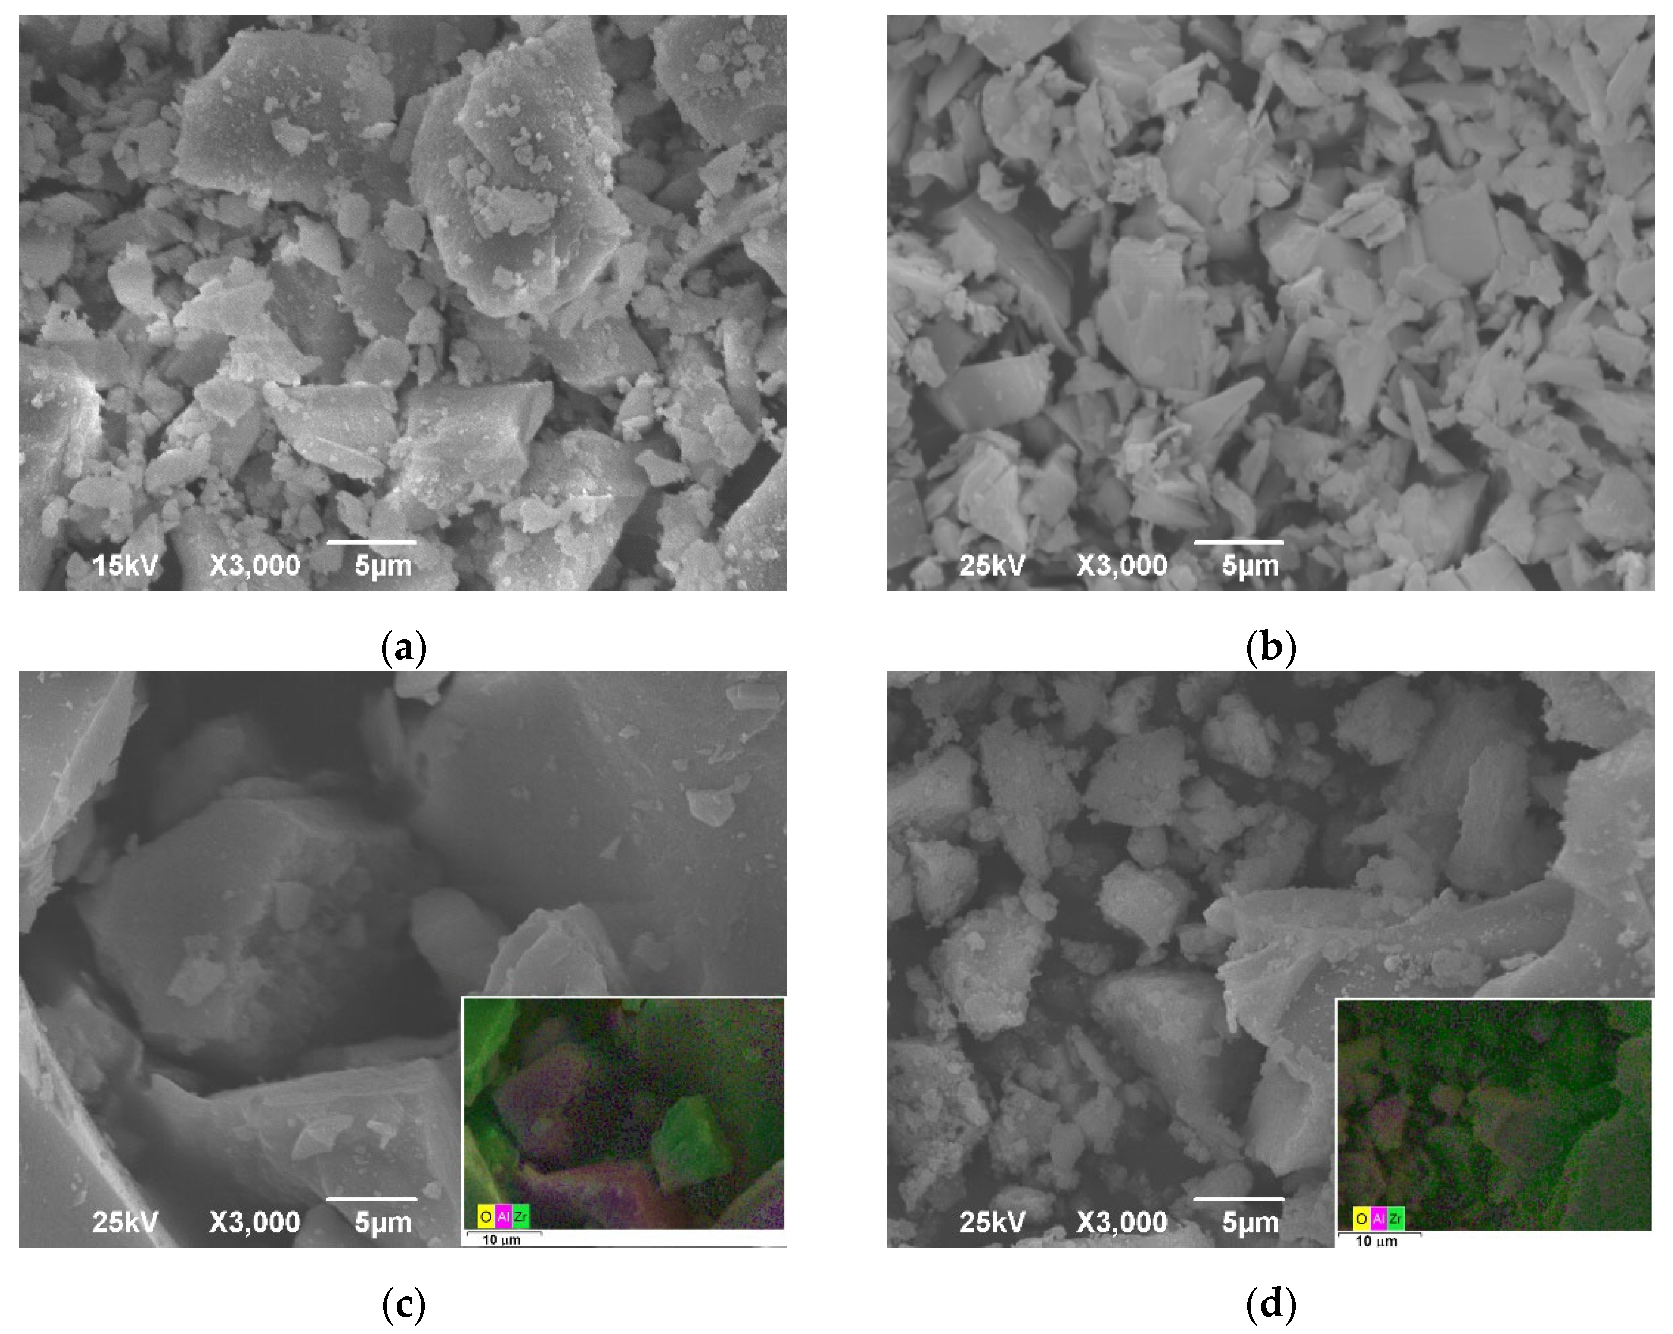
3.1. Structural and Morphological Properties of Oxide Samples

XRD patterns of pure and binary oxides are presented in Figure 1. XRD of the pure alumina sample is characterized by diffractions characteristic for cubic γ-alumina (γ-Al2.144O3.2, PDF No. 79-1558), which has spinel-type lattice that contains cation vacancies. Broad diffraction peaks indicate the nanocrystalline nature of alumina and the possible presence of amorphous material. Pure ZrO2 crystalizes in an initial, metastable tetragonal crystal phase (JCPDS 81-1544) usually formed at temperatures higher than 330 °C (formation of m-tetragonal nuclei), and in monoclinic (JCPDS 65-1025) crystalline structure, the latter being expected in the presented experimental conditions. X-ray diffractions of the composite with the lowest amount of zirconia (2Al:1Zr) indicated that crystallization of alumina is suppressed even for that Al/Zr ratio, although still no presence of crystalline zirconia can be seen, so the sample should be considered as amorphous. XRD patterns of the other two composites are dominated by peaks related to initial, metastable tetragonal zirconia, which can be expected due to the presence of trivalent (Al) cations in the matrix, which improve the stability of the tetragonal phase and induce the formation of oxygen vacancies [28]. In addition, according to literature data [29] the presence of Al2O3 can shift the temperature of m-tetragonal phase crystallization to higher temperatures compared to pure ZrO2, from 400 °C (pure ZrO2) to 750 °C (10% Al2O3). The temperature of formation of the monoclinic crystalline phase is consequently increased with an increase of alumina content: pure ZrO2 calcined at 450 °C had both crystalline phases, and samples containing 10% of Al2O3 do not contain the monoclinic phase up to 750 °C [29]. We observed similar behavior: after the annealing of samples at 500 °C in pure ZrO2, both phases were detectable but in composite samples the m-tetragonal phase was a dominant phase of zirconia, with traces of low-intensity peaks of the monoclinic phase (Figure 1). Similar results were obtained when zirconia was doped with Si4+ ions in Carevic et al. [7]. The addition of silica ions induced reduction of particle sizes of zirconia and a delay of crystallization in stable monoclinic form to temperatures higher than 600 °C.
Thus, the crystallinity of nanocomposites decreases with increasing alumina content when annealing was performed at 500 °C, but higher temperatures would severely diminish the specific surface area of the samples. For example: the specific surface area of pure ZrO2 annealed at 450 °C is three times higher than that annealed at 600 °C. Similar results were obtained for ZrO2 with 10% of Al2O3 [29]. In Table 1, together with the textural properties of oxide samples, diameters of crystalline domains calculated using the Scherrer equation, from the FWHM (full width at half maximum of the most prominent peak in the spectra, at 2θ = 30.2 deg) in XRD spectra, are given. Data are in good agreement with the pore sizes of the samples, except for 2Al:1Zr, which has no prominent peaks for calculation. Pure ZrO2 has similar crystallite diameters for both crystalline phases (tetragonal and monoclinic), about 11 nm.
In Figure 2, the SEM microphotographs of pure oxides (a and b) and two composites (c and d) are shown. In (c) and (d) insets of Figure 2, chemical mapping is given for composite samples. The elemental analysis results are presented in Tables S1–S4 in Supplementary Materials.
A scanning electron microscope-energy dispersive spectrometer (SEM-EDS) was used to investigate the morphology and element distribution of alumina/zirconia composites and pure oxide samples. The well-developed porous structures cannot be seen in typical images in Figure 2, all samples consisted of agglomerates and particles of random sharp angled shapes and sizes. Pure alumina has larger agglomerates/particles (Figure 2a), from about 15 µm to submicron sizes, compared to pure zirconia (Figure 2b), which has particles from about 10 µm to submicron sizes. The fraction of smaller particles is larger for zirconia synthesized in the proposed way than for alumina. Additionally, the zirconia sample showed the presence of elongated structures, with a rodlike aspect ratio. When composite Al2O3/ZrO2 samples are in question, a sample with more alumina (Figure 2c) resembles pure alumina, with large agglomerates of about 10–20 µm and a smaller fraction of particles (submicron) distributed on their surfaces without any order. A composite sample with more zirconia (Figure 2d) also has particles of different shapes and sizes. A fraction of smaller particles, with sizes ≤ 1 µm, is distributed on the surface of larger particles (≤15 µm). Elemental mapping presented in Figure 2c,d, as insets, showed the distribution of Al, Zr and O on the surface of composite samples. Elements are distributed in well-balanced manner; it can be concluded that we have contact between Al and Zr oxides mixed at the molecular level. In addition, it could be seen from the SEM images that the samples had an uneven bulky surface, which might lead to locally uneven distribution, especially when a composite sample with more alumina is considered. The surface composition of measured samples, EDS, is given in Tables S1–S4 in Supplementary Materials.

3.2. Textural Properties of Pure and Composite Samples

The isotherms of all samples can be classified as IUPAC type IVa with an H2 hysteresis loop [30], characteristic of mesoporous materials (Figure S1 in SM). Similar results were obtained when titania/zirconia composites were studied in [12], as well as when zirconia was doped with Fe3+ ions [8]. Pure γ-alumina has large SBET and pore volume, and a narrow pore size distribution with a mean pore diameter of 4.9 nm (Figure S2 in Supplementary Materials). The increasing amount of zirconia in nanocomposites induced the reduction of SBET, Vp micro and changes in pore size distribution, i.e., the occurrence of bimodal distribution with two predominating pore diameters (Table 1). Changes in pores structure of alumina/zirconia composites are dependent on the amount of present zirconia, where a small increase of both sizes of pores can be seen. Vp 0.98 are the largest for pure oxides, although alumina has two times higher value compared to zirconia. Values for composites are between 0.124–0.167 cm3g−1, increasing with the increase of zirconia share.

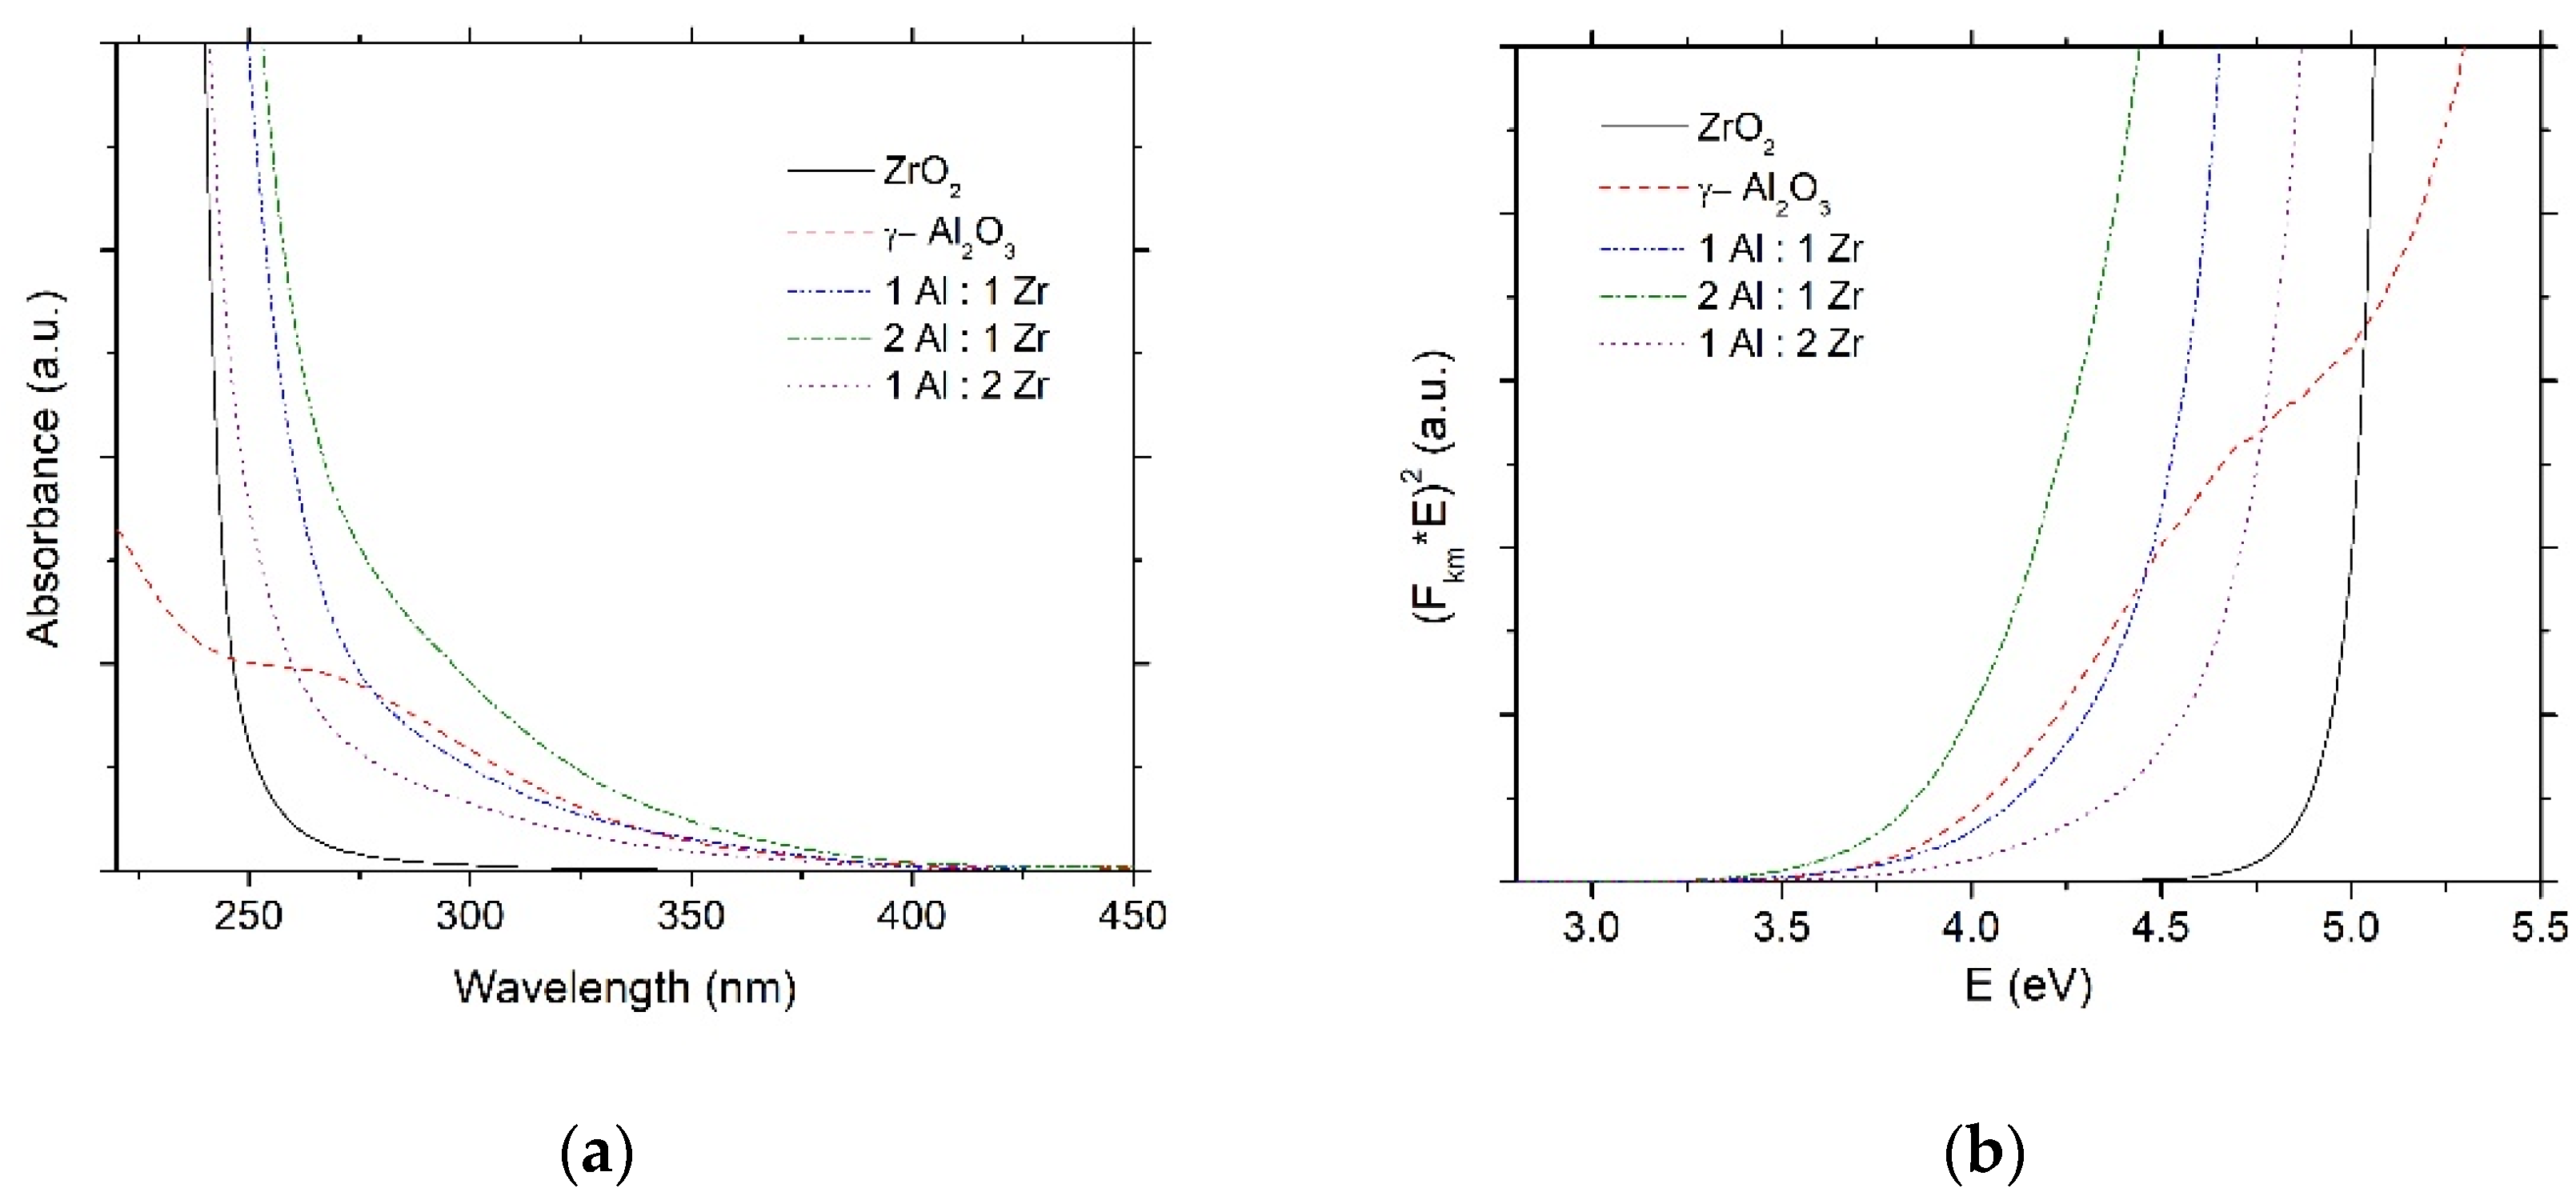
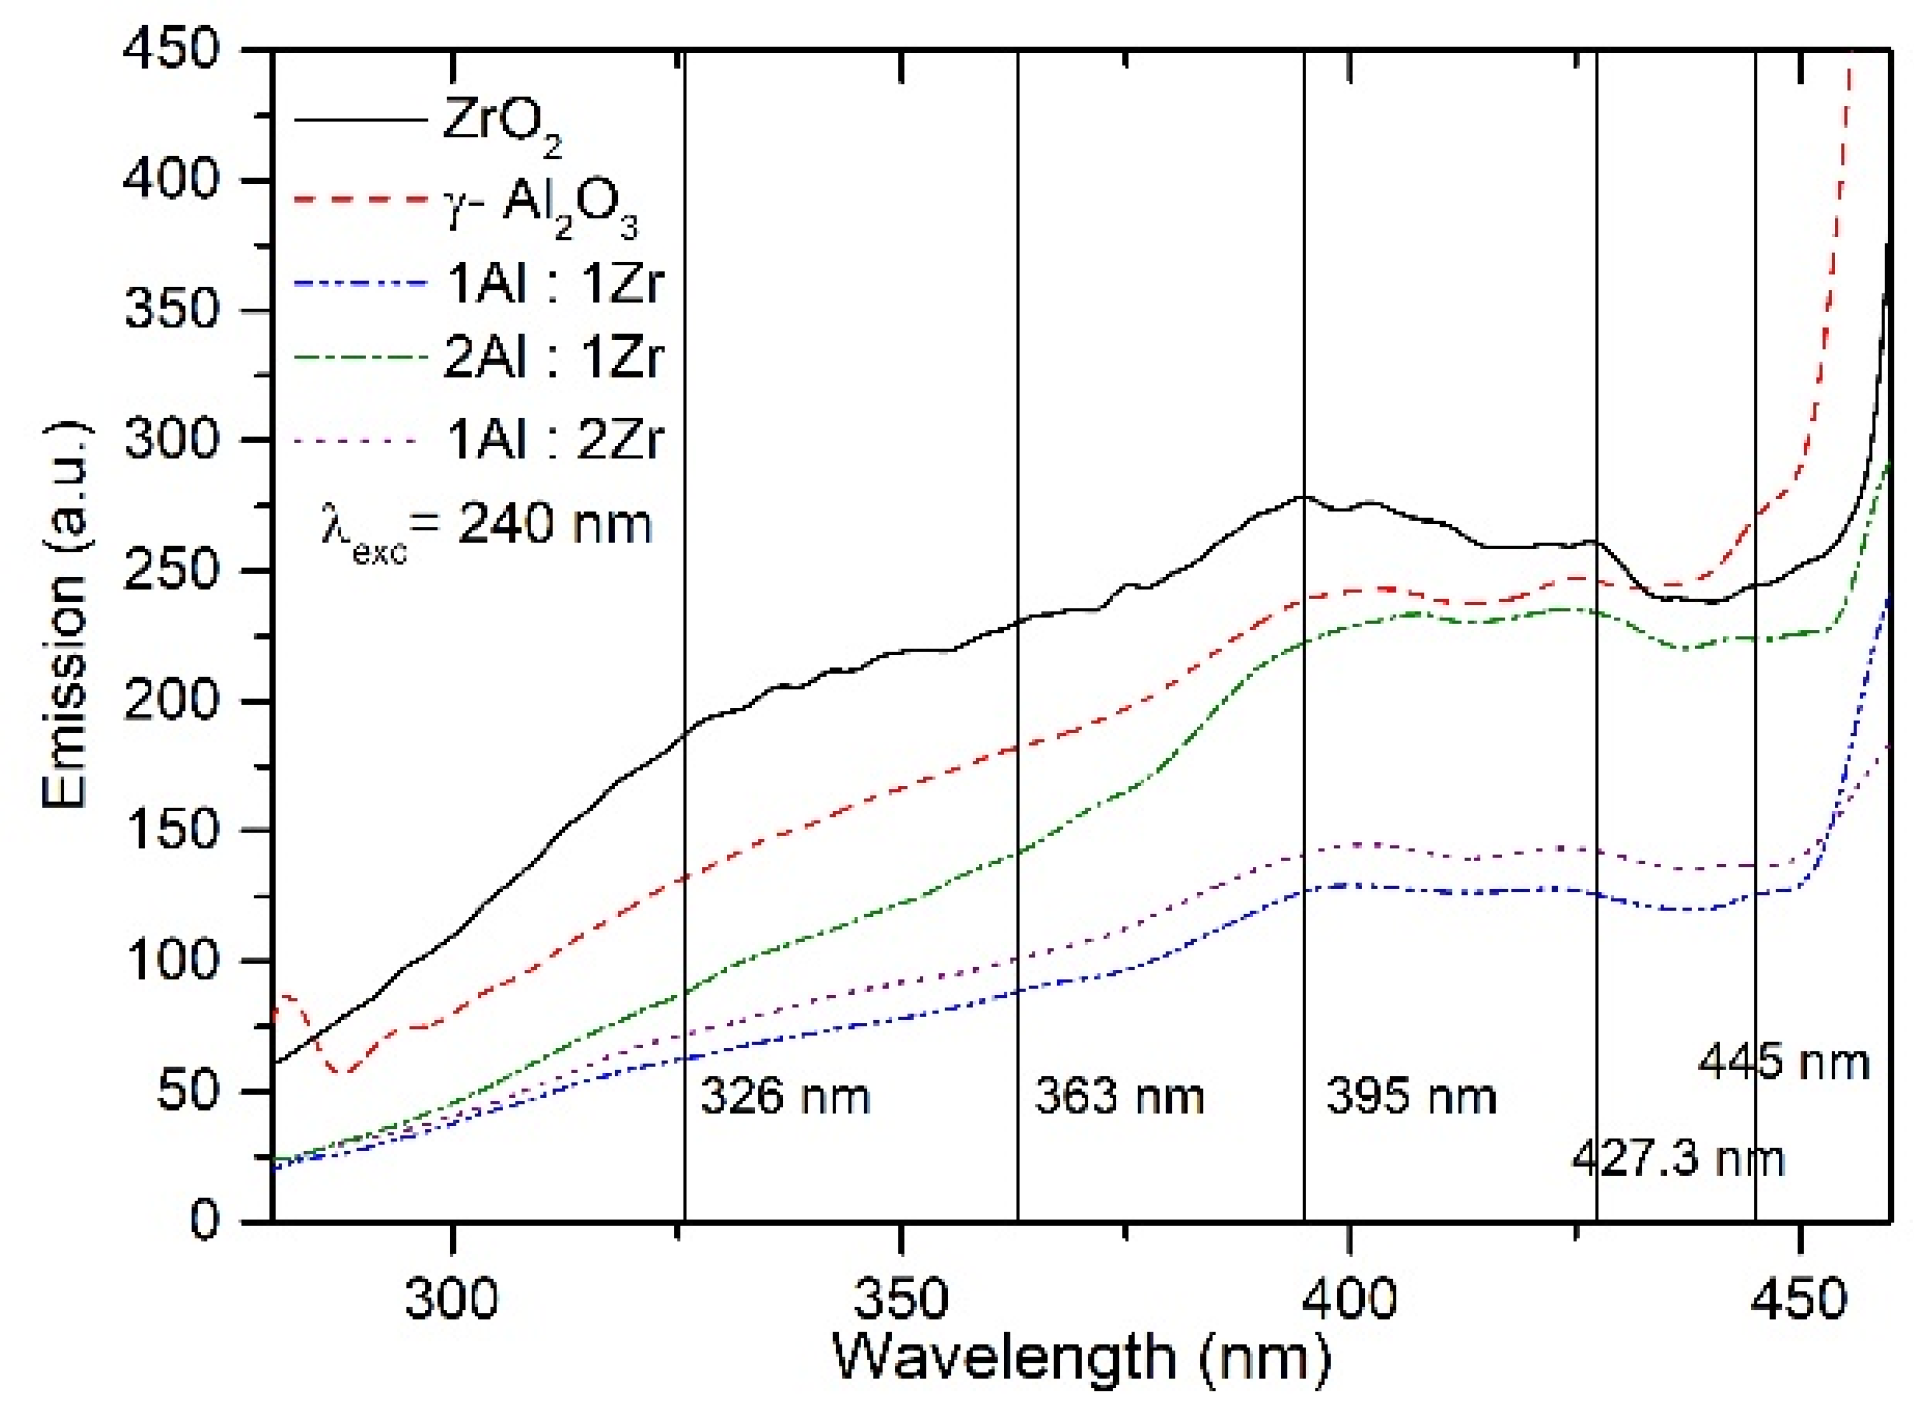
3.3. Optical Properties of Pure and Composite Oxide Samples

The characterization of the optical properties of the semiconductor nanomaterials, requires the use of diffuse reflectance UV/Visible spectroscopy (DRUVS). If the estimation of the optical band gap energy is a goal, then the Kubelka–Munk transformation should be applied on reflectance in order to get the absorption spectra (Figure 3a) and Tauc’s plots (Figure 3b). In the Tauc’s plots, the Kubelka–Munk function, F[R∞(λ)], is proportional to the absorption coefficient of the material (α) as it varies according to the expression (αhν)1/n, which is plotted against the energy of the photons (hν), where α is the absorption coefficient, h is Planck’s constant and ν is the frequency of light. After carefully fitting the best line to the previous plot, an extrapolation to zero shows the intercept corresponding to the optical band gap. The nature of the semiconductor dictates the exponent (n); the band gap of the semiconductor material can correspond to an allowed direct (n = 0.5), allowed indirect (n = 2), forbidden direct (n = 1.5) or forbidden indirect (n = 3) transition. It is assumed that alumina and zirconia, as well as their nanocomposites, have allowed direct transitions, n = 0.5.
As can be seen in the literature [22], the UV/Vis spectra of the γ-Al2O3 dried at 100 °C show three absorption edges (371.38 nm (3.3 eV), 298.46 nm (4.15 eV) and 239.71 nm (5.17 eV) nm), which are associated with different electronic transitions caused by the different environments of hydroxylation present in the material, mainly amorphous oxide. However, when the alumina is annealed at 500 °C, a shift to the visible region of the spectrum can be observed, due to color defects in the oxide structure. Dehydration of the material, which favors the electronic transitions from the 2p orbitals of oxygen to the 3p orbitals of aluminum by a drop from octa- to tetra- and penta-coordinated structure, causes absorption edge shifts. In the samples annealed at temperatures higher than 500–600 °C, an unfavorable shift of the absorption edges to a higher energy value was observed, at about 359 nm (3.45 eV), originating from the spatial arrangement of the Al and O atoms when the crystalline phase of the material was formed [22]. In Figure 3, the absorption spectra (a, Kubelka–Munk transformation from reflection spectra) and Tauc’s plots (b, for estimation of band gaps, values listed in Table 2) of all samples can be seen. The absorption threshold of γ-alumina is about the formerly suggested value, between 350–400 nm, band gap energy and defect transitions, estimated from the Tauc’s plot, are 5.10, 4.80 and 3.90 eV.
The UV/Vis absorption spectrum of ZrO2 powder is also presented in Figure 3. Zirconia is an active and typical photon absorber and photocatalyst among wide band gap metal oxides, although band gap excitation is in the UVC part of the spectra. It is a direct band gap material with two direct band-to-band transitions at 5.20 and 5.79 eV [31], but the wide variety of data for band gap energies can also be found in the literature from 3.25 to 5.10 eV [18,19,31]. Literature data proposed [31] different band gaps for the different crystalline phases of ZrO2: the monoclinic phase transitions at 5.17–5.20 eV (240 nm) and tetragonal ZrO2 transitions at 4.00 eV (310 nm). The valence band of ZrO2 is mainly composed of the occupied 2p energy state of the O atom and the conduction band is constituted of the unoccupied 4d energy states of the Zr atom [31]. The UV/Vis spectrum of the pure ZrO2 sample shows a sharp absorption raise toward wavelengths shorter than 250 nm, with the estimated value of the band gap energy (Table 2) of 4.9 eV, indicating the monoclinic phase. That absorption band corresponds to the valence band to conduction band (VB → CB) transition. The broad absorption tailing that can be observed for zirconia and binary oxides at the photon energies smaller than the band gap of zirconia or alumina, most probably originates from the defect centers. These are usually oxygen vacancies at 3.0 eV (410 nm) and 4.5 eV (275 nm), and hole color centers of the V-type with a maximum at 3.25 eV (380 nm) of oxide materials [22]. As can be seen in Figure 3b and Table 2, composite powders have band gap energies slightly lower than pure ZrO2 (maybe due to the tetragonal crystalline phase of ZrO2): 3.8 eV (2Al:1Zr), 4.1 eV (1Al:1Zr) and 4.5 eV (1Al:2Zr).
To further examine the presence of defects in synthesized pure and composite oxides, the photoluminescence spectroscopy was employed. This technique is an extremely useful tool for obtaining information about the electronic, optical and photoelectric properties of the materials. PL spectra depend strongly on the particle size, defects and impurities present in the materials. The PL spectra of the samples are shown in Figure 4. The excitation wavelength was chosen to be 240 nm /5.1 eV in order to exceed all estimated band gaps (Table 2).
All samples gave similar PL spectra, characterized by broad, overlapped bands with weak peaks/shoulders at about 325 nm, 363 nm, 395 nm, 425 nm and 445 nm. Pure oxides also resembled each other. It should be borne in mind that alumina was mostly amorphous with a dominant influence of defects and decreased optical band gap energy of 3.9 eV, compared to a bulk value of 9 eV [32]. All observed shoulders in the spectra of pure alumina can be assigned to defects/color centers in the band gap of alumina: 395 nm to Fs and Fs+ (Fs is surface perturbed neutral oxygen vacancy) and shoulders above 400 nm (420–450 nm) to F emission centers. In the case of pure zirconia, the broad nature of spectral features also strongly indicated that fluorescence involves defect/intraband/extrinsic states. Excitation energy exceeds the band gap energy of ZrO2 nanoparticles, and photogenerated electrons can be trapped by oxygen vacancies (VO) and create neutral or charged F centers [31]. Recombination of valence band holes and F centers gives rise to broad band emission between 320–450 nm. Mixed oxides have the shapes of PL spectra similar to pure oxides, with lower intensities. This shape can propose the same recombination mechanisms as in the pure oxides (defects) [32], where lower intensities can indicate the decrease of recombination of photogenerated charges. These can be induced by newly formed defects at the interface between alumina and zirconia, which can trap electrons [33].

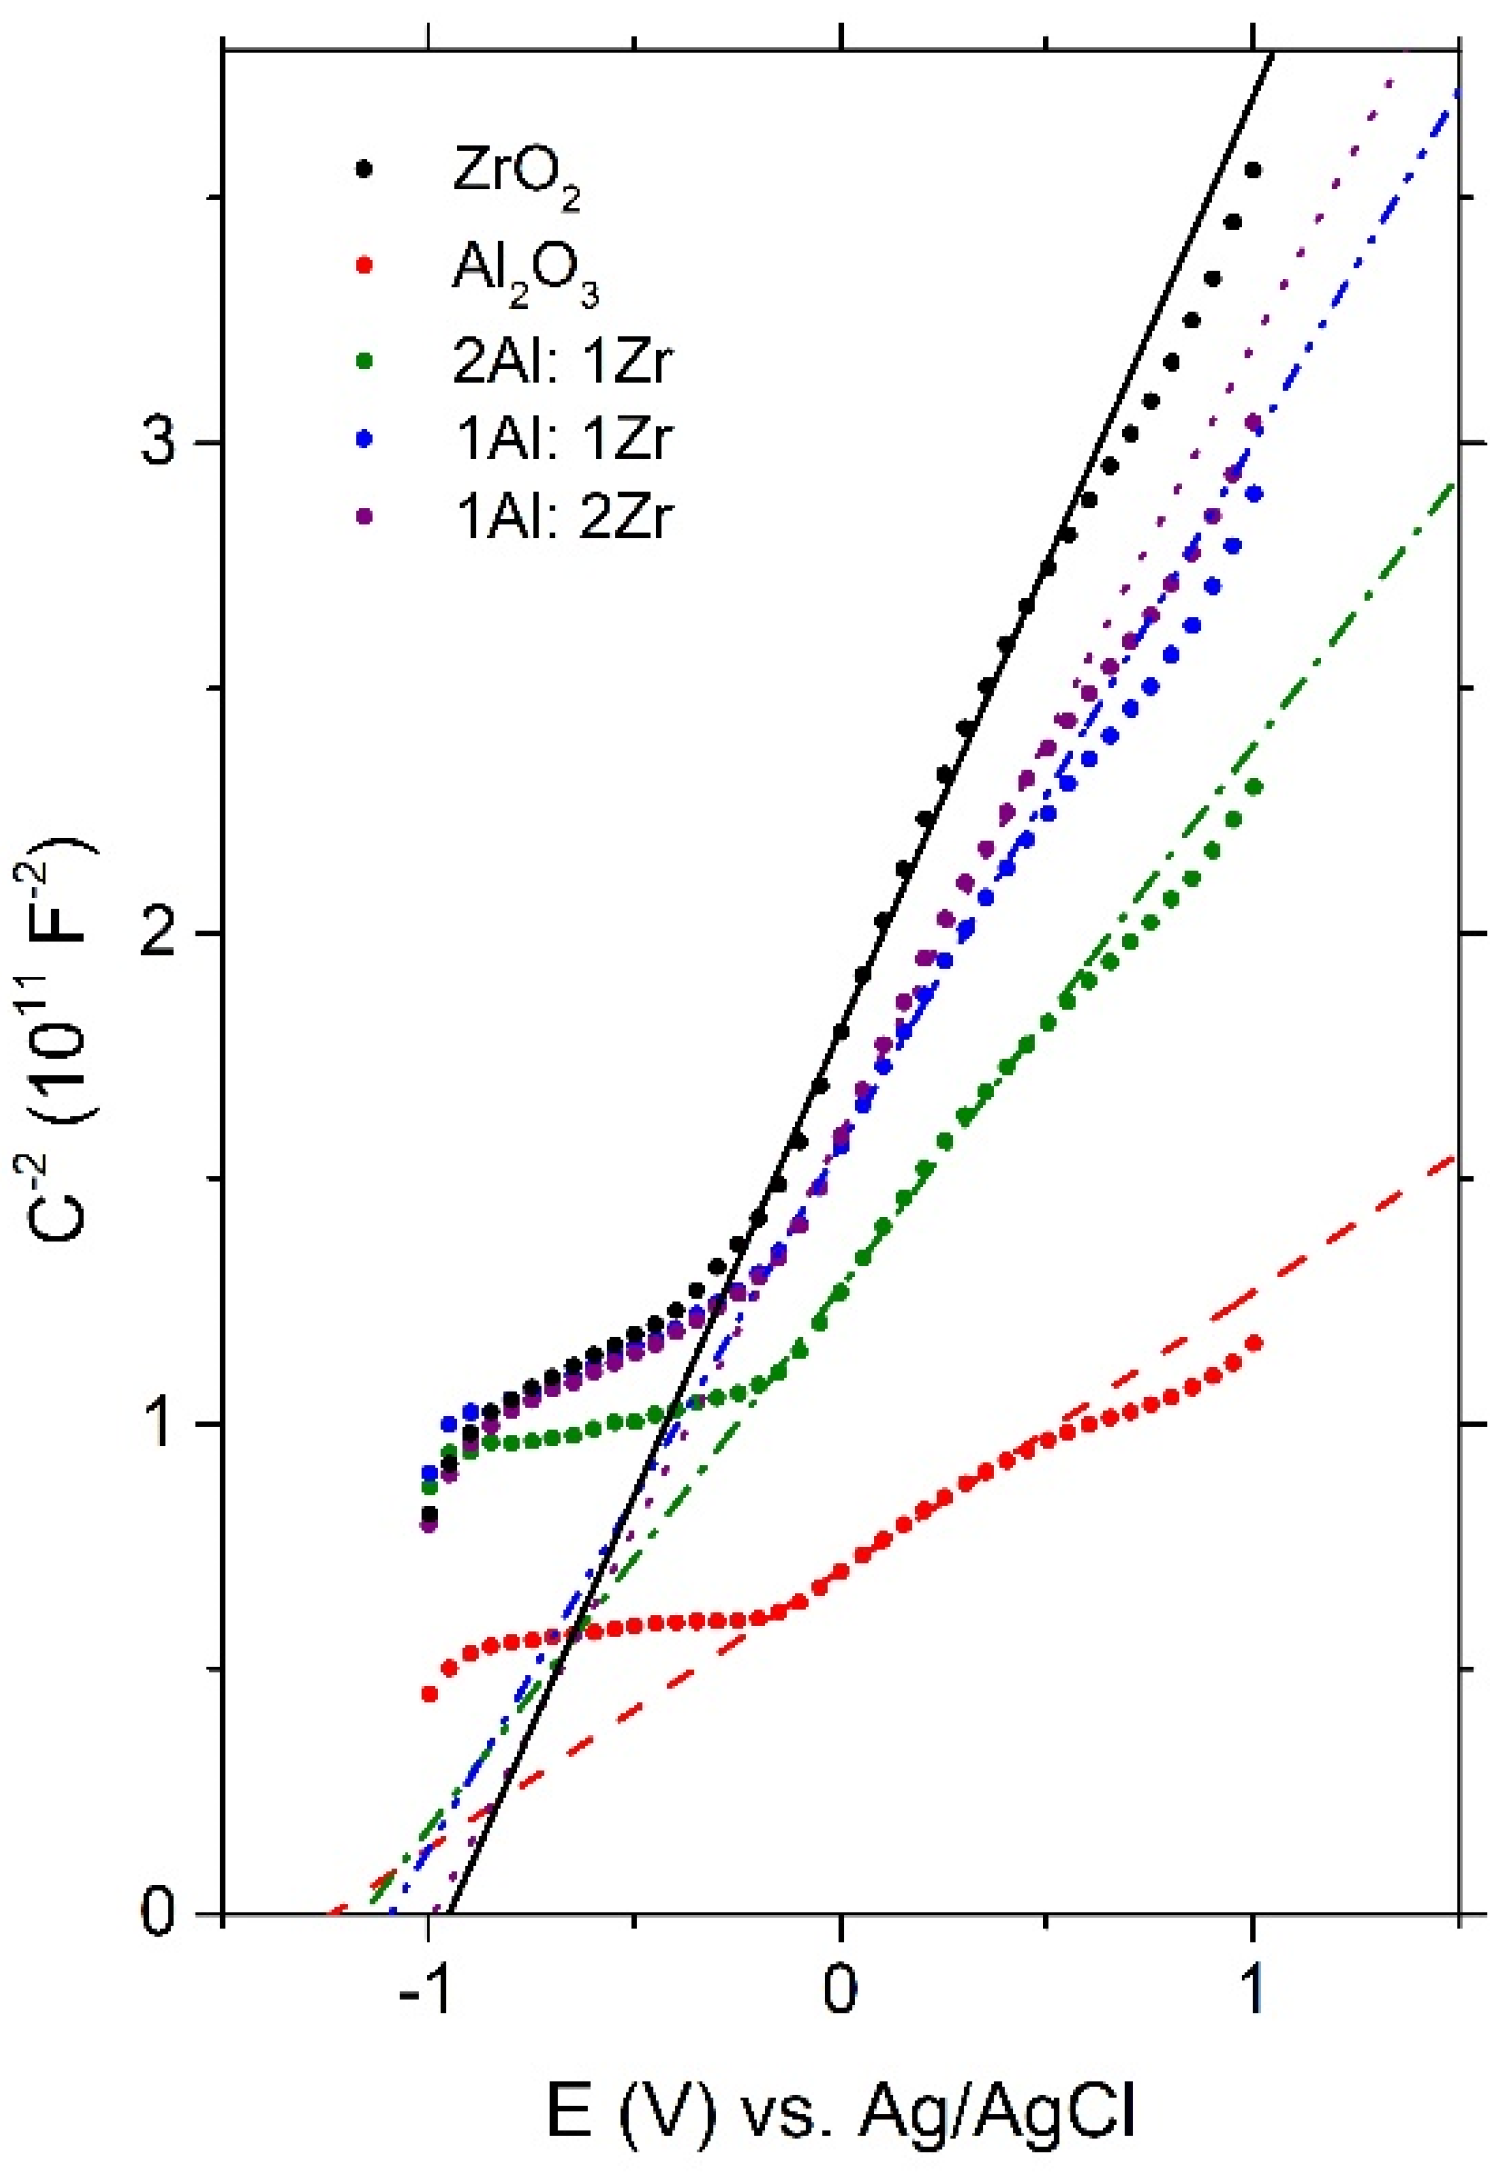
3.4. Determination of Flat Band Potentials of Oxide Samples (Mott–Schottky Plots)

The Mott–Schottky measurements were performed in order to determine flat band potentials and the recorded plots are presented in Figure 5.
The Mott–Schottky relationship, Equation (1), is given as [34]:
1 C 2 = 2 ε ε 0 e N E E f b k T e
where C is the interfacial capacitance, ε is the relative electric permittivity of a sample, ε0 is the electric permittivity of vacuum, e is the elementary charge, N is the charge carrier density, E is the applied potential, Efb is the flat band potential, k is the Boltzmann constant and T is the absolute temperature.
Table 2. Flat band potentials of investigated samples determined from Mott–Schottky plots and band gap energies estimated from Tauc’s plots (Figure 3b).
SampleEfb (V) vs. SHE 1ECB(V)EVB(V)Band Gap Energy (eV)
Al2O3−1.04−1.142.763.9
2Al2O3–1ZrO2 −0.91−1.052.753.8
1Al2O3–1ZrO2 −0.88−1.003.104.1
1Al2O3–2ZrO2 −0.78−0.923.584.5
ZrO2−0.74−0.943.964.9
1 SHE—standard hydrogen electrode.
The Mott–Schottky plot gave a straight line for the C−2 vs. E plot with interception with a potential axis at Efb. The positive slope of the plots indicated that all investigated samples were n-type semiconductors. The obtained values of flat band potential are given with respect to SHE, and are listed in Table 2.
The value of flat band potential shifted toward more positive values with the increase of ZrO2 content in the composites, with the lowest/the most positive value obtained for pure ZrO2. The values of flat band potential reported for ZrO2 in the literature varied greatly (−0.485V (NHE) −0.69 V vs. Ag/AgCl/3 M KCl [33] or −1.25 V vs. Ag/AgCl [35]), depending on the synthesis procedure and the final product properties. It is considered that the conductive band (ECB) for n-type semiconductors is located at values from 0.1 V to 0.2 V more negative than Efb [36,37]. The valence band (EVB) potential could be obtained by adding the value of the band gap obtained from the Tauc’s plot. All calculated potentials are given in Table 2.

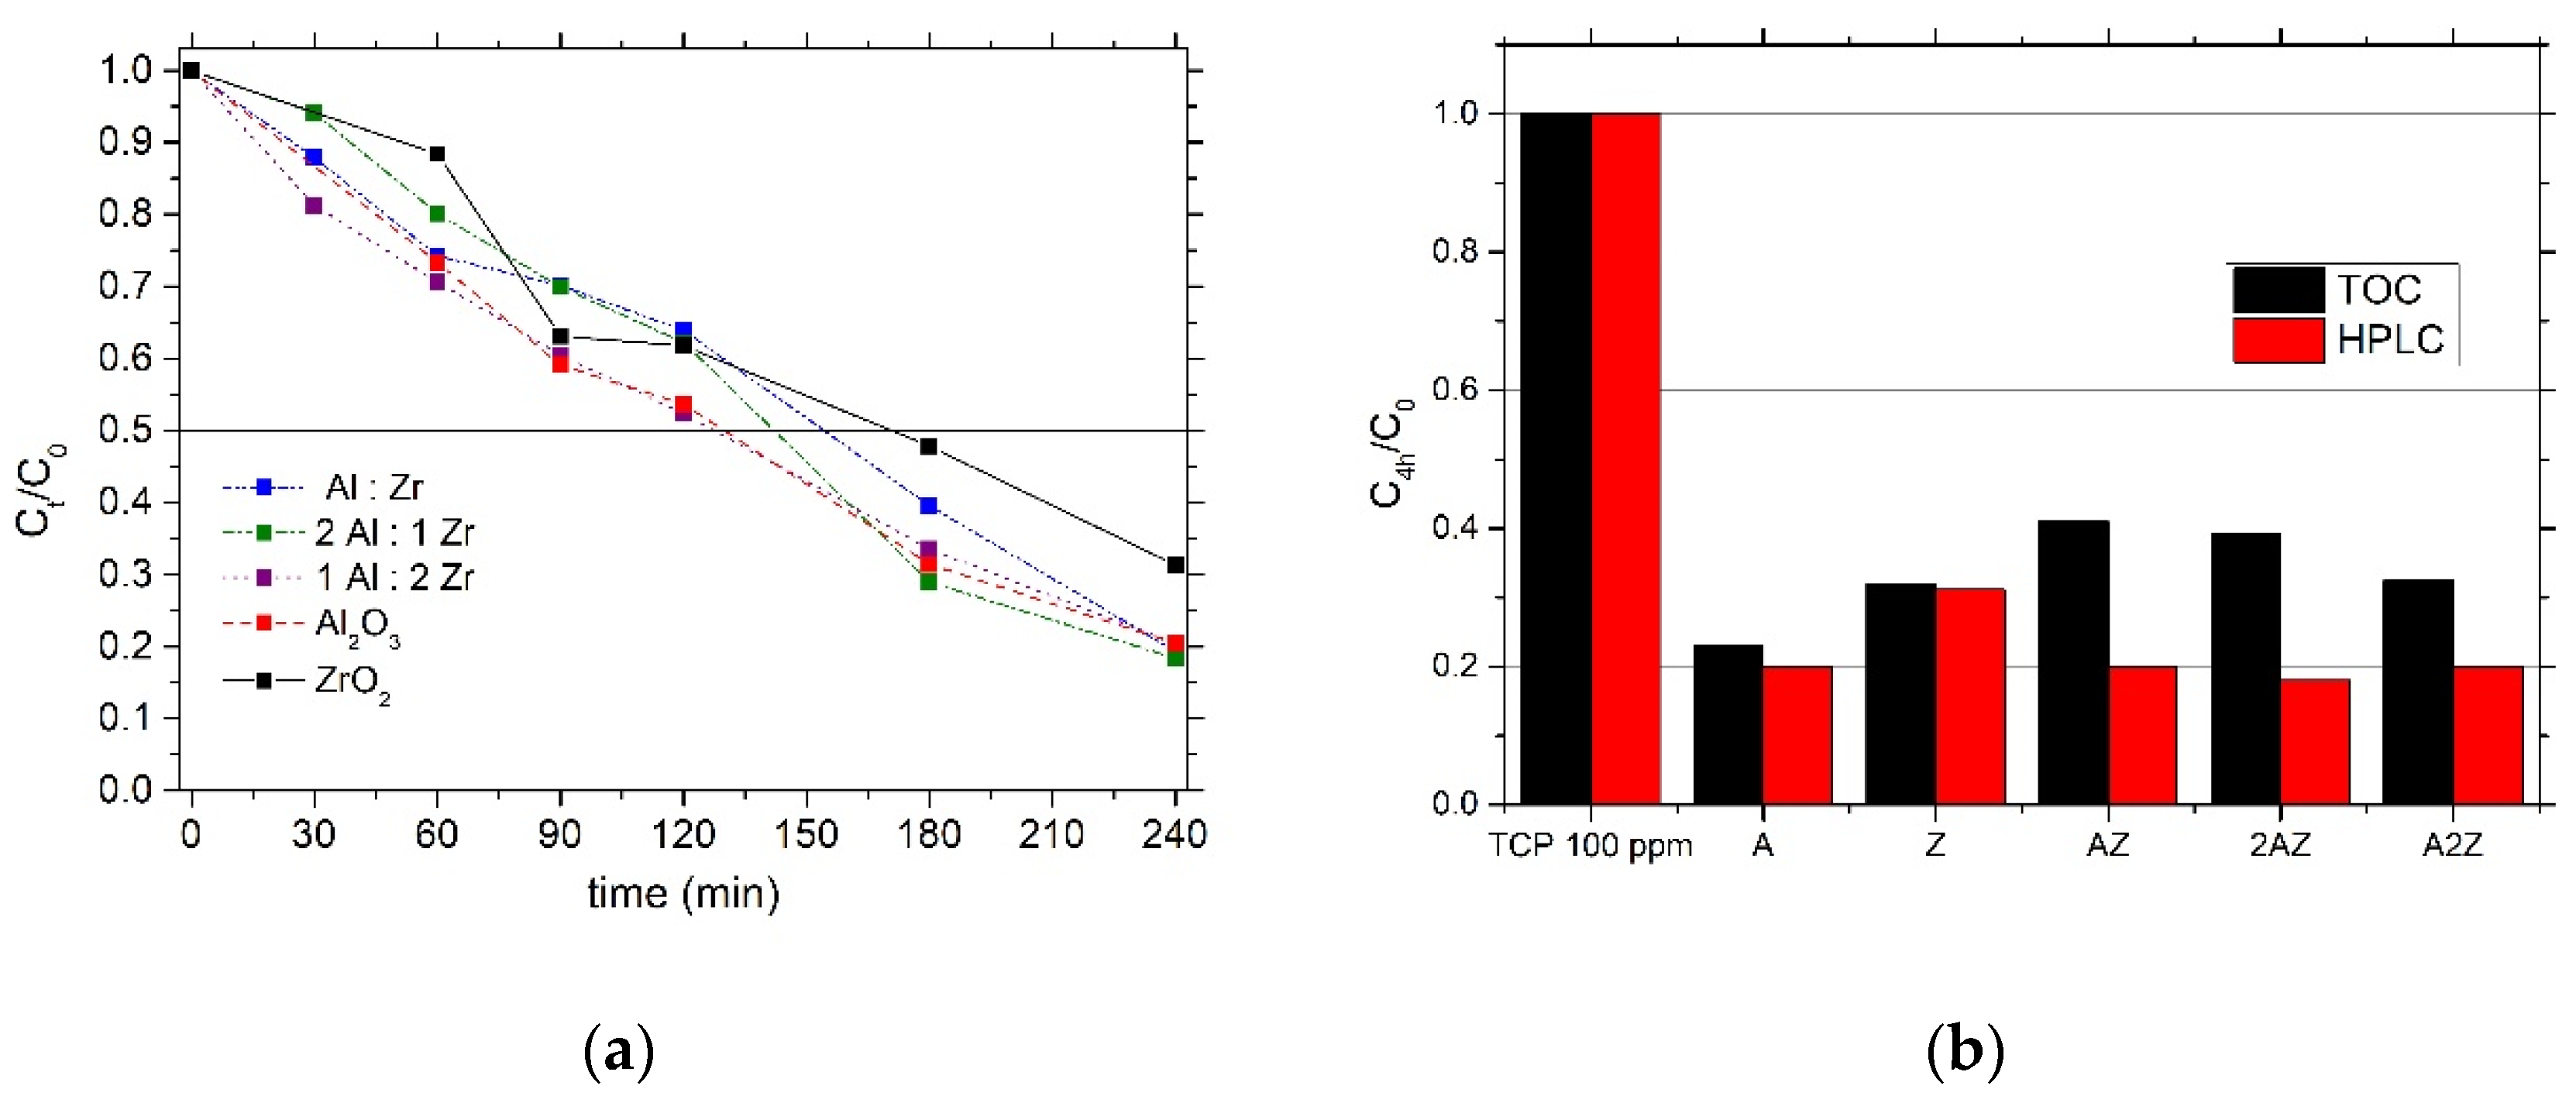
3.5. Evaluation of Photocatalytical Efficacies of Pure and Composite Oxides

In the majority of studies regarding binary oxides used as photocatalysts, they are combined in order to increase the number of available active sites on the binary oxide surface compared to pure oxides, for the adsorption of pollutant molecules [33]. Phenol and its derivatives are common environmental pollutants [38], so trichlorophenol was selected for a study of the photocatalytic efficiencies of the synthesized samples as one of the most toxic compounds. Kinetic curves of photocatalytic degradation of 2, 4, 6-trichlorophenol (TCP) in the first 4 h of illumination are presented in Figure 6a.
Adsorption of TCP on pure and composite samples was also followed in the same time window (0–4 h), presented in Figure S3 in Supplementary Material, and showed a max of about 20% for pure oxides and less than 10% for composite oxides. After 1 h of adsorption–desorption equilibration in the dark, as noted in the experimental part, before illumination, about 10% of TCP was removed when ZrO2 was used, 15% when Al2O3 was used (Table 1: the largest specific surface area of 280 m2g−1 and pore volume 0.54 cm3g−1, combined) and composites adsorbed less than 10%.
Bearing in mind values of band gap energies of both oxides, it can be safely presumed that whole photocatalytic activity induced by simulated solar light originates from defects/oxygen vacancies/color centers, discussed in the former part of the manuscript (Section 3.2). This is a common situation in the case of wide band oxide photocatalysts [7,8,12]. As can be seen in Figure 6a, TCP can be effectively removed from the aqueous solution, due to adsorption/photocatalytic degradation using all synthesized samples. After 4 h of illumination, between 70% (ZrO2) and 80% (all other samples) of TCP was removed from the solutions. These results are similar with results from our previous publications as presented in Table S5 [7,8,12]. Considering flat band potentials obtained from Mott–Schottky plots, all oxide samples (pure and composites) were able to generate all important radical species capable to degrade TCP: O 2   a d s / O 2 (−0.33 V, NHE), O H a d s / O H (+1.9 V, NHE) and H 2 O ads/ O H (+2.32 V, NHE) [5]. It should be stressed that pure oxides had greater adsorptions, so photodegradation is most probably lower compared to composites. If we consider composites only, the best adsorber/photocatalyst was (2Al:1Zr) > (1Al:2Zr) ≥ (1Al:1Zr).
The effective band gap energy of the 2Al:1Zr composite is the smallest compared to other composites; others have Eg > 4 eV, so that can be considered as the reason for better efficacy. All observed band gap energies are the measure of energy levels of defects in the oxide samples, which are present in high concentrations due to the method of synthesis and the close contact of the precursors. However, it should be borne in mind that oxide surfaces are capable of complexation with phenol-like molecules [39,40], making the absorption of light more intensive in the sub-band gap energy part of the spectra.
In Figure 6b, measurements of Total Organic Carbon present in the solutions after 4 h of irradiation are presented. This method keeps count of all present organic molecules, TCP and intermediates in the samples. Similar results were obtained: pure alumina showed the highest percent of removed organic compounds, almost 80%, most probably due to adsorption on the surface of the alumina powder, the zirconia result is also better than composites at about 68%. All others showed removal results between 60 and 70% of the initial value of TCP in the solutions. A slightly lower efficacy compared to results obtained using HPLC was observed, which is expected bearing in mind that this method sees all intermediates; obviously, composite oxides induced the formation of more intermediates in the experimental solutions. If composite oxides should be ranked, then the best result is gained with (1Al:2Zr) > (2Al:1Zr) ≥ (1Al:1Zr).

4. Conclusions

Alumina/zirconia composites with different Al/Zr ratios were synthesized in order to obtain materials with improved properties compared to pure oxides. The method of choice resulted in alumina with characteristics of the cubic γ-phase, which was lost with the first addition of zirconia precursor. The composite oxide with two times more Al than Zr atoms was almost amorphous, growing content of Zr showed an initial metastable tetragonal zirconia phase. Pure zirconia crystallizes in a combination of tetragonal and monoclinic crystalline phases. The nitrogen sorption data confirmed the mesoporosity of the obtained composites and that the Al/Zr ratio strongly affected the texture, as well as the crystalline phase composition of the samples. SEM measurements showed the presence of agglomerates with random shapes and sizes, in the micrometer range, with submicron particles. Crystalline domains of the particles were calculated from XRD, for all oxide samples particles were smaller than 11 nm. UV/Vis reflection absorption measurements and Tauc’s plots gave an estimation of effective band gaps of all samples: pure alumina had Eg ~3.9 eV (defects) and zirconia 4.9 eV, composite oxides had 3.8, 4.1 and 4.5 eV, increasing with increased Zr content. Mott–Schottky plots were used for the determination of Efb: the most negative value was measured for alumina −1.04V (SHE) and the most positive for zirconia −0.74 V. Composite samples had the values: −0.91V, -0.88V and -0.78V, becoming more positive with increasing Zr content in the sample. All oxide samples succeeded in the removal of TCP from experimental solutions, partially due to adsorption, and partially due the photocatalytic process. The most efficient sample was pure alumina, mainly because its adsorption capacity. Pure zirconia also showed an excellent result, but removed only 70% of the initial TCP concentration after 4 h of illumination. Composite oxides had similar results as alumina. TOC measurements showed the presence of a greater concentration of intermediates when composite oxides were used as photocatalysts.

Supplementary Materials

The following supporting information can be downloaded at: https://www.mdpi.com/article/10.3390/photochem2040058/s1, Figure S1: N2adsorption/desorption isotherms of all samples; Figure S2: Pore size distributions patterns of all samples; Figure S2: Adsorption curves of TCP all oxide samples in the dark; Table S1: Composition of pure zirconia powder, results obtained from SEM/EDX; Table S2: Composition of pure alumina powder, results obtained from SEM/EDX; Table S3: Composition of 2Al2O3: 1ZrO2 nanocomposite powder, results obtained from SEM/EDX; Table S4: Composition of 1Al2O3: 2ZrO2 nanocomposite powder, results obtained from SEM/EDX; Table S5: Results obtained in this study together with our previous results of photocatalytical degradation of TCP in aqueous solutions with similar zirconia based photocatalysts, after 4 h of illumination by Simulated Solar light. High Performance Liquid Chromatography (HPLC) was used for measurement of TCP concentrations.

Author Contributions

Conceptualization, M.I.Č. and T.B.N.; formal analysis, all T.D.V., M.V.C., N.D.A., T.B.N. and Z.D.M.; investigation, T.D.V., M.V.C., N.D.A., T.B.N., Z.D.M. and M.I.Č.; validation, T.D.V., M.V.C., N.D.A., T.B.N., Z.D.M. and M.I.Č.; monitoring, M.I.Č.; writing—original draft preparation, M.I.Č., T.B.N. and Z.D.M.; writing—review and editing, T.D.V., M.V.C., N.D.A., T.B.N., Z.D.M. and M.I.Č. All authors have read and agreed to the published version of the manuscript.

Funding

This research was funded by the Ministry for Education, Science and Technological development of the Republic of Serbia, Contract No 451-03-68/2022-14-200026 and 451-03-68/2022-14-200017.

Data Availability Statement

Not applicable.

Acknowledgments

The authors are grateful to V. Pavlović for SEM measurements and M. Mitrić for XRD measurements.

Conflicts of Interest

The authors declare no conflict of interest.

References

  1. Barber, J. Photosynthetic Energy Conversion: Natural and Artificial. Chem. Soc. Rev. 2009, 38, 185–196. [Google Scholar] [CrossRef] [PubMed]
  2. Available online: www.theworldcounts.com (accessed on 1 September 2022).
  3. Priya, A.K.; Suresh, R.; Kumar, P.S.; Rajendran, S.; Vo, D.-V.N.; Soto-Moscoso, M. A Review on Recent Advancements in Photocatalytic Remediation for Harmful Inorganic and Organic Gases. Chemosphere 2021, 284, 131344. [Google Scholar] [CrossRef] [PubMed]
  4. Lu, Z.; Xu, Y.; Akbari, M.Z.; Liang, C.; Peng, L. Insight into Integration of Photocatalytic and Microbial Wastewater Treatment Technologies for Recalcitrant Organic Pollutants: From Sequential to Simultaneous Reactions. Chemosphere 2022, 295, 133952. [Google Scholar] [CrossRef] [PubMed]
  5. Fujishima, A.; Zhang, X.; Tryk, D. TiO2 Photocatalysis and Related Surface Phenomena. Surf. Sci. Rep. 2008, 63, 515–582. [Google Scholar] [CrossRef]
  6. Carević, M.; Abazović, N.D.; Savić, T.; Novaković, T.B.; Mojović, M.D.; Čomor, M.I. Structural, Optical and Photodegradation Properties of Pure and Fe-Doped Titania Nanoparticles Probed Using Simulated Solar Light. Ceram. Int. 2016, 42, 1521–1529. [Google Scholar] [CrossRef]
  7. Carević, M.V.; Abazović, N.D.; Novaković, T.B.; Pavlović, V.B.; Čomor, M.I. Zirconium Dioxide Nanopowders with Incorporated Si4+ Ions as Efficient Photocatalyst for Degradation of Trichlorophenol Using Simulated Solar Light. Appl. Catal. B-Environ. 2016, 195, 112–120. [Google Scholar] [CrossRef]
  8. Carević, M.V.; Savić, T.D.; Abazović, N.D.; Mojović, M.D.; Novaković, T.B.; Čomor, M.I. Effect of Fe3+ Ion Doping on Photocatalytic Ability of Nanozirconia Ceramic to Degrade 2,4,6-Trichlorophenol. Ceram. Int. 2020, 46, 6820–6827. [Google Scholar] [CrossRef]
  9. Abramović, B.; Šojić, D.; Anderluh, V.; Abazović, N.; Čomor, M. Nitrogen-Doped TiO2 Suspensions in Photocatalytic Degradation of Mecoprop and (4-Chloro-2-Methylphenoxy)Acetic Acid Herbicides Using Various Light Sources. Desalination 2009, 244, 293–302. [Google Scholar] [CrossRef]
  10. Abazović, N.D.; Montone, A.; Mirenghi, L.; Janković, I.A.; Čomor, M.I. TiO2 Doped with Nitrogen: Synthesis and Characterization. J. Nanosci. Nanotechno. 2008, 8, 613–618. [Google Scholar] [CrossRef] [PubMed]
  11. Čomor, M.I.; Janković, I.A.; Savić, T.D.; Abazović, N.D.; Carević, M.V. Surface Modification of Anatase Nanoparticles with Catecholate- and Salicylate-type Ligands: A Novel Tool for Tuning Optical Properties. In Advances in Materials Science Research; Wythers, M.C., Ed.; Nova Science: Hauppauge, NY, USA, 2016; Volume 22, pp. 157–207. [Google Scholar]
  12. Carević, M.V.; Abazović, N.D.; Savić, T.D.; Novaković, T.B.; Pjević, D.J.; Čomor, M.I. Binary Oxide Ceramics for Enhanced Phenols Degradation under Simulated Solar Light. J. Am. Ceram. Soc. 2017, 101, 1420–1431. [Google Scholar] [CrossRef]
  13. Radoičić, M.; Šaponjić, Z.; Janković, I.A.; Ćirić-Marjanović, G.; Ahrenkiel, S.P.; Čomor, M.I. Improvements to the Photocatalytic Efficiency of Polyaniline Modified TiO2 Nanoparticles. Appl. Catal. B-Environ. 2013, 136–137, 133–139. [Google Scholar] [CrossRef]
  14. Hussain, I.; Jalil, A.A.; Hamid, M.Y.S.; Hassan, N.S. Recent Advances in Catalytic Systems in the Prism of Physicochemical Properties to Remediate Toxic CO Pollutants: A State-of-The-Art Review. Chemosphere 2021, 277, 130285. [Google Scholar] [CrossRef] [PubMed]
  15. Deshpande, P.A.; Polisetti, S.; Madras, G. Rapid Synthesis of Ultrahigh Adsorption Capacity Zirconia by a Solution Combustion Technique. Langmuir 2011, 27, 3578–3587. [Google Scholar] [CrossRef] [PubMed]
  16. Liu, T.; Zhang, X.; Yuan, L.; Yu, J. A Review of High-Temperature Electrochemical Sensors Based on Stabilized Zirconia. Solid State Ionics 2015, 283, 91–102. [Google Scholar] [CrossRef]
  17. Shim, J.H.; Chao, C.-C.; Huang, H.; Prinz, F.B. Atomic Layer Deposition of Yttria-Stabilized Zirconia for Solid Oxide Fuel Cells. Chem. Mater. 2007, 19, 3850–3854. [Google Scholar] [CrossRef]
  18. Basahel, S.N.; Ali, T.T.; Mokhtar, M.; Narasimharao, K. Influence of Crystal Structure of Nanosized ZrO2 on Photocatalytic Degradation of Methyl Orange. Nanoscale Res. Lett. 2015, 10, 73. [Google Scholar] [CrossRef] [Green Version]
  19. López, M.C.U.; Lemus, M.A.A.; Hidalgo, M.C.; González, R.L.; Owen, P.Q.; Oros-Ruiz, S.; López, S.A.U.; Acosta, J. Synthesis and Characterization of ZnO-ZrO2 Nanocomposites for Photocatalytic Degradation and Mineralization of Phenol. J. Nanomater. 2019, 2019, 1015876. [Google Scholar] [CrossRef] [Green Version]
  20. Ziółek, M.; Cohen, B.; Yang, X.; Sun, L.; Paulose, M.; Varghese, O.K.; Grimes, C.A.; Douhal, A. Femtosecond to Millisecond Studies of Electron Transfer Processes in a Donor–(π-Spacer)–Acceptor Series of Organic Dyes for Solar Cells Interacting with Titania Nanoparticles and Ordered Nanotube Array Films. Phys. Chem. Chem. Phys. 2012, 14, 2816. [Google Scholar] [CrossRef]
  21. Karunakaran, C.; Dhanalakshmi, R.; Gomathisankar, P. Photomineralization of Phenol on Al2O3: Synergistic Photocatalysis by Semiconductors. Res. Chem. Intermediat. 2010, 36, 361–371. [Google Scholar] [CrossRef]
  22. Tzompantzi, F.; Piña, Y.; Mantilla, A.; Aguilar-Martínez, O.; Galindo-Hernández, F.; Bokhimi, X.; Barrera, A. Hydroxylated Sol–Gel Al2O3 as Photocatalyst for the Degradation of Phenolic Compounds in Presence of UV Light. Catal. Today 2014, 220–222, 49–55. [Google Scholar] [CrossRef]
  23. Piña-Pérez, Y.; Tzompantzi-Morales, F.; Pérez-Hernández, R.; Arroyo-Murillo, R.; Acevedo-Peña, P.; Gómez-Romero, R. Photocatalytic Activity of Al2O3 Improved by the Addition of Ce3+/Ce4+ Synthesized by the Sol-Gel Method. Photodegradation of Phenolic Compounds Using UV Light. Fuel 2017, 198, 11–21. [Google Scholar] [CrossRef]
  24. Piña-Pérez, Y.; Aguilar-Martínez, O.; Oros-Ruíz, S.; Gómez, R.; Tzompantzi, F. Commercial Aluminum Oxides with Different Crystalline Structures Efficient for the Mineralization of Phenolic Pollutants. J. Photochem. Photobiol. A 2018, 353, 409–415. [Google Scholar] [CrossRef]
  25. Yoldas, B.E. Alumina Gels That Form Porous Transparent Al2O3. J. Mater. Sci. 1975, 10, 1856–1860. [Google Scholar] [CrossRef]
  26. Lippens, B. Studies on Pore Systems in Catalysts I. The Adsorption of Nitrogen; Apparatus and Calculation. J. Catal. 1964, 3, 32–37. [Google Scholar] [CrossRef]
  27. Sing, K.S.W. Reporting Physisorption Data for Gas/Solid Systems with Special Reference to the Determination of Surface Area and Porosity (Recommendations 1984). Pure Appl. Chem. 1985, 57, 603–619. [Google Scholar] [CrossRef]
  28. Cong, Y.; Dong, B.; Yu, N.; He, Y.; Zhao, Y.; Yang, Y. Enhanced Upconversion Emission in ZrO2–Al2O3 Composite Oxide. Dalton Trans. 2016, 45, 6627–6633. [Google Scholar] [CrossRef]
  29. Turakulova, A.O.; Golubina, E.V.; Lokteva, E.S.; Korotkov, A.V.; Lunin, V.V. ZrO2-Al2O3 Binary Oxides as Promising Supports for Palladium Catalysts of Hydrodechlorination. Russ. J. Phys. Chem. A 2011, 85, 402–407. [Google Scholar] [CrossRef]
  30. Thommes, M.; Kaneko, K.; Neimark, A.V.; Olivier, J.P.; Rodriguez-Reinoso, F.; Rouquerol, J.; Sing, K.S.W. Physisorption of Gases, with Special Reference to the Evaluation of Surface Area and Pore Size Distribution (IUPAC Technical Report). Pure Appl. Chem. 2015, 87, 1051–1069. [Google Scholar] [CrossRef] [Green Version]
  31. Kumar, S.; Ojha, A.K. Oxygen Vacancy Induced Photoluminescence Properties and Enhanced Photocatalytic Activity of Ferromagnetic ZrO2 Nanostructures on Methylene Blue Dye under Ultra-Violet Radiation. J. Alloy Compd. 2015, 644, 654–662. [Google Scholar] [CrossRef]
  32. Amirsalari, A.; Shayesteh, S.F. Effects of pH and calcination temperature on structural and optical properties of alumina nanoparticles. Superlattice Microst. 2015, 82, 507–524. [Google Scholar] [CrossRef]
  33. Guerrero-Araque, D.; Ramírez-Ortega, D.; Acevedo-Peña, P.; Tzompantzi, F.; Calderón, H.A.; Gómez, R. Interfacial Charge-Transfer Process across ZrO2-TiO2 Heterojunction and Its Impact on Photocatalytic Activity. J. Photochem. Photobiol. A 2017, 335, 276–286. [Google Scholar] [CrossRef] [Green Version]
  34. Bard, A.L.; Foulkner, L.R. Electrochemical Methods Fundamentals and Applications; John Wiley & Sons: New York, NY, USA, 2001. [Google Scholar]
  35. Ismael, M.; Wu, Y.; Wark, M. Photocatalytic Activity of ZrO2 Composites with Graphitic Carbon Nitride for Hydrogen Production under Visible Light. New J. Chem. 2019, 43, 4455–4462. [Google Scholar] [CrossRef]
  36. Yu, L.; Zhang, X.; Li, G.; Cao, Y.; Shao, Y.; Li, D. Highly Efficient Bi2O2CO3/BiOCl Photocatalyst Based on Heterojunction with Enhanced Dye-Sensitization under Visible Light. Appl. Catal. B-Environ. 2016, 187, 301–309. [Google Scholar] [CrossRef]
  37. Kennedy, J.H.; Frese, K.W. Flatband Potentials and Donor Densities of Polycrystalline α - Fe2O3 Determined from Mott-Schottky Plots. J. Electrochem. Soc. 1978, 125, 723–726. [Google Scholar] [CrossRef]
  38. Dionysiou, D.D.; Khodadoust, A.P.; Kern, A.M.; Suidan, M.T.; Baudin, I.; Laîné, J.-M. Continuous-Mode Photocatalytic Degradation of Chlorinated Phenols and Pesticides in Water Using a Bench-Scale TiO2 Rotating Disk Reactor. Appl. Catal. B-Environ. 2000, 24, 139–155. [Google Scholar] [CrossRef]
  39. Karunakaran, C.; Dhanalakshmi, R. Semiconductor-Catalyzed Degradation of Phenols with Sunlight. Sol. Energy Mater. Sol. Cells 2008, 92, 1315–1321. [Google Scholar] [CrossRef]
  40. Hassan, N.S.; Jalil, A.A. A Review on Self-Modification of Zirconium Dioxide Nanocatalysts with Enhanced Visible-Light-Driven Photodegradation of Organic Pollutants. J. Hazard. Mater. 2022, 423, 126996. [Google Scholar] [CrossRef]
Figure 1. XRD patterns of the pure γ-Al2O3, ZrO2 and alumina/zirconia composites with different Al/Zr ratios (2Al:1Zr, 1Al:1Zr and 1Al:2Zr), after annealing at 500 °C. XRD peaks were denoted by using γ-Al2.144O3.2, (PDF No. 79-1558), monoclinic ZrO2 (JCPDS 65-1025) and metastable tetragonal ZrO2 crystal phase (JCPDS 81-1544).
Photochem 02 00058 g001
Figure 2. SEM micrographs of pure oxides: (a) Al2O3 and (b) ZrO2; and two oxide composites: (c) 2Al:1Zr and (d) 1Al:2Zr; elemental mapping of (c,d) are presented as insets, pink-Al, green-Zr and yellow-O.
Photochem 02 00058 g002
Figure 3. (a) Absorption spectra (obtained using Kubelka–Munk transformation of DRS) and (b) Tauc’s plots of pure alumina and zirconia and of binary oxide composites, in order to estimate band gap energies of photocatalysts.
Photochem 02 00058 g003
Figure 4. PL spectra of pure and composite oxide samples.
Photochem 02 00058 g004
Figure 5. The Mott–Schottky plots of the investigated sample measured at 100 Hz in 0.1 M Na2SO4 solution (pH = 5.6).
Photochem 02 00058 g005
Figure 6. (a) Kinetic curves of photocatalytic degradation of TCP, obtained using HPLC (High Performance Liquid Chromatography); (b) TOC (Total Organic Carbon measurements) results of photocatalytic degradation of TCP, obtained after 4 h of illumination in the stream of oxygen.
Photochem 02 00058 g006
Table 1. Textural properties of the pure γ-alumina (A-500), ZrO2 and alumina/zirconia composites with different Al/Zr ratios (2Al:1Zr, 1Al:1Zr, 1Al:2Zr).
SampleSBET
(m2g−1)
Vp0.98
(cm3g−1)
Vp micro
(cm3g−1)
Dmax1
(nm)
Dmax2
(nm)
D (nm), from FWHM/XRD
Al2O3 2800.4410.1044.9 3.1
2 Al:1 Zr1710.1240.0563.26.3NA
1 Al:1 Zr1450.1540.0443.26.45.7
1 Al:2 Zr900.1670.0373.87.27.5
ZrO2550.2280.01910.9 10–11
Publisher’s Note: MDPI stays neutral with regard to jurisdictional claims in published maps and institutional affiliations.

