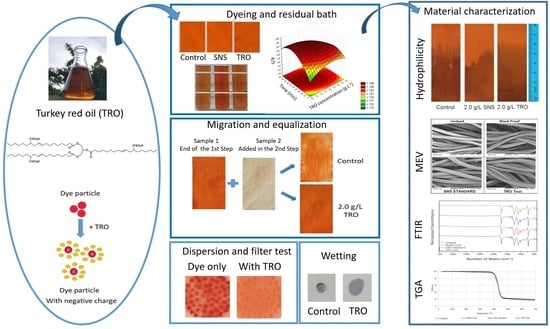
1. Introduction
The textile industry has faced strong competition from products imported at low prices from eastern countries. For this industry to remain competitive, textile companies have sought defensive strategies to differentiate their products [
1].
As environmental pollution is a problem faced worldwide [
2], there is a growing ecological concern with the textile dyeing and finishing industries, as they are responsible for high environmental impacts. This is due to high water consumption, high energy use and a large use of chemicals, many of which are dangerous to human health and the environment. For this reason, in recent years, efforts have been made to implement natural and safer molecules in these processes [
3].
To guarantee the sustainable growth of the textile industry, the development of a dyeing process with ecological textiles is essential [
4]. Therefore, it is important to establish environmental policies that encourage the development of new technologies that emphasize sustainability [
5].
Polyester fibers, synthetic fibers formed from polymers that use resins derived from petroleum as a raw material [
6,
7], face a challenging dyeing process, with high energy consumption and a significant amount of water required. The most common dyes used to dye polyester fibers are disperse dyes, which are practically insoluble in water. Thus, it is necessary to use dispersing agents to keep them dispersed in water, keeping the dyes in fine dispersion and preventing the occurrence of dyeing particle coalescence. To obtain a dyeing with an adequate level of absorption, it is necessary to heat it up to temperatures close to 130 °C. Recent studies have looked for alternative processes for dyeing polyester with non-hazardous and more ecological compounds that also require less energy in the overall dyeing process [
8,
9,
10].
There is a growing demand for renewable resources due to the depletion of oil reserves. Therefore, the importance of renewable resources is rapidly increasing, and one of the sources of renewable and sustainable fatty acids is seed oils, which can be used to prepare a series of oleochemicals, which replace petrochemicals for industrial applications [
11].
Turkey red oil (TRO) is increasingly becoming an important bio-based feedstock for industrial applications. The presence of a hydroxyl group, a double bond, a carboxylic group and a long-chain hydrocarbon in ricinoleic acid (one of the main components of the oil) offers several possibilities to transform the compound into different materials. The oil is therefore a potential alternative to petroleum-based starting chemicals to produce materials with various properties [
12].
According to Kosolia et al. [
13] and Gharanjig et al. [
14], there are several options under study for the replacement of derivatives of the compound sodium naphthalene sulfonate (SNS), which is a commonly used commercial dispersant derived from petroleum. Castor oil has the ability to moisten and disperse dyes, pigments and fillers [
15]. Sulfonation, which is the reaction with sulfuric acid, is among the main chemical reactions of castor oil [
16,
17], where sulfuric acid esters are obtained, in which the hydroxyl group of ricinoleic acid is esterified, thus providing characteristics specific to the TRO, which is widely used in the textile industry [
12].
The present work aims to evaluate TRO as a renewable dispersant and leveling option in polyester dyeing with disperse dye. Thus, the goal is to contribute to the community, seeking to study the variables that allow the development of a more sustainable process compared to the standard currently adopted by the industries.
2. Materials and Methods
This research used Interlock knitted fabric, trade name Dry Sport, with 100% PES (polyester) composition, average weight of 130 g/m2, yarn count of 75 DEN/72 filaments and purged at 60 °C with 1.0 g·L−1 of WK Fiberclean LC 8 (anionic surfactant supplied by the company Werken Química, Indaial, Brazil), supplied by the company Texneo, Indaial, Brazil. The dye used was Large Molecule-Disperse Orange 29 Brown Colorpes D-FRL 200%. Turkey red oil (TRO) and sodium naphthalene sulfonate (SNS), supplied by Werken Química, Indaial, Brazil, were used for comparative tests as dispersants and leveling agents.
A statistical design of rotational central composite was carried out, with a factorial experiment base 2
2, with α = √2, plus four points of combinations of levels −1 and +1 and the central point (
Table 1) to achieve greater model robustness. The tests were carried out at a standard temperature of 130 °C and pH of 4.5–5.0, and the values obtained in the color analysis were considered as the response. All treatments were performed in triplicate. Subsequently, the study of temperature variation was carried out. Statistical analysis of results was performed using analysis of variance (ANOVA) with 5% significance, with the aid of Statistica 13.0 software.
The dyeing tests were performed in a Laboratory Dyeing Machine, model IR Dyer, brand Texcontrol. The dyeing process was started at room temperature, with 5 g of polyester, 1.0% owf (on weight of fiber) of dye. The material-to-liquor ratio was 1:10. As the standard sample, 2.0 g·L
−1 of SNS was used, while for other tests, the concentration of TRO was varied, with heating at 35 °C/min until it reached 130 °C, then remaining for various process times, as shown in
Table 1. After the process time, the dyeing solution was cooled and removed (which was reserved for color measurements by absorbance). A new solution was used for reductive washing, containing 2.0 g·L
−1 of 100% sodium hydroxide and 4.0 g·L
−1 WK Redux ECO 120, heated to 70 °C, with a gradient of 5 °C/min, remaining for 20 min at 70 °C. Then, the reductive solution was released and a new bath was added containing 0.6 g·L
−1 acetic acid, remaining at room temperature for 10 min. The solution was discharged, and the polyester fabric was dried at 120 °C and subsequently thermofixed with a stenter at 160 °C for 30 s.
To verify the influence of temperature on the dyeing process, tests were carried out with dyeing at 120 °C and 30 min. Furthermore, to understand the exhaustion process, dyeing tests were carried out at temperatures of 80 °C, 100 °C and 115 °C.
Table 2 shows the chemicals and processes.
After the dyeing, the baths’ absorbance was measured to verify the depletion of the dyeing solution and to determine the residual dye concentration.
The migration test was conducted starting from a material weight of 10 g. Initially, 50% of the sample (5 g) was placed in the dyeing equipment, with dye and at a material-to-liquor ratio of 1:10 and 100% acetic acid to adjust pH at 4.5–5.0. Then, the sample was heated with a gradient of 3.5 °C/min up to 130 °C for 30 min and cooled to room temperature. Later, without removing the solution or the dyed material, 50% of the missing material (another 5 g) was added, as well as the leveling agent under test, plus water to keep the material-to-liquor ratio of 1:10. Heating was performed again, with a gradient of 3.5 °C/min, remaining at a level of 30 min, cooled to 60 °C and the solution was released, samples were removed, dried at 120 °C and subsequently thermofixed.
A hydrophilicity test by capillarity was carried out based on the JIS L 1907:2004 standard. To determine the degree of dispersion under specific conditions in aqueous medium, the AATCC Test Method-146-2001 was used.
For the wetting test, three beakers were prepared, one with water only, one with 2.0 g·L−1 of SNS and the other with 2.0 g·L−1 of TRO (Turkey red oil). The fabric was 100% PES, with an average weight of 130 g/m2, yarn count of 75 DEN/72 filaments, purged and cut in the size of 2 × 2 cm. The time for submersion in each of the solutions was recorded and the tests were performed in triplicate.
An alternative to measure wetting efficiency is to check how long it takes for a drop of solution placed on the textile material to be absorbed. High-efficiency wetting is when the contact angle of the droplet and textile material is zero. To facilitate the visualization, a solution with 0.1 g·L−1 of disperse dye (Turquoise Colorpes GL 200%) was prepared to be the blank test (control). Additionally, two more solutions were prepared, one with 2.0 g·L−1 of SNS and another with 2.0 g·L−1 of TRO. The solutions were dropped onto the PES fabric and the time was recorded until total absorption of each drop of the solutions. The test was performed in triplicate.
The measurements were performed in a UV absorbance spectrophotometer VIG–M51 from BEL Photonics. A scan was performed to check the maximum absorption wavelength of the dye solution. Readings were taken at 5 points of different dye concentrations (10 mg·L−1 to 50 mg·L−1) to determine the calibration curve, which was used to obtain the correlation between the absorbance reading and the dye concentration. To investigate the ionic demand of the products used in the solution (SNS and TRO), a particle charge detector equipment, Mutek PCD 05, was used.
Readings of the coloristic properties of the fabrics after dyeing were performed with the DATACOLOR 500 spectrophotometer. Datacolor Tools software version 2.3.1 was used to analyze the CIE L*a*b* coordinates, ∆E and K/S. The rubbing fastness test was carried out under the ABNT NBR ISO 105-X12 standard. Washing fastness tests were conducted according to the ABNT NBR ISO 105-C06 standard.
The morphological analysis of the samples was performed using a conventional scanning microscope with a tungsten filament, with acceleration voltage from 0.5 to 30 kV and magnification between 25× and 300,000×. For the chemical characterization of functional groups, the samples were analyzed by an ATR module, making 20 scans from 400 to 4000 cm−1 with a resolution of 4 cm−1. To evaluate the thermal stability of polyester through a thermogravimetric analysis, Netzsch equipment, model STA 449 F3 Jupiter, was used, using an alumina crucible, gas flow of 60 mL/min, a heating rate of 10 °C/min, a nitrogen atmosphere and a temperature range from 30 to 700 °C.
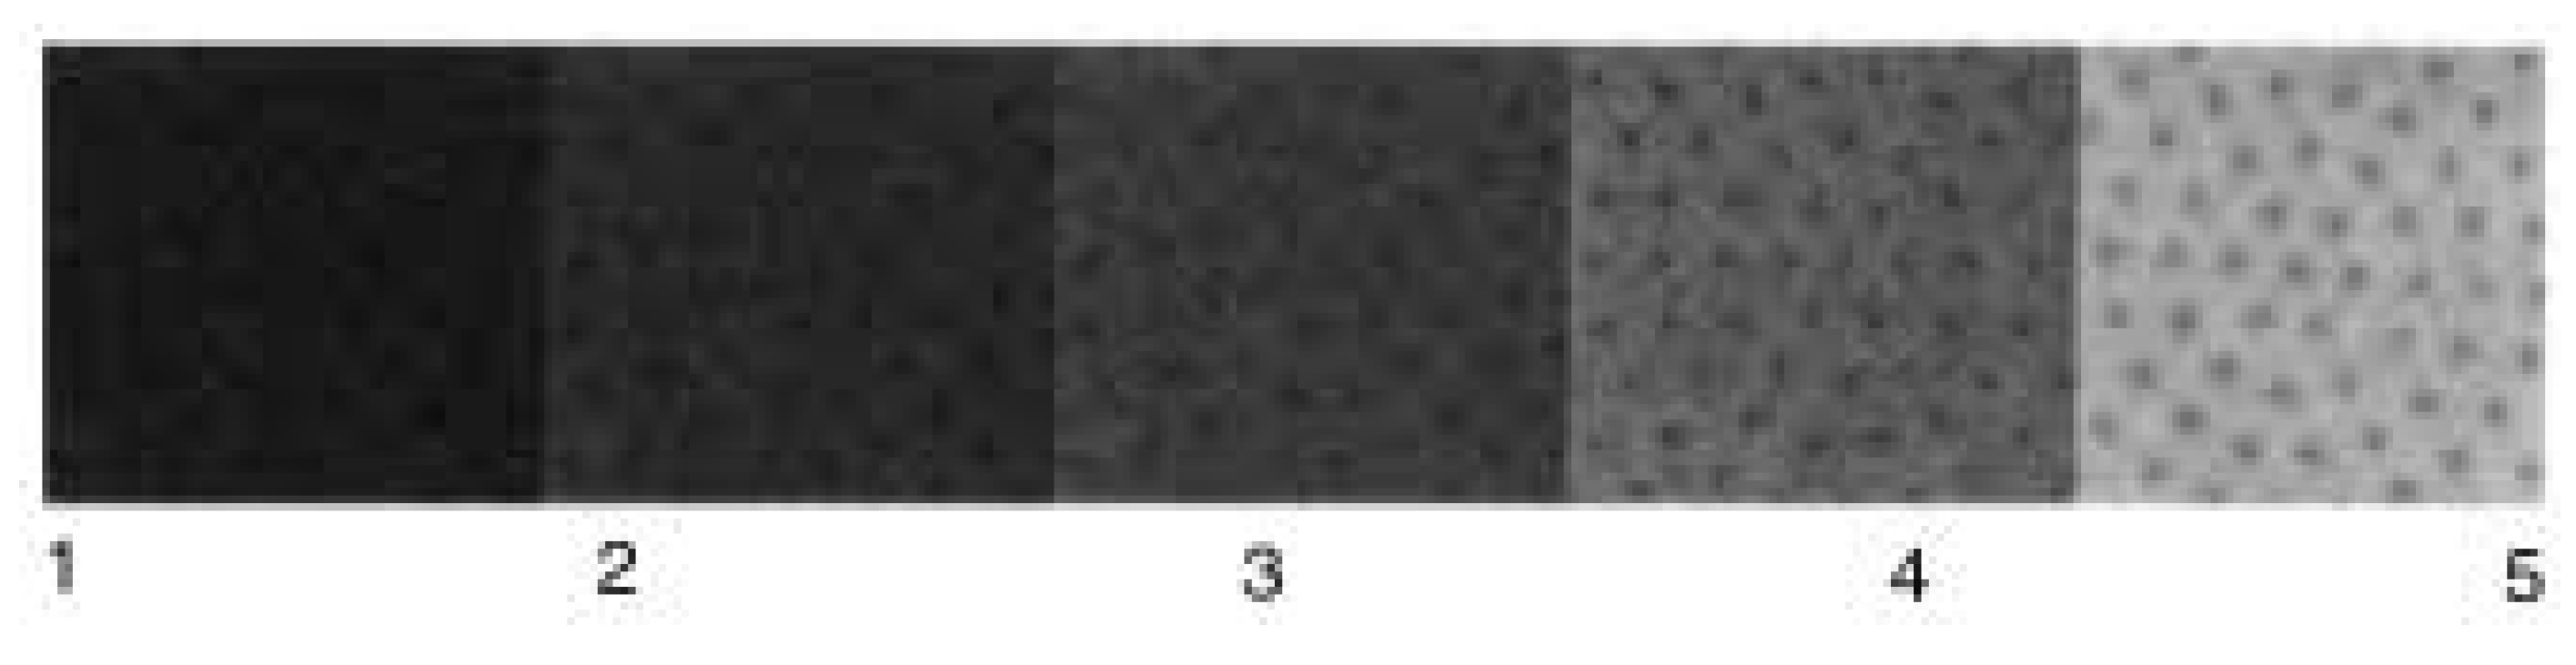
In addition to the analysis of dyed substrates and dyeing solutions, comparison analyses were also carried out between SNS and TRO products through filtration dispersion tests, wetting tests and ionic charge tests. The dispersion test was based on the test method AATCC-146-2001 (dispersibility of dispersed dyes: Filter Test) and evaluated the residues present on the filters using the residue scale (
Figure 1)
3. Results
3.1. Dyeing
Dyeing tests were carried out at 130 °C, with 1% Orange 29 disperse dye, with standard (2.0 g·L
−1 SNS), control (without dispersant) and different concentrations of TRO at different process times; all tests were performed in triplicate. The color measurements of the dyed polyester mesh samples were carried out with the sample folded, taking readings at four different points of the sample, from which an average value was determined.
Table 3 shows the CIE coordinates L*a*b* and K/S (color strength) reading values of the dyed samples.
The ∆E values (color deviation), in relation to the standard, indicate that the color of polyester dyed at 130 °C did not show major changes for the control, for the different TRO concentrations or for different process times. Knowing that the color difference is only perceptible to the human eye with ∆E above 1, only in samples from treatments 5 and 6 would it be possible to perceive the color difference. In
Figure S1 (
Supplementary Material), it is possible to visualize the photos of the samples from the 13 treatments, as well as the standard and the control sample. An important observation is that the samples treated with 2.0 g·L
−1 TRO and 15 min showed K/S values slightly higher than the standard treated with 30 min. With the K/S data, a statistical analysis was carried out to effectively verify the response of the concentration of TRO. It was observed that both the TRO concentration factor and the process time factor are significant.
Table 4 and
Table 5 show the effects of the parameters studied and the results of the analysis of variance (ANOVA).
The ANOVA analysis demonstrates that the TRO concentration (L), time (Q) and the interaction between the studied factors are significant. It is observed that they appear as negative values, which indicates that when varying the factors from their lowest values (−1) to values of higher levels (+1), there is a reduction in the value of K/S. This result demonstrates that the values studied were properly chosen and that intermediate values of both factors are sufficient to maximize the color values of polyester dyeing using Turkey red oil (TRO) as a dispersing agent, as can be seen in
Figure 2.
Values in red in
Table 4 and
Table 5 indicate the relevant factors at a significance level of 5%. If the
p-value is greater than the significance level, the test detects no fit (lack-of-fit test). Observing the K/S (color strength) response surface as a function of TRO concentration and treatment time, it is verified that there are central points with better K/S results.
Analyzing the K/S values in
Figure 2, it can be seen that the highest K/S values are found in the central conditions, between 1.0 and 2.0 g·L
−1 TRO in the process times between 30 and 40 min, and the critical values are 1.41 g·L
−1 of TRO and 32.3 min.
From the statistical analysis of the data, it was possible to present the statistical model that generated the response surface curve, according to Equation (1).
The R
2 value of the response surface curve was 0.6567, a value that is justified because there are deviations related to the dyeing process itself, especially in terms of washing steps. The R
2 value accounts for 65% of the variation due to the proposed factors (TRO concentration and time) and 45% can be by virtue of the fluctuation of the reductive washing. However, the efficiency of surface dye removal and the degree of influence on the properties varies significantly with the particular dye [
18].
In the case of polyester, reductive washing in the laboratory has limitations in terms of reproducibility. Analyzing the residual variance, the lack-of-fit test was not significant (
p-value > 0.05) for the predicted model, implying that the experimental data were well fitted.
3.1.1. Dyeing Levelness Analysis
Dyeing levelness indicates the efficiency of dye absorption in the process. The smaller the presence of undesirable stains, the higher the quality of the product.
To evaluate the uniformity of the dyeing, color measurements were performed on the dyed samples at four different points (four quadrants): upper front, lower front, upper back and lower back; then, the average was determined.
All measurements performed on the dyed samples showed ∆E below 1, in relation to the average of the sample itself, indicating that the dyeing is even. According to the results obtained for ∆E (color deviation) and K/S of the dyed samples, it was decided to select the dyeing samples at 130 °C for 30 min of treatment with 2.0 g·L
−1 of TRO (Treatment 7), from the standard (SNS) and the control (without dispersant), for the comparison of results using the same amount of product.
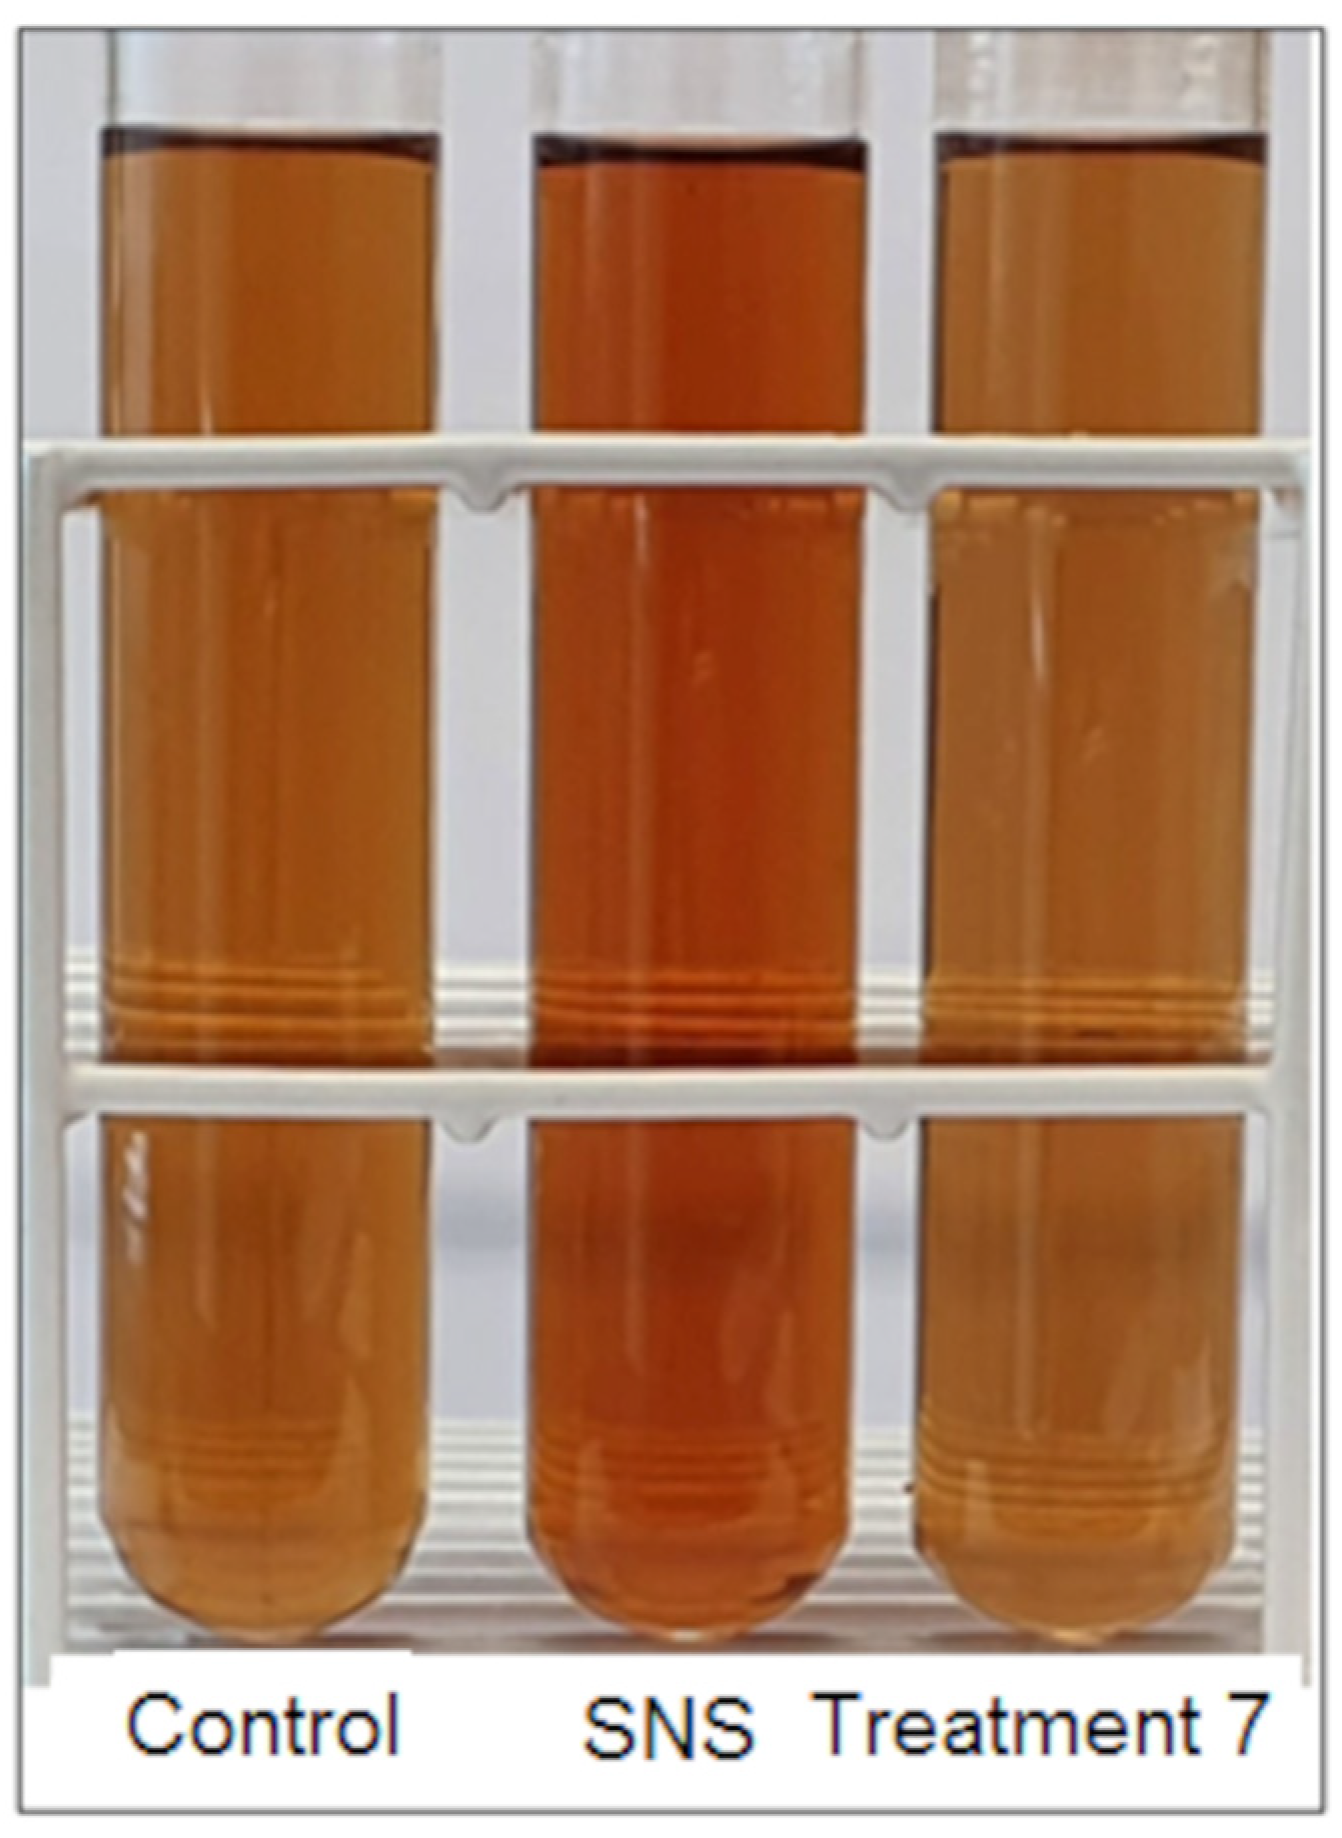
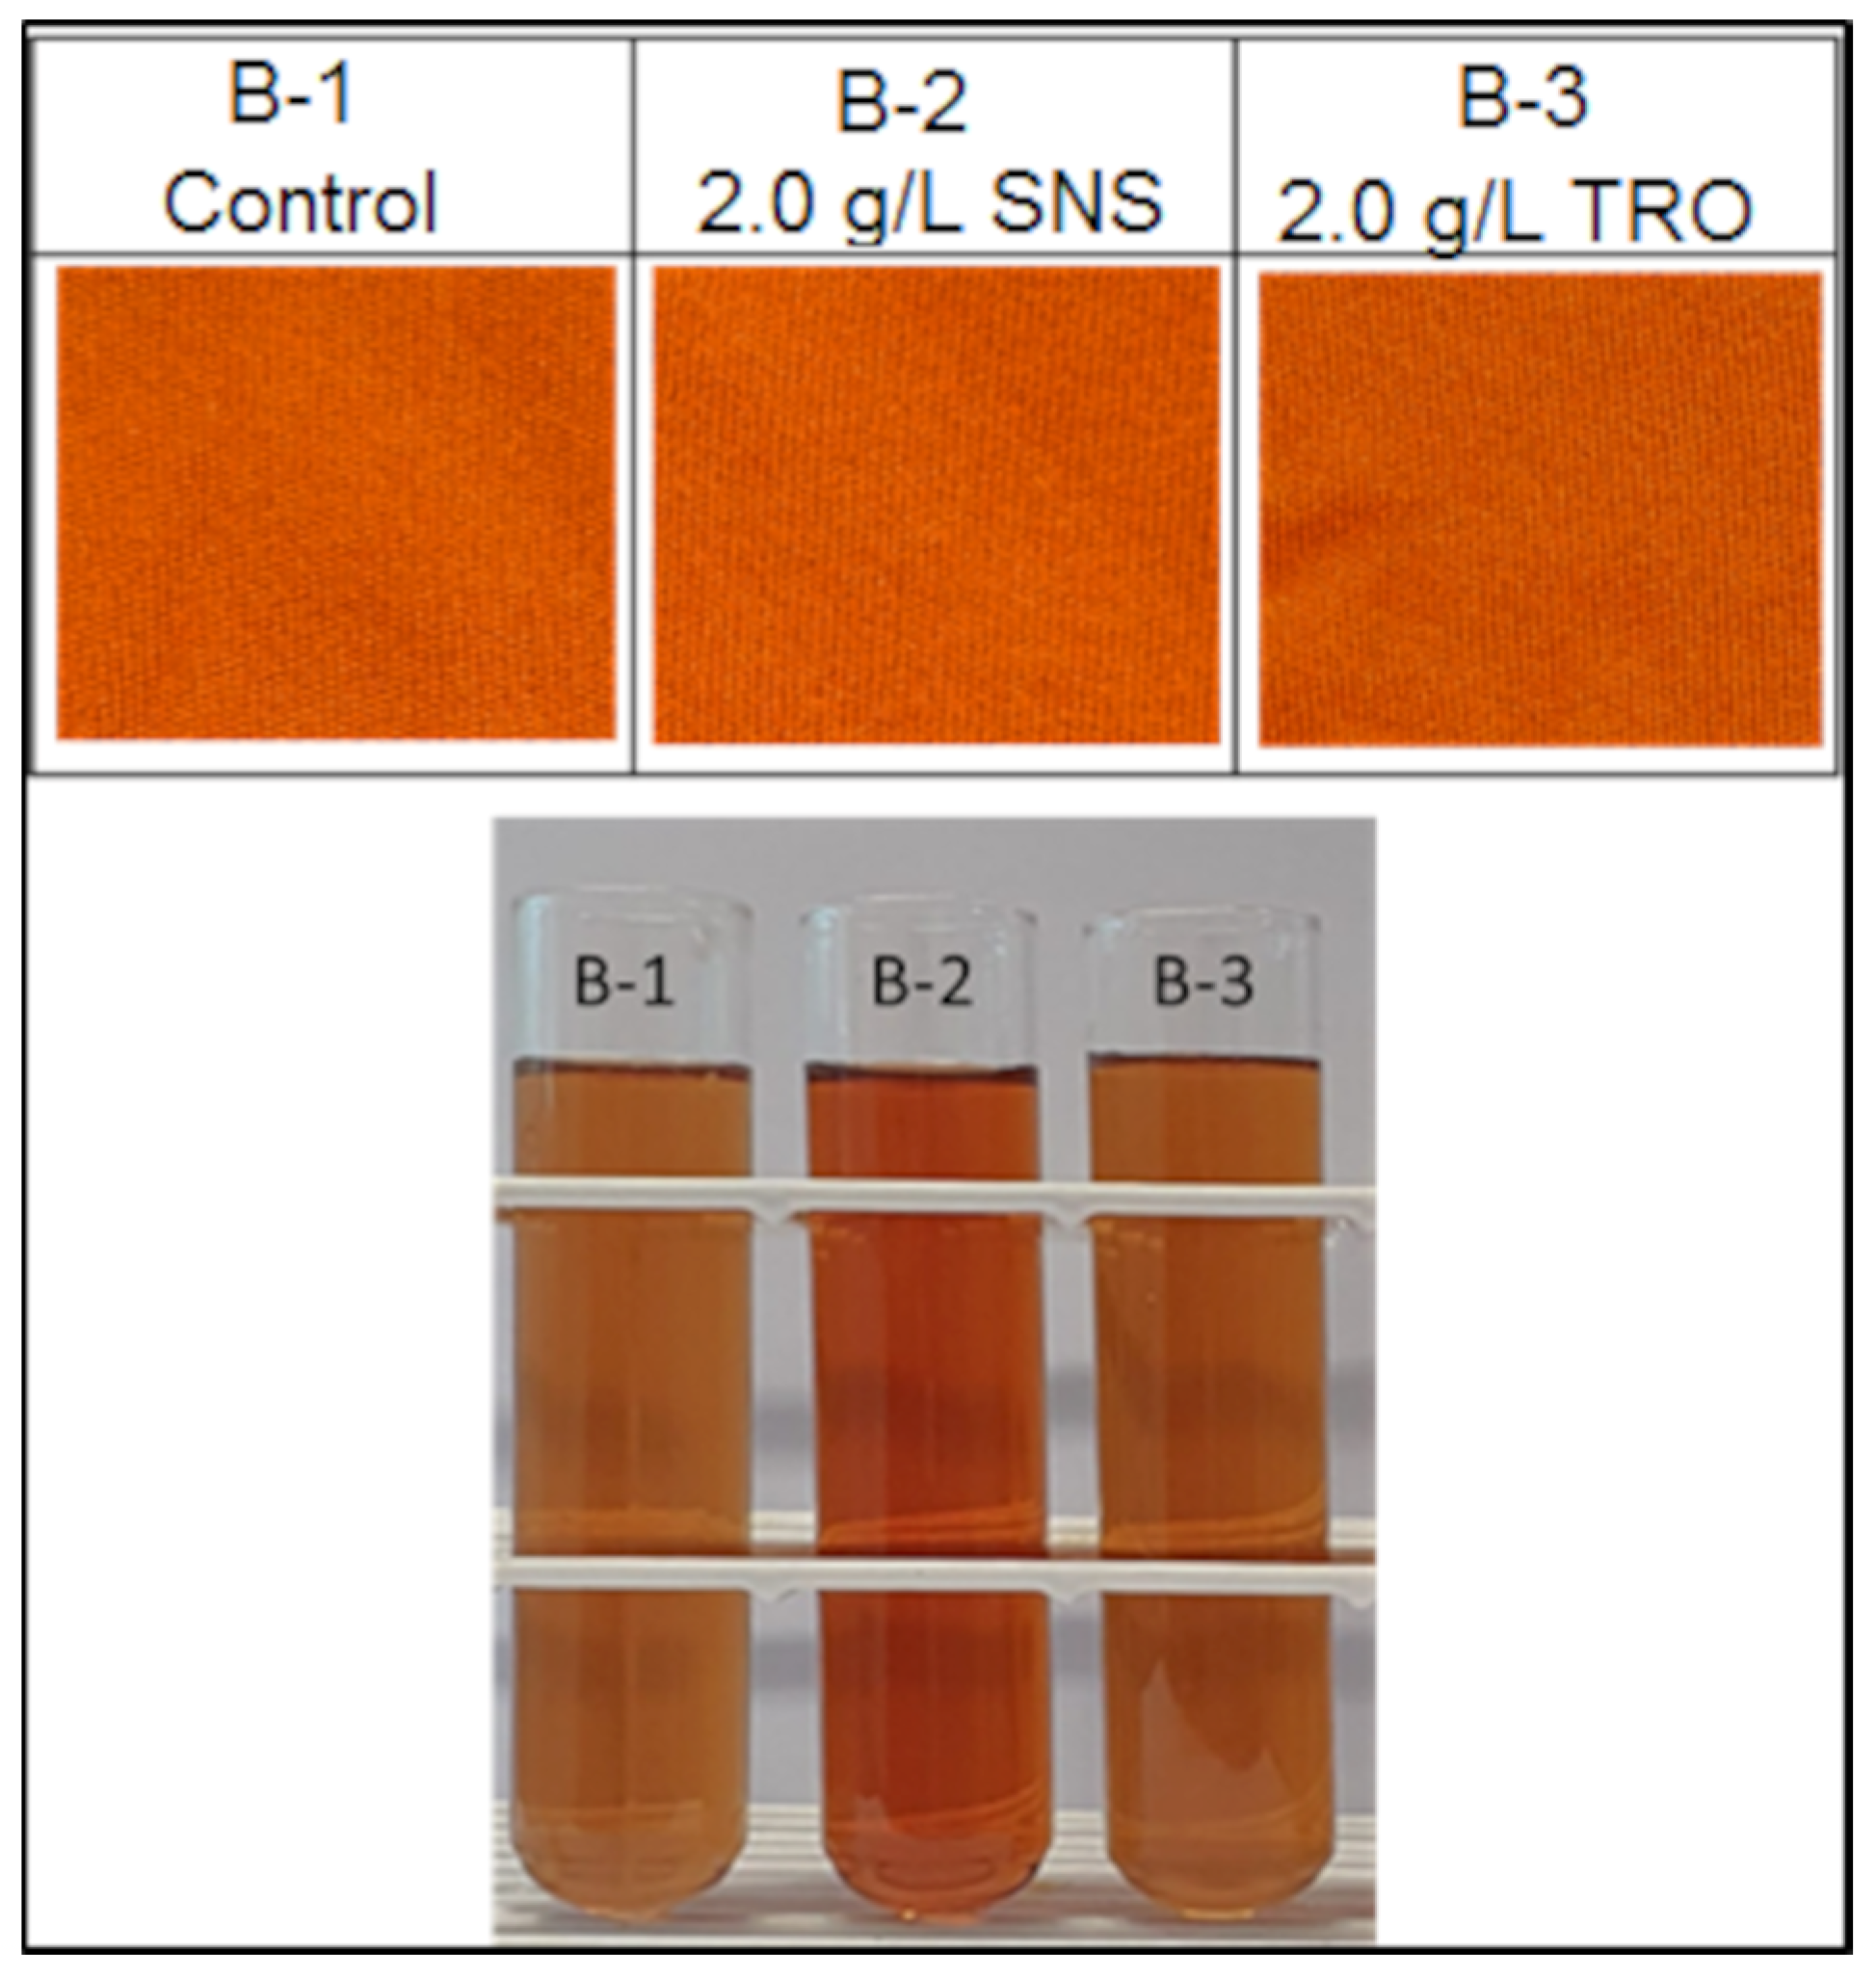
Table 6 shows the readings by quadrants of the samples as well as the ∆E values and mean standard deviation of each sample, and
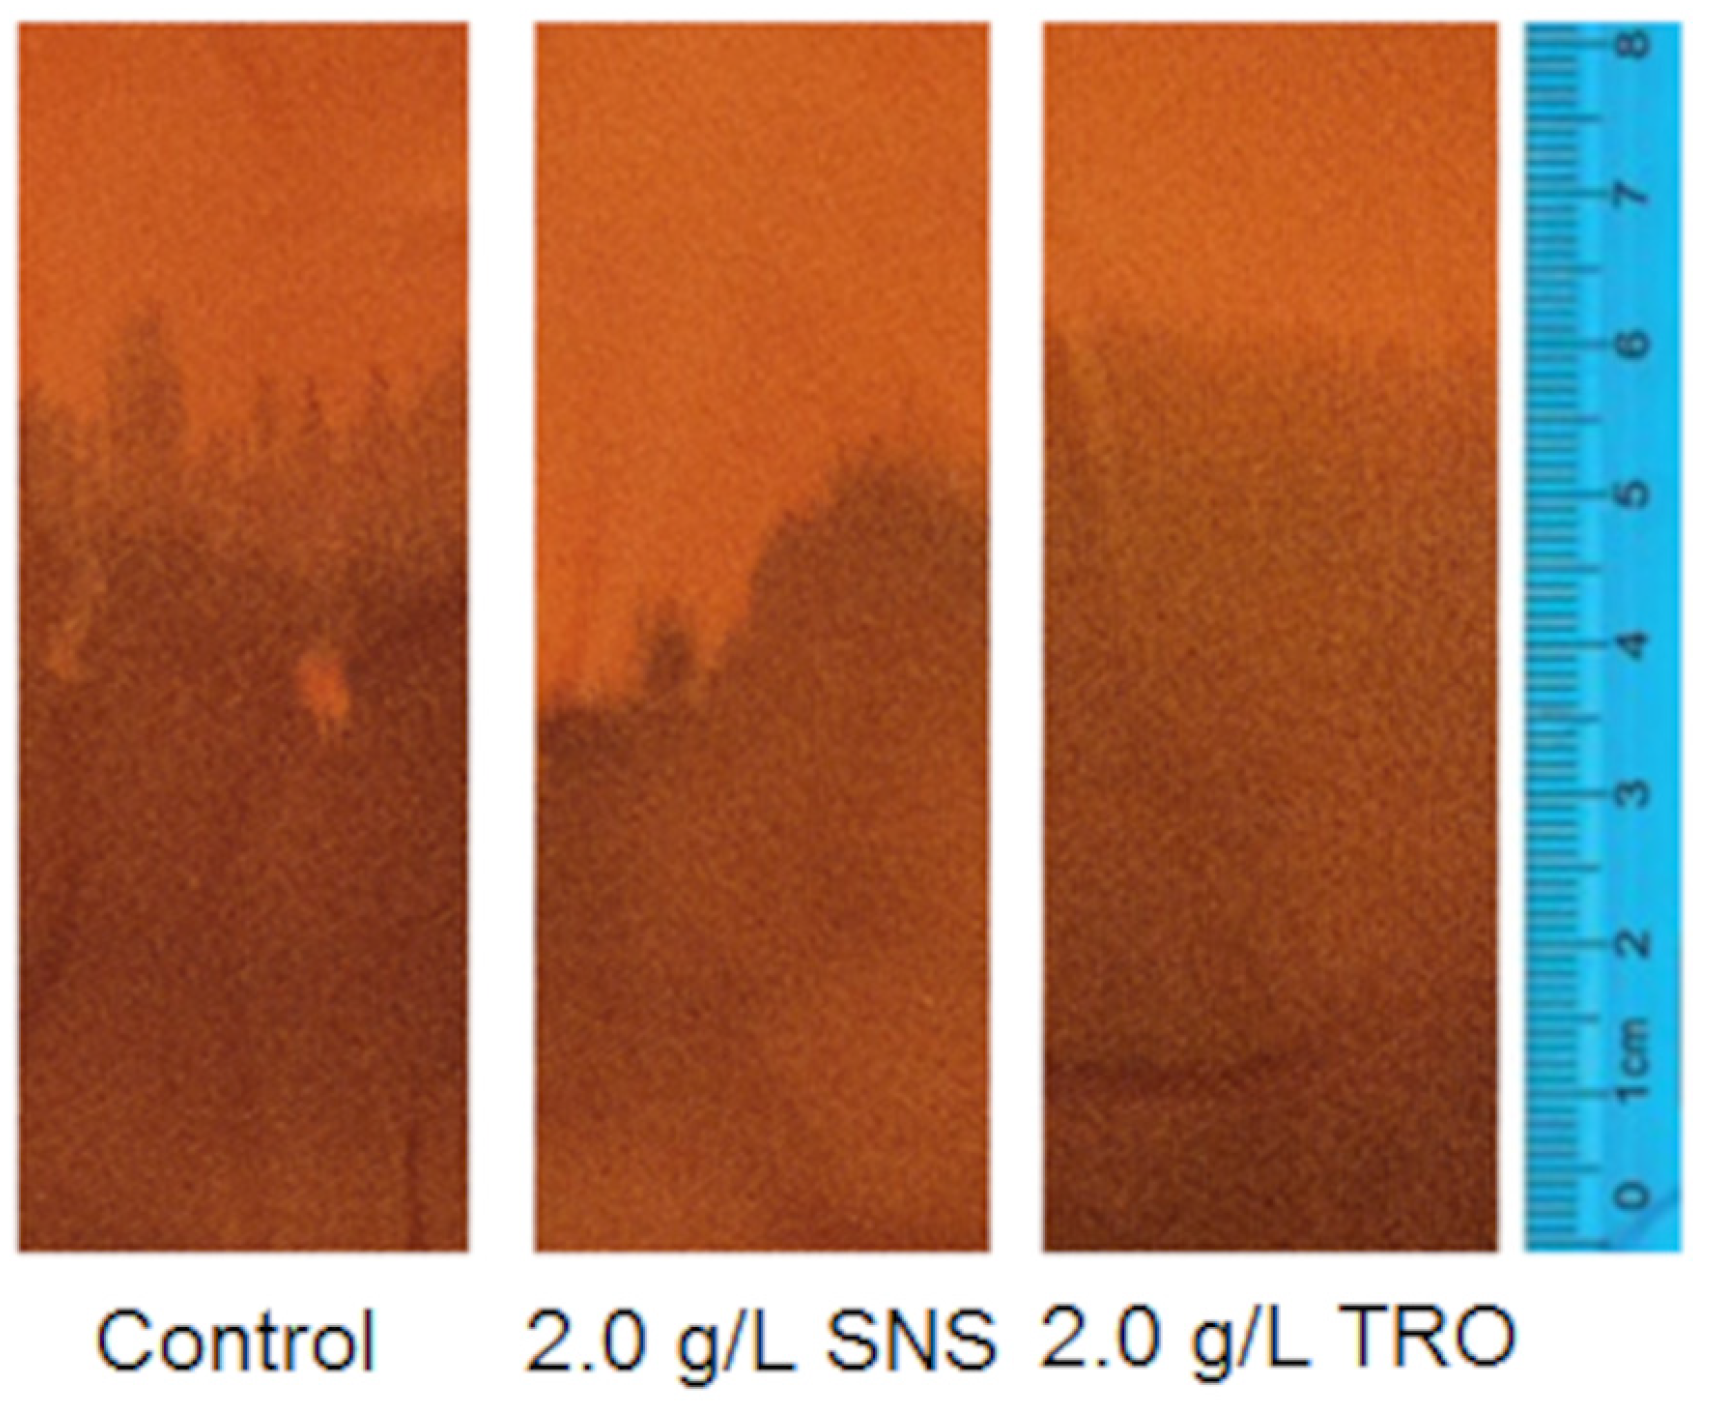
Figure 3 shows the residual dyeing solutions of these treatments.
The concentrations of the dyeing effluents were determined from the measurement of the absorbance at a wavelength of λ = 310 for all treatments, were is possible to compare visually the dye concentration (
Figure 4). The absorbances of the dispersants/leveling agents in water and without dye, and of the solutions with 2.0 g·L
−1 of SNS and 0.6 g·L
−1, 1.0 g·L
−1, 2.0 g·L
−1 and 3.4 g·L
−1 of TRO were also measured.
With the absorbance data of the residual dyeing solutions, deducted from the value obtained from the solutions containing only the dispersants, the actual residual concentration of dye in each solution was calculated, as shown in
Table 7.
As seen in
Figure 3, it is observed that the residual dyeing solution with SNS presents greater color intensity. This is due to the color depth of the SNS. The comparison between the solutions with dispersants (without dye) with the concentration of the dye is shown in
Table 8.
It is observed that when adding SNS, there is a significant increase in the color of the effluent, while with the addition of TRO, this increase is extremely small; considering the mean standard deviations of the solutions, it can be considered insignificant.
3.1.2. Dyeing at a Temperature of 120 °C—30 min
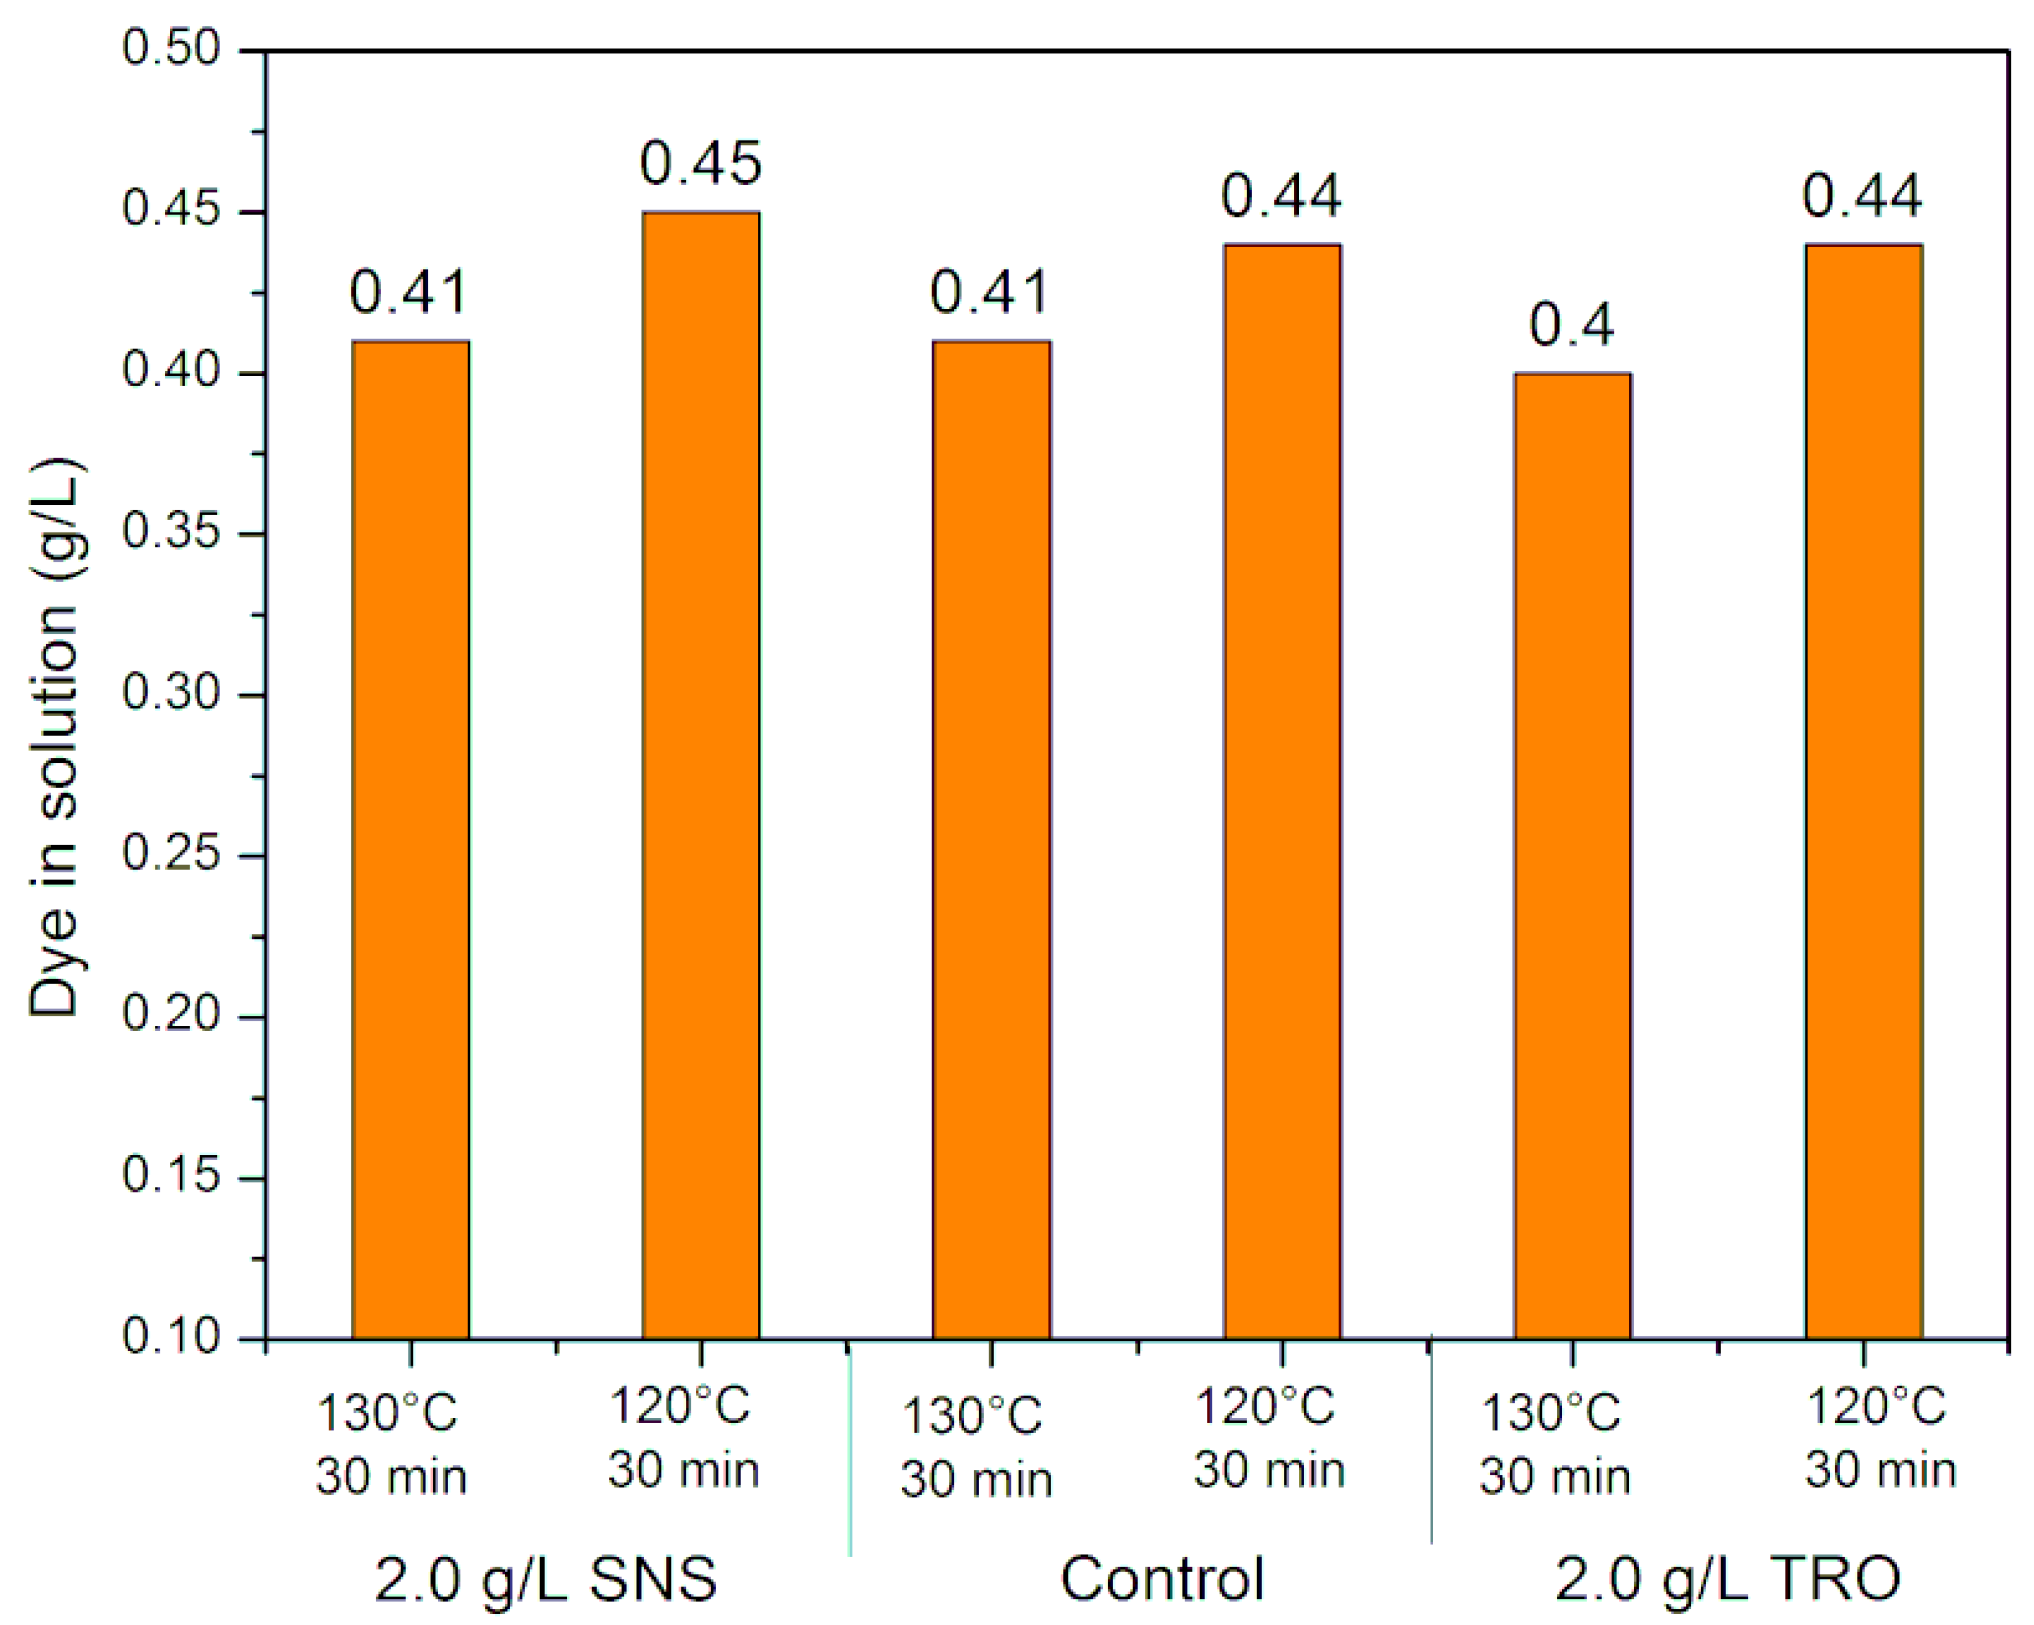
Dyeing tests were performed at 120 °C for 30 min, with 1% Orange 29 Disperse Dye, with standard (2.0 g·L
−1 SNS), control (without dispersant) and 2.0 g·L
−1 of TRO. Color strength (K/S) measurements of the dyed polyester mesh samples were taken at four different points with the folded sample, and then an average value was determined. In
Figure 5, it is possible to visualize photos of the dyed fabric samples dyed at 120 °C and the residual dyeing solutions.
The results obtained for K/S and dye concentration in the residual dyeing solutions at 120 and 130 °C for 30 min are shown in
Figure 6 and
Figure 7, respectively.
Analyzing the results, it is possible to verify that with the decrease in temperature, there is a loss of K/S, both in the standard treatment with SNS (sodium naphthalene sulfonate—control) and in the treatment with TRO (Turkey red oil). This demonstrates that there is lower dye incorporation with decreasing temperature, which is corroborated by the dye concentration in the residual solution. At 120 °C, there was an increase in the dye concentration in the residual solution.
3.1.3. Dyeing at Temperatures of 80, 100 and 115 °C
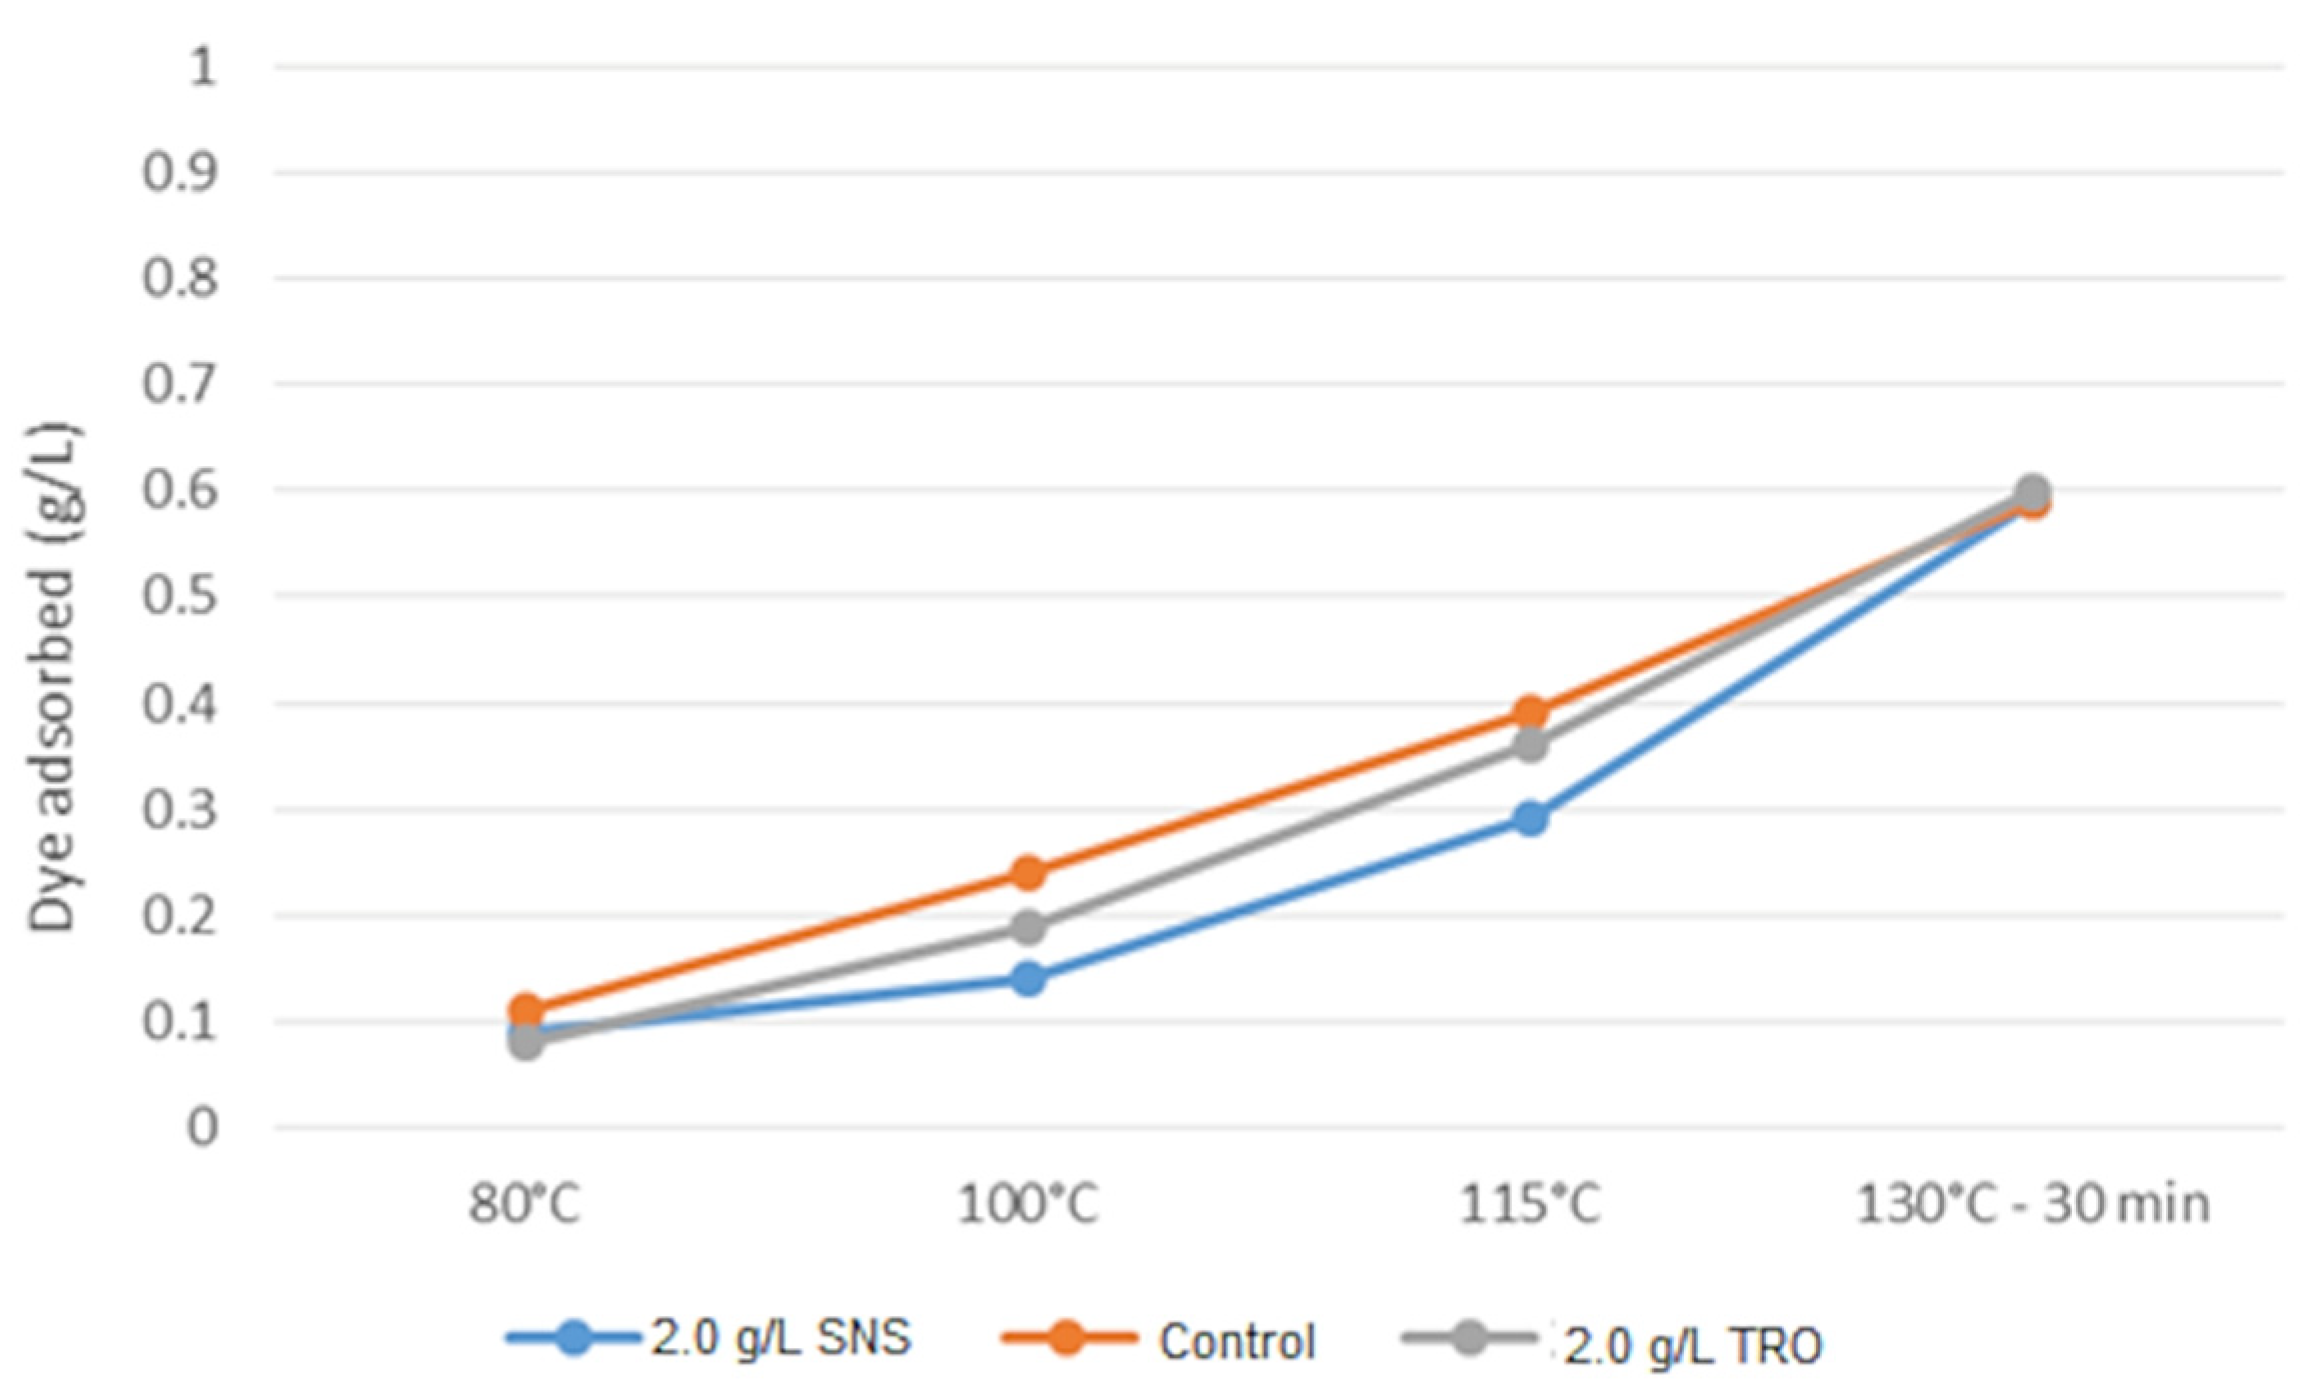
In
Figure S2 (
Supplementary Material), it is possible to visualize the fabrics dyed at 80, 100 and 115 °C, as well as the residual solutions of dyeing at 80, 100 and 115 °C.
Table 9 presents the K/S data and dye concentration in the residual solutions.
Figure 8 and
Figure 9 show the dye adsorbed and K/S values for treatments with 2 g·L
−1 of SNS and TRO, along with the control. It is observed that with the increase in temperature, there was greater adsorption of dye and an increase in K/S for the control test and SNS. However, it is also observed that for the control sample at lower temperatures, the adsorption of the dye was greater than the standard.
The association between dye and the leveling agent is established through a balance that gradually dissolves. This happens with the release of dye molecules as they are fixed on the fiber while the equilibrium is changed, considering a free behavior in the dyeing solution. The leveling agent that has an affinity with the fiber is, in general, a molecule smaller than the dye, capable of diffusing more easily inside the fiber. Therefore, at the beginning of the dyeing process, the leveling agent occupies the freest access points in the fiber. The presence of leveling agents is normally transitory, and when the dye reaches its position, it moves and becomes fixed due to the greater affinity it has with the fiber. Dye fixation is consequently delayed, promoting a bigger migratory effect.
3.2. Wet Rubbing and Washing Fastness
The analyses were conducted for wet rubbing fastness of the SNS (sodium naphthalene sulfonate) standard samples, control and samples treated with 2.0 g·L
−1 of TRO (Turkey red oil).
Figure S3 (
Supplementary Material) presents photos of the staining on cotton and polyester fabrics. According to the results of
Table 10, the TRO did not negatively interfere with the rubbing fastness—it even showed a slight improvement in the CO fabric.
Washing fastness analyses of standard SNS samples, control and samples treated with 2.0 g·L
−1 TRO were also conducted, as shown in
Figure S4. Again, it is evidenced that TRO does not negatively interfere with washing fastness; instead, it shows a slight improvement in the CO.
3.3. Scanning Electron Microscopy (SEM)
Through the SEM technique, four samples were analyzed: without dyeing, control, SNS standard (2.0 g·L
−1 SNS dyed at 130°C—30 min) and TRO test (2.0 g·L
−1 TRO dyed at 130 °C—30 min). The images in
Figure 10 were obtained with 1000× magnification, making it possible to see that the morphology of the samples is very similar. They present small particles deposited on the fibers, which is probably due to the presence of oligomers. As these particles are evidenced both in the undyed and control samples, as well as in the SNS standard and TRO tested samples, it is evident that both the SNS and the TRO did not show efficiency for the removal of oligomers. In
Figure S5, the micrographs are shown at 3000× magnification.
3.4. Fourier Transform Infrared Spectroscopy (FTIR)
FTIR tests were performed to identify structural characteristics, mainly regarding functional groups and bonds presented in the fabrics. There were four samples tested: without dyeing, control (dyeing without dispersant), standard SNS (dyeing with 2.0 g·L−1 SNS) and TRO test (dyeing with 2.0 g·L−1 TRO), with dyeing performed at 130 °C for 30 min.
The spectra presented in
Figure 11 have the characteristic peaks associated with the polyester fiber, according to the evaluations already presented in the literature by Assis [
19]. No significant structural change is observed through the FTIR analysis in the treated samples when compared to the sample without dyeing.
3.5. Thermogravimetric Analysis (TGA)
Thermogravimetric analysis (TGA) is widely used to investigate the temperature degradation of polymers such as polyester and to determine the kinetic parameters of thermal degradation [
18,
20,
21]. It is used to gain a better understanding of the thermal stability of polymers.
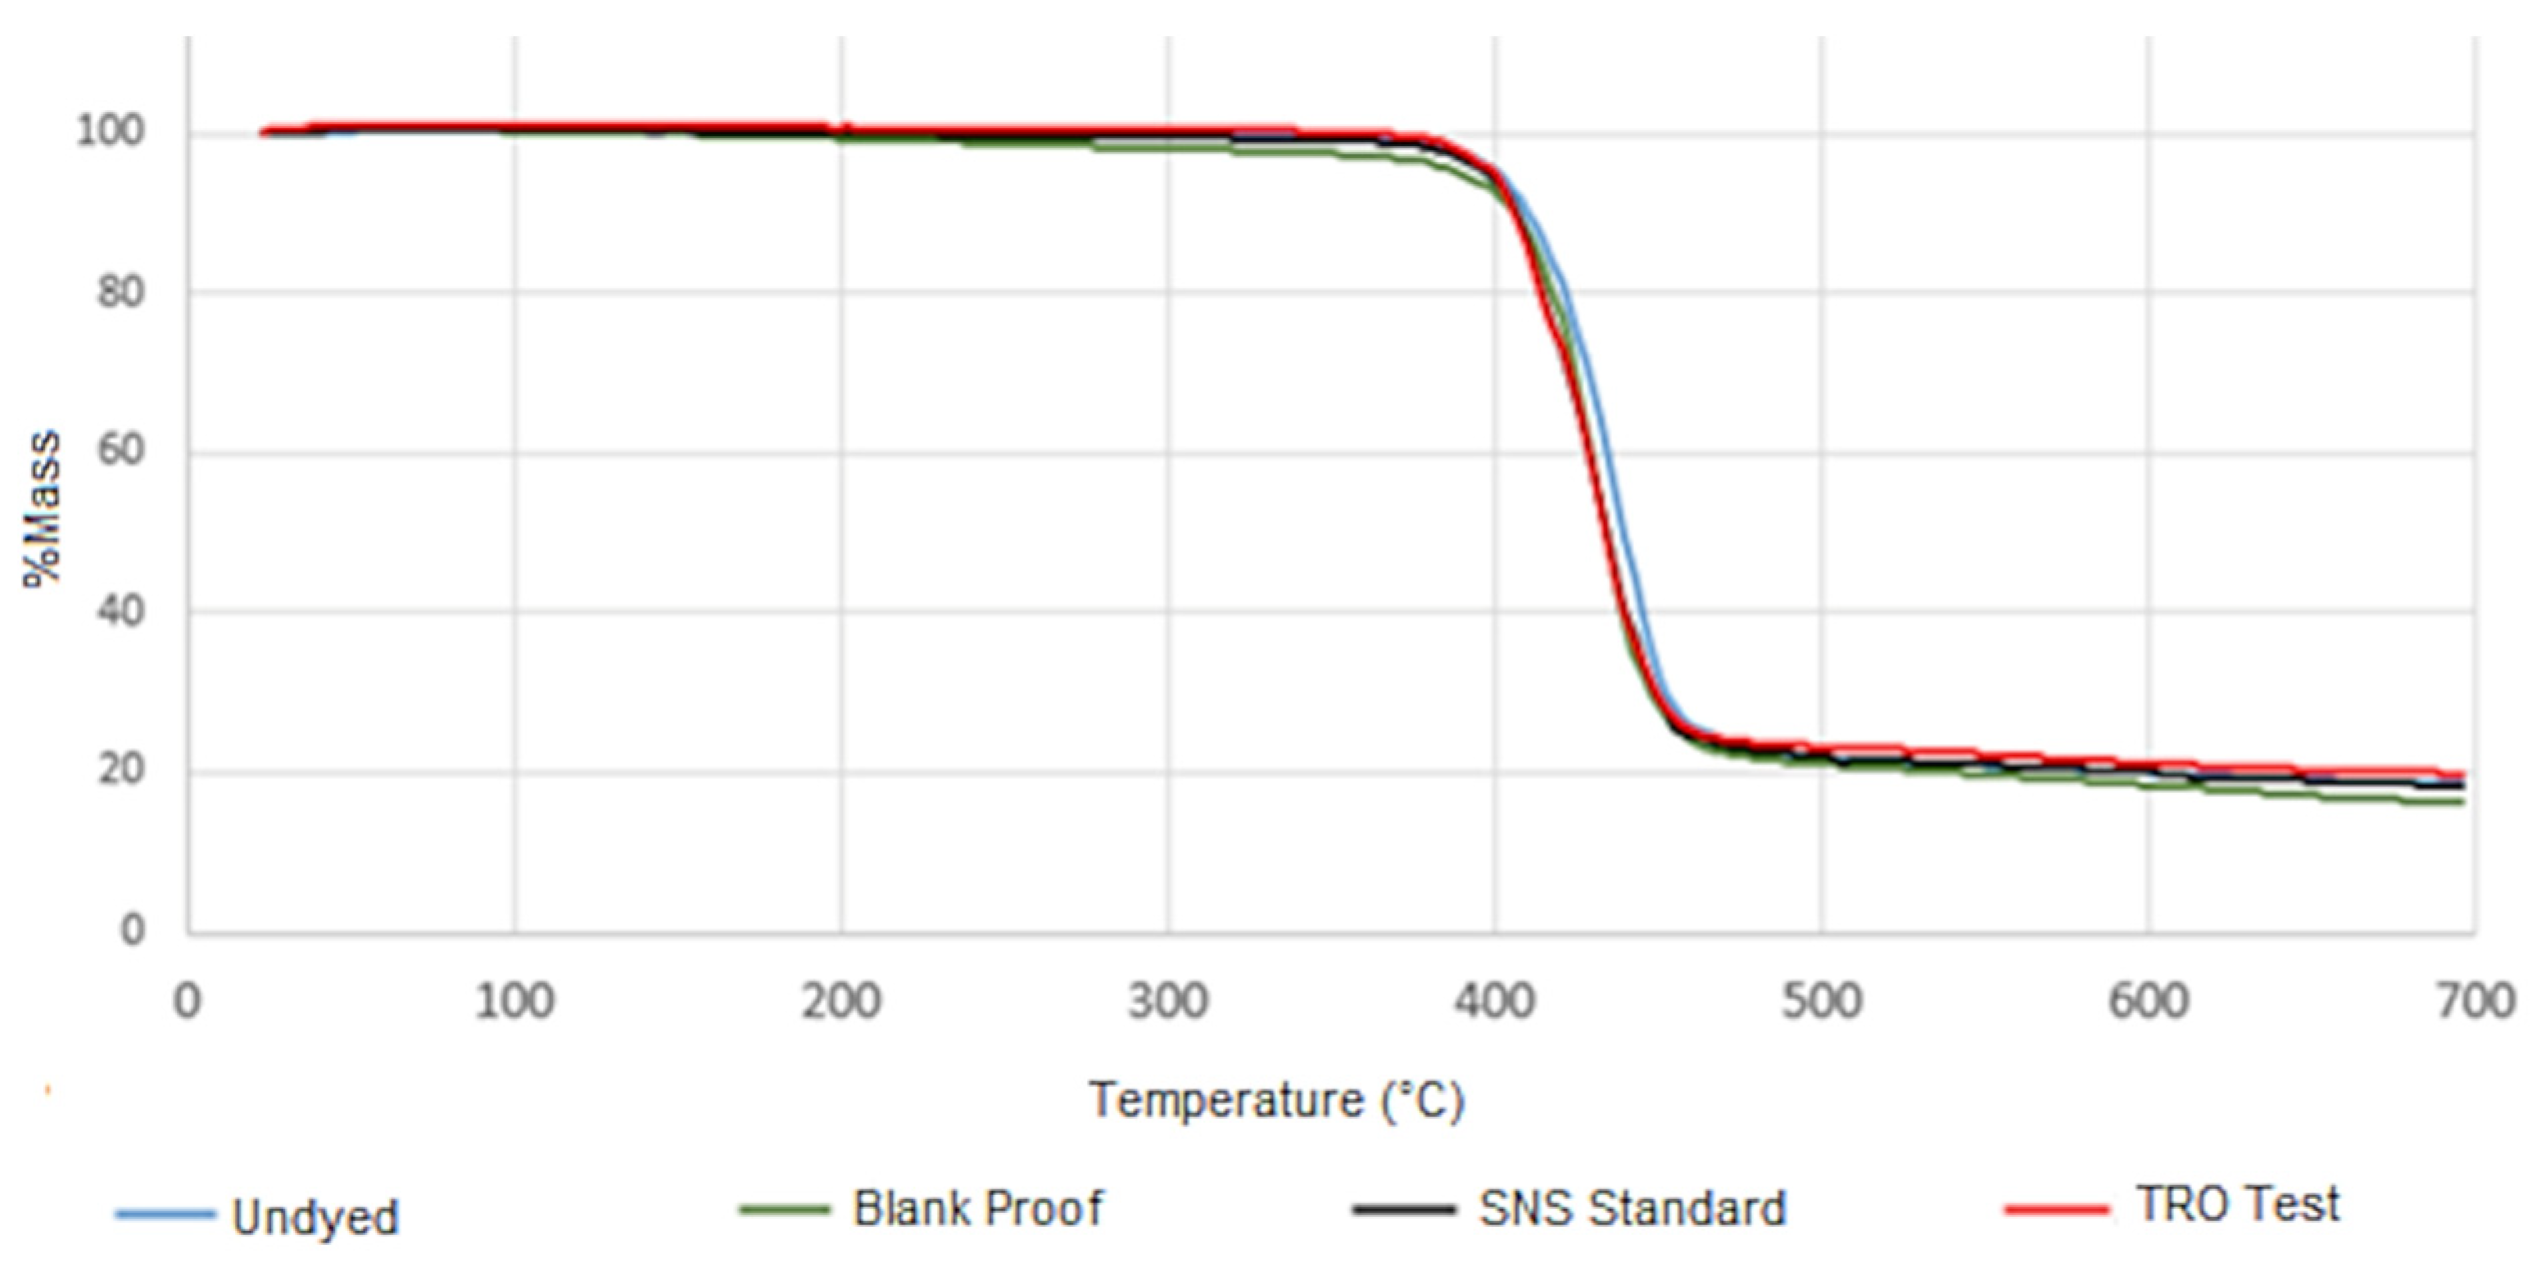
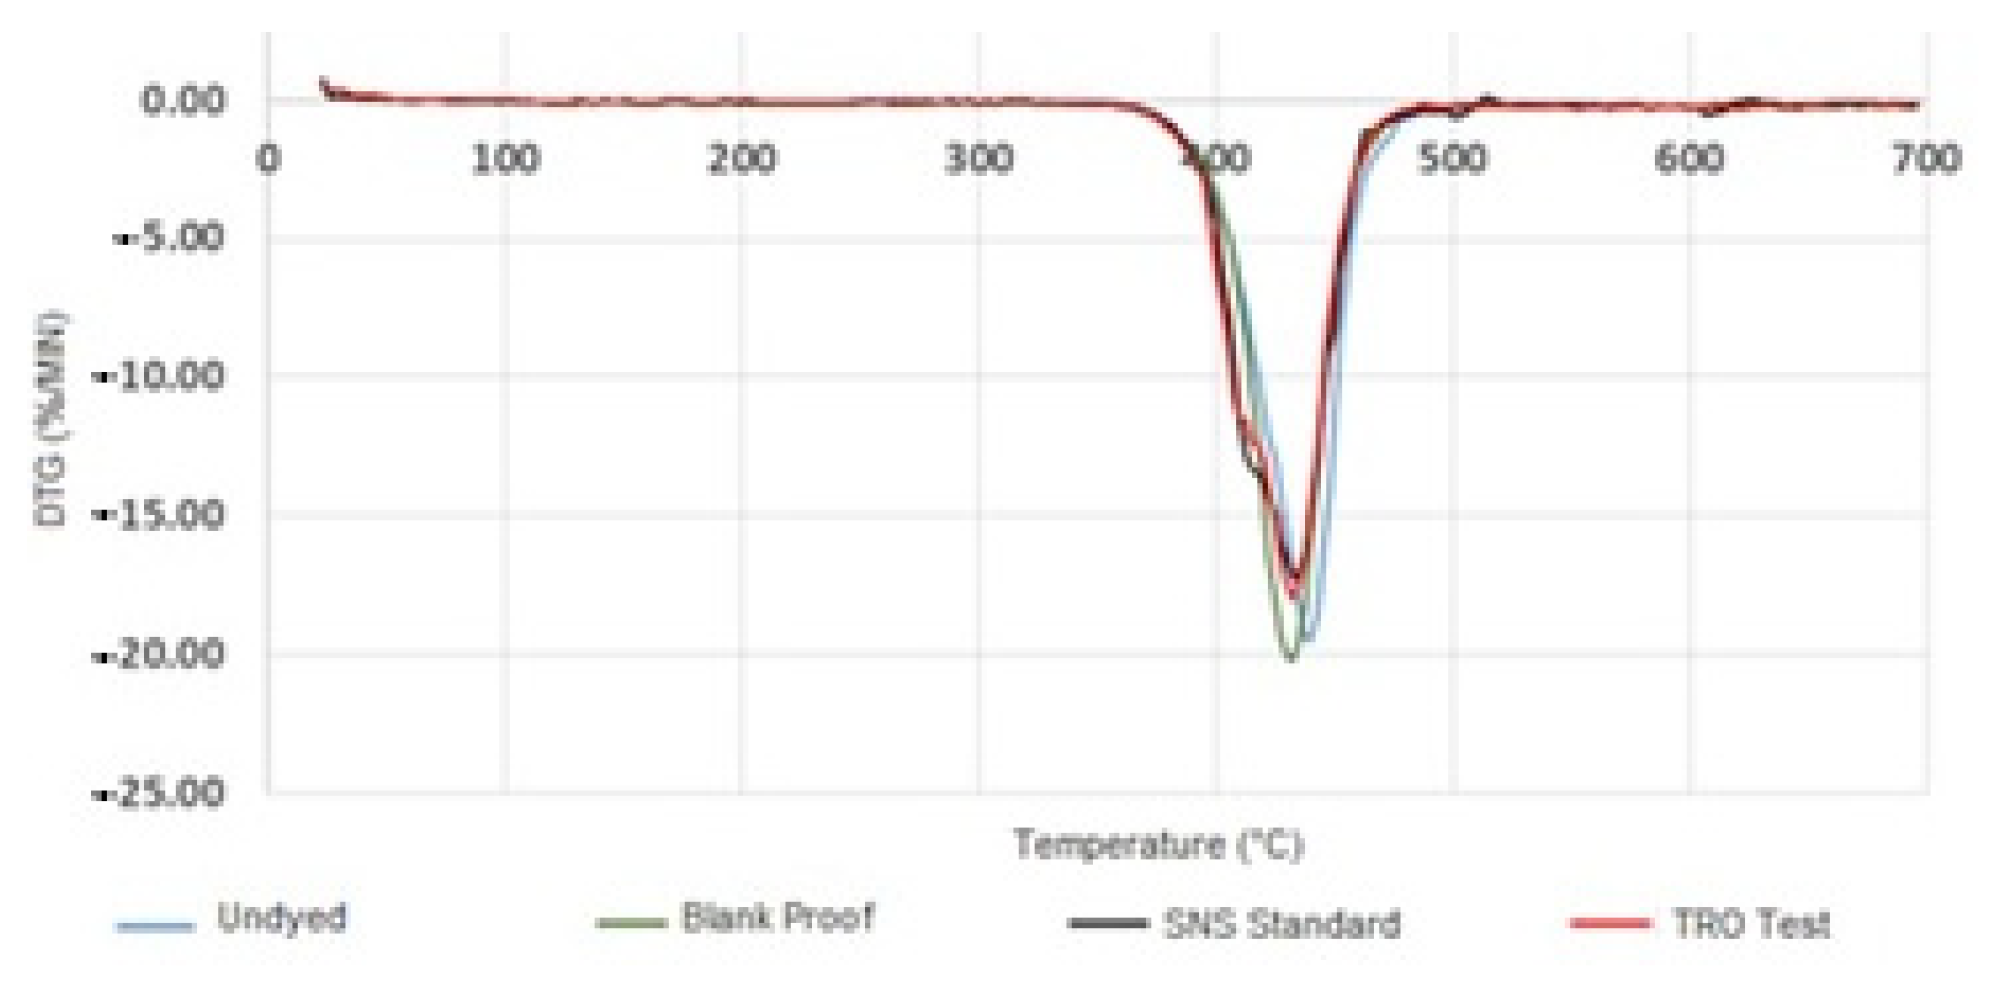
Figure 12 shows the graphs with the results obtained in the TGA analysis of the samples: without dyeing, control, SNS standard and TRO test (sample treated with 2.0 g·L
−1 of TRO at 130 °C for 30 min). The final mass loss percentage results, as well as the onset (extrapolated start of the thermal event) and endset (extrapolated end of the thermal event) values for these samples, are summarized in
Table 11.
It can be observed that the thermal stability is very similar among the samples. The highest proportion of mass loss occurs for all samples from 400 °C. The TRO test sample was the one that presented the lowest onset temperature, but it also presented the lowest percentage of final total mass loss.
In addition to the direct thermogravimetric relationship (% mass loss x temperature), the DTG graph was also made to visualize the data more precisely [
22].
Figure 13 shows the DTG curves (%/min) of the undyed, blank proof, SNS standard and TRO test samples.
With the TG/DTG data, it is possible to verify that the treatment with TRO did not interfere negatively with the thermal stability of the polyester fabric, and even presented a lower percentage of mass loss when compared to other samples.
3.6. Migration and Levelness
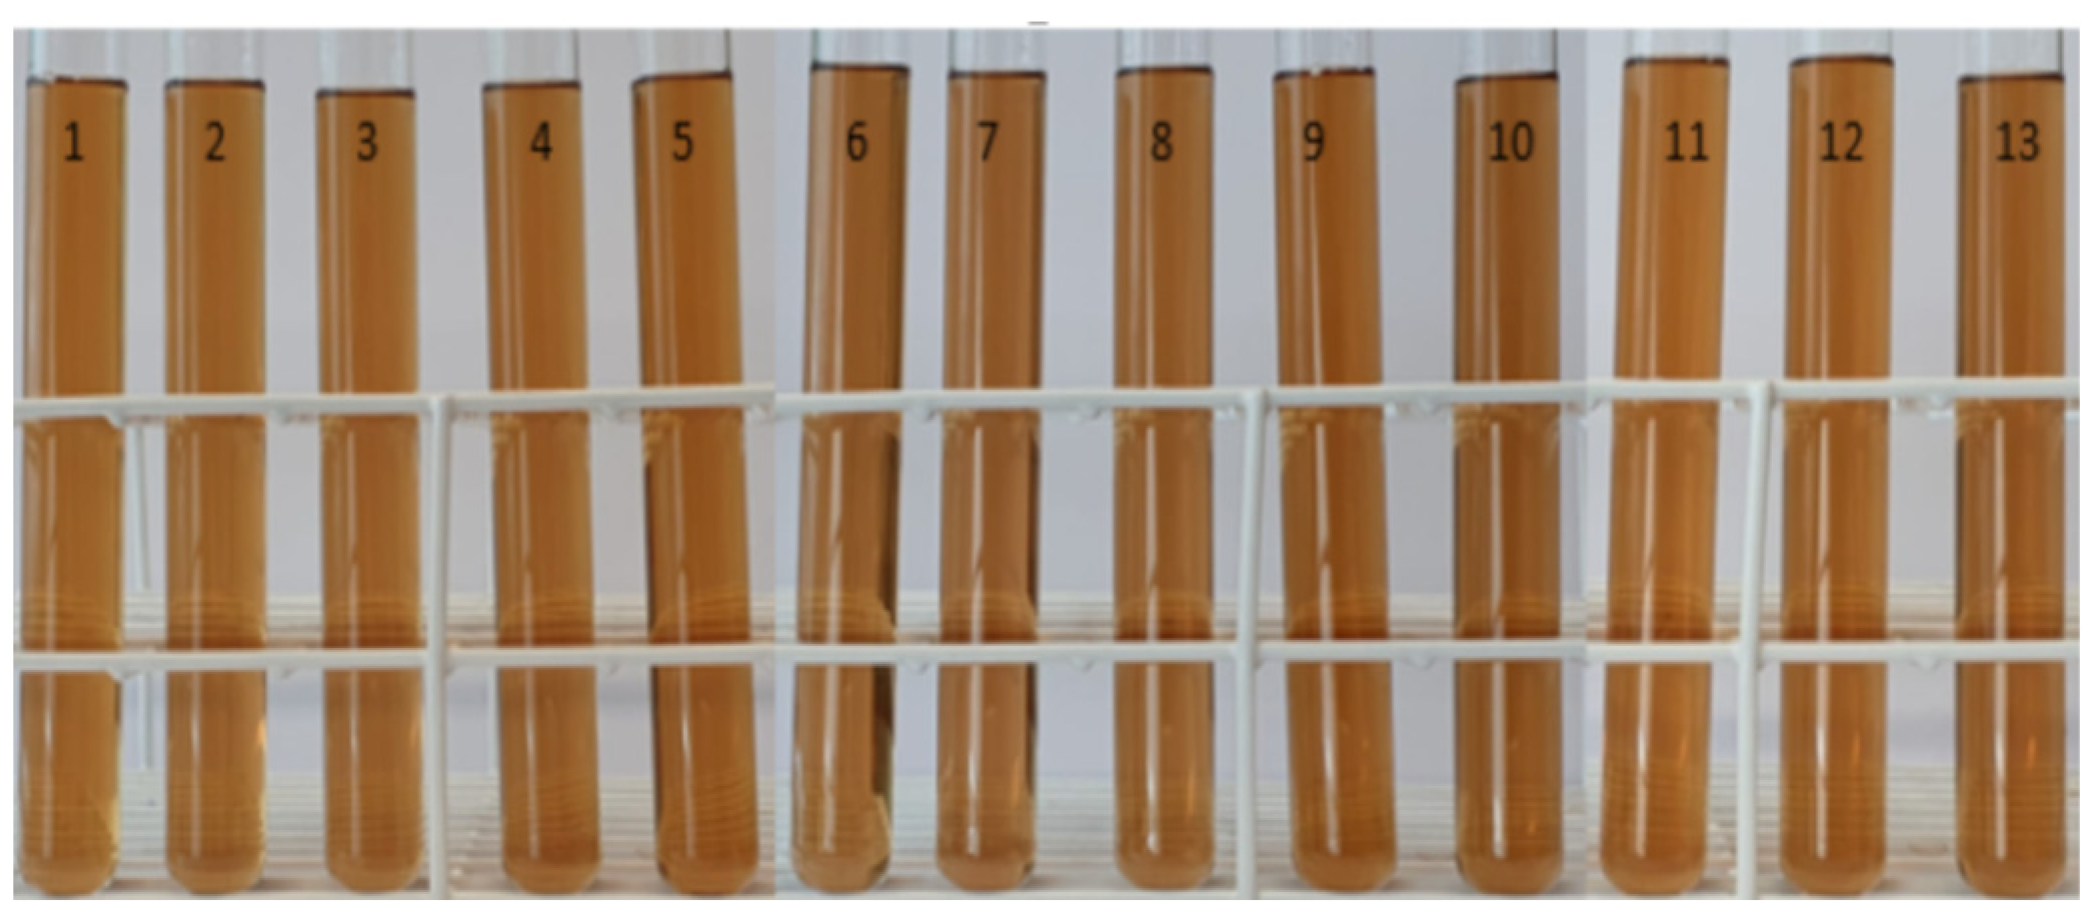
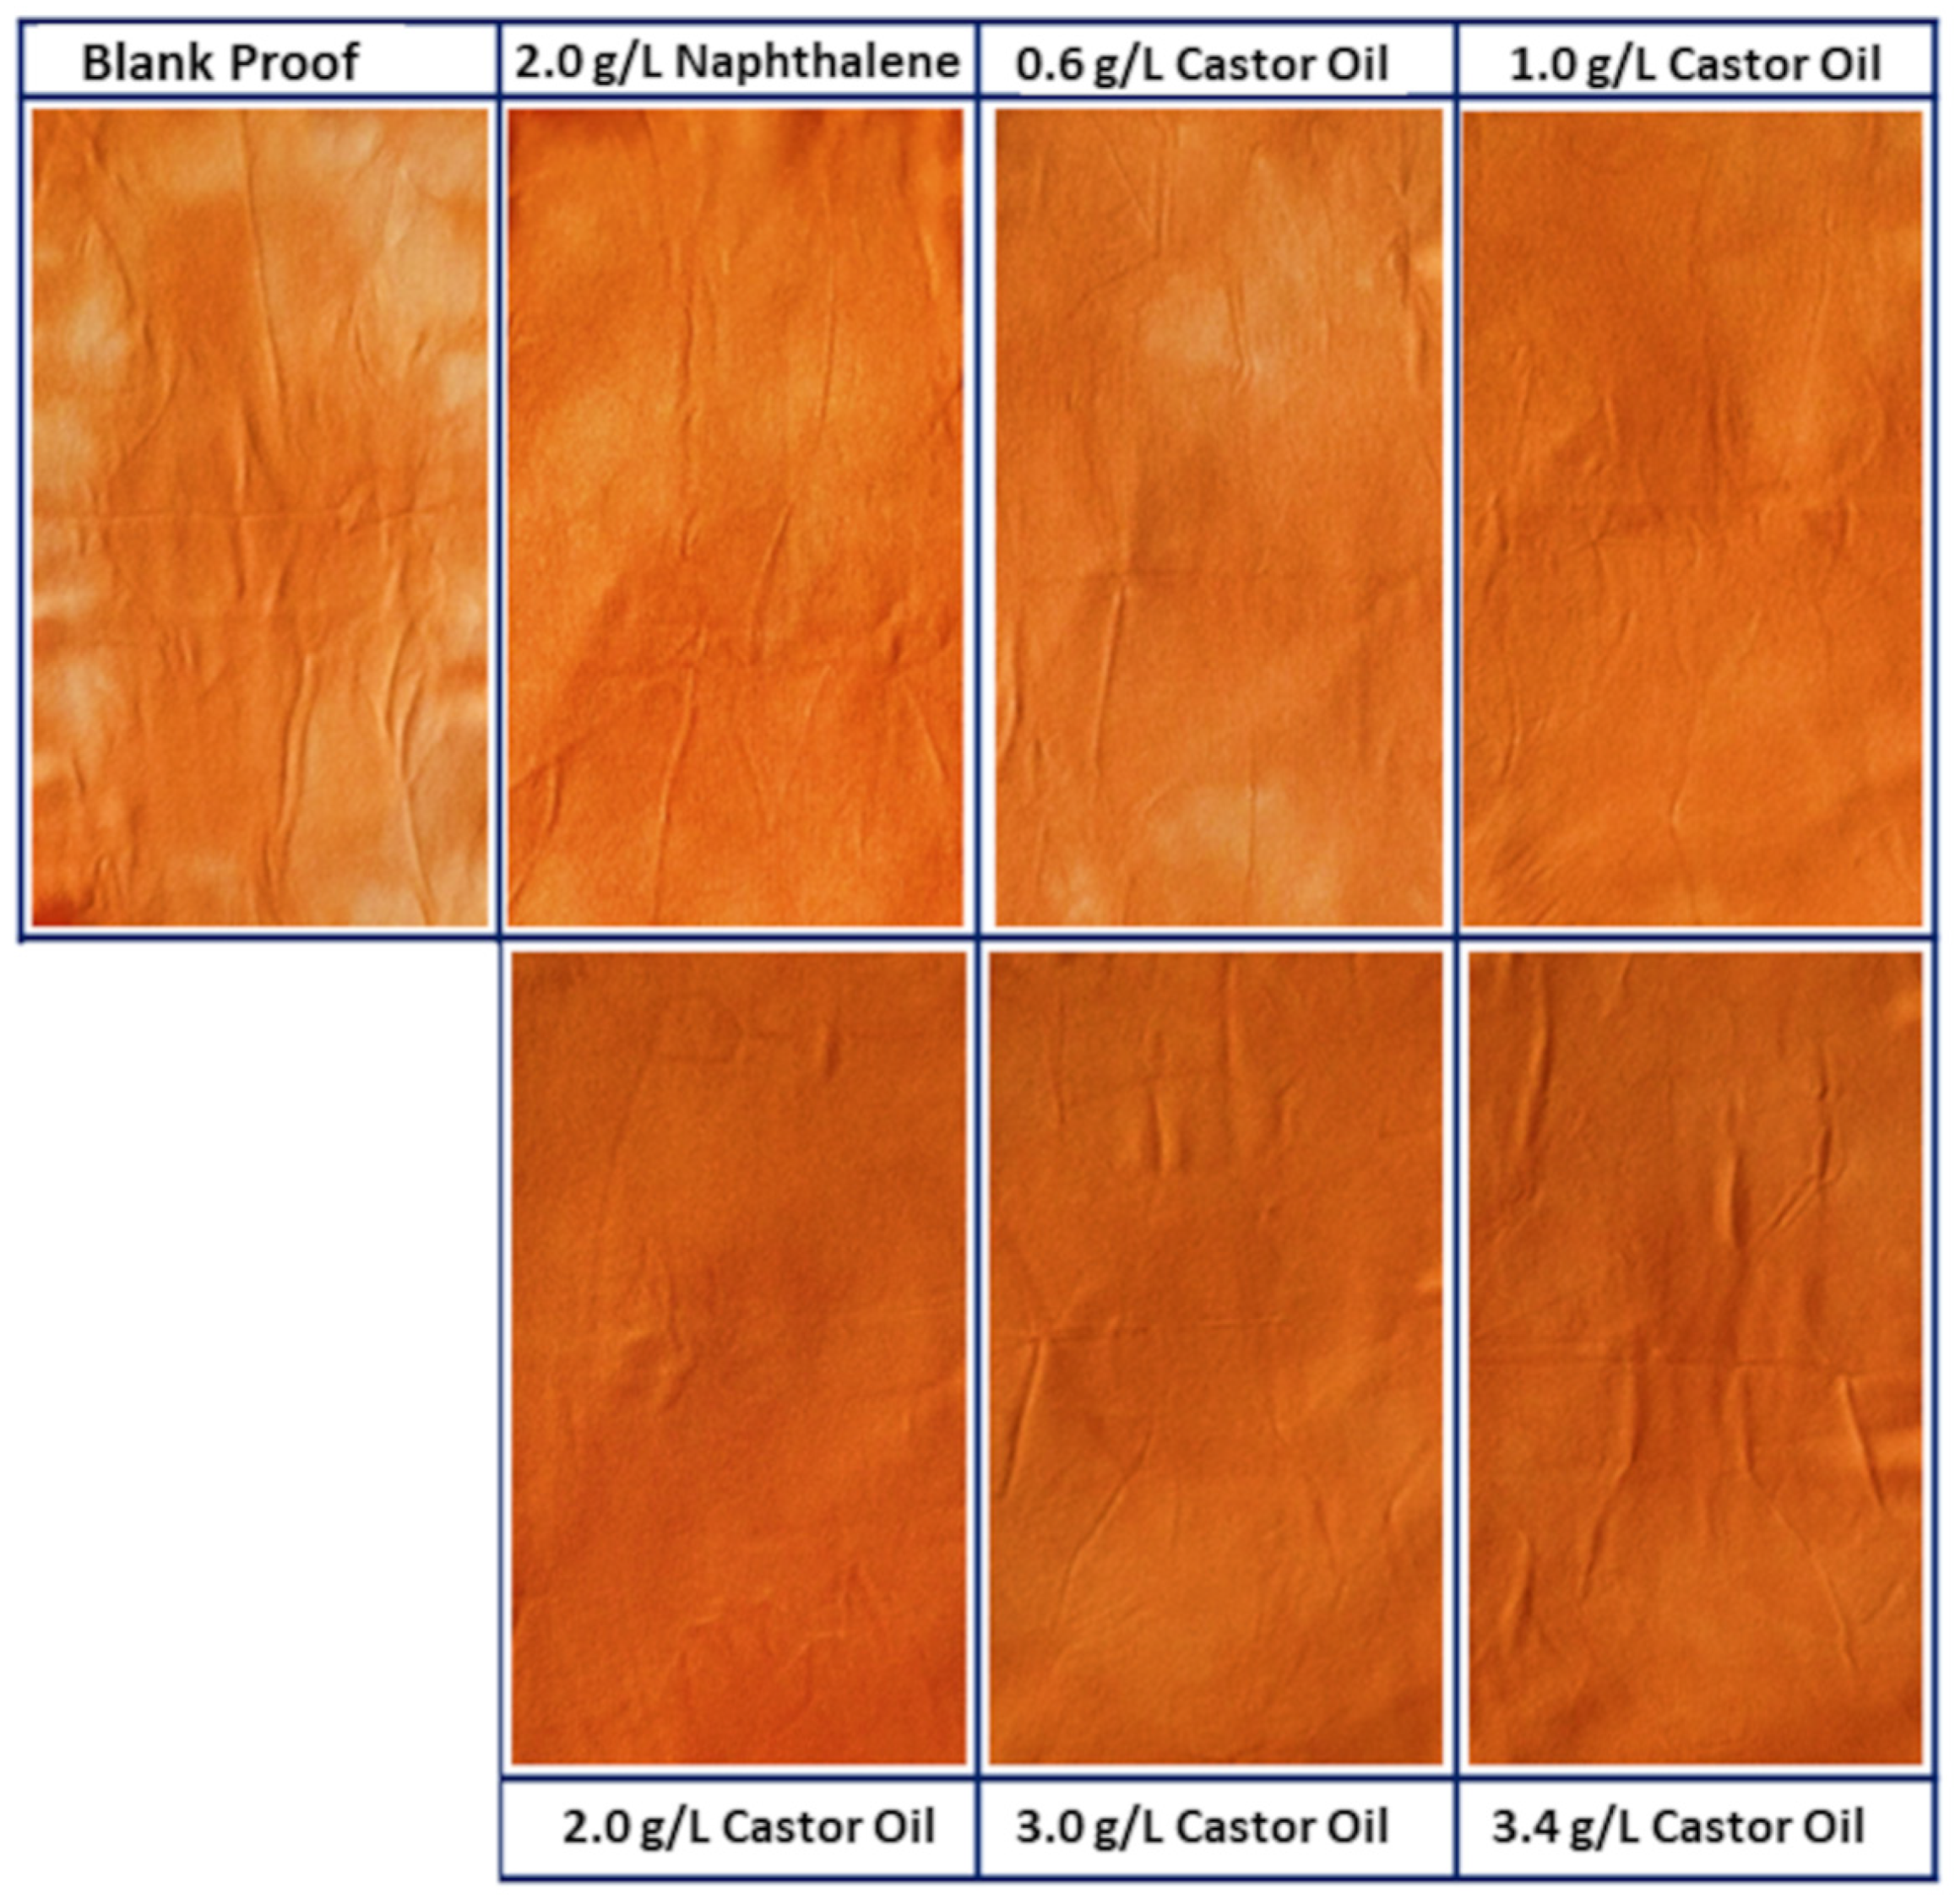
Faced with dyeing in ideal situations in the laboratory, with excellent levelness results, such as those presented in the previous tests, the migration test has the objective of verifying the real potential of a leveling agent in a situation of little equalization, such as cases of reprocessing.
Figure 14 shows photos of reprocessing treated with TRO and the standard with SNS, making it possible to visually verify the difference between the test without a leveling agent and the test with the SNS standard.
The tests were performed with 2.0 g·L
−1 of sodium naphthalene sulfonate and different concentrations of TRO (0.6 g·L
−1, 1.0 g·L
−1, 2.0 g·L
−1, 3.0 g·L
−1 and 3.4 g·L
−1), plus a control sample (second step without the addition of leveling agent). In
Figure 15, it is possible to visualize the photos of the reprocessed fabrics (after the second step) of the control sample with an uneven aspect. The standard (SNS) has a more even aspect than the samples with TRO, where a significant improvement in levelness is observed for the samples with 2.0 g·L
−1, 3.0 g·L
−1 and 3.4 g·L
−1.
Color measurements of the dyed polyester fabric samples were taken in four different areas of the samples (that is, four quadrants: upper front, lower front, upper back and lower back). The readings were performed at four different points in each area, from which an average value is shown in
Table 12. It is possible to verify that the TRO presents better performance than the standard leveling agent SNS at the same concentration. The average of ∆E specific to the SNS standard is equal to 2.22, while the test with 2.0 g·L
−1 of TRO presented an average ∆E of 0.86.
3.7. Dispersion, Hydrophilicity, Wetting and Ionic Demand Tests
To evaluate the efficiency of the dispersants, dispersibility tests were conducted by measuring the filtering time of dye solutions, with and without dispersant. The residues present in the filters were evaluated under standard filtering conditions. The results obtained are shown in
Table 13 and
Figure 16.
According to the scale, the control sample presented a score of 1, where a large presence of dye particles on the filter is verified. On the other hand, the filter with SNS presented a score of 4, and the filter with TRO presented a score of 5, related to a lesser presence of dye particles on the filter.
With these results, it is possible to state that the TRO has a very satisfactory dispersing power, even presenting better results than the SNS standard.
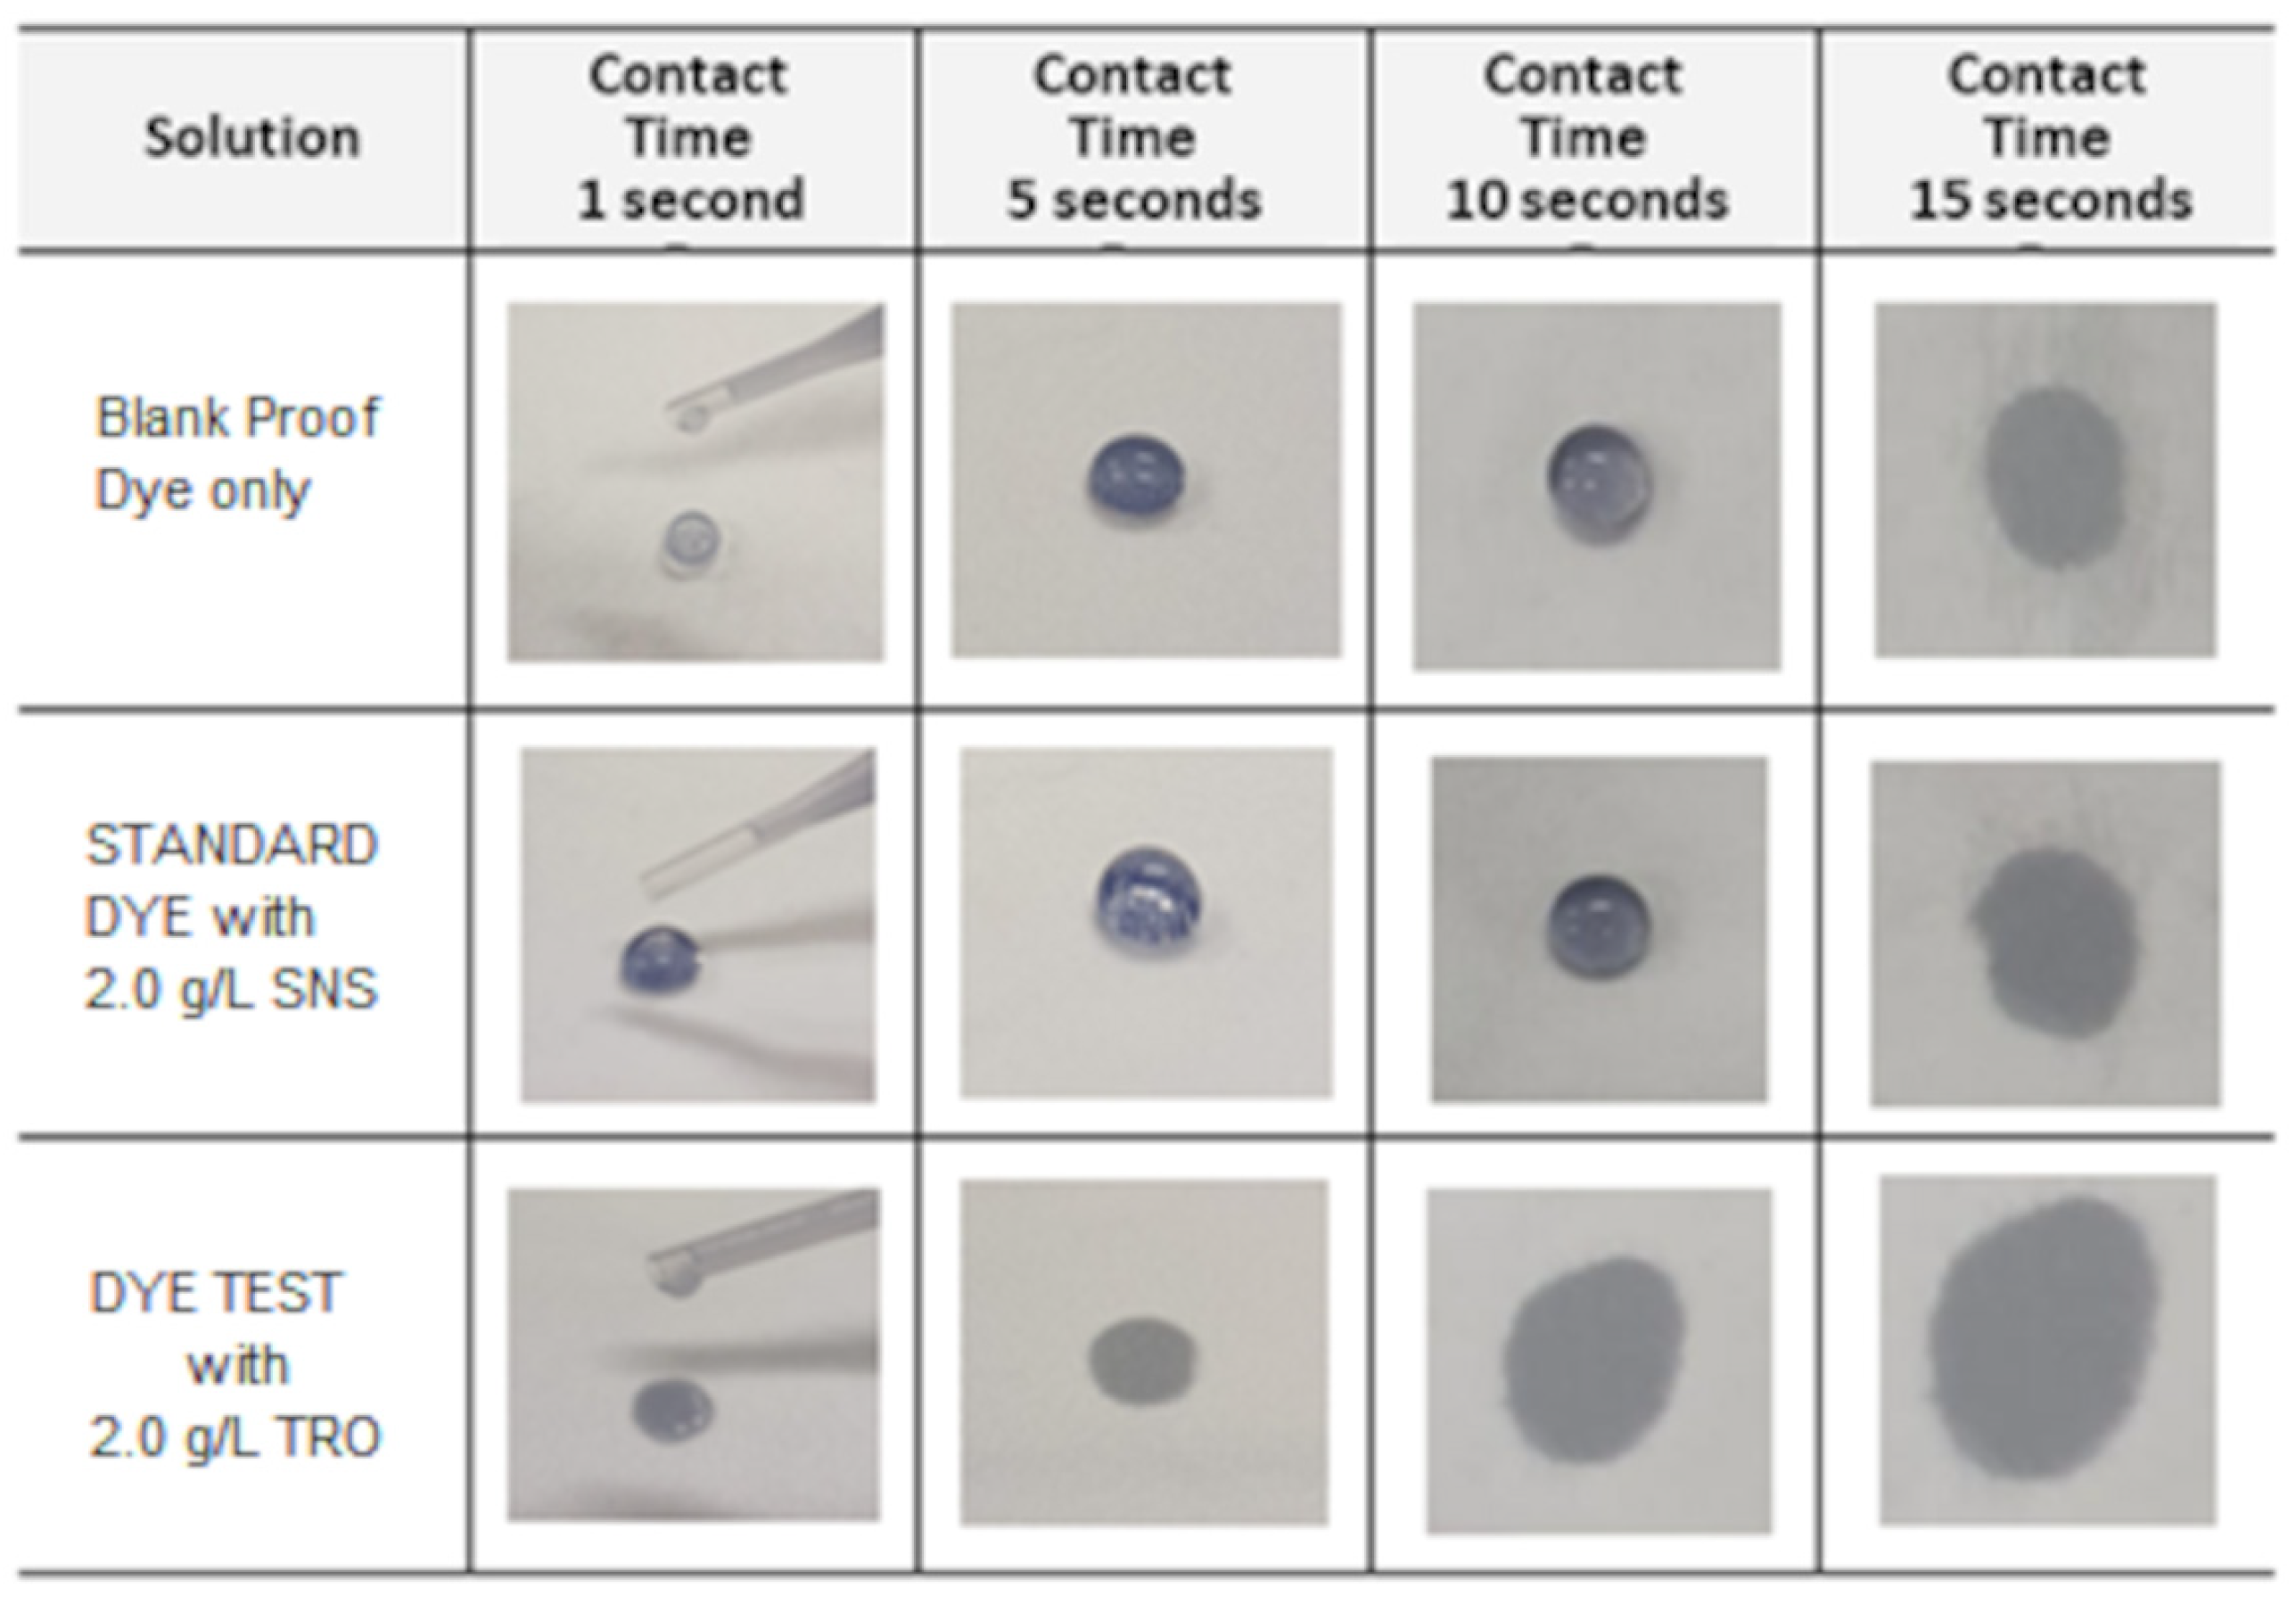
Hydrophilicity analysis by capillarity of the SNS standard, control and samples treated with 2.0 g·L
−1 TRO was carried out. It is possible to see, through
Figure 17, a greater and more uniform capillarity in the sample with TRO. The results demonstrate the efficiency of TRO as a surfactant due to the evenness and better capillarity.
Wetting tests were also carried out on standard SNS samples, control and samples treated with 2.0 g·L
−1 TRO. Each test verified how long it takes for a drop of the solution placed on the textile material to be absorbed. As shown in
Figure 18 and
Table 13, the TRO presented the best result.
Another wetting test was performed by submersion; as shown, the TRO was also the one that presented the best result. With these results presented, it is possible to demonstrate and confirm the efficiency of TRO as a surfactant, with good wetting power for polyester fibers.
The results obtained in the ionic demand tests carried out using the Mutek equipment are shown in
Table 13, where it is observed that both the SNS and the TRO are presented as strongly anionic products. The SNS standard presents a higher ionic demand value than TRO. However, TRO also has a significant ionic demand value, thus confirming that it is an anionic dispersant. This confirms that anionic surfactants have the necessary ability to disperse dyes.
4. Conclusions
The analyses conducted demonstrate the possibility of replacing a petroleum-based product with a renewable alternative in the process of dyeing polyester with disperse dye. TRO was also better than SNS in terms of residual coloration of the dyeing solution, generating an effluent with a lower dye concentration. Additionally, the TRO performed better in the filtration tests.
For the dyeing tests at 130 °C, all measurements performed on dyed samples showed ∆E below 1, indicating good evenness. Moreover, higher K/S values were obtained with TRO compared to TRO under a given condition.
In this sense, with the results of dyeing, with variations in the concentration of TRO, time and temperatures, the levelness and dispersion tests show that the TRO presents efficient power in both dispersing and equalizing when compared to the standard sodium naphthalene sulfonate. It even presented the potential to use a smaller amount of product or decrease the processing time, which leads to lower energy consumption. In the evaluation of the residual dyeing solutions, the results show that the solutions with TRO present less color residue in the effluent than the solutions with SNS.
As for the ionic demand, the TRO showed a significant value, thus confirming that it is an anionic dispersant.
According to the analysis of washing and wet rubbing fastness of the dyed fabrics, the TRO even showed an increase in these properties in comparison to the SNS standard or the control. With the TGA technique, it was verified that the treatment with TRO presented a lower percentage of mass loss when compared to other samples. According to the hydrophilicity analysis by capillarity and wetting, the surfactant power of TRO stood out, with an increase in the hydrophilicity power of the material after dyeing and the wetting potential in solution; this was not evidenced with the SNS.
Therefore, it is concluded that TRO presents promising results for application as a dispersant and leveling agent for polyester dyeing, thus being a renewable and sustainable option for petroleum-based products.

 ,
, 


