
Tactile Perception of Woven Fabrics by a Sliding Index Finger with Emphasis on Individual Differences

Department of Advanced Fibro Science, Graduate School of Science and Technology, Kyoto Institute of Technology, Matsugasaki, Sakyo-ku, Kyoto 606-8585, Japan
*
Author to whom correspondence should be addressed.
Textiles 2023, 3(1), 115-128; https://doi.org/10.3390/textiles3010009
Submission received: 22 December 2022
/
Revised: 8 February 2023
/
Accepted: 13 February 2023
/
Published: 16 February 2023
(This article belongs to the Special Issue New Research Trends for Textiles, a Bright Future)
Abstract
:Haptic sensing by sliding fingers over a fabric is a common behavior in consumers when wearing garments. Prior studies have found important characteristics that shape the evaluation criteria and influence the preference of consumers regarding fabrics. This study analyzed the tactile perception of selected woven fabrics, with an emphasis on the participants’ individual differences. Individual differences generally are discarded in sensory experiments by averaging them. Small differences among consumers can be important for understanding the factors driving consumer preferences. For this study, 28 participants assessed fabrics with very distinct surface, compression, and heat transferring properties by sliding their index fingers along the surface of the fabric. The participants also engaged in a descriptive sensory analysis. The physical properties of the fabric were measured using the Kawabata Evaluation System for Fabrics (KES-F) system. Moreover, parameters at the finger–fabric interface, such as the contact force, finger speed, and skin vibration, were measured during the assessment. This study used analysis of variance to eliminate nonsignificant attributes. Consonance analysis was performed using principal component analysis (PCA) on the unfolded sensory and interface data matrices. Finally, the physical and interface data were regressed onto sensory data. The results showed that the contact force and finger speed were nonsignificant, while skin vibration was a possible replacement for surface physical properties measured by the Kawabata Evaluation System for Fabrics (KES-F) system with an equal or slightly improved explainability.
1. Introduction
Running their fingers over a fabric is a common consumer behavior when choosing and buying garments. In this tactile interaction, consumers may extract information on the special characteristics of the fabrics. Over time, this process can lead to the accumulation of consumer fabric evaluation criteria and can be the reason for their preference for certain fabrics.
Textile industry experts have used sensory analysis to understand consumer preferences for quality. In the case of descriptive sensory analysis (DA), trained panels have been used in product development to obtain consistent data and to find small differences among products. Recently, there has been an increasing interest in engaging consumers in DA. Related studies have also discussed the pros and cons, accuracy, and reliability issues between trained and consumer panels [1,2].
Both subjective and objective evaluations of fabrics are necessary to understand consumer preferences. One approach is to measure a series of physical values, such as tensile strength, shear stress, bending, and compression, using the Kawabata Evaluation System for Fabrics (KES-F) [3]. Prior studies have interpreted the values obtained in the DA in terms of physical values by correlation or regression [4,5]. Another reported approach used a user-oriented design to analyze the depth impression of natural and artificial materials using concept networks [6]. To understand individual perceptions and preferences, new characteristic values must be linked to individual senses to produce customized fabrics.
Recently, studies have analyzed the tactile sensation of materials using sensors that capture the movement of fingers running across fabric. The velocity of the moving finger [7], the measurement of the force applied by the finger, the velocity–vibration system [8], and the vibration [9] have been assessed. These attributes are measured very closely to the fabric and are expected to be closely related to the physical properties of the fabric. Given the two-way mechanisms of haptics, some information related to abstract preference layers may also be collected in these new attributes. These abstract layers are closely related to consumer individuality. We expect this information to support the understanding of the individual tactile nature of consumers [10].
In this study, a fundamental case in which a person slides their index finger over a woven fabric surface was considered. Three parameters were measured: the contact force, sliding speed, and skin vibration (hereinafter referred to as interface attributes). To better mimic a familiar environment, little constraint was imposed on participants when moving their finger from left to right along the length of the sample. Furthermore, a DA and measurements of the physical properties of the fabrics were also conducted.
The study mainly focused on the differences among the participants and the interplay between the DA, interface attributes, and physical attributes. Understanding participants’ individuality was prioritized in this study and not sample differences. Samples were selected for easy discrimination, especially regarding surface properties. This had the benefits of reducing the mental burden and speeding up the experiment. Unless explicitly mentioned, the individual averages were not recorded during the experiment.
The analysis strategy comprised (a) elimination of non-significant sensory and interface attributes following a qualitative investigation of (b) the level of agreement among the participants for each attribute (consonance analysis). Finally, the relationship between the sensory attributes, interface attributes, and physical properties was investigated using (c) linear regression. (a) ANOVA; (b) PCA; and (c) principal component regression (PCR).
2. Materials and Methods
2.1. Samples
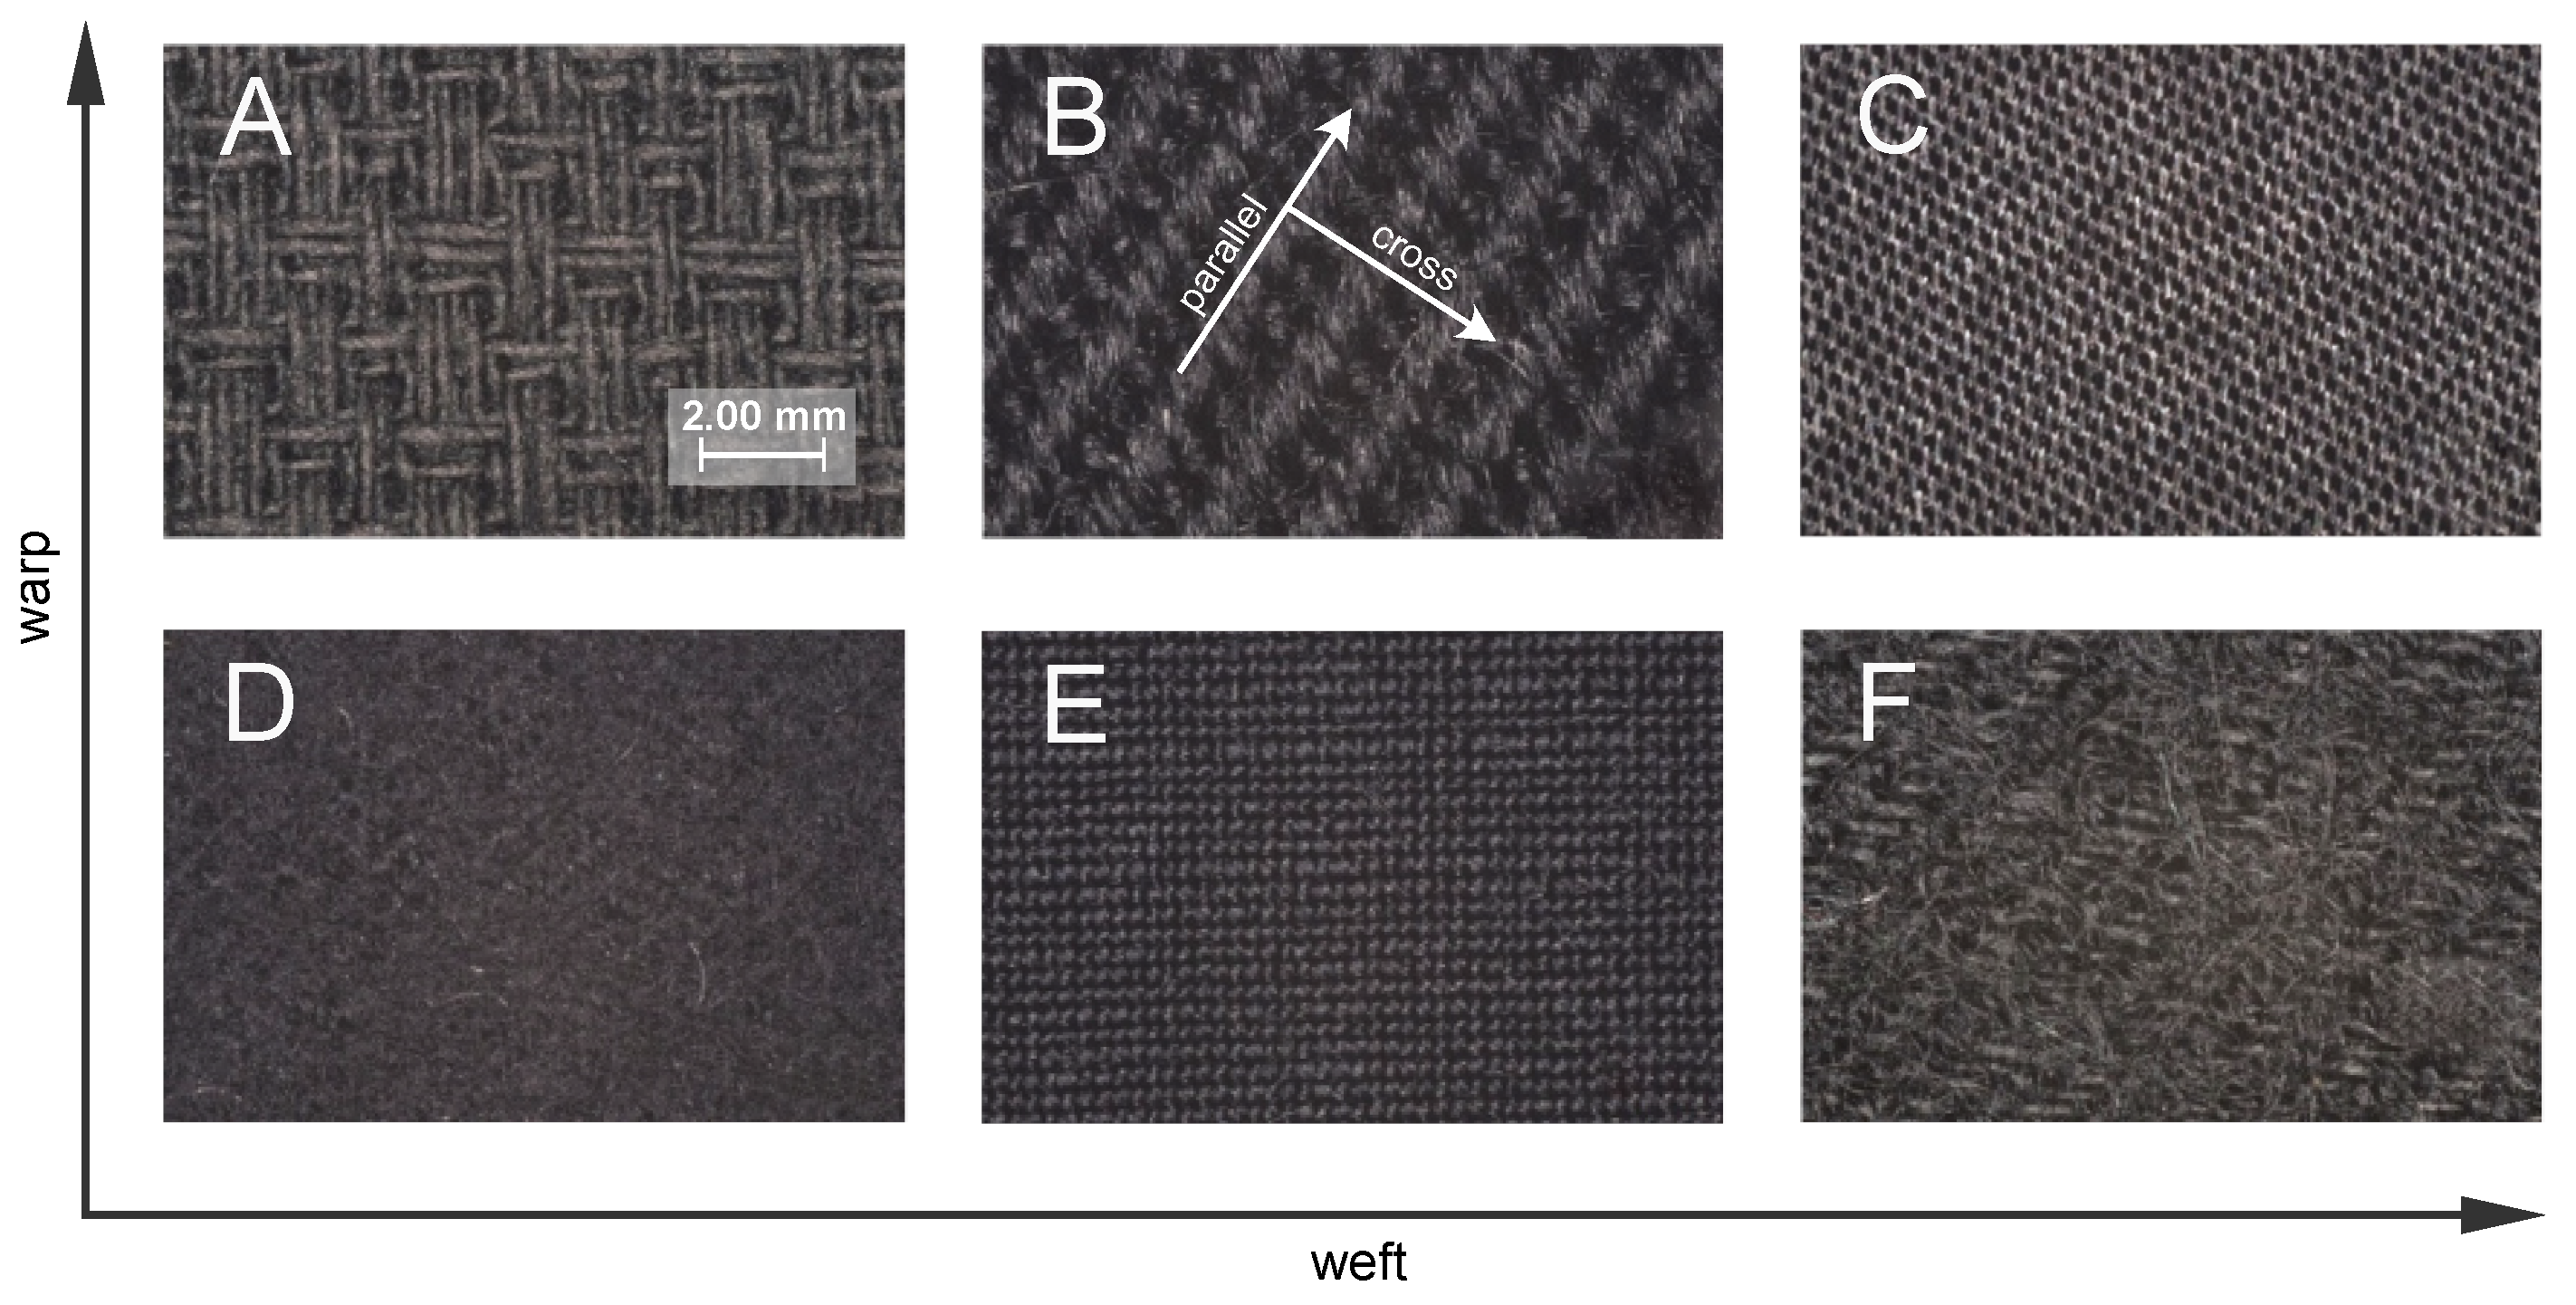
Six woven fabric samples with different weave structures and surface roughness values were used in this study. Photographs of the sample surfaces are shown in Figure 1. The specifications of each sample are listed in Table 1. The surfaces of samples D and F were hairy; however, the surface of sample D was smooth and composed of fine wool fibers. The color of the fabrics was assessed using a colorimeter (CM-3600d; Konica Minolta, Inc., Tokyo, Japan) under illuminant D65 conditions with a 10 field of vision. The values of L*, a*, and b* are listed in Table 1. In sample B (3 × 1 twill), a large weave rib is clearly observed compared to the other samples, as shown in Figure 1.
2.2. Participants
Twenty-eight participants (14 men and 14 women) took part in the finger-sliding experiment for a total of 14 specimens, as listed under the ‘Code No.’ column in Table 2. The participants evaluated the samples by sliding the fingers along the warp and weft directions of all samples, and additionally for two extra directions for sample B (parallel and cross). All participants were university students (aged 22–25 years) with normal color vision and normal or corrected-to-normal visual acuity. The order of evaluation of the samples was randomized.
2.3. Measurements
2.3.1. Physical Properties: Surface, Compression, and Heat Flow Properties
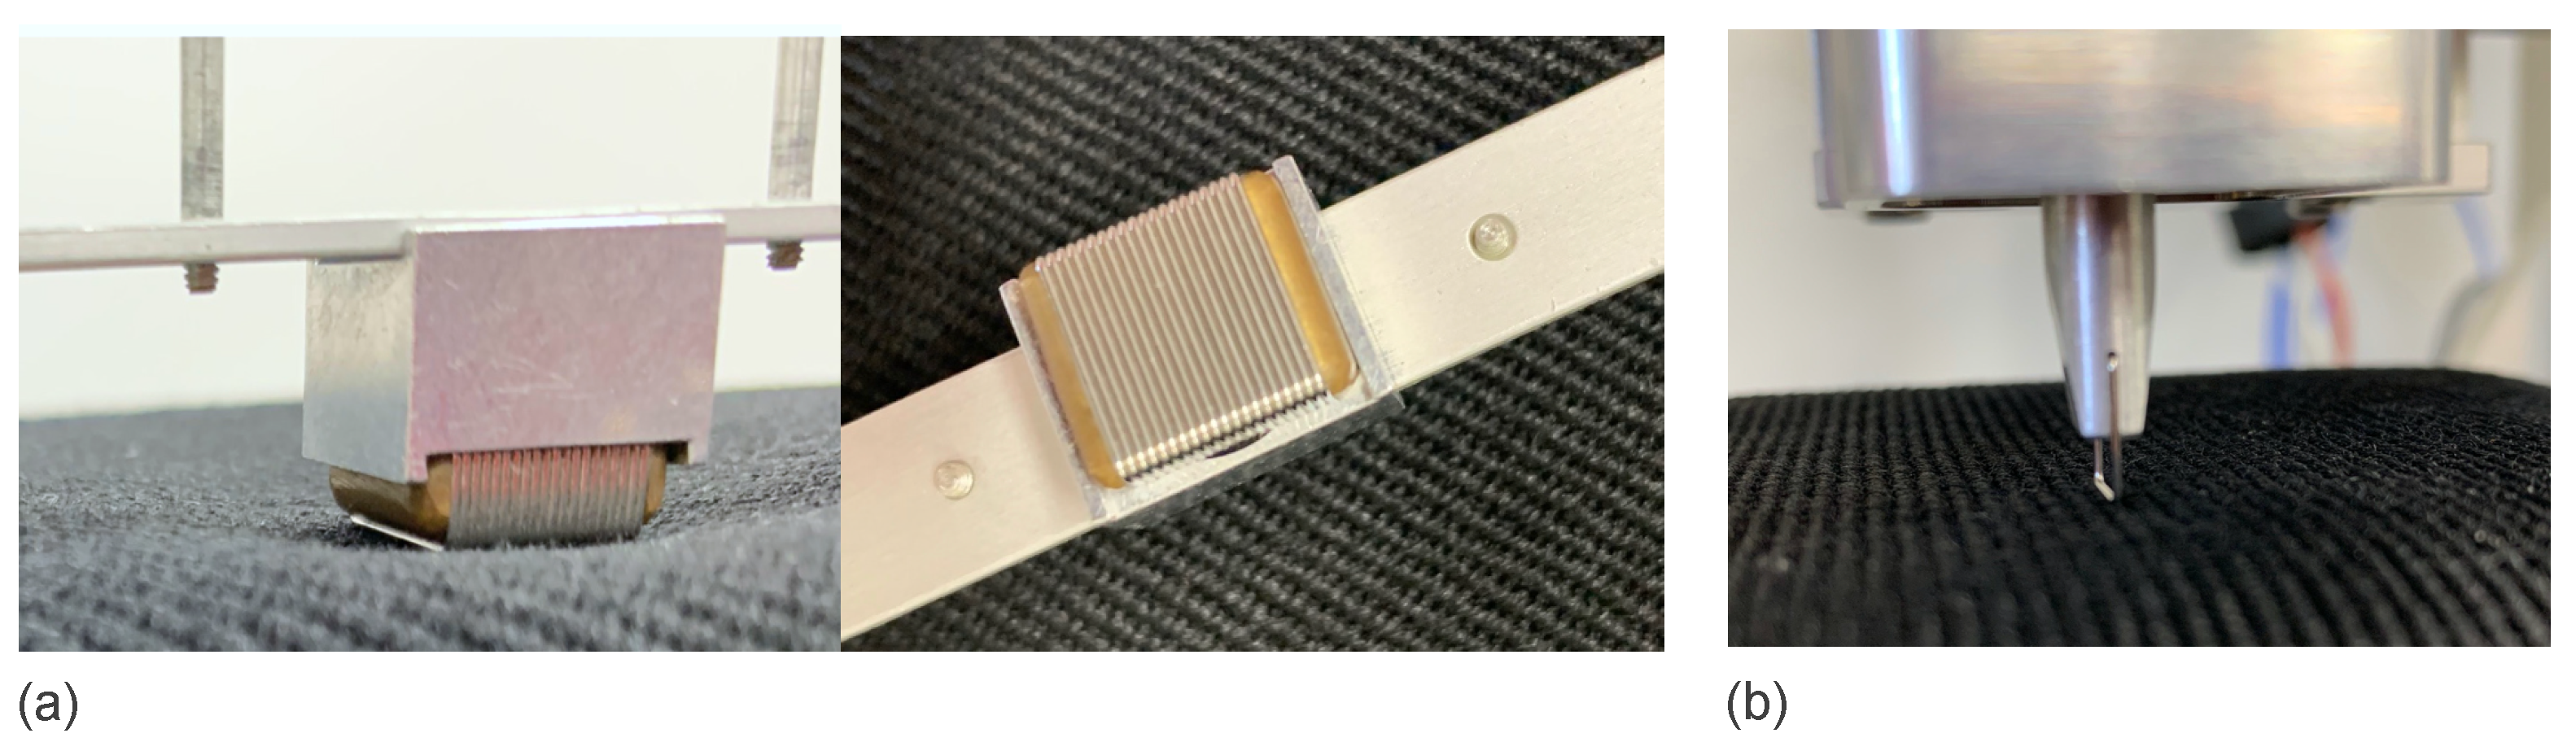
Surface properties of the fabrics, such as surface roughness (SMD), coefficient of friction (MIU), and mean deviation of MIU (MMD), were measured under standard measurement conditions along the warp and weft directions using KES-SE-SR and KES-SE surface testers (Kato Tech Co., Ltd., Kyoto, Japan), respectively. The shapes of the surface contact sensors used to measure MIU, MMD, and SMD are shown in Figure 2a,b, respectively. For sample B, the surface properties were measured along four directions, as shown in Figure 1, because a difference in the SMD values along different directions was expected. The compression properties were measured using KES-G5 (Kato Tech Co., Ltd., Japan) under standard measurement conditions (Table A1, Appendix A). The parameters LC (linearity of compression–thickness curve), WC (compression energy, J/m), and RC (compression resilience, %) were obtained. All measurements were performed on three fabric specimens from each sample (20 cm × 20 cm) at room temperature (23 ± 2 °C) and (60 ± 5)% relative humidity. The maximum value of the heat flow (qmax, W/cm2), which is related to the warm/cool feeling, was also measured using a KES Thermo Labo II (Kato Tech Co., Ltd., Kyoto, Japan) in accordance with the JIS L1927 standard.
2.3.2. Descriptive Sensory Evaluation
Eleven sensory attribute pairs divided into two groups were evaluated in this study. The first group was related to the fundamental physical properties of the fabric: warm/cool, hard/soft, flat/bumpy, rough/smooth, thin/thick, slippery/sticky, and weak/strong. The other group was related to personal preferences and experiences: new/familiar, expensive/cheap, uncomfortable/comfortable, and like/dislike. Participants rated the fabric on a scale ranging from 1 to 7 in accordance with the semantic differential method [11]. Each participant was presented with samples in random order. All four edges of the fabric were attached to a 10 cm × 60 cm cardboard of 1 mm thickness to prevent movement of the sample.
2.3.3. Interface Parameters: Index Finger Skin Vibration, Contact Force, and Translation Speed
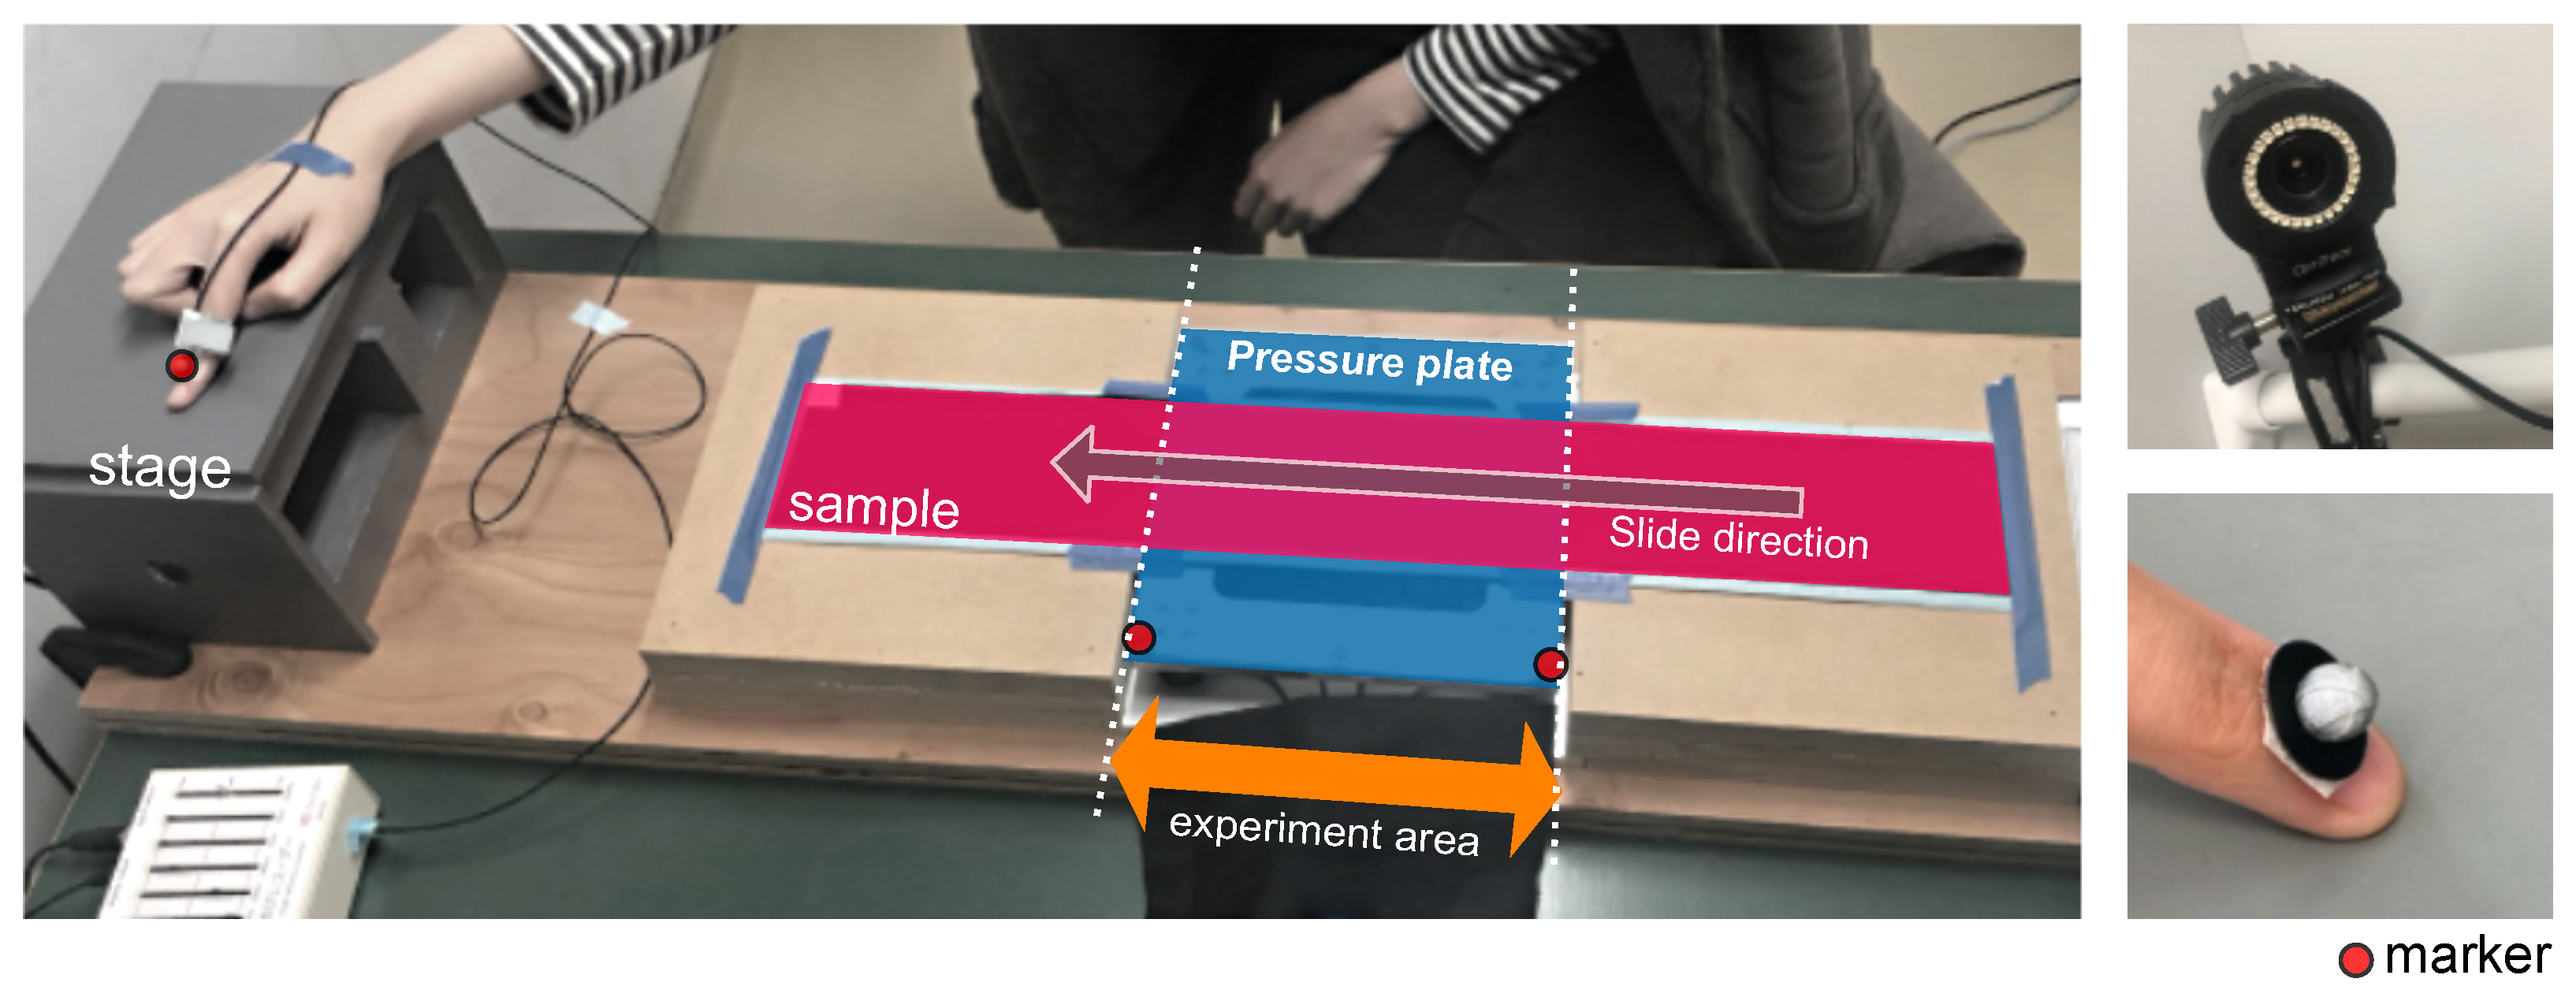
Participants assessed the sample by sliding their right index finger over the length of the sample four times, from left to right. A force plate (3-axis force plate; 20 cm × 20 cm, TF-2020, Tec Gihan Co., Ltd., Kyoto, Japan) was placed under the sample to measure the contact force. A skin vibration sensor (Yubi recorder, Tec Gihan Co., Ltd., Kyoto, Japan) was wrapped around the distal interphalangeal joint of each participant’s index finger to measure the vibrations of the skin triggered by the sliding movement of the finger over the fabric surface. A motion capture system (Motive, Nobby Tech, Ltd., Tokyo, Japan) comprising six cameras and three markers (4 mm diameter) was used in this study. One marker was used on the finger to track its location and calculate its speed. Two markers were used to indicate the location of the force plate in the motion capture space. Data logging was synchronized over the period of each assessment. The ambient conditions were (23 ± 2) °C with a relative humidity of 60.5%. The luminance over the fabric was 150 lx, and the effect of the color difference on visual perception was marginal. The details of the setup are shown in Figure 3. In this experiment, the following characteristic parameters were obtained: area under the power spectral density (PSD) of the vibration signal between 60 and 1000 Hz, delta power (DP, mV); contact force (Fz, N), and finger speed along the sample (v, m/s). The contact force and speed were averaged over the finger slides.
2.4. Analysis
It is important to recognize and consider the various differences that may exist among participants in sensory description experiments. This recognition and consideration play a crucial role in deciding on an appropriate model for data analysis, as well as in the interpretation of the results and determination of the most suitable analysis strategy. The following is a non-exhaustive list of differences commonly observed among participants:
- Differences in the use of attributes and measurement scale;
- Discrimination ability;
- Differences in sensitivity (perception and recognition);
- Misunderstanding of the meaning of attributes;
- Confusion of similar attributes;
- Repeatability.
In contrast to a trained panel, where the above differences are considered undesirable, it is expected that such differences will manifest randomly among consumers (represented by the participants). Some of these differences may be mitigated. For example, centering of sensory attributes reduces the differences in the use of the measuring scale. Other differences may require more specialized experimental designs. However, it is important to acknowledge that, from the participant’s viewpoint in a decision-making scenario, these differences are of secondary importance as they collectively contribute to the participant’s unique individuality. This raises the question of the extent to which these differences should be taken into account. By focusing on the most general case, we have chosen to examine the degree of agreement among participants, also known as consonance analysis.
The overall analysis procedure included the following steps: (1) initial health check-up of the data using descriptive statistical analysis; (2) elimination of attributes with low significance through the use of ANOVA; (3) evaluation of the agreement among participants through the application of PCA and Tucker-1 modeling as part of a consonance analysis; and (4) analysis of the correlation between the sensory data, the physical properties of the samples, and the interface parameters through Principal Component Regression (PCR).
2.4.1. Datasets
The three datasets used in the study consisted of sensory descriptive analysis, physical properties, and interface data. The sensory dataset served as the master dataset. All datasets used in the analysis were centered. The interface data and physical properties were standardized. Unless otherwise specified, the data were not averaged to maintain the individuality of the participants. The structures of the three datasets are listed in Table 3.
2.4.2. Structure of the Sensory Dataset
In the sensory analysis experiment, m participants evaluated n samples for p attributes. The data formed a three-way table , with ; , and . The variance model, represented by Equation (1), comprised of participant effects, , sample effects, , and random error, :
The participant effects represented the differences between the average score of participant i (and attribute k) and the overall average for that attribute. Similarly, the sample effects described the differences between the average score of the jth sample for a particular attribute k and the overall average value for that sample and attribute. Since there were no replicate samples, the interaction term was confounded with the error. The interface dataset followed a similar structure.
2.4.3. Descriptive Statistical Analysis
The overall impression of the sensory and interface datasets was assessed by distribution plots of all participants and attribute scores for each sample. The presence of extreme outliers was investigated.
2.4.4. ANOVA
A two-way analysis of variance based on the variance model in Equation (1) was carried out. Attributes with a p-value < 0.05 were eliminated. Moreover, attributes with low agreement were also eliminated in the subsequent consonance analysis.
2.4.5. PCA and Tucker-1
Given the three-way structure of the data, it was deemed appropriate to employ three-way factor analysis (TWFA) in the study, utilizing the Tucker-1 modeling approach. TWFA represents a generalization of the principal component analysis (PCA) model for matrices of higher dimensions. The standard PCA of an matrix conforms to the following model:
where is the sample score, is the attribute loading, and is the matrix of residuals. The scores are defined to have orthogonal columns and the loadings orthogonal rows. The loadings P are defined to describe as much variation in as possible given a dimension a. Normally and are the projection of on . Alternatively, the problem can be stated as finding the and matrices that minimize the residuals in
In the context of Tucker-1 modeling, if we consider a slice of the three-way sensory data representing participant i’s individual sample-by-attributes matrix , where , can be defined as
where has dimension . and are found for any a by minimization of the residuals in
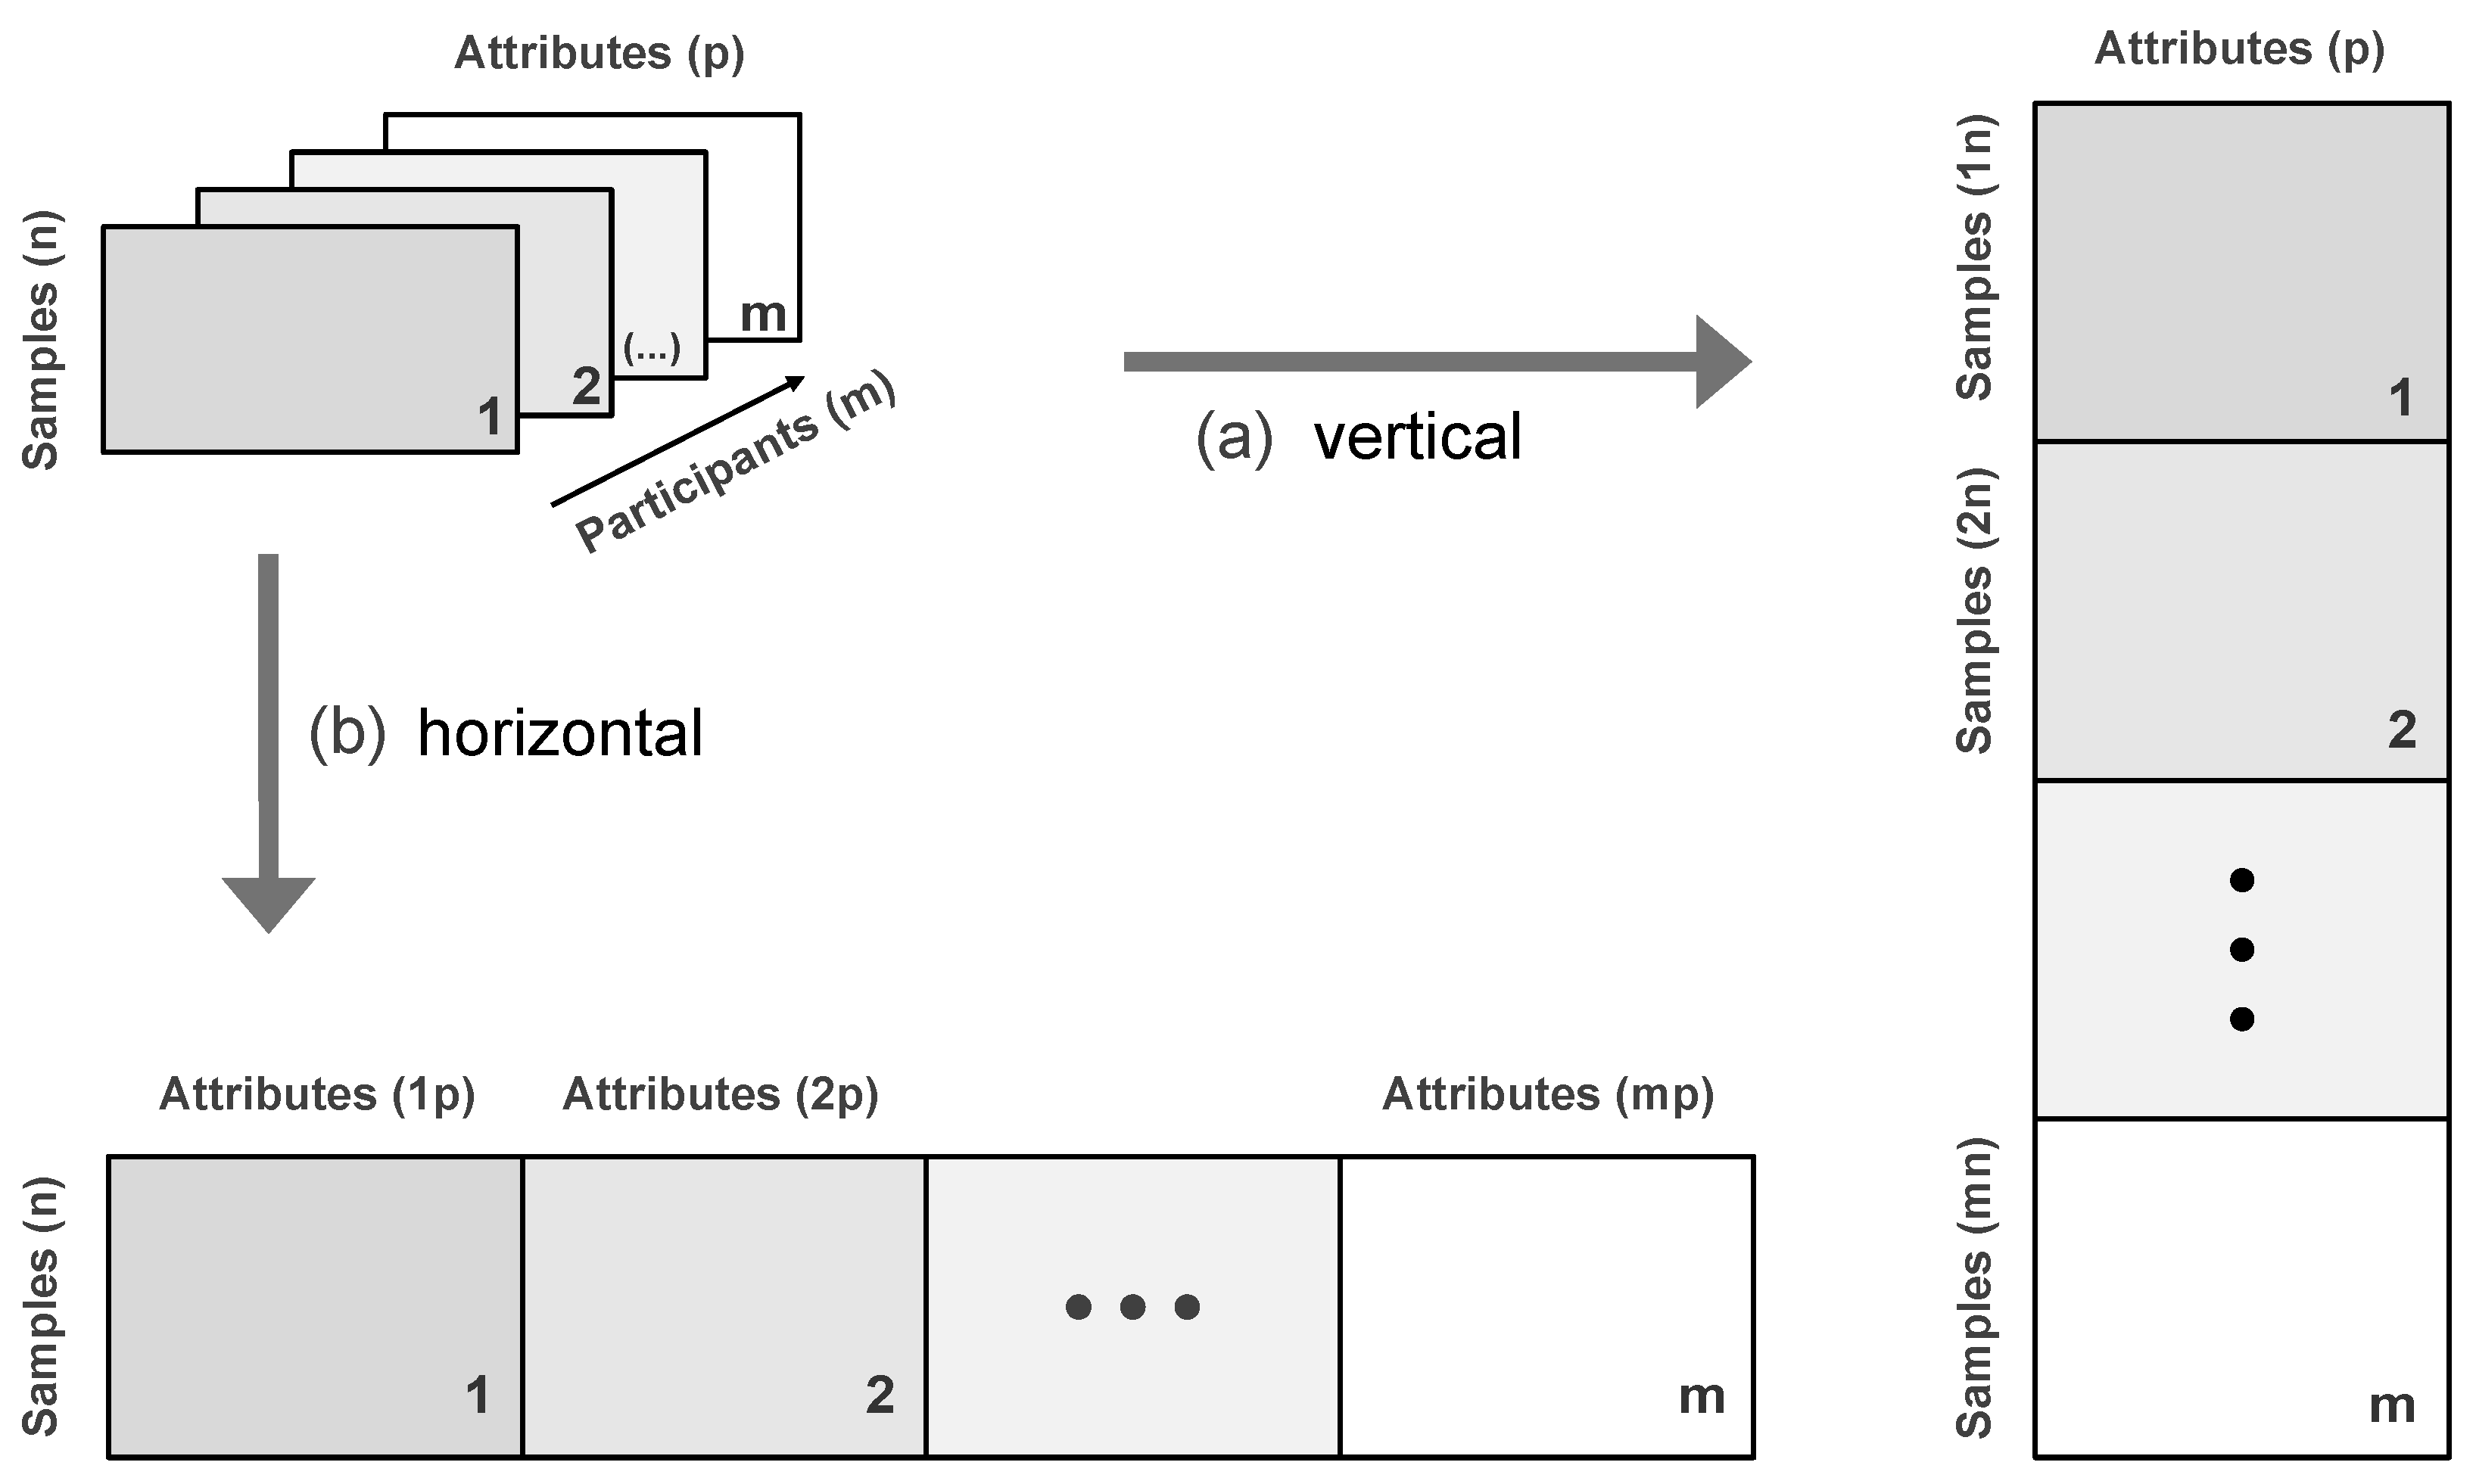
is constrained to have orthogonal rows () and the s are unconstrained. If the matrix is unfolded to give an matrix, it can be shown that the minimization can be achieved by applying the standard PCA to the unfolded matrix. This corresponds to the vertical unfolding in Figure 4. Similarly, if the matrix is unfolded as an matrix, it can be shown that the minimization of the criterion can be solved by standard PCA. The criterion is
where has dimensions and b stands for the reduced dimension. is constrained to have orthogonal columns () and s are unconstrained. For a more detailed description of the Tucker-1 model see [12,13].
2.4.6. Consonance Analysis—Visualization of Agreement among Participants
The level of agreement among participants was assessed by applying PCA to the unfolded sensory and interface data. The distinct unfolding direction results in a different perspective of the same underlying information. Vertical unfolding made it easier to see the variability in the sample’s score, whereas horizontal unfolding emphasized the variability in the attribute loadings. Cross-validation was performed by leaving one participant out in the case of vertical unfolding.
2.4.7. Principal Component Regression (PCR)
In sensory descriptive experiments, high semantic similarity among sensory attributes often leads to high correlation. Additionally, removing attributes is not always appropriate as the goal is often to comprehend subtle differences in meaning. Performing PCA before conducting a linear regression, also know as PCR, can address the issues caused by collinearity. Principal component regression analysis was performed to assess the influence of the physical properties and interface parameters on the sensory perception of the participants. The physical and interface datasets were joined into a single matrix for attributes not yet eliminated. The two steps of (1) PCA and (2) linear regression for the PCR model were
where X represents the sensory dataset, T represents the PCA scores, P represents the loadings, and E represents the residuals. PCA was conducted on each attribute separately, with rows as samples and columns as participants.
where y represents a physical or interface attribute, T is the PCA score, q is the regression coefficients for y on T, and f is the residuals. The regression coefficients are also known as regression loadings because they assume the same role as in Equation (8). The regression loading plots provided a direct relationship between the predictors (sensory data) and the response (physical attributes and interface attributes).
3. Results and Discussion
3.1. Descriptive Analysis
The median values of the distributions indicated discrimination tendencies among the participants. However, the high variance in the distributions makes it unclear whether each participant’s score follows the trend of the median.
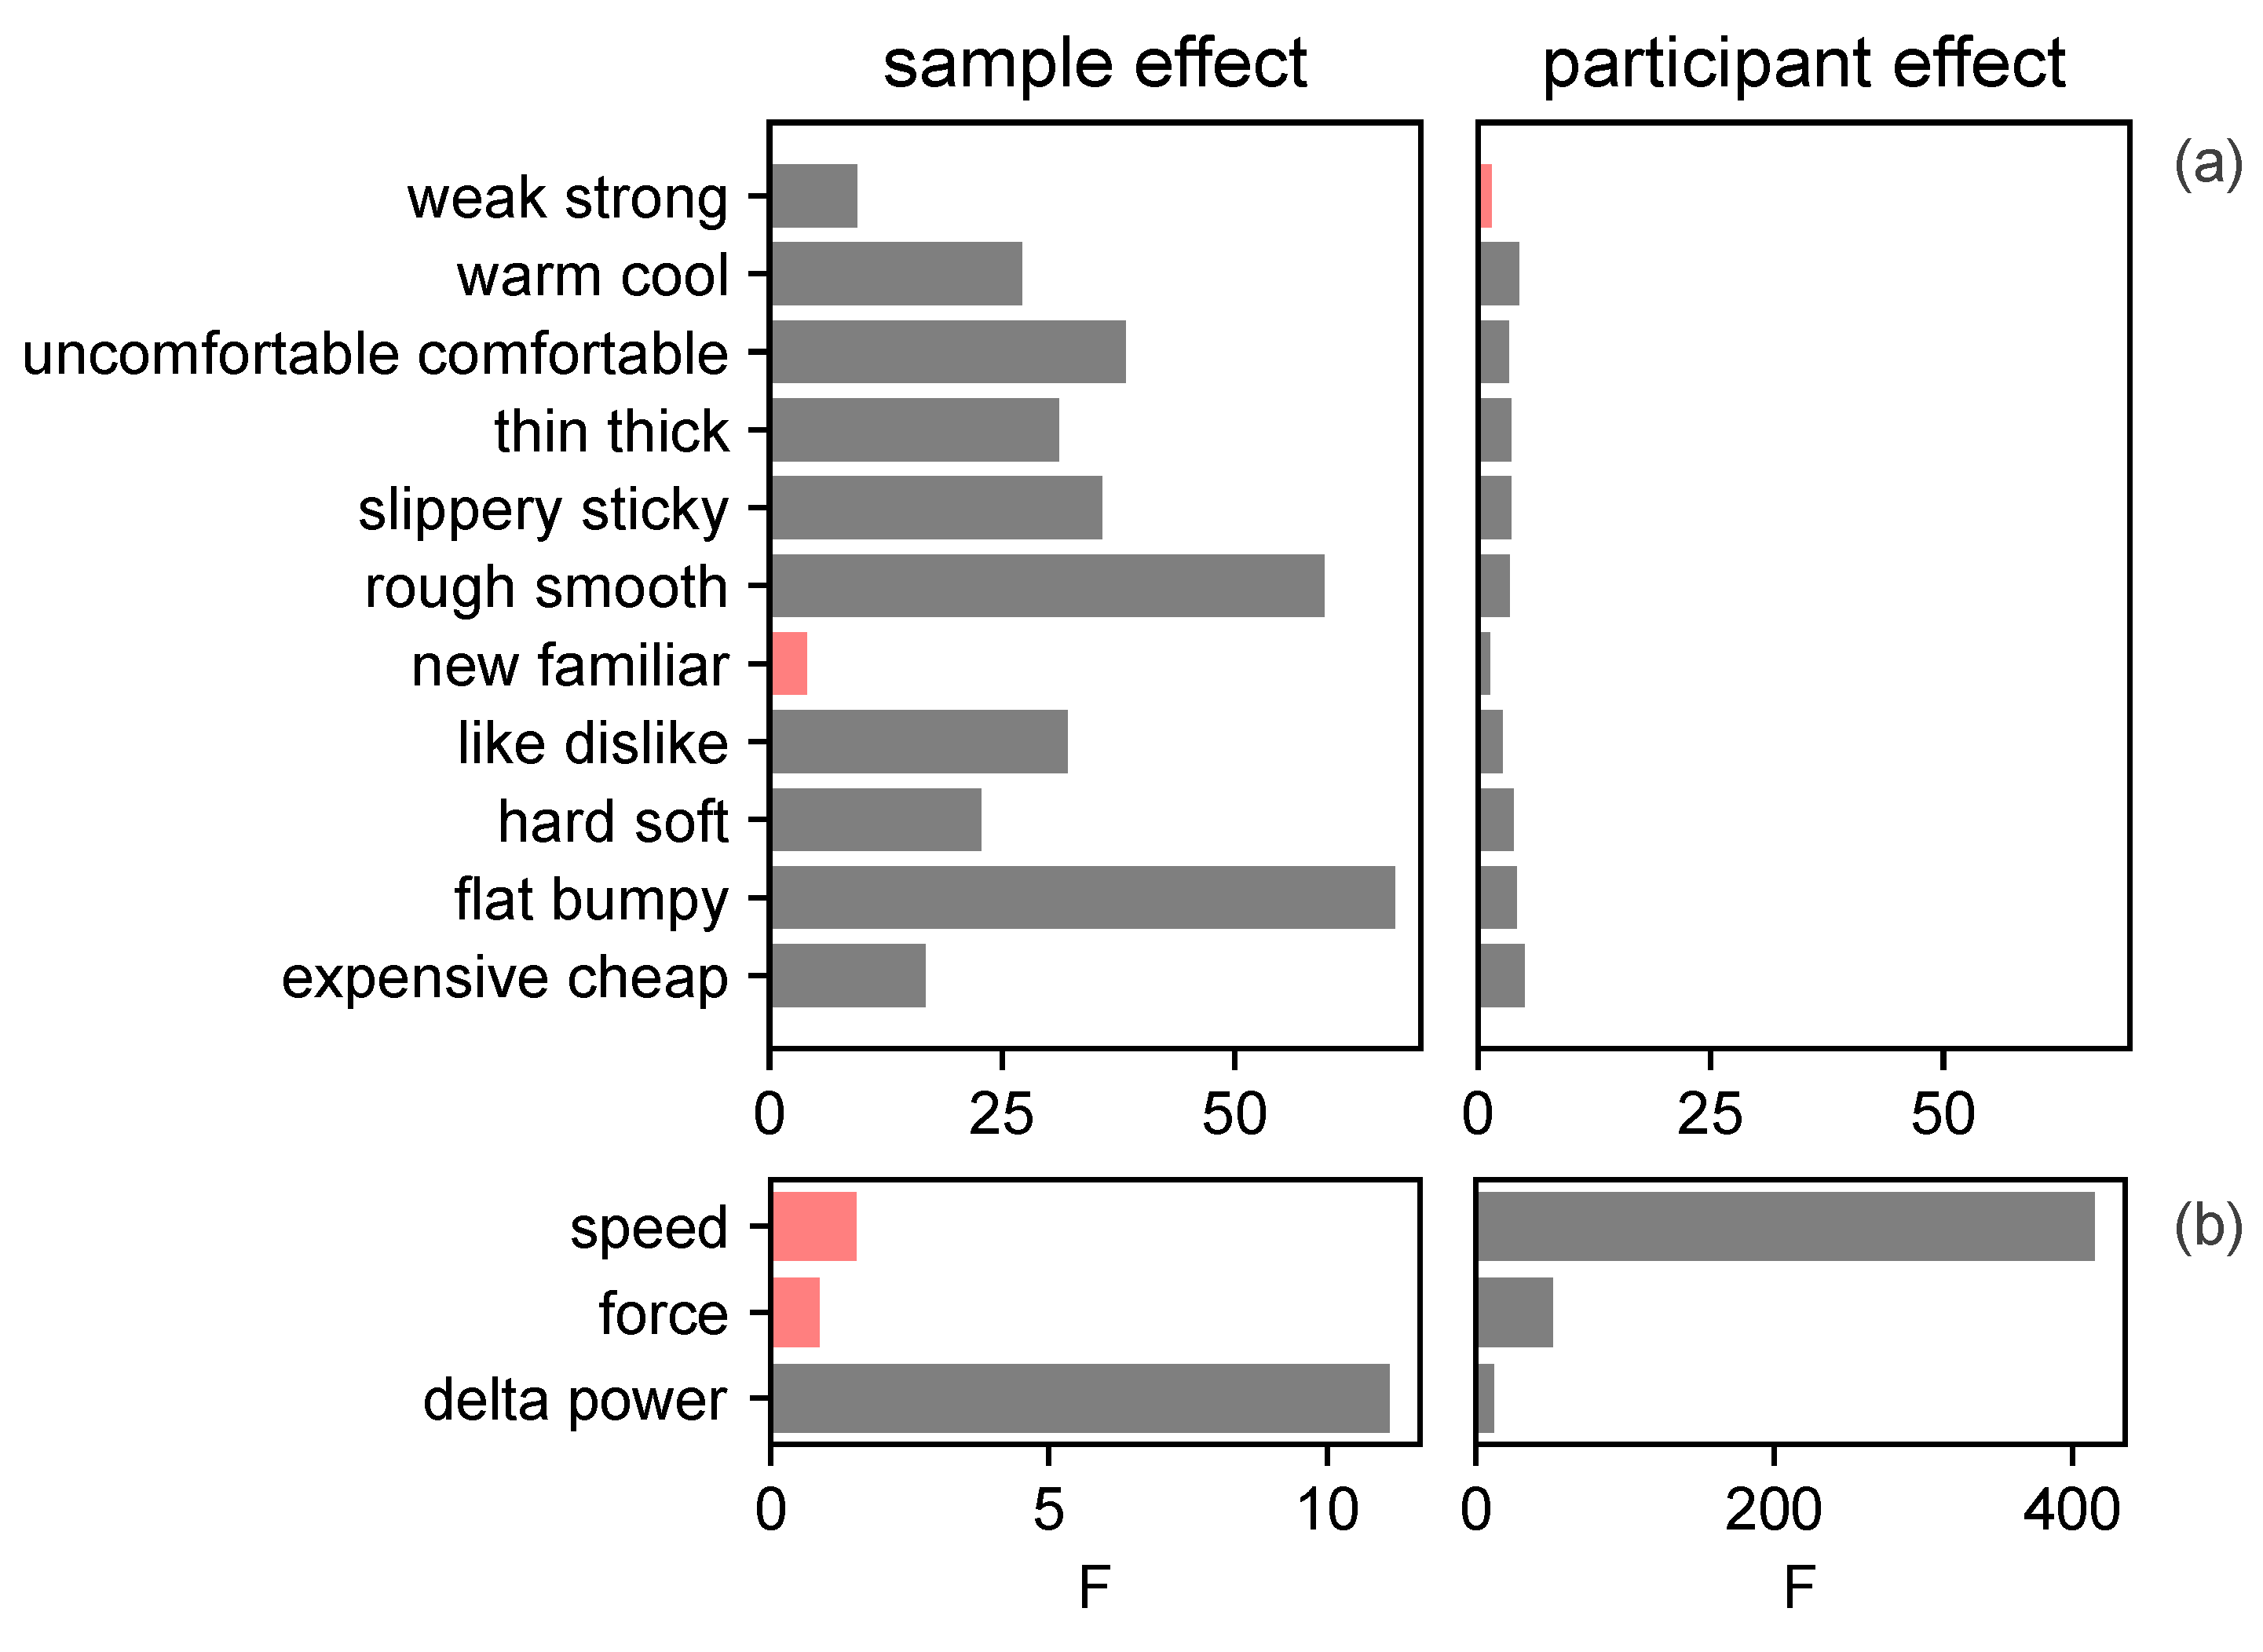
3.2. ANOVA
The attributes of weak/strong and new/familiar were found to be not significant in the sensory dataset. The speed and force were not significant in the interface dataset (Figure 5). Although the contact force and speed attributes were eliminated, there may still be important correlations not investigated in this study. For example, the time between evaluations of variations in speed may be correlated with the level of confusion over the attributes.
3.3. Consonance Analysis
3.3.1. Vertical Unfolding—Sensory Dataset
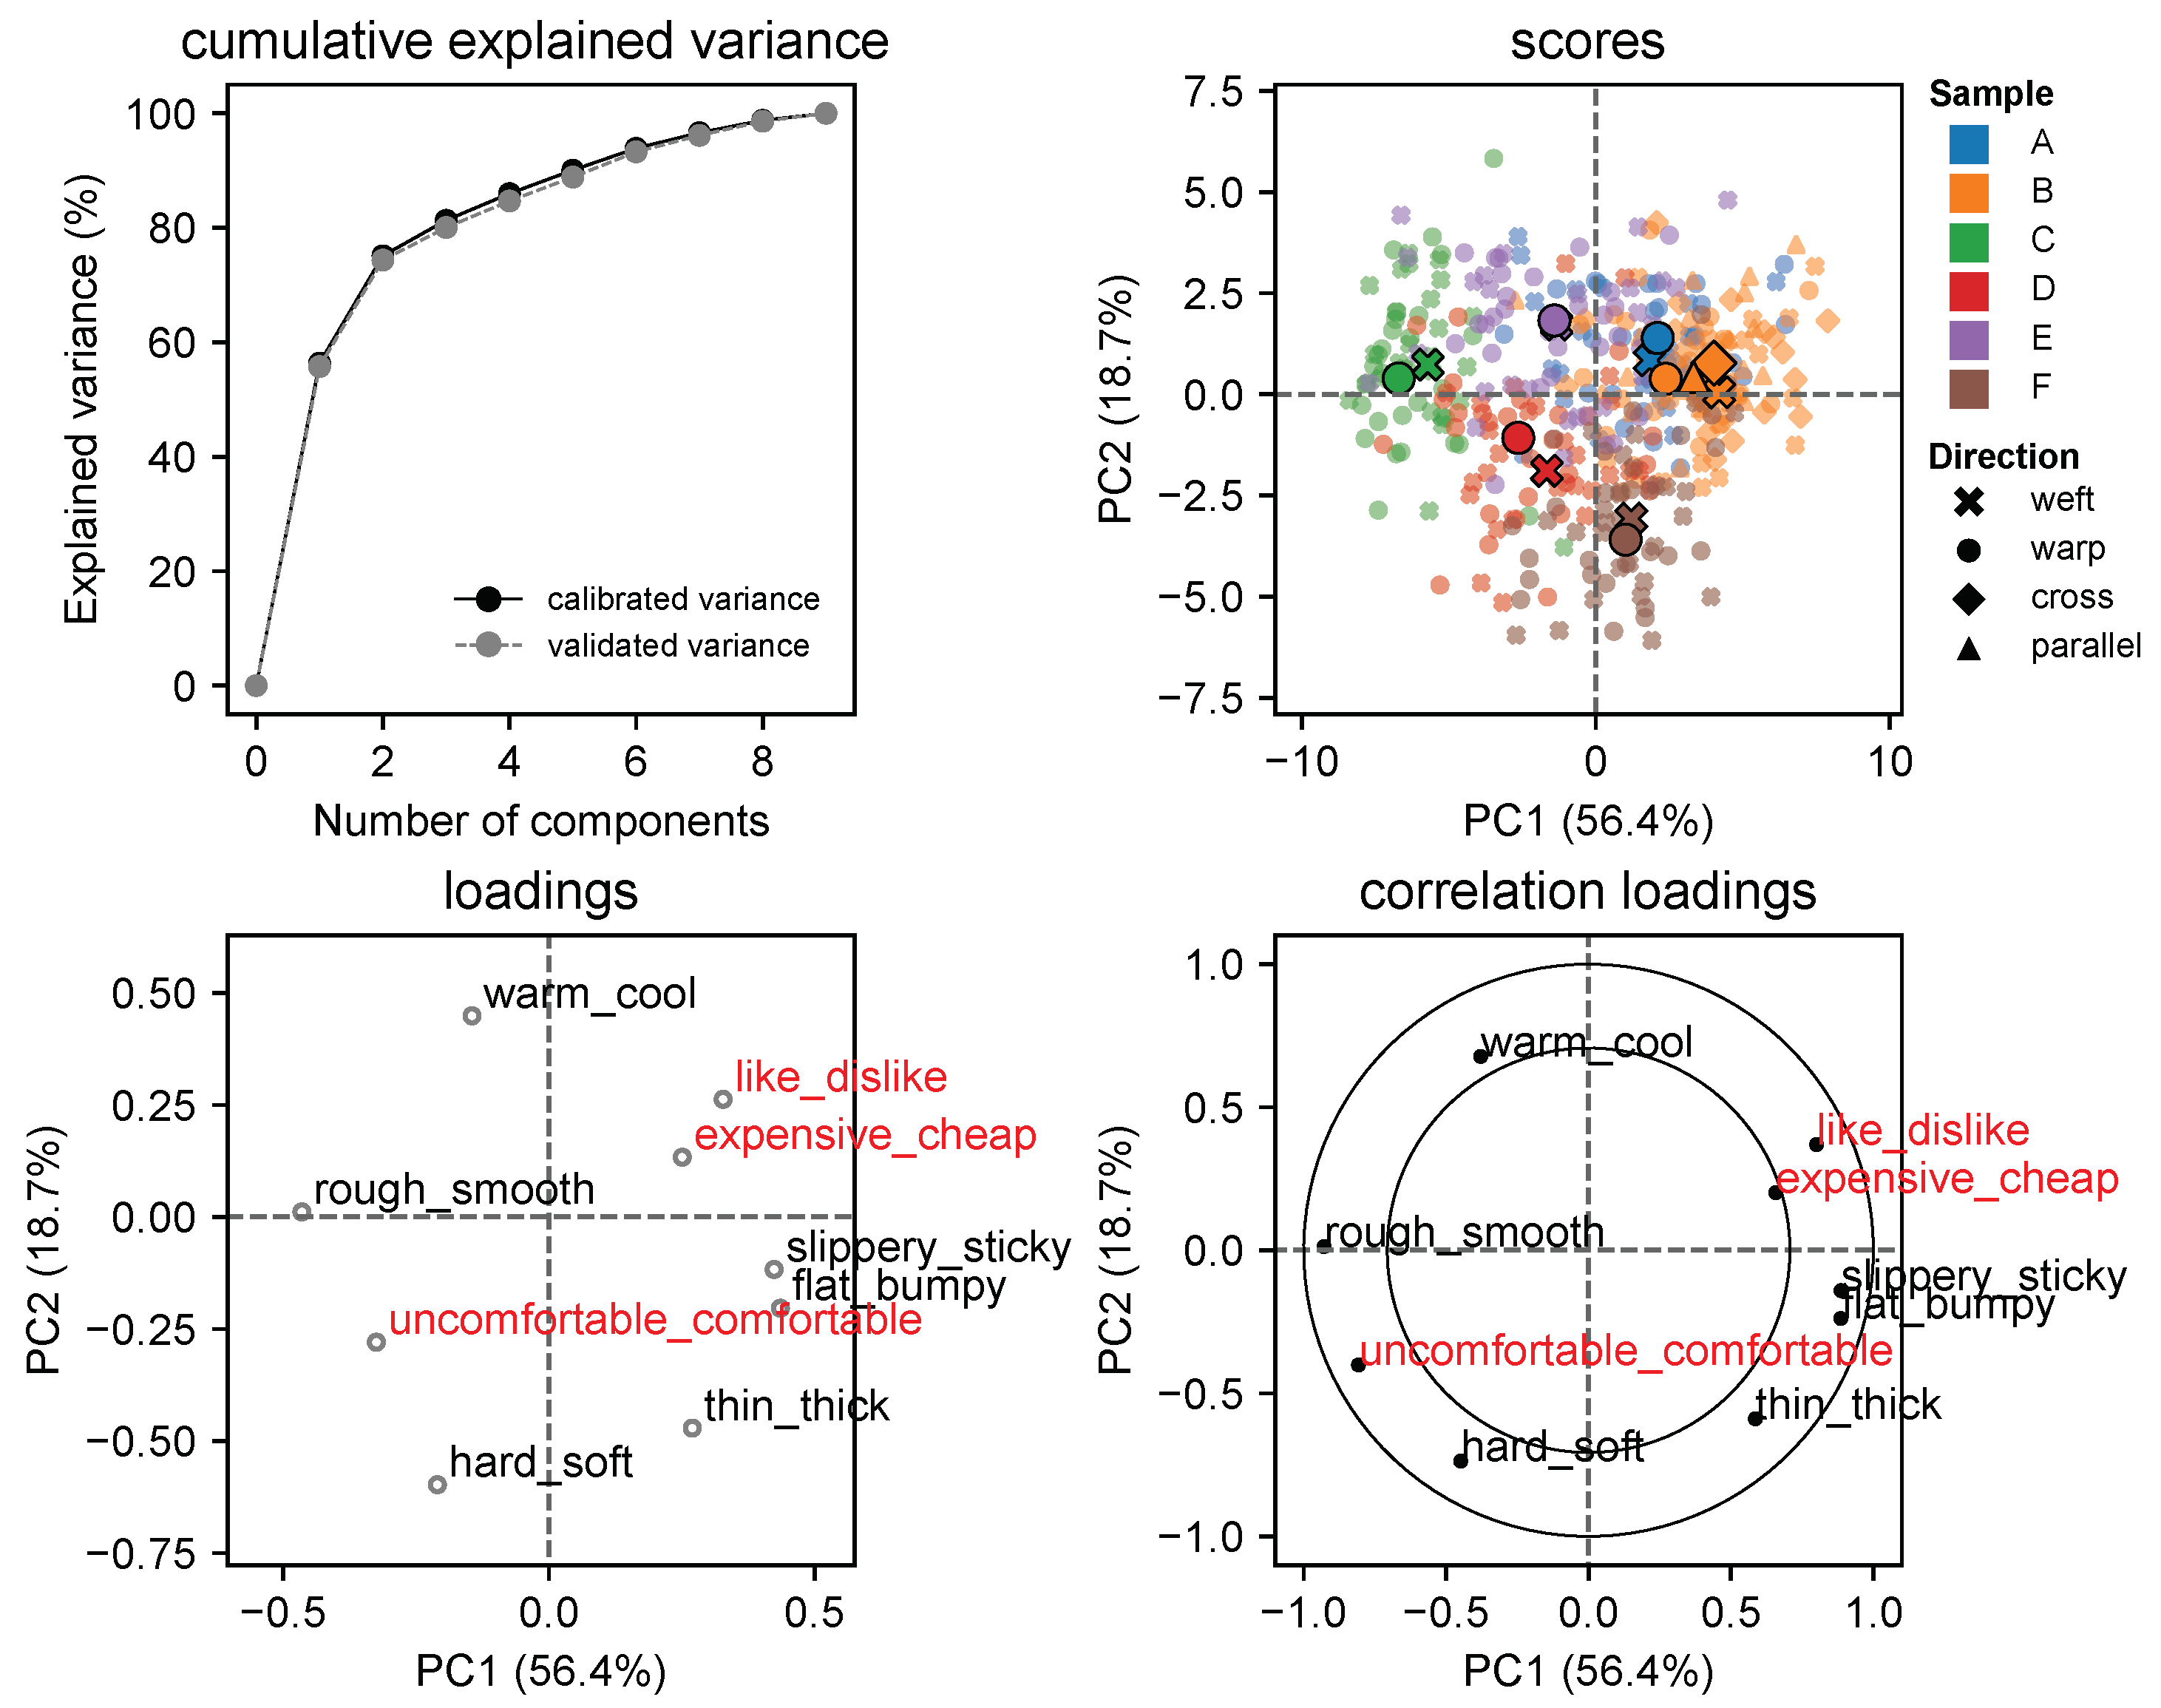
Figure 6 shows that the robustness of the PCA model is supported by the invariance of explainability with and without cross-validation. The loading plot shows that the first component spans surface property variations, whereas the second component spans a compression-heat transport variation. The correlation was found to be strong between slippery/sticky and flat/bumpy. As the sample surface properties were quite different, we assumed that the participants interpreted the attributes similarly. The correlation plot suggests that slippery and flat were interpreted as smooth, whereas sticky and bumpy were interpreted as rough. Similarly, but to a lesser degree, we could observe that the participants like samples that appear expensive and comfortable while disliking cheap and uncomfortable. Finally, the soft samples were interpreted as warm and the hard samples as cool. Given the correlation, the attributes expensive/cheap and slippery/sticky were dropped at this point.
3.3.2. Horizontal Unfolding—Sensory Dataset and Delta Power
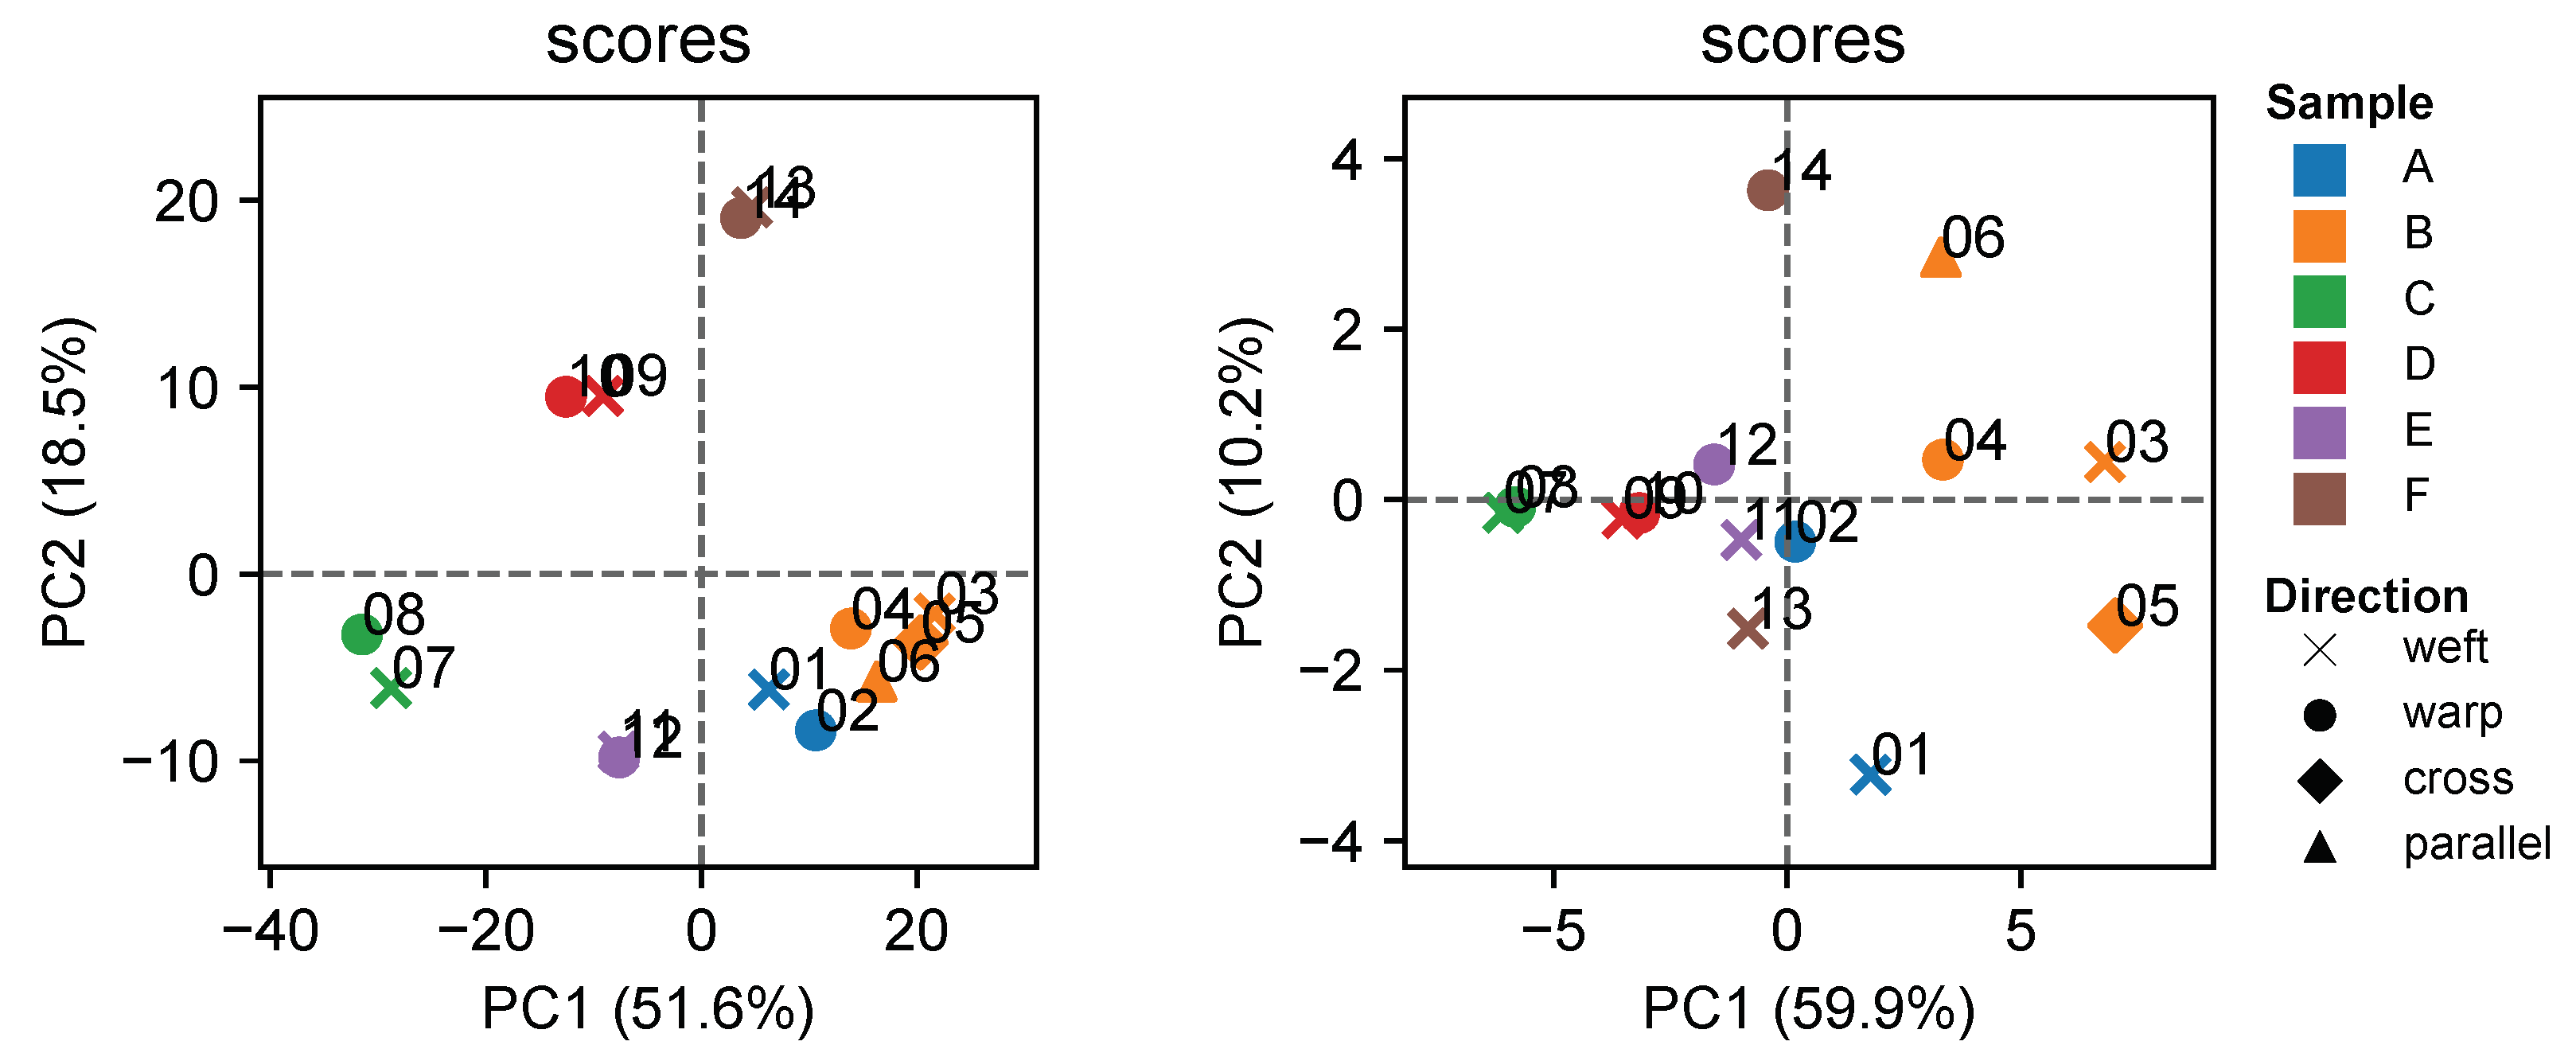
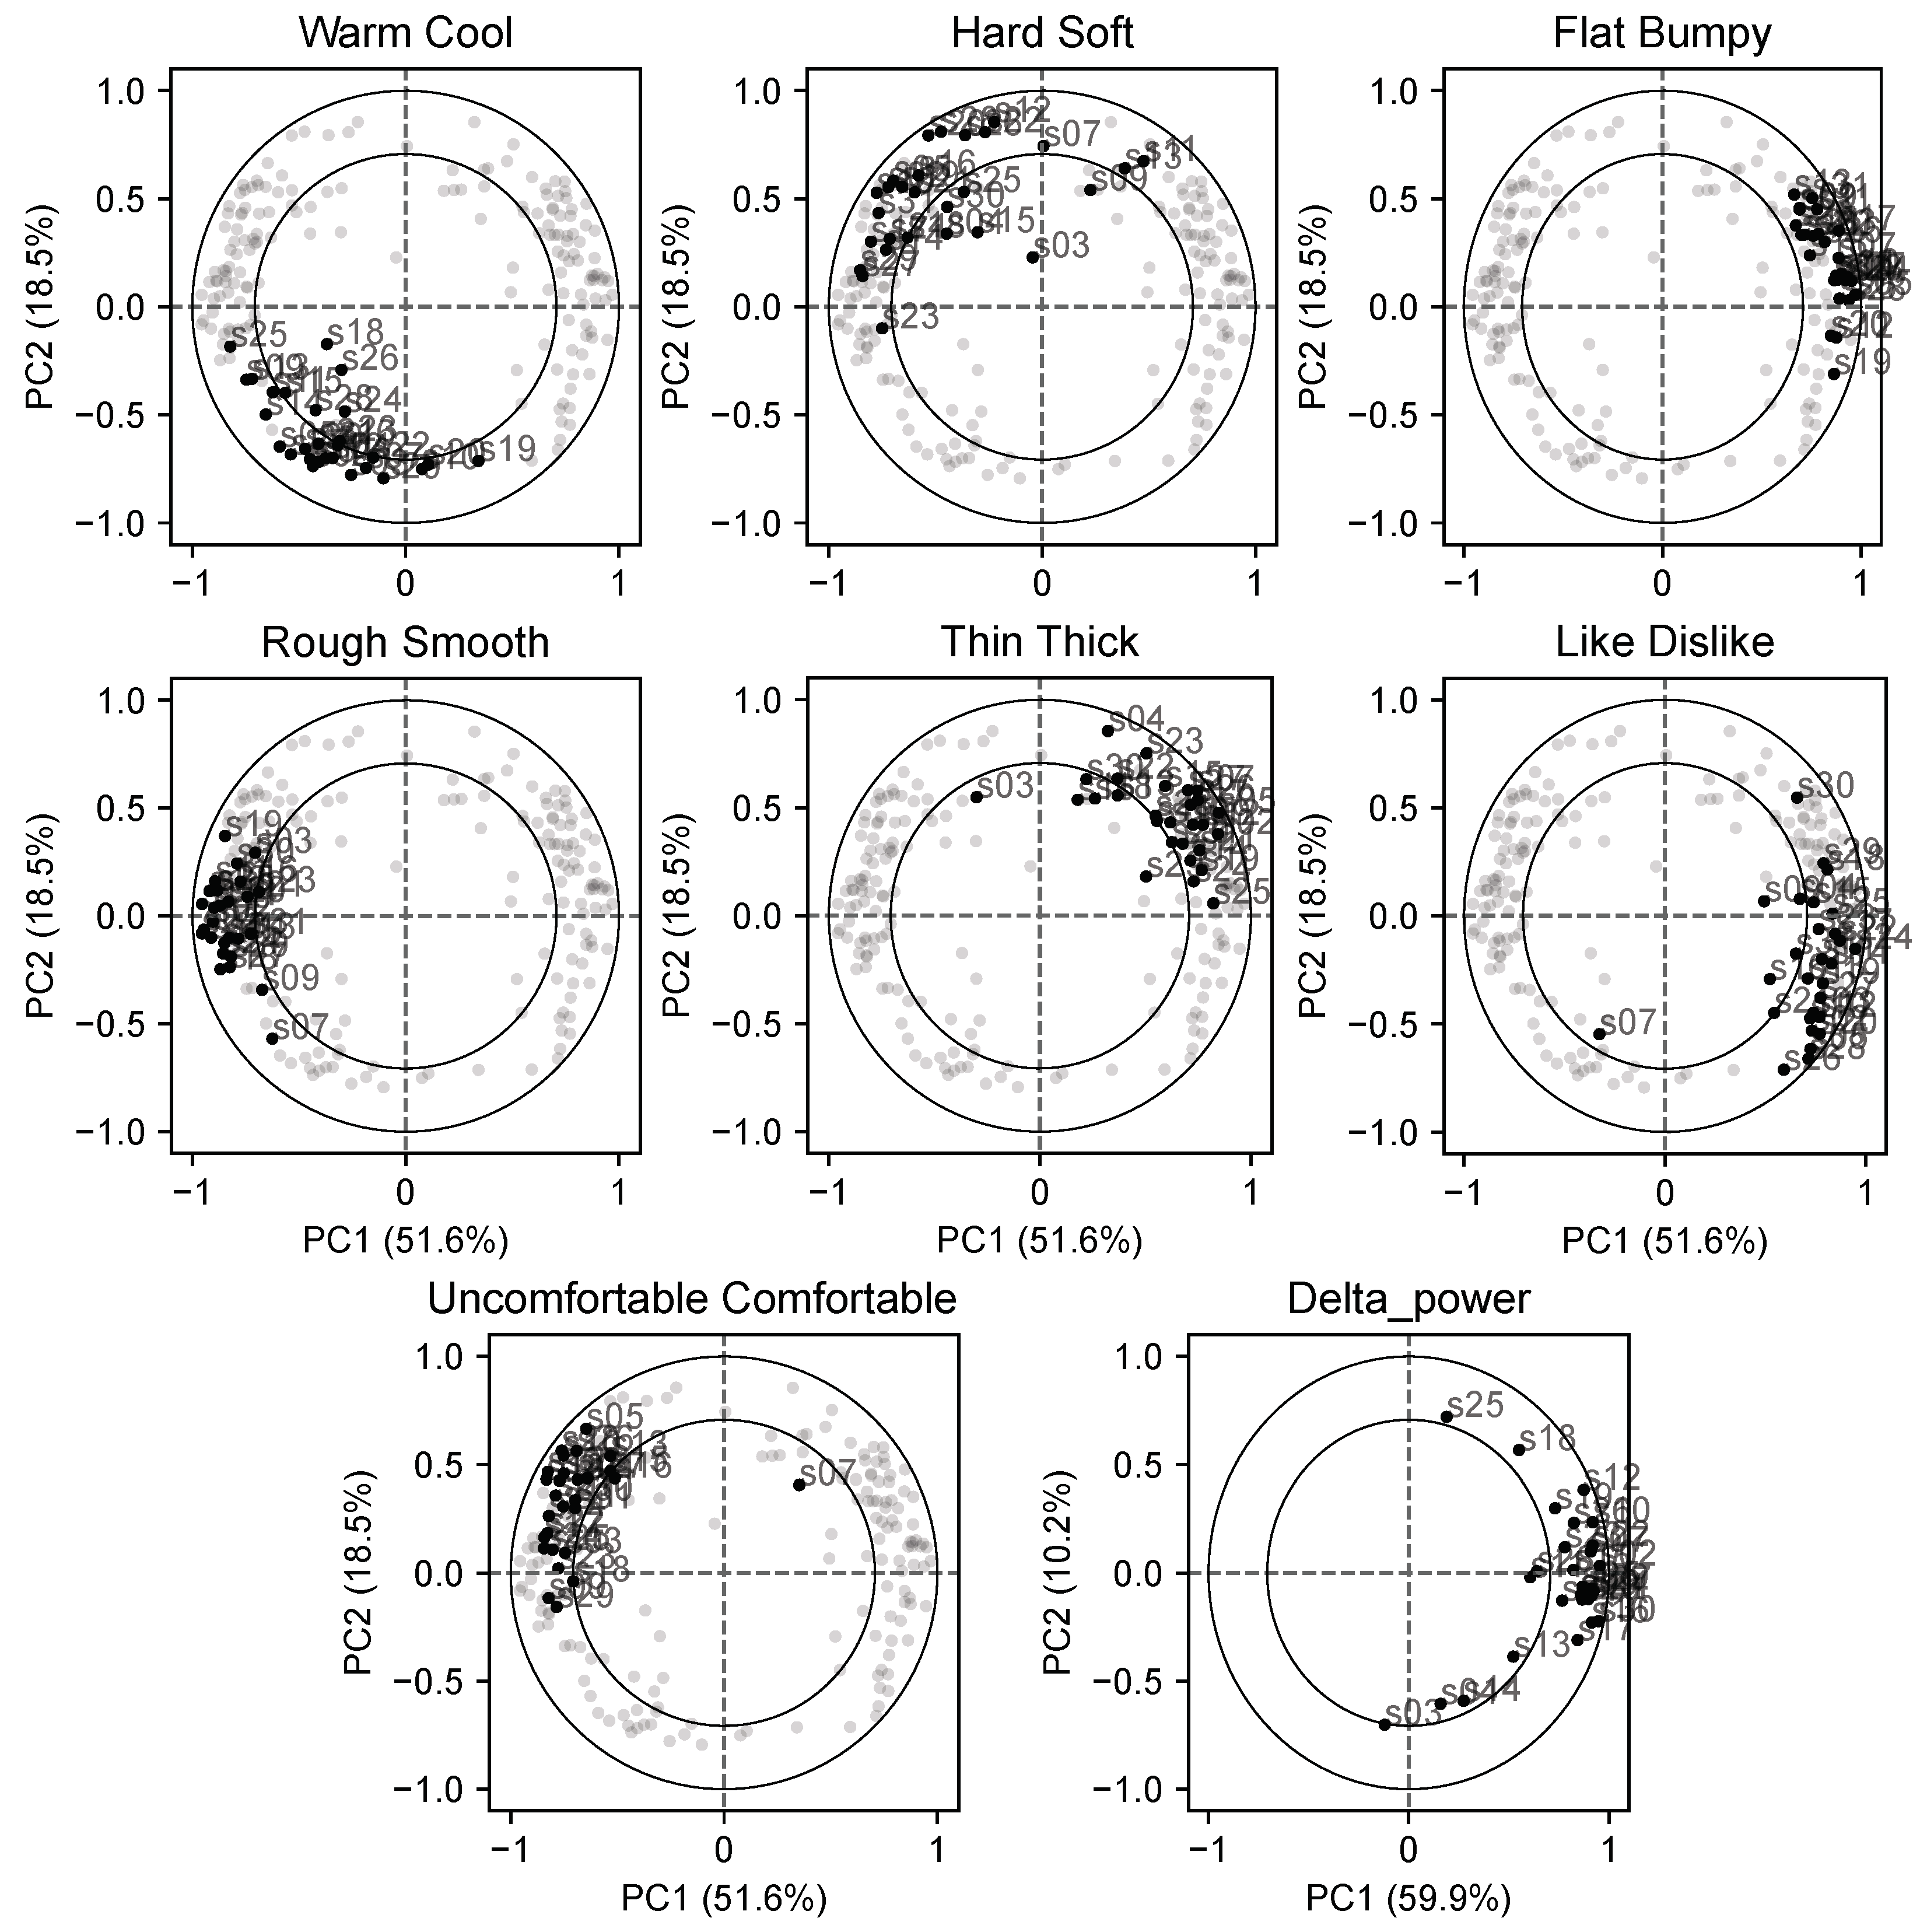
Scores from the sensory data and delta power (Figure 7) showed similar relationships among the samples. This result highlights the fact that skin vibrations were the main factor affecting the surface perception of the samples. In Figure 8, the loading plots show the level of agreement among the participants for each attribute. A strong agreement in the surface-related attributes was noticed.
4. PCR
Regression analysis highlights the relationships among the sensory attributes, physical properties, and delta power. The correlation plots (Figure 9) with 100% and 50% correlation ellipses show which attributes are better at describing the variance in the sensory data. The explained variance values are provided for PCA and regression. The regression-explained variance is the average value for all participants. The relationship between compression, heat transfer, and surface properties depends on the investigated sensory attributes. More importantly, even where agreement exists, the factors driving the variability were slightly different. This is a manifestation of the individuality of participants. The attributes warm/cool and thin/thick were independent of finger vibration. In the case of sensory attributes related to surface properties, the results show that delta power can be a drop-in replacement for physical surface property parameters showing equal or increased explainability.
5. Conclusions
In this study, individual tactile perception was analyzed by sliding a finger over a fabric. During this simple finger movement, the relationships between the individual perception, fabric weave structure, physical properties, and hybrid attributes measured at the finger–fabric interface (contact force, speed, and vibration) were investigated. Surface tactile perceptions, such as flat/bumpy, rough/smooth, and slippery/sticky, were influenced by the vibration occurring at the finger–fabric interface. However, warm/cool and thin/thick perceptions were independent of finger vibrations. Skin vibration was shown to be a possible replacement for the surface physical properties measured by the KES-F with equal or slightly improved explainability. Although not significant in this experiment, the interface parameters of contact force and speed could be useful in describing the decision-making characteristics not covered here, for example, the degree of confusion toward a sensory attribute. Finally, individuality, depicted using PCR correlation plots, was shown to be a useful tool to understand sensory data while accounting for participant individuality.
Author Contributions
R.R.S. designed and supervised the experiments, analyzed the data, and drafted the manuscript. M.N. performed the experiments. S.S. guided and supplied feedback and commented on the final format of the paper. All authors have read and agreed to the published version of the manuscript.
Funding
This work was supported by JSPS KAKENHI (grant number 20K02365).
Institutional Review Board Statement
The experiment was approved by the Ethics Committee of the Kyoto Institute of Technology (approval no. 202039).
Informed Consent Statement
Informed consent was obtained from all subjects involved in the study.
Data Availability Statement
Datasets are available upon request.
Conflicts of Interest
The authors declare no conflict of interest.
Abbreviations
The following abbreviations are used in this manuscript:
| KES-F | Kawabata Evaluation System for Fabrics |
| PCA | Principal Component Analysis |
| DA | Sensory Descriptive Analysis |
| MIU | Coefficient of Friction |
| MMD | Mean Deviation of MIU |
| SMD | Surface Roughness |
| LC | Linearity of Compression |
| WC | Compression Energy |
| RC | Compression Resilience |
| PSD | Power Spectral Density |
| PCR | Principal Component Regression |
| TWFA | Three-way Factor Analysis |
Appendix A

Table A1.
Characteristic values and standard conditions of measurement of the physical properties.
| Property | Symbol | Characteristic Value | Unit | Measurement Condition |
|---|---|---|---|---|
| Compression | LC | Linearity of compression displacement curve | — | Maximum pressure, Pm, = 5 kPa |
| WC | Compression energy | J/m2 | Rate of compression = 20 µm/s | |
| RC | Compression resilience | % | ||
| Surface | MIU | Coefficient of friction | — | 20 steel piano wires with 0.5 mm diameter and 10 mm length. |
| MMD | Mean deviation of MIU | — | Contact force = 0.49 N | |
| SMD | Geometrical roughness | µm | Steel piano wire with 0.5 mm diameter and 5 mm length. Contact force = 0.1 N | |
| Thickness | T0 | Thickness at pressure of 49.0 Pa | mm | |
| Weight | W | Fabric weight per unit area | g/m2 | |
| qmax | qmax | Maximum value of heat flux | W/cm2 | ΔT = 10 °C |
References
- Ares, G.; Varela, P. Trained vs. consumer panels for analytical testing: Fueling a long lasting debate in the field. Food Qual. Prefer. 2017, 61, 79–86. [Google Scholar] [CrossRef] [Green Version]
- Flora, P.; Schacher, L.; Adolphe, D.C.; Dacremont, C. Tactile feeling: Sensory analysis applied to textile goods. Text. Res. J. 2004, 74, 1066. [Google Scholar]
- Kawabata, S. The Standardization and Analysis of Hand Evaluation, 2nd ed.; Textile Machinery Society of Japan: Osaka, Japan, 1980; pp. 23–34. [Google Scholar]
- Isami, C.; Kondo, A.; Goto, A.; Sukigara, S. Effects of Viewing Distance on Visual and Visual-Tactile Evaluation of Black Fabric. J. Fiber Sci. Technol. 2021, 77, 56–65. [Google Scholar] [CrossRef]
- Phoophat, P.; Yamamoto, H.; Sukigara, S. Visual aesthetic perception of handwoven cotton fabrics. J. Text. Inst. 2019, 110, 412–425. [Google Scholar] [CrossRef]
- Nagai, Y.; Georgiev, G.V. The role of impressions on users’ tactile interaction with product materials: An analysis of associative concept networks. Mater. Des. 2011, 32, 291–302. [Google Scholar] [CrossRef]
- Kimura, K.; Natsume, M.; Tanaka, Y. Influence of Scanning Velocity on Skin Vibration for Coarse Texture. In Proceedings of the International Conference on Human Haptic Sensing and Touch Enabled Computer Applications, Pisa, Italy, 13–16 June 2018; Springer: Berlin/Heidelberg, Germany, 2018; pp. 246–257. [Google Scholar]
- Asaga, E.; Takemura, K.; Maeno, T.; Ban, A.; Toriumi, M. Tactile evaluation based on human tactile perception mechanism. Sens. Actuators A Phys. 2013, 203, 69–75. [Google Scholar] [CrossRef]
- Tanaka, Y.; Nguyen, D.P.; Fukuda, T.; Sano, A. Wearable skin vibration sensor using a PVDF film. In Proceedings of the 2015 IEEE World Haptics Conference (WHC), Evanston, IL, USA, 22–26 June 2015; IEEE: Piscataway, NJ, USA, 2015; pp. 146–151. [Google Scholar]
- Kanai, R.; Rees, G. The structural basis of inter-individual differences in human behaviour and cognition. Nat. Rev. Neurosci. 2011, 12, 231–242. [Google Scholar] [CrossRef] [PubMed]
- Union of Japanese Scientists and Engineers. Sensory Evaluation Hand Book; JUSE Press Ltd.: Tokyo, Japan, 1999. [Google Scholar]
- Tucker, L.R. The extension of factor analysis to three-dimensional matrices. Math. Psychol. 1964, 110119. [Google Scholar]
- Næs, T.; Risvik, E. Multivariate Analysis of Data in Sensory Science; Elsevier: Amsterdam, The Netherlands, 1996. [Google Scholar]
Figure 1.
Photographs of the surface structures of the samples with weave directions. (A–F) Six woven fabric samples with different weave structures and surface roughness values were used in this study.
Figure 1.
Photographs of the surface structures of the samples with weave directions. (A–F) Six woven fabric samples with different weave structures and surface roughness values were used in this study.

Figure 2.
Measurement of surface properties. (a) Measurement of surface friction using 20 piano wires ( mm, probe size of 1 cm × 1 cm) (MIU and MMD). (b) Surface geometry measurement using a U-type piano wire ( mm) (SMD).
Figure 2.
Measurement of surface properties. (a) Measurement of surface friction using 20 piano wires ( mm, probe size of 1 cm × 1 cm) (MIU and MMD). (b) Surface geometry measurement using a U-type piano wire ( mm) (SMD).

Figure 3.
Experimental setup. Starting from the stage, the participants slid the index finger over the sample from left to right (slide direction) in a smooth and continuous motion. On the index finger, a motion capture marker and a skin vibration sensor were attached to measure the speed and the vibration signal, respectively. Beneath the sample, a pressure plate was used to measure contact force. Two markers on the pressure were defined as the effective experimental areas where all the parameters were calculated.

Figure 4.
Three-way matrix unfolding. The figure depicts the two unfolding strategies used in Tucker-1 analysis. The three-way dataset is arranged either (a) vertically as an () matrix or (b) horizontally as an () matrix, resulting in unique sample–participant or participant–attribute pairs. This forms the foundation for the agreement (consonance) analysis, where participants with similar perceptions of samples (a) cluster together in the principal component space and participants with similar perceptions of attributes or (b) cluster together similarly.

Figure 5.
Two-way ANOVA (sensory and interface data). Model with effects for the sample and the participants. (a) Sensory attributes and (b) fabric–finger interface attributes. The bar length represents the F-value. The attributes in red have a p-value > 0.05 and were regarded as non-significant.
Figure 5.
Two-way ANOVA (sensory and interface data). Model with effects for the sample and the participants. (a) Sensory attributes and (b) fabric–finger interface attributes. The bar length represents the F-value. The attributes in red have a p-value > 0.05 and were regarded as non-significant.

Figure 6.
Consonance analysis—sensory data (vertical unfolding). The agreement in the samples can be inspected. Attributes flagged by the ANOVA have been dropped. Cross-validation was performed, leaving one participant out. “Scores” represents the distribution of the samples, as seen by the participants compressed in the first two PCs. Bold colors represent the sample median. “Loadings” represents the attributes of the PCA space. Subjective preference attributes are highlighted in red. “Correlation loadings” is an alternative scaling of the loadings plot, where each original attribute is correlated with the score components. The outer ellipse corresponds to a 100% correlation and the inner to a 50% correlation.

Figure 7.
Consonance analysis (scores)—sensory and delta power (horizontal unfolding). The left scores plot corresponds to the sensory data and the right corresponds to delta power.
Figure 7.
Consonance analysis (scores)—sensory and delta power (horizontal unfolding). The left scores plot corresponds to the sensory data and the right corresponds to delta power.

Figure 8.
Consonance analysis (loadings)—sensory and delta power (horizontal unfolding). Correlation loadings plot for each sensory attribute. Each graph represents the same data. The same graph is repeated highlighting each sensory attribute at a time. The level of agreement is given by the level of the clustering of the participants.

Figure 9.
Principal component regression—correlation loadings plots. Physical properties and delta power were regressed onto the principal components of the sensory dataset. The regression coefficients (regression loadings) are plotted in red. The percentages shown on the left indicate the explained variance in the component. On the right, the mean R2 values for all the response variables in the component are shown. Delta power was regressed without averaging and the medium value (blue) is highlighted. Roughly, values inside the inner ellipse are not significant (p-value > 0.05).

Table 1.
Sample specifications.
| Sample | Fiber Ratio (%) | Weave Structure | Density (cm) | Thickness mm | Weight g/m2 | L* (D65), a*, b*, c* (*1) | |
|---|---|---|---|---|---|---|---|
| Ends | Picks | ||||||
| A | Polyester 99/polyurethane 1 | Wedge slab | 28 | 20 | 0.90 | 214 | 15.28, 0.21, 0.08, 0.23 |
| B | Wool 100 | 3 × 1 twill | 22 | 12 | 1.80 | 406 | 13.81, 0.03, −0.84, 0.80 |
| C | Polyester 100 | Satin | 95 | 39 | 0.24 | 9 | 18.78, 0.47, −0.56, 0.73 |
| D | Wool 100 | 2 × 1 twill | 38 | 30 | 1.13 | 243 | 13.22, 0.17, −1.37, 1.38 |
| E | Mohair 56/wool 35/water soluble vinylon 9 | Plain | 35 | 30 | 0.38 | 155 | 15.98, −0.10, −1.38, 1.34 |
| F | Wool 56/paper 40/cotton 4 | 2 × 2 twill | 60 | 64 | 3.40 | 415 | 16.91, −0.18, −1.39, 1.40 |
(*1) Calculated by the SCI method at 10° viewing angle.
Table 2.
Sample physical properties.
| Code No | Direction | Surface | Heat Flow | Compression | ||||
|---|---|---|---|---|---|---|---|---|
| SMD mm | MIU — | MMD — | qmax W/cm2 | WC J/m2 | RC % | LC — | ||
| A-1 | Weft | 5.91 | 0.160 | 0.016 | 0.124 | 0.29 | 40.0 | 0.32 |
| A-2 | Warp | 7.92 | 0.177 | 0.012 | ||||
| B-3 | Weft | 8.16 | 0.286 | 0.018 | 0.057 | 0.59 | 50.6 | 0.34 |
| B-4 | Warp | 2.90 | 0.170 | 0.009 | ||||
| B-5 | Cross | 32.0 | 0.213 | 0.019 | ||||
| B-6 | Parallel | 4.85 | 0.197 | 0.011 | ||||
| C-7 | Weft | 1.54 | 0.177 | 0.003 | 0.208 | 0.07 | 37.6 | 0.38 |
| C-8 | Warp | 0.68 | 0.140 | 0.002 | ||||
| D-9 | Weft | 2.53 | 0.134 | 0.006 | 0.086 | 0.37 | 56.5 | 0.30 |
| D-10 | Warp | 2.56 | 0.124 | 0.006 | ||||
| E-11 | Weft | 3.52 | 0.131 | 0.015 | 0.188 | 0.11 | 52.7 | 0.30 |
| E-12 | Warp | 7.52 | 0.158 | 0.020 | ||||
| F-13 | Weft | 3.81 | 0.212 | 0.008 | 0.050 | 1.82 | 49.0 | 0.45 |
| F-14 | Warp | 3.27 | 0.215 | 0.007 | ||||
Table 3.
Structure of the datasets.
| Dataset | Samples | Attributes | Participants |
|---|---|---|---|
| Sensory | 11 | 28 | |
| Interface | 14 | 3 | 28 |
| Physical | 7 | — |
Disclaimer/Publisher’s Note: The statements, opinions and data contained in all publications are solely those of the individual author(s) and contributor(s) and not of MDPI and/or the editor(s). MDPI and/or the editor(s) disclaim responsibility for any injury to people or property resulting from any ideas, methods, instructions or products referred to in the content. |
© 2023 by the authors. Licensee MDPI, Basel, Switzerland. This article is an open access article distributed under the terms and conditions of the Creative Commons Attribution (CC BY) license (https://creativecommons.org/licenses/by/4.0/).
Share and Cite
MDPI and ACS Style
Romao Santos, R.; Nakanishi, M.; Sukigara, S. Tactile Perception of Woven Fabrics by a Sliding Index Finger with Emphasis on Individual Differences. Textiles 2023, 3, 115-128. https://doi.org/10.3390/textiles3010009
AMA Style
Romao Santos R, Nakanishi M, Sukigara S. Tactile Perception of Woven Fabrics by a Sliding Index Finger with Emphasis on Individual Differences. Textiles. 2023; 3(1):115-128. https://doi.org/10.3390/textiles3010009
Chicago/Turabian StyleRomao Santos, Raphael, Masumi Nakanishi, and Sachiko Sukigara. 2023. "Tactile Perception of Woven Fabrics by a Sliding Index Finger with Emphasis on Individual Differences" Textiles 3, no. 1: 115-128. https://doi.org/10.3390/textiles3010009