

Eco-Friendly Anionic Surfactant for the Removal of Methyl Red from Aqueous Matrices
 , and
, and 
Abstract
:1. Introduction
2. Materials and Methods
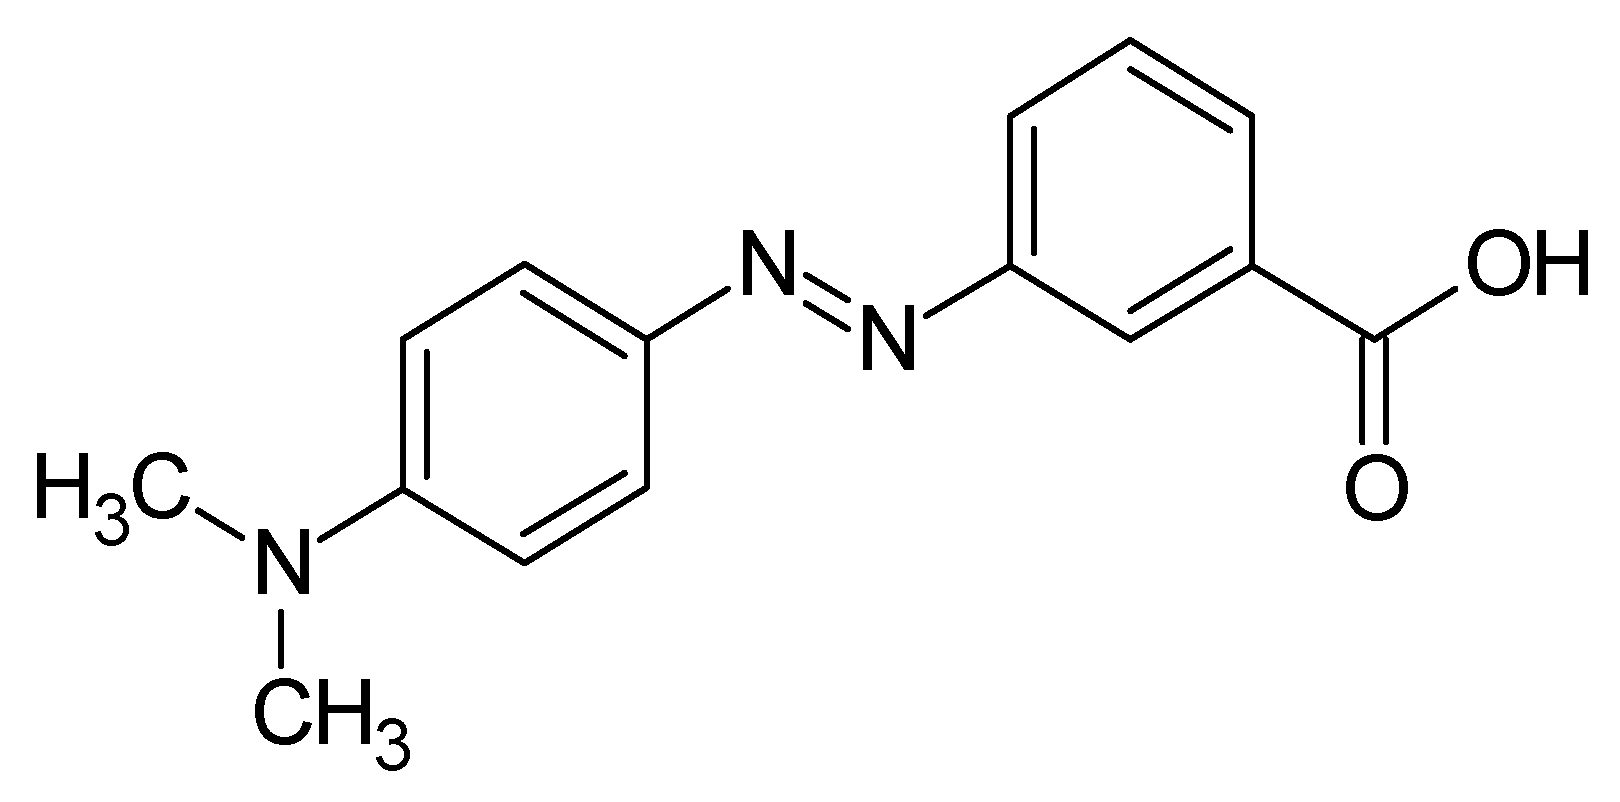
2.1. Chemicals
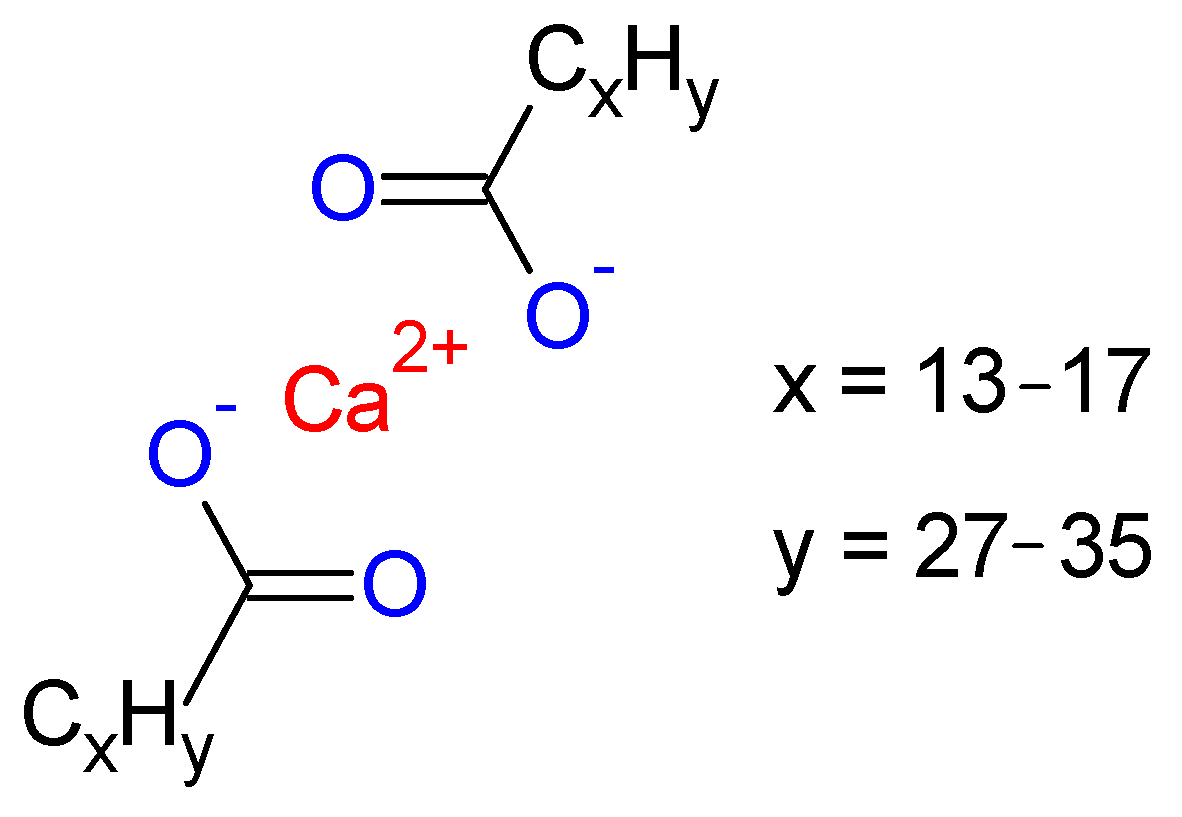
2.2. CaSF Synthesis
2.3. CaSF Characterization
2.4. Adsorption Experiments
2.5. Kinetics Studies
2.6. Diffusion Mechanism
2.7. Equilibrium Study
2.8. Statistical Error Analysis
3. Results and Discussion
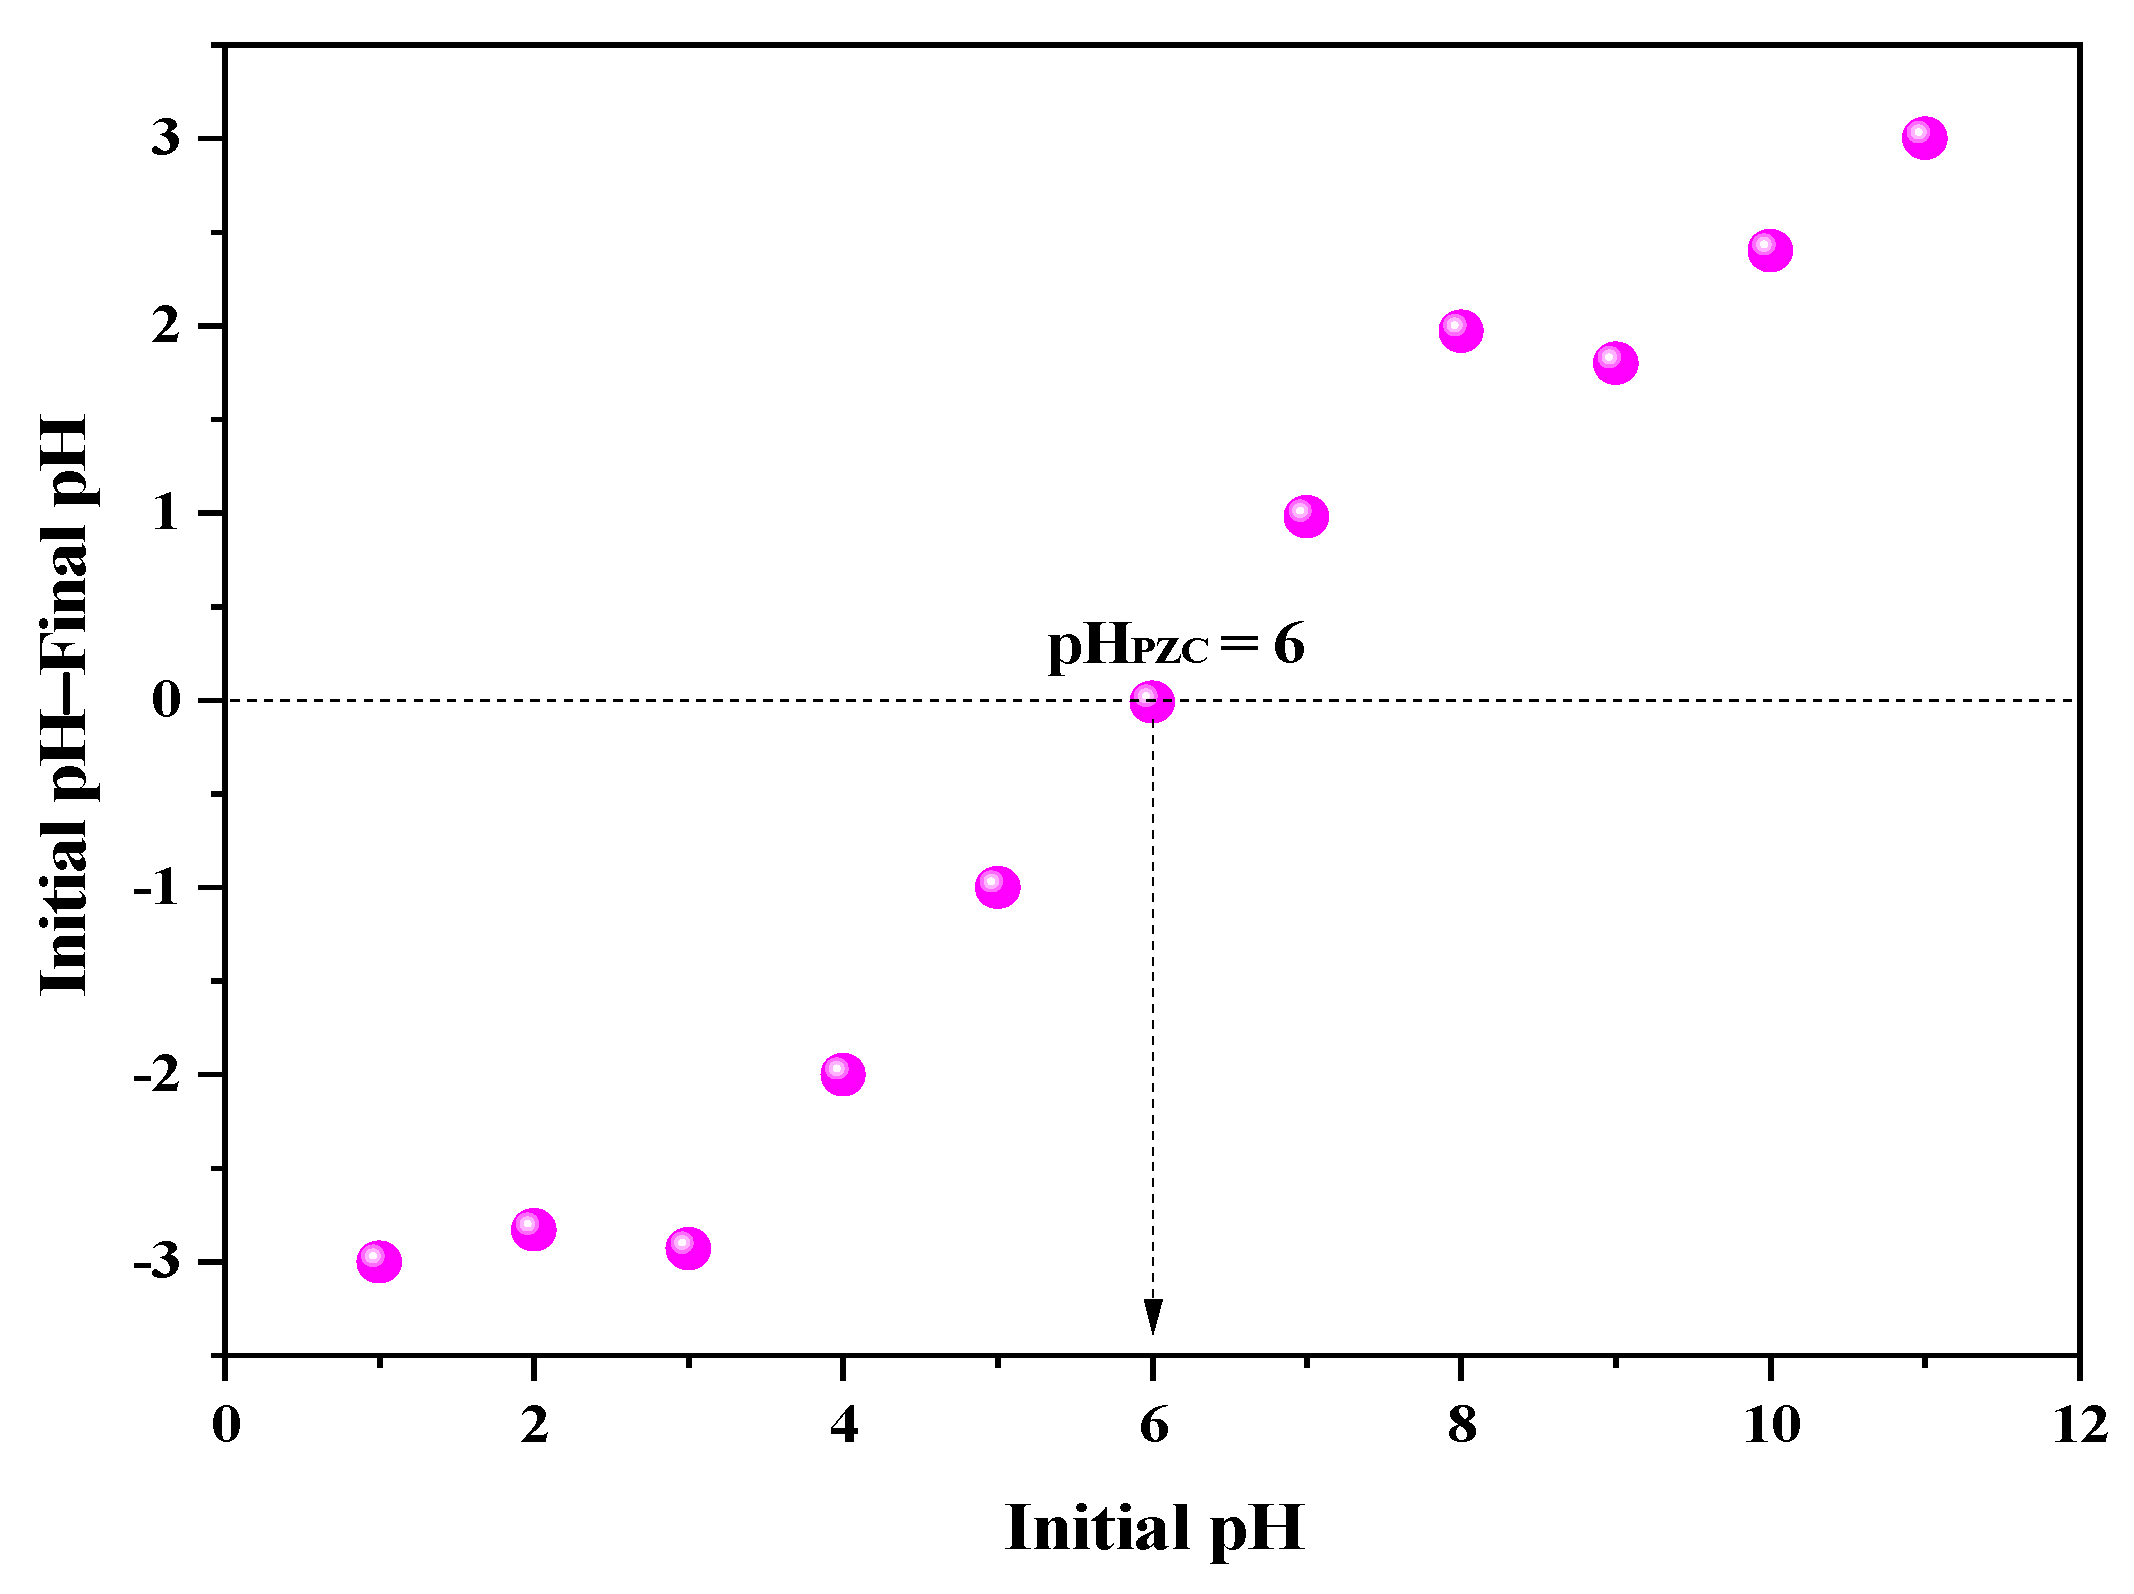
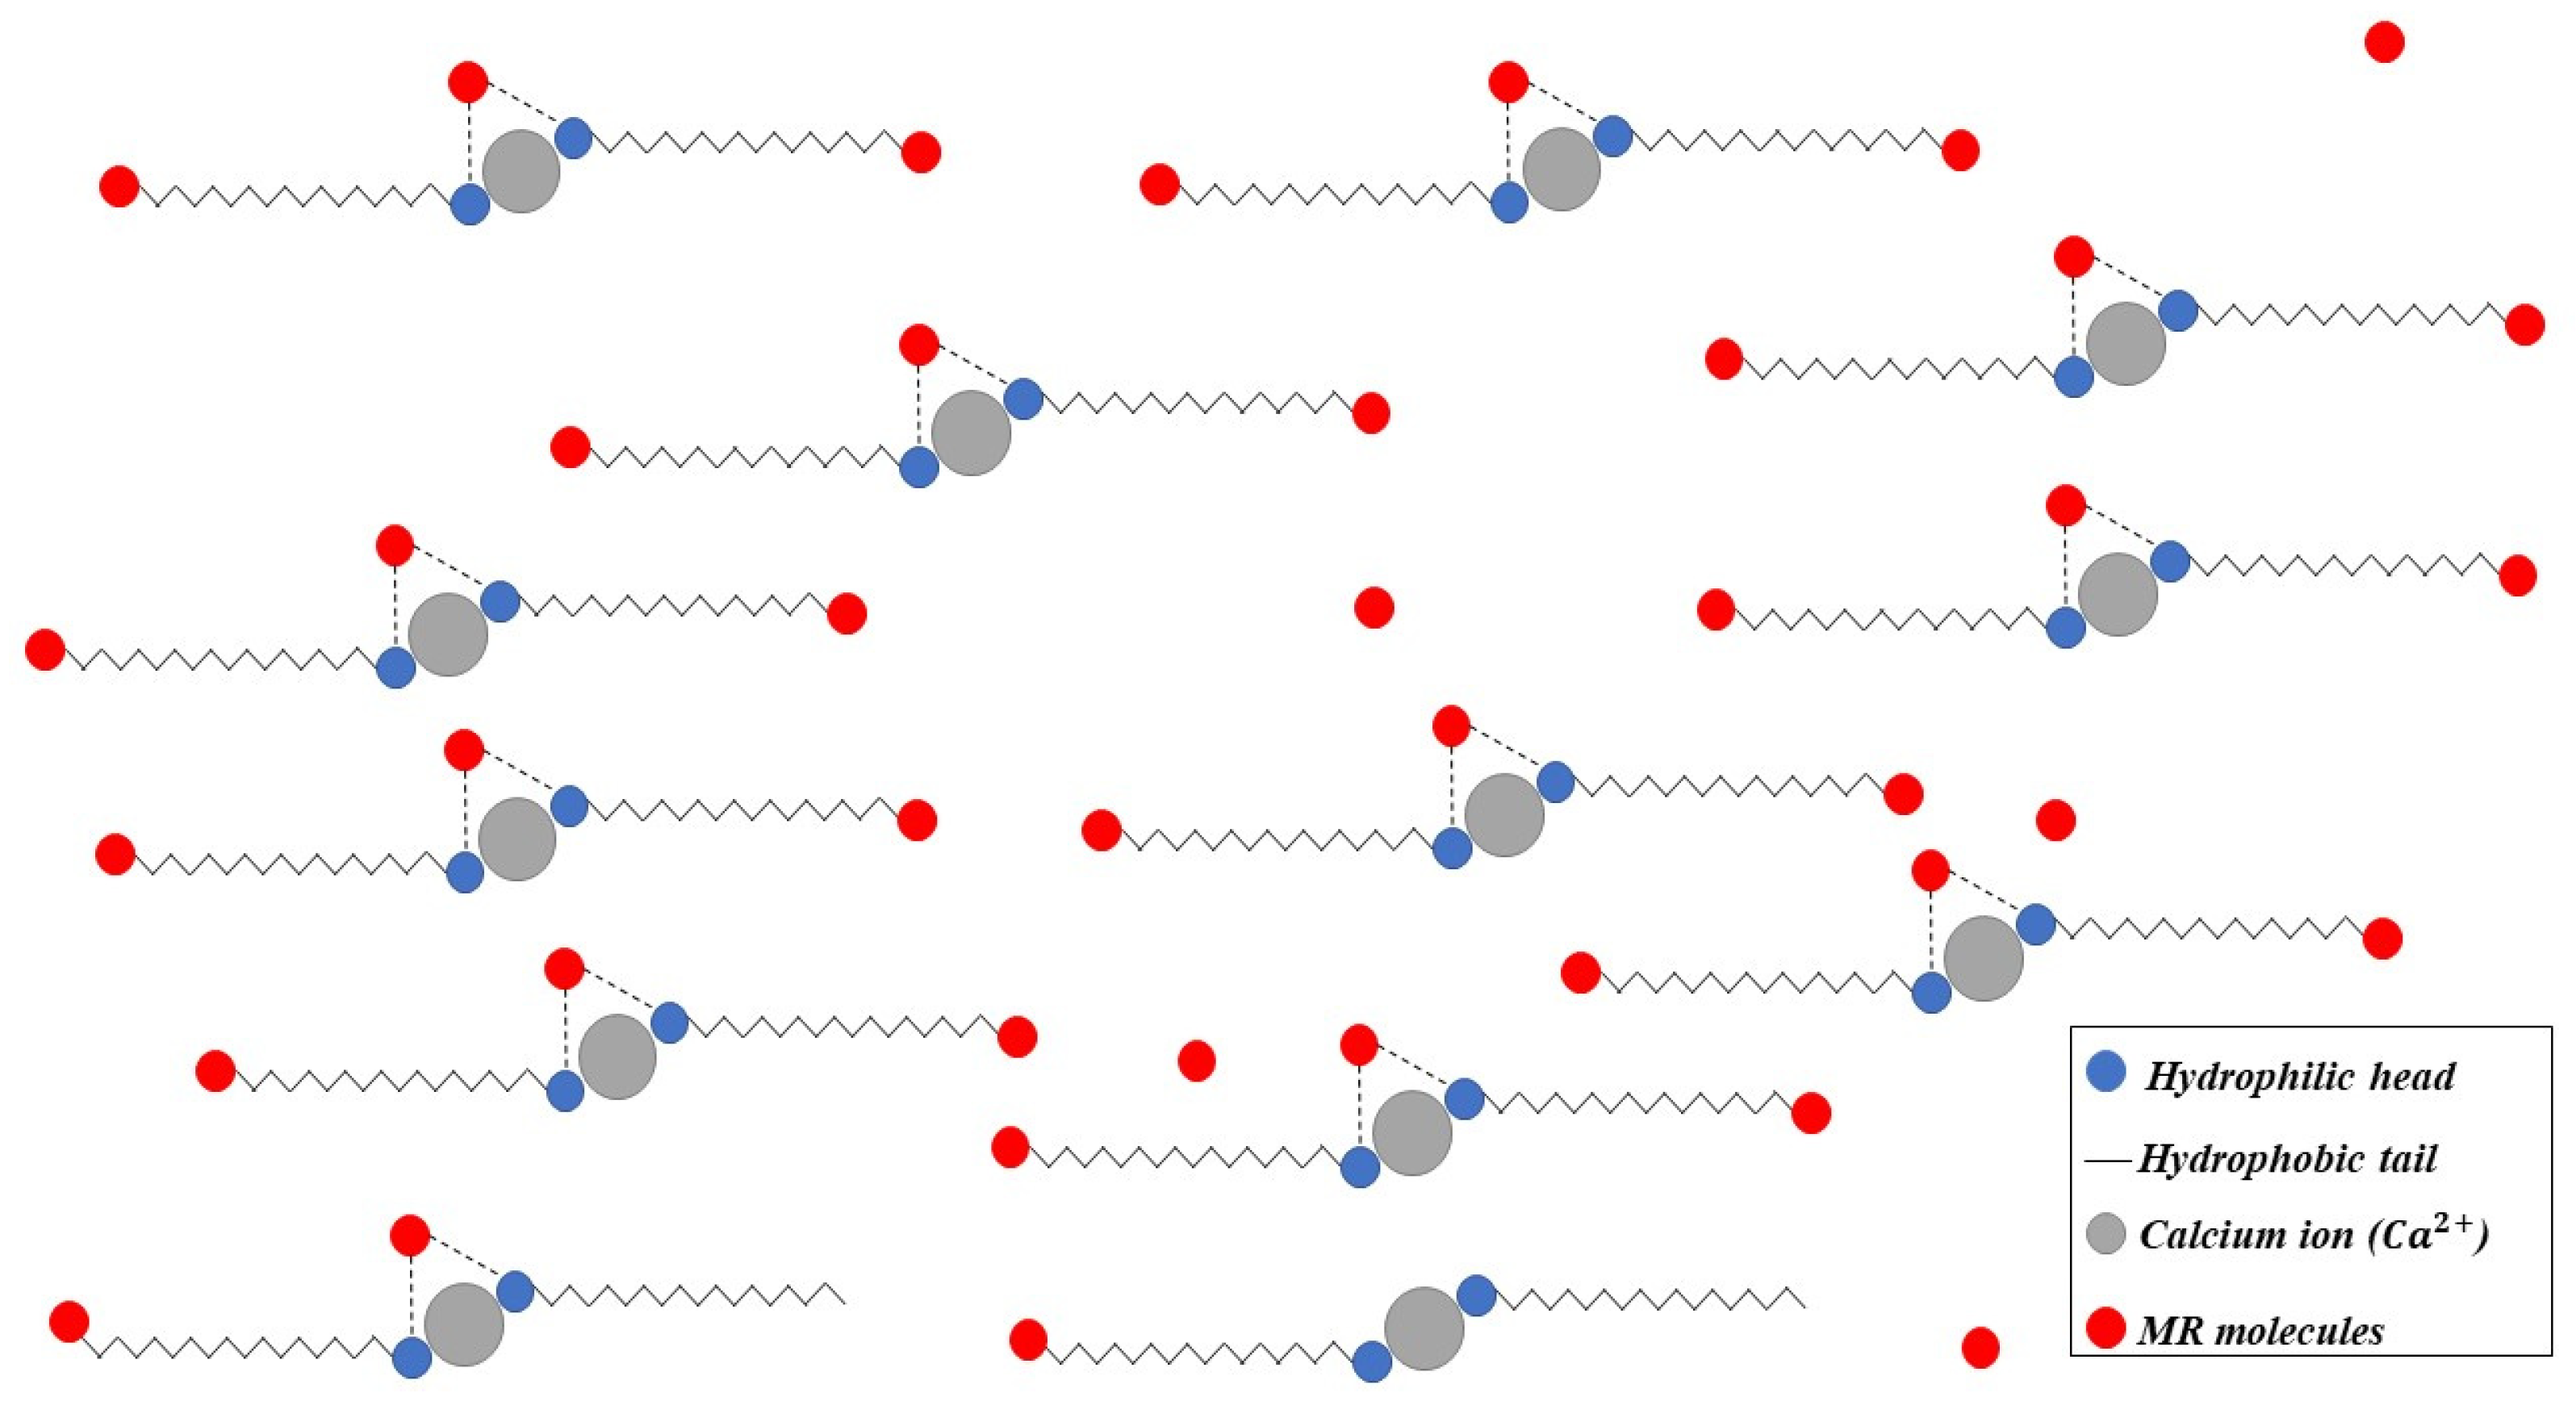
3.1. CaSF Characterization
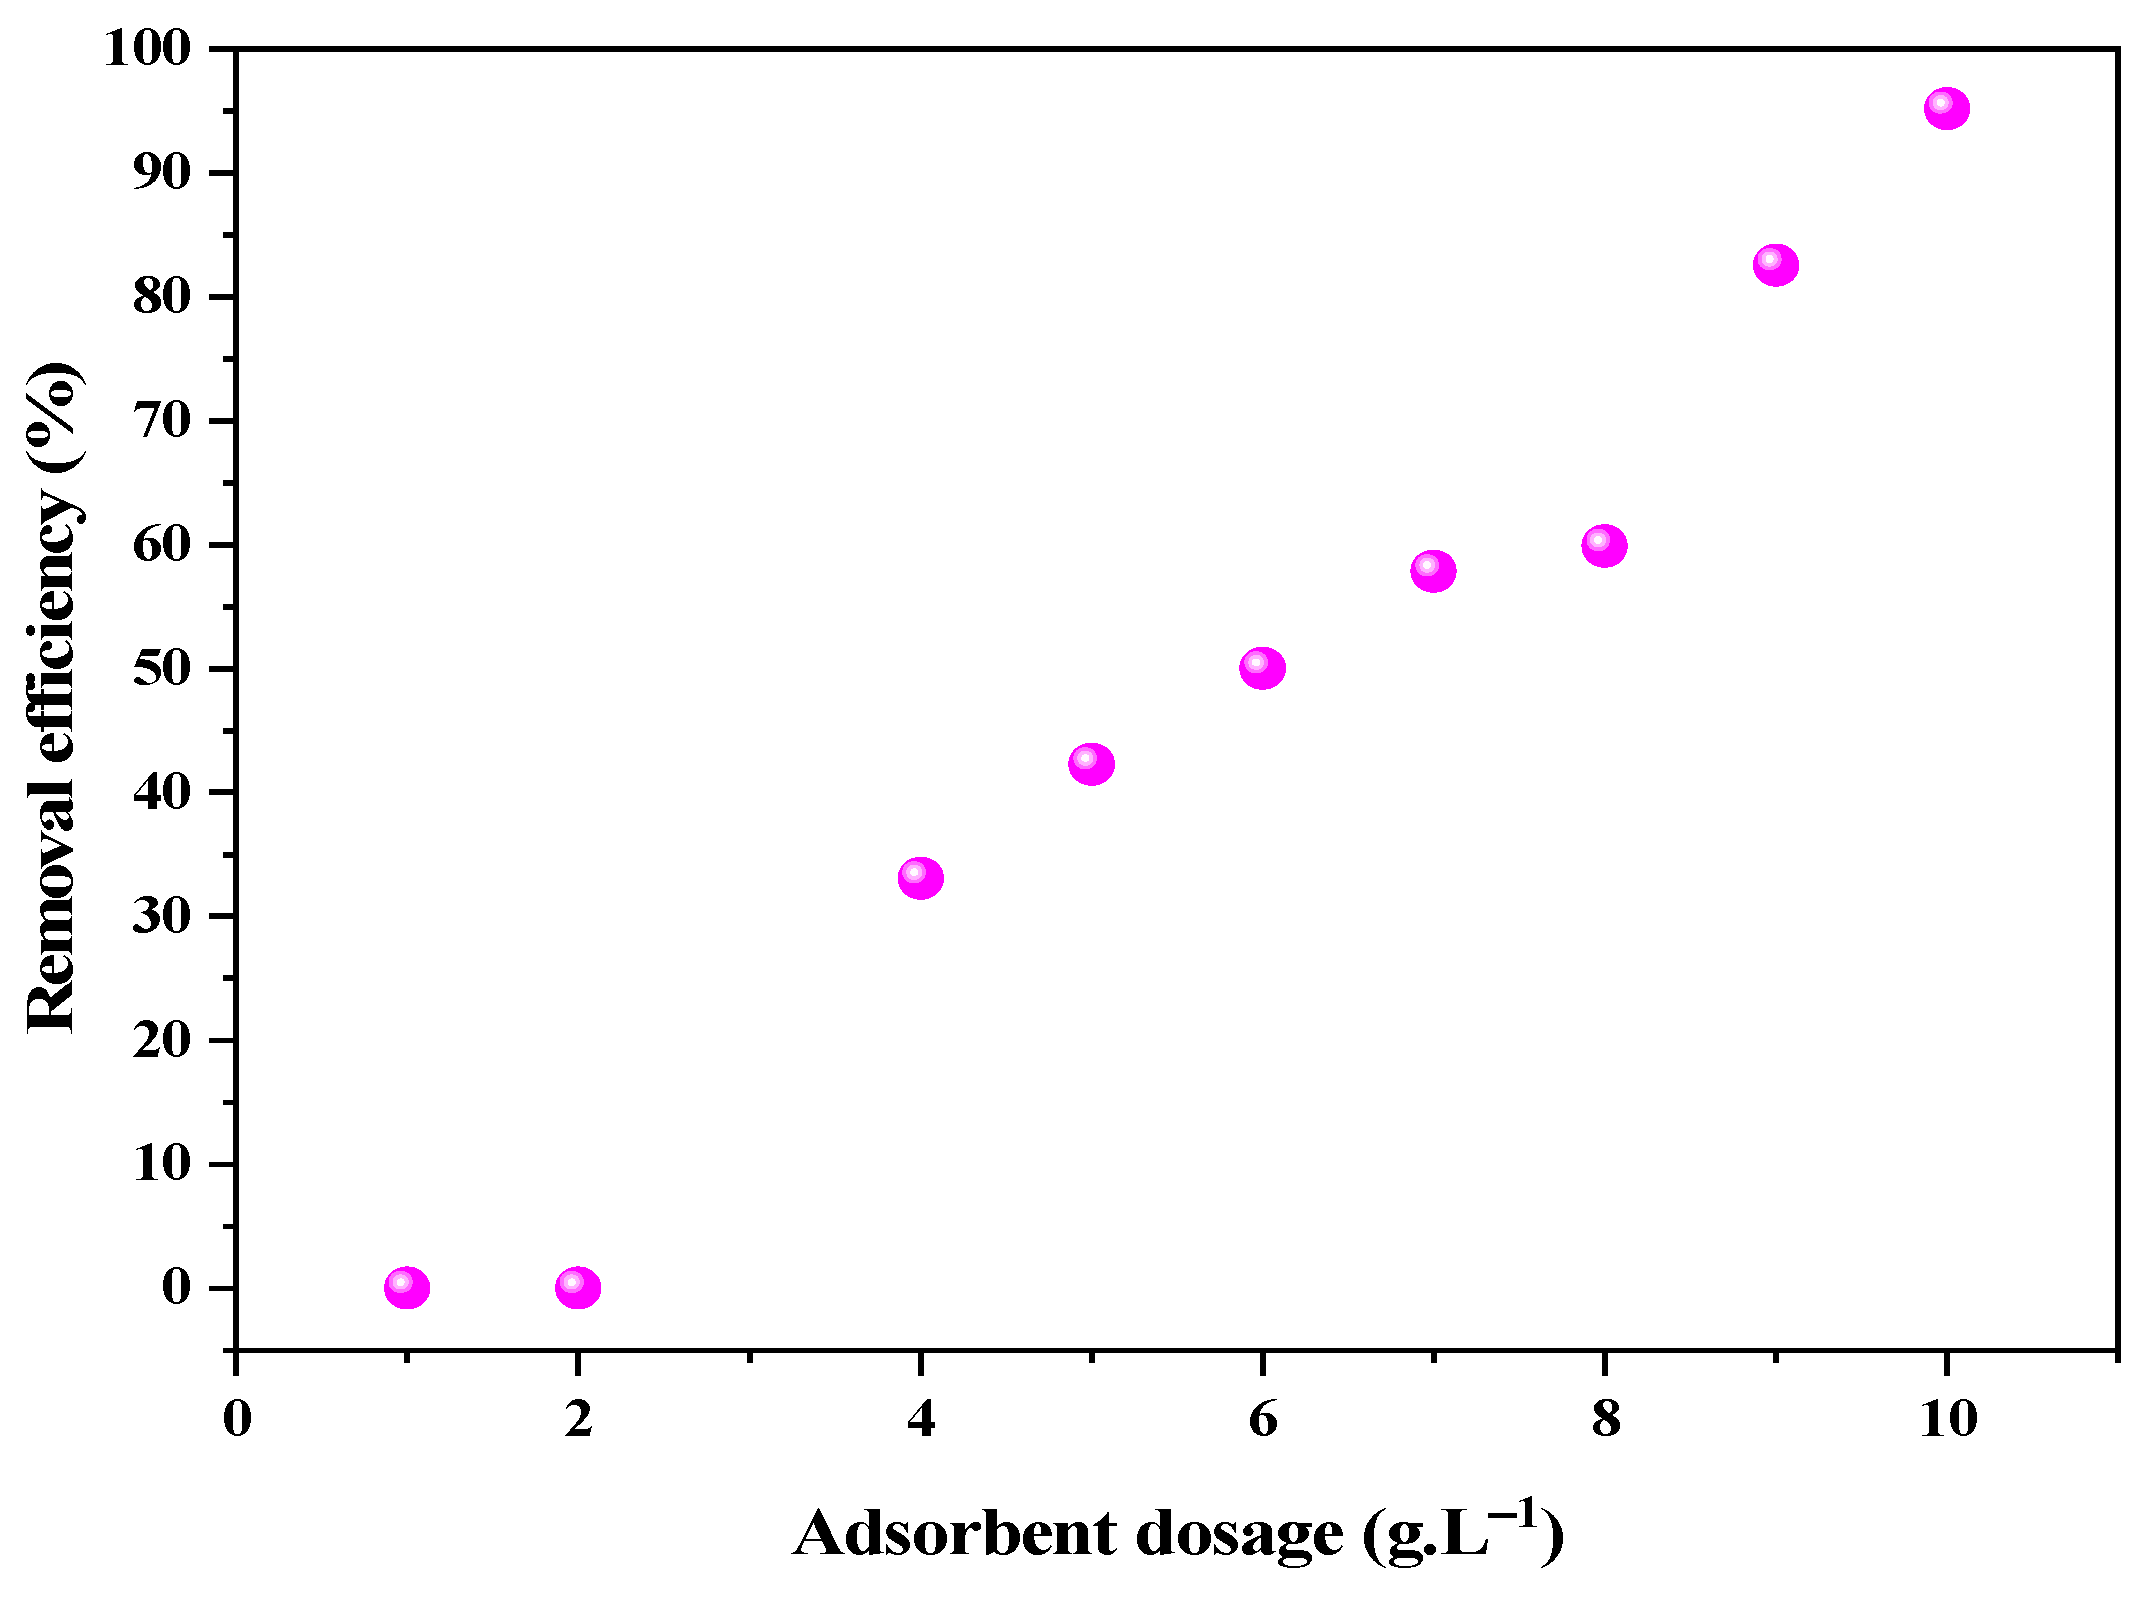
3.2. CaSF Dosage
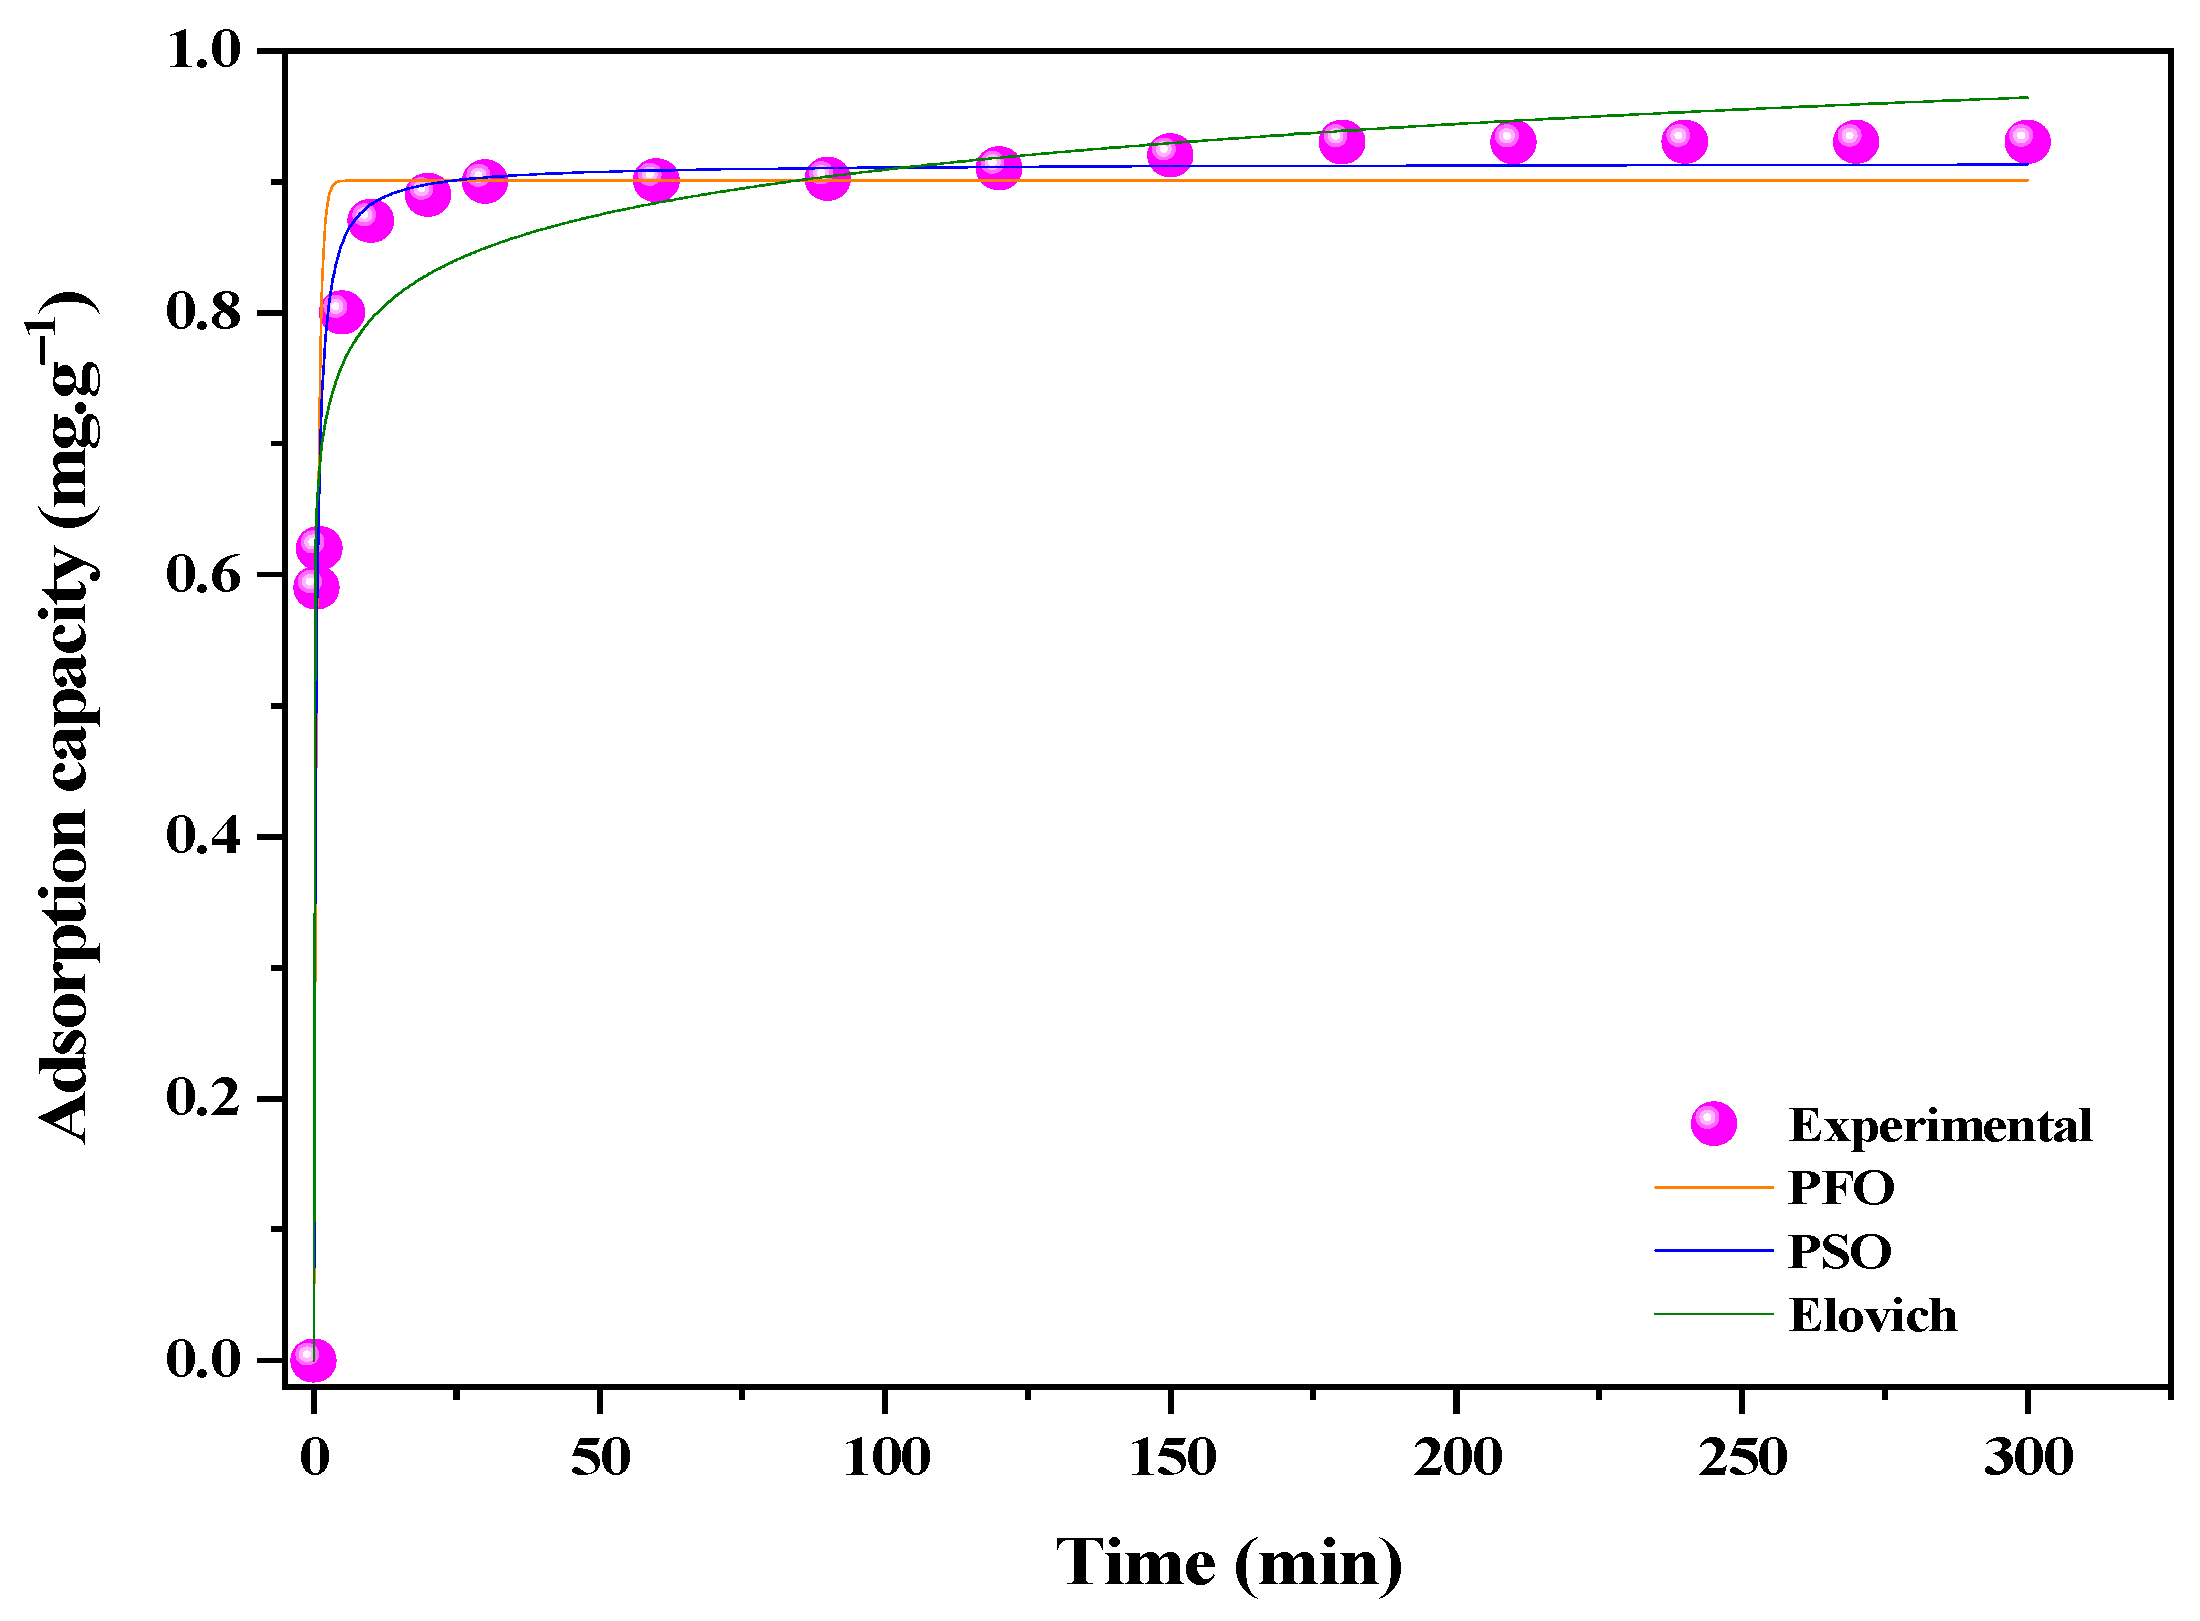
3.3. Adsorption Kinetics
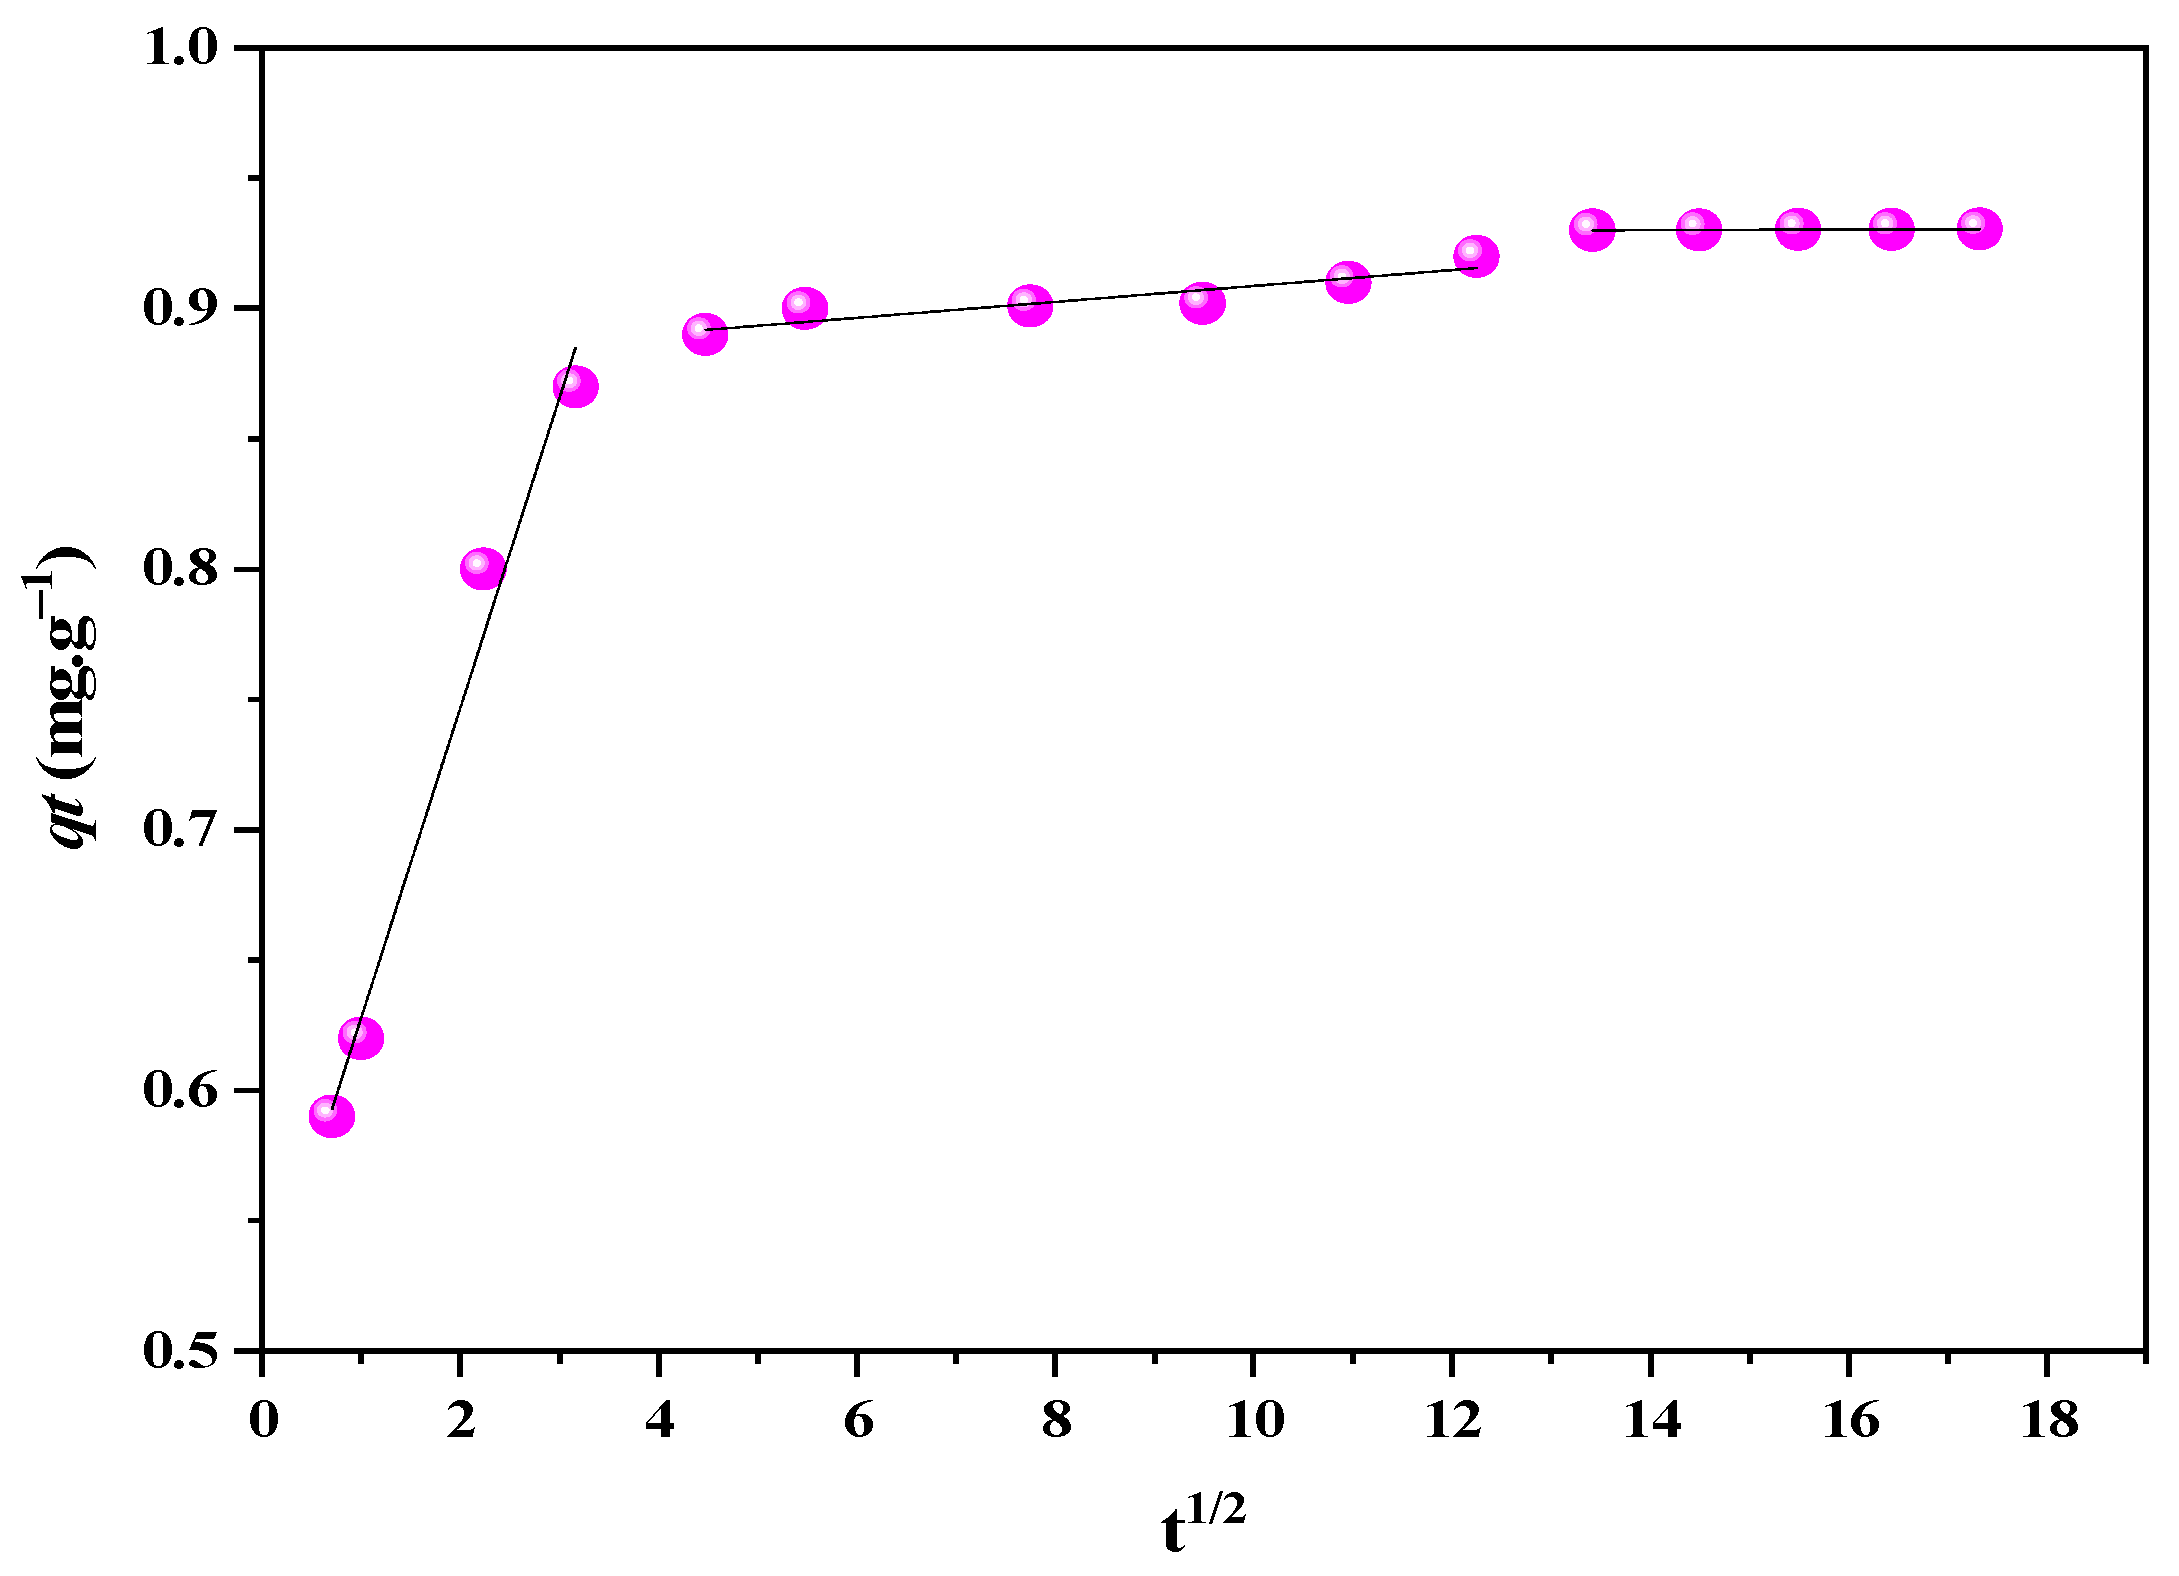
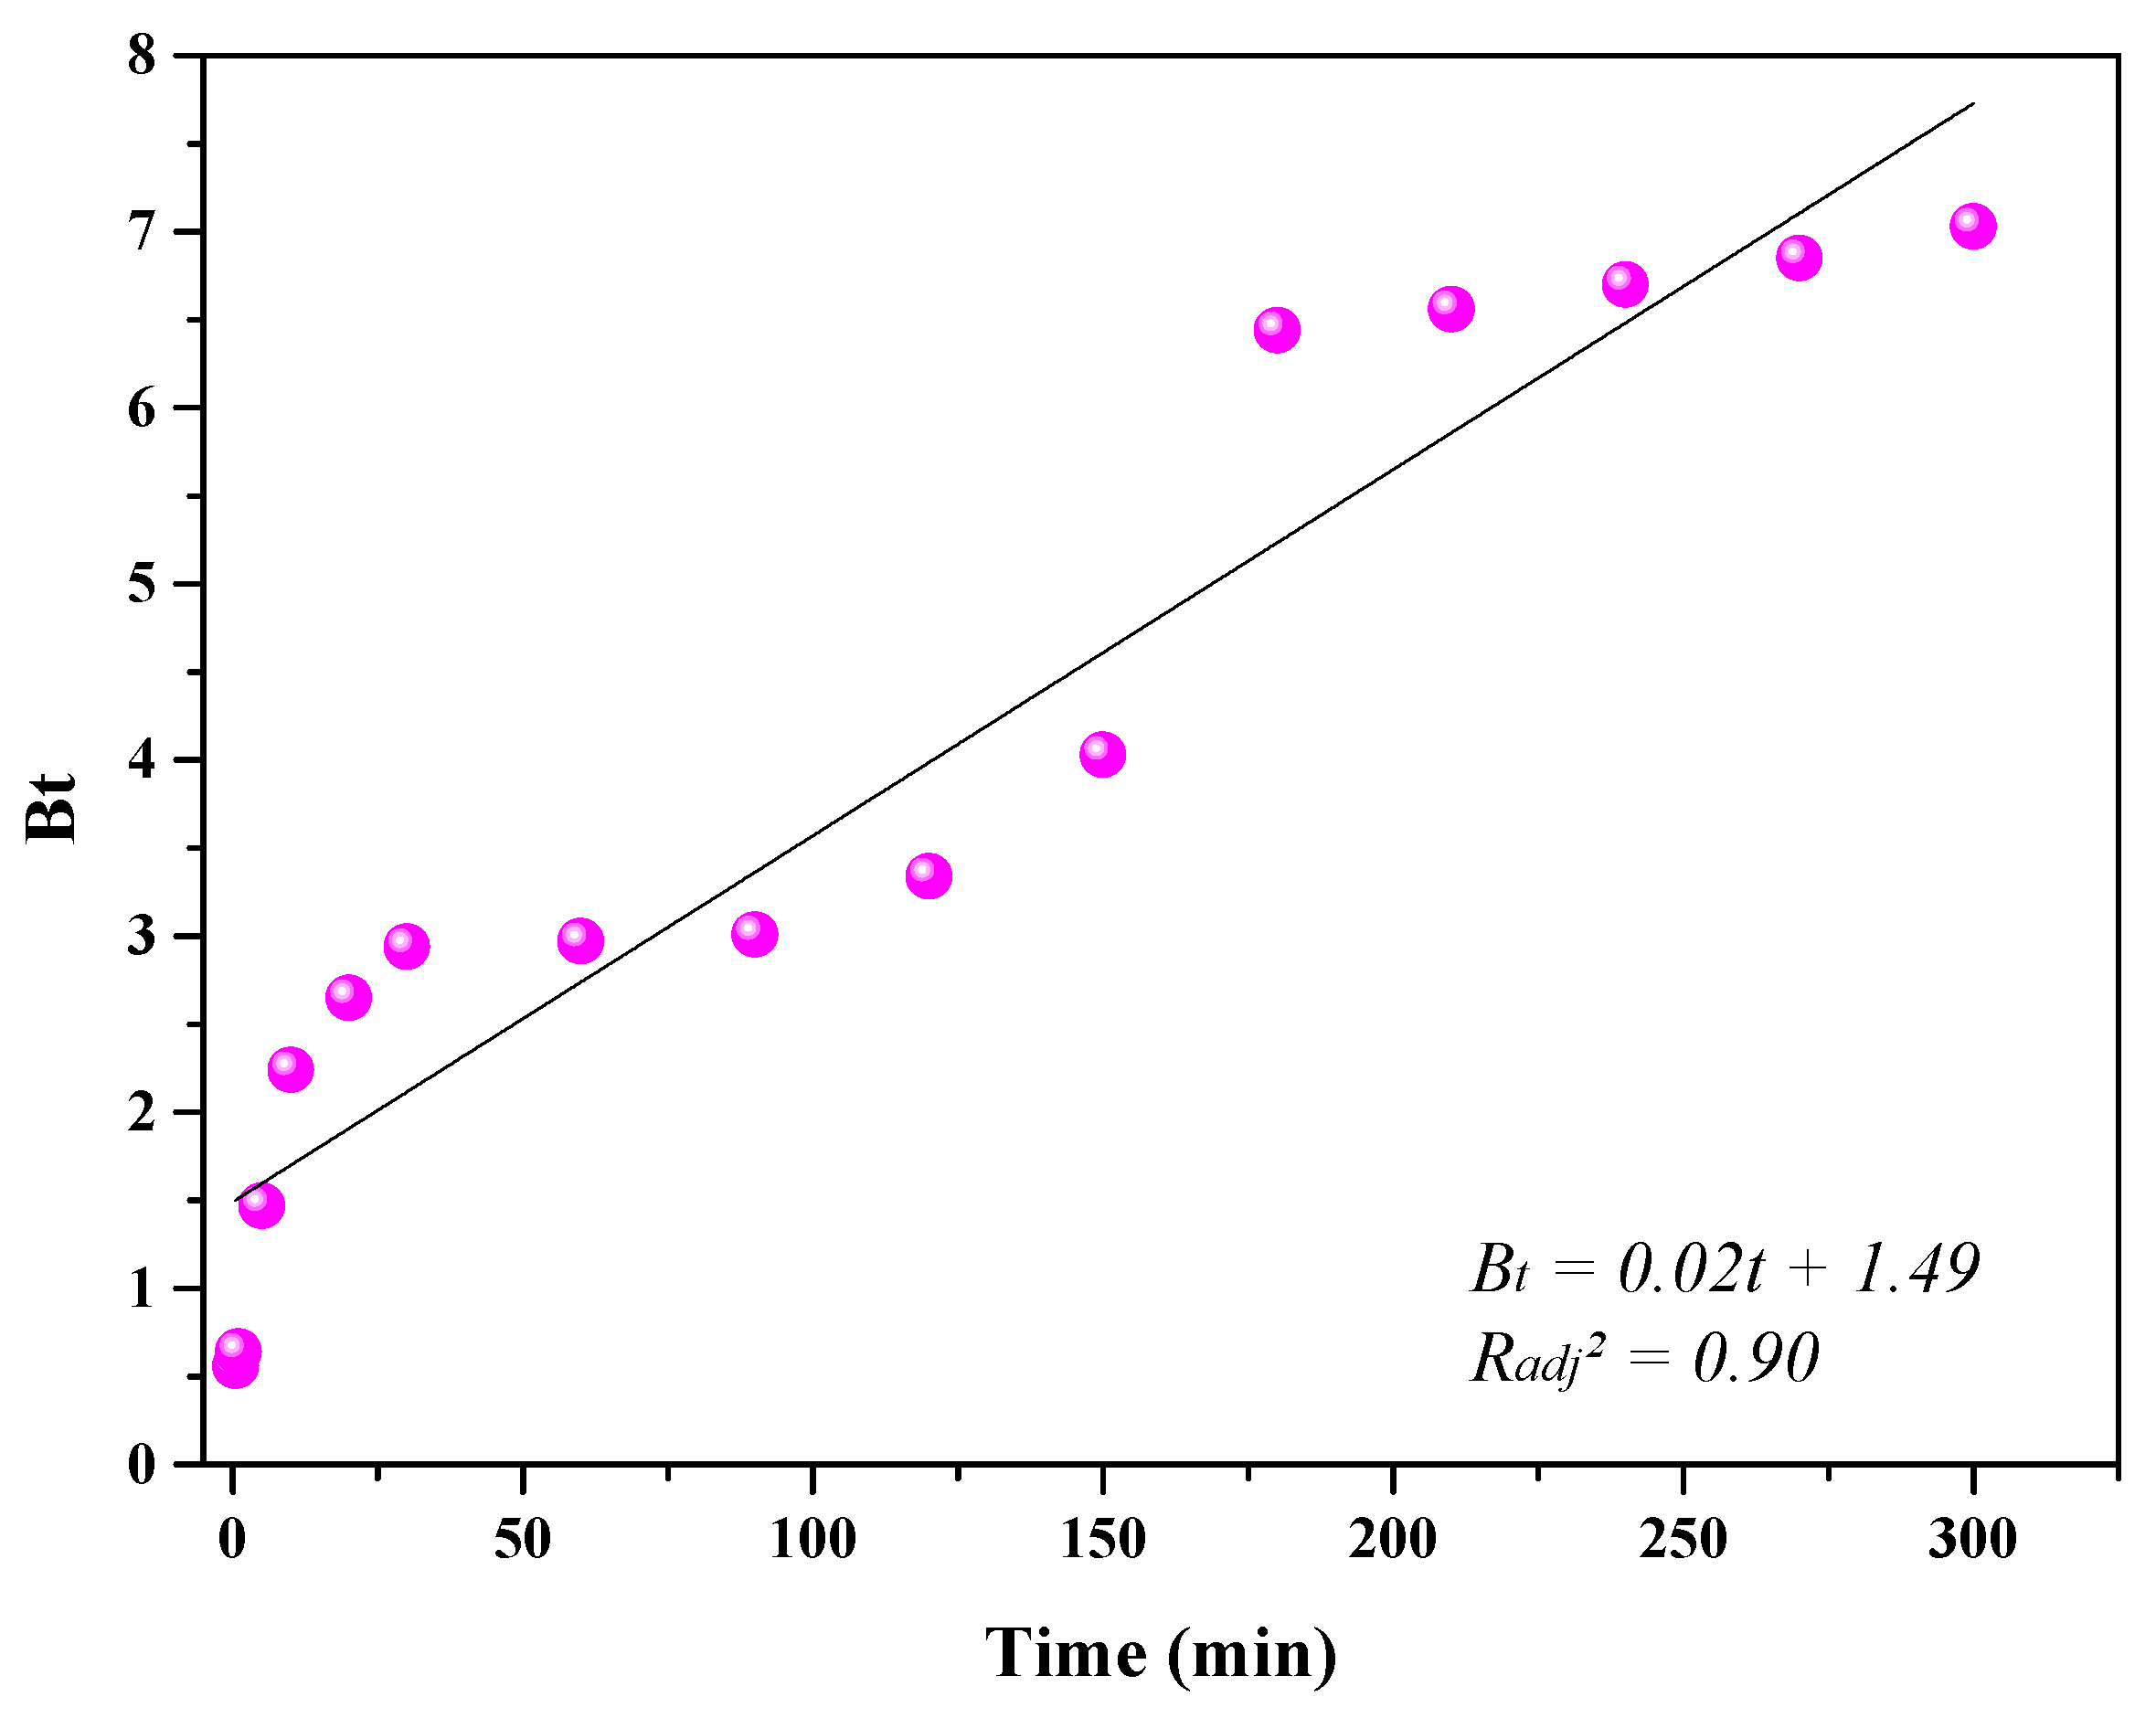
3.4. Diffusion Mechanism
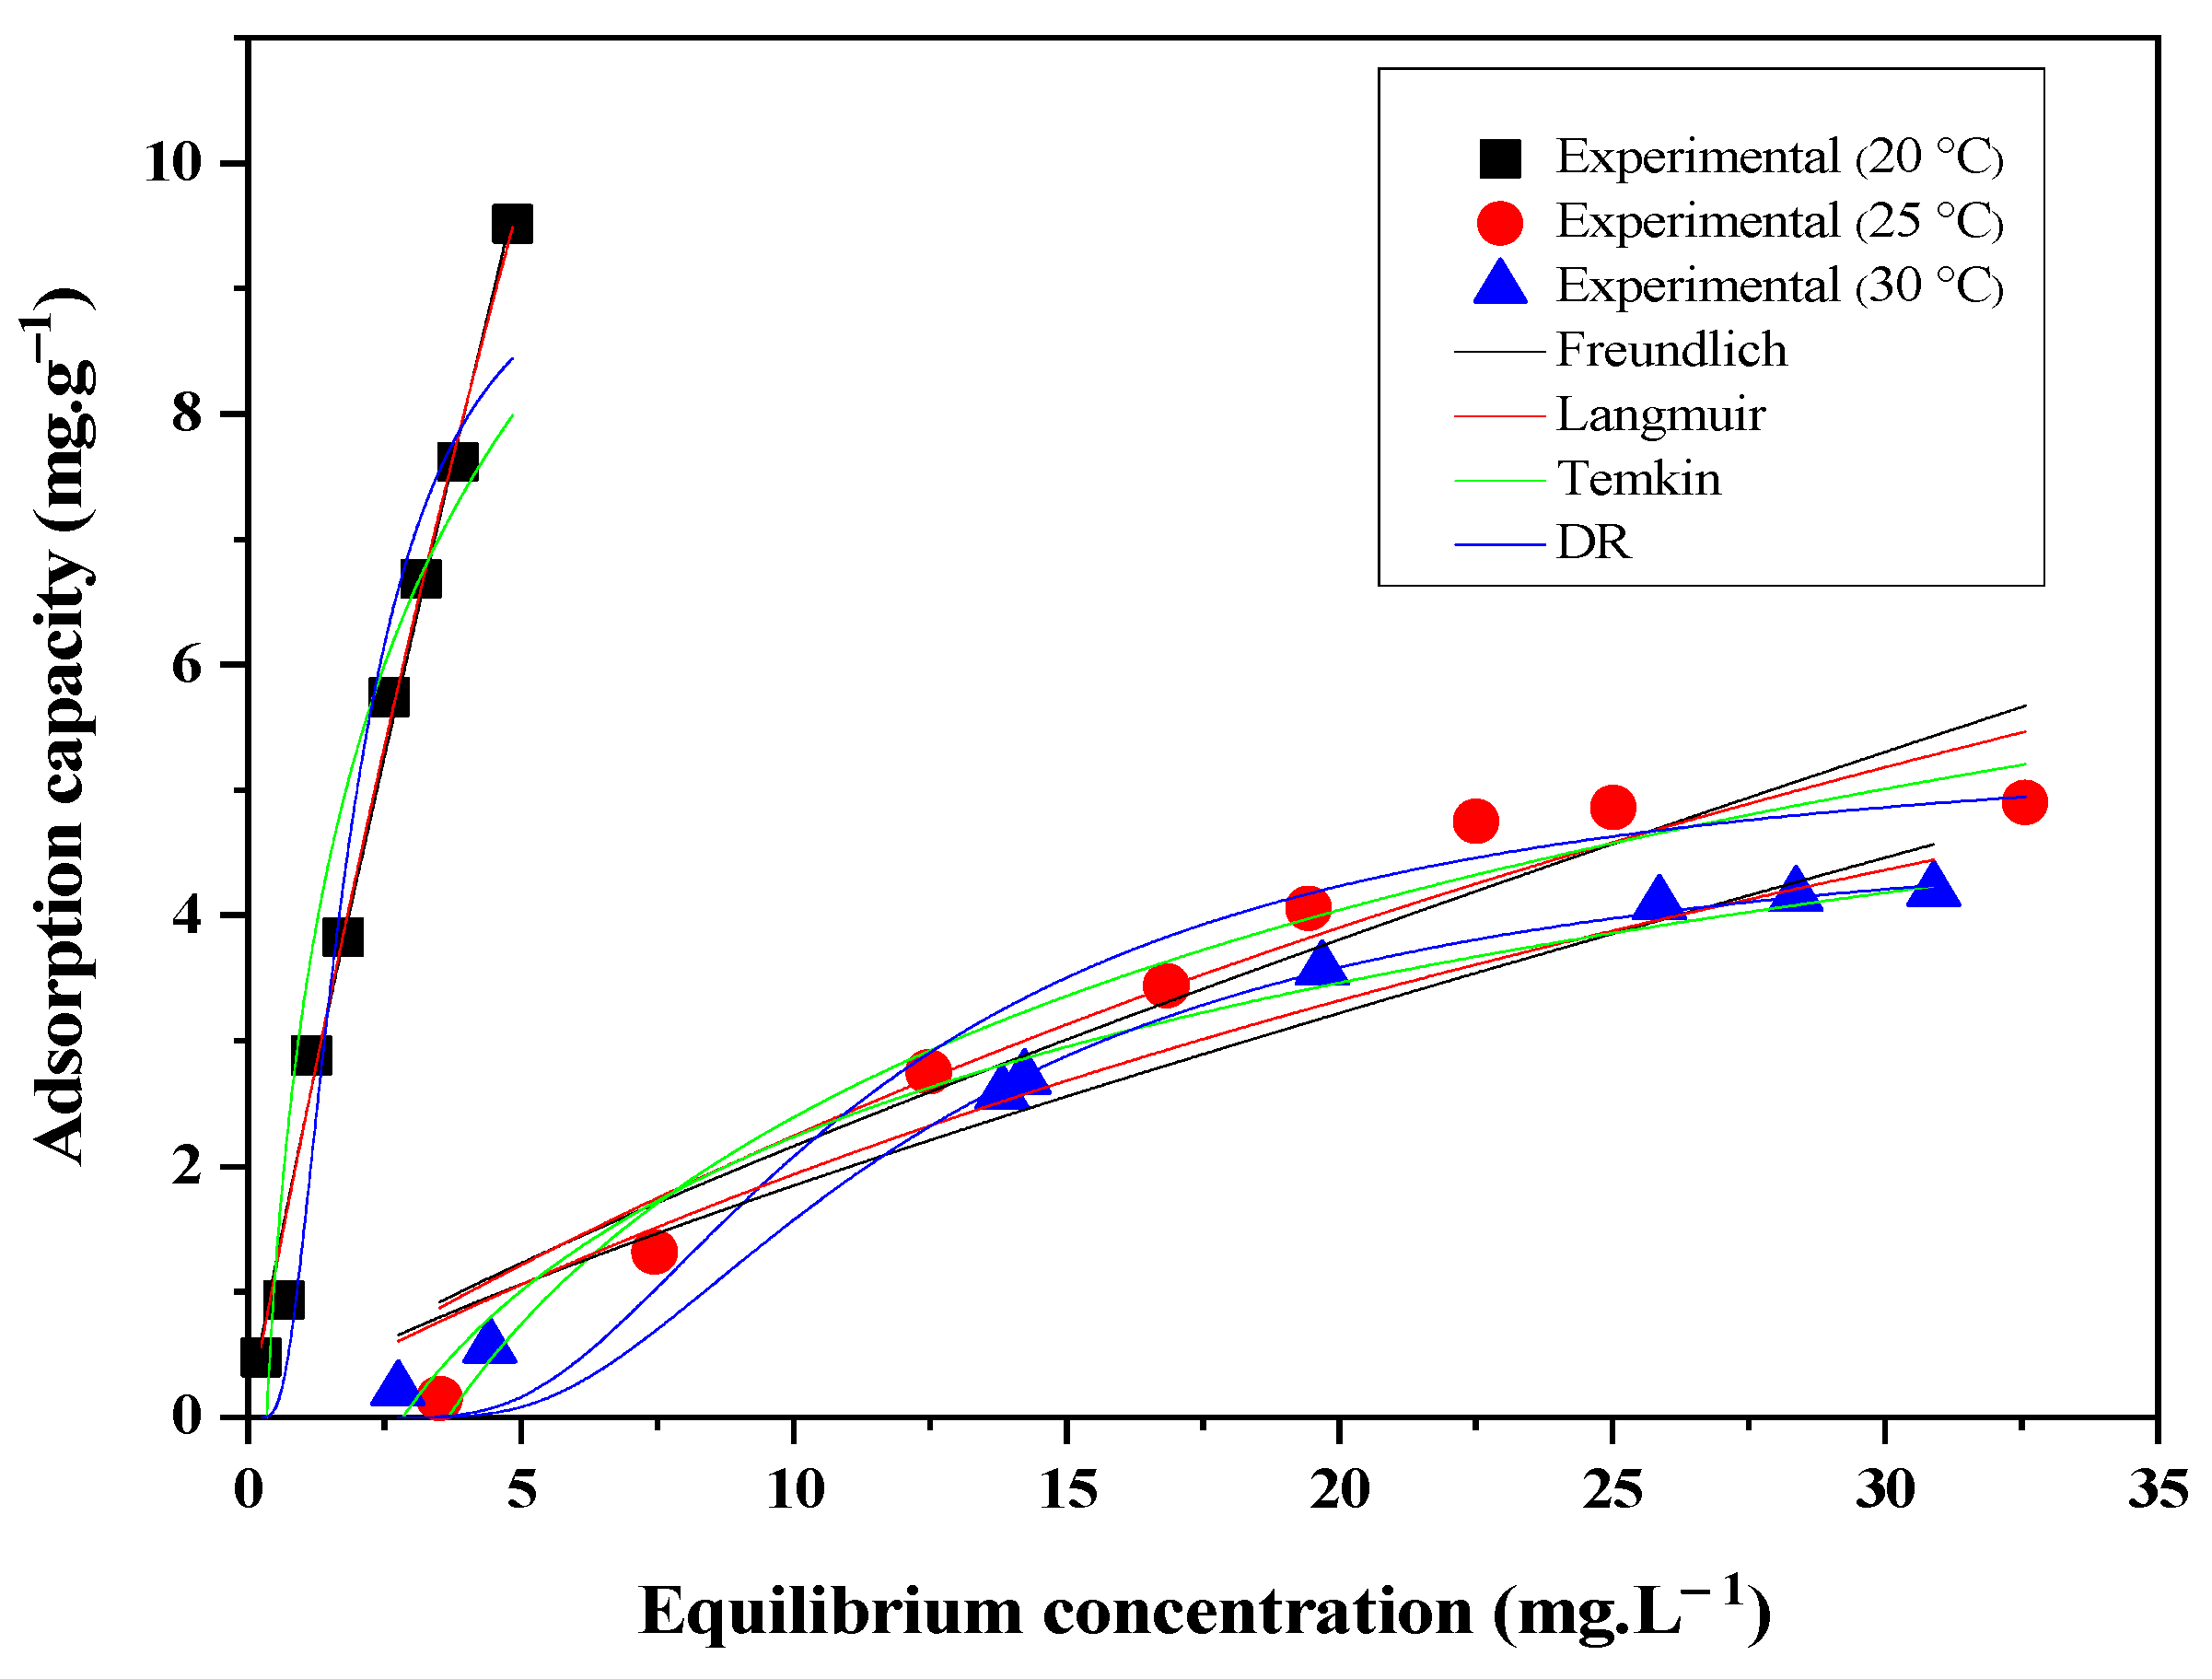
3.5. Adsorption Equilibrium
4. Conclusions
Author Contributions
Funding
Data Availability Statement
Acknowledgments
Conflicts of Interest
References
- Khan, E.A.; Shahjahan; Khan, T.A. A. Adsorption of methyl red on activated carbon derived from custard apple (Annona squamosa) fruit shell: Equilibrium isotherm and kinetic studies. J. Mol. Liq. 2018, 249, 1195–1211. [Google Scholar] [CrossRef]
- Basu, S.; Ghosh, G.; Saha, S. Adsorption characteristics of phosphoric acid induced activation of bio-carbon: Equilibrium, kinetics, thermodynamics and batch adsorber design. Process Saf. Environ. Prot. 2018, 117, 125–142. [Google Scholar] [CrossRef]
- Szygula, A.; Guibal, E.; Ruiz, M.; Sastre, A.M. The removal of sulphonated azo-dyes by coagulation with chitosan. Colloid Surf. A Physicochem. Eng. Asp. 2008, 330, 219–226. [Google Scholar] [CrossRef]
- Zhang, L.; Gao, X.; Zhang, Z.; Zhang, M.; Cheng, Y.; Su, J. A doping lattice of aluminum and copper with accelerated electron transfer process and enhanced reductive degradation performance. Sci. Rep. 2016, 6, 31797. [Google Scholar] [CrossRef] [Green Version]
- Greluk, M.; Hubicki, Z. Efficient removal of Acid Orange 7 dye from water using the strongly basic anion exchange resin Amberlite IRA-958. Desalination 2011, 278, 219–226. [Google Scholar] [CrossRef]
- Martini, B.K.; Daniel, T.G.; Corazza, M.Z.; Carvalho, A.E. Methyl orange and tartrazine yellow adsorption on activated carbon prepared from boiler residue: Kinetics, isotherms, thermodynamics studies and material characterization. J. Environ. Chem. Eng. 2018, 6, 6669–6679. [Google Scholar] [CrossRef]
- Pekov, G.; Petsev, N. Adsorption of methyl red on sterchamol. Anal. Chim. Acta 1990, 232, 413–416. [Google Scholar] [CrossRef]
- Ashraf, S.S.; Rauf, M.A.; Alhadrami, S. Degradation of Methyl Red using Fenton’s reagent and the effect of various salts. Dye. Pig. 2006, 69, 74–78. [Google Scholar] [CrossRef]
- Cheng, X.H.; Guo, W. The oxidation kinetics of reduction intermediate product of methyl red with hydrogen peroxide. Dye. Pig. 2007, 72, 372–377. [Google Scholar] [CrossRef]
- Muthuraman, G.; Teng, T.T. Extraction of methyl red from industrial wastewater using xylene as an extractant. Prog. Nat. Sci. 2009, 19, 1215–1220. [Google Scholar] [CrossRef]
- Rios-Del Toro, E.E.; Celis, L.B.; Cervantes, F.J.; Rangel-Mendez, J.R. Enhanced microbial decolorization of methyl red with oxidized carbon fiber as redox mediator. J. Hazard. Mater. 2013, 260, 967–974. [Google Scholar] [CrossRef] [PubMed]
- Sarkar, P.; Fakhruddin, A.N.M.; Pramanik, M.K.; Mahin, A.A. Decolorization of Methyl Red by Staphylococcus arlettae PF4 Isolated from Garden Soil. Int. J. Environ. 2011, 1, 34–39. [Google Scholar]
- Ikram, M.; Naeem, M.; Zahoor, M.; Rahim, A.; Hanafiah, M.M.; Oyekanmi, A.A.; Shah, A.B.; Mahnashi, M.H.; Ali, A.A.; Jalal, N.A.; et al. Biodegradation of Azo Dye Methyl Red by Pseudomonas aeruginosa: Optimization of Process Conditions. Int. J. Environ. Res. Public Health 2022, 19, 9962. [Google Scholar] [CrossRef] [PubMed]
- Sharifi, N.; Nasiri, A.; Martínez, S.S.; Amiri, A. Synthesis of Fe3O4@activated carbon to treat metronidazole effluents by adsorption and heterogeneous Fenton with effluent bioassay. J. Photochem. Photobiol. A Chem. 2022, 427, 113845. [Google Scholar] [CrossRef]
- Tumlos, R.; Ting, J.; Osorio, E.; Rosario, L.; Ramos, H.; Ulano, A.; Lee, H.; Regalado, G. Results of the study of chemical-, vacuum drying- and plasma-pretreatment of coconut (Cocos nucifera) lumber sawdust for the adsorption of methyl red in water solution. Surf. Coat. Technol. 2011, 205, S435–S439. [Google Scholar] [CrossRef]
- Ding, G.; Wang, B.; Chen, L.; Zhao, S. Simultaneous adsorption of methyl red and methylene blue onto biochar and an equilibrium modeling at high concentration. Chemosphere 2016, 163, 283–289. [Google Scholar] [CrossRef]
- Luo, W.; Sasaki, K.; Hirajima, T. Influence of the pre-dispersion of montmorillonite on organic modification and the adsorption of perchlorate and methyl red anions. Appl. Clay Sci. 2018, 154, 1–9. [Google Scholar] [CrossRef]
- Mozaffari, M.; Emami, M.R.S.; Binaeian, E. A novel thiosemicarbazide modified chitosan (TSFCS) for efficiency removal of Pb (II) and methyl red from aqueous solution. Int. J. Biol. Macromol. 2019, 123, 457–467. [Google Scholar] [CrossRef]
- Zaheer, Z.; AL-Asfar, A.; Aazam, E.S. Adsorption of methyl red on biogenic Ag@Fe nanocomposite adsorbent: Isotherms, kinetics and mechanisms. J. Mol. Liq. 2019, 283, 287–298. [Google Scholar] [CrossRef]
- Rajoriya, S.; Saharan, V.K.; Pundir, A.S.; Nigam, M.; Roy, K. Adsorption of methyl red dye from aqueous solution onto eggshell waste material: Kinetics, isotherms and thermodynamic studies. Curr. Res. Green Sustain. Chem. 2021, 4, 100180. [Google Scholar] [CrossRef]
- Roik, N.V.; Belyakova, L.A.; Dziazko, M.O. Selective sorptive removal of Methyl Red from individual and binary component solutions by mesoporous organosilicas of MCM-41 type. J. Environ. Sci. 2021, 99, 59–71. [Google Scholar] [CrossRef] [PubMed]
- Kim, H.; Purev, O.; Myung, E.; Choi, N.; Cho, K. Removal of methyl red from aqueous solution using polyethyleneimine crosslinked alginate beads with waste foundry dust as a magnetic material. Int. J. Environ. Res. Public Health 2022, 19, 9030. [Google Scholar] [CrossRef] [PubMed]
- Adusei, J.K.; Agorku, E.S.; Voegborlo, R.B.; Ampong, F.K.; Danu, B.Y.; Amarh, F.A. Removal of methyl red in aqueous systems using synthesized NaAlg-g-CHIT/Nzvi adsorbent. Sci. Afr. 2022, 17, e01273. [Google Scholar] [CrossRef]
- Weschayanwiwat, P.; Kunanupap, O.; Scamehorn, J.F. Benzene removal from wastewater using aqueous surfactant twophase extraction with cationic and anionic surfactant mixtures. Chemosphere 2008, 72, 1043–1048. [Google Scholar] [CrossRef]
- Cavalcante, P.R.M.; Melo, R.P.F.; Castro Dantas, T.N.; Dantas Neto, A.A.; Barros Neto, E.L.; Moura, M.C.P.A. Removal of phenol from aqueous medium using micellar solubilization followed by ionic flocculation. J. Environ. Chem. Eng. 2018, 6, 2778–2784. [Google Scholar] [CrossRef]
- Liu, H.Q.; Liu, F.; Wei, G.X.; Zhang, R.; Zhu, Y.W. Effects of Surfactants on the Removal of Carbonaceous Matter and Dioxins from Weathered Incineration Fly Ash. Aerosol Air Qual. Res. 2017, 17, 2338–2347. [Google Scholar] [CrossRef] [Green Version]
- Hosseinzadeh, R.; Khorsandi, K.; Hemmaty, S. Study of the effect of surfactants on extraction and determination of polyphenolic compounds and antioxidant capacity of fruits extracts. PLoS ONE 2013, 8, e57353. [Google Scholar] [CrossRef] [Green Version]
- Koner, S.; Pal, A.; Adak, A. Use of Surface Modified Silica gel factory Waste for Removal of 2,4-D Pesticide from Agricultural Wastewater: A case study. Int. J. Environ. Res. 2012, 6, 995–1006. [Google Scholar] [CrossRef]
- Li, F.; Li, X.; Zhang, J.; Peng, L.; Liu, C. Removal of organic matter and heavy metals of low concentration from wastewater via micellar-enhanced ultrafiltration: An overview. IOP Conf. Ser. Earth Environ. Sci. 2017, 52, 012077. [Google Scholar] [CrossRef] [Green Version]
- Fu, H.Y.; Zhang, Z.B.; Chai, T.; Huang, G.H.; Yu, S.J.; Liu, Z.; Gao, P.F. Study of the removal of aniline from wastewater via meuf using mixed surfactants. Water 2017, 9, 365. [Google Scholar] [CrossRef] [Green Version]
- Lima, É.C.; Dehghani, M.H.; Guleria, A.; Sher, F.; Karri, R.R.; Dotto, G.L.; Tran, H.N. Adsorption: Fundamental Aspects and Applications of Adsorption for Effluent Treatment. In Green Technologies for the Defluoridation of Water; Elsevier: Amsterdam, The Netherlands, 2021; pp. 41–88. [Google Scholar]
- Kaveeshwar, A.R.; Kumar, P.S.; Revellame, E.D.; Gang, D.D.; Zappi, M.E.; Subramaniam, R. Adsorption properties and mechanism of barium (II) and strontium (II) removal from fracking wastewater using pecan shell based activated carbon. J. Clean. Prod. 2018, 193, 1–13. [Google Scholar] [CrossRef]
- Mirghani, M.E.S.; Che Man, Y.B.; Jinap, S.; Baharin, B.S.; Bakar, J. FTIR Spectroscopic Determination of Soap in Refined Vegetable Oils. J. Am. Oil Chem. Soc. 2002, 79, 111–116. [Google Scholar] [CrossRef]
- Nandiyanto, A.B.D.; Oktiani, R.; Ragadhita, R. How to read and interpret FTIR spectroscopy of organic material. Indones. J. Sci. Technol. 2019, 4, 97–118. [Google Scholar] [CrossRef] [Green Version]
- Dadfarnia, S.; Shabani, A.M.H.; Moradi, S.E.; Emami, S. Methyl red removal from water by iron based metal-organic frameworks loaded onto iron oxide nanoparticle adsorbent. Appl. Surf. Sci. 2015, 330, 85–93. [Google Scholar] [CrossRef]
- Yılmaz, E.; Sert, E.; Atalay, F.S. Synthesis, characterization of a metal organic framework: MIL-53 (Fe) and adsorption mechanisms of methyl red onto MIL-53 (Fe). J. Taiwan Inst. Chem. Eng. 2016, 65, 323–330. [Google Scholar] [CrossRef]
- Oyelude, E.O.; Awudza, J.A.M.; Twumasi, S.K. Removal of malachite green from aqueous solution using pulverized teak leaf litter: Equilibrium, kinetic and thermodynamic studies. Chem. Cent. J. 2018, 12, 81. [Google Scholar] [CrossRef] [Green Version]
- Mohamed, H.G.; Aboud, A.A.; El-Salam, H.M.A. Synthesis and characterization of chitosan/polyacrylamide hydrogel grafted poly(N-methylaniline) for methyl red removal. Int. J. Biol. Macromol. 2021, 187, 240–250. [Google Scholar] [CrossRef]
- Ngwabebhoh, F.A.; Erdem, A.; Yildiz, U. Synergistic removal of Cu(II) and nitrazine yellow dye using an eco-friendly chitosan-montmorillonite hydrogel: Optimization by response surface methodology. J. Appl. Polym. Sci. 2016, 133, 43664. [Google Scholar] [CrossRef]
- Teixeira, Y.N.; Melo, R.P.F.; Fernandes, M.R.; Carmo, S.K.S.; Barros Neto, E.L. Malachite green removal using ionic flocculation. Water Pract. Technol. 2022, 17, 1113–1128. [Google Scholar] [CrossRef]
- Teixeira, Y.N.; Paula Filho, F.J.; Bacurau, V.P.; Menezes, J.M.C.; Fan, A.Z.; Melo, R.P.F. Removal of Methylene Blue from a synthetic effluent by ionic flocculation. Helyion 2022, 8, e10868. [Google Scholar] [CrossRef] [PubMed]
- Sultana, H.; Usman, M.; Ghaffar, A.; Bokhari, T.H.; Mansha, A.; Yusaf, A. Sustainable Application of Ionic Flocculation Method for Textile Effluent Treatment. In Sustainable Practices in the Textile Industry; Wiley: Hoboken, NJ, USA, 2021; pp. 253–272. [Google Scholar]
- Ruthven, D.M. Principles of Adsorption and Adsorption Process, 1st ed.; John Wiley & Sons: Toronto, ON, Canada, 1984; p. 98. [Google Scholar]
- Bonilla-Petriciolet, A.; Mendonza-Castillo, D.I.; Reynel-Ávila, H.E. Adsorption Processes for Water Treatment and Purification, 1st ed.; Springer: Cham, Switzerland, 2017; p. 33. [Google Scholar]


| Fatty Acids (Carbon Atoms) | SB (wt%) | PF (wt%) | Type |
|---|---|---|---|
| Myristic (C14) | 0.20 | 2.00 | Saturated |
| Palmitic (C16) | 11.35 | 27.00 | Saturated |
| Stearic (C18) | 4.15 | 11.00 | Saturated |
| Palmitoleic (C16) | 0.05 | 4.00 | Unsaturated |
| Oleic (C18) | 25.30 | 44.00 | Unsaturated |
| Linoleic (C18) | 50.75 | 11.00 | Unsaturated |
| Linolenic (C18) | 8.20 | 1.00 | Unsaturated |
| Experimental Result | PFO | PSO | Elovich | |||
|---|---|---|---|---|---|---|
| qe_exp | qe | k1 | qe | k2 | α | β |
| (mg·g−1) | (mg·g−1) | (min−1) | (mg·g−1) | (g·mg−1·min−1) | (mg·g−1·min−1) | (mg·g−1) |
| 0.93 | 0.90 | 1.61 | 0.91 | 3.05 | 4.19 × 10⁴ | 20.07 |
| PFO | PSO | Elovich | |||||||||
|---|---|---|---|---|---|---|---|---|---|---|---|
| Radj2 | RSS | X2 | AICc | Radj2 | RSS | X2 | AICc | Radj2 | RSS | X2 | AICc |
| 0.96 | 0.03 | 2.47 × 10⁻³ | −92.90 | 0.99 | 0.01 | 7.78 × 10⁻⁴ | −110.46 | 0.97 | 0.02 | 1.67 × 10⁻³ | −99.18 |
| MR Conc. (mg·L−1) | qe_exp (mg·g−1) | Weber–Morris | Boyd | ||||
|---|---|---|---|---|---|---|---|
| Stage | C (mg·g−1) | Kd (mg·g−1·min−0.5) | Radj2 | RSS | D (cm2·s−1) | ||
| I | 0.51 | 0.12 | 0.98 | 9.28 × 10⁻⁴ | |||
| 10 | 0.93 | II | 0.88 | 3.06 × 10⁻³ | 0.81 | 7.87 × 10⁻⁵ | 5.28 × 10⁻⁹ |
| III | 0.93 | 1.02 × 10⁻⁴ | 0.99 | 1.43 × 10⁻¹⁰ |
| T (°C) | qmax_exp (mg·g−1) | Langmuir | DR | |||
|---|---|---|---|---|---|---|
| qmax (mg·g−1) | kL (L·mg−1) | qm (mg·g−1) | kDR (mol2·kJ−2) | E (kJ·mol−1) | ||
| 20 | 9.52 | 53.59 | 0.04 | 9.73 | 7.82 × 10⁻⁷ | 800 |
| 25 | 4.90 | 15.03 | 0.02 | 5.45 | 2.01 × 10⁻⁵ | 158 |
| 30 | 4.20 | 11.69 | 0.02 | 4.80 | 2.30 × 10⁻⁵ | 147 |
| Temkin | Freundlich | |||||
| b (J·mol−1) | kT (L·mg−1) | kF (L·mg−1) | n | |||
| 20 | 9.52 | 756.59 | 2.95 | 2.29 | 1.10 | |
| 25 | 4.90 | 963.29 | 0.27 | 0.33 | 1.22 | |
| 30 | 4.20 | 1.30 × 10³ | 0.35 | 1.26 | 0.29 | |
| T (°C) | Langmuir | DR | ||||||
|---|---|---|---|---|---|---|---|---|
| Radj2 | RSS | X2 | AICc | Radj2 | RSS | X2 | AICc | |
| 20 | 0.99 | 0.51 | 0.08 | −17.18 | 0.95 | 3.29 | 0.55 | −2.31 |
| 25 | 0.93 | 1.40 | 0.23 | −9.20 | 0.98 | 0.44 | 0.07 | −18.40 |
| 30 | 0.97 | 0.48 | 0.08 | −17.78 | 0.98 | 0.26 | 0.04 | −22.59 |
| Temkin | Freundlich | |||||||
| Radj2 | RSS | X2 | AICc | Radj2 | RSS | X2 | AICc | |
| 20 | 0.87 | 7.87 | 1.31 | 4.67 | 0.99 | 0.66 | 0.11 | −15.34 |
| 25 | 0.97 | 0.63 | 0.10 | −15.53 | 0.90 | 1.88 | 0.31 | −6.80 |
| 30 | 0.98 | 0.34 | 0.06 | −20.47 | 0.95 | 0.76 | 0.13 | −14.02 |
| Adsorbent | Equilibrium (min) | pH | Temperature (°C) | qmax (mg·g−1) | Reference |
|---|---|---|---|---|---|
| Eggshell | 180 | 2 | 25 | 1.66 | 20 |
| Hydrogel | 120 | 7 | 25 | 6.14 | 30 |
| Sodium alginate | 60 | 2 | 45 | 9.48 | 23 |
| Chitosan | 240 | 8 | 25 | 17.31 | 18 |
| Organosilicons | 3000 | 4.8 | 20 | 47.89 | 21 |
| Coffee residues | 240 | 3.5 | 25 | 66.66–76.72 | 45 |
| Activated carbon | 300 | 2 | 30 | 76.92 | 46 |
| Activated carbon | 50–80 | 4–5 | 30–50 | 435.25–226.90 | 1 |
| Calcium surfactant | 30 | 4 | 20 | 53.59 | This study |
Disclaimer/Publisher’s Note: The statements, opinions and data contained in all publications are solely those of the individual author(s) and contributor(s) and not of MDPI and/or the editor(s). MDPI and/or the editor(s) disclaim responsibility for any injury to people or property resulting from any ideas, methods, instructions or products referred to in the content. |
© 2023 by the authors. Licensee MDPI, Basel, Switzerland. This article is an open access article distributed under the terms and conditions of the Creative Commons Attribution (CC BY) license (https://creativecommons.org/licenses/by/4.0/).
Share and Cite
Teixeira, Y.N.; Menezes, J.M.C.; Teixeira, R.N.P.; Paula Filho, F.J.; Oliveira, T.M.B.F. Eco-Friendly Anionic Surfactant for the Removal of Methyl Red from Aqueous Matrices. Textiles 2023, 3, 52-65. https://doi.org/10.3390/textiles3010005
Teixeira YN, Menezes JMC, Teixeira RNP, Paula Filho FJ, Oliveira TMBF. Eco-Friendly Anionic Surfactant for the Removal of Methyl Red from Aqueous Matrices. Textiles. 2023; 3(1):52-65. https://doi.org/10.3390/textiles3010005
Chicago/Turabian StyleTeixeira, Yago N., Jorge M. C. Menezes, Raimundo N. P. Teixeira, Francisco J. Paula Filho, and Thiago M. B. F. Oliveira. 2023. "Eco-Friendly Anionic Surfactant for the Removal of Methyl Red from Aqueous Matrices" Textiles 3, no. 1: 52-65. https://doi.org/10.3390/textiles3010005