1. Introduction
Textile printing is becoming a well-known technology in the textile wet-processing industries for all fibers, textiles, and garments. Textile printing seems to be the most versatile and widely used way of imparting color and pattern to textile fibers. Textile printing is a significant method of producing ornamental textile fabric. Color is obtained using dyes or pigments in printing paste. Printing is a type of dyeing in which colors are applied to specific parts of the cloth rather than the entire fabric. The dyes and other auxiliaries are glued with a natural or synthetic thickening agent to confine the coloring materials to the design area. A successful print requires precise color, sharpness of mark, levelness, excellent hand, and efficient dye use: all of these characteristics are affected by the type of thickener employed [
1,
2,
3,
4,
5,
6,
7].
Thickening agents are an important component of any printing process. Thickeners are high-molecular-weight viscous chemicals that form a sticky paste with water, imparting stickiness and plasticity to the printing paste. These thickeners help to keep the design outlines from spreading even under high pressure. The primary function of thickeners in the textile industry is to retain or stick dye particles to the targeted portions of the fabric until the dye has transferred to the fabric surface and its fixation has been completed. A thickener adds viscosity to printing pastes, prevents early reactions between the print paste’s chemicals, and aids in the seizing of the print paste’s constituents on textiles. The thickener must be stable and suitable with the dyes and dyeing auxiliaries that are being employed [
8,
9,
10,
11].
Natural thickeners are polysaccharides derived from nature, such as plant exudates, seaweeds, seeds, and roots, which are commonly utilized. Some of them seem to be appropriate for printing with a specific color category, but they should be chemically adapted to satisfy the standards for printing [
1,
9].
Pectin is a complex polysaccharide combination that accounts for around one-third of the dry cell-wall material in higher plants. These chemicals are present in much lower concentrations in grass cell walls. Pectin concentrations are greatest in the middle lamella of the cell wall, with a steady decline as one moves through the main wall into the plasma membrane. Although pectin is found in almost all plant tissues, the number of sources from which pectin may be commercially manufactured is quite restricted. Because pectin’s capacity to form gel is dependent on the molecular size and degree of esterification (DE), pectin from different sources does not have the same gelling ability owing to variances in these characteristics [
12,
13,
14,
15].
As a result, detecting a substantial amount of pectin in fruit is insufficient to certify that fruit is a source of commercial pectin. Now, commercial pectin is virtually entirely generated from citrus peel or apple pomace, both of which are byproducts of juice (or cider) production. On a dry-matter basis, apple pomace comprises 10–15% pectin. Citrus peel contains 20–30% vitamin C. Citrus and apple pectin are identical in terms of application. Citrus pectin is pale cream or light tan in color, but apple pectin is usually deeper [
16].
Pectin is used in the cosmetics, pharmaceutical, and food industries to stabilize acidified milk drinks or juice and as a gelling or thickening agent. Pectin has also been the subject of special attention from nutritionists. It is used as dietary fiber and exerts physiological effects on the intestinal tract by increasing the transit time and the absorption of glucose [
17].
This study aims to use a natural thickening agent extracted from fruit peel (orange and pomegranate peels) in printing paste. Then the extracted pectin from both orange and pomegranate peel was modified with hexamine to improve its ability to store and against high pH to be able to be used as a thickener in the printing paste of cotton fabric.
The rheological properties of extracted pectin from orange and pomegranate peels and modified pectin were evaluated, including the influence of pH. The effect of prepared pectin thickeners on the color strength, fastness, mechanical, and physical qualities of the different textiles was also analyzed.
During this study, the different fabrics (cotton, wool, acrylic, and polyester) were printed using the appropriate dyes for the fibers (reactive, acid, and disperse dyes).
2. Materials and Methods
2.1. Material
Cotton (100%; 158 g/m2), polyester (100%; 160 g/m2), polyacrylic (100%; 160 g/m2), and wool (100%; 210 g/m2) fabrics were purchased from Misr El-Mahala Co., El-Mahala, Egypt. The natural gel was extracted from the citrus peel (orange and pomegranate peels collected from the local market) to use as an eco-friendly thickener. Alginate was purchased from Fluka BioChemica GmbH Co. and DELL thickener P (as a polyacrylate inverse nonionic emulsion), produced by Delta for Chemical Industries, Egypt.
C.I. Reactive blue 19 as a reactive dye, Telon Blue BRL as an acid dye, and Dianix Blue SE-2R as a dispersed dye were kindly supplied by Dystar Co., Cairo, Egypt. Hostapal CV, an anionic textile auxiliary based on alkyl aryl polyglycol ether, was used as a detergent. The sodium bicarbonate, acetic acid, ethyl alcohol, and urea used were laboratory-grade chemicals.
2.2. Method
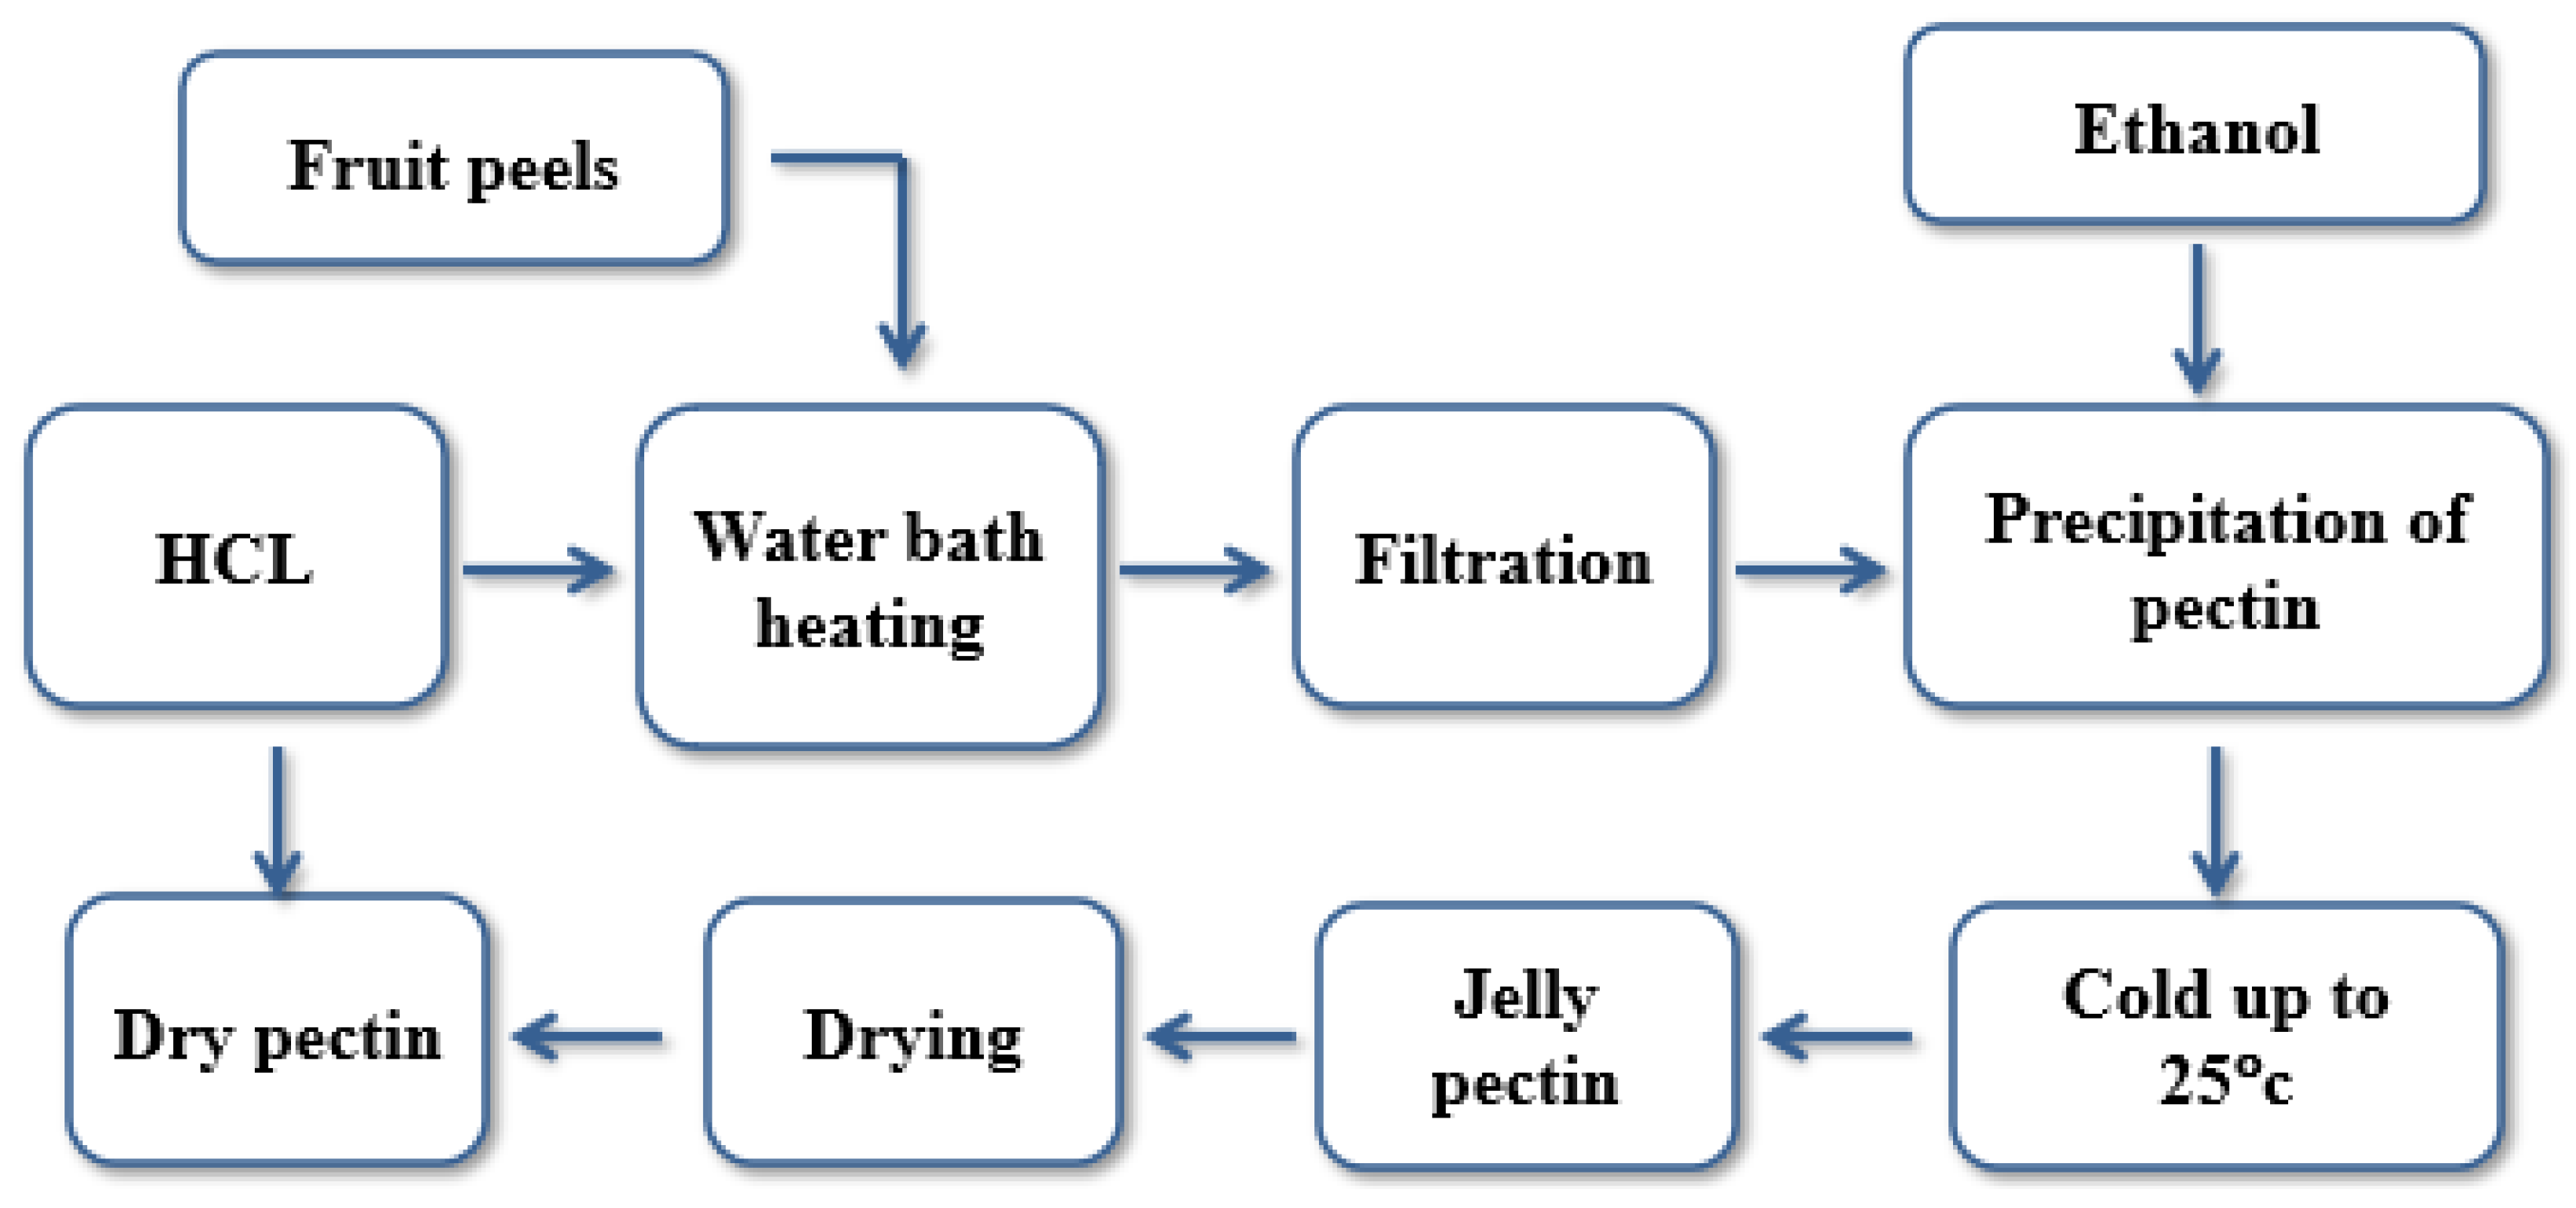
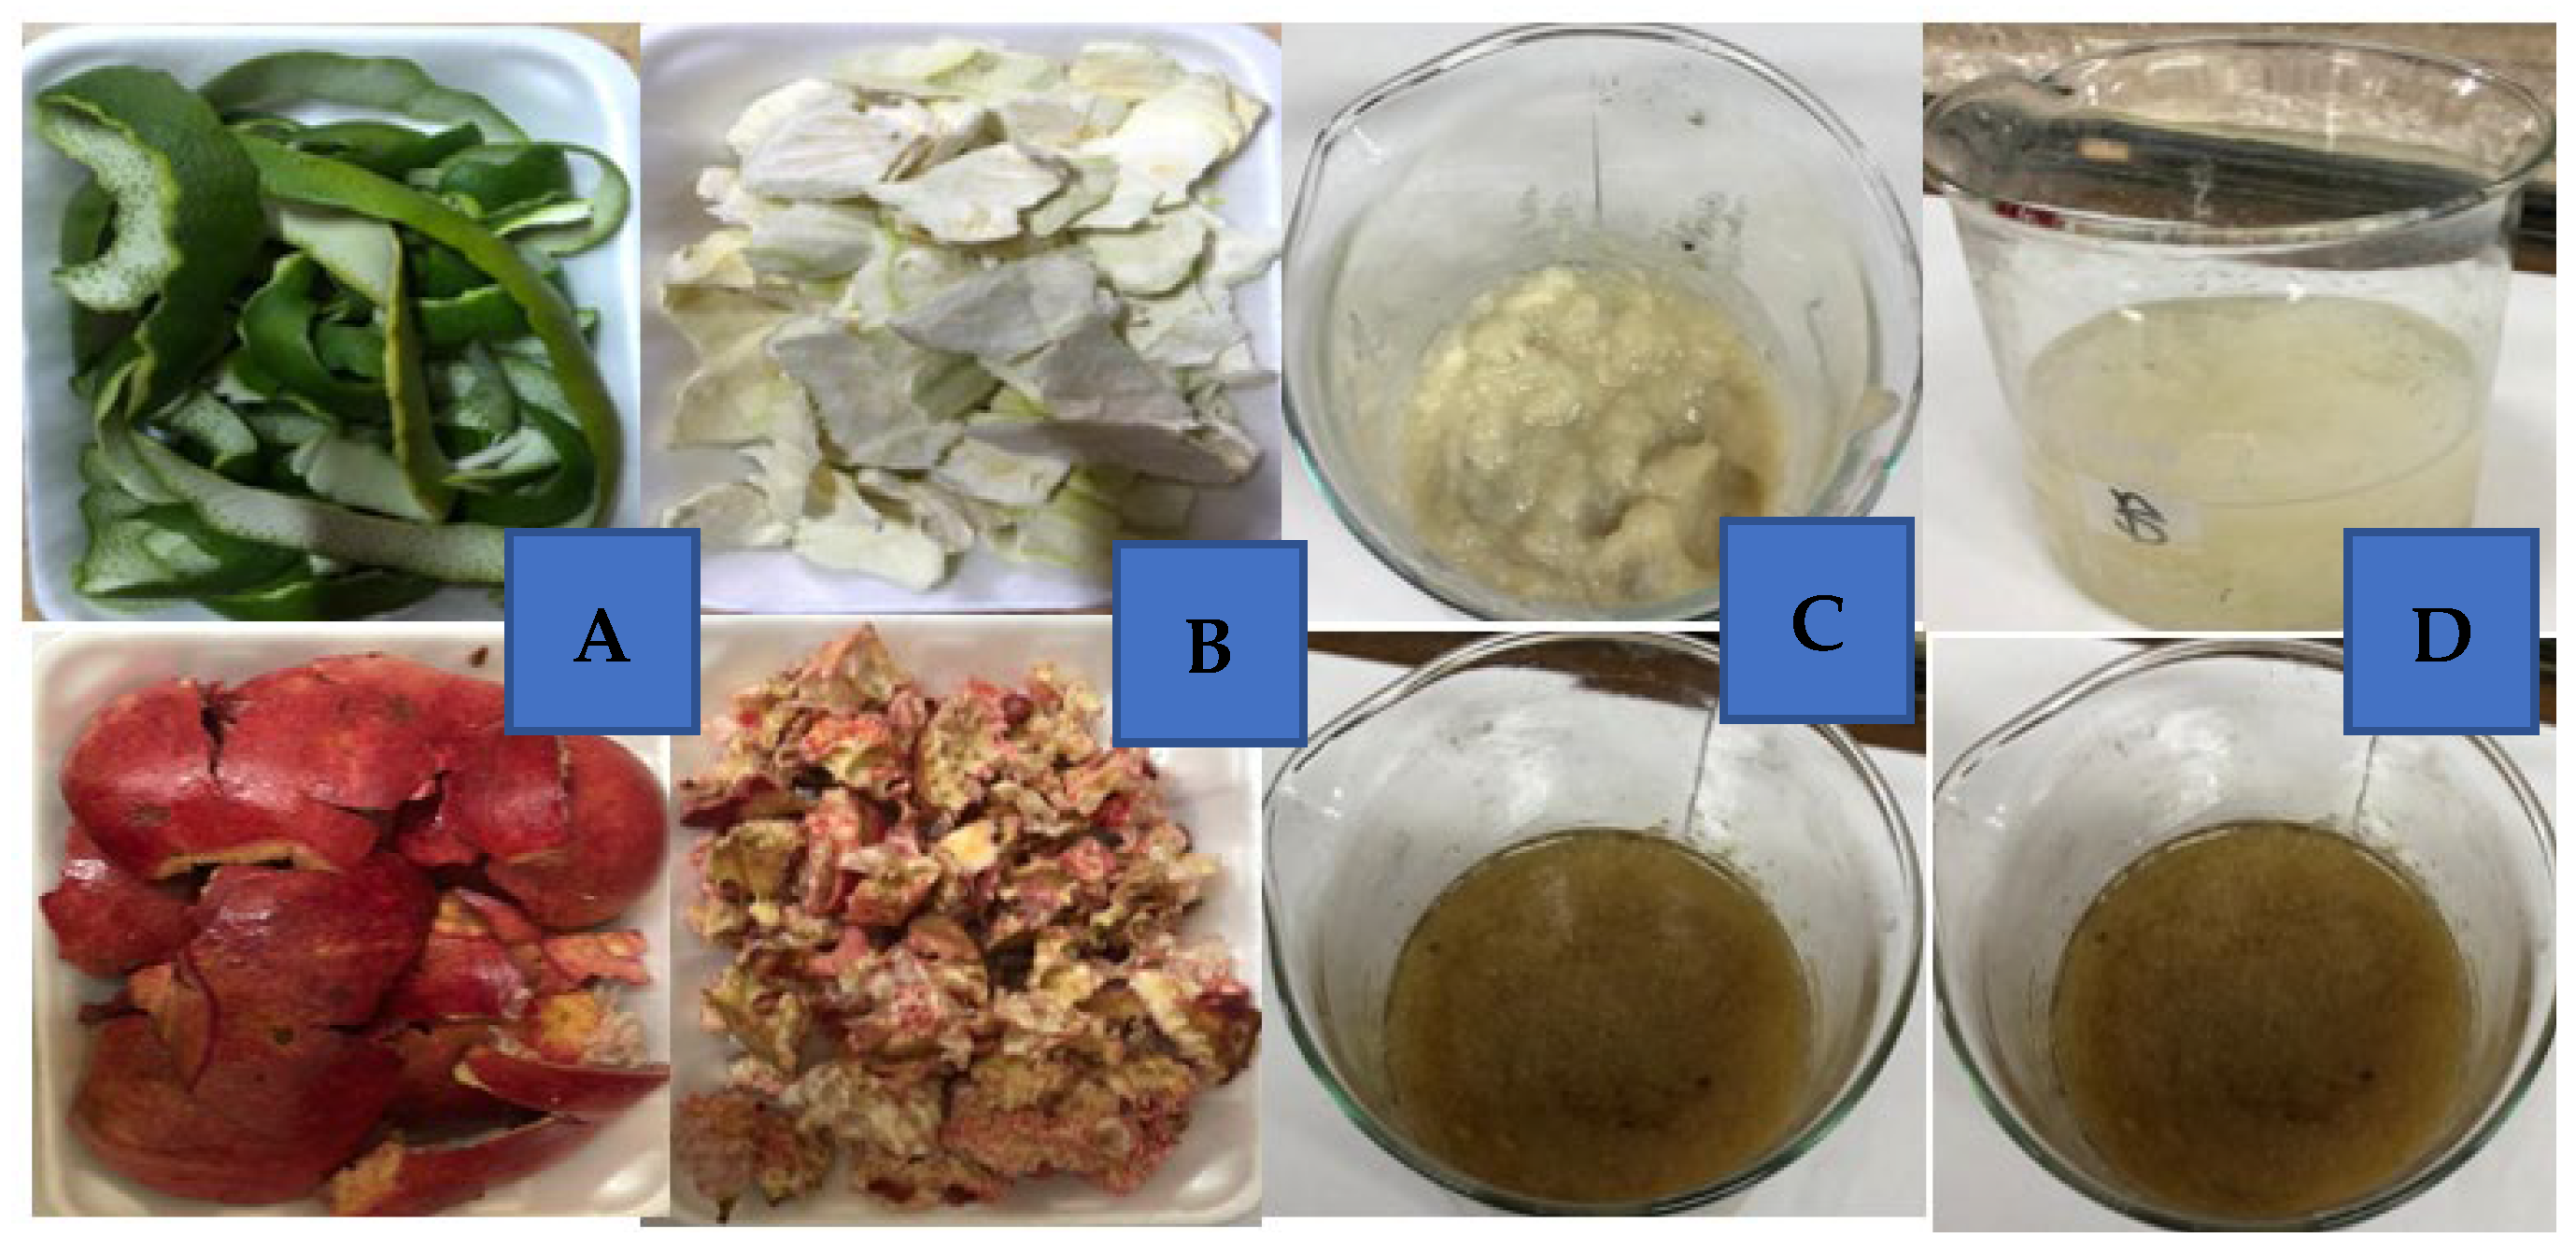
2.2.1. Extraction of Pectin from Fruit Peels
Pomegranate or orange peels were split/cut into four parts, and the peels were removed (a soft white substance inside the skin of citrus fruits). The peels were cut further into smaller pieces for easy drying and then washed with a large volume of water to remove glycosides and the bitter taste of the peels and to remove the residues of the pesticide spray. Afterward, they were air-dried for 24 h [
18,
19,
20].
The peel pieces (30 g) were weighed and put into a 1000 mL beaker containing 450 mL distilled water, and 2.6 mL hydrochloric acid was used to achieve a pH of 1.27. After that, the fruit peel was boiled for an hour. The residues were then removed from the extracts by filtering them through a fine mesh. The fine mesh was rinsed with 250 mL of boiling water, and the combined filtrate was allowed to cool to 25 °C to prevent the heat destruction of the pectin. The extracted pectin was precipitated by adding 200 mL of 95% isopropanol to 100 mL of extracted pectin and thoroughly swirling for 30 min to allow the pectin to rise to the surface. The gelatinous pectin flocculants were subsequently removed by filtering. The pectin extract was refined by washing it in 200 mL of isopropanol and pressing it on nylon fabric to remove the HCl and universal salt residues. The pectin that resulted was measured, crushed into little pieces, and air-dried.
Finally, the dried pectin was ground into tiny parts with a pestle and mortar and measured with a digital weighing balance [
20,
21]
Figure 1 and
Figure 2 illustrate a schematic diagram and photo for the preparation of pectin from fruit peel.
2.2.2. Modification of Pectin with Hexamine
Hexamine compound was used to modify the extracted pectin as follows: 5 g extracted pectin was dissolved in 100 mL distilled water under stirring until it formed a clear solution. Then, 30 g hexamine was added to the solution under constant stirring; the temperature was adjusted to 30 °C, and the mixture was kept under stirring for 48 h. The mixture was then dried overnight in a vacuum oven at 30 °C. The resulting modified pectin was used as resulted without further purification
2.2.3. Preparation of Thickening Agents
Different thickening agents (alginate, DELL P, extracted pectin, and modified pectin) were prepared in various concentrations (1, 2, 3, 4, 5%) to investigate their rheological behavior during this work. Alginate and DELL P thickeners were used for comparison with the prepared thickeners.
2.2.4. Preparation of Printing Paste
The printing paste was prepared using a different thickener, as described in the previous recipes. To prepare the printing paste, sodium carbonate, urea, glycerin, dispersing agent, citric acid, and dyes were added to the thickeners. Before applying the paste to the textiles, it was kept for 2–3 h after mixing (to allow the paste to relax after mixing and cooling to the internal temperature). The samples were then printed using a manual silkscreen with the printing produced.
The following recipe listed in
Table 1 shows the recipe used to prepare the printing paste for cotton fabric using C.I. Reactive blue 19 as a reactive dye, for wool fabric using a Telon Blue BRL as an acid dye, and for polyester and acrylic fabrics using Dianix Blue SE-2R as a dispersed dye
2.2.5. Application of Printing Paste to Textile Fabrics
Flat-screen printing was used during this research. The printed cotton fabric was dried at 100 °C for 3 min before being thermofixed at 140 °C for 5 min. The printed fabrics were then rinsed with cold water for about 15 min before being washed in warm water (50 °C) with a nonionic detergent for about 15 min and then dried at 85 °C for 5 min. The printed wool fabric was dried at 100 °C for 7 min before being thermofixed at 180 °C for 5 min. The printed fabrics were then rinsed with cold water for about 15 min before being washed in warm water (50 °C) with a nonionic detergent for about 15 min and then dried at 85 °C for 5 min. The printed polyester and acrylic fabrics were dried for 3 min at 100 °C and thermofixed for 3 min at 180 °C. The printed fabrics were then rinsed with cold water for about 15 min before being washed in warm water (50 °C) with a nonionic detergent for about 15 min, rinsed well, and dried at 85 °C for 5 min. The printed fabrics were subsequently immersed in a reducing bath with a 1:50 liquor ratio containing 2 g/L sodium hydrosulfite, 2 g/L sodium hydroxide, and 2 g/L wetting agent for 10 min at 60–70 °C. The textiles were then thoroughly washed with cold water, neutralized with 1 g/L acetic acid at 40 °C for 5 min, and dried at 85 °C for 5 min.
2.3. Analysis and Measurements
2.3.1. Characterization of Extracted Pectin
Fat Content
With 5 g dry peels powder and Soxhlet’s equipment, the fat content was calculated using the ether extraction technique according to AOAC method no. 945.44 [
22]. The extraction was then dried in a water bath before being baked in a vacuum oven at 100 °C for 1 h. The extract was then filtered to remove impurities from the fatty sample. The fat content of the sample was calculated as a percentage using the formula below.
Protein Content
Micro-equipment Kjeldahl’s was used to determine the protein content in line with AOAC method number 991.20 [
23]. A total of 0.2 g defatted peel powder was digested in a mixture of catalyst (1 g) and 5 mL each of H
2O
2 and concentrated H
2SO
4 Before collecting the ammonia distillate liberated in boric acid, the digested sample was brought to a boil. Hydrochloric acid was used to titrate the distillation until the blue hue was fully eliminated. The equation outlined below was used to determine the protein content.
where S = mL of HCl required for sample titration, B = mL of HCl required for blank titration, N = normality of HCl (0.02 N)
Ash Content
Carbonizing a 2 g material at 290 °C for 6 h in a muffle furnace according to AOAC method 923.03 yielded the ash content [
24]. The amount of ash in the sample was calculated using the formula below.
Carbohydrate Content
Carbohydrates were determined using the equation shown below:
The Percentage Yield of Pectin
The total extraction pectin yield (Y
pec) was calculated using the equation below:
where Y
pec (%) is the extracted pectin yield in percent, P is the amount of extracted pectin in grams, and P
o is the initial amount of pomegranate peel (30 g).
Solubility of Dry Pectin in Cold and Hot Water
By combining 0.25 g pectin with 10 mL 95 percent ethanol and 50 mL distilled water, the cold-water solubility of the pectin powder was evaluated. To determine solubility, the combination was forcefully agitated, and any quantity of insoluble material in the solution was weighed. The solution was then heated for 15 min at 85–95 °C to determine the existence of any insoluble material. [
25]
Solubility of Pectin in Cold and Hot Alkali (NaOH)
A total of 5 mL of pectin solution was mixed with 1 mL of 0.1 N NaOH and heated at 85–90 °C for 15 min. [
20,
21]
Sugar and Organic Acids
A total of 1 g of pectin was added in separate 500 mL flasks and moistened with 5 mL ethanol, 100 mL water poured fast, agitated, and left to stand for 10 min; 100 mL ethanol with 0.3 mL hydrochloric acid was added to this solution, quickly combined, and filtered; then 2.5 mL of the filtrate was measured into a conical flask (25 mL), the liquid evaporated on a steam bath, and the residual dried in an oven at 50 °C for 2 h.
Determination of Equivalent Weight of Dried Pectin
In a 250 mL conical flask, 0.5 g of dried pectin was placed, and 5 mL of 95% ethanol was added. One gram of sodium chloride and 100 mL of deionized water were added. Then, six drops of phenol red were added and titrated against 0.1 M sodium hydroxide. The pink hue denoted the titration point. The equivalent weight was calculated using the following equation: [
26]
where EW = equivalent weight of dried pectin (%), V
NaOH = volume of alkali (ml), M
NaOH = molarity of alkali, and W
s = weight of sample
Determination of Methoxyl Content of Dried Pectin (MeO%)
The neutralized solution was collected after calculating the equivalent weight, and 25 mL of sodium hydroxide was then added. The blended solution was well agitated and left at room temperature (25 °C) for 30 min. Then, 30 min later, 25 mL of 0.25 M hydrochloric acid was added and titrated against 0.1 M sodium hydroxide. The methoxyl content was calculated using the following equation: [
27]
MTC = methoxyl content of dried pectin (%).
VNaOH = volume of alkali (mL), MNaOH = molarity of alkali, and Ws = weight of the sample.
Measurement of the Ash Content of Dried Pectin
A total of 5 g of dried pectin was placed in a weighted empty crucible. The crucible was moved to a furnace heated at 60 °C to burn out any biological stuff. The carbon scorched and eventually burned away as carbon dioxide, leaving black ash behind. This procedure took 24 h. The crucible was removed from the furnace and cooled in a desiccator. After cooling, the crucible was reweighed. The ash content was calculated using the following equation: [
28]
AC = ash content of dried pectin (%), Wa = weight of ash (g), and Ws = weight of the sample (g).
Determination of the Degree of Esterification of Dried Pectin
At 40 °C, 20 g of dry pectin was moistened with ethanol and soluble in 20 mL of distilled water. After the pectin had completely dissolved, 5 drops of phenolphthalein were added to the solution. Following that, the solution was titrated with 0.5 M sodium hydroxide; in addition, the amount of the sodium hydroxide solution utilized for color change was noted as V
1. Following that, 10 mL of 0.5 M sodium hydroxide was added, and the solution was vigorously agitated and allowed to rest for 15 min. In addition, 10 mL of 0.5 M hydrochloric acid was added, and the solution was agitated till the pink tint was gone. During the last stage, the solution was titrated with 0.5 M sodium hydroxide, and the amount consumed was noted as V
2. The degree of esterification was calculated using the following equation: [
29,
30,
31]
DE = degree of esterification of dried pectin (%), V1 = initial titration volume (ml), and V2 = final titration volume (mL).
Determination of Total Anhydrouronic Acid Content of Dried Pectin
Estimating the anhydrouronic acid content (AUA) is critical for determining purity and the degree of esterification (DE), as well as for assessing pectin’s physical characteristics. Pectin, a partially esterified polygalacturonide, comprises at least 10% organic material in the form of galactose, arabinose, and other sugars. Using comparable weight, methoxyl content, and ash alkalinity values, anhydrouronic acid was calculated [
32].
where V
m = mL (titer) of NaOH from methoxyl content determination, V
e = mL (titer) of NaOH from equivalent weight determination, W
s = weight of the sample, and 176 is the molecular weight of anhydrouronic acid.
Determination of Acetyl Value (ACV) of Dried Pectin
With stirring, 0.5 g of dried pectin sample was dissolved in 0.1 M sodium hydroxide solution and left to stand overnight. Distilled water was used to dilute the contents to 50 mL, and an aliquot (20 mL) was placed in the distillation apparatus. A magnesium sulfate–sulfuric acid solution (20 mL) had also been added to the distillation device and distilled, yielding approximately 100 mL of distillate. Utilizing phenol red as an indicator, the distillate was titrated with 0.5 M sodium hydroxide. A blank distillation was performed utilizing 20 mL of the magnesium sulfate–sulfuric acid solution, and the distillate was titrated. The acetyl content was calculated using the following equation: [
27]
ACV = acetyl value of orange peel dried pectin (%)
Moisture Content Determination
An emptied dry petri dish was baked, chilled in a desiccator, and weighed. A total of 0.5 g of pectin samples was placed in the crucibles in an oven set at 130 °C for one hour, following which the Petri dish was removed, cooled in a desiccator, and weighed. This procedure was carried out once more. The moisture content was calculated using the following equation: [
20,
21]
2.3.2. Rheological Behavior and Power Law
The rheological activity and power low of the thickening agent were studied at 25 ± 0.1 °C with a coaxial rotary viscometer (HAAK V20), Germany [
33,
34]. A co-axial rotary viscometer (HAAK V20, Germany) was used to evaluate the thickening agent’s rheological behavior at 25 °C. The result of shear stress (τ; dyn/cm
2) versus shear rate (γ; s
−1) is known in Newton’s law as the apparent viscosity (η; cP), as shown in the equation: [
35]
The power-law equation of Ostwald de Waele is another name for the power-law model.
where γ represents shear rate, and K represents the consistency coefficient, which specifies the entire viscosity range throughout the region of the current flow curve and is the viscosity or stress at a certain shear rate point. The index of the power law is represented by the n number. The n value for a shear-thinning fluid was larger than 0 and less than 1 (0 n 1), indicating that the closer a sample is to zero, the more shear thinning. As a result, the viscosity may be defined as [
36,
37,
38]
When shown in logarithmic form, log shear stress vs. log shear rate graphs of the top curve for many fluids become linear. The data of shear thinning and shear thickening for fluids is described by the power-law model. As a result, the following equation can be constructed by taking the natural logarithms of both sides from the preceding equation:
When plotting log (η) versus log (γ), the result is linear. It is, nonetheless, helpful in evaluating and spotting trends in experimental data. This model is especially valuable since it can provide data with shear rates ranging from 10 to 104 s−1 [
36]. The disadvantage of this approach is that it does not account for shear-thinning fluids with a constant viscosity at low and high shear rates [
39,
40].
2.3.3. FTIR Measurement
The FTIR tester of the JASCO spectrometer connected with the diamond ATR unit was used to analyze the spectrum of the modified pectin. The measurement was done from 400 to 4000 cm−1 by the accomplishment of 128 reads.
2.3.4. Color Measurements
The Hunter Lab Ultra-Scan Pro was used to evaluate the color intensity of printed fabrics at Egypt’s National Research Center. The traditional form is represented by the characters K/S. The Kubelka–Munk equation was used to determine the K/S values [
41,
42,
43,
44,
45].
where K is the absorption coefficient; S is the dispersion coefficient; R
kmax is the fabric’s reflectance at its highest wavelength.
2.3.5. Colorfastness Properties
The colorfastness to washing was tested by using a Laudner-Ometer according to the AATCC test procedure 61–2013 [
46]. The colorfastness against friction (dry and wet) was tested utilizing a crock meter according to the AATCC test method 8–2016 [
47]. AATCC test method 15–2013 was used to measure colorfastness to perspiration (acidic and alkaline) [
48]. The colorfastness to light was determined according to the AATCC test method 16.1–2014 [
49]. The Gray Scale guideline for the color shift was used to evaluate the printed textiles.
2.3.6. Mechanical Properties of the Treated Fabric
Tensile properties must be measured at 25 °C and 65 percent relative moisture using an FMCW 500 tensile strength machine (Veb Thuringer Industrie Werk Rauenstein 11/2612 Germany) following the ASTM D1682-59T [
50]. The crease recovery angle (CRA) was measured using the AATCC 66–2014 [
51]. The fabric roughness was determined using the surface roughness instrument SE 1700 following ASTM D 7127–13 [
52]. The stiffness or rigidity of printed textiles was tested using only cantilever equipment following ASTM D 1388-14e1 [
53,
54].
2.3.7. Antibacterial Activity
Antibacterial activity was quantitatively tested against
Staphylococcus aureus (ATCC 29213) as a Gram-positive bacteria and
Escherichia coli (ATCC 25922) and
Candida Albicans (ATCC 10231) as a fungus using the AATCC 100-2004 (bacterial-reduction method) [
55], which is a popular methodological model for antimicrobial paste studies [
56].
This test cultivates uniform microbes with liquid culturing. The culture is diluted in a nutrient solution that has been sterilized. In sealed containers, the thickening agent is infected with microorganisms for 24 h at 37 °C. Shake for 1 min after incubation to measure bacteria levels. Eventually, the quantity of microbes compared to the starting concentration was, as follows, a percentage reduction of bacteria (R%) [
57]
Therefore, A is the number of bacteria collected from an inoculated lab test in a jar throughout the desired length of contact, and B is the number of bacteria recovered from an inoculated measurement specimen in the jar immediately after inoculation (at “0” contact time).
2.3.8. Handle and Sharpness
Touch and eye observation were used to evaluate the textile handling and sharpness of the printed region. The cloth was examined by three specialists, and the average of their ratings was recorded. The textile handling was rated as smooth (S) or harsh (H), and the sharp outline of the printed region was rated as sharp (Sh) or not sharp (Ns).
3. Results
3.1. Characterization of Fruit Peels
On a dry basis, moisture content of 9.32 and 9.11%, carbohydrate content of 79.49 and 80.29%, crude protein content of 5.54 and 5.23%, fat content of 2.11 and 2.13%, and ash content of 3.54 and 3.24% were found in dried orange and pomegranate peel powders, respectively.
Due to its gelling characteristic, which is suited for the manufacture of low-calorie and dietetic meals, there has lately been growing interest in the synthesis of pectin [
58].
3.2. Characterization of Extracted Pectin
The physical analysis results for extracted pectin from both orange and pomegranate peels are listed in
Table 2. The total extraction yield (Y
pec) in wet processing from both orange and pomegranate peels was 16.3 and 8.14%, respectively (see
Table 3), which is as reported by researchers [
32,
58,
59,
60,
61,
62]. Previous research has found that severe extraction conditions improve pectin extraction yield from banana peel, apple pomace, and lemon by-product [
63,
64].
The extraction of pectin from orange, passion fruit, dragon fruit, and citric waste peels at a correspondingly increased extraction temperature and at low pH results in increased pectin production. Low pH indicates increased acid concentration (acidic), and a higher acidity level boosts the extraction yields of different kinds of pectin and proto-pectin [
65].
This is due to the fractionation of glycosidic bonds in neutral polysaccharides that are much more sensitive to pH than the connection between two galacturonic acids, resulting in the breakdown of neutral sugar side chains.
Furthermore, a high concentration of hydrogen ions in the solvent triggers protopectin hydrolysis at low pH, causing the repression of the ionization of the hydrated carboxylate groups by turning them into hydrated carboxylic acid groups [
63,
66]. This loss of carboxylate groups reduces the repulsion of polysaccharide molecules, which increases pectin gelation, resulting in much more precipitated pectin at lower pH [
67].
In general, pectin is differentiated by the degree of methylation, which is a crucial factor in pectin function regulation. The degree of esterification for dried pectin (DE) from both orange and pomegranate peels was 63.8 and 63.2%, respectively (see
Table 3). The degree of esterification is a key molecular marker for pectin categorization because it reflects the extent to which carboxyl groups in pectin molecules exist as methyl ester. The pectin produced is classified as high methoxyl pectin (HMP), since it has a high proportion of esterification, more than 50%. Pectin with a significant level of esterification can form gel fast at high temperatures, resulting in a more effective influence on the lipid profile [
68]. The degree of esterification, on the other hand, merely shows the ratio of methanol-esterified carboxyl groups to free carboxyl groups, while the methoxyl rate relates to the number of methoxyl groups in a sample [
69].
Because the degree of methyl esterification (DM) for both orange and pomegranate peels were 6.07 and 5.32%, respectively (see
Table 3), predominantly high methoxyl pectin was recovered. Lower DM levels were obtained as a result of extraction as corroborating results reported for pectin extraction from banana peels and durian rinds [
63]. This is attributed to the de-esterification of the polygalacturonic acid chain being aided by harsher extraction conditions [
63,
70,
71]. Furthermore, stronger treatments may have extracted more firmly bonded pectin, potentially with a lower DM content [
72].
Kanmani et al. discovered that the methoxyl content of pectin ranges between 0.2 and 12% based on the source and technique of extraction. Because the value achieved was less than 7%, the dried pectin has a low ester characteristic, implying that it is good in terms of quality. Pectin with a low methoxyl concentration creates a thermo-irreversible gel, meaning it remains gelled even when heated to temperatures that would ordinarily dissolve it [
60,
73].
The equivalent weights for both orange and pomegranate peels were 614.7 and 523.21 g, respectively (see
Table 3). Pectin has a noticeable physical feature called equivalent weight, which is the most significant factor in defining pectin’s functional behavior. Individual pectin gelling capacities are extremely strongly related to comparable weight. A higher equivalent weight has a stronger gel-forming impact. A low equivalent weight indicates a higher partial breakdown of the pectin, which is undesirable [
74].
The total anhydrouronic acid level of dried pectins for both orange and pomegranate peels were 72.67 and 66.32%, respectively (see
Table 3). Pectin must include at least 65% galacturonic acid, according to the Food Chemical Codex (FCC), Food and Agriculture Organization (FAO), and European Union (EU) [
75]. The amount of anhydrouronic acid in pectin affects its gelling ability. The high value obtained indicates that the extracted pectin has little protein.
The dried pectin from both orange and pomegranate peels has an acetyl value of 0.39 and 0.35%, respectively (see
Table 3). The gelling ability of pectin also decreases as the degree of acetylation increases. The presence of an acetyl group in pectin reduces gel formation. Because of the low value attained, pectin is an effective gelling agent.
Table 3.
Quantitative analysis results for extracted pectin from both orange and pomegranate peels.
Table 3.
Quantitative analysis results for extracted pectin from both orange and pomegranate peels.
| Parameters | Orange Peel | Pomegranate Peel |
|---|
| Actual Result | Reference Result | Actual Result | Reference Result |
|---|
| Degree of esterification | 63.85 | 65.49 ± 0.57% [14] | 63.21 | 61.67% [58] |
| Equivalent weight | 614.73 | 599.74% [27] | 523.21 | |
| Methoxyl content | 6.07 | 6.23% [27] | 5.32 | |
| Total anhydrouronic acid | 72.67 | 70.9% [27] | 66.32 | 6.63 ± 0.40 [76] |
| Acetyl value | 0.39 | 0.4% [27] | 0.35 | |
| Ash content | 35.88 | 35% [32] | 51.2 | 4.97 ± 0.22 [76] |
| Moisture content | 92.28 | 95.25% [32] | 66.92 | 67.26 ± 0.23 [76] |
| The percentage yield of pectin on a wet basis | 16.32 | 15.92% [32] | 8.14 | 7.84% [58] |
| The percentage yield of pectin on a dry basis | 1.64 | 1.68 [32] | 1.21 | |
3.3. Rheological Properties of Extracted Pectin
A fluid’s “viscosity” is a measurement of its resistance to flow. Newtonian (or simple flow) and non-Newtonian complex flow are both possible in fluids. Newtonian flow is an ideal state in which viscous liquids obey Newton’s rule of viscous flow, which says that the flow rate is proportional to applied shearing stress. Most solvents, such as water, alcohol, benzene, real solutions, and extremely dilute colloidal solutions, are found in Newtonian fluids. Shear rate (S) and shear stress (F) in Newtonian fluids have a straight-line connection and are stated in terms of absolute viscosity (η):
Non-Newtonian fluids are fluids that do not obey Newton’s law of flow. Because shear rate and shear stress in these fluids do not have a linear relationship, they are typically described in terms of apparent viscosity (ηapp).
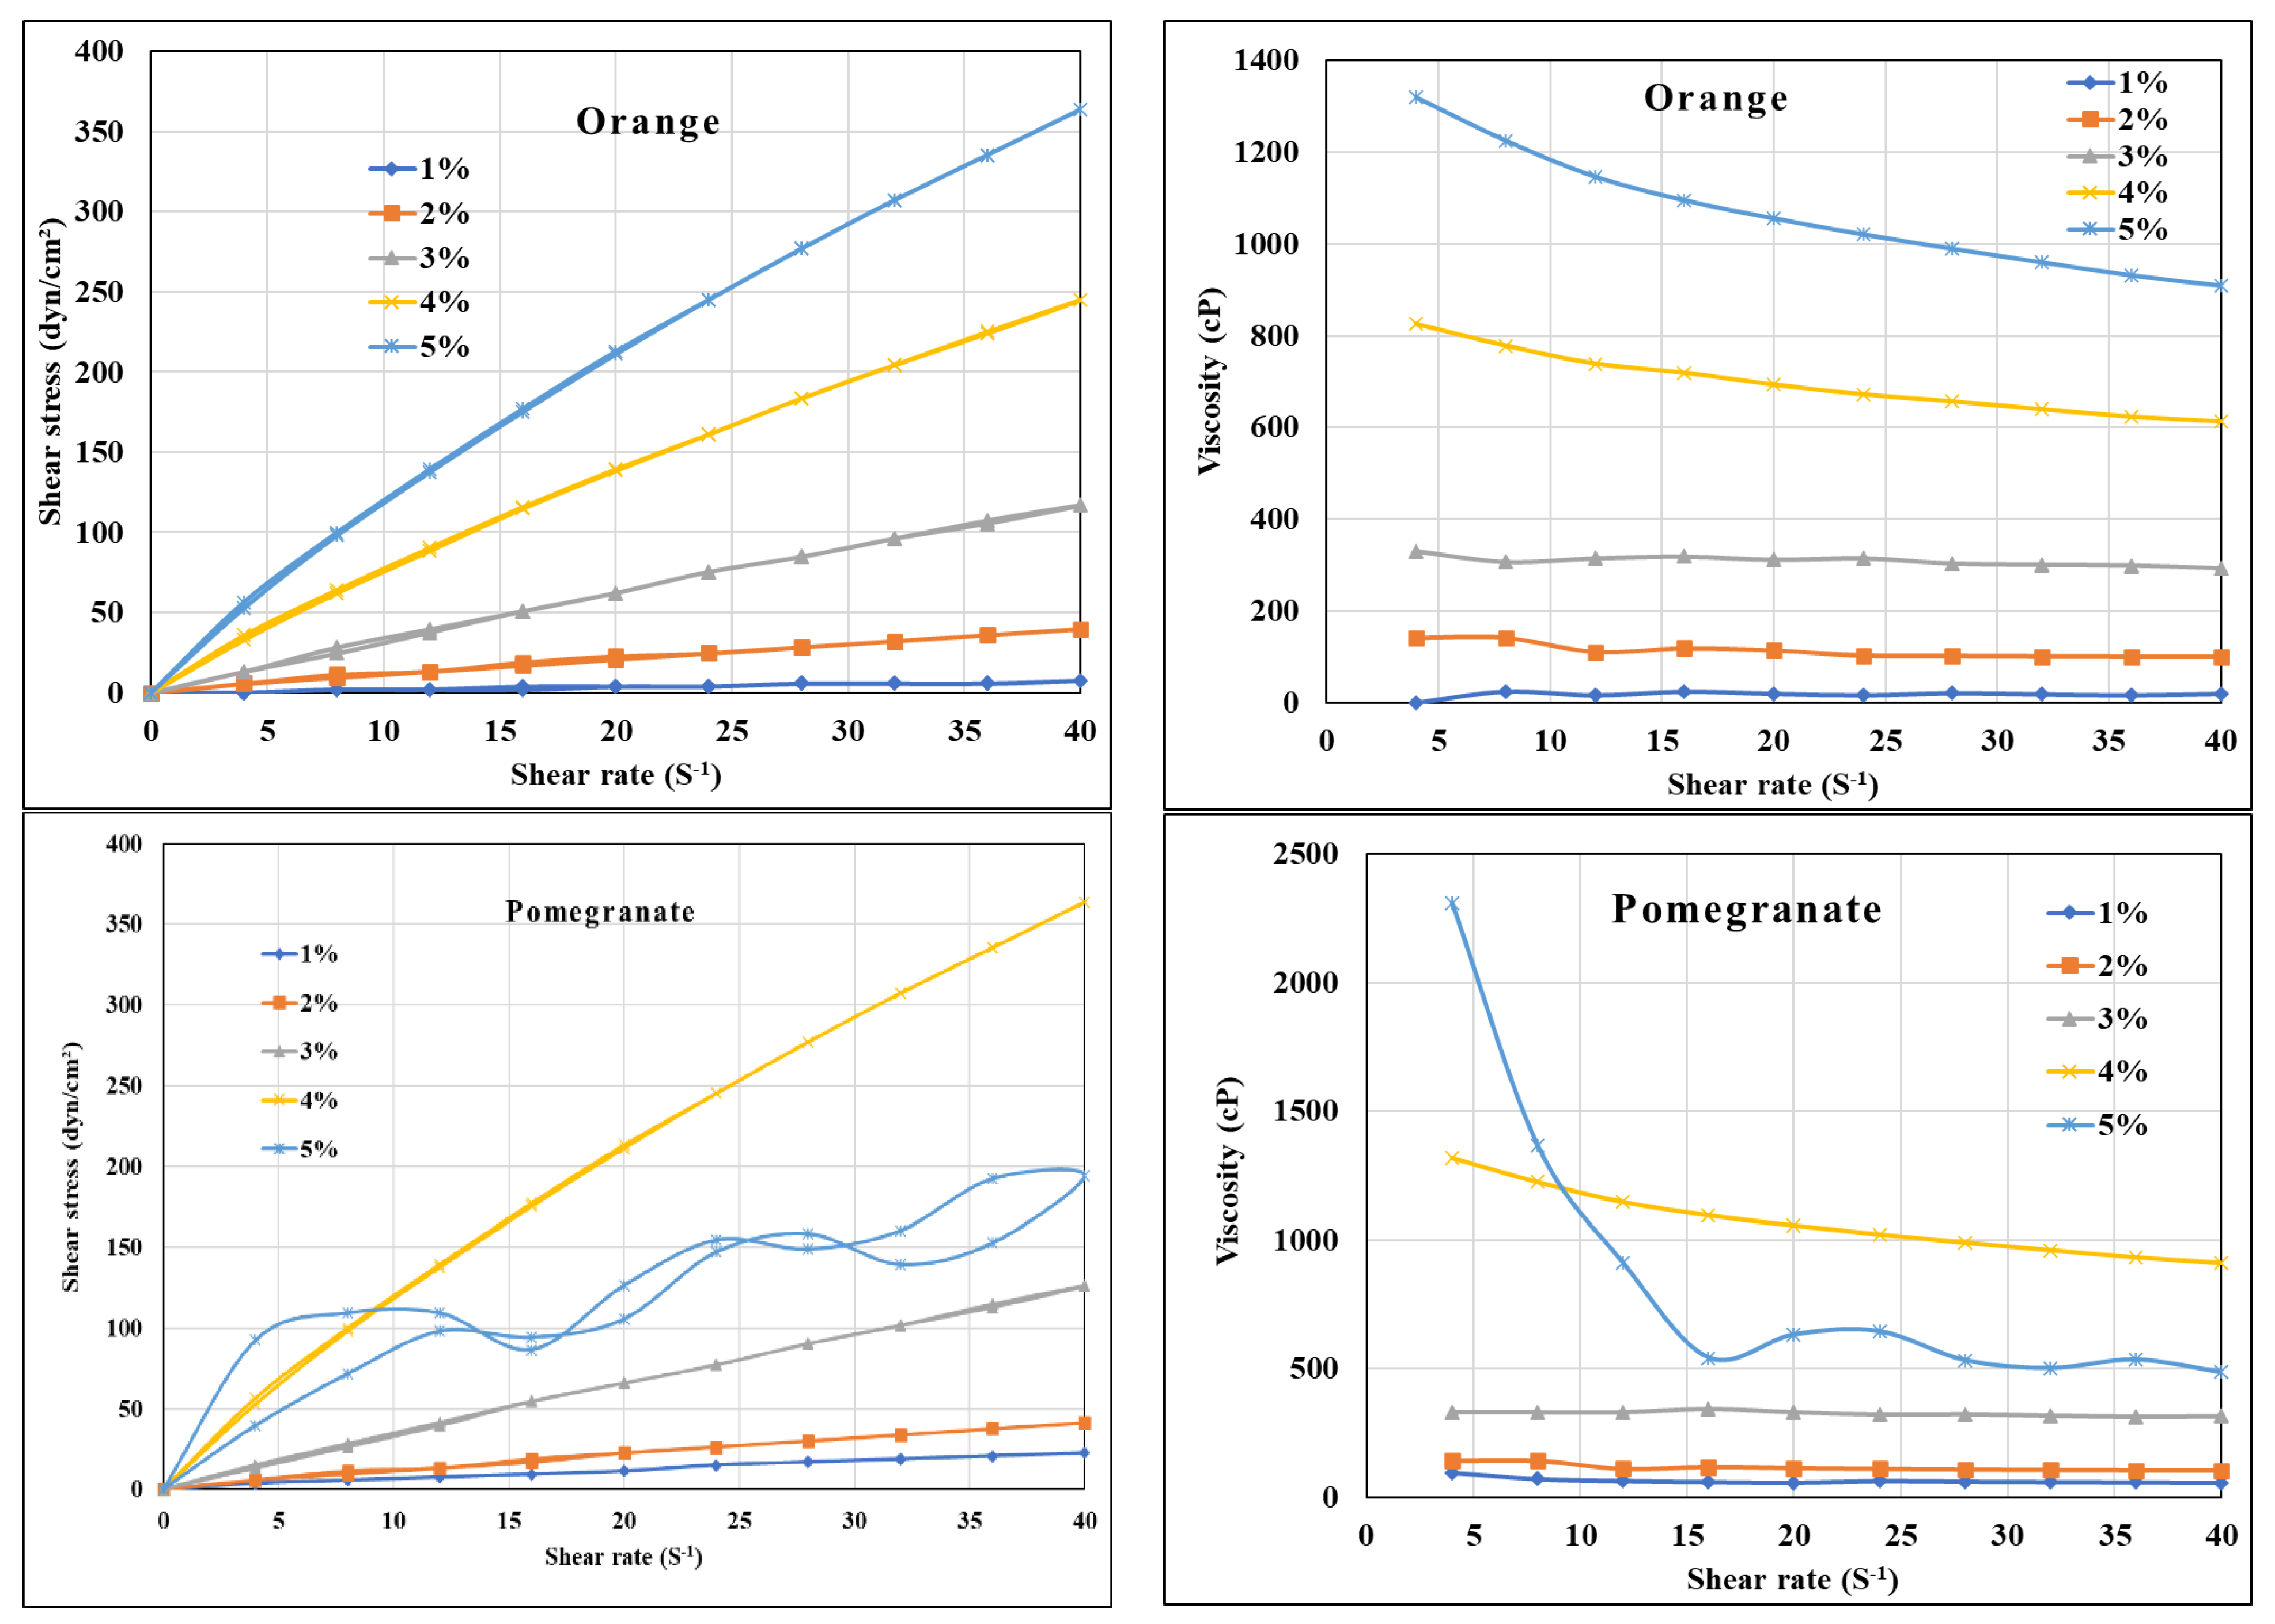
The rheological properties of five different concentrations of extraction pectin from orange and pomegranate peels (1, 2, 3, 4, and 5%) were investigated.
Figure 3 depicts the effect of shear rate on shear stress and viscosity of extracted pectin, demonstrating that the flow of prepared thickeners is characterized by the formation of a hysteresis loop that starts at 0 and goes up to 40 before reversing and ending at a zero-share rate. It is also possible to assume that the thickener, regardless of concentration, has a pseudo-plastically non-Newtonian shear-thinning flow, implying significant thixotropy. The time required to fix the thickener’s distorted internal structures is linked to its thixotropic activity. The degree of thixotropy is defined as the area between curves up and down [
77,
78].
As a result, the lower the thixotropy, the more elastic the thickening (i.e., the capacity for the internal structure to recover after releasing the shear). As a result, the thickening is thought to be more elastic due to the lower thixotropy (which is between the up and down curves).
Table 4 shows the area between curves for various extracted pectin concentrations from both orange and pomegranate peels, revealing that 4 percent of pectin has a lower area, while lower concentrations have a practically identical area from up and down the curve, indicating improved elasticity and thickening effectiveness. In addition, the concentration of pectin increasing by more than 4% led to irregular and unstable behavior in both shear stress and viscosity, which proves that 4% of pectin is the most favorable to use as a thickening agent.
3.4. Characterization of Modified Pectin
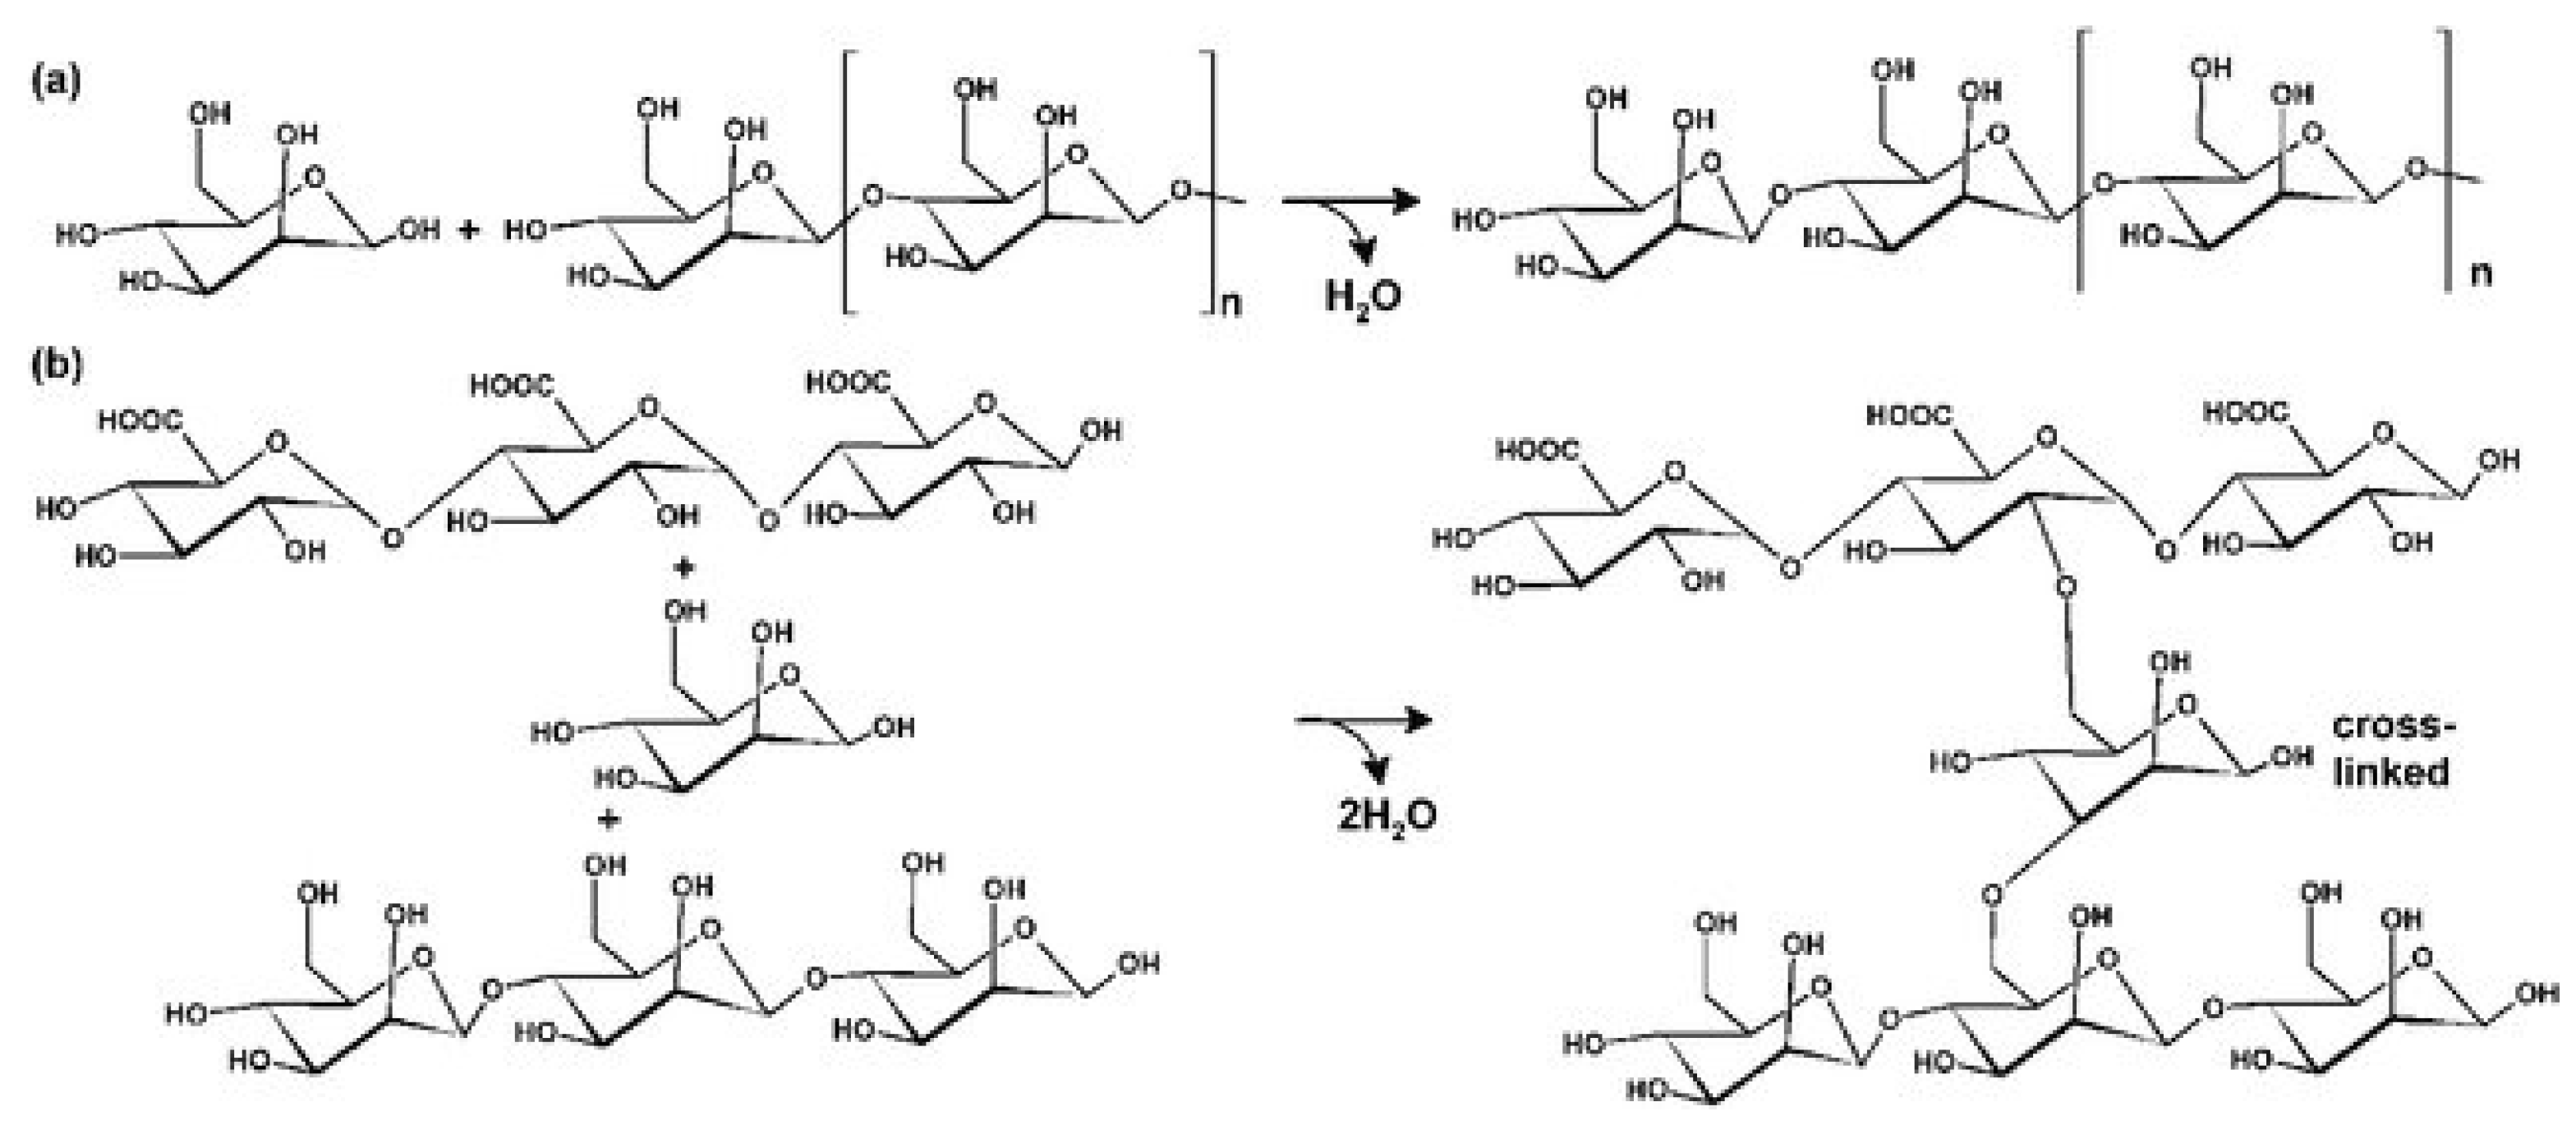
As pectin has acidic pH and increasing its pH led to destroying its viscosity, which makes it unsuitable for use as a thickening agent in the printing paste with high pH (especially for cotton fabric), a modification for pectin occurred to improve its rheological behavior, as well as to use it as a thickening agent in printing paste by improving its ability to work at high pH (9).
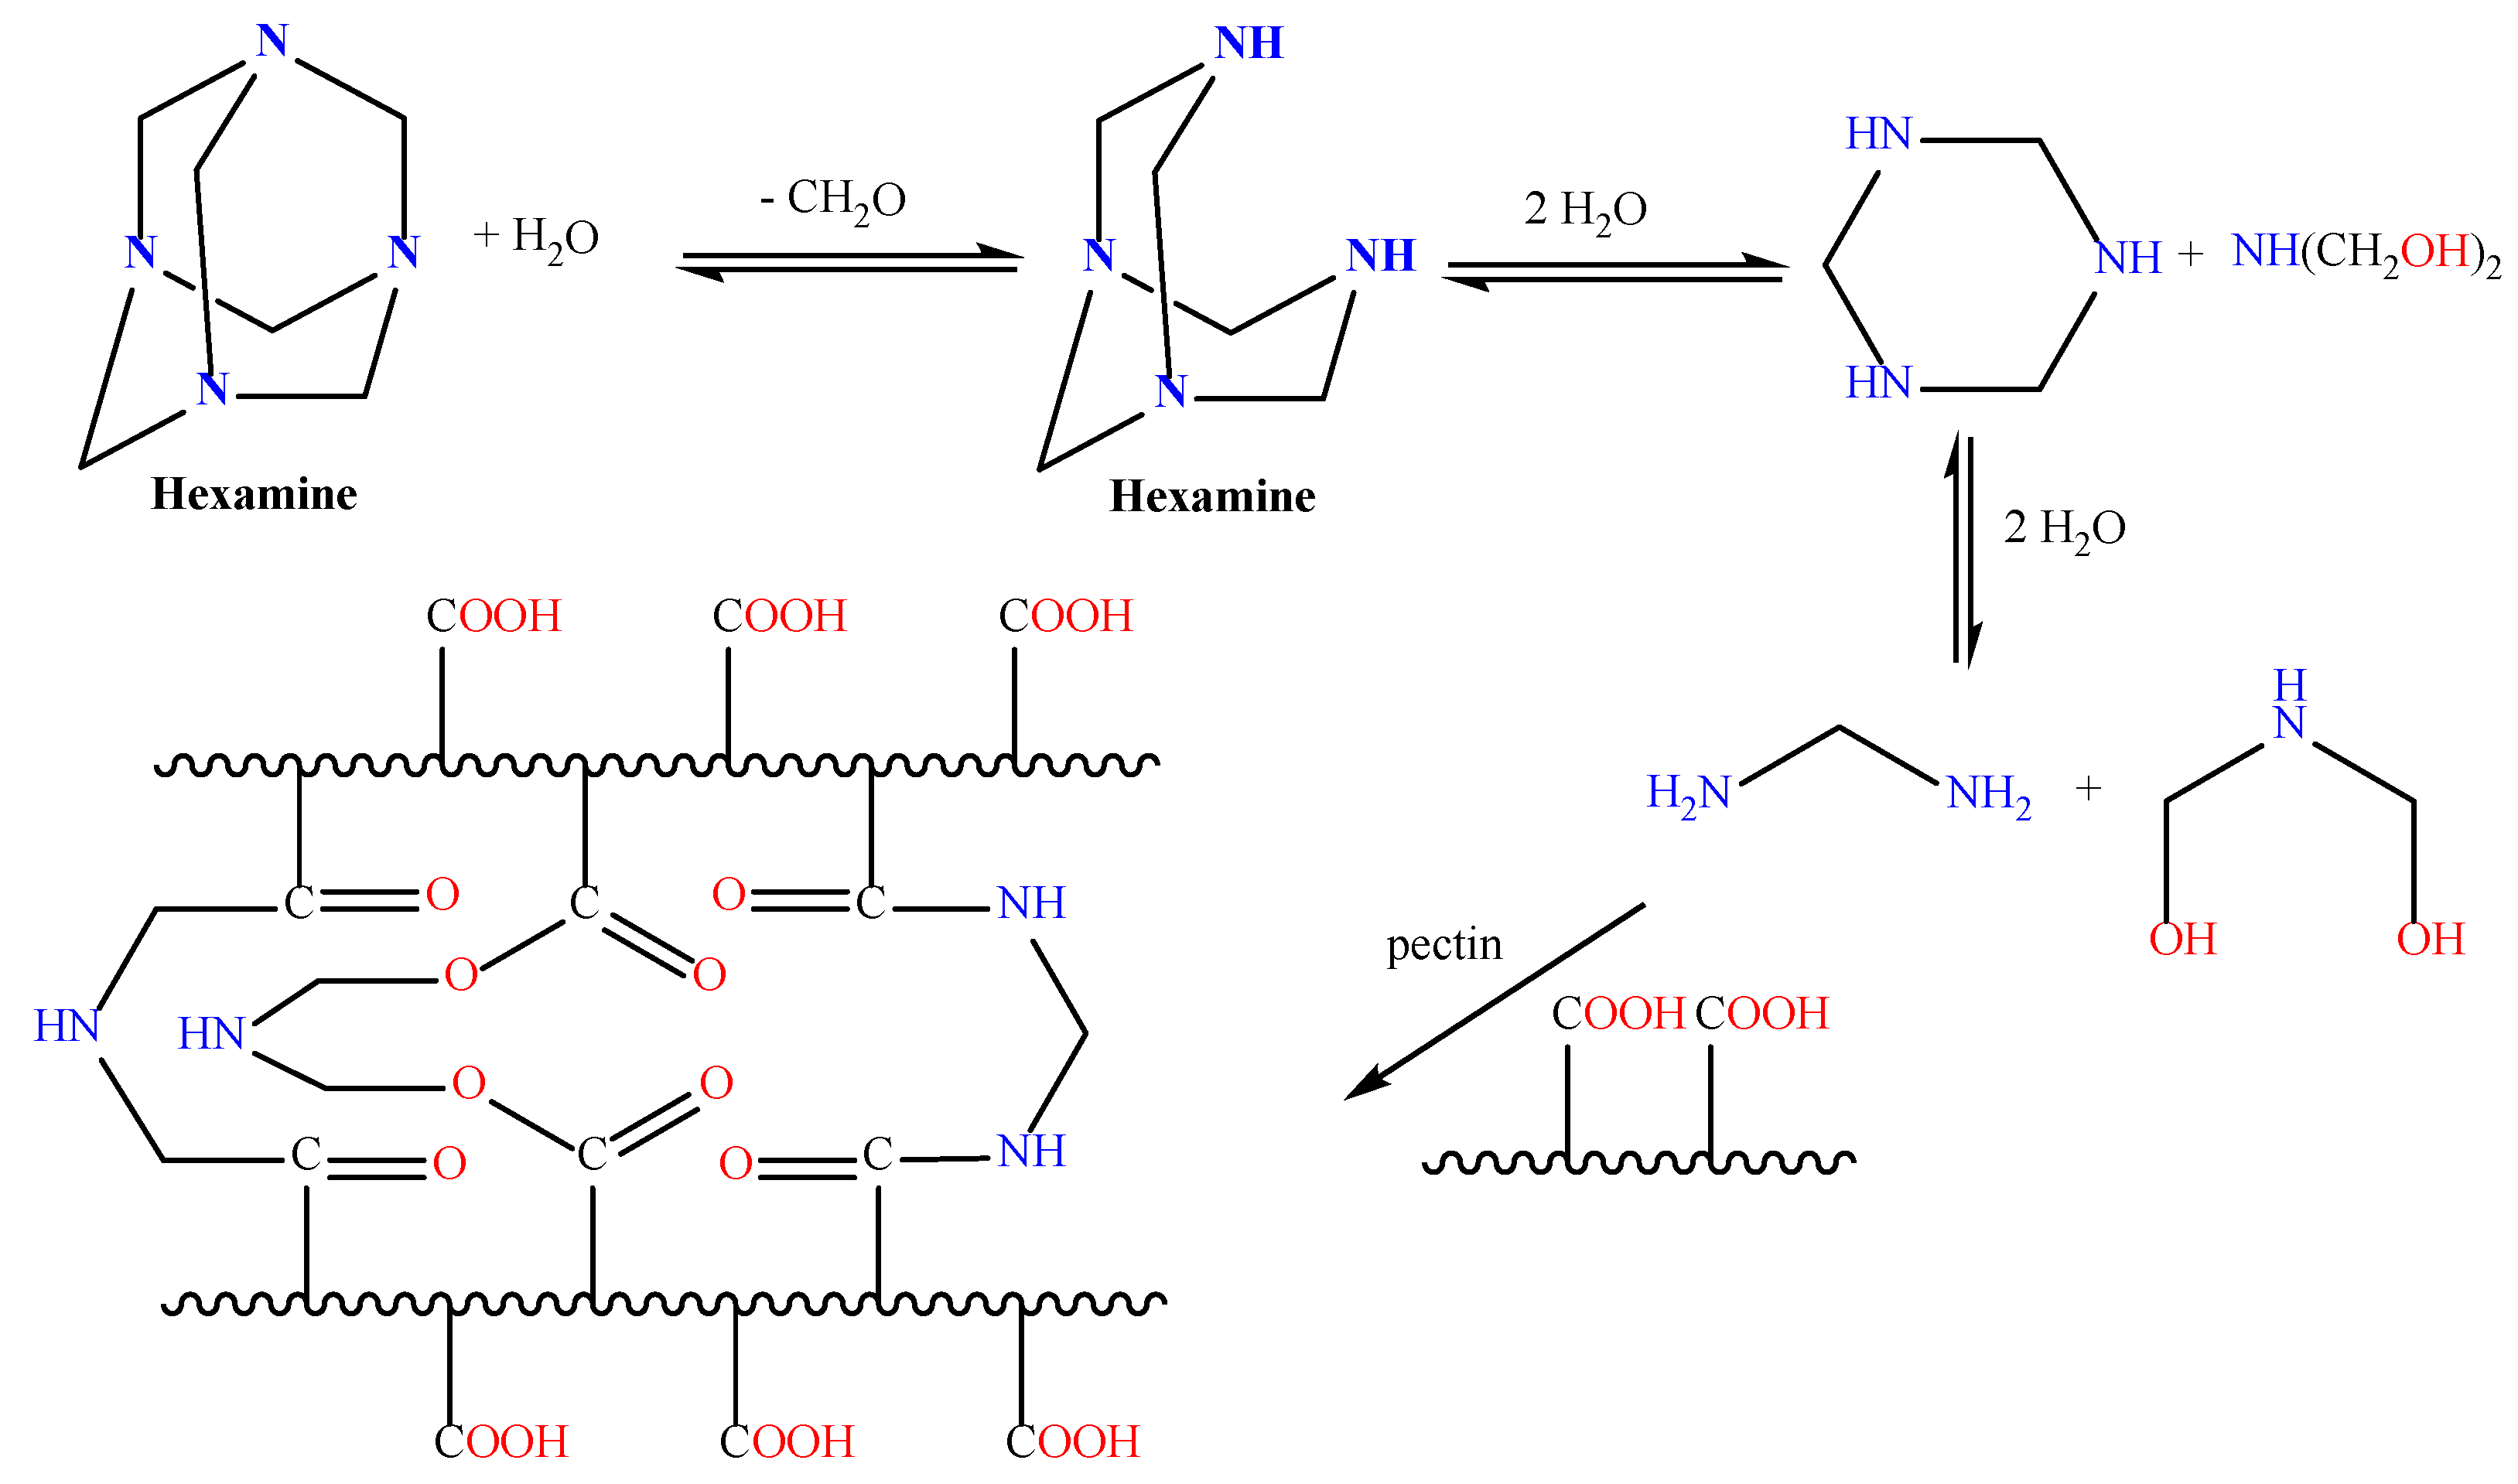
Hexamine, also called hexamethylenetetramine, is a heterocyclic organic compound. Extracted pectin from both orange and pomegranate peel was modified with hexamine to improve its ability to keep and to protect against high pH to be able to be used as a thickener in the printing paste of cotton fabric.
Figure 4 illustrates the suggested mechanism for the modification of pectin
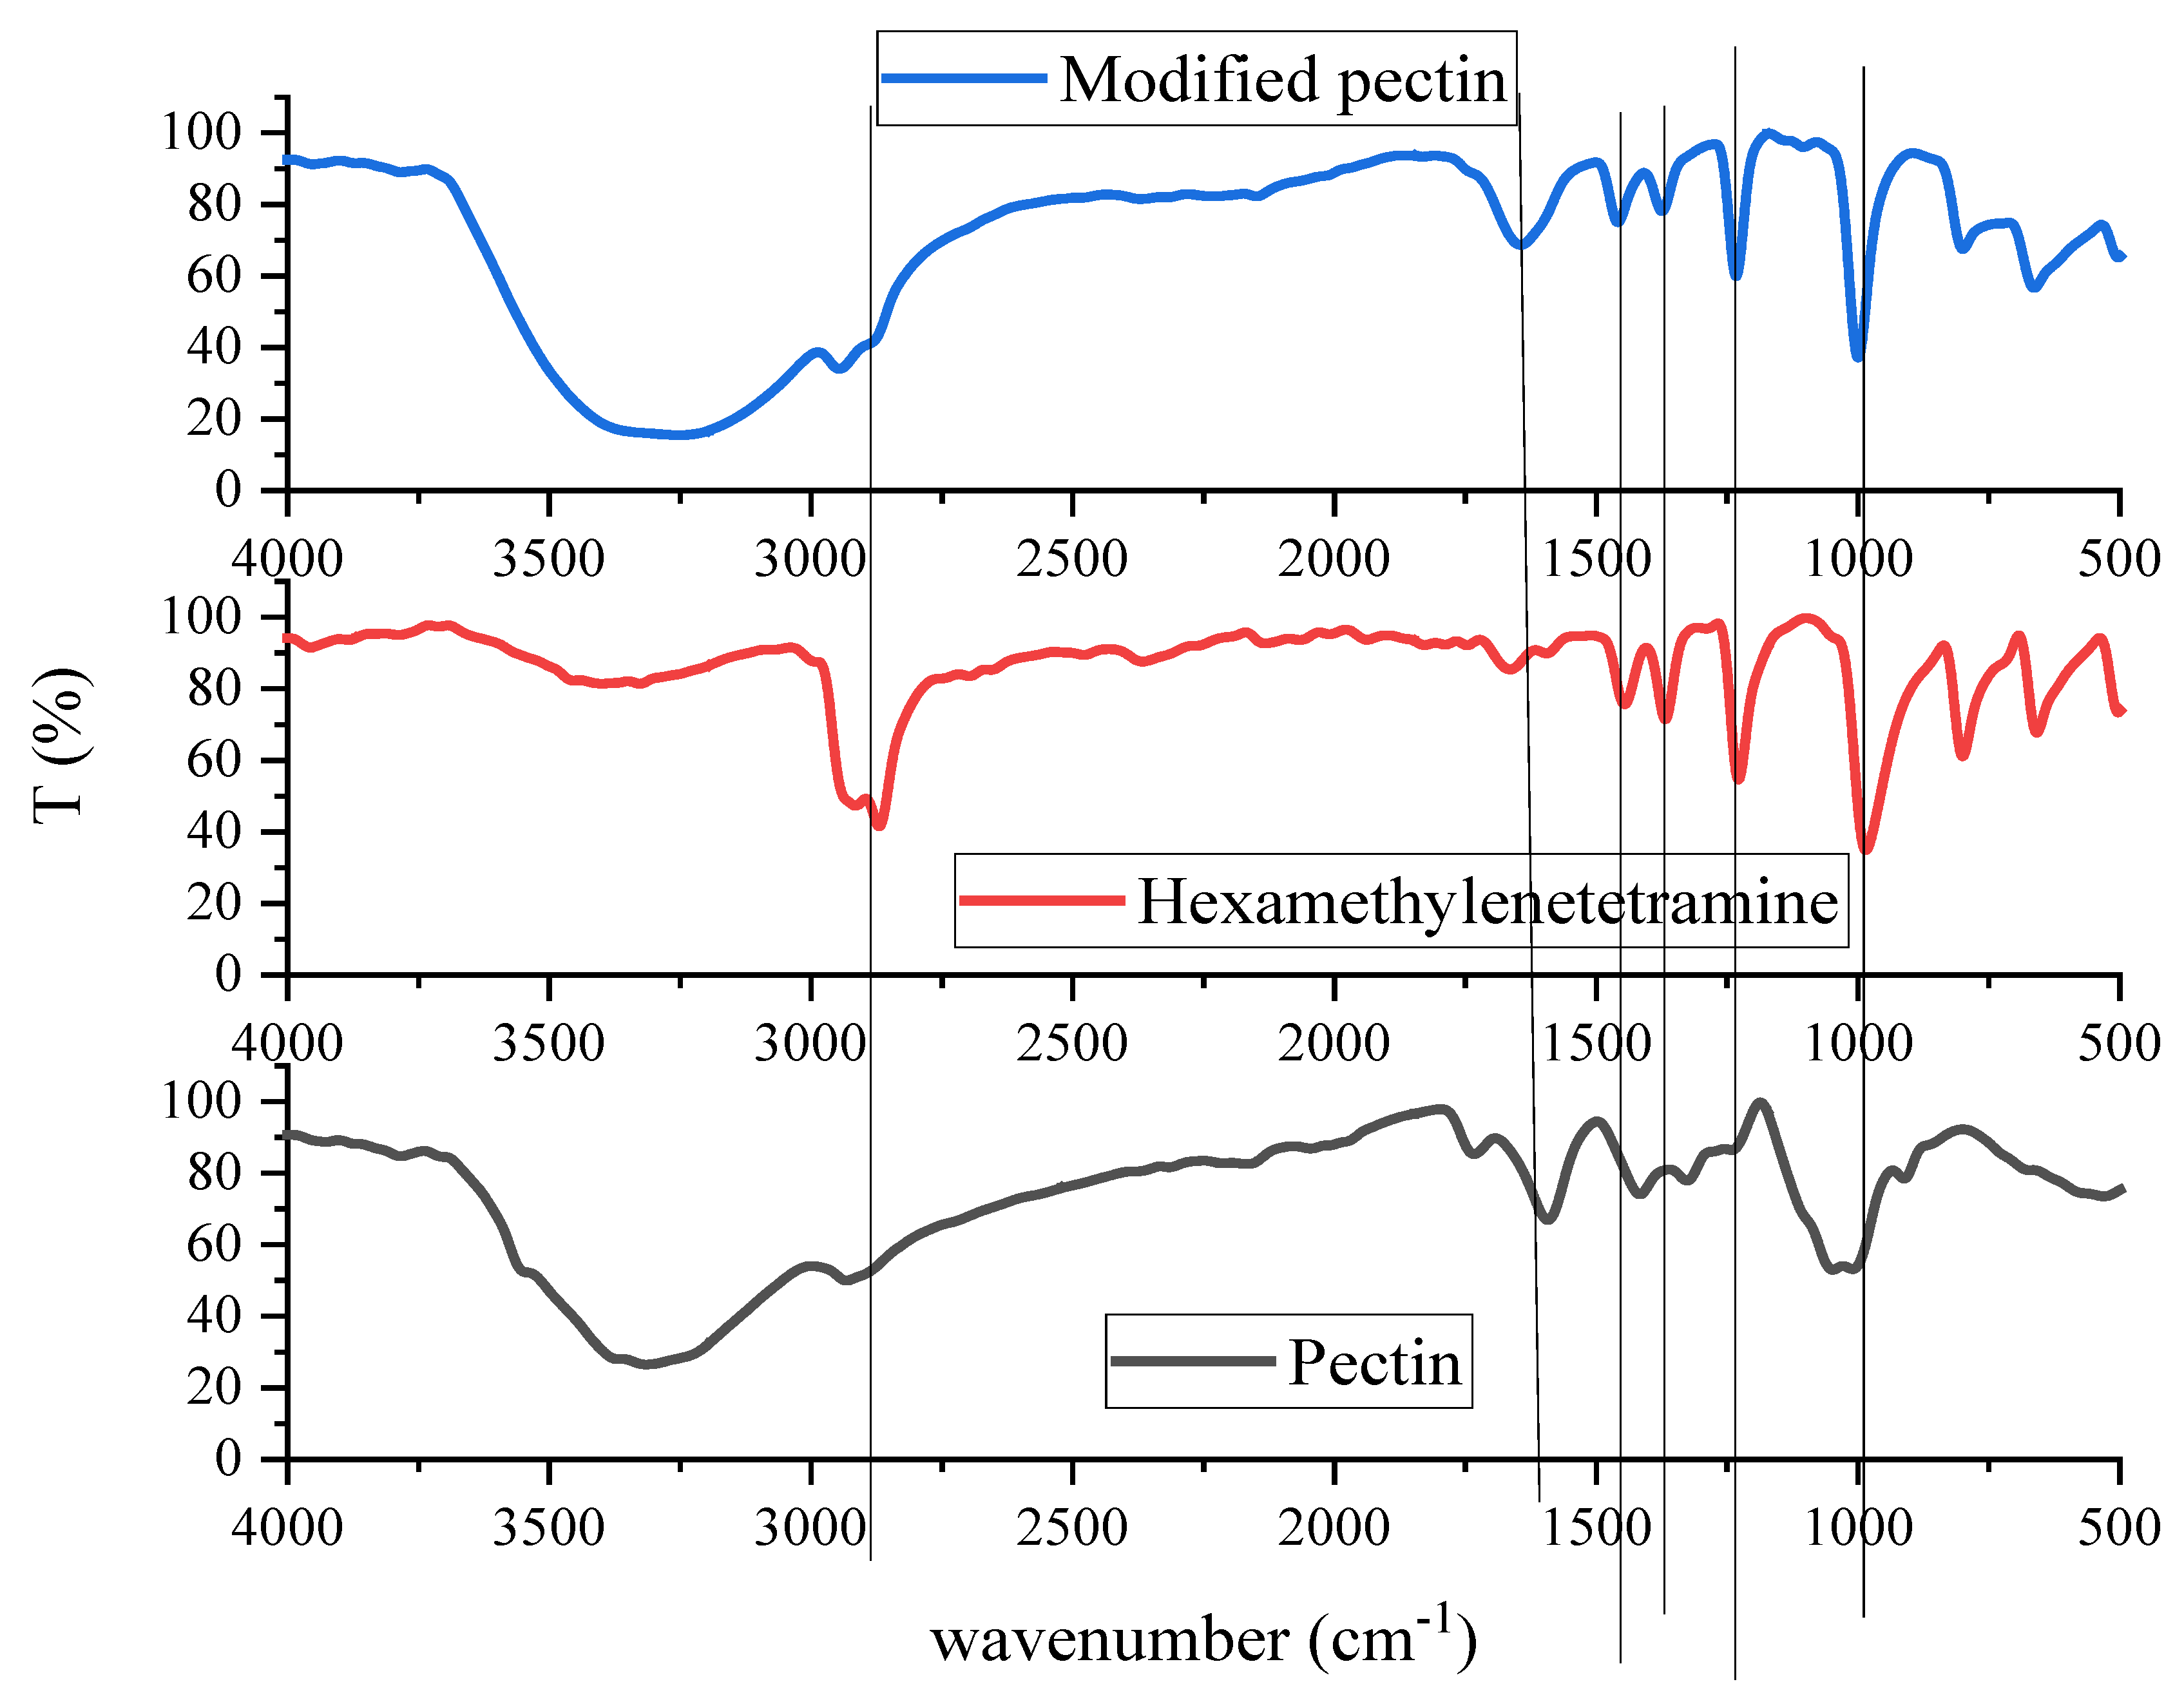
The infrared spectra for pectin, hexamine, and modified pectin are illustrated in
Figure 5 and the presence of the common peaks for both original raw materials (pectin and hexamine) is displayed.
The major peaks of extracted pectin are the hydroxyl group that appeared at 3410 cm
−1 for pectin. The aliphatic C–H groups esterified carboxyl groups, and free carboxyl groups were shown in 2928, 1748, and 1640 cm
−1 for pectin [
79]. The peak at 1443 cm
−1 describes the presence of a CH methyl group for extracted pectin and standard pectin. In addition, peaks at 1160 and 1154 cm
−1 indicate the presence of C–O bonds in alcohols, esters, and carboxylic acids [
80].
The IR spectrum of the hexamine compound showed absorption bands at 650, 795, 990, 1225, 1370, 1445, 1674, 2866, and 2912 cm
−1 which were similar to those reported according to the literature [
81]. Of these, the bands at 1225 and 990 cm
−1 were assigned to the C–N stretching modes. In this regard, the modified pectin has the same bands likely attributed to the C–N stretching, which confirmed the modification process.
In addition, modified pectin has two vibration bands located at 2912 and 1225 cm
−1 assigned, respectively, to the (CH) and (CN) vibration, and two bands located at 1445 and 1370 cm
−1, characteristics of the δ
as(CH
2) and δ
s(CH
2) deformation of the hexamethylene–tetramine ligand [
82].
3.5. Characterization of Printed Fabrics
Because the goal of this study was to evaluate and find the best possible printed material to achieve darker prints with better overall fastness properties using new eco-friendly biological thickener extracted from fruit peels, extracted pectin and pectin modified with hexamine ere used in the printing of different fabrics (namely, cotton, wool, acrylic, and polyester) with appropriate dyes for each textile material.
3.5.1. Color Strength and Fastness Properties
Color strength (K/S) and various fastness properties, such as light, washing, perspiration, and rubbing fastness, were evaluated for all printed textiles (cotton, wool, acrylic, and polyester fabrics) with appropriate dye for each fabric using alginate, DELL P, pectin, and modified pectin as thickeners, and the results are listed in
Table 9.
The lightfastness of printed textiles containing each of the pectin’s gels as thickeners were excellent (6), better than using alginate as a thickener (4). The washing fastness for all printed fabrics was good (4–5). The perspiration fastness property showed 3–4 to 4–5 color differences in both acidic and alkaline perspiration. The colorfastness to rubbing was tested in both dry and wet procession, and it was discovered that dry rubbing had a similar impact as wet rubbing.
Furthermore, for printed cotton and wool fabrics with reactive dye, both pectin thickeners have great color strength and fastness properties, as well as a sharp outline and soft handling in comparison to the printed cotton fabric using alginate as thickeners. Furthermore, modified pectin imparts higher color strength and fastness properties than pectin only. In addition, compared to printed fabrics using all examined thickeners, the printed fabric using alginate as a thickening agent delivered a fair color value.
Furthermore, all thickeners based on aloe vera gel have great color strength and fastness properties with sharp edges and gentle handling for printed polyester or acrylic fabrics with dispersed dye. In addition, compared to printed fabrics using alginate as a thickener, the printed polyester or acrylic fabrics using DELL P as a thickening agent delivered excellent color value.
Pectin and its modified thickeners may be utilized for printing cotton, wool, acrylic, and polyester textiles under varied pH values, depending on the printing condition of each printed fabric, based on their overall performance. These results correspond to the thickener performance. In addition, modified pectin shows better results compared with pectin only.
3.5.2. Mechanical and Physical Properties
The mechanical and physical characteristics of printed textiles, such as tensile strength, elongation at a break, bending length, crease recovery angle, and surface roughness, have been examined, and the findings are displayed in
Table 10.
The use of pectin-based thickeners increased the tensile strength and elongation at a break of the printing materials, as seen by the data
Table 10. Rather than using pectin only as a thickener in the printing paste, the modified pectin helps to create and alter the thin film in the microstructure of the fabric, which fills gaps on the surface of the printed fabrics and improves both tensile strength and elongation at a break [
85].
The bending length presence of printed textiles with pectin-based thickener showed superior values compared to the printed fabrics with alginate as a thickener, according to the data
Table 10. Furthermore, the use of modified pectin as a thickener in the printing of all the textiles tested, with all the essential colors, had a better bending length value than the use of alginate. This behavior might be attributed to the presence of amine groups in the coating layer that forms as a result of the printing paste. The use of a novel thickener in the printing of various textiles has helped in the stiffness of the printed fabrics, according to these studies.
Further investigation into the angle of the crease recovery of printed textiles in both the warp and weft directions revealed that all printed materials have comparable angles of crease recovery. These findings show that the new thickeners did not affect the angle of the crease recovery of printed textiles in a variety of printing paste formulas and pH levels.
3.5.3. Antimicrobial Activity of Printed Fabrics
Using three types of microbes, Gram-positive bacteria (Staphylococcus aureus), Gram-negative bacteria (Escherichia coli), and fungus (Candida albicans), the antimicrobial activities of printed fabrics using different thickening agents (alginate, DELL P, pectin, and modified pectin) and suitable dyes have been quantitatively demonstrated.
Table 11 shows the antibacterial properties of printed materials. Printed textiles that use pectin or modified thickeners have better antibacterial activity than printed fabrics that use alginate. Due to differences in the composition of the cell walls of both the examined bacterium strains, printed textiles are more effective against Gram-positive bacteria than against Gram-negative bacteria because they decrease ergosterol, a critical component of the fungal cell membrane [
86,
87,
88].
The antibacterial behavior of all printed textiles using modified pectin as a thickener was found to be superior to that of printed fabrics using alginate, DELL, or pectin only as a thickener.
After washing, the percentage of antibacterial reduction dropped. The percentage reduction decreased depending on the thickeners. Even after 10 washing cycles, the printed materials had good antibacterial capability against the tested microorganisms due to their longevity.
4. Conclusions
Pectin is a naturally occurring biopolymer that may be employed as a thickening agent in textiles because of its chemistry and ability to produce gels. Pectin may be extracted in an easy and safe method for the environment.
Pectin from orange and pomegranate peels was extracted by cutting, removing the white portion connected to the outer peel of plants, drying them, then pouring 30 g/L and 2.6 mL/L of HCL to set the pH at 2, boiling for an hour, filtering, precipitating with alcohol, filtering, and drying.
The contents of fats, protein, ash, carbohydrates, and sugars; the equivalent weight of dried pectin and methoxyl groups; acetyl value; moisture; organic acids; ability to dissolve in cold/hot water; ability to dissolve in cold/hot alkali; and the degree of esterification were measured. The effect of shear rate on shear stress to evaluate the viscosity was also measured.
The pectin was modified with hexamine and characterized by the IR spectrum. The IR spectrum of the hexamine compound showed absorption bands at 650, 795, 990, 1225, 1370, 1445, 1674, 2866, and 2912 cm−1, which are similar to those reported according to the literature. The rheological properties of pectin extracted from orange peel and modified have the properties of pseudo-plastic pastes, while the pectin extracted from pomegranate peel has the properties of a non-Newtonian thixotropic paste. Thickeners bear a pH of up to 6 in the acidic direction and decompose at pH 7.5 in the alkaline direction. The pectin was modified by adding hexamine to change the pH degrees in the basic direction; the rheological properties of thickeners did not change during a storage period of up to 15 days.
Pectin and its modification were used for printing, and they were compared to other thickeners such as alginates for natural textiles and Dell P as manufactured thickeners for industrial fabrics with various dyes. After the printing process, they were dried and then fixed. The printed fabrics were characterized using color strength (K/S), fastness properties (washing, dry and wet rubbing, acid and alkaline perspiration, light), mechanical properties (surface roughness, tensile strength, elongation at the break, crease recovery angle), and anti-bacterial protection (Gram-positive, Gram-negative, fungi).
The results showed an increase in the color intensity for all materials printed with pectin and modified compared to the standard sample printed with sodium alginate and Dell p and increasing in K/S for printed cotton fabrics (3%), (13%) for wool (109%), (123%) for polyester (49%), (64%), (12%), (22%) and for polyacrylic (25%), (57%), (2%), (29%) sequentially. The improvement in fastness properties (washing, dry and wet rubbing, acidic and alkaline perspiration, light) was from satisfactory to good to excellent. There was also improvement in fabric roughness, tensile strength, elongation at the break, and crease recovery. Printed fabrics with pectin and modified pectin gave high resistance to Gram-negative and Gram-positive bacteria, as well as fungi.
Through the printing process, natural thickeners (extracted pectin from fruit peels) and modified pectin were added to various textiles (cotton, wool, acrylic, and polyester). All the printed samples with pectin and its modified synthetic dyes (reactive, acid, and disperse) exhibited good fastness towards washing and wet and dry rubbing. The light fastness of printed textiles was excellent (7), better than when using alginate as a thickener (5). All printed textiles had good washing fastness (4–5). In both acidic and alkaline perspiration, the perspiration fastness characteristic revealed 3–4 to 4–5 color differences. Colorfastness to rubbing was tested in both dry and wet conditions, and it was revealed that dry rubbing had the same effect as wet rubbing. Printed textiles using pectin or modified pectin as thickeners exhibit antibacterial activity.


