Article

Numerical and Experimental Investigation on Bending Behavior for High-Performance Fiber Yarns Considering Probability Distribution of Fiber Strength

1
Ministry of Education Key Laboratory of Advanced Textile Composite Materials, Institute of Composite Materials, Tiangong University, Tianjin 300387, China
2
School of Textile Science and Engineering, Tiangong University, Tianjin 300387, China
3
ENSISA, LPMT, University of Haute-Alsace, F-68000 Mulhouse, France
4
Jiangsu Hengli Chemical Fibre Co., Ltd., Suzhou 215228, China
*
Author to whom correspondence should be addressed.
Textiles 2023, 3(1), 129-141; https://doi.org/10.3390/textiles3010010
Submission received: 13 January 2023 / Revised: 14 February 2023 / Accepted: 16 February 2023 / Published: 18 February 2023
(This article belongs to the Special Issue New Research Trends for Textiles, a Bright Future)

Abstract

:
The performance of fiber-reinforced composite materials is significantly influenced by the mechanical properties of the yarns. Predictive simulations of the mechanical response of yarns are, thus, necessary for fiber-reinforced composite materials. This paper developed a novel experiment equipment and approach to characterize the bending behavior of yarns, which was also analyzed by characterization parameters, bending load, bending stiffness, and realistic contact area. Inspired by the digital element approach, an improved modeling methodology with the probability distribution was employed to establish the geometry model of yarns and simulated bending behavior of yarns by defining the crimp strain of fibers in the yarn and the effective elastic modulus of yarns as random variables. The accuracy of the developed model was confirmed by the experimental approach. More bending behavior of yarns, including the twisted and plied yarns, was predicted by numerical simulation. Additionally, models revealed that twist level and number of plies affect yarn bending properties, which need to be adopted as sufficient conditions for the mechanical analysis of fiber-reinforced composite materials. This efficient experiment and modeling method is meaningful to be developed in further virtual weaving research.

1. Introduction

Usage of fiber-reinforced composite materials is growing in the aerospace, automotive sectors, and protective clothing, due to excellent mechanical properties, structural designability, and fatigue resistance, where there is an increasing need to produce complex parts in a cost-effective manner [1,2,3]. Such parts usually consist of two components, including the fiber preforms and the matrix. In the fiber preforms, consisting of straight weft yarns and crimped warp yarns, architecture has an important influence on the final mechanical properties of the composites. Hence, as a vital part of fiber-reinforced composites, the mechanical behavior of the yarns will significantly disperse the mechanical properties of the composite [4,5,6], such as tensile strength, compression and bending, etc. As a matter of fact, the yarns themselves are formed by many thousands of individual continuous fibers, whose fiber structures are extremely complex and variable under force. Thus, a classification into two scales can be made: meso (yarn level) and micro (fiber level) [7]. The geometrical deformations that occur across these scales are critical in determining the final mechanical properties of the composites.
Depending on that described above, the geometrical deformation and mechanical properties of the two scales need to be explored under force. However, experimentally predicting the geometrical deformation and mechanical properties of yarn, made of large fibers, remains an obstacle to the understanding of these behaviors due to the stochastic effects of micro-scale interactions [8]. Numerical simulation [9,10,11] is used to analyze the mechanical behavior of fiber-reinforced composite, in which the yarns should be modeled as realistically as possible to make sure that the obtained behaviors are reliable. Some simulation models [12,13,14] are established based on the simplified meso scale geometries of yarns, which does take into account the geometries and mechanical properties of fibers. The yarn structures can be generated by specialist software such as TexGen [15,16] and WiseTex [17]. To simulate the realistic geometries of yarn, approaches are generally carried out at the micro-meso scale based on previous research [18,19]. Wang et al. [20,21] proposed the digital-element method to model yarns, which were constituted by a bundle of digital fibers, which were represented by a chain of digital elements between every two digital nodes. Based on the digital-element method, the virtual fiber method was employed to model yarns [12,14]. Durville et al. [22] employed beam elements to represent fibers, which considered the geometrical and mechanical aspects. Durville’s approach starts from an arbitrary of virtual fiber configuration, in which all yarns have straight trajectories and all fibers constituting these yarns are taken into account in the model. Daelemans et al. [23] proposed a numerical modeling methodology to simulate yarns mechanics and geometries in Abaqus/Explicit. The idealized fibers are produced, which are constituted as a yarn by a Python script. The main advantage of this methodology is that the simulations are able to predict the mechanical response of the fabric by considering the sub-yarn behavior without the requirement of complex constitutive laws. High precision models of yarns can be generated using the above methods. These yarn modeling techniques, however, differ significantly from the realistic weaving process and do not consider the geometrical deformation and mechanical properties of the heterogeneous yarns, namely twisted and plied yarns, independently.
To acquire a more accurate model and character realistic mechanical properties described of heterogeneous yarns, an improved modeling methodology with the probability distribution constitutive laws needs to be established. A few constitutive laws have been utilized to characterize the mechanical properties of heterogeneous yarns [24,25]. Lamon et al. [26] proposed a solution based on a plot of quintile–quintile vs. strength to characterize flaw strengths using tensile tests on various fiber two types including, SiC, carbon, glass, basalt, and alumina. The results indicate that the normal distribution function is used to construct reference empirical distributions of flaw strengths that allow the evaluation of the Weibull plot and Maximum Likelihood Estimation methods as functions of sample size and composition. Wang et al. [27] proposed an analytical model based on the statistic theory to evaluate the random tensile response of jute fiber yarns which considered fiber crimp and properties distribution. The Beta probability distribution function was employed to characterize the stochastic tensile response of yarns. Wang et al. [28] used a constitutive model with stochastic damage properties to simulate axial tensile and transverse compressive behavior of the twisted yarns in explicit solver Abaqus/Explicit. The accuracy of the constitutive model, namely geometry and mechanics, was validated experimentally. Excellent agreement between simulation and experiment is obtained for the right set of input parameters. The above research investigated the mechanical properties of heterogeneous yarns focused on the constitutive laws, including the tensile and compressive behavior. However, the bending behavior of twisted and plied yarns, such as slippage, distortion, and shift of positions, have not been adequately explained. As a result, understanding and predicting the bending behavior of yarns, especially twisted and plied yarns, is crucial for final performance of the fiber-reinforced composite materials.
In the current paper, we use a novel experiment equipment and approach to evaluate the bending behavior of yarns, which is characterized by bending load, bending stiffness EIyarn, and realistic contact area Ar. An improved constitutive model with probability distribution constitutive laws was employed to establish the models and simulate the bending behavior of yarns. The probability distribution in terms of crimp strain is introduced to characterize the upper limit of crimp region. The model is demonstrated on carbon fiber yarns using the explicit solver Abaqus/Explicit. Meanwhile, to explore how the yarns’ architecture affects the bending behavior, the geometric deformation and bending behavior of yarns with various twists and plies were predicted on alumina and fiber quartz yarns, respectively. The model also provided the calculation approach for the bending stiffness of yarns at specific deflection.

2. Materials and Methods

2.1. Materials

This study was carried out on high-performance yarns, including carbon fiber yarn, alumina fiber yarn, and quartz fiber yarn, which are directly produced by Weihai Tuozhan Fiber Co., Ltd. (Weihai, China), Shandong University (Jinan, China), and Feilihua Quartz Glass Co., Ltd. (Jingzhou,, China). The detailed parameters of the samples are listed in Table 1. In this study, the carbon fiber yarn, alumina fiber yarn, and quartz fiber yarn are called CF, ALF, and QF, respectively. Initially, the samples were in the form of yarn containing thousands of fibers each.

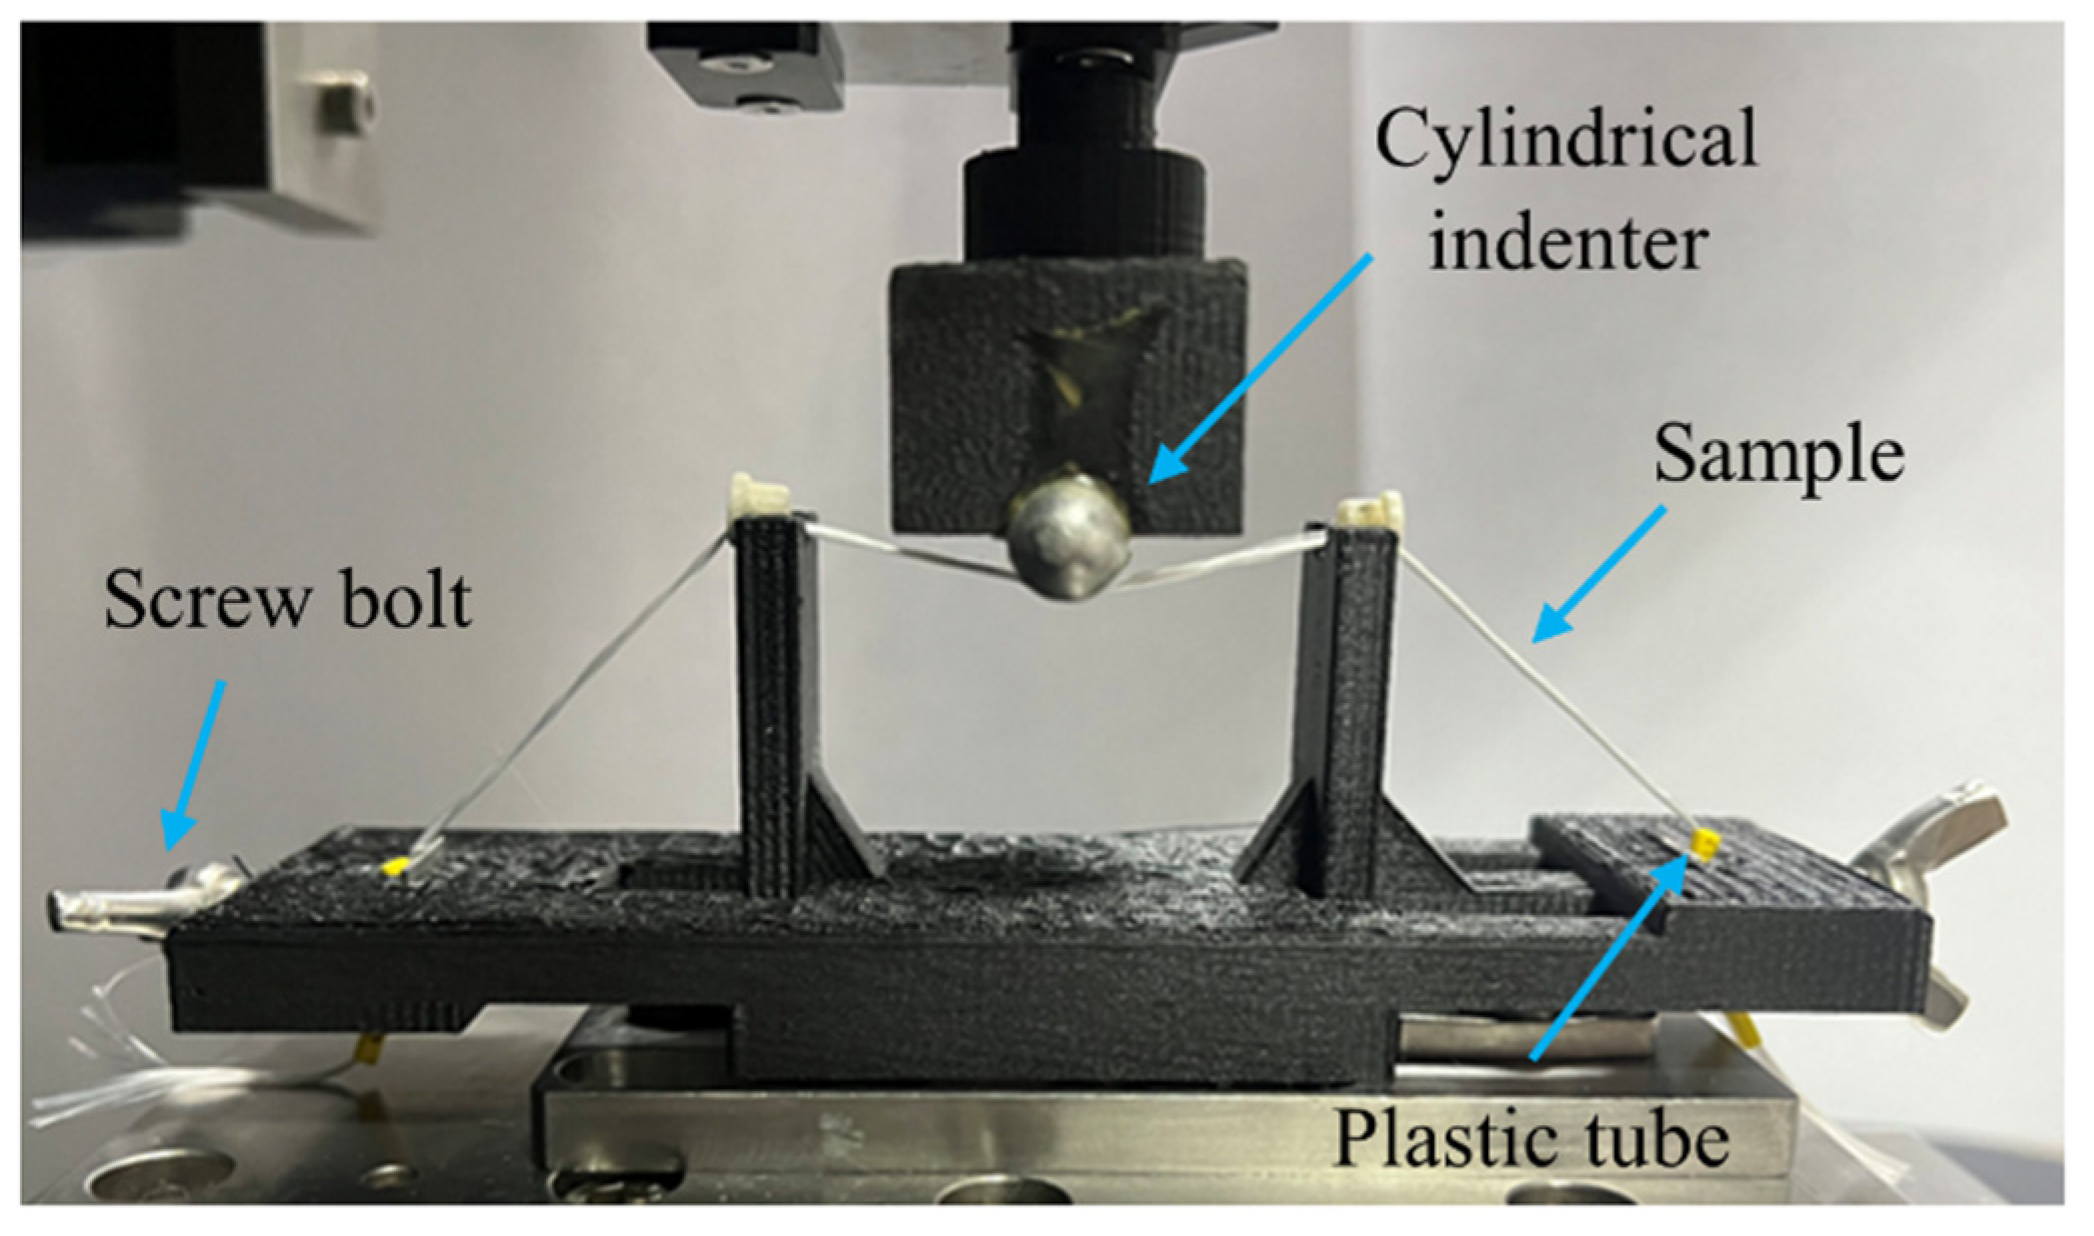
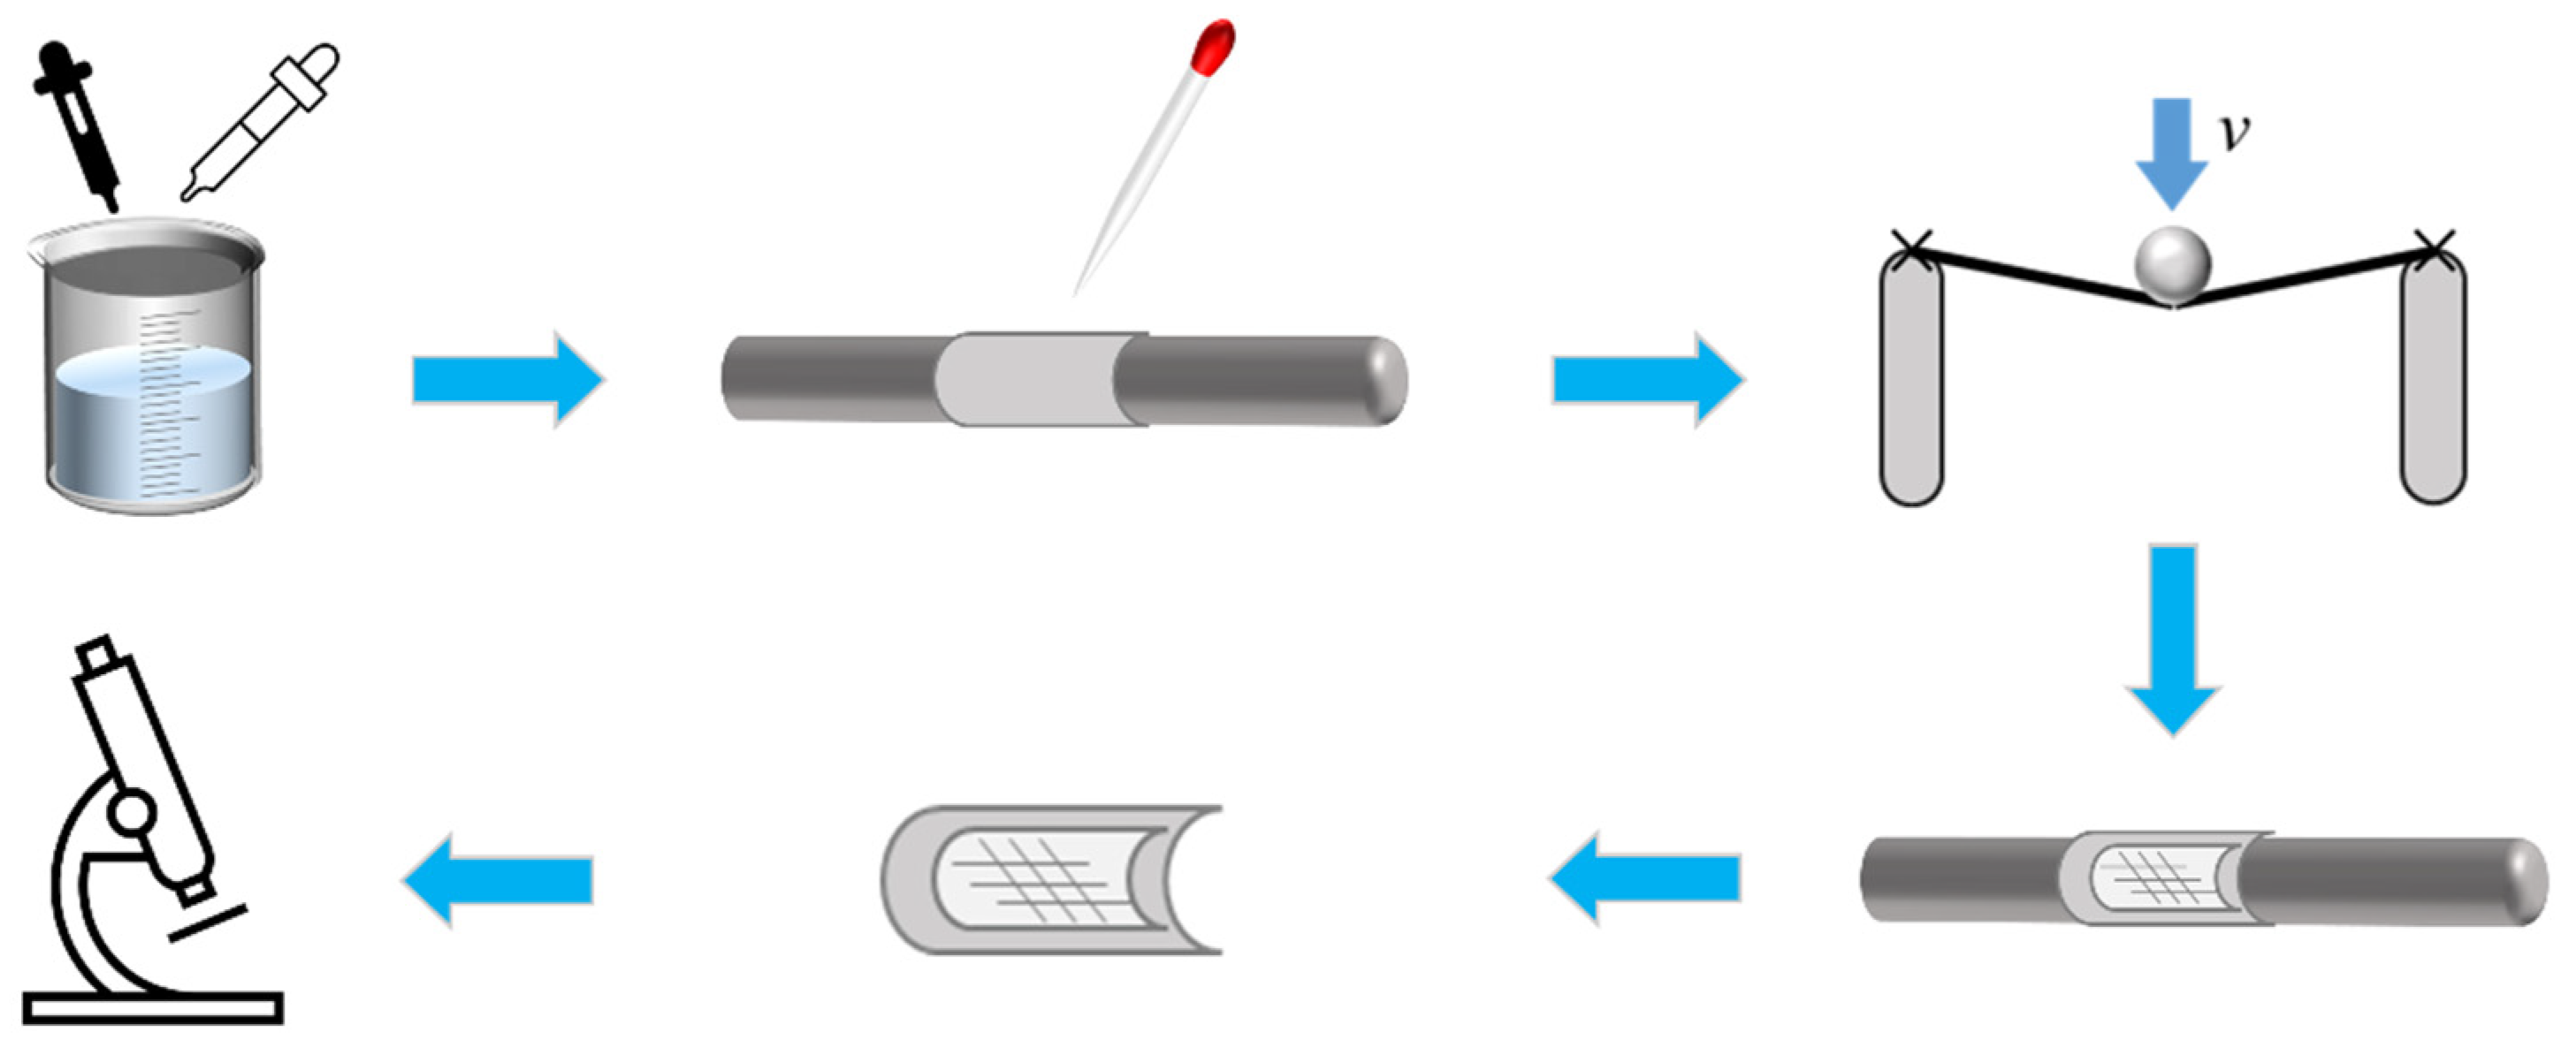
2.2. Experiment Method and Set Up

According to previous research [29,30], the experiment tests were carried out by a UMT-TRIBO LAB tribometer (Bruker Nano, Inc., Campbell, CA, USA) which were capable of being set at gauge lengths of 350 ± 10 mm. A pretension force of 2–6% of the maximum tensile load was applied to the samples and the deflection is 3 mm. To obtain more accurate test results, the particular fiber carrier was designed to fix the sample under a certain tension, as shown in Figure 1. Two ends of the sample were screwed together under strain during sample fixation. The screwed part of sample was protected by a plastic tube. The whole test was repeated 20 times at a room temperature of 23 ± 2 °C and a humidity of 60 ± 5%.
Based on the previous research on fiber/yarn contact surface [7,31], the yarn contact surface extraction experiment was conducted as shown in Figure 2. A silicone film mixture was prepared with silicone grease and curing agent in the ratio of 1:5, and 2 mL of the mixture was dropped evenly onto the surface of the cylindrical indenter. After 5–8 min of contact between the sample and the cylindrical indenter, a silicone film containing information on the contact surface for the sample was obtained. Furthermore, the silicone film was analyzed by a 3D contour measuring instrument VR-5200 ( KEYENCE Inc., Osaka, Osaka Prefecture, Japan).

3. Simulation Details

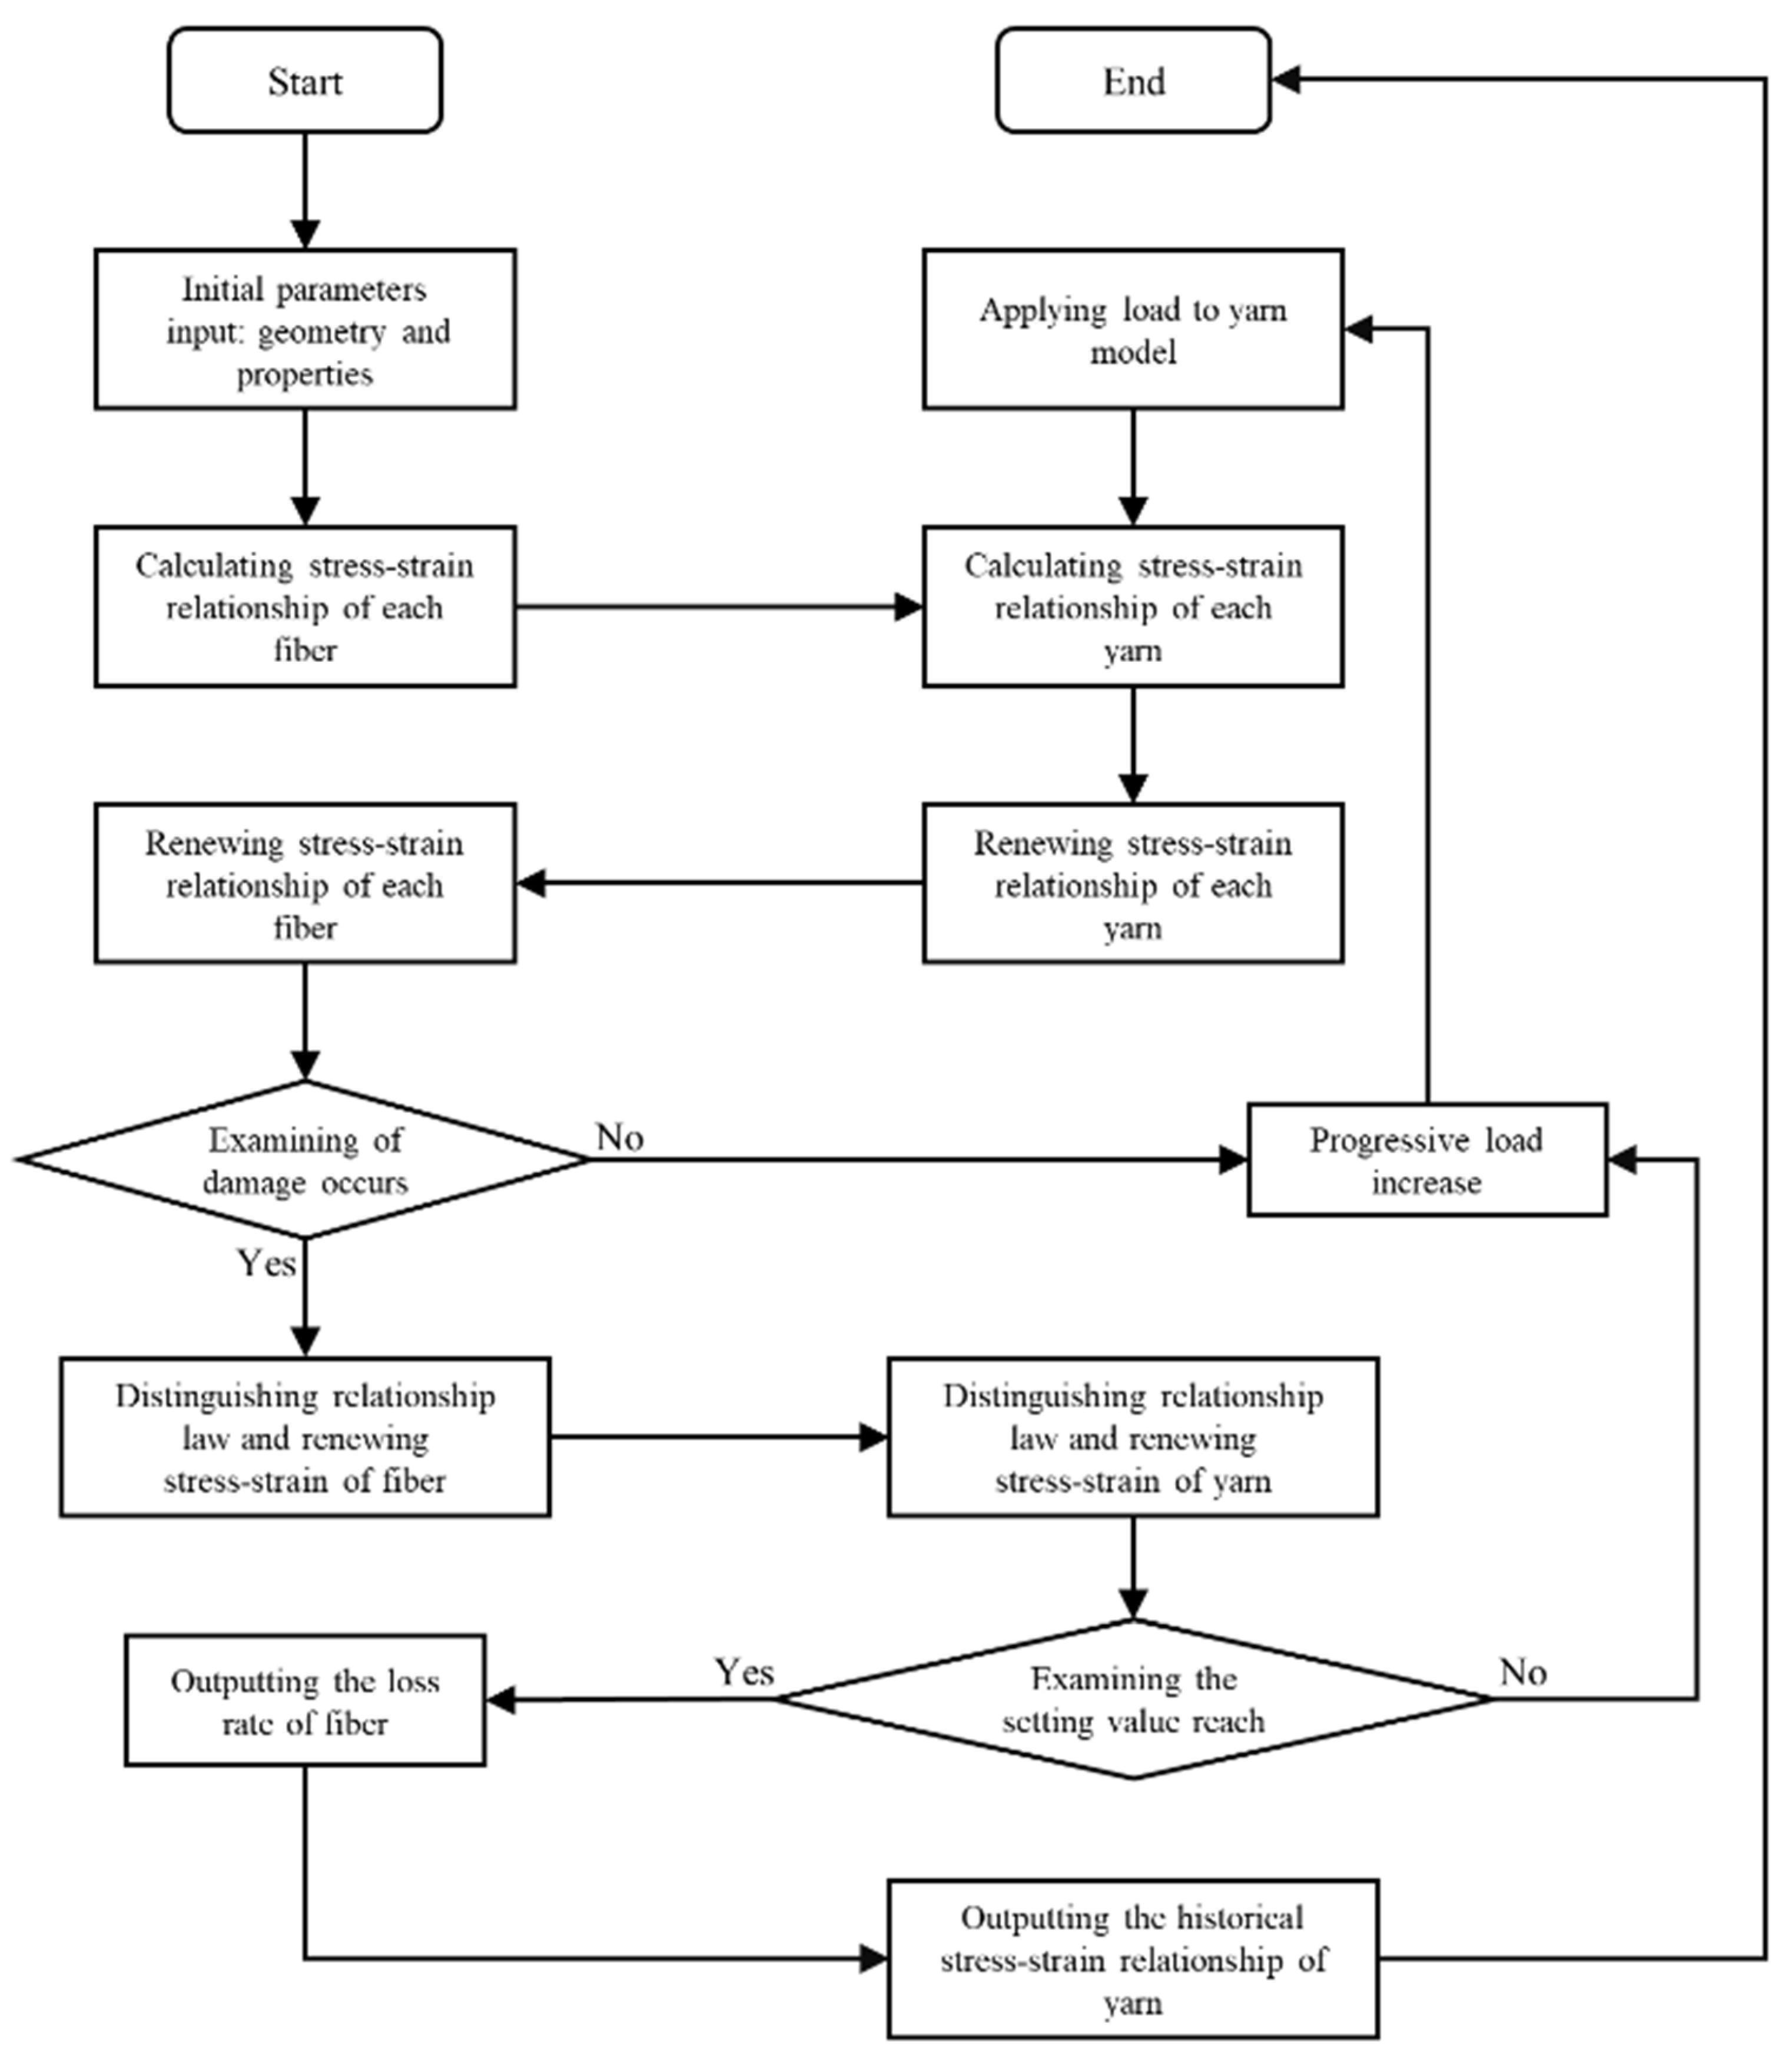
3.1. Constitutive Model Description

Each yarn is composed of thousands of fibers. However, modeling a yarn with realistic fiber amount is infeasible. A segmented constitutive model is utilized to describe the bending behavior of yarn. The model proposed in this research is based on the Weibull distribution described in the literature [28,32,33]. The terms apparent cross-section area and realistic cross-section area are used to describe the cross-section area of fiber strands. Images of yarns taken under an optical microscope can be used to determine the apparent yarn cross-section area, which includes the cross-section areas of the fibers inside the yarn and the gap between them. The geometry model of yarn is established in Abaqus by Python, which initially establishes the fiber arrangement of each yarn cross-section according to the twist level, and further connects each fiber node with a beam element, as shown in Figure 3. The geometry of yarn was determined based on the following equations:
θ 0 = π - n × arcsin ( z 0 / r point )
x = x 0 + κ × L e y = r point × cos θ 0 + κ θ t z = r point × sin θ 0 + κ θ t
where  x y , and  z  are coordinates along x, y and z directions, separately.  κ  is the number of the element.  r p o i n t = x 0 2 + y 0 2  is the distance between the node and the center of the circle on the section.  θ t  and  θ 0  are the twist level of yarns and the deflection angle of the element, which usually is normalized by n.
The constitutive structure model of the fiber and yarn needs to be clarified. Initially, li (i = 1~n) is defined as crimp length of the i-th fiber, which is arranged from small to large. Hence, the bending strain outside the neutral axis of the i-th fiber is obtained as:
ε i f = l l 0 l i l 0 = ε ε i l
where l is the stretched yarn length and l0 is the initial yarn length. ε is the yarn strain.  ε i l = l i l 0  is defined as crimp strain of the i-th fiber and is used to characterize the crimp behavior of fibers within a yarn [21].
σ i = E f ε i f             ε i l ε ε i b       0             o t h e r w i s e
where Ef is Young’s modulus of the fiber,  ε i b  and  ε i l  are breaking strain and crimp strains of the i-th fiber.
The attributes with Weibull distribution must be assigned to each virtual fiber based on the stochastic distribution algorithm to investigate a more precise mechanical response of yarn. The factors with Weibull distribution of fibers—scale and shape factor—are obtained from the research [26,28], probability of fiber can be obtained by Equation (5).
P ε = 1 exp ε ε i l m = N N
where m is the Weibull modulus or shape factor. Assuming that yarn with N fiber filaments has N′ fibers under tension and other fibers not, the strain with n′ fibers straightened is  ε i l . Thus, the yarn force can be calculated as:
F = N A f E f P ( ε ) ε 0 ε x p ( x ) d x
where Af is the apparent cross-section area of the fiber. The probability density function p(x) is the derivative of P(x). The stress of yarn with N fibers can be defined as:
σ = E f P ( ε ) ε 0 ε x p ( x ) d x
Indeed, yarn failure strain and yarn strength are two commonly used yarn failure criteria [28,34,35]. Assuming that a brittle yarn breaks when its stress exceeds its yarn strength  σ s , therefore, the stress–strain relationship in the axial direction of the yarn can be given as:
σ = E f P ( ε ) ε 0 ε x p ( x ) d x ε < ε N l E f P ( ε ) ε 0 ε l x p ( x ) d x ε = ε N l 0 otherwise
The proposed constitutive model is carried out by User subroutine VUMAT of Abaqus nonlinear finite element codes, which is based on the classic step-by-step iterative method in an incremental form, shown in Figure 4.

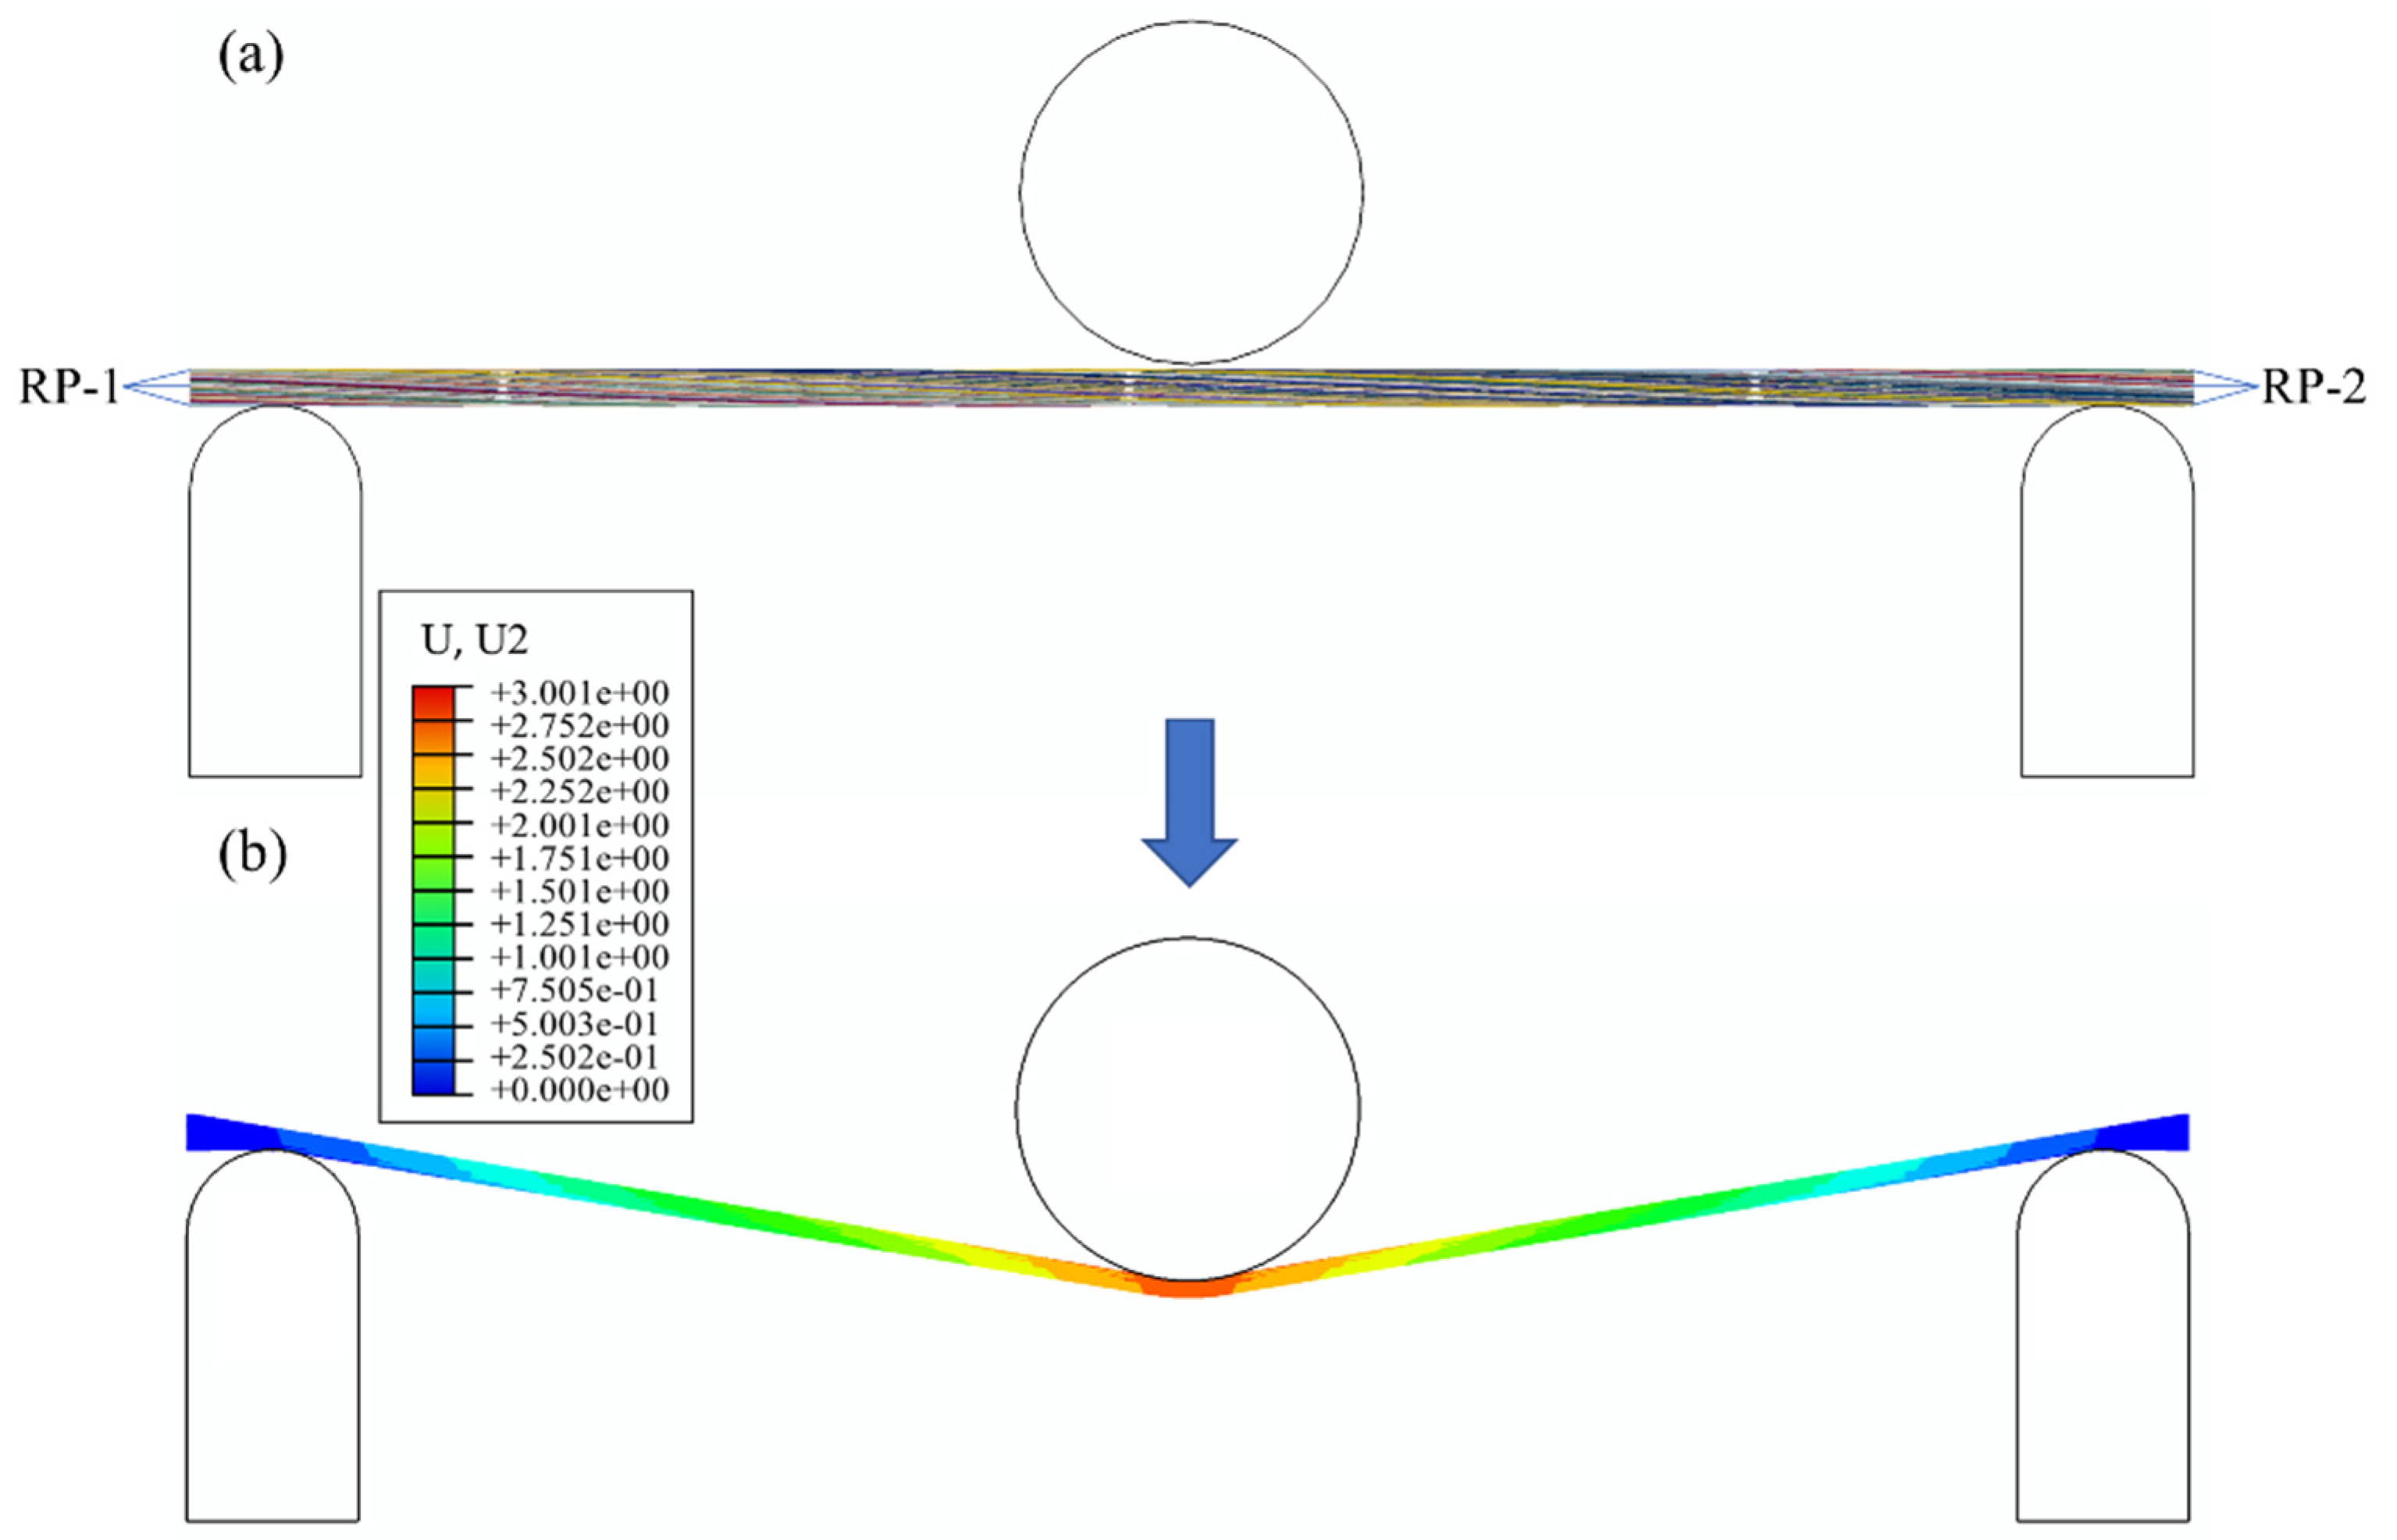
3.2. Simulation of Bending Test

A quasi-fiber scale model of yarn for bending simulation was established in an explicit solver Abaqus/Explicit. The parameters of yarn simulation, COF (coefficient of friction)—0.35, 112 fibers and element length of Le—0.3, were validated based on previous research [28]. The bending behavior was simulated using two dynamic/explicit steps by three rigid parts (dimensions consistent with experiments, rigid shell elements R3D4), which move (displacement-controlled) towards yarn in between the pre-tension in Figure 5. The dimensional parameters of specimen were identical to experiment in the bending simulation. The two steps, both 0.5 s, were performed to achieve the bending simulation. In step 1 the pre-tension was applied, while in step 2 the cylindrical indenter moved to a set displacement of 3 mm. To achieve a balance between the modeling precision and computational efficiency and ensure the convergence of the simulation, it is necessary to use mass scaling to increase the mass of the model artificially. During the analysis, a fixed mass scaling factor of 100 was introduced to the virtual fiber model. To conveniently apply the boundary conditions, the nodes at the start and end of the geometric model are coupled to points RP-1 and RP-2. During the bending simulation of the yarn, the reaction forces and the distance on the cylindrical indenter are recoded to characterize the bending behavior of yarns.

4. Results and Discussion

In this section, the proposed analytical model was validated against the data obtained from the experiment. The predictions of mechanical properties for twisted and plied yarns were also performed to understand the generality of the present model. Various parameters were employed to characterize the bending properties of the yarn and to demonstrate the universality of the present model.

4.1. Verification of Numerical Simulation Model

Following the experimental and simulation methods described above, taking carbon fiber yarn as an example, the bending properties were characterized and compared by the curve between bending load and deflection, as shown in Figure 6. The relationships between bending load and deflection under pretension are shown in Figure 6a. The bending load increases non-linearly with increasing deflection, whose shape is similar to the load–deflection curve of compression behavior [12,36]. Similarly, the curve can be divided into two phases, the deformation and bending phase, to explain the bending behavior. Both curves have the same trend for relationships between bending load and deflection during the whole bending. Additionally, the characteristic value is located in 95% prediction bounds of the experiment range.
Furthermore, the EIyarn and Ar of yarn were compared to experimental results using the present model. Here, EIyarn was calculated based on Equation (9) [12]:
E I y a r n = E f ( I + d 2 A )
where I is the second moment of area, d is the projected distance to the centerline, and A is the cross-section area of the fiber.
Figure 6b shows the values for the EIyarn and Ar at the deflection of 3 mm. It was found that the error of the experiment is larger than the simulation. This may be due to the fact that fiber rearrangement, and the accompanying cross-sectional change, is a dominant influence mechanism in the bending process of yarns in the experiment. Additionally, it is worth noting that the determined EIyarn by simulation falls within the range determined by the experiment whose changing rate is 1.7%. For contact area morphology, both showed a low center and high surrounding, the height changing rate was about 0.7 mm. The Ar of experiment and simulation were 17.5 and 15.8 mm2, respectively, whose changing rate for Ar was 12.6%.
The bending response showed better agreement with the experimentally determined curve, both in terms of its macroscopic (bending load–deflection) and microscopic (EIyarn and Ar) parameters, which validates the universality of the present model. Hence, it shows that the simulation model can be employed to explore the effect of more details on yarn bending properties.

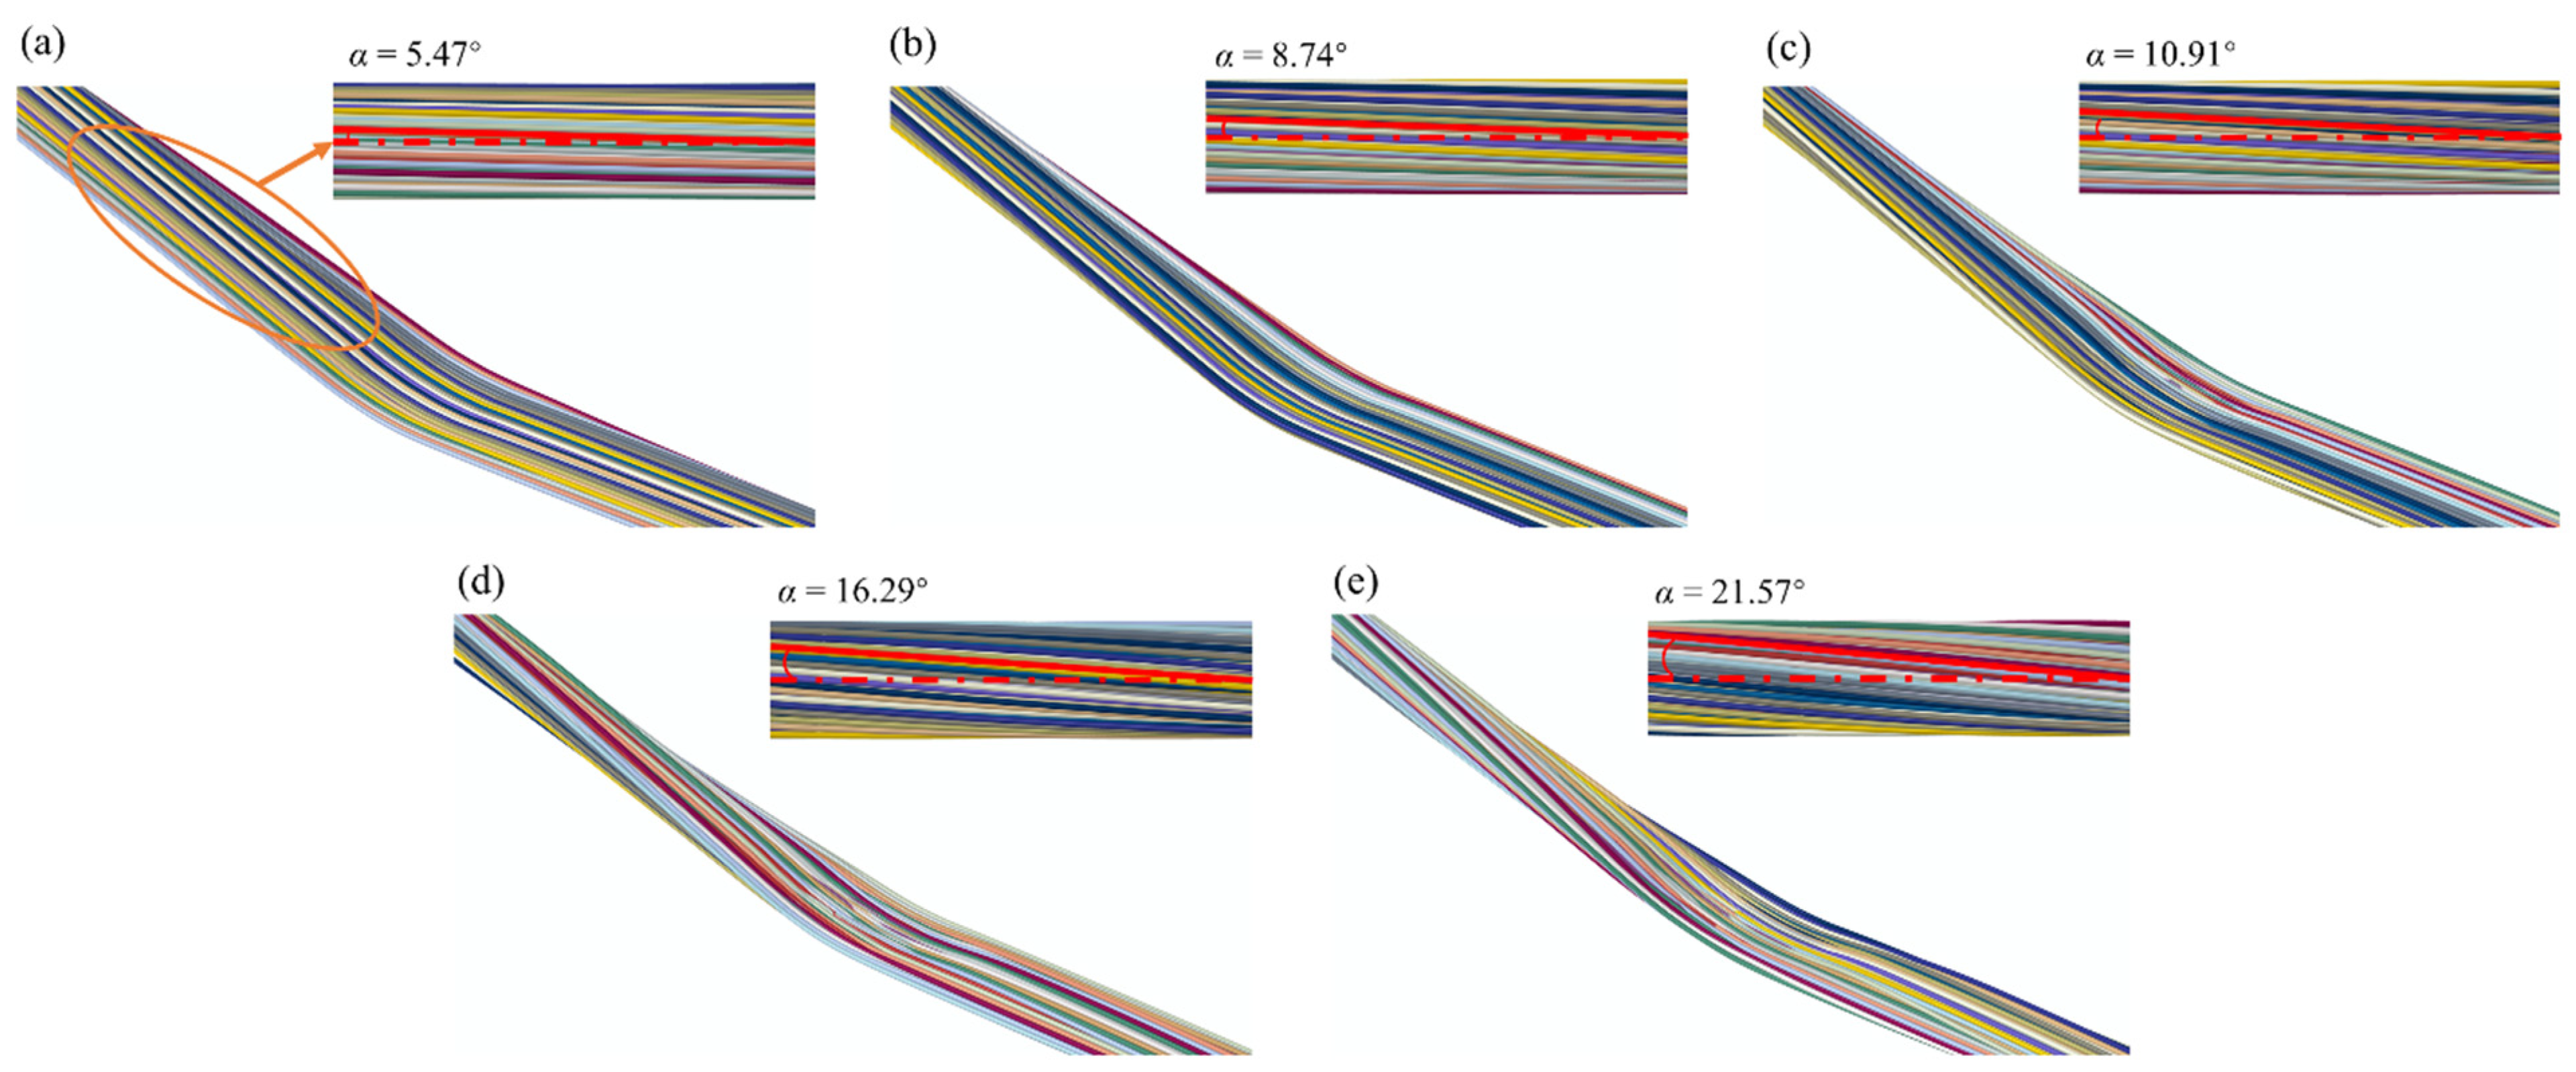
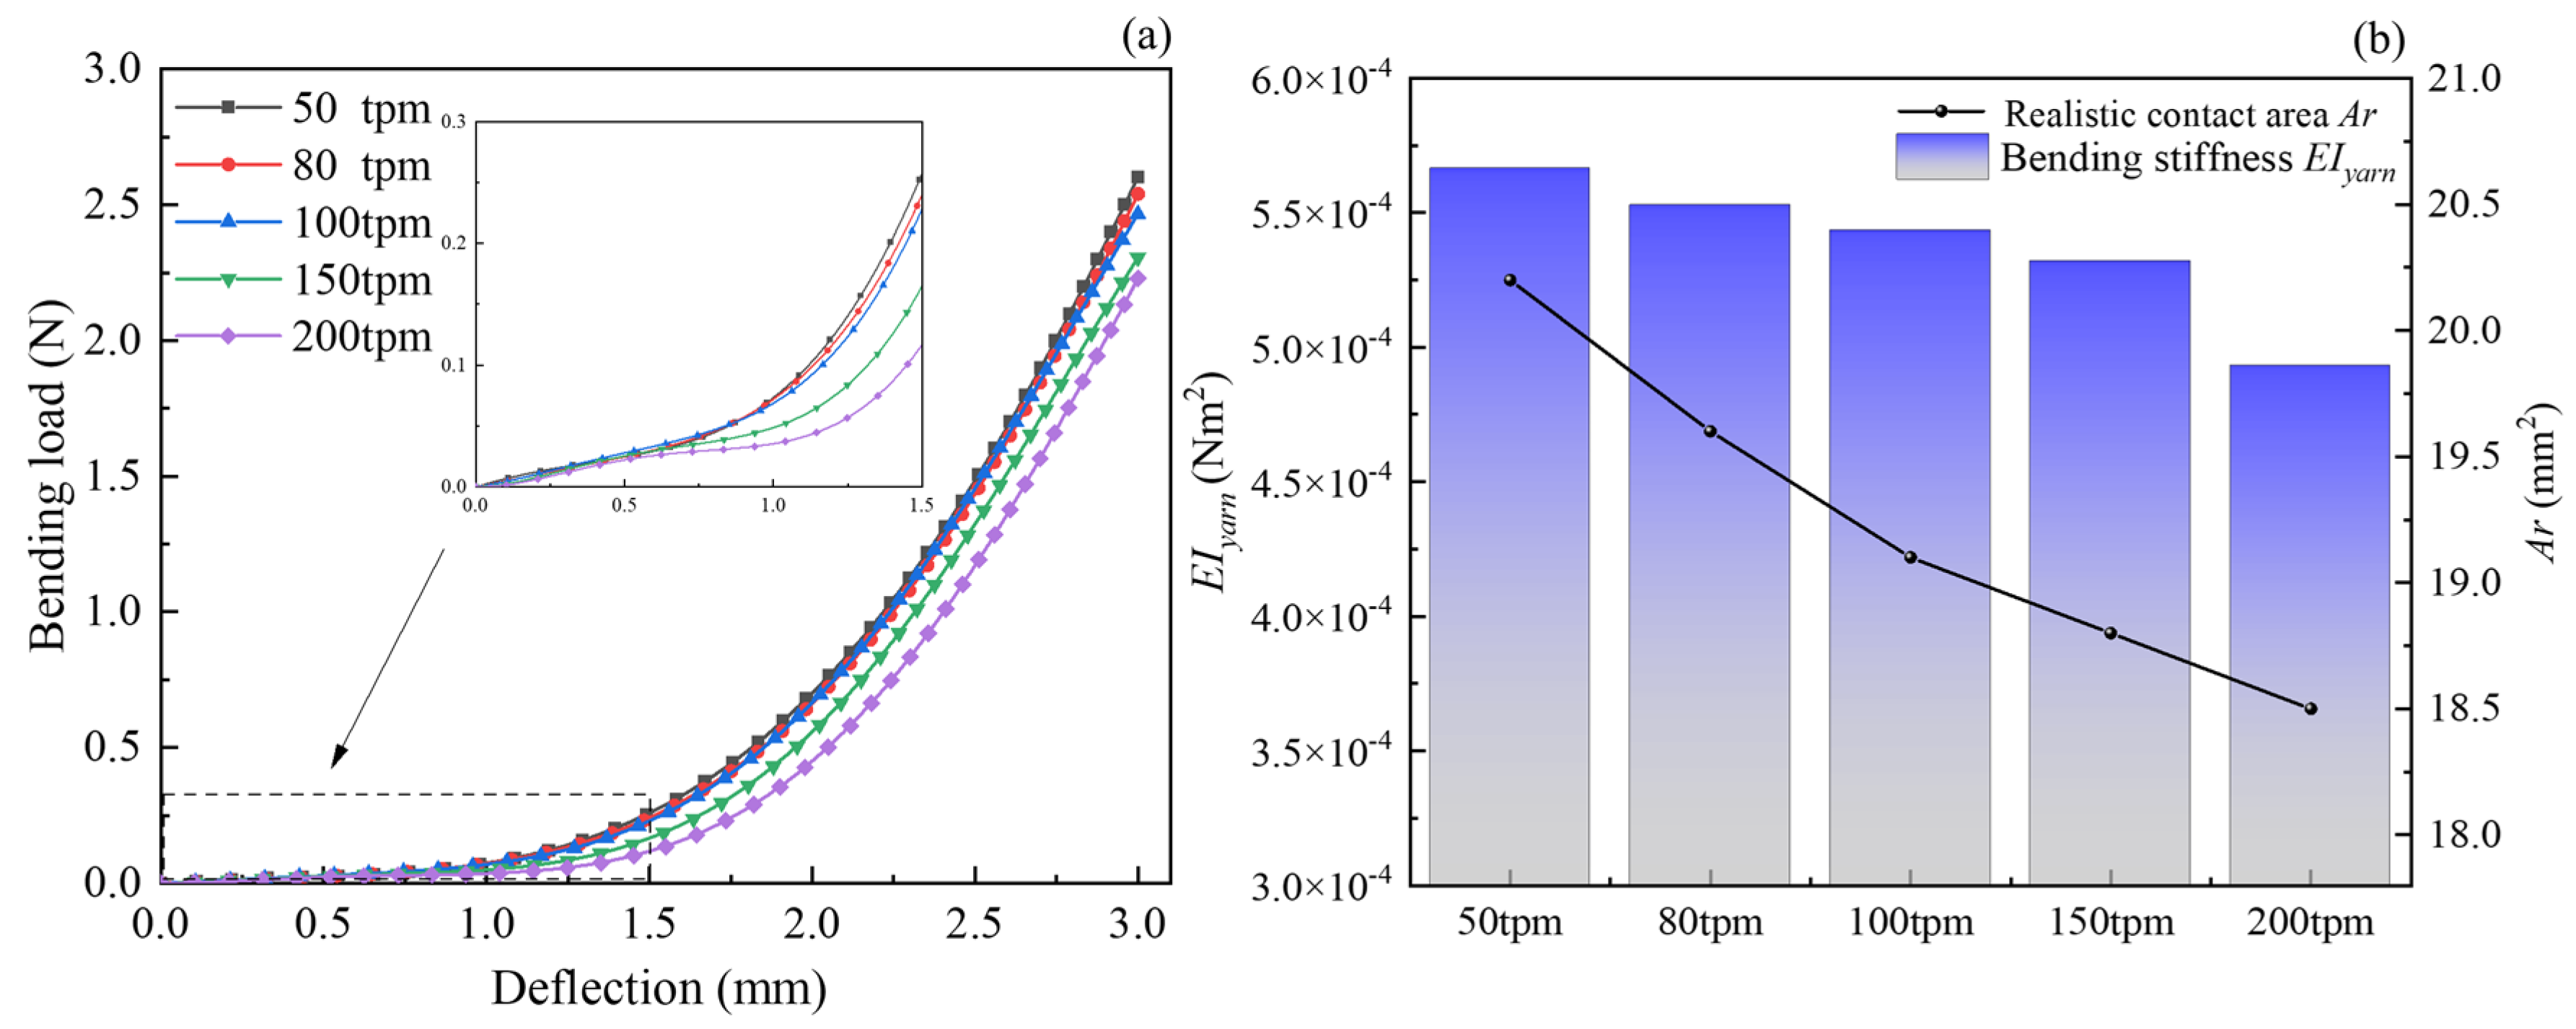
4.2. Influence of Twist Level on Bending Behavior

Based on the validated simulation model, yarn models with different twist levels were established and the bending behavior was predicted for 50, 80, 100, 150, and 200 tpm, respectively. Geometry models of various twisted yarns are generated using 122 beam elements with different properties. Figure 7 shows the local enlargement of the yarn model, from which the variation of yarn shape and twist level can be clearly observed. In each twisted yarn, the twist angles α were obtained from the geometric model of yarns, which indicates an increasing trend with the increasing twist level. Simultaneously, as the twist level increased, the fibers within the yarn became entangled and in contact with each other, gradually squeezing toward the central axis of the central yarn. At the same time, the curvature of the fiber spatial path gradually increased as the twist level increased, which led to fiber volume content with increasing twist level.
The simulation results are shown in Figure 8a. It can be seen that when the deflection was in the range of 0 and 0.1 mm, the effect of twist level on the bending load was insignificant, while the effect of twist level on the bending load was significant for deflections between 1.0 and 3.0 mm, that is, the bending load decreased with increasing twist level. This may be due to the increase in twist level, therefore, migration of external fibers to the center of the yarn as the arrangement was not yet steady and the increase in fiber cohesion was achieved. Netherlands, nonlinear processes are observed in Figure 8a, that is, the rates of change in bending load of yarn between 50, 80 and 100 tpm were not significant. The rate of change between 50 and 100 tpm with a deflection of 3.0 mm was just 2.9%, while the rate of change with 200 tpm was 6.9%. Theoretically, the rates of change will probably continue to increase as the twist level continues to increase.
Figure 8b showed that the values for the EIyarn and Ar that are determined according to the methods described in the previous section for different twisted yarns at a deflection of 3 mm. Firstly, one can see that EIyarn is inversely proportional to twist level, especially 150 tpm to 200 tpm, which can be explained using the deformation mechanisms described. Yarns with a small twist result in weak cohesion and a great degree of freedom of fibers. Therefore, the EIyarn can be considered as the sum of each fiber. Conversely, yarns with a greater twist are susceptible to deformation. In addition, the results of bending simulation show that the effect of twist level on EIyarn is mainly concentrated in a finite range, whose conclusions are similar to the ones in the literature. Furthermore, the relationship between the realistic contact area and twist level was recorded at a deflection of 3 mm by the numerical simulation method in Figure 8b. It is shown that the Ar decreased non-linearly as the twist level increased, which is the same trend as the EIyarn’s. This can be explained by fiber rearrangement theory [7,37,38], that is, mainly due to the great degree of freedom between fibers within small twist yarns, a new contact surface of yarn is generated by rearrangement of inner layer fibers to the outer layer. As the twist level continues to increase, it is more difficult for the fibers to move with each other and the rate of change of Ar gradually decreases. It can be obtained that the rates of change of the realistic contact areas with different twists are 2.9, 2.5, 1.5, and 1.4%, respectively, further validating the above explanation from Figure 8b.

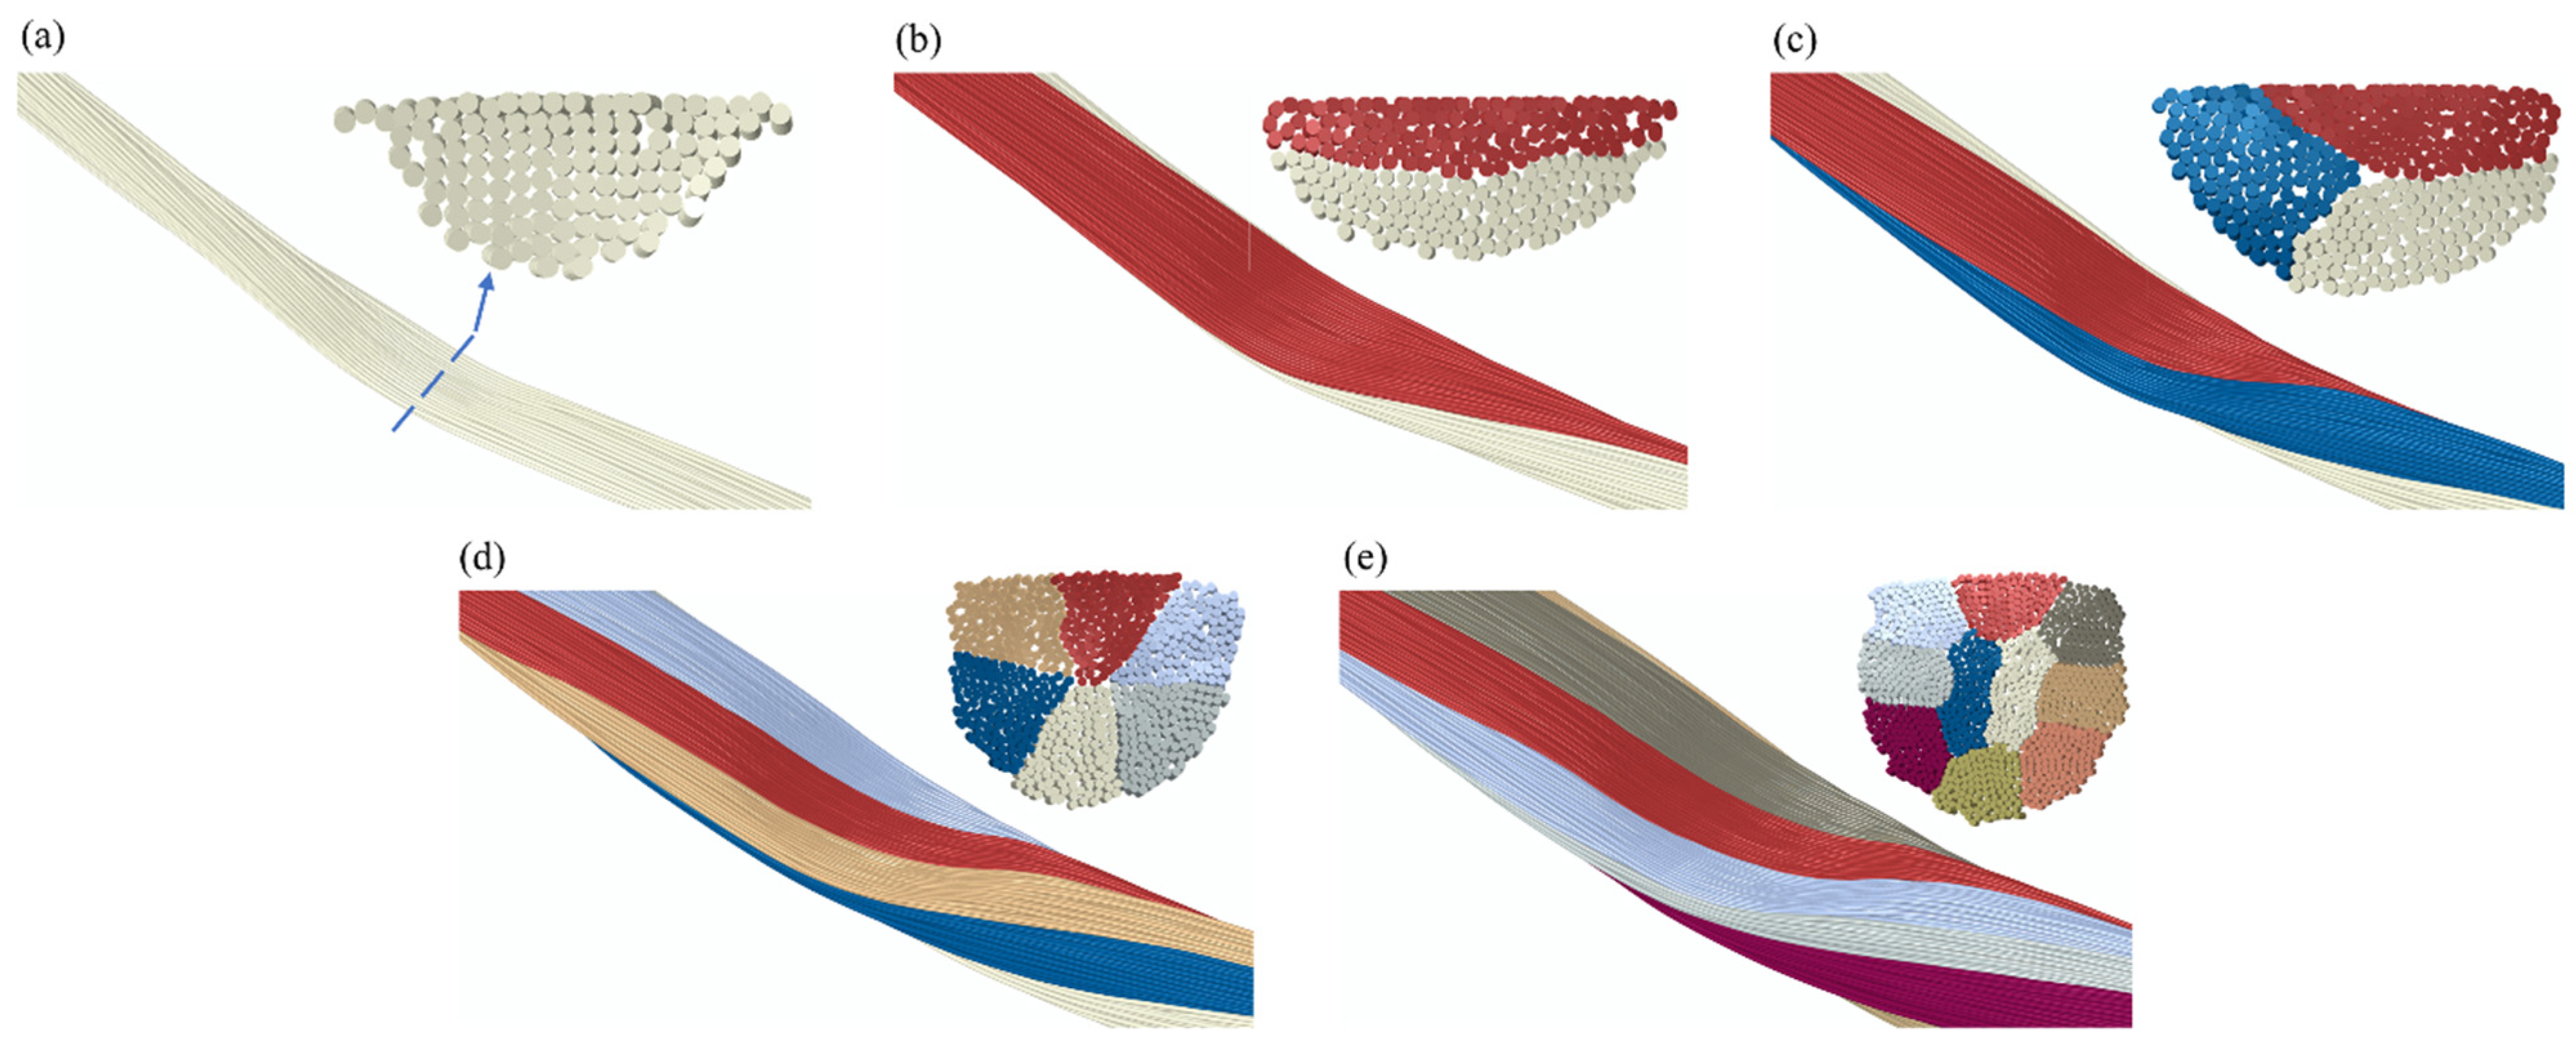
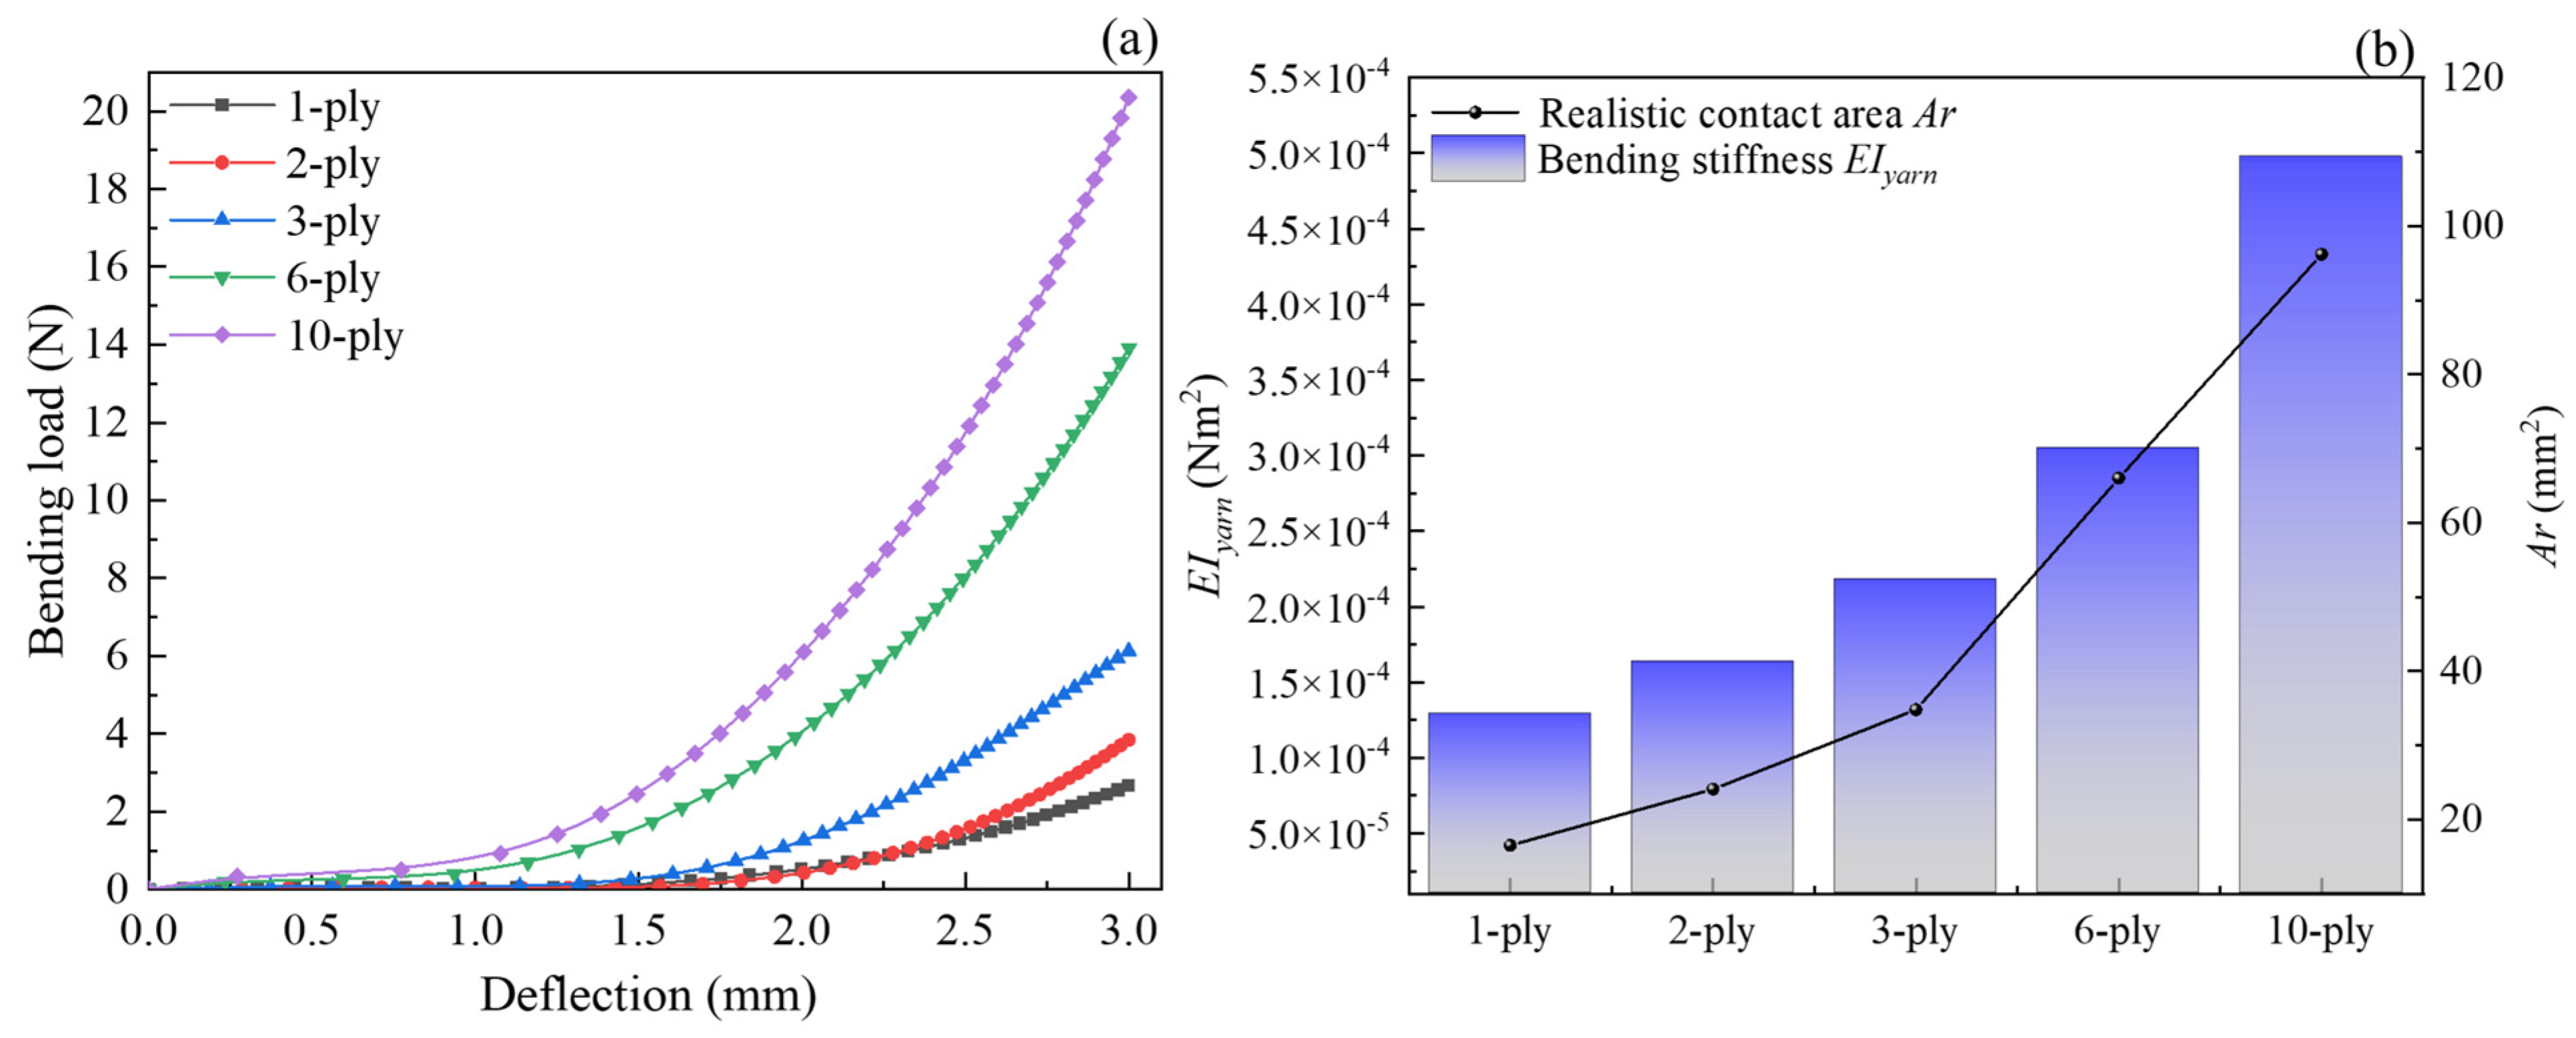
4.3. Influence of Ply on Bending Behavior

To prediction of the effect of the number of plies on the bending behavior of yarns, similar simulation approach and characterization parameters were employed for analysis using the quartz fiber yarn. Figure 9 illustrates the five kinds of plied yarns consisting of 1, 2, 3, 6, and 10 plies all with 80 tpm, which clearly indicates single ply yarns by different colors. It can be seen that the yarn of 10 plies model was relatively “strong”, that is, larger diameter and more fibers. In addition, the cross-sections of plied yarns are also shown. With the increase of fiber amount, the resolution of the yarn’s cross-sectional shape improves. The calculation time, however, increased from 1.5 h to 8.3 h.
Similar to the effect of twist level, the curve between the deflection and bending load, EIyarn and Ar were employed to characterize the bending behavior of plied yarn. Figure 10 shows the values for the EIyarn and Ar after the bending of plied yarns, which illustrates that the effect of ply number on the bending behavior is significant. The bending load of plied yarn showed a non-linear increasing trend with increasing deflection during the bending, which can be divided into two phases, that is, the deformation and bending phase in Figure 10a. The bending load of the defection of 3 mm was proportional to the number of plies. However, it is seen that as the number of plies increased, the non-linear variation trend of the bending load at 3 mm gradually became obvious, especially in 3-ply and 6-ply. This means that the effect of inter-fiber friction force on the bending load of multi-plies yarns is significant. Figure 10b represents the relationships of EIyarn and Ar to the number of plies. There was an increase in EIyarn of yarns with the increasing number of plies at the deflection of 3 mm. This is a result of the increase in the number of fibers in the cross-section of yarn with the increase in the number of plies. Furthermore, the trend described is explained by the following equation:
E I y a r n = N 2 E I f i b e r φ
where φ is the filling coefficient of fiber, N is the number of fibers within the cross-section, and EIyarn is the bending stiffness of fiber.
Figure 10b shows that the Ar increases with the increasing number of plies at the deflection of 3 mm. Apparently, the Ar of 10-ply was the largest within the current research, which was also influenced by inter-fiber friction force. During the bending process, the migration of the inter fibers to the outer layer was obstructed, which resulted in a non-linear change for Ar. Here, Ar varied from 16.5 mm2 of 1-ply to 96.2 mm2 of 10-ply. The overall behavior was similar to Ar in Figure 8b, but with a few notable differences: somewhat greater range of variation in the results, and finally, a more marked transition was evident at around 3-ply where the rate of change of Ar changed. The rates of change were 31%, 30%, 47%, and 31%, respectively, within the scope of the current research, for which the arrangement of fibers may be responsible.

5. Conclusions

Predictive simulations of the mechanical response of yarns are necessary for the structural design of reinforcement, as well as for the development of fiber-reinforced composite materials. In the present research, experimental equipment and approach were utilized to characterize the bending behavior of yarns. The modeling approach was used to simulate the bending behavior of yarns based on our previous research. There are excellent agreements in characterization parameters including bending load, bending stiffness EIyarn, and realistic contact area Ar after the comparison between the experimental measurements and the simulation. Furthermore, the predictions of bending behavior for twisted and plied yarns were carried out by the described model. It is shown that the bending load decreases gradually as the twist level increases and increases as the number of plies increases at the deflection of 3 mm. The EIyarn and Ar are inversely proportional to twist level of yarns though, which varies on a minor interval. However, mainly influenced by the number of fibers, the EIyarn and Ar increase with the increasing number of strands, which varies on a large interval. In the future, more detailed characterization parameters that cannot be experimentally obtained need to be explored to analyze the mechanical behavior of yarns through simulation models.

Author Contributions

Y.W.: investigation, methodology, software, validation, visualization, and writing—original draft. X.L.: investigation, methodology, visualization, and writing. J.X.: investigation, software, and validation. N.W.: investigation, methodology, and validation. Y.J.: conceptualization, methodology, and supervision. P.W.: conceptualization, investigation, and supervision. All authors have read and agreed to the published version of the manuscript.

Funding

The authors gratefully appreciate the financial support from the China Scholarship Council (Project no. 202108120054).

Institutional Review Board Statement

Not applicable.

Informed Consent Statement

Not applicable.

Data Availability Statement

The data presented in this study are available on request from the corresponding author.

Conflicts of Interest

The authors declare no conflict of interest.

References

  1. Boisse, P. Advances in Composites Manufacturing and Process Design; Woodhead Publishing: Cambridge, UK, 2015; ISBN 978-1-78242-320-1. [Google Scholar]
  2. Emonts, C.; Grigat, N.; Merkord, F.; Vollbrecht, B.; Idrissi, A.; Sackmann, J.; Gries, T. Innovation in 3D Braiding Technology and Its Applications. Textiles 2021, 1, 185–205. [Google Scholar] [CrossRef]
  3. Xiang, H.; Jiang, Y.; Zhou, Y.; Malengier, B.; Van Langenhove, L. Binocular Vision-Based Yarn Orientation Measurement of Biaxial Weft-Knitted Composites. Polymers 2022, 14, 1742. [Google Scholar] [CrossRef] [PubMed]
  4. Janicki, J.C.; Bajwa, D.S.; Cairns, D.; Amendola, R.; Ryan, C.; Dynkin, A. Gauge Length and Temperature Influence on the Tensile Properties of Stretch Broken Carbon Fiber Tows. Compos. Part A Appl. Sci. Manuf. 2021, 146, 106426. [Google Scholar] [CrossRef]
  5. Xie, J.; Guo, Z.; Shao, M.; Zhu, W.; Jiao, W.; Yang, Z.; Chen, L. Mechanics of Textiles Used as Composite Preforms: A Review. Compos. Struct. 2023, 304, 116401. [Google Scholar] [CrossRef]
  6. Li, M.; Wang, P.; Boussu, F.; Soulat, D. Effect of Fabric Architecture on Tensile Behaviour of the High-Molecular-Weight Polyethylene 3-Dimensional Interlock Composite Reinforcements. Polymers 2020, 12, 1045. [Google Scholar] [CrossRef]
  7. Mulvihill, D.M.; Smerdova, O.; Sutcliffe, M.P.F. Friction of Carbon Fibre Tows. Compos. Part A Appl. Sci. Manuf. 2017, 93, 185–198. [Google Scholar] [CrossRef] [Green Version]
  8. Chakladar, N.D.; Mandal, P.; Potluri, P. Effects of Inter-Tow Angle and Tow Size on Carbon Fibre Friction. Compos. Part A Appl. Sci. Manuf. 2014, 65, 115–124. [Google Scholar] [CrossRef]
  9. Wang, J.; Wang, P.; Hamila, N.; Boisse, P. Meso-Macro Simulations of the Forming of 3D Non-Crimp Woven Fabrics. Textiles 2022, 2, 112–123. [Google Scholar] [CrossRef]
  10. Orlik, J.; Krier, M.; Neusius, D.; Pietsch, K.; Sivak, O.; Steiner, K. Recent Efforts in Modeling and Simulation of Textiles. Textiles 2021, 1, 322–336. [Google Scholar] [CrossRef]
  11. Gao, Z.; Chen, L. A Review of Multi-Scale Numerical Modeling of Three-Dimensional Woven Fabric. Compos. Struct. 2021, 263, 113685. [Google Scholar] [CrossRef]
  12. Daelemans, L.; Tomme, B.; Caglar, B.; Michaud, V.; Van Stappen, J.; Cnudde, V.; Boone, M.; Van Paepegem, W. Kinematic and Mechanical Response of Dry Woven Fabrics in Through-Thickness Compression: Virtual Fiber Modeling with Mesh Overlay Technique and Experimental Validation. Compos. Sci. Technol. 2021, 207, 108706. [Google Scholar] [CrossRef]
  13. Pham, Q.H.; Ha-Minh, C.; Chu, T.L.; Kanit, T.; Imad, A. On Microscopic and Homogenized Macroscopic Analysis of One Kevlar® KM2 Yarn under Transverse Compressive Loading. Mech. Res. Commun. 2020, 104, 103496. [Google Scholar] [CrossRef]
  14. Yang, Z.; Jiao, Y.; Xie, J.; Chen, L.; Jiao, W.; Li, X.; Zhu, M. Modeling of 3D Woven Fibre Structures by Numerical Simulation of the Weaving Process. Compos. Sci. Technol. 2021, 206, 108679. [Google Scholar] [CrossRef]
  15. Buchanan, S.; Grigorash, A.; Archer, E.; McIlhagger, A.; Quinn, J.; Stewart, G. Analytical Elastic Stiffness Model for 3D Woven Orthogonal Interlock Composites. Compos. Sci. Technol. 2010, 70, 1597–1604. [Google Scholar] [CrossRef] [Green Version]
  16. Aziz, A.R.; Ali, M.A.; Zeng, X.; Umer, R.; Schubel, P.; Cantwell, W.J. Transverse Permeability of Dry Fiber Preforms Manufactured by Automated Fiber Placement. Compos. Sci. Technol. 2017, 152, 57–67. [Google Scholar] [CrossRef]
  17. Vanaerschot, A.; Cox, B.N.; Lomov, S.V.; Vandepitte, D. Experimentally Validated Stochastic Geometry Description for Textile Composite Reinforcements. Compos. Sci. Technol. 2016, 122, 122–129. [Google Scholar] [CrossRef]
  18. Hoan-Pham, Q.; Ha-Minh, C.; Long-Chu, T.; Kanit, T.; Imad, A. Analysis of the Transverse Compressive Behavior of Kevlar Fibers Using Microscopic Scale Approach. Int. J. Mech. Sci. 2019, 164, 105149. [Google Scholar] [CrossRef]
  19. Döbrich, O.; Gereke, T.; Hengstermann, M.; Cherif, C. Microscale Finite Element Model of Brittle Multifilament Yarn Failure Behavior. J. Ind. Text. 2018, 47, 870–882. [Google Scholar] [CrossRef]
  20. Wang, Y.; Miao, Y.; Swenson, D.; Cheeseman, B.A.; Yen, C.-F.; LaMattina, B. Digital Element Approach for Simulating Impact and Penetration of Textiles. Int. J. Impact Eng. 2010, 37, 552–560. [Google Scholar] [CrossRef]
  21. Wang, Y.; Sun, X. Digital-Element Simulation of Textile Processes. Compos. Sci. Technol. 2001, 61, 311–319. [Google Scholar] [CrossRef]
  22. Durville, D.; Baydoun, I.; Moustacas, H.; Périé, G.; Wielhorski, Y. Determining the Initial Configuration and Characterizing the Mechanical Properties of 3D Angle-Interlock Fabrics Using Finite Element Simulation. Int. J. Solids Struct. 2018, 154, 97–103. [Google Scholar] [CrossRef] [Green Version]
  23. Daelemans, L.; Faes, J.; Allaoui, S.; Hivet, G.; Dierick, M.; Van Hoorebeke, L.; Van Paepegem, W. Finite Element Simulation of the Woven Geometry and Mechanical Behaviour of a 3D Woven Dry Fabric under Tensile and Shear Loading Using the Digital Element Method. Compos. Sci. Technol. 2016, 137, 177–187. [Google Scholar] [CrossRef]
  24. Hu, Y.; Zhao, Y.; Liang, H. Refined Beam Theory for Geometrically Nonlinear Pre-Twisted Structures. Aerospace 2022, 9, 360. [Google Scholar] [CrossRef]
  25. Li, Z.; Liu, Z.; Lei, Z.; Zhu, P. An Innovative Computational Framework for the Analysis of Complex Mechanical Behaviors of Short Fiber Reinforced Polymer Composites. Compos. Struct. 2021, 277, 114594. [Google Scholar] [CrossRef]
  26. Lamon, J.; R’Mili, M. Investigation of Flaw Strength Distributions from Tensile Force-Strain Curves of Fiber Tows. Compos. Part A Appl. Sci. Manuf. 2021, 145, 106262. [Google Scholar] [CrossRef]
  27. Wang, J.; Zhou, H.; Liu, Z.; Peng, X.; Zhou, H. Statistical Modelling of Tensile Properties of Natural Fiber Yarns Considering Probability Distributions of Fiber Crimping and Effective Yarn Elastic Modulus. Compos. Sci. Technol. 2022, 218, 109142. [Google Scholar] [CrossRef]
  28. Wang, Y.; Jiao, Y.; Wu, N.; Xie, J.; Chen, L.; Wang, P. An Efficient Virtual Modeling Regard to the Axial Tensile and Transverse Compressive Behaviors of the Twisted Yarns. J. Ind. Text. 2022, 52, 15280837221137352. [Google Scholar] [CrossRef]
  29. Wu, N.; Xie, X.; Yang, J.; Feng, Y.; Jiao, Y.; Chen, L.; Xu, J.; Jian, X. Effect of Normal Load on the Frictional and Wear Behaviour of Carbon Fiber in Tow-on-Tool Contact during Three-Dimensional Weaving Process. J. Ind. Text. 2020, 51, 152808372094461. [Google Scholar] [CrossRef]
  30. Wu, N.; Li, S.; Han, M.; Zhu, C.; Jiao, Y.; Chen, L. Experimental Simulation of Bending Damage of Silicon Nitride Yarn during 3D Orthogonal Fabric Forming Process. J. Ind. Text. 2021, 51, 152808372110106. [Google Scholar] [CrossRef]
  31. Ismail, N.; Vries, E.G.D.; Rooij, M.B.D.; Zini, N.H.M.; Schipper, D.J. An Experimental Study of Friction in Fibre-Fibre Contacts. IJMPT 2016, 53, 240. [Google Scholar] [CrossRef]
  32. Weibull, W. A Statistical Theory of the Strength of Materials. J. Appl. Mech. 1939, 9, 293–297. [Google Scholar]
  33. Zhou, W.; Wang, H.; Chen, Y.; Wang, Y. A Methodology to Obtain the Accurate RVEs by a Multiscale Numerical Simulation of the 3D Braiding Process. Polymers 2022, 14, 4210. [Google Scholar] [CrossRef] [PubMed]
  34. Wang, J.; Zhou, H.; Ouyang, Z.; Peng, X.; Zhou, H. A Mesoscale Tensile Model for Woven Fabrics Based on Timoshenko Beam Theory. Text. Res. J. 2022, 93, 00405175221117616. [Google Scholar] [CrossRef]
  35. Chen, Z.; Wang, B.; Pan, S.; Fang, G.; Meng, S.; Zhou, Z.; Zhu, J. Damage Analysis of Shear Pre-Deformed 3D Angle-Interlock Woven Composites Using Experiment and Non-Orthogonal Finite Element Model. Compos. Commun. 2021, 28, 100978. [Google Scholar] [CrossRef]
  36. Hemmer, J.; Lectez, A.-S.; Verron, E.; Lebrun, J.-M.; Binetruy, C.; Comas-Cardona, S. Influence of the Lateral Confinement on the Transverse Mechanical Behavior of Tows and Quasi-Unidirectional Fabrics: Experimental and Modeling Investigations of Dry through-Thickness Compaction. J. Compos. Mater. 2020, 54, 3261–3274. [Google Scholar] [CrossRef]
  37. Tourlonias, M.; Bueno, M.-A.; Poquillon, D. Friction of Carbon Tows and Fine Single Fibres. Compos. Part A Appl. Sci. Manuf. 2017, 98, 116–123. [Google Scholar] [CrossRef] [Green Version]
  38. Mulvihill, D.M.; Sutcliffe, M.P.F. Effect of Tool Surface Topography on Friction with Carbon Fibre Tows for Composite Fabric Forming. Compos. Part A Appl. Sci. Manuf. 2017, 93, 199–206. [Google Scholar] [CrossRef]
Figure 1. The picture of the bending test setup developed in the laboratory.
Textiles 03 00010 g001
Figure 2. Experimental method for extracting realistic contact surface of the yarn.
Textiles 03 00010 g002
Figure 3. The 3D segmented clockwise twisted yarns. (Note: the gray is a cross-section of yarn, and the green is a cross-section of fiber).
Textiles 03 00010 g003
Figure 4. Flow chart for mechanical properties prediction of yarns.
Textiles 03 00010 g004
Figure 5. The bending simulation of the yarn: (a) boundary condition and (b) simulation result.
Textiles 03 00010 g005
Figure 6. Comparison of experimental and simulation results of yarn bending behavior: (a) bending load–deflection curve, (b) resulting values of EIyarn and Ar (taking carbon fiber yarn as an example).
Textiles 03 00010 g006
Figure 7. Prediction of the geometric model with different twist levels: (a) 50 tpm; (b) 80 tpm; (c) 100 tpm; (d) 150 tpm; and (e) 200 tpm.
Textiles 03 00010 g007
Figure 8. Prediction of bending behavior of twisted yarn: (a) curve of deflection and bending load, (b) realistic contact area and bending stiffness for different twisted yarns at a deflection of 3 mm.
Textiles 03 00010 g008
Figure 9. The prediction of the geometric model with the different number of plies: (a) 1 ply; (b) 2 plies; (c) 3 plies; (d) 6 plies; and (e) 10 plies.
Textiles 03 00010 g009
Figure 10. Prediction of bending behavior of plied yarn: (a) curve of deflection and bending load, (b) realistic contact area and bending stiffness at a deflection of 3 mm.
Textiles 03 00010 g010
Table 1. Material properties of investigated samples given by the manufacturers.
Yarn and Fiber TypeDensity (g/cm3)Tex (g/1000 m)Twist Level
(tpm)
Radius of Fiber (μm)
Carbon fiber yarn1.9121805.0
Alumina fiber yarn2.883301707.0
Quartz fiber yarn2.20190807.5
Disclaimer/Publisher’s Note: The statements, opinions and data contained in all publications are solely those of the individual author(s) and contributor(s) and not of MDPI and/or the editor(s). MDPI and/or the editor(s) disclaim responsibility for any injury to people or property resulting from any ideas, methods, instructions or products referred to in the content.

