1. Introduction
Characterization of the catalysts before the reaction and especially in situ characterization is of extreme importance in heterogeneous catalysis [
1,
2,
3,
4]. Detailed knowledge of the catalyst’s behavior under the same conditions of reaction and with the correct adjustments to the reaction conditions as a way to elongate the catalyst’s active lifetime can be obtained from in situ characterization. Sintering of active species as well as carbon deposition are the main causes of catalytic deactivation [
5,
6,
7] and they are good examples of where this type of characterization would be necessary to obtain more information about the catalytic process. Hence, in situ characterization before and after reaction is the key procedure for carrying out a successful catalytic process. In previous work, we presented the need to characterize the catalysts used in the Fischer–Tropsch reaction under the same reaction conditions [
8]. In the current work, a system is applied that allows these characterizations to be carried out without having to remove the catalyst from the reactor and expose it to the environmental conditions of the laboratory, and especially saving time having to remove the catalyst from the reactor and take it to another device for characterization.
The In Situ Catalyst Characterization System (ICCS) developed by Micromeritics [
9] is a new instrument that complements any dynamic laboratory reactor system by bringing new capabilities to catalyst researchers. It adds two key characterization techniques to the functionality of an existing reaction system—Temperature Programmed Analyses (temperature programmed reduction (TPR) and temperature programmed desorption (TPD)) and Pulse Chemisorption—in order to determine the number of active sites in the reaction, as well as their dispersion on the support. These well-known and time-tested techniques may now be performed on a fresh catalyst and then repeated on a spent catalyst. Users benefit from obtaining both temperature programmed chemical analyses (in general denoted as TPX) and pulse chemisorption data for the same sample used for reaction studies. Performing these analyses in situ virtually eliminates the possibility of contamination from atmospheric gases or moisture which may damage the active catalyst and undermine the relevance of post-reaction characterization data. The ICCS connects to an external reactor that provides a programmable oven; the PID-Micromeritics FR-100 micro-reactor is included in
Figure 1 and
Figure 2. The ICCS is then used to carry out the TPX analyses at 1 bar.
As an application example, two Ni/support catalysts used in the CO
2 hydrogenation reaction were selected. This reaction is one of the most studied thermal catalytic CO
2 conversions taking place at relatively low temperatures to produce CO, methane, and methanol, among others [
10,
11]. The Ni based catalysts have been reported as the most efficient and active catalytic systems together with alumina as a support [
12]. Nickel catalysts have a short lifetime due to sintering of Ni particles, Ni(CO)
4 formation, coke deposition, and sulfur poisoning [
13,
14]. It is necessary to improve the design of the catalyst and, therefore, it is necessary to obtain more information on the performance of the catalysts under reaction conditions and without altering the working atmosphere. In such a case, an in situ characterization may be the best alternative to improve the performance of these catalytic systems.
2. Experimental Procedure
In this work, the ICCS was connected to a microreactor FR-100 from PID-Micromeritics [
15] (see
Figure 2). A mass spectrometer was also connected to the exhaust of the FR reactor to carry out the up-to-date process of reduction of CO
2 to produce methane [
16,
17,
18,
19,
20] and other higher chains of hydrocarbon molecules following the below reactions [
21,
22,
23,
24,
25,
26,
27,
28,
29,
30,
31,
32,
33,
34,
35,
36,
37]:
To elucidate the effectiveness of such important tools (a combination of ICCS and the mass spectrometer) for this study, two series of Ni-supported catalysts with about 5 wt.% of metal were prepared using the classical impregnation method. The supports used were an alumina trilobe (high specific surface area material, 310 m
2/g) and an alumina tablet (low specific surface area material, 92 m
2/g); both aluminas were from Grace Davison Co. 1989. Equivalent amounts of nickel nitrate (Ni(NO
3)
2·6H
2O from Aldrich) were considered for the preparation of the catalysts. The difference in the supports’ surface areas was thought to have a direct impact on the dispersion of the active species. Each alumina was first dried under a vacuum for 12 h and was then poured into the nickel solution that was prepared to have an approximate amount of 5% NiO. The mixture was stirred at ambient temperature until no more liquid was left over the solid. The freshly prepared catalysts were washed with DI water. The washing liquid was a rather pale green, which indicated that all the NiO immigrated within the pores. The precursor catalysts were dried and calcined at 500 °C for 12 h with a minimum ramping rate (2 °C/min). The final approximate loading on NiO was determined by using the ICCS system and performing TPR analyses, with TPR being a bulk analysis that reduced all NiO present in the catalysts. The amounts of consumed H
2 were 297 and 293 cm
3/g, respectively, and were very close to the theoretical value for 1 g of pure NiO that consumes 300 cm
3/g of H
2 for its complete reduction to nickel metal (see Equation (6)). It was concluded from these first results that almost all NiO present in the catalysts was reduced and found to be about 5 wt.% approximately for both catalysts.
Water as a product of the reduction was trapped by the automatic cold trap provided by ICCS where the temperature was set to −12 °C to prevent the TCD signal from being disturbed. The produced peaks over a stable TCD base line were used to quantify the amount of H2 consumed by the oxide particles present in the catalysts.
3. Results and Discussion
3.1. Characterization of the Supports
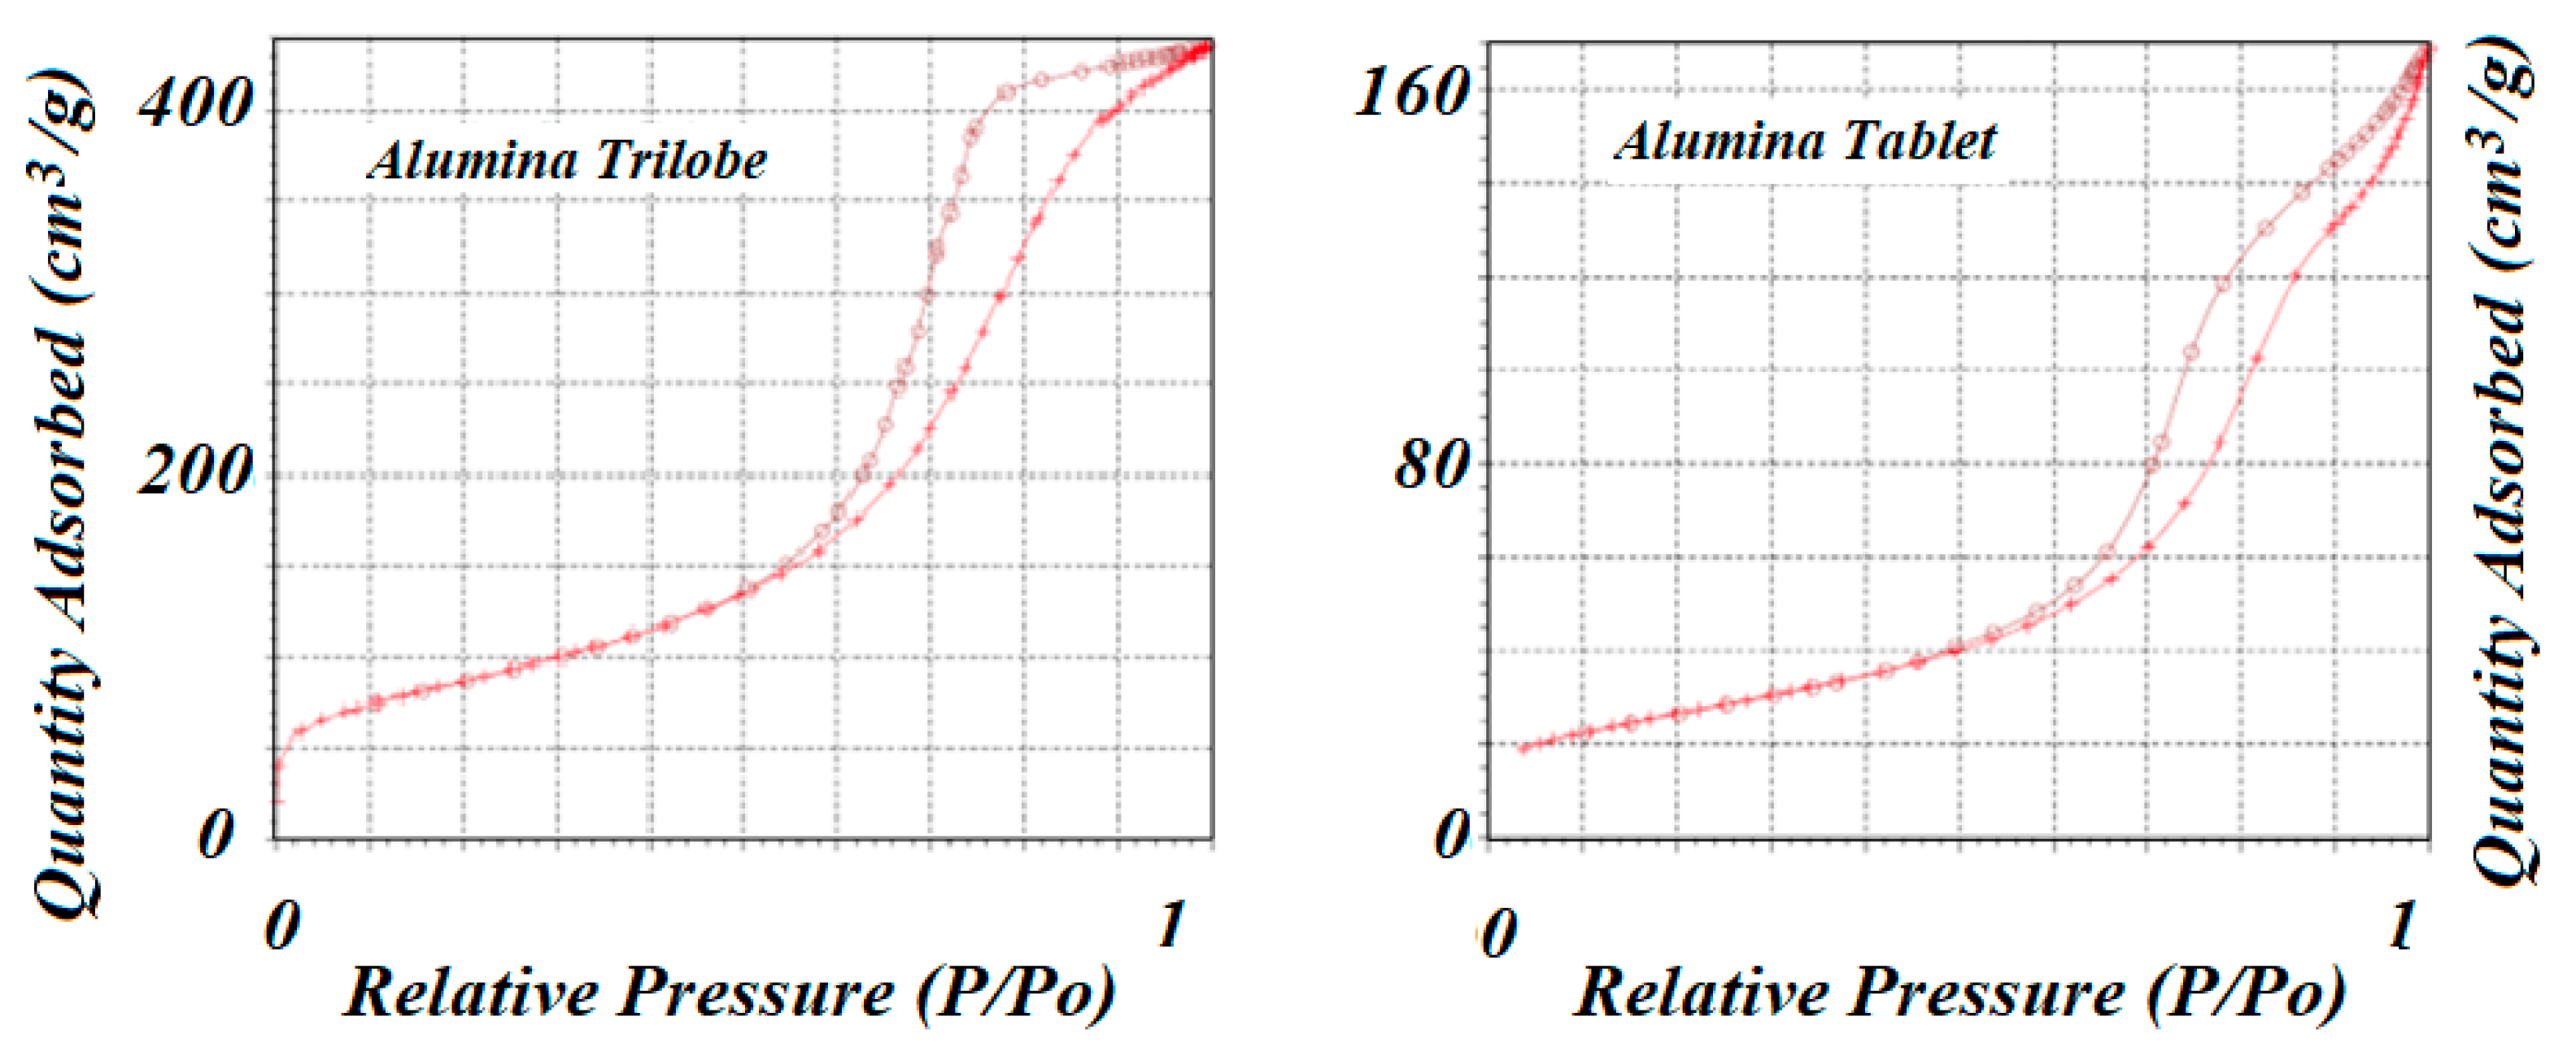
The two supports used to prepare the catalysts were alumina trilobe and alumina tablet. Surface area and pore volume distribution were determined by experimental adsorption of N
2 at −196 °C using the Micromeritics 3Flex instrument. Results are shown in
Figure 3 for both supports. In both cases, the adsorption isotherms corresponded to type IV according to the IUPAC classification that corresponds to mesoporous materials. Alumina trilobe, however, showed a larger amount of N
2 adsorbed than the alumina tablet, and that could be related to a higher number of pores as shown in
Table 1 for the total pore volume (V
pT). The desorption of N
2 at the same temperature of the adsorption process did not coincide and produced the formation of two hysteresis loops: H1 type in the case of alumina trilobe that was related to a narrow range of uniform mesopores, and H3 type in the case of alumina tablet that was related to pores within the aggregation of plate-like particles [
38].
3.2. Characterization of the Catalysts by the ICCS
3.2.1. Temperature Programmed Reduction (TPR)
TPR was used to determine the reduction profile of the catalysts and verify the correct reduction temperature for each of the reducible species. This technique also confirmed the amount of H
2 being consumed, which corresponded to the amount of reducible species present in the catalysts. Approximately 0.50 g of the sample was placed in a quartz reactor and heated up to 950 °C with a ramp of 10 °C/min in the presence of a flow of 100 cm
3/min of a 10% H
2-Argon mixture. Results are shown in
Figure 4 and
Figure 5 for the high surface area and for the low surface area catalysts, respectively.
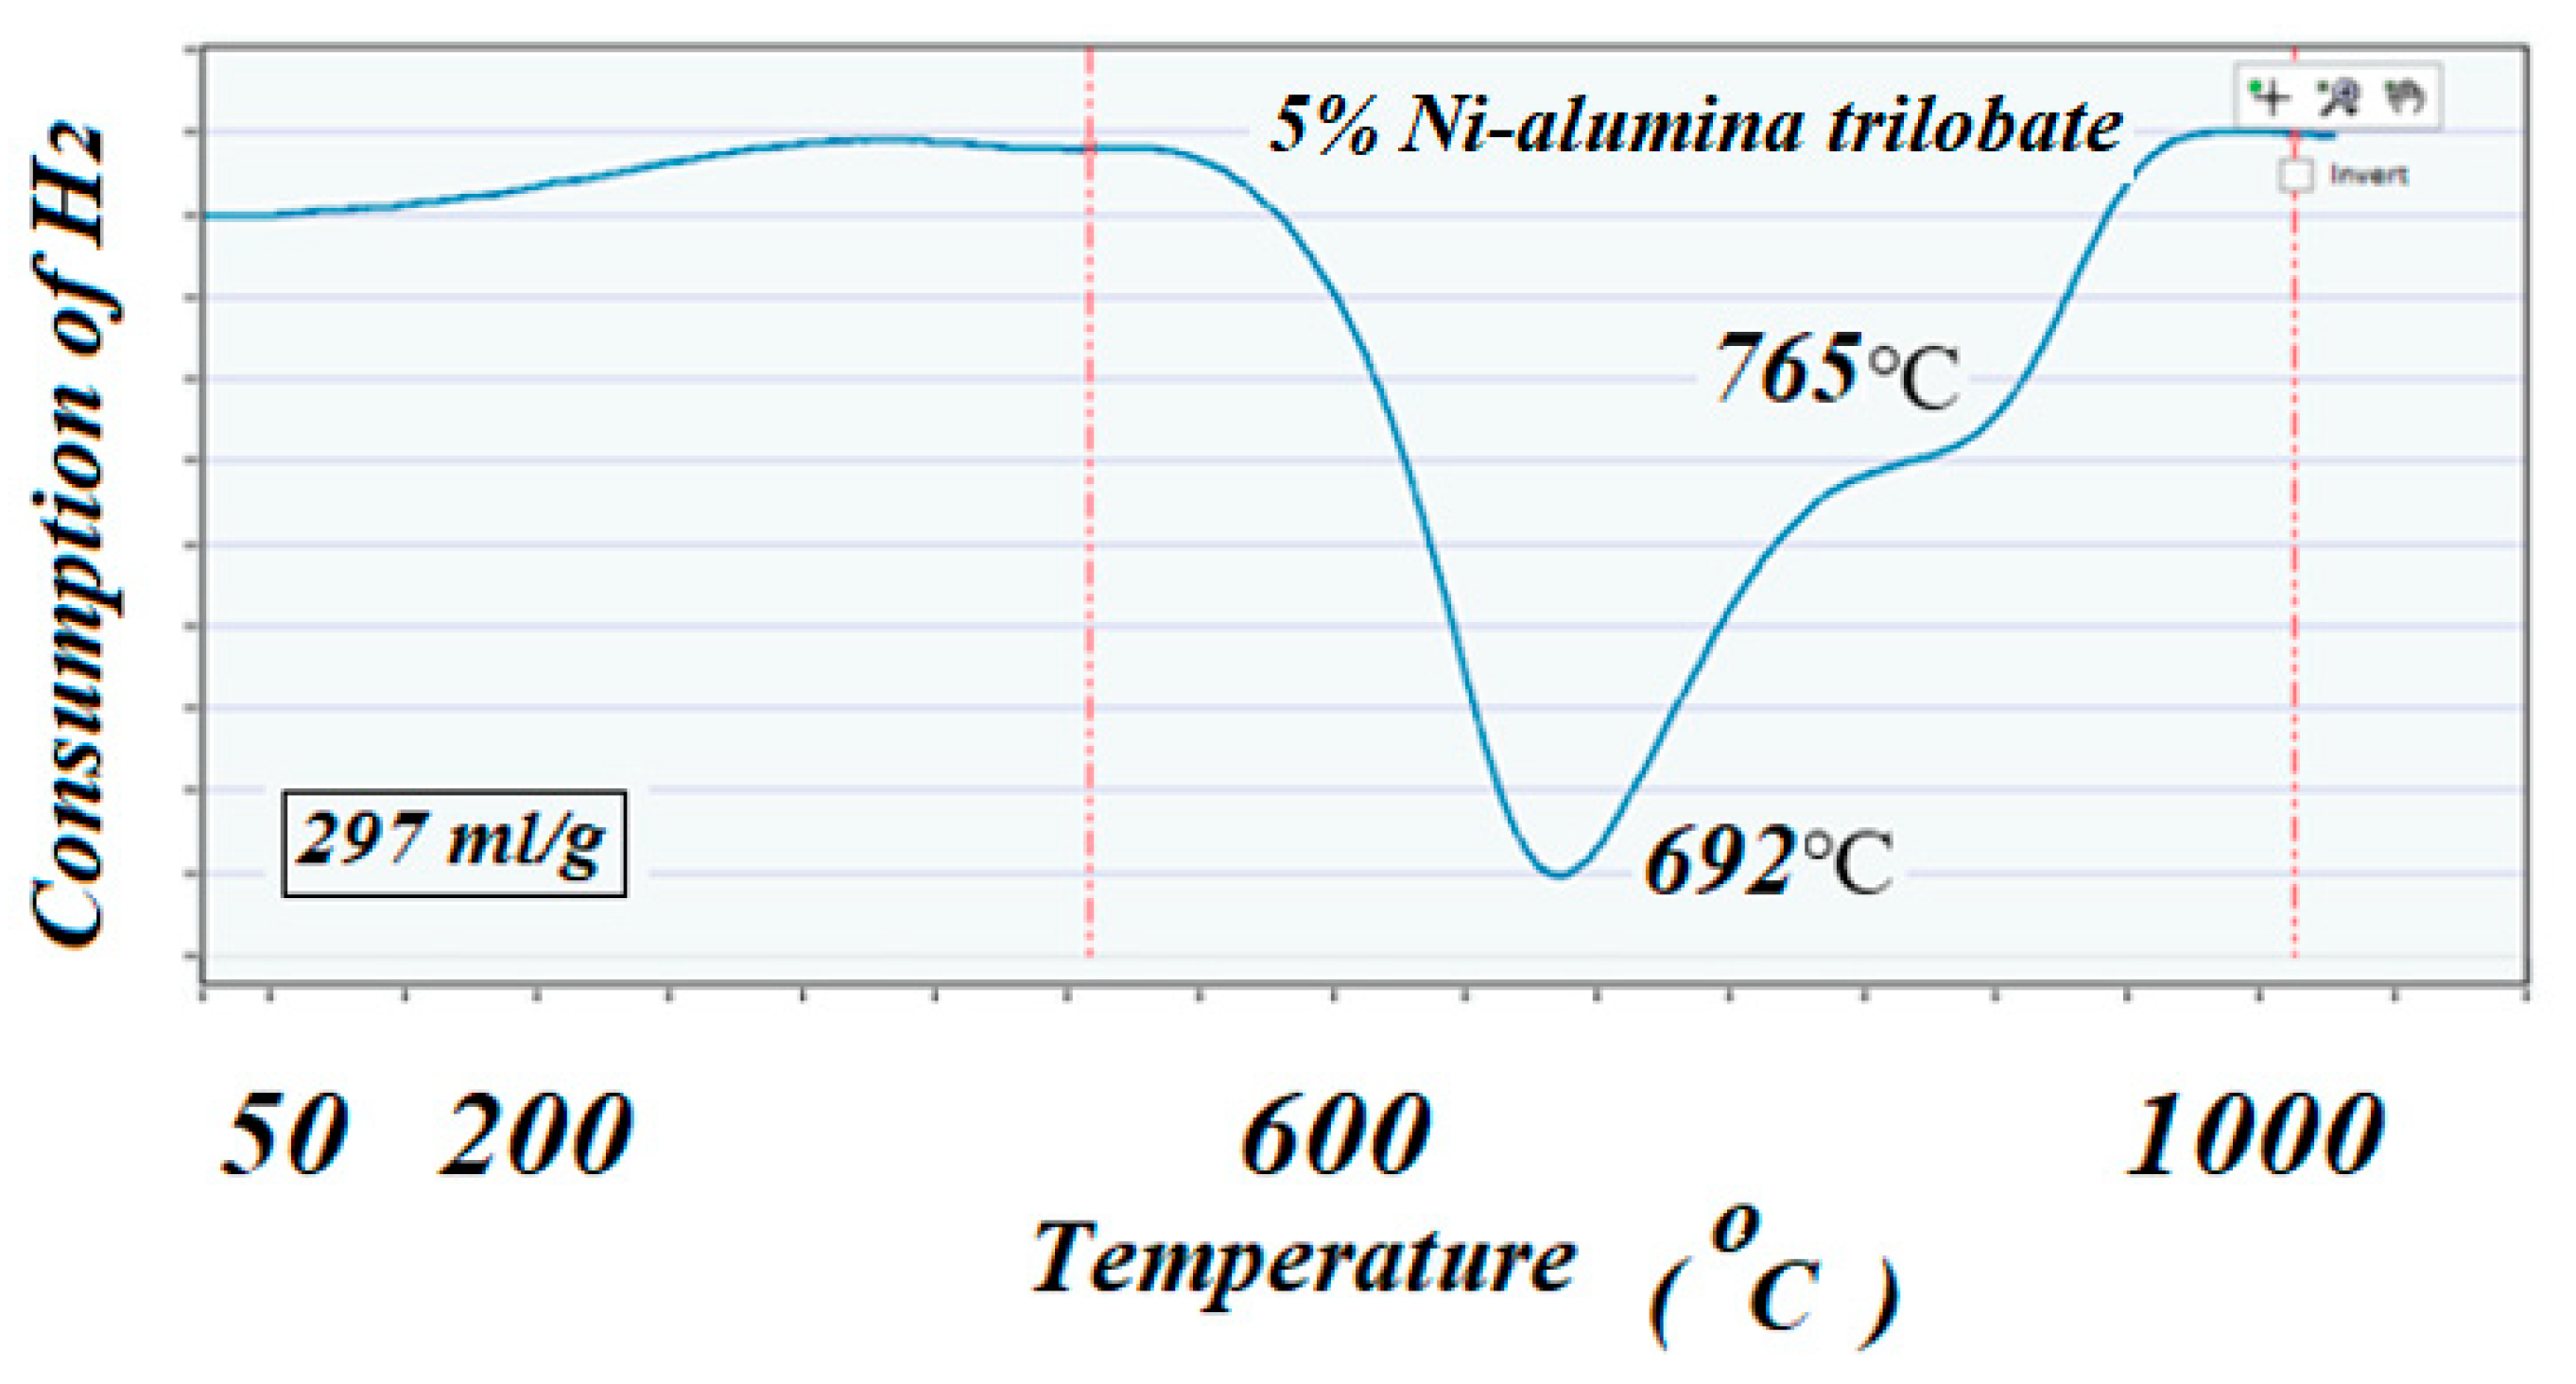
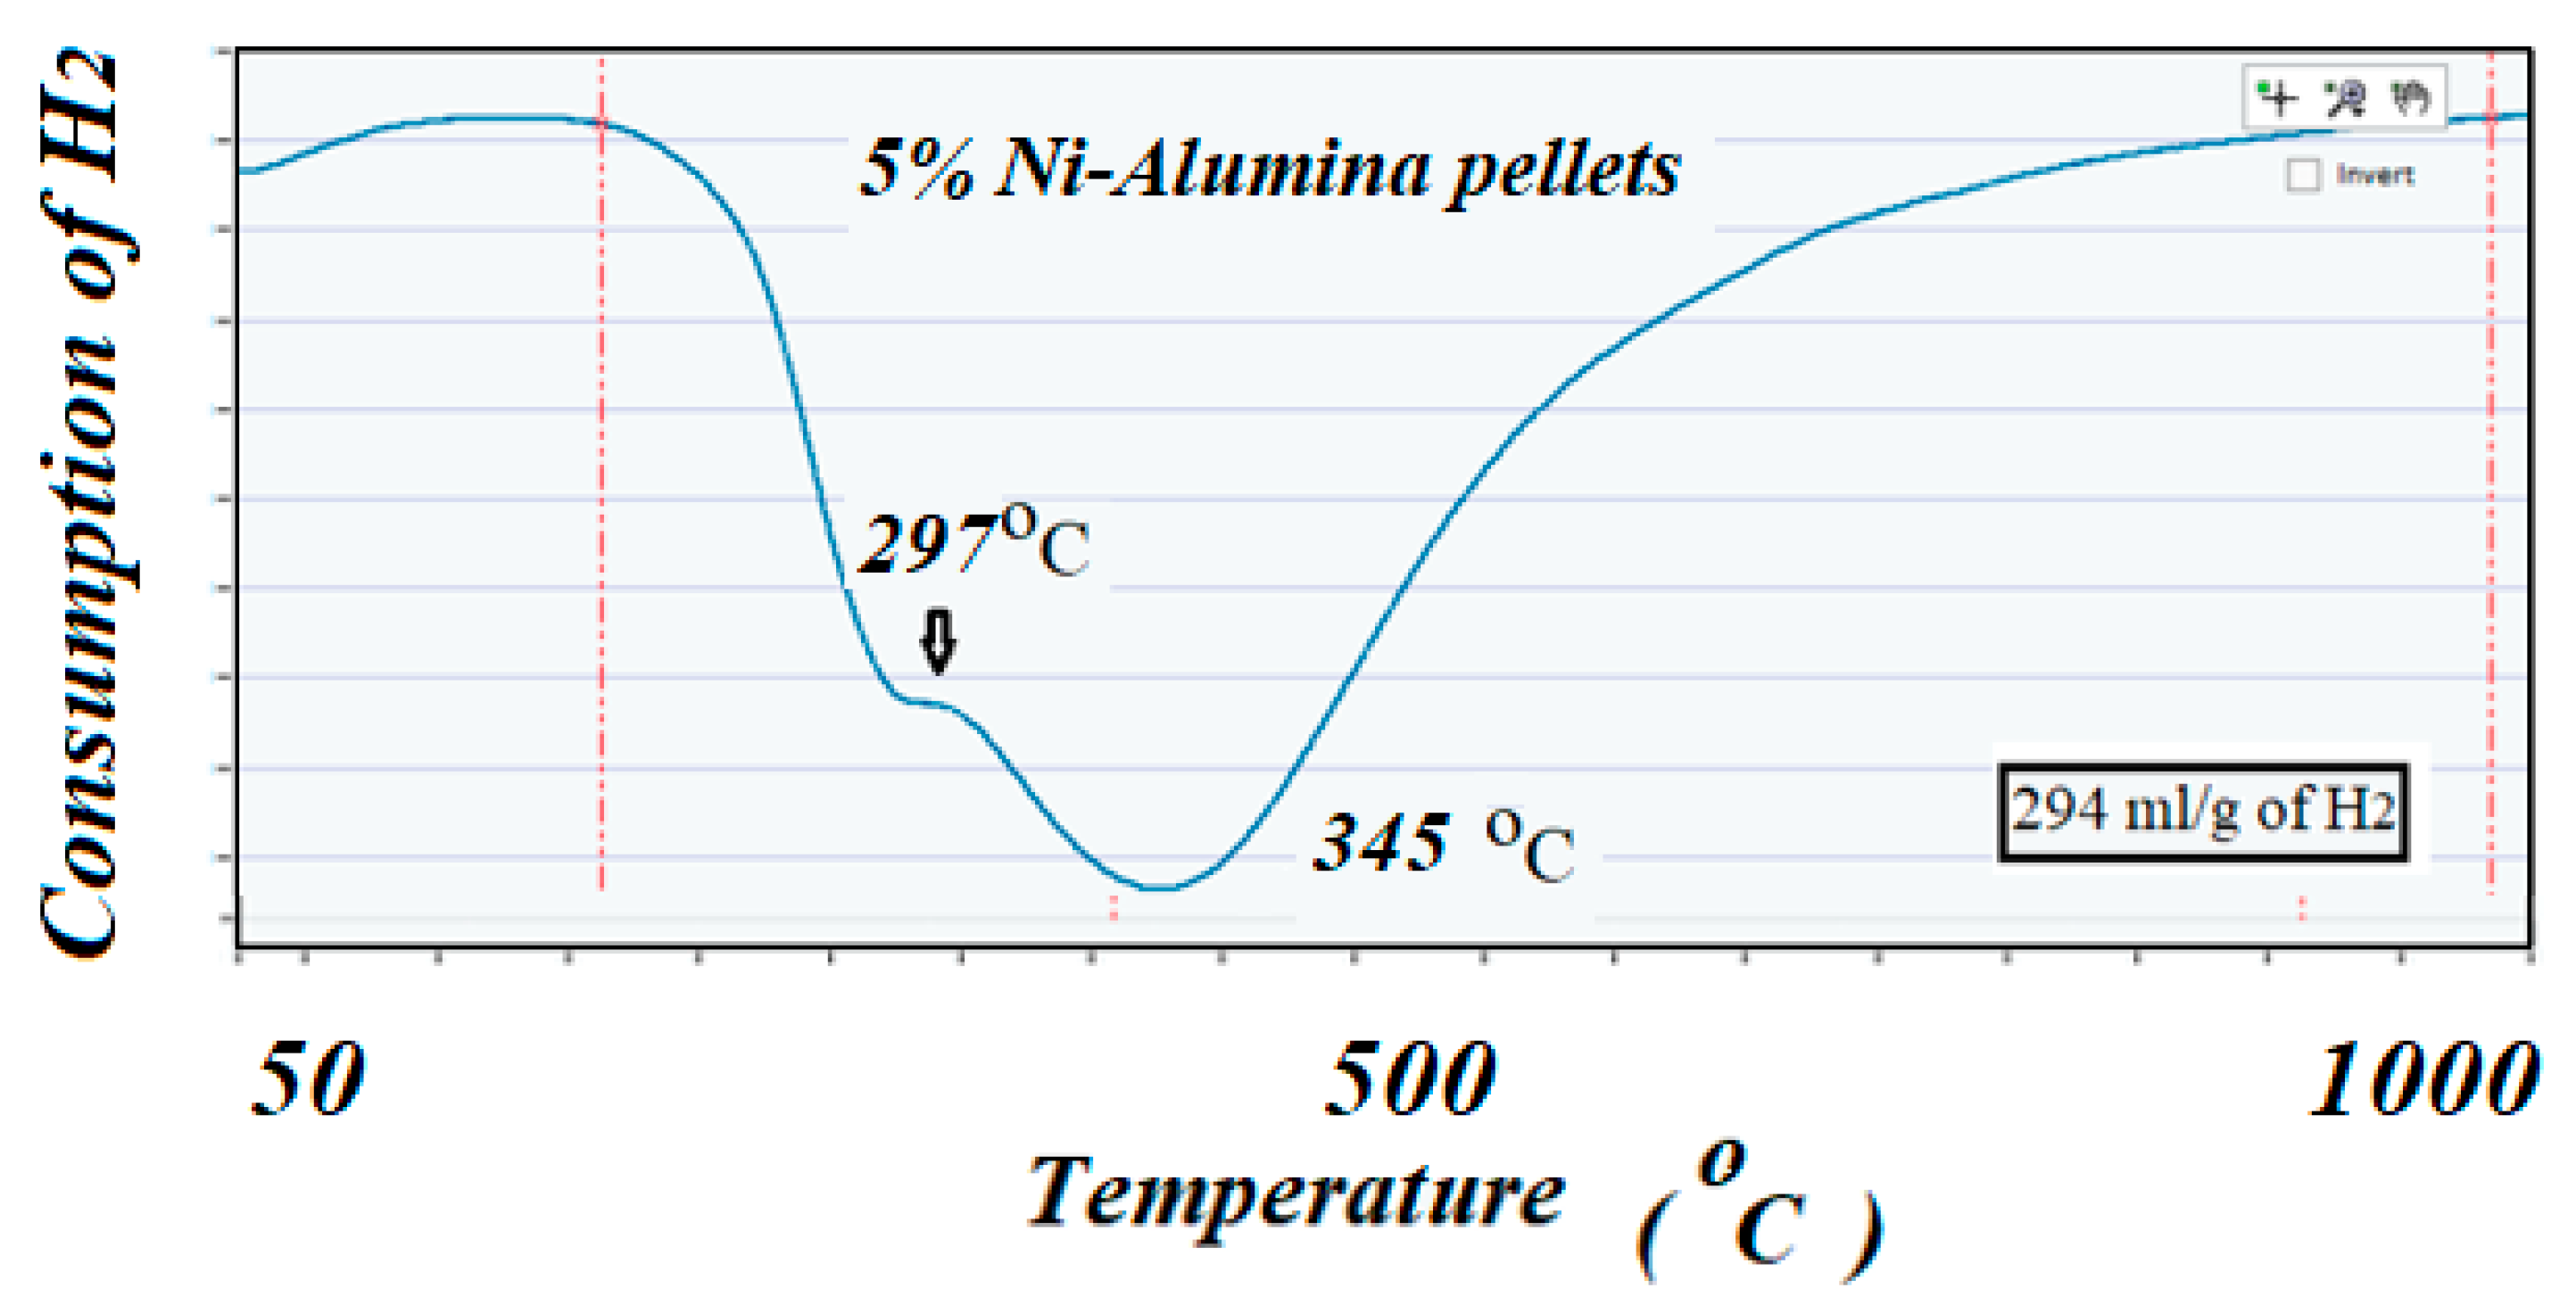
The ICCS can precisely detect, elucidate, and quantify the amount of H
2 consumed during the reduction reaction. Profiles of TPR on the two catalysts showed different behaviors; the catalyst with high surface area support showed mainly two well identified peaks at 635 and 725 °C, while the catalyst with low surface area support showed lower reduction peaks, 297 and 345 °C, respectively. The amount of H
2 consumed in these two TPR experiments (close to a 300 cm
3/g theoretical value for consumption of H
2 by 1 g of pure NiO) suggested that all the used NiO that was deposited on the supports remained in the catalysts with no apparent reaction with the alumina to produce the unreducible spinels NiAl
2O
4. These results could well indicate the role of the support in interacting and stabilizing the metal active particles on the surface [
39,
40,
41]. In the same way, the high dispersion of the active particles exhibited by the high surface area catalyst justified the higher performance of the catalyst to produce CH
4, as can be seen below.
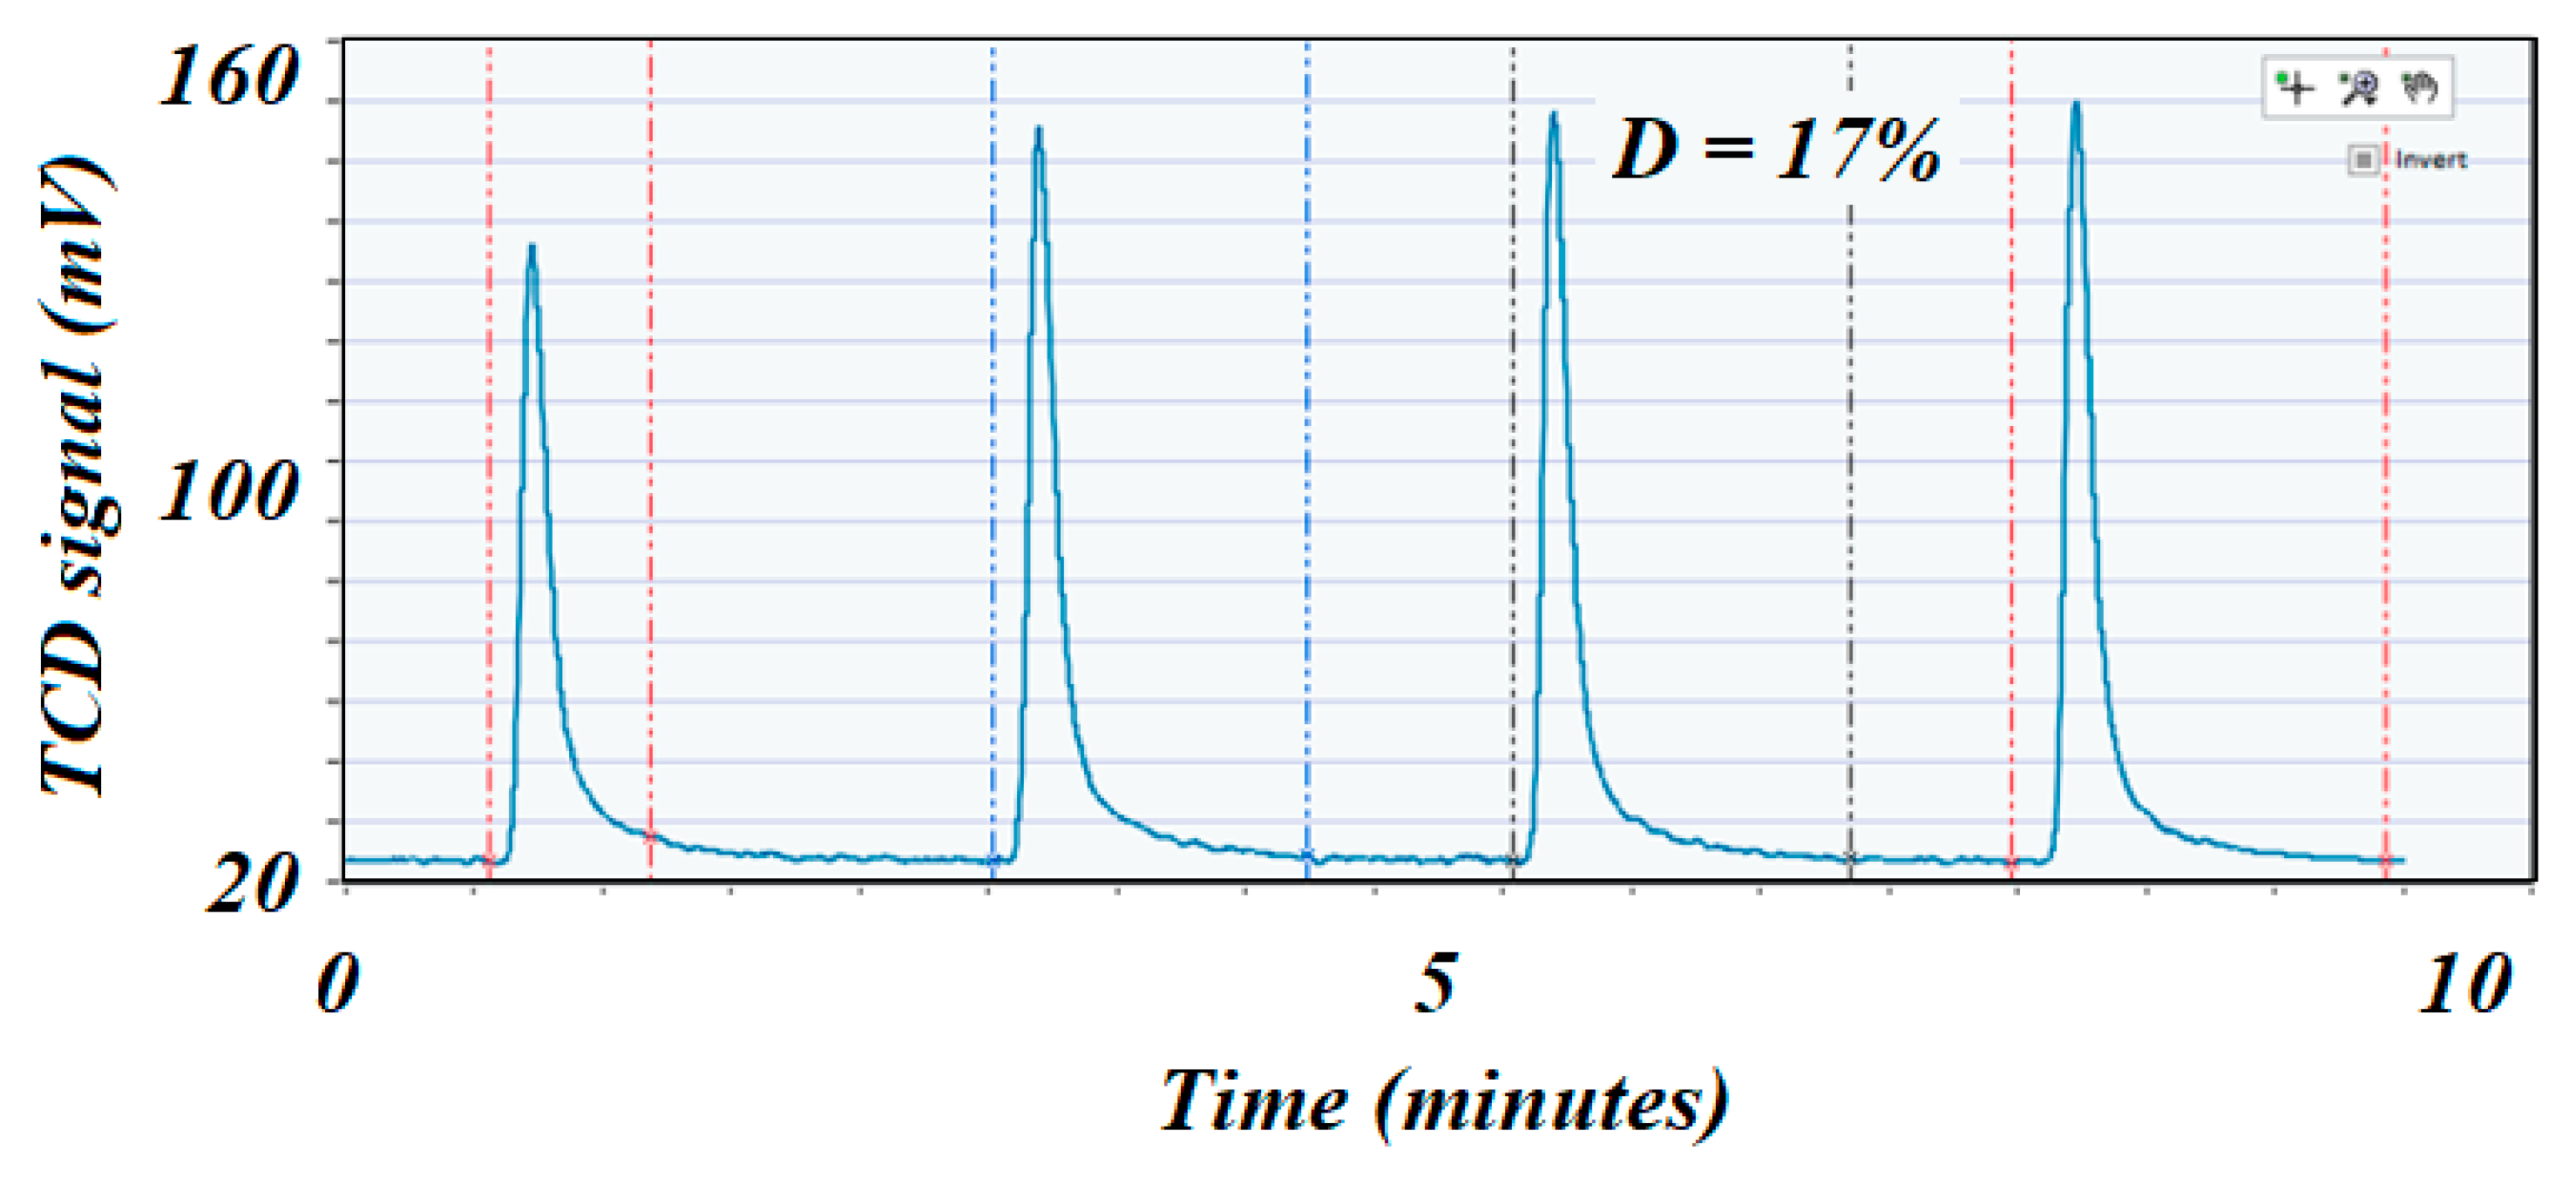
3.2.2. Pulse Chemisorption of H2
The ICCS performed pulse chemisorption by using a pre-calibrated loop of about 0.5 cm
3 up to 20 bar of pressure. The analysis was carried out at 35 °C at 1 bar and was used before and after the reaction to determine dispersion. Thus, comparing dispersion values before and after reduction would indicate sintering if the post-reaction value had depleted, which was one of the deactivation phenomena of the catalyst. Dispersion was determined according to Equation (7) and highly depended on the amount of H
2 adsorbed. For this test, catalysts were reduced at 500 °C for 4 h and 20 bar of pressure and monitored using the TCD signal of the ICCS to ensure complete reduction of the catalyst. It was found that after 4 h of reduction, the TCD signal returned to base line, indicating the maximum amount of NiO that could be reduced in these conditions. Upon completion of the reduction, the catalysts were flushed with pure Ar for 1 h at the reduction temperature to ensure a complete removal of any H
2 that could have been left after reduction. The temperature was then brought down to 35 °C and pulses of 10% H
2-Ar were admitted to the sample until similar peaks were detected and quantified by the TCD, indicating saturation. The results are shown in
Figure 6 and
Figure 7, respectively.
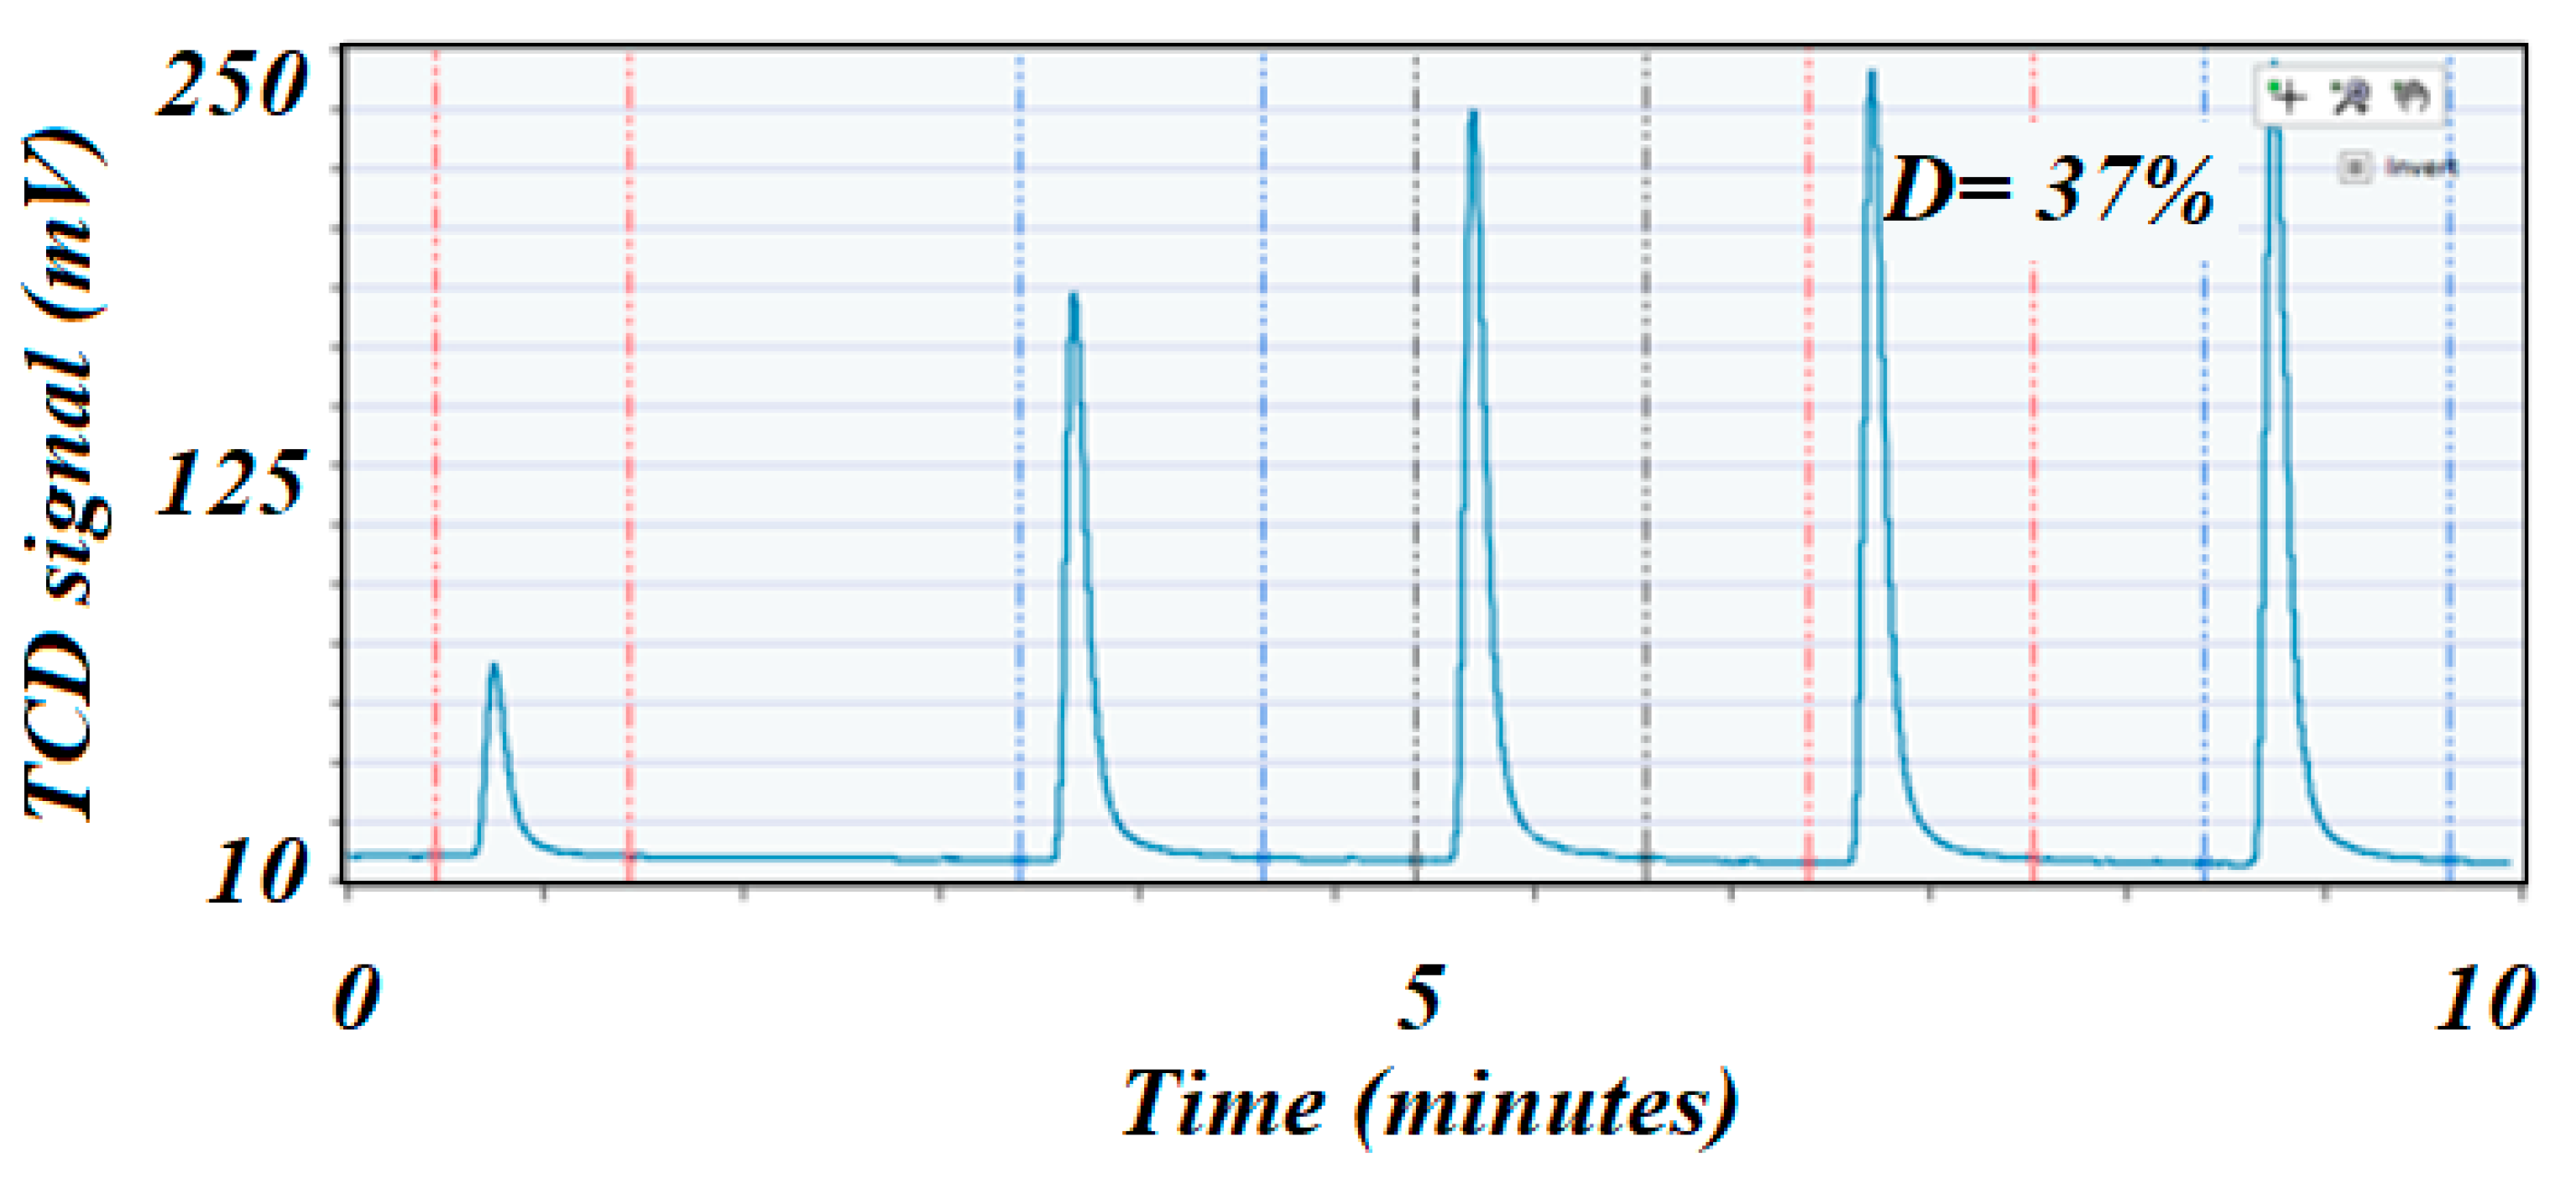
The H
2 chemisorption on nickel was the most advisable technique to determine dispersion of the active species due to the affinity of nickel to adsorb H
2 [
42], and hence was widely used in the hydrogenation processes. The high surface area catalyst exhibited the higher dispersion (37% vs. 17%), although both catalysts had similar loading on Ni. This phenomenon was due to the fact that a higher surface area support would better disperse the active elements, while a lower surface area support tended to allow agglomeration (large particles) that dramatically reduced dispersion and, therefore, showed lower catalytic performance for any type of reaction. Dispersion was usually considered to be directly related to the performance of the catalyst. The metal dispersion was determined from the amount of H
2 consumed when applying the pulse chemisorption technique from Equation (7) [
42]:
where
VH2 is the chemisorbed monolayer volume (cm
3(STP)/g),
Xm is the average stoichiometric factor,
MatomMetal is the atomic weight of Ni (g/mole),
Vmol is the molar volume of H
2 (22,414 cm
3 occupied by one mol of gas at STP conditions), and
%metal is the metal content.
3.3. Catalytic Tests
Approximately 0.5 g of the catalyst was taken for all tests and was placed in a 9 mm ID SS tubular fixed bed reactor. The catalyst was reduced with pure H
2, and the temperature was ramped at a rate of 10 °C/min up to 500 °C and kept for 6 h at 20 bar. These reduction conditions were selected rather than a high reduction temperature to minimize sintering of the active species. After reduction, the reactor temperature was brought down to 30 °C prior to flowing the active gases for the reaction. A combination of 50 cm
3/min of CO
2 and 200 cm
3/min of H
2 was pre-mixed before being passed through the catalyst bed at room temperature. The pressure in the system was set to 20 bar. The reactor temperature was then raised to 600 °C at a rate of 2 °C/min and set at this temperature for 24 h. The mass spectrometer (Cirrus MKS) [
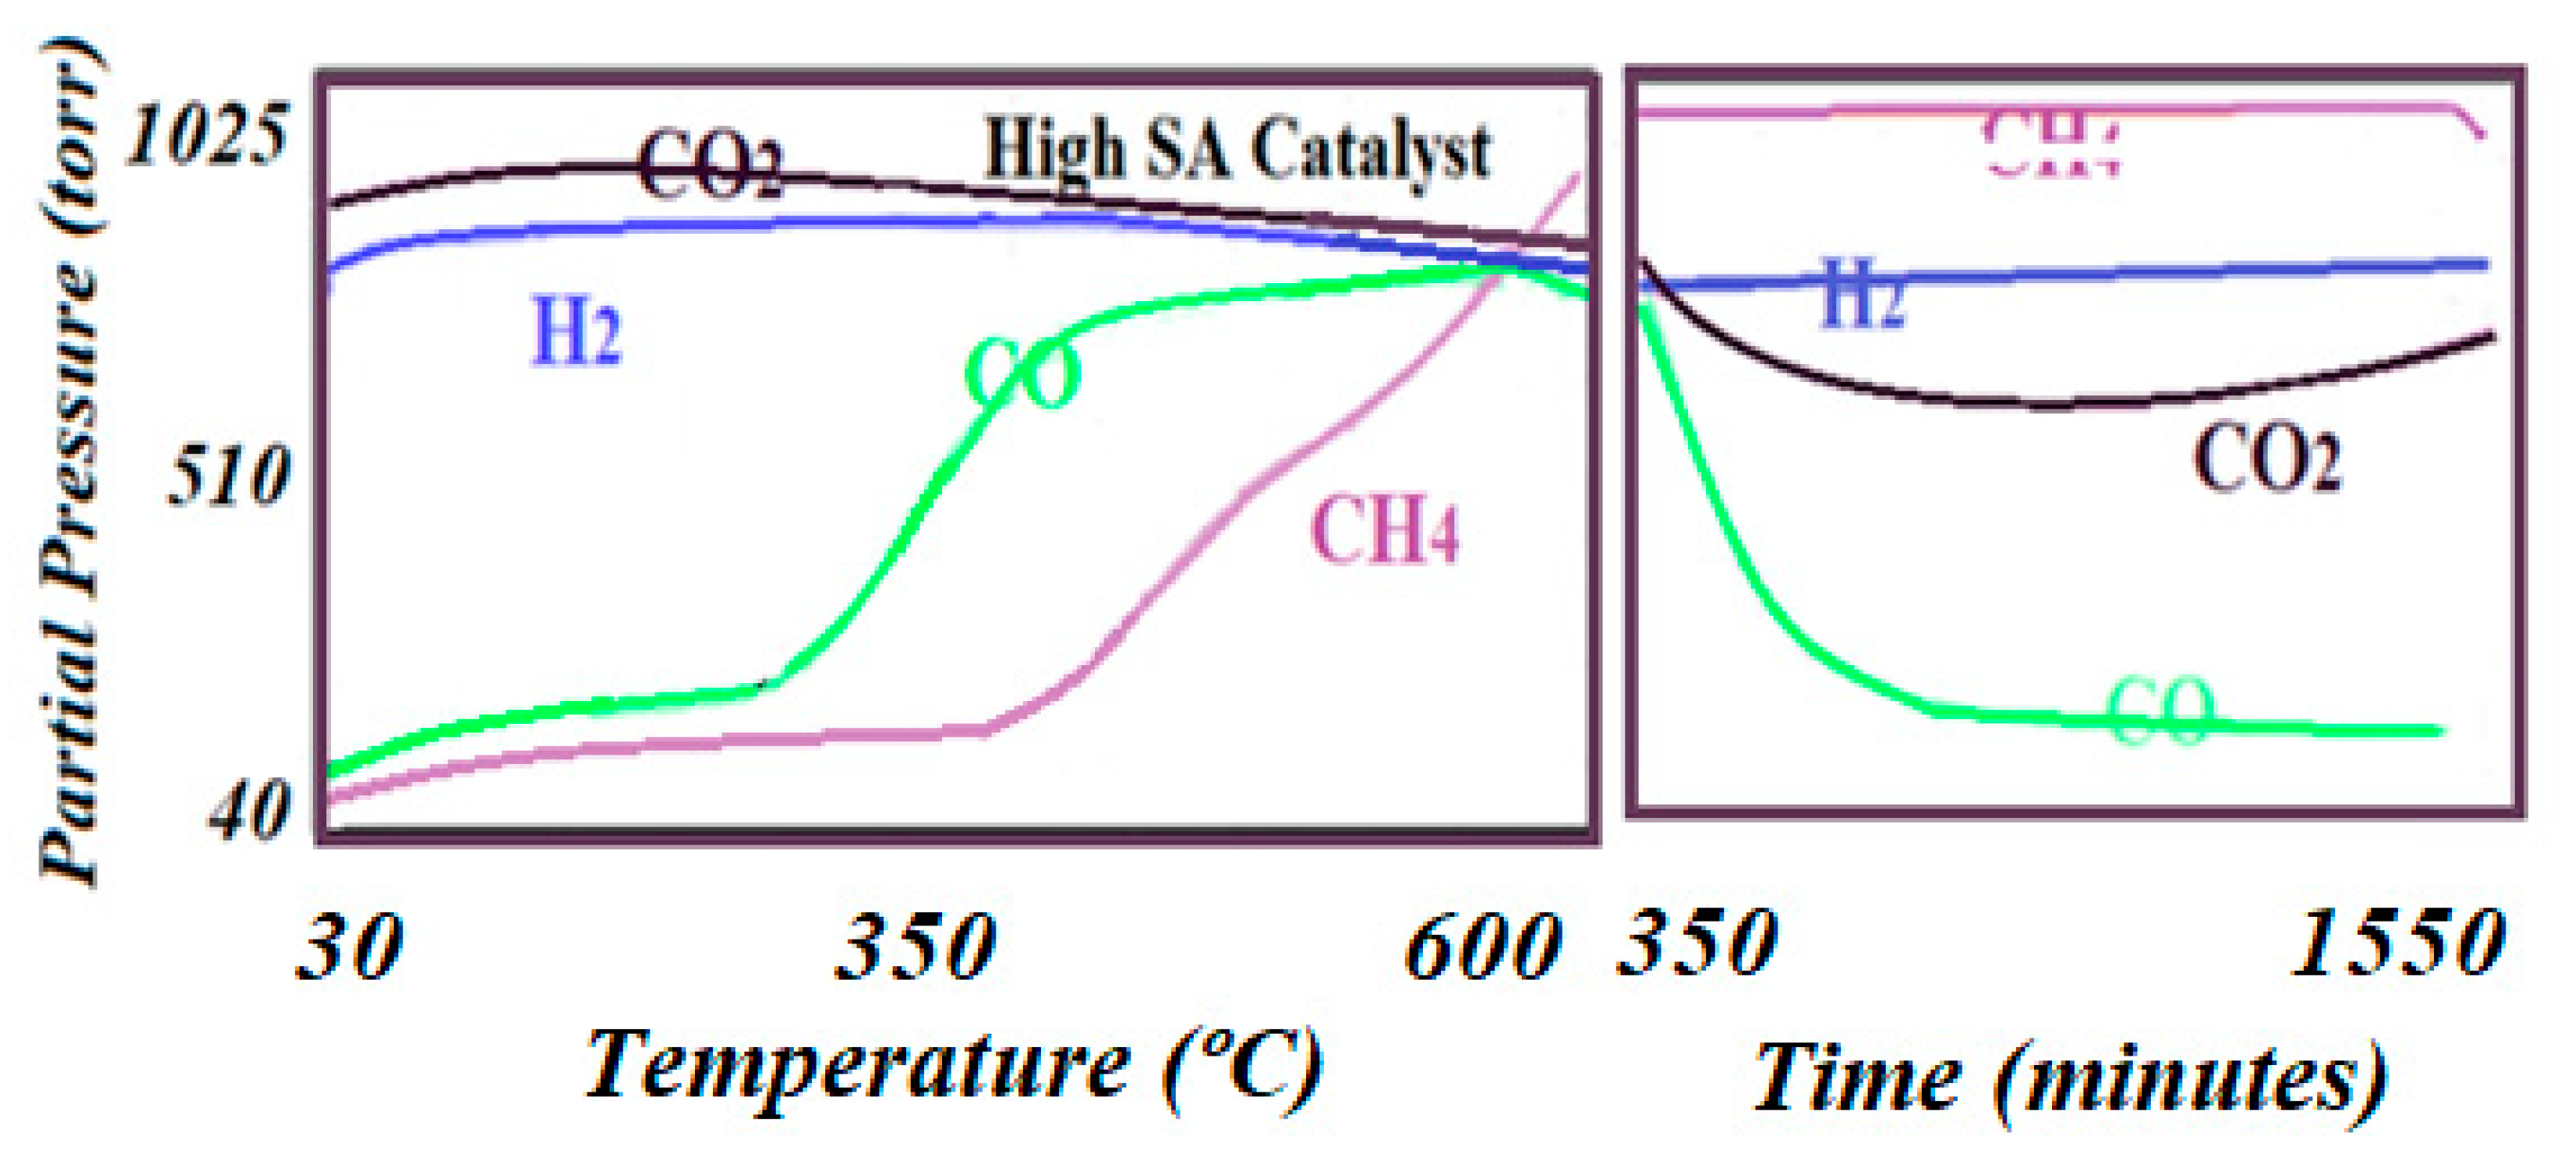
43] was connected to the exhaust of the reactor and served to online monitor the signals for both the flowing mixture as well as for the expected products. This latest method allowed the step-by-step identification of the newly produced products under the reaction conditions of temperature and pressure. It was found that the catalyst that had the higher specific surface area produced a higher conversion of CO
2 into CH
4 and other products. Furthermore, the high specific surface area catalyst showed a longer active life and less deactivation after 24 h of testing at 20 bar than the low specific surface area catalyst (see
Figure 8 and
Figure 9).
The testing and monitoring of the production in this work was completed using a rather innovative method. Experiments started from room temperature and then were slowly raised at a rate of 2 °C/min up to 600 °C and set for 24 h. This procedure helped to identify the steps that the reaction could undergo and the temperature at which every product could be produced as the reaction advanced (see
Figure 8 and
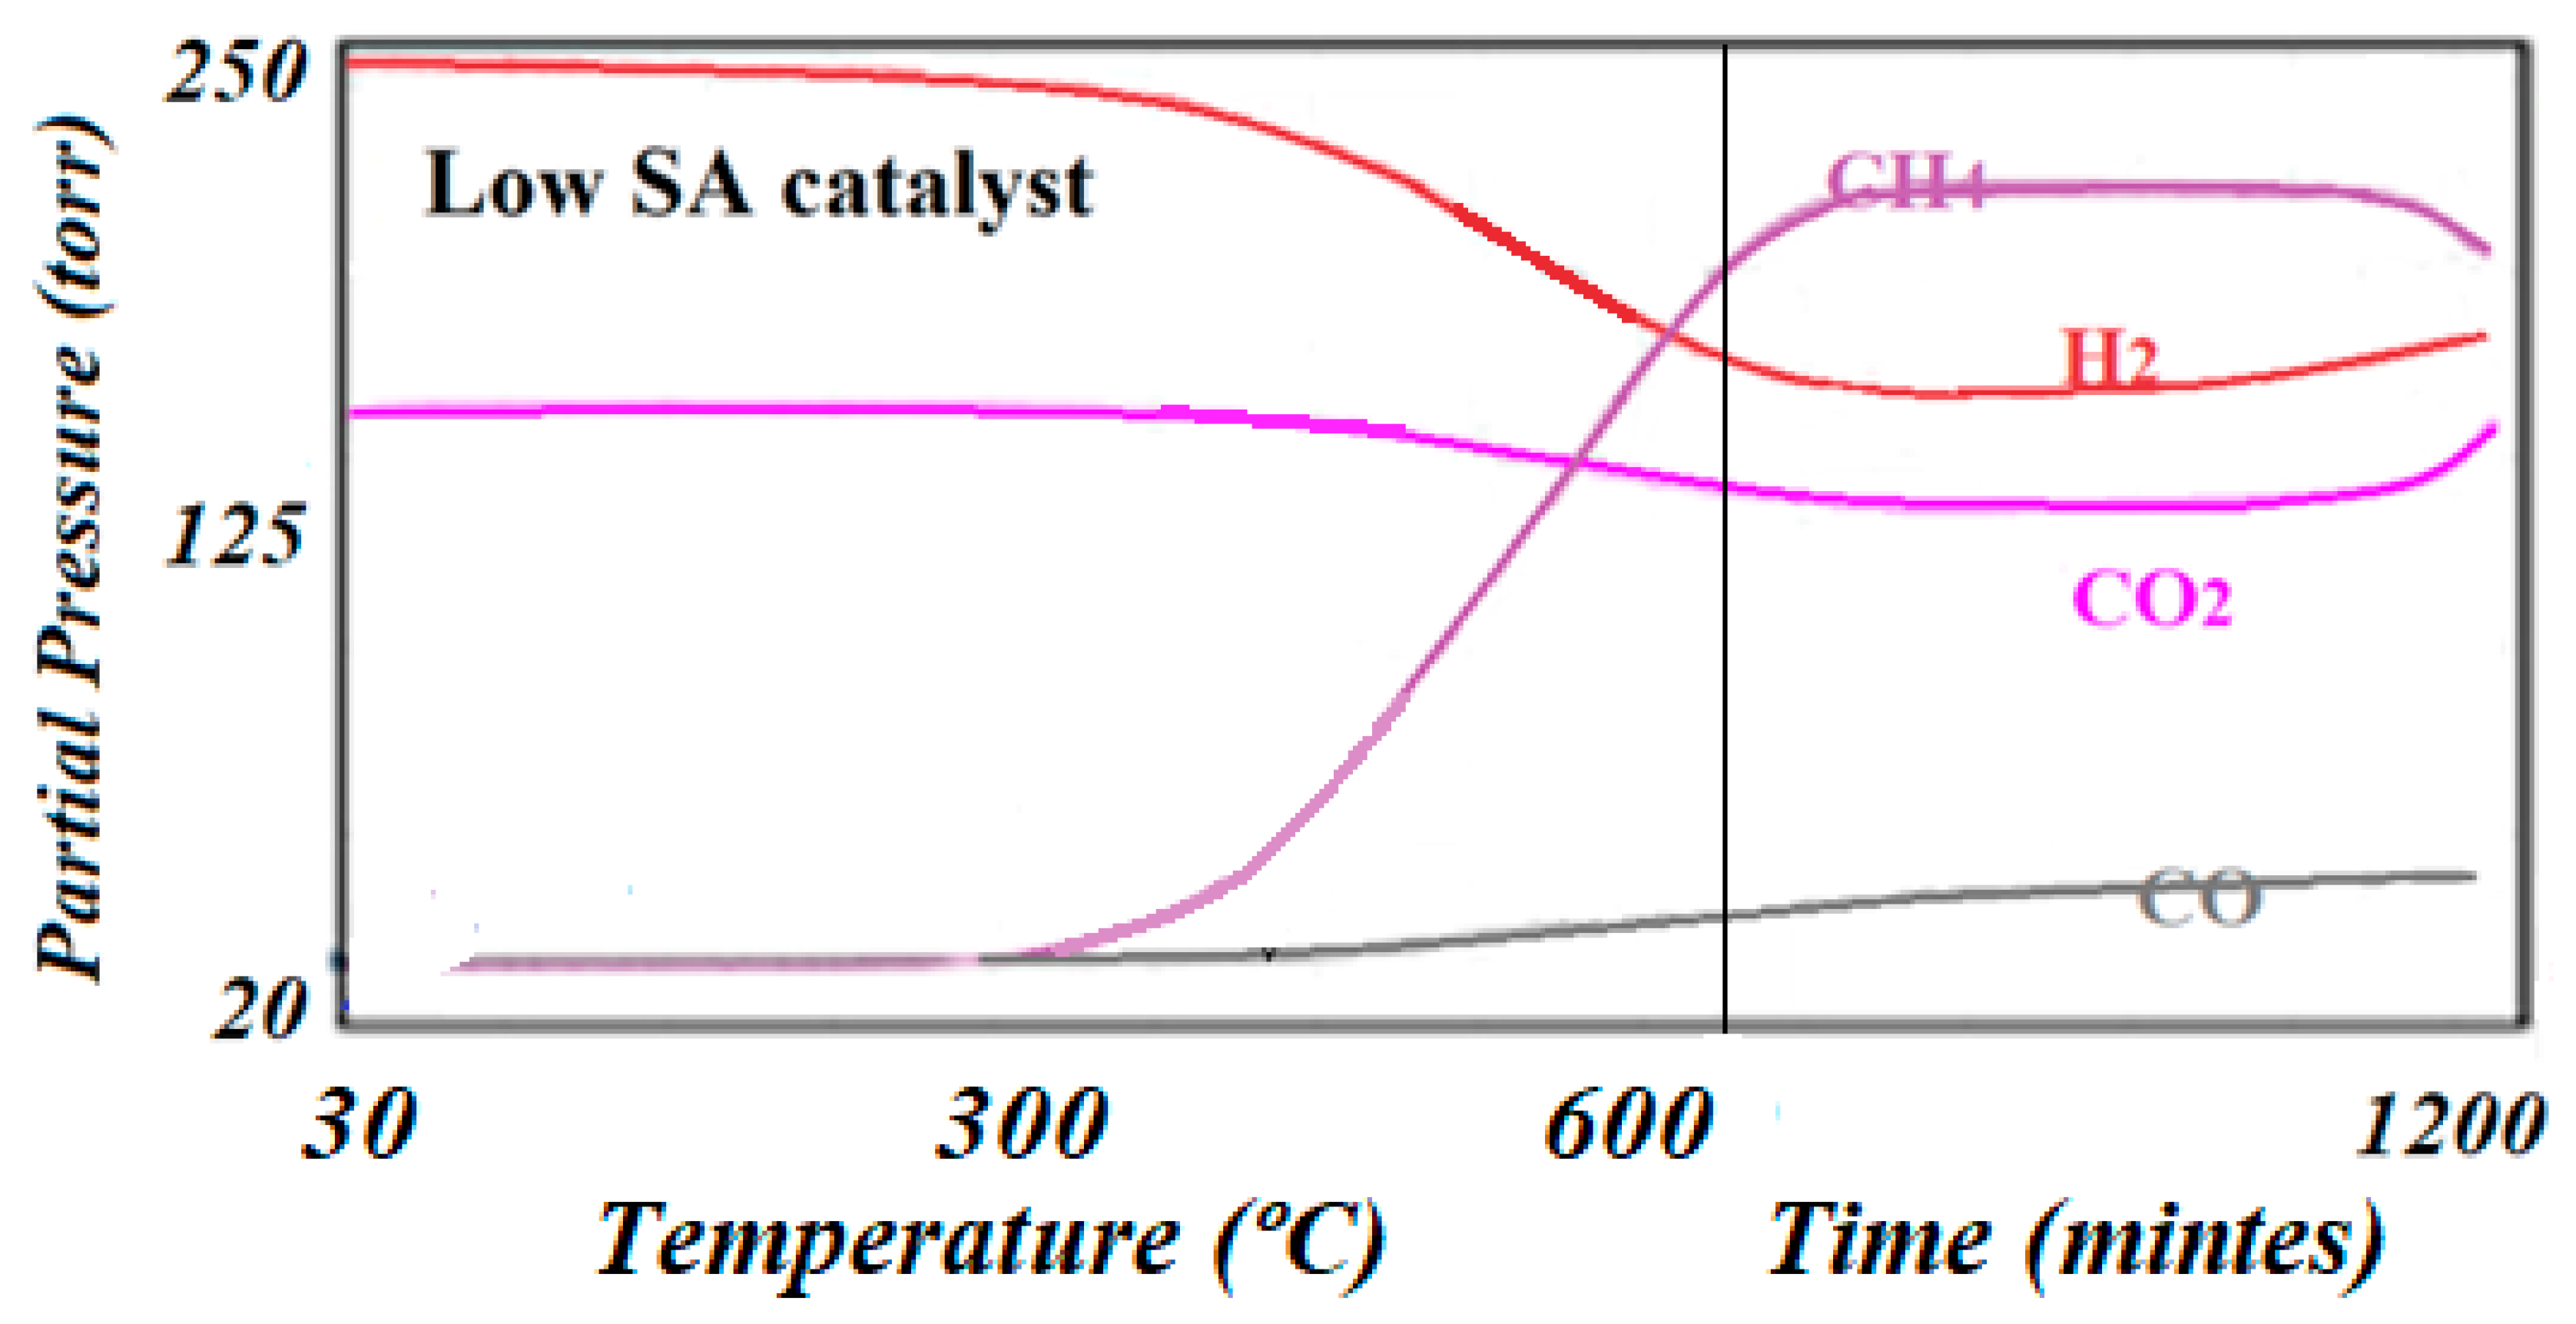
Figure 9). It was observed that while the low specific surface area catalyst produced CH
4 at a lower temperature than CO (275 °C vs. 325 °C), the high specific surface area catalyst produced CH
4 at a higher temperature than CO. However, the high specific surface area catalyst produced about two times the amount of CH
4 as is indicated by Equations (1) and (2) of relative intensity (102,450 vs. 55,620) and was active for at least 24 h, while the low specific surface area catalyst was only active for about 18 h. The relative performance was determined by dividing the MS signal by the number of surface-active sites according to Equation (8):
where
MSRP is the MS signal of the produced element (relative pressure in torr). Values of 102,450 and 55,619 were obtained from the high and low specific surface area catalysts, respectively.
It can be concluded from this study of catalytic performance that the high specific surface area support positively impacted the performance of the catalyst. Thus, the active species are better dispersed and stabilized, yielding a higher dispersion which is translated into small active particles that make a large contribution to the active area for the reaction.
3.4. Causes of Deactivation
A catalyst deactivates mainly due to two critical phenomena [
44,
45]: (i) The deposition of carbon due to cracking or the deposition of a product such as graphite, as in this case. The carbon that was produced at a high temperature was deposited directly onto the surface of the catalyst, and covered the active area, thus preventing the contact between the reactant molecules and the actives species, which was the principal condition for the reaction to proceed. (ii) The growing of the active particles under severe reaction condition (sintering) that dramatically decreased the active area of the catalyst. Here, the ICCS instrument came to play an important role in this study of deactivation as it allowed the in situ characterization of the catalyst that helped to reveal the causes of deactivation. At the end of the reaction, the ICCS was used to perform a TPO analysis by flowing (as before) a mixture of O
2 balanced inert carrier gas. In this work, oxidation started from room temperature up to 600 °C by ramping 10 °C/min. This technique oxidized the carbon to produce mainly CO
2. Here, production of CO and CO
2 were monitored using the mass spectrometer as a function of the consumption of O
2. The evolution of the formation of CO
2 as O
2 consumed is presented in
Figure 10. Quantification of the amount of O
2 consumed could be used to estimate the amount of carbon being deposited during the reaction. After cleaning the catalyst, a second method was applied. Once again, the ICCS system enabled us (as before) to perform the pulse chemisorption technique to determine dispersion. The difference between dispersion before and after reaction, if any, was related to sintering of active species that contributed to the deactivation of the catalyst.
4. Characterization upon Deactivation of the Catalysts
The Sabatier reaction that demonstrates a reduction of CO2 with H2 at elevated pressure and temperature was performed on both catalysts. Reaction time was set to 24 h and the reaction’s products were followed online by the mass spectrometer. Twenty-four hours was enough to observe some deactivation of the catalysts which was the main goal for this study. The ICCS was used again to study the causes of the deactivation on both catalysts. The following techniques were used again to evaluate the amount of graphite that was supposed to be produced as one of the products of the reaction as it comes to deposit and cover the active surface area of the catalysts. Pulse chemisorption, however, was used to determine dispersion of the active particles, since the severe reaction conditions would sinter the well-dispersed active species.
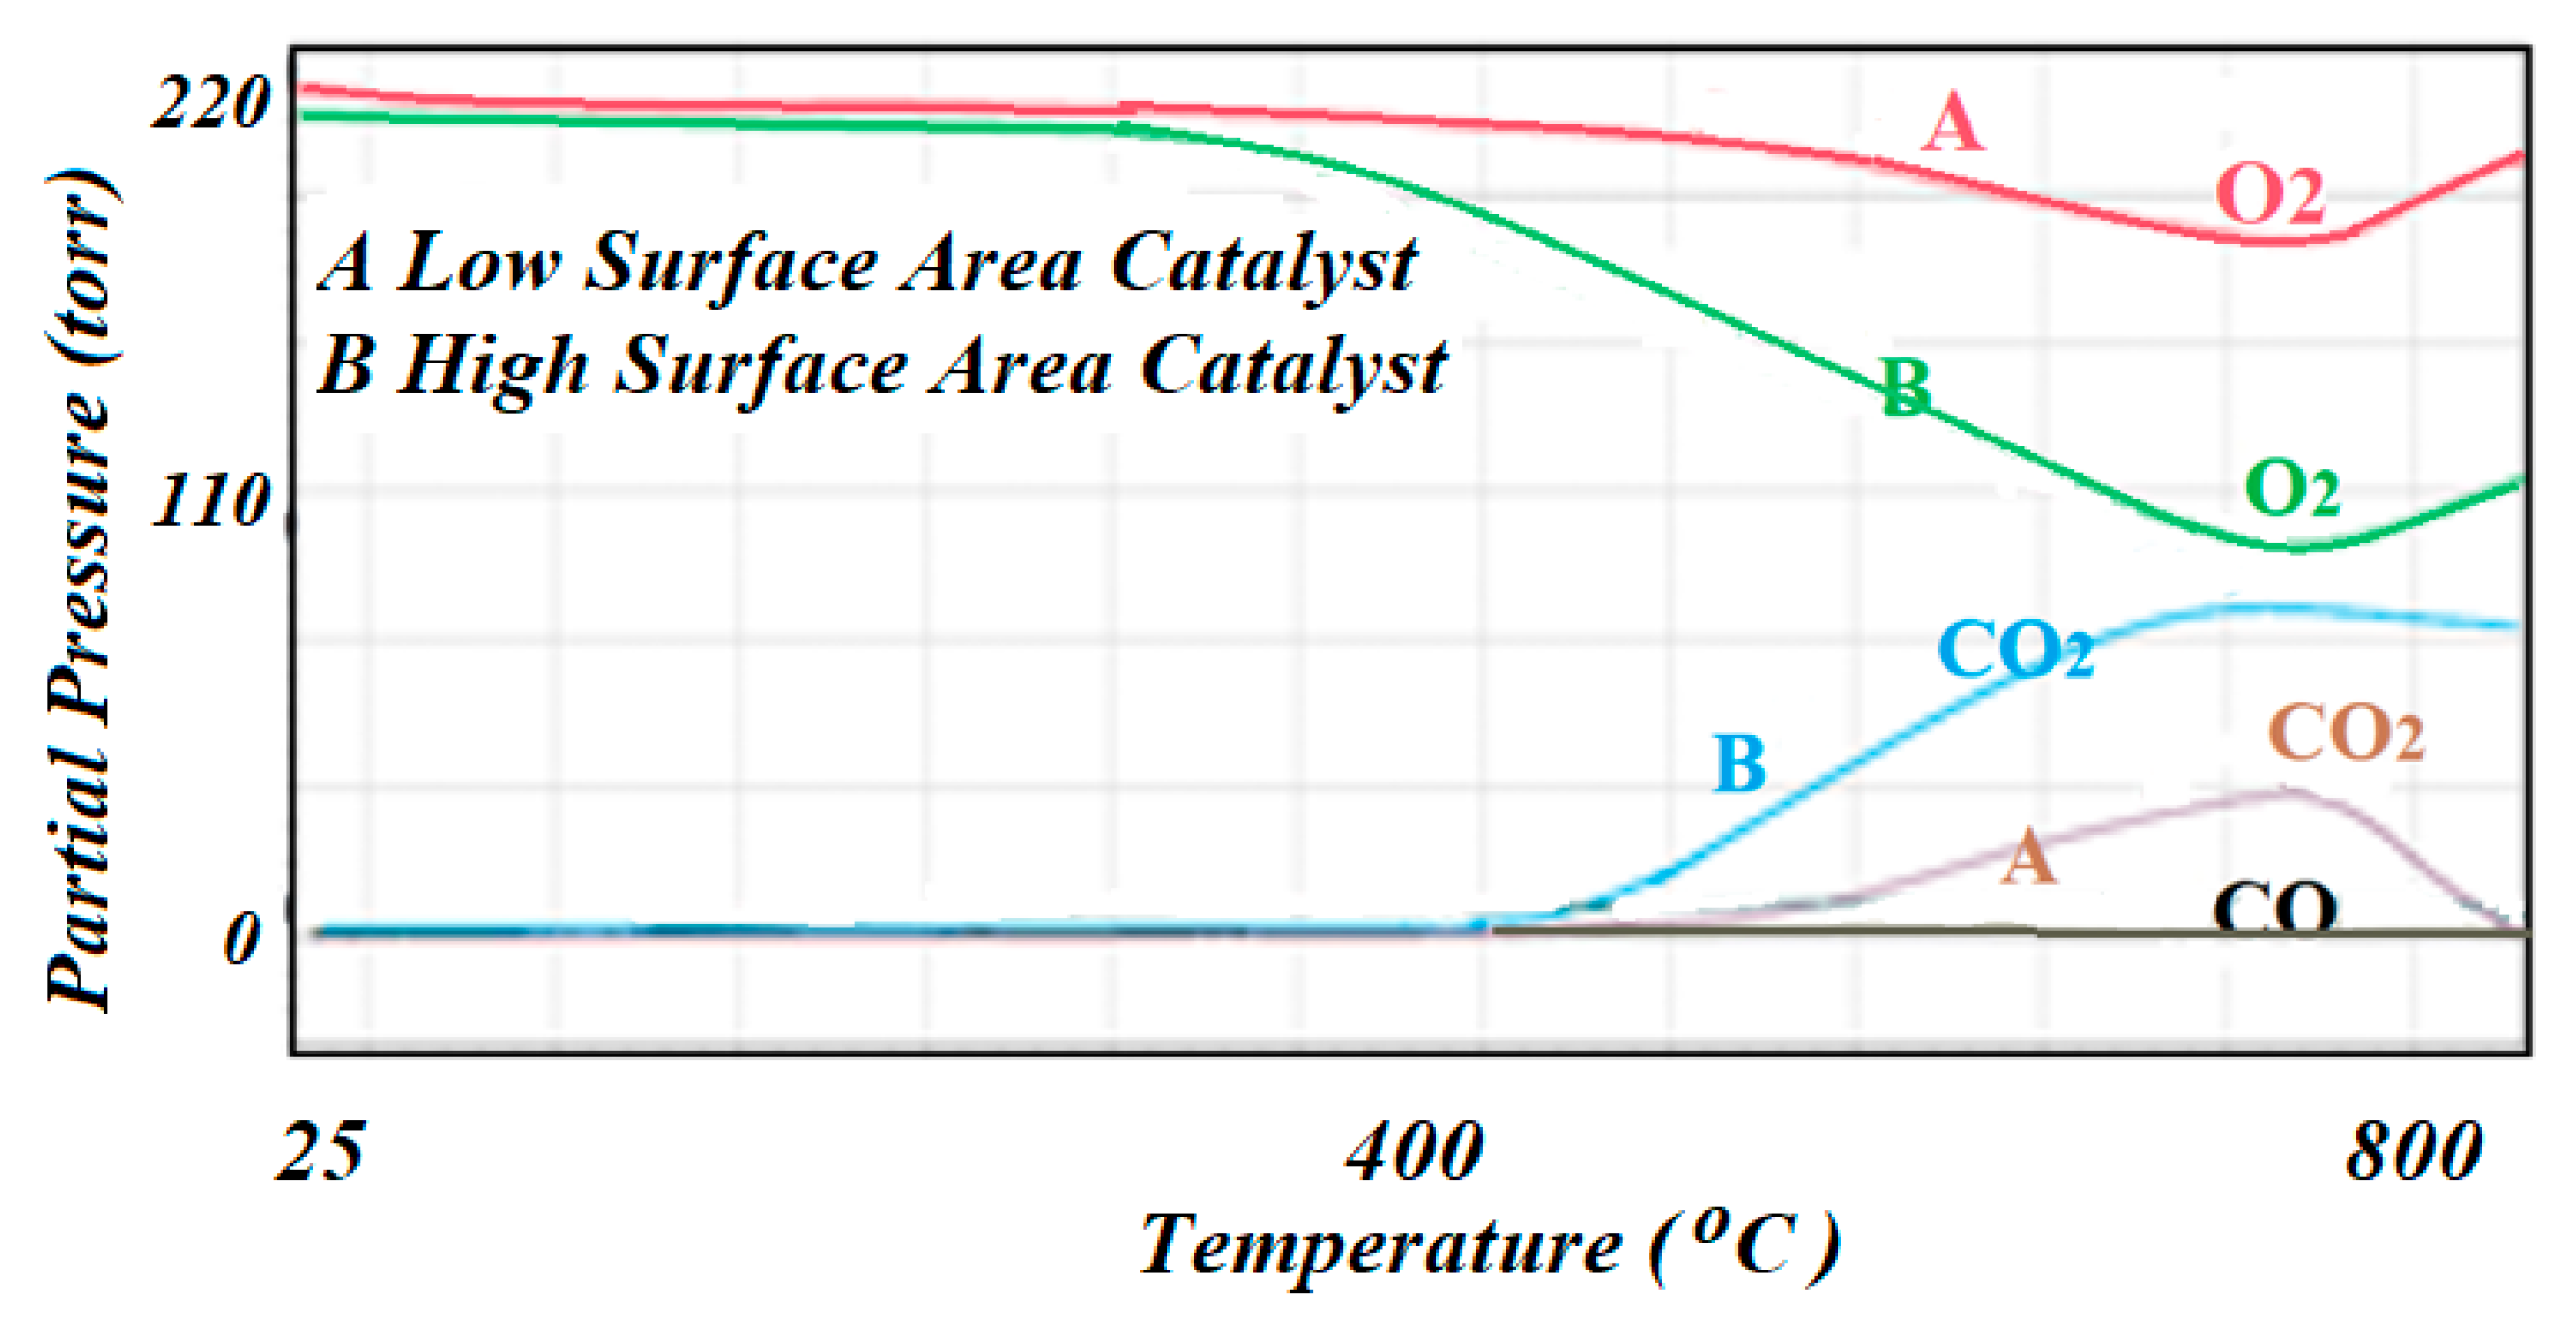
4.1. Temperature Programmed Oxidation (TPO)
For the regeneration of the spent catalysts, the ICCS was used at the end of the reaction and upon deactivation of the catalyst to perform temperature programmed oxidation (TPO) to quantify the amount of carbon that was produced as graphite or by possible cracking (if there was any) and had covered the active surface, and hence, deactivated the catalyst. This test was completed by flowing a mixture of 10% O
2 balance He through the catalyst bed at 35 °C and brought up to 500 °C at a rate of 10 °C/min. The TPO results were monitored by the mass spectrometer that was connected to the exhaust of the reactor. The TPO profiles for both spent catalysts are included in
Figure 10. Profile A corresponds to the low specific surface area catalyst, while profile B corresponds to the high specific surface area catalyst. The consumption of O
2 was not quantified, but it was observed that the high specific surface area catalyst showed a higher consumption of O
2 which indicated that more graphite was formed during the reaction as there was little probability of cracking in these cases.
Temperature programmed oxidation (TPO) was the preferred technique that was used to regenerate the catalyst upon deactivation and to quantify the amount of carbon that resulted as a product of the reaction, graphite in this case, or by the effect of cracking of the reactant molecules yielding atomic carbon that was directly deposited on the surface of the catalyst. Consumption of O2 then indicated the presence of carbon that came to cover the actives species, thus reducing the contact between the reactant molecules and the accessible active sites that yielded rapid deactivation of the catalyst. The TCD was considered blind as it did not differentiate between the oxidation states of the carbon. In this case, the mass spectrometer was used to follow the formation of CO and CO2. According to the TPO profiles, it was concluded that the oxidation mainly produced CO2 rather than CO.
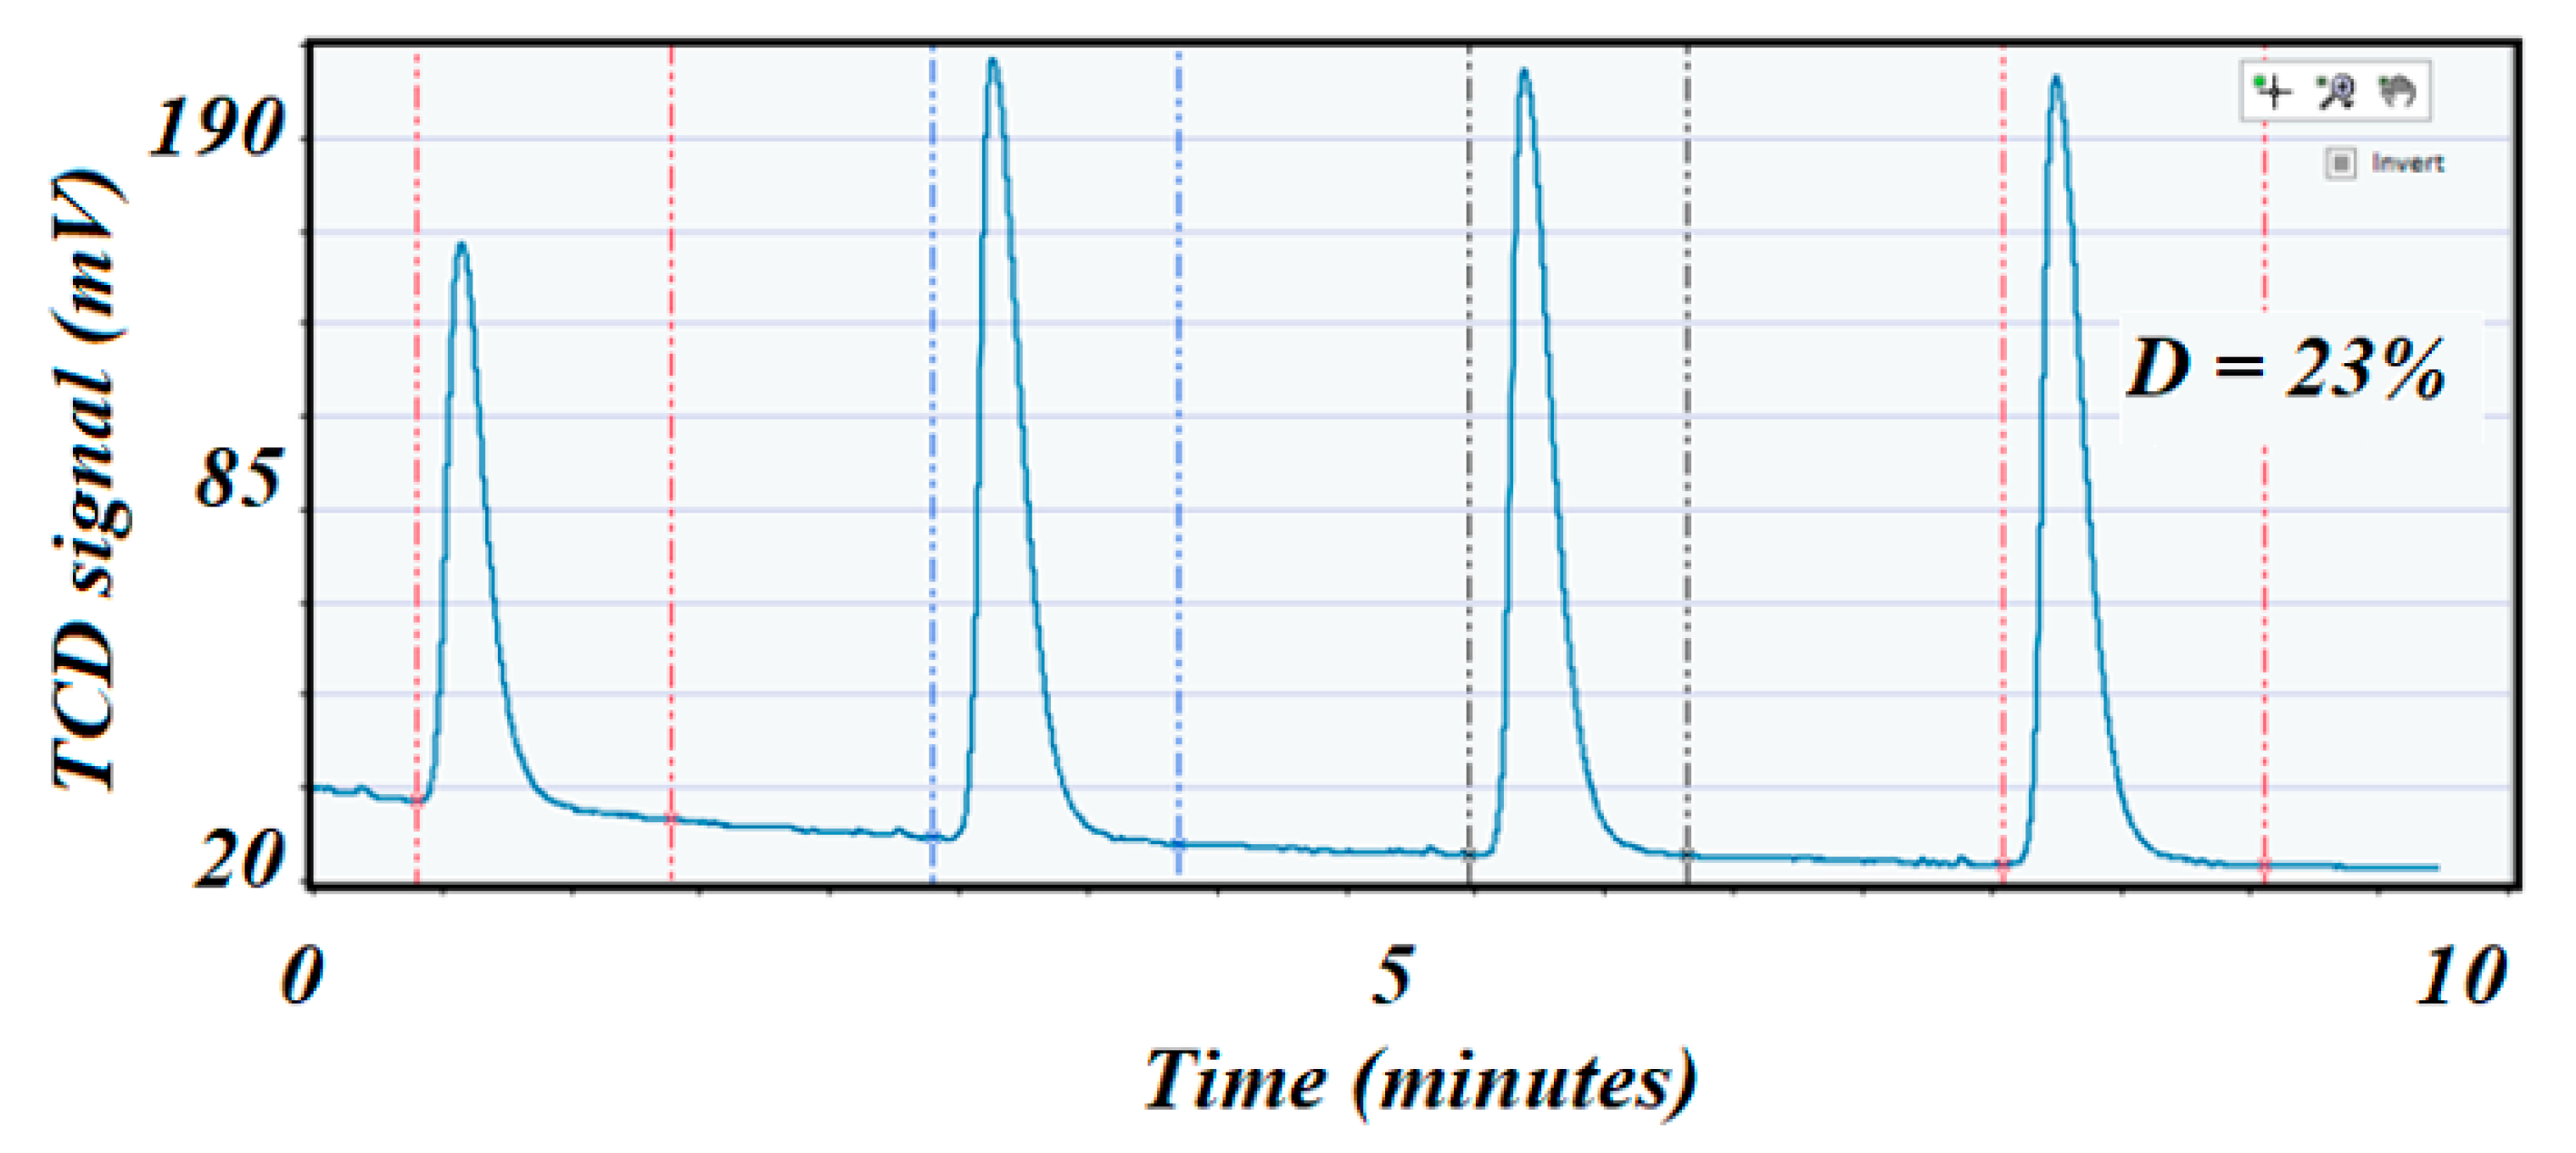
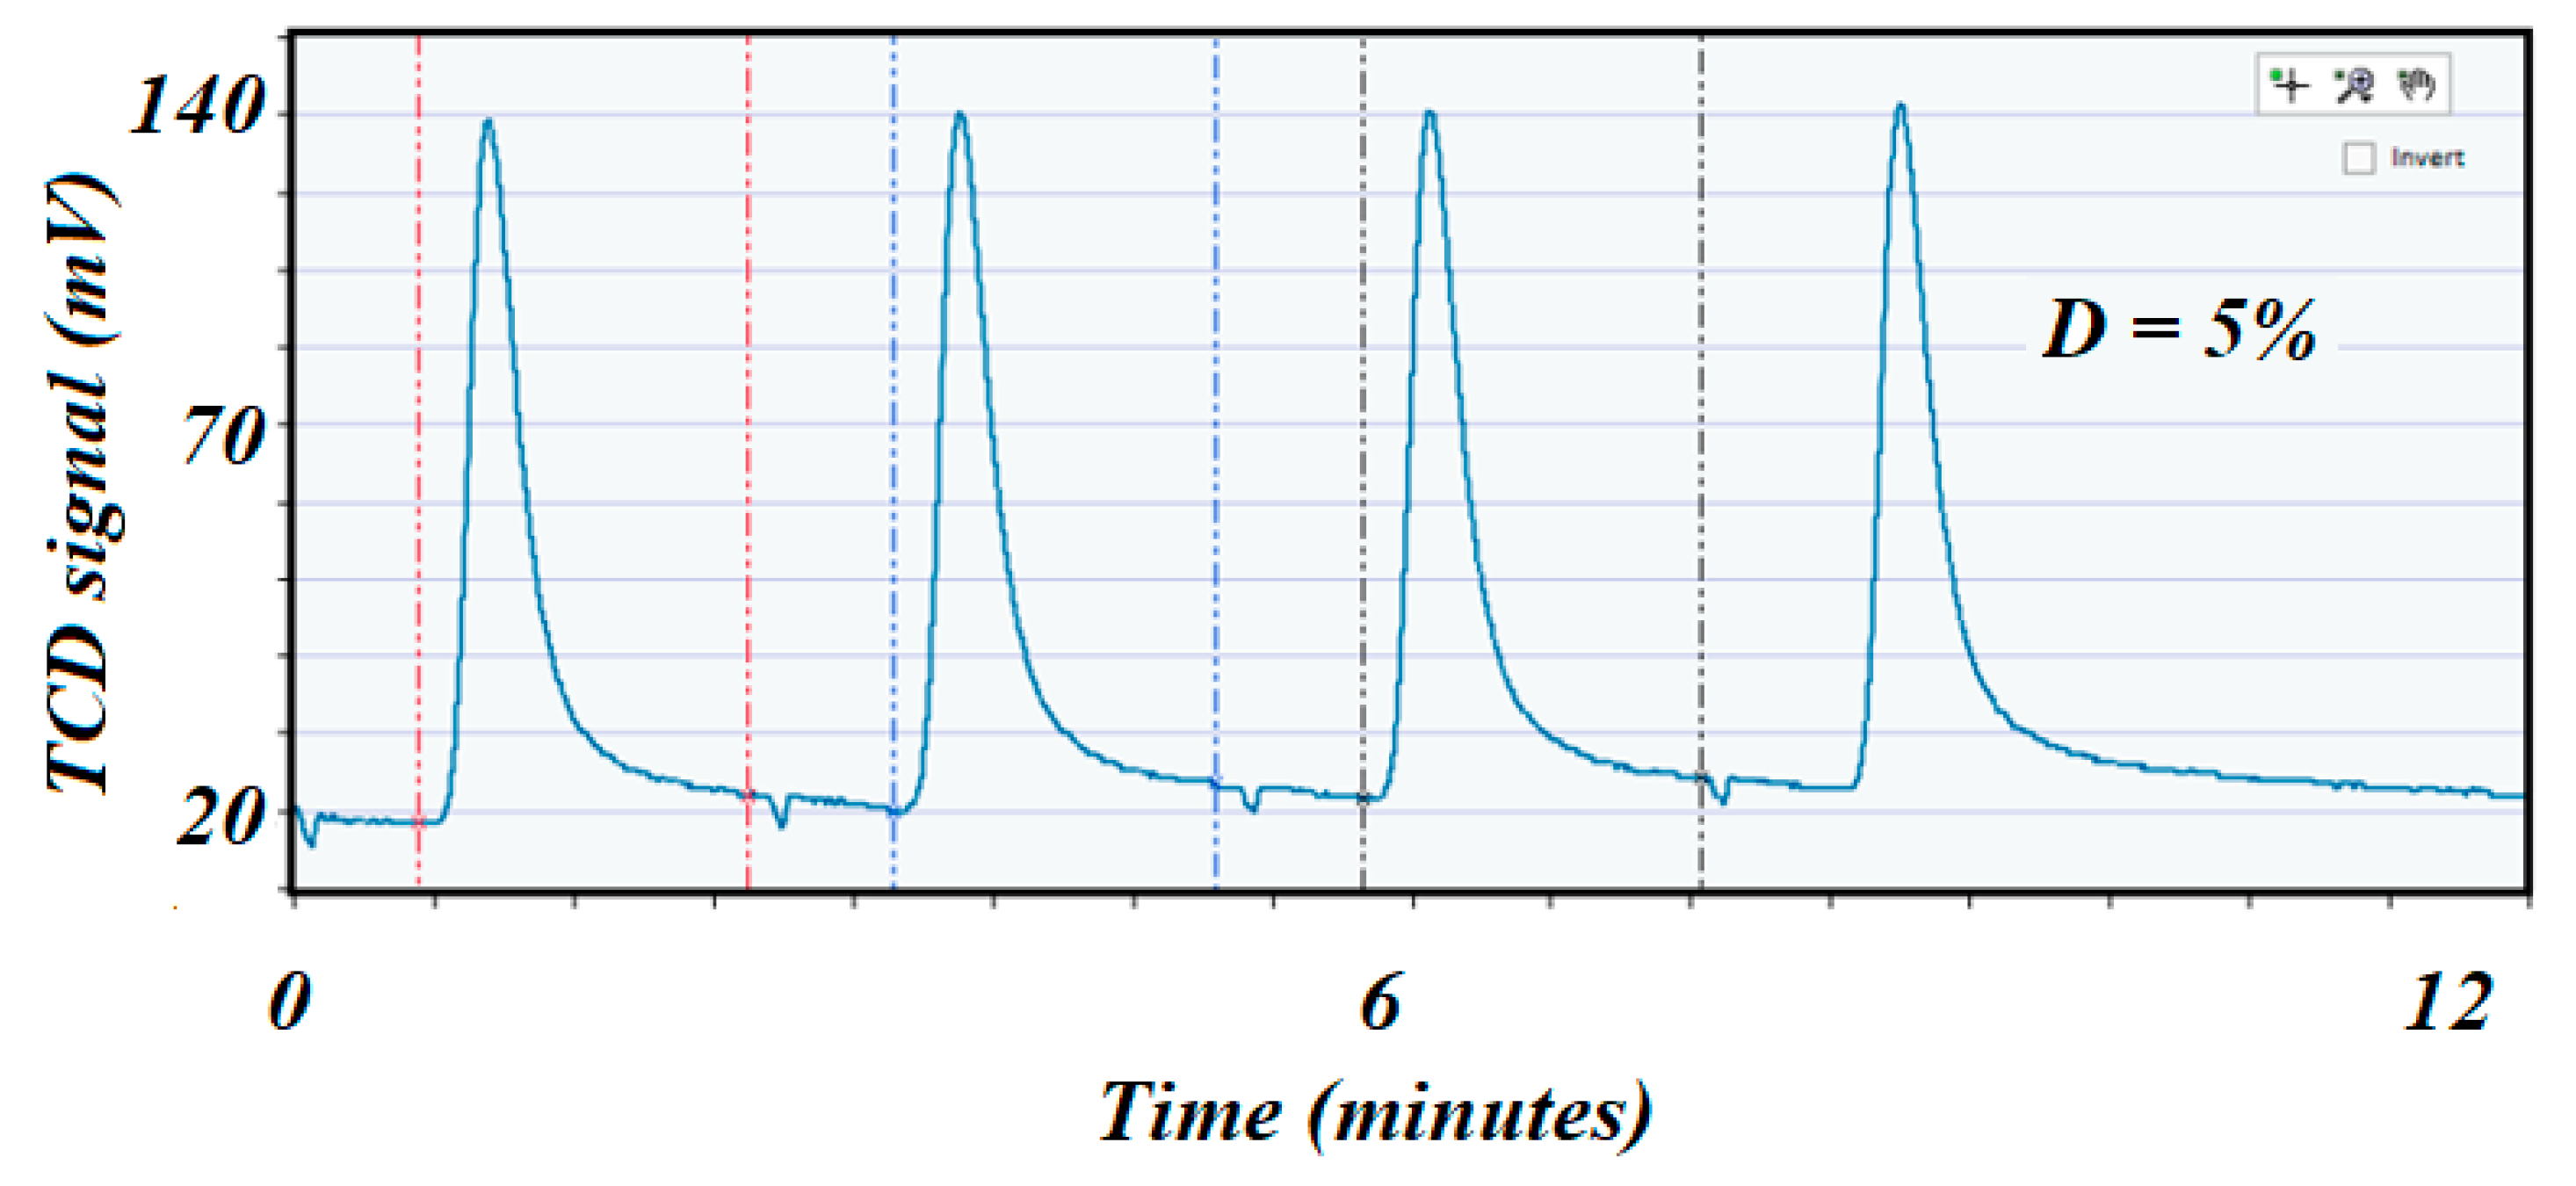
4.2. Catalyst Dispersion upon Regeneration
The freshly regenerated catalyst was reduced again with the same previously described conditions. Pulse chemisorption was performed (as before) to determine dispersion after regeneration (
Figure 11 corresponds to the high specific surface area catalyst, while
Figure 12 corresponds to the low specific surface area catalyst). A comparison of the dispersion values before and after reaction indicated a cause of deactivation by sintering if the second value of dispersion was depleted compared with the dispersion value on the fresh catalyst. In this case, dispersion was 23 and 5%, respectively.
5. Conclusions
The in situ characterization of catalysts such as the PID-Micromeritics ICCS system is an indispensable tool when connected to any external reactor, allowing for the chemical characterization of the catalyst by providing the TPX techniques. Its self-built cold trap that is automatically set to −15 °C prevents any moisture as a product of reduction from reaching the built-in highly sensitive TCD and disturbing its base line.
The ICCS helps to characterize the catalyst in situ before and after reaction and thus identifies the causes of deactivation of the catalyst without the need to remove the catalyst from the reactor. The mass spectrometer is also a very powerful tool when connected to the exhaust of the reactor, as it was in this study. It allows for the online following of the catalyst’s behavior as the reaction proceeds and identifies the products of the reaction as a function of the rising temperature.
From the experimental results found, the high specific surface area catalyst showed, as suspected, a higher catalytic performance to produce CH4 and other co-products. Thus, the support disperses and stabilizes the active species and hence elongates the active life of the catalyst. The lower dispersion on the spent catalysts than on the fresh catalysts clearly indicates that the deactivation of the catalyst was not only due to the production of graphite that slowly deposited onto the surface of the catalyst, hindering the active sites, but also due to sintering of the active particles. The above characterization results were easily obtained by connecting the ICCS to a reactor and overall they can be obtained in situ without needing to remove the catalyst from the reactor and expose it to the atmosphere.
Author Contributions
Conceptualization, S.Y.; methodology, S.Y.; validation, S.Y.; formal analysis, S.Y. and A.G.; investigation, S.Y.; resources, J.K.; data curation, S.Y.; writing—original draft preparation, S.Y.; writing—review and editing, S.Y. and A.G.; supervision, S.Y. and A.G.; funding acquisition, J.K. All authors have read and agreed to the published version of the manuscript.
Funding
This research was funded by the Micromeritics Instrument Corporation, 4356 Communications drive, Norcross, GA 30093, USA.
Conflicts of Interest
The authors declare no conflict of interest.
References
- Bañares, M.A. Operando methodology: Combination of in situ spectroscopy and simultaneous activity measurements under catalytic reaction conditions. Catal. Today 2005, 100, 71–77. [Google Scholar] [CrossRef]
- Tinnemans, S.J.; Mesu, J.G.; Kervinen, K.; Visser, T.; Nijhuis, T.A.; Beale, A.M.; Keller, D.E.; van der Eerden, A.M.J.; Weckhuysen, B.M. Combining operando techniques in one spectroscopic-reaction cell: New opportunities for elucidating the active site and related reaction mechanism in catalysis. Catal. Today 2006, 113, 3–15. [Google Scholar] [CrossRef]
- Piovano, A.; Wada, T.; Amodio, A.; Takasao, G.; Ikeda, T.; Zhu, D.; Terano, M.; Chammingkwan, P.; Groppo, E.; Taulike, T. Formation of highly active Ziegler–Natta catalysts clarified by a multifaceted characterization approach. ACS Catal. 2021, 11, 13782–13796. [Google Scholar] [CrossRef]
- Piovano, A.; Pletcher, P.; Velthoen, M.E.Z.; Zanoni, S.; Chung, S.-H.; Bossers, K.; Jongkind, M.K.; Fiore, G.; Groppo, E. Genesis of MgCl2-based Ziegler-Natta catalysts as probed with operando spectroscopy. ChemPhysChem 2018, 19, 2662–2671. [Google Scholar] [CrossRef] [PubMed]
- Lee, H.H.; Ruckenstein, E. Catalyst sintering and reactor design. Catal. Rev.-Sci. Eng. 1983, 25, 474–550. [Google Scholar] [CrossRef]
- Mutz, B.; Sprenger, P.; Wang, W.; Wang, D.; Kleist, W.; Grunwaldt, J.D. Operando Raman spectroscopy on CO2 methanation over alumina-supported Ni, Ni3Fe and NiRh0.1 catalysts: Role of carbon formation as possible deactivation pathway. Appl. Catal. A-Gen. 2018, 556, 160–171. [Google Scholar] [CrossRef]
- Mutz, B.; Carvalho, H.W.P.; Mangold, S.; Kleist, W.; Grunwaldt, J.-D. Methanation of CO2: Structural response of a Ni-based catalyst under fluctuating reaction conditions unraveled by operando spectroscopy. J. Catal. 2015, 327, 48–53. [Google Scholar] [CrossRef]
- Yunes, S.; Vicente, M.A.; Korili, S.A.; Gil, A. Effect of high pressure on the reducibility and dispersion of the active phase of Fischer-Tropsch catalysts. Materials 2019, 12, 1915. [Google Scholar] [CrossRef]
- Micromeritics Instrument Corp. 4356 Communications Drive, Norcross, GA, 30093, USA. Available online: https://www.micromeritics.com/fr-mr-reactor-systems/ (accessed on 5 October 2021).
- Sancho-Sanz, I.; Korili, S.A.; Gil, A. Catalytic valorization of CO2 by hydrogenation: Current status and future trends. Cata. Rev.-Sci. Eng. 2021, in press. [Google Scholar] [CrossRef]
- Tackett, B.M.; Gomez, E.; Chen, J.G. Net reduction of CO2 via its thermocatalytic and electrocatalytic transformation reactions in standard and hybrid processes. Nat. Catal. 2019, 2, 381–386. [Google Scholar] [CrossRef]
- Younas, M.; Loong Kong, L.; Bashir, M.J.K.; Nadeem, H.; Shehzad, A.; Sethupathi, S. Recent advancements, fundamental challenges, and opportunities in catalytic methanation of CO2. Energy Fuels 2016, 30, 8815–8831. [Google Scholar] [CrossRef]
- Gao, J.; Liu, Q.; Gu, F.; Liu, B.; Zhong, Z.; Su, F. Recent advances in methanation catalysts for the production of synthetic natural gas. RSC Adv. 2015, 5, 22759–22776. [Google Scholar] [CrossRef]
- Ashok, J.; Pati, S.; Hongmanorom, P.; Tianxi, Z.; Junmei, C.; Kawi, S. A review of recent catalyst advances in CO2 methanation processes. Catal. Today 2020, 356, 471–489. [Google Scholar] [CrossRef]
- Process Integral Development Eng & Tech S.L. (PID). Available online: http://www.pidengtech.com/products-and-services/in-situ-catalyst-characterization-system (accessed on 5 October 2021).
- Sabatier, P.; Senderens, J.-B. New synthesis of methane. Comptes Rendus 1902, 134, 514–516. [Google Scholar]
- Sabatier, P.; Senderens, J.-B. Hydrogénation directe des oxydes du carbone en présence de divers métaux divisés. Comptes Rendus 1902, 134, 689–691. [Google Scholar]
- Artz, J.; Muller, T.E.; Thenert, K.; Kleinekorte, J.; Meys, R.; Sternberg, A.; Bardow, A.; Leitner, W. Sustainable conversion of carbon dioxide: An integrated review of catalysis and life cycle assessment. Chem. Rev. 2018, 118, 434–504. [Google Scholar] [CrossRef]
- Álvarez, A.; Borges, M.; Corral-Perez, J.J.; Giner-Olcina, J.; Hu, L.; Cornu, D.; Huang, R.; Stoian, D.; Urakawa, A. CO2 Activation over catalytic surfaces. ChemPhysChem 2017, 18, 3135–3141. [Google Scholar] [CrossRef]
- Prieto, G. Carbon dioxide hydrogenation into higher hydrocarbons and oxygenates: Thermo-dynamic and kinetic bounds and progress with heterogeneous and homogeneous catalysis. ChemSusChem 2017, 10, 1056–1070. [Google Scholar] [CrossRef] [PubMed]
- Kattel, S.; Liu, P.; Chen, J.G. Tuning selectivity of CO2 hydrogenation reactions at the metal/oxide interface. J. Am. Chem. Soc. 2017, 139, 9739–9754. [Google Scholar] [CrossRef]
- IEA Report. Global CO2 Emission in 2019. Available online: https://www.iea.org/articles/global-co2-emissions-in-2019 (accessed on 11 February 2020).
- Gorre, J.; Ruoss, F.; Karjunen, H.; Schaffert, J.; Tynjälä, T. Cost benefits of optimizing hydrogen storage and methanation capacities for power-to-gas plants in dynamic operation. Appl. Energy 2020, 257, 113967. [Google Scholar] [CrossRef]
- Frontera, P.; Macario, A.; Ferraro, M.; Antonucci, P. Supported catalysts for CO2 methanation: A review. Catalyst 2017, 7, 59. [Google Scholar] [CrossRef]
- Magdalena, R.-C.M.; Goldwasser, M.R.; de Sousa Aguiar, E.F. Decarbonization as a Route Towards Sustainable Circularity; Springer: New York, NY, USA, 2023. [Google Scholar]
- Gassner, F.; Leitner, W. Hydrogenation of carbon dioxide to formic acid using water-soluble rhodium catalysts. J. Chem. Commun. 1993, 19, 1465–1466. [Google Scholar] [CrossRef]
- Yang, Z.Z.; He, L.-N.; Zhao, Y.-N.; Li, B.; Yu, B. CO2 capture and activation by superbase/polyethylene glycol and its subsequent conversion. Energy Environ. Sci. 2011, 4, 3971–3975. [Google Scholar] [CrossRef]
- Du, C.; Stöwe, K.; Müller, F.; Maier, W.F. Efficient and new production methods of chemicals and liquids fuels by carbon monoxide hydrogenation. ACS Omega. 2020, 5, 49–56. [Google Scholar] [CrossRef]
- Kim, D.K.; Stöwe, K.; Müller, F.; Maier, W.F. Mechanistic study of the unusual catalytic properties of a new nice mixed oxide for the CO2 reforming of methane. J. Catal. 2007, 247, 101–111. [Google Scholar] [CrossRef]
- Ginsburg, J.M.; Piña, J.; El Solh, T.; de Lasa, H.I. Coke formation over a nickel catalyst under methane dry reforming conditions: Thermodynamic and kinetic models. Ind. Eng. Chem. Res. 2005, 44, 4846–4854. [Google Scholar] [CrossRef]
- Li, Y.; Wang, Y.; Zhang, Z.; Hong, X.; Liu, Y. Oxidative reforming of methane to syngas with steam and CO2 catalyzed by metallic nickel based monolithic catalysts. Catal. Commun. 2008, 9, 1040–1044. [Google Scholar] [CrossRef]
- Hunt, J.; Ferrari, A.; Lita, A.; Crosswhite, M.; Ashely, B.; Stiegman, A.E. Microwave-specific enhancement of the carbon-carbon dioxide reaction. J. Phys. Chem. 2013, C117, 26871–26880. [Google Scholar] [CrossRef]
- Mondal, K.; Sasmal, S.; Badgandi, S.; Chowdhury, D.R.; Nair, V. Dry reforming of methane to syngas: A potential alternative process for value added chemicals—A techno-economic perspective. Environ. Sci. Pollut. Res. 2016, 23, 22267–22273. [Google Scholar] [CrossRef]
- Kim, S.; Ryi, S.-K.; Lim, H. Techno-economic analysis (TEA) for CO2 reforming of methane in a membrane reactor for simultaneous CO2 utilization and ultra-pure H2 production. Int. J. Hydrog. Energy 2018, 43, 5881–5893. [Google Scholar] [CrossRef]
- Ramirez-Corredores, M.M.; Diaz, L.A.; Gaffney, A.M.; Zarzana, C.A. Identification of opportunities for integrating chemical processes for carbon dioxide utilization to nuclear power plants. Renew. Sustain. Energy Rev. 2021, 150, 111450. [Google Scholar] [CrossRef]
- Gao, X.; Ashok, J.; Kawi, S. Smart design of anti-coking and anti-sintering Ni based catalysts for dry reforming of methane: A recent review. Reactions 2020, 1, 162–194. [Google Scholar] [CrossRef]
- Rostrup-Nielsen, J.R. Sulfur-passivated nickel catalysts for carbon-free steam reforming of methane. J. Catal. 1984, 85, 31–43. [Google Scholar] [CrossRef]
- Gil, A. Análisis Textural de Sólidos Porosos Mediante Adsorción Física de Gases; Universidad Pública de Navarra: Pamplona, Spain, 2019. [Google Scholar]
- Richardson, J.T.; Twigg, M.V. Reduction of impregnated NiO/α-Al2O3 association of Al3+ ions with NiO. Appl. Catal. A-Gen. 1998, 167, 57–64. [Google Scholar] [CrossRef]
- Mori, H.; Wen, C.-J.; Otomo, J.; Eguchi, K.; Takahashi, H. Investigation of the interaction between NiO and yttria-stabilized zirconia (YSZ) in the NiO/YSZ composite by temperature-programmed reduction technique. Appl. Catal. A-Gen. 2003, 245, 79–85. [Google Scholar] [CrossRef]
- Torrez-Herrera, J.J.; Korili, S.A.; Gil, A. Effect of the synthesis method on the morphology, textural properties and catalytic performance of La-hexaaluminates in the dry reforming of methane. J. Environ. Chem. Eng. 2021, 9, 105298. [Google Scholar] [CrossRef]
- Gil, A. Classical and new insights into the methodology for characterizing adsorbents and metal catalysts by chemical adsorption. Catal. Today 2023, in press. [Google Scholar] [CrossRef]
- MKS Instruments UK Lt. Cowley Way; MKS Instruments UK Lt: Crewe, UK.
- Rendón-Calle, A.; Low, Q.H.; Hong, S.H.L.; Builes, S.; Yeo, B.S.; Calle-Vallejo, F. How symmetry factors cause potential-and facet-dependent pathway shifts during CO2 reduction to CH4 on Cu electrodes. Appl. Catal. 2021, 285, 119776. [Google Scholar] [CrossRef]
- Wilson, R.B. Fundamental Investigation of the Bosch Reaction; MIT: Cambridge, MA, USA, 1971; p. 11. [Google Scholar]
Figure 1.
The ICCS commercial system connected to an external reactor placed in a programable oven. (1) In Situ Catalyst Characterization System (ICCS). (2) Stand-alone programmable oven. (3) Computer to register and reduce data. (4) 9 mm SS316 tubular reactor.
Figure 1.
The ICCS commercial system connected to an external reactor placed in a programable oven. (1) In Situ Catalyst Characterization System (ICCS). (2) Stand-alone programmable oven. (3) Computer to register and reduce data. (4) 9 mm SS316 tubular reactor.
Figure 2.
Shows equipment used in characterizing and testing catalysts for this work. (1) The In Situ Catalyst Characterization System (ICCS). (2) The FR-100 microreactor. (3) The micro-gas chromatograph. (4) The MKS mass spectrometer.
Figure 2.
Shows equipment used in characterizing and testing catalysts for this work. (1) The In Situ Catalyst Characterization System (ICCS). (2) The FR-100 microreactor. (3) The micro-gas chromatograph. (4) The MKS mass spectrometer.
Figure 3.
N2 adsorption–desorption isotherms for both aluminas used as supports. Both isotherms seemed to correspond to type IV, which corresponds to mesoporous materials.
Figure 3.
N2 adsorption–desorption isotherms for both aluminas used as supports. Both isotherms seemed to correspond to type IV, which corresponds to mesoporous materials.
Figure 4.
The TPR profile corresponding to the high surface area fresh catalyst. Both peaks indicated a strong interaction of the NiO with the support due to the high reduction temperature.
Figure 4.
The TPR profile corresponding to the high surface area fresh catalyst. Both peaks indicated a strong interaction of the NiO with the support due to the high reduction temperature.
Figure 5.
Shows the TPR profile corresponding to the low surface area fresh catalyst. The two peaks probably corresponded to weak or no interaction of the NiO with the support due to the low reduction temperature.
Figure 5.
Shows the TPR profile corresponding to the low surface area fresh catalyst. The two peaks probably corresponded to weak or no interaction of the NiO with the support due to the low reduction temperature.
Figure 6.
H2 pulse chemisorption profile on the high surface area fresh catalyst. The first peak was almost 90% consumed by the sample, which could indicate that the Ni was well dispersed on the catalyst’s surface.
Figure 6.
H2 pulse chemisorption profile on the high surface area fresh catalyst. The first peak was almost 90% consumed by the sample, which could indicate that the Ni was well dispersed on the catalyst’s surface.
Figure 7.
H2 pulse chemisorption profile on the low surface area fresh catalyst. The first peak corresponded almost completely to the entire volume of H2 injected, which could indicate that the Ni was poorly dispersed on the catalyst’s surface.
Figure 7.
H2 pulse chemisorption profile on the low surface area fresh catalyst. The first peak corresponded almost completely to the entire volume of H2 injected, which could indicate that the Ni was poorly dispersed on the catalyst’s surface.
Figure 8.
The reaction trends as detected by online mass spectroscopy. The left figure shows signals for the advanced reaction as the temperature rose to 600 °C, while the right figure shows the last trends of the reaction before deactivation had appeared after 24 h of reaction.
Figure 8.
The reaction trends as detected by online mass spectroscopy. The left figure shows signals for the advanced reaction as the temperature rose to 600 °C, while the right figure shows the last trends of the reaction before deactivation had appeared after 24 h of reaction.
Figure 9.
The reaction trends as detected by online mass spectroscopy on the low specific surface area catalyst. The catalyst tended to deactivate after about 20 h of reaction.
Figure 9.
The reaction trends as detected by online mass spectroscopy on the low specific surface area catalyst. The catalyst tended to deactivate after about 20 h of reaction.
Figure 10.
The mass spectrometer signals corresponding to the TPO results in producing CO and CO2 as carbon being oxidized by the O2 mixture: (A) corresponds to the low surface area catalyst, while (B) corresponds to the high surface area catalyst.
Figure 10.
The mass spectrometer signals corresponding to the TPO results in producing CO and CO2 as carbon being oxidized by the O2 mixture: (A) corresponds to the low surface area catalyst, while (B) corresponds to the high surface area catalyst.
Figure 11.
Shows the pulse chemisorption profile on the spent 5 wt.% Ni alumina trilobate catalyst with a dispersion of 23%.
Figure 11.
Shows the pulse chemisorption profile on the spent 5 wt.% Ni alumina trilobate catalyst with a dispersion of 23%.
Figure 12.
Shows the pulse chemisorption profile on the spent 5 wt.% Ni alumina tablet catalyst with a dispersion of 5% only.
Figure 12.
Shows the pulse chemisorption profile on the spent 5 wt.% Ni alumina tablet catalyst with a dispersion of 5% only.
Table 1.
BET specific surface areas and total pore volumes for both supports.
Table 1.
BET specific surface areas and total pore volumes for both supports.
| Sample | SBET (m2/g) | VpT (cm3/g) |
|---|
Alumina
(trilobe) | 310 | 0.67 |
Alumina
(tablet) | 92 | 0.26 |
| Disclaimer/Publisher’s Note: The statements, opinions and data contained in all publications are solely those of the individual author(s) and contributor(s) and not of MDPI and/or the editor(s). MDPI and/or the editor(s) disclaim responsibility for any injury to people or property resulting from any ideas, methods, instructions or products referred to in the content. |
© 2023 by the authors. Licensee MDPI, Basel, Switzerland. This article is an open access article distributed under the terms and conditions of the Creative Commons Attribution (CC BY) license (https://creativecommons.org/licenses/by/4.0/).


