Article

Optical and Sensing Properties of Carbon Colloidal Particles Based on (Thio)urea and Citric Acid: Effect of the Components Ratio

by
Evgeny Karpushkin
*,
Ekaterina Kharochkina
,
Ekaterina Mesnyankina
,
Olga Zaborova
and
Vladimir Sergeyev
Department of Chemistry, Lomonosov Moscow State University, Moscow 119991, Russia
*
Author to whom correspondence should be addressed.
Physchem 2023, 3(1), 92-109; https://doi.org/10.3390/physchem3010008
Submission received: 30 November 2022 / Revised: 16 January 2023 / Accepted: 18 January 2023 / Published: 26 January 2023
(This article belongs to the Section Nanoscience)

Abstract

:
Changing the composition of a precursors mixture is a powerful tool to tune the structure and properties of carbonaceous nanoparticles synthesized via the solvothermal route. We have addressed the influence of the ratio of urea or thiourea to citric acid during their solvothermal treatment in dimethylformamide on the optical and sensing properties of the obtained colloidal product. It has been found that the urea-derived products are more diverse in comparison with the thiourea-based ones. The excitation-dependent fluorescence of the products and their sensitivity to mercury(II) ions have been investigated; one to three types of fluorophores have been observed in the products depending on the composition. The nanoparticles prepared in excess of urea have been found more sensitive to the heavy metal, with the sensitivity of the long-wave emission band being superior.

Graphical Abstract

1. Introduction

Carbon-based nanodots and nanoparticles have been recognized as promising functional materials due to their excellent colloidal stability, biocompatibility, possibility of chemical modification, and peculiar optical properties [1]. One of the most striking features of the carbonaceous nanodots and nanoparticles is their fluorescence typically excited by UV or visible-range irradiation. The fluorescence properties can be used in light-emitting devices, including screens for portable devices, yet this technology has not been matured. Application of carbon-based nanoparticles in qualitative sensing and the quantitative determination of heavy metals and organic species (exploiting the sensitivity of their emission properties to the presence of various analytes) has been better explored. Other applications of the carbonaceous nanoparticles include catalysis and energy harvesting [1]. These applications also rely on the optical properties of the nanoparticles: the ability to absorb UV and visible light, being converted in the excited state and capable of initiating photoreactions. The essence of the use of dispersed (colloidal) nanoparticles is due to two factors. The emission of the nanoparticles due to the defects in the graphitic core is, as a rule, strongly dependent on the size of the core (hence, such objects are usually called carbon nanodots). The effects due to the surface functional groups (optical properties, binding capacity, catalytic activity, etc.) are also more pronounced for colloidal particles due to the increased specific surface area. Moreover, nanosized particles are more stable against sedimentation, allowing their prolonged use in aqueous media. Nitrogen-doped nanoparticles are beneficial over other carbon-based nanomaterials due to the higher quantum yield and the possibility of fluorescence excitation by light with a wavelength of about 500 nm [2], which is close to the window of biological tissues transparency, enabling the application of such carbon nanoparticles for in vivo imaging and phototherapy [1].
Microwave or solvothermal treatment of a mixture of citric acid and urea are simple and efficient approaches to prepare nitrogen-doped carbon nanodots and nanoparticles [3]. These processes can be performed in bulk as well as in a solution in water or other polar solvents such as ethanol or dimethylformamide [4]. The attempts to elucidate the products’ structure have been recently reported [5,6]. It has been argued that the primary interaction of urea and citric acid leads to citrazinic acid, described in 1893 [7], whereas further condensation reactions yield well-defined low-molecular species such as 4-hydroxy-1H-pyrrolo [3,4-c]pyridine-1,3,6(2H,5H)-trione [6] along with more complex products mixtures including oligomeric ureas, melamine, guanidine, and other CN ring structures stabilized by the oligomers and forming sophisticated hydrogen bond networks which stabilize the nanoparticles [5].
Although certain progress has been made towards the investigation of the molecular mechanism of the nanoparticle formation from urea and citric acid [8], tuning their optical and other properties has largely remained an empirical issue due to complexity of the process. Therefore, many reports have appeared discussing the effects of the process duration, temperature, and the components ratio on the synthesis outcome. For example, the microwave-assisted (domestic microwave oven) formation of carbon nanodots in an aqueous solution of a 1:1 mixture of urea with citric acid, the synthesis duration being 30 to 300 s, has been investigated in [9]. Gradual change in the product coloration has revealed the reaction progress. The absorption spectra have been qualitatively similar when the treatment duration has been of 60–300 s, its intensity being regularly increased with the treatment duration. The fluorescence (excitation wavelength 300–350 nm, emission band maximum 435–440 nm) has been observed only for the samples treated during 150–300 s. The spectral shape as well as the band gap have been found independent of the synthesis duration, meaning that the nature of the emitting species has not been changed throughout the process. It should be noticed that the dialysis of the samples to remove the low-molecular products has not been mentioned by the authors.
In a similar study [10], the effect of the heating rate (1.6–9.6 deg/min) and duration (up to 90 min) on the outcome of the hydrothermal treatment of a urea–citric acid mixture has been studied. The urea/citric acid mass ratio was constant (18.5:1), whereas the total components concentration was varied between 0.025 and 1.27 mol/L. The product photoluminescence intensity was passed through a maximum at the process duration corresponding to a temperature of 150–170 °C; further weakening of the photoluminescence has been ascribed to the formation of larger nanoparticles. Indeed, the mean size of the particles formed at 150 and 180 °C at the lowest heating rate was 2 and 29 nm, respectively. No effect of the heating rate on the quantum yield of fluorescence (31–33%) for the product obtained at the optimal duration has been found. Hence, it has been concluded that the synthesis temperature is the most important factor determining the formation of stable, highly fluorescent nitrogen-doped carbon dots. Unfortunately, the details of the sample purification upon the synthesis have not been mentioned in this report either.
Another study of a similar hydrothermal process (temperature 140–240 °C, duration 2–10 h, urea/citric acid mass ratio 1:223 to 1:22, aqueous solution) [11] has led to a somewhat different conclusion. Upon the synthesis, the product was filtered and subject to dialysis in order to remove large particles and low-molecular species. In this study, the strongest fluorescence was observed in the case of the longest treatment at the highest temperature (the 5–10 nm graphitic particles were found in the product by means of TEM), which is in seeming contradiction with the findings in [10]. However, the initial mixture compositions in these studies were strongly different: a large excess of urea in [10] and of citric acid in [11]. Therefore, the composition of the reaction mixture is another important factor affecting the process outcome.
The influence of the mixture composition has been addressed in several studies, including [12] (microwave treatment of an aqueous solution), [13] (microwave treatment of a humid mixture), and [14] (solvothermal treatment of ferric citrate and urea in dimethylformamide). The strong dependence of the products’ optical properties on the mixture composition has been revealed in these studies, yet the details have been different. In the case of the microwave-assisted hydrothermal treatment [12], the urea/citric acid mass ratios between 5:1 and 1:5 were examined, with the aqueous solution concentration being 13%. The products were purified via centrifugation and dialysis. Electronic absorption spectra of the products contained several bands with maximums at about 275, 330, and 415 nm, with their ratio being variable. Emission spectra of the products obtained in the excess of citric acid showed blue fluorescence, with the maximum at about 440 nm (excitation wavelength 370 nm), whereas those obtained at the 1:1 ratio or in excess of urea revealed green fluorescence (emission maximum at 540 nm) when excited at 408.5 nm. The obtained products were used to detect allantoin: the nanodots obtained in the excess of citric acid revealed the enhancement of the fluorescence in the presence of allantoin, which has been ascribed to the hydrogen bonding between allantoin and surface citrazinic acid groups of the nanodots, as supported by the XPS data. Moreover, the graphitic structure of the nanodots has been confirmed by TEM. The products obtained in the excess of urea have been found insensitive to the presence of allantoin.
When the microwave-assisted synthesis was performed with only small amount of water (10 g per 100 g of the solids mixture; the urea/citric acid mass ratio was varied between 3:1 and 1:3) [13], the absorption spectra were slightly different. The samples obtained in the excess of citric acid revealed the bands at about 350 and 450 nm (the long-wave band has appeared as a shoulder shifting to a shorter wavelength with the decrease in citric acid excess), whereas the bands were at about 330 and 415 nm at the 1:1 ratio or in excess of urea, with the long-wave band being stronger. The samples revealed a blue (excess of citric acid) or green (1:1 or excess of urea) fluorescence under 360 nm UV irradiation. When the excitation wavelength was tuned (340–450 nm), the emission band shifted from 410 to 550 nm (excess of citric acid) and from 370 to 550 nm (excess of urea). Longer excitation wavelengths have not been probed. It should be noted that the dialysis stage has not been mentioned in this study.
In the case of the solvothermal treatment in dimethylformamide (160 °C, 6 h) [14], ferric citrate was utilized instead of citric acid as the precursor, and the urea/ferric citrate mass ratio was varied between 1:1 and 6:1 (the compositions in excess of citrate have not been studied). Only centrifugation has been mentioned as the product purification method. The electronic absorption spectrum of the nanodots contained an n-π* transition band at 340 nm and a shoulder at 420 nm. The luminescence spectra showed a blue emission band at about 450 nm (excitation at 300–370 nm), blue and green emission bands when excited at 380 nm, and a green emission band at about 530 nm at longer excitation wavelengths (390–510 nm). This pattern was found similar independently of the reaction mixture composition. It has not been mentioned if iron has been retained in the nanodots or in the external liquid phase.
Hence, to the best of our knowledge, studies of the effect of the precursors mixture composition on the outcome of solvothermal treatment of urea and citric acid in organic media have been lacking. However, it is known that the change of solvent during the heat treatment can strongly affect the optical properties of the product. For example, the heating of a 1:2 urea–citric acid mixture (180 °C, 10 h) in water, ethanol, and dimethylformamide has resulted in blue (emission maximum at 450 nm), yellow (550 nm), and red-emitting (650 nm) carbon nanodots, respectively [4]. The possibility of increasing both the excitation and emission wavelengths is interesting in view of the solar energy harvesting and in vivo biomedical applications. Therefore, in the present study, we decided to probe the effect of the urea–citric acid mixture composition on the outcome of its solvothermal treatment in dimethylformamide. The range of compositions was chosen to cover both urea- and citric-acid-rich mixtures (7:1 to 1:7). Although the temperature and duration of the synthesis could likely affect product properties as well, we kept them constant in the scope of this study.
Furthermore, it has been argued that the codoping of carbon nanoparticles with nitrogen and sulfur can be advantageous in view of their antioxidant properties [15] and the detection of nitric oxide [16]. The codoping has been achieved in the mentioned studies via the introduction of either α-lipoic acid [15] or sodium thiosulfate [16] into a urea–citric acid mixture during the hydrothermal treatment. Several studies have mentioned the possibility of direct introduction of nitrogen and sulfur into carbon nanodots via hydrothermal treatment of a mixture of citric acid and thiourea [17,18,19,20,21]. To the best of our knowledge, only two reports have discussed the solvothermal treatment of thiourea–citric acid mixtures in dimethylformamide. It has been marked that the obtained nanoparticles can be self-oxidized during storage, which affects their optical properties [22]. In the other study [23], several peculiar pH- and solvent-dependent effects have been described as well as the possibility to use the prepared nanoparticles for the detection of complex organic molecules, but the influence of the precursors mixture composition has not been detailed. Therefore, we also explored the solvothermal treatment of thiourea–citric acid mixtures of different composition in dimethylformamide and compared its outcome with the urea-based mixtures.
In our study, we mainly addressed the absorbance and fluorescence of the prepared products as well as their fluorescence sensitivity to the presence of mercury(II) ions. We have recently shown [24] that the so-prepared carbonaceous particles exhibit the selective quenching of the fluorescence by this heavy metal; therefore, it was of additional interest to probe the effect of the initial mixture composition on the colloidal product sensitivity. The major novelty of our research in comparison with the earlier reports consists of the comprehensive investigation of the optical properties of colloidal products obtained via the solvothermal treatment of urea or thiourea with citric acid, the mixture composition being widely varied between 7:1 and 1:7 (by weight) and the other synthesis conditions being identical; moreover, we compared the properties of the urea- and thiourea-based products obtained under identical conditions.

2. Materials and Methods

In a typical synthesis, a 10 wt% solution of a mixture of citric acid with urea or thiourea in dimethylformamide was heated at 160 °C during 8 h in a Teflon-lined steel autoclave. Upon the thermal treatment, the reactors were cooled down to ambient temperature naturally. The reaction products were purified via dialysis through a membrane (cutoff limit 1000 Da) against distilled water and filtered through a 0.45 μm syringe filter. The first portion of the dialysate was used for comparison. The components mass ratio was varied between 7:1 and 1:7. If not stated otherwise, the samples composition was denoted as the mass ratio of urea (or thiourea) to citric acid throughout the paper. Synthesis and isolation of the products described in this study are represented schematically in Figure 1.
Urea, thiourea, citric acid, and dimethylformamide (chemical pure grade) were purchased from local suppliers and used as received. Distilled water was used as solvent during the samples characterization.
The electronic absorption spectra and the emission spectra excited at 365 nm were recorded using a modular system including a Maya 2000 Pro detector (Ocean Optics, USA) and a DH-2000 light source (absorption measurements) or a 365 nm diode (fluorescence measurements). Quantum yield of the samples fluorescence was determined with quinine sulfate as reference using a conventional comparative technique [25]. The fluorescence spectra at variable excitation wavelengths (300–580 nm) were registered in 96-well Black Flat Bottom plates using a Varioscan LUX Microplate reader (Thermo Fisher Scientific, Waltham, MA, USA). The specimen volume was always the same to ensure constant optical pathlength. The particle size was determined by means of nanoparticle tracking analysis (NTA) using a ZetaView® PMX420-QUATT instrument (Particle Metrix GmbH, Inning am Ammersee, Germany) equipped with a 488 nm laser, while the data were analyzed using ZetaView NTA software. The instrument was calibrated using a reference sample with a known concentration of 100 nm polystyrene nanoparticles (Applied Microspheres B.V., Netherlands) prior to the measurements. The standard was suspended in particle-free water, and the investigated samples were diluted with Milli-Q water to achieve the appropriate concentration. Data processing, exploratory analysis, and the results visualization were performed using R 4.2.1 (base 4.2.1 and tidyverse 1.3.2 packages).

3. Results

3.1. Sample Appearance and Purification

The as-prepared samples were red–brown to brown liquid dispersions with keen smell, containing a negligible amount of the precipitate. Upon dialysis, a series of liquid dispersions with no smell exhibiting pronounced red laser scattering (which marked the presence of nanoparticles) were obtained. Their appearance was as shown in Figure 2 (top row). Prior to taking the photos, the samples were diluted according to the total volume of the sample and total mass of the precursors (urea and citric acid) in the reaction mixture, hence the intensity of the coloration qualitatively reflected the amount of the colored products in the mixtures. The strongest coloration was observed in the case of the 1:1 precursors ratio for both the urea and thiourea series. Judging from the color tone, the samples prepared from the urea–citric acid mixtures in excess of either component were qualitatively different. That was also true for the thiourea-based series, yet not so well seen due to overall lower color intensity. The coloration of the obtained thiourea–citric acid 1:7 sample was so weak that it was excluded from the consideration in this study.
The dialysates were orange to brown liquids differing only in the color intensity (the images of the first, most concentrated, portion without any dilution are shown in the bottom row in Figure 2). As in the case of the purified samples, the strongest color was observed in the case of the 1:1 mixtures. The dialysates did not exhibit red laser scattering, which confirmed the absence of colloidal particles in them.

3.2. Particle Size Distribution

Taking advantage of the light-scattering properties of the obtained purified samples, we determined the particle size in the urea–citric acid series by means of nanoparticle tracking analysis (see the results in Table 1 and an example of the resulting particle size distributions in Figure 3). It was found that the median size of the particles in the samples was only slightly dependent on the initial mixture composition. The samples prepared in the excess of citric acid (1:5 and 1:7) revealed somewhat larger particles than the samples prepared from the 7:1–1:1 mixtures; despite small magnitude of the effect, it exceeded the standard deviation of the median size values. The 1:3 sample was an exception, showing about two times smaller particles in comparison with the other samples. That was unlikely to be a measurement artifact, since the effect was well reproducible in three sets of independent observations, but its possible origin is unclear so far.
Since the NTA technique allowed direct observation of single nanoparticles in the Brownian motion, we obtained complete and accurate particle size distributions of the samples. They were found to be relatively broad, with about 10% (by number) of the particles falling in the nanoparticles range (diameter of 100 nm and smaller, see the 10th percentile of the diameters distribution in Table 1), the major fraction of the particles in the samples being in the colloidal size range.
Moreover, the NTA measurements afforded the number-based concentration of the particles in the samples. Using those data, we estimated the yield of the colloidal particles with respect to the mass of the starting precursors (see the details of the calculation in [24]). The obtained yield was rather low, yet, coinciding with the visual inspection of the samples, the highest yield was obtained at the 1:1 mass ratio of urea and citric acid. The yields obtained in excess of urea (the 7:1–3:1 samples) were somewhat lower yet comparable to it, whereas the increase in the citric acid excess (the 1:3–1:7 samples) led to an extremely low yield of the particles.
It should be noted that the samples of the urea–citric acid series were found to be stable against aggregation in a neutral salt-free aqueous medium. Repeated measurements of the median particle size and the size distributions performed over a month gave identical results. On the other hand, the samples of the thiourea–citric acid series were less stable, revealing the noticeable sedimentation of the purified samples upon storage during several days. Therefore, the NTA data for these samples are not presented here, since they demand additional verification.

3.3. Electronic Absorption Spectra

The electronic absorption spectra of the purified samples of both series are shown in Figure 4. The samples were diluted with water to ensure the absorbance of about 0.1 at 365 nm, which is required for the quantum yield measurements.
In the urea–citric acid series, the samples prepared in the largest excess of citric acid (1:5 and 1:7) exhibited strong UV absorption, with a maximum at 330–340 nm. The increase in the urea fraction led to the vanishing of that peak and the appearance of the absorption bands in the visible range, with maximums at 415 and 530–560 nm, depending on the composition. On the contrary, the samples of the thiourea–citric acid series revealed the UV range absorption band with maximum at 330–340 nm irrespectively of the precursors ratio. The samples prepared in excess of thiourea and at the 1:1 ratio showed an additional visible-range band, with a maximum at 550 nm. Overall, the spectra of the samples of that series were less composition-dependent in comparison with the urea–citric acid ones.
Comparison of electronic absorption spectra of the purified samples with the corresponding dialysates (see representative examples for the 1:1 mixtures in Figure 5) revealed that, in most cases, the spectra were different, which was in agreement with the sample color (Figure 2). That fact marked the pronounced difference in the electronic spectra (and, hence, the structure) of the low-molecular and colloidal fractions of the solvothermal treatment products.

3.4. Fluorescence Properties

Fluorescence spectra (excitation 365 nm) of the purified urea–citric acid samples (Figure 6a) revealed that the emission properties of the colloidal fraction of the products were affected by the initial mixture composition. The samples obtained in excess of citric acid (1:5 and 1:7) exhibited a single emission band, with a maximum at 460 nm. The increase in the fraction of urea in the precursors mixture (1:3 and 1:1) led to the red shift of the emission band, its maximum being observed at 540 nm. Further enrichment of the precursors mixture with urea (3:1–7:1) resulted in the splitting of the emission band into two weaker ones, with the maximums at 480–530 and 640 nm. Since the region of the local minimum (about 560 nm) corresponded to the visible-range absorption maximum of the samples (Figure 4a), the band splitting could be due to the partial self-absorption of the emitted radiation.
In contrast, the thiourea–citric acid samples revealed the more similar shape of the emission spectra (Figure 6b). The main emission maximum was observed at 450–460 nm, and the long-wave shoulder at about 560 nm was observed for the samples obtained in excess of thiourea (7:1–3:1). The similarity of the emission spectra was in line with the similar shape of the absorption spectra of the corresponding products (Figure 4b), the long-wave emission shoulder being observed for the samples with a stronger absorption in the range of the primary emission maximum.
It should be noted that the emission spectra of the dialysate and the purified sample of the same composition were in certain cases very similar in shape (Figure 6d), although in most cases they were different (Figure 6c). Overall, the difference in the emission spectra shape between the purified and the dialysate samples of the same composition was the most pronounced for the urea–citric acid 7:1–1:3 mixtures and for the thiourea–citric acid 7:1–3:1 ones.
We calculated the quantum yield of fluorescence (λex 365 nm, λem 390–800 nm) of the obtained samples (Table 2). In most cases, it was much higher for the dialysates than for the corresponding purified samples. The efficiency of the fluorescence at that excitation wavelength was significantly lower in comparison with the values reported in the literature; the possible reasons will be given below in the Section 4.
To get better insight into the emission properties of the obtained purified samples, we recorded their emission spectra at different excitation wavelengths ranging between 300 and 580 nm. First, we determined the optimal concentration of the specimens to obtain the strongest emission with the microplate reader experimental setup. As illustrated by a representative example in Figure 7, the increase in the concentration (corresponding to the decrease in dilution ratio from 80× to 20×) led to the expected increase in the emission intensity; however, the decrease in the dilution ratio from 15× to 5× resulted in the weakening of the emission due to the self-absorption of the excitation and/or emitted light. Hence, the optimal dilution to examine the emission of the urea–citric acid 1:1 sample was considered to be 15–20×. Similar trial experiments were performed for other samples.
The effect of the precursors mixture composition on the excitation wavelength-dependent fluorescence is illustrated in Figure 8 (urea–citric acid) and Figure 9 (thiourea–citric acid). To use the same color scheme across the samples, the excitation–emission maps were normalized with respect to the peak value. Hence, the two-dimensional plots in Figure 8 and Figure 9 allowed comparison of the shape of the spectra over the samples series rather than their intensity. The obtained data revealed several characteristic excitation–emission patterns in the spectra.
In the case of the urea–citric acid system (Figure 8), the fluorescence excited at 550 nm (emission maximum at about 630–640 nm) was the strongest for the 7:1–3:1 samples, becoming relatively weaker in the case of the 1:1 sample and almost vanishing for the 1:3–1:7 samples. The fluorescence excited at 440 nm (emission maximum at about 550 nm) was observed for the 7:1–1:5 samples (being absent only for the highest fraction of citric acid), and it was the strongest emission in the case of the 1:1 and 1:3 compositions. The fluorescence at 460 nm excited by 380 nm irradiation was noticeable in the spectra of the 7:1 and 5:1 samples, becoming much weaker for the 3:1 composition and almost disappearing at higher fractions of citric acid. Finally, the strongest emission for the mixtures enriched in citric acid (1:5 and 1:7) was excited at 320–340 nm, to give the emission band with a maximum at 430–440 nm.
In the case of the thiourea–citric acid system (Figure 9), only three characteristic excitation–emission combinations were observed. Excitation at 540 nm gave rise to emission at about 625 nm; that band was observed for the 5:1–1:1 samples and even in those cases it was much weaker in comparison with the major band. The band excited at 440 nm (emission maximum at about 550 nm) was observed for the thiourea-rich samples of 7:1–1:1, being more pronounced at a high fraction of thiourea in the precursors mixture. The major band, the strongest over the whole range of compositions, was excited at 340–360 nm and gave the emission maximum at about 440 nm; that band was exclusively seen in the obtained maps for the citric-acid-rich mixtures.

3.5. Sensitivity to Hg(II)

We further examined the sensitivity of the above-marked emission bands to the presence of mercury(II) in the specimen. The concentration of mercury(II) nitrate, 10 µmol/L, was chosen to be at approximately the midpoint of the calibration curves for similar samples studied in [24]. In other words, it was expected to noticeably quench the fluorescence excited at 365 nm.
Several characteristic cases for the urea–citric acid series are shown in Figure 10. The intensities were normalized to the peak value of the corresponding Hg-free sample, hence the comparison of the pairs of the plots before and after addition of mercury(II) nitrate revealed the change in both the spectral pattern and intensity. The emission maps revealed different sensitivities of the characteristic bands of the colloidal products to the presence of the Hg(II) ions. In the case of the 7:1 sample, the strongest emission band excited at 540 nm became weaker than that excited at 380 nm upon addition of Hg(II). The major band of the 1:1 sample (excited at 440 nm) was almost vanished in the presence of Hg(II). At the same time, the band of the 1:7 sample excited at 340 nm was only minorly affected by the addition of a relatively high concentration of the mercury salt.
Those preliminary conclusions were confirmed by the dependences of the relative intensity of fluorescence for the 7:1 sample at different combinations of excitation and emission wavelengths (Figure 11a) and for different samples (Figure 11b). The plots in Figure 11a show that the band excited at 540 nm was indeed the most sensitive to the presence and concentration of Hg(II) in the solution of the urea–citric acid 7:1 sample. The plots for the different samples and the most sensitive bands (Figure 11b) demonstrated that the 7:1 and 1:1 samples exhibited the highest sensitivity to the concentration of Hg(II), the detection limit being about 0.2 µmol/L and the detection range being 0.5–10 µmol/L. The sample of colloidal particles prepared at a higher content of citric acid (1:3) was about five times less sensitive, whereas detection limit of Hg(II) using the 1:7 sample was above 10 µmol/L, almost two orders of magnitude higher than for the 7:1 and 1:1 samples.
In the case of the thiourea–citric acid samples of different composition (Figure 12), the presence of the relatively high concentration of Hg(II) in the specimen revealed only a minor effect on both emission bands of the samples.

4. Discussion

We considered a wide range of compositions of urea–citric acid mixtures subject to solvothermal treatment in this study. Since the properties of the so-obtained nanoparticles were expected to strongly depend on the nature of the solvent used in the synthesis [4], we compared our results with the available reports on relevant solvothermal preparations in dimethylformamide [4,14,26,27,28]. In general, our findings coincided with the properties of carbon nanodots prepared in other studies in excess of urea or at a 1:1 mass ratio of the precursors [4,14,26,28] as well as in slight excess of citric acid [4,
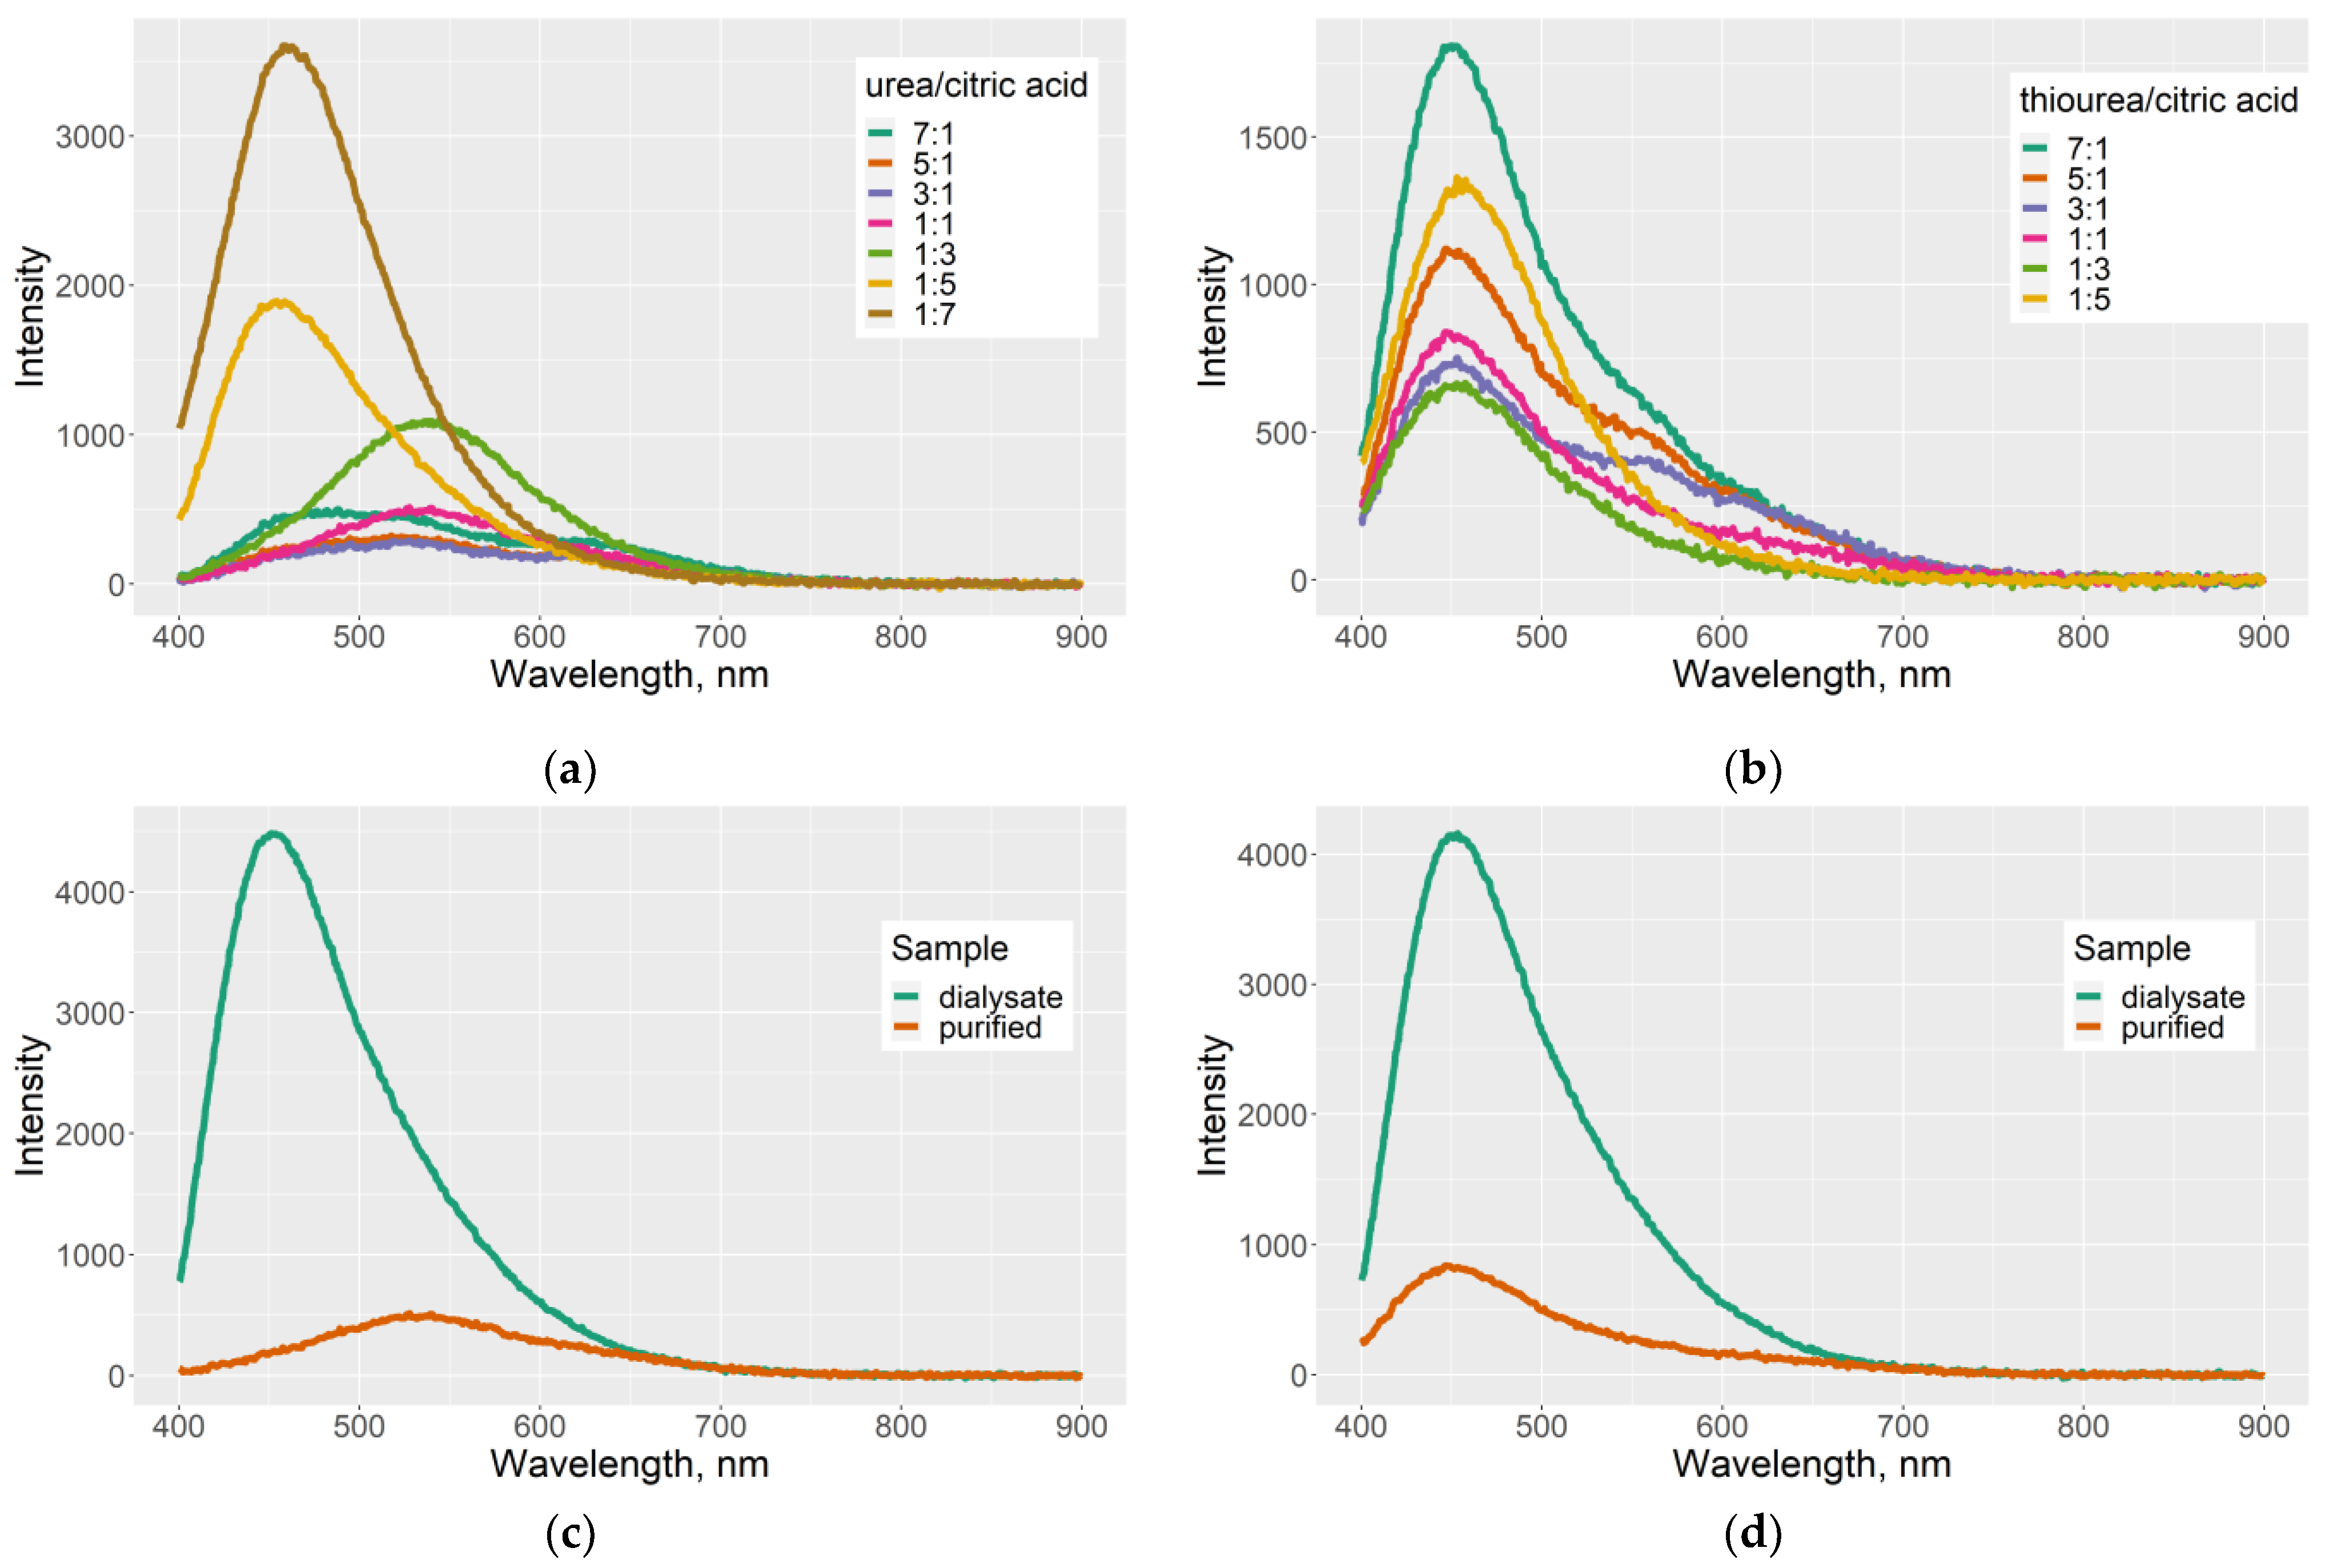
27]: the multicolor excitation-dependent fluorescence of the solvothermal treatment products was observed. Important progress made in our study was the direct examination of the synthesized nanoparticles by means of the NTA technique, without isolation for TEM study. Comparison of the samples prepared over a wide range of the mixtures composition, 7:1 to 1:7, revealed that the highest yield of the colloidal particles was achieved at the urea/citric acid mass ratio close to unity (Table 1), whereas their concentration in the product rapidly decreased at more than threefold excess of either precursor. Moreover, the characteristic groups of the samples were revealed based on the absorption (Figure 4a) and emission spectra (Figure 6a and Figure 8): those prepared in significant excess of urea (7:1 to 3:1), at equal mass ratio or in slight excess of citric acid (1:1 and 1:3), and at large excess of citric acid (1:5 and 1:7). Four types of fluorophores differing in the excitation wavelength and the emission spectrum were detected in the colloidal products (Figure 8). Their presence and fractions in the sample depended on the precursors ratio during the synthesis, as described in detail in the Section 3. Hence, variation of the initial precursor ratio during the solvothermal treatment is a facile and powerful tool to tune the optical properties of the obtained products, in addition to variation of other process conditions such as temperature and the duration of the treatment [27] or the solvent nature [4].
Comparison of optical properties of the purified colloidal products and the dialyzed low-molecular species revealed that they were strongly different. Hence, the colloidal particles were not merely associated low-molecular dyes or inert nanoparticles bearing dye-like surface groups; the nature of the nanoparticle core affected the electronic structure of the fluorophores.
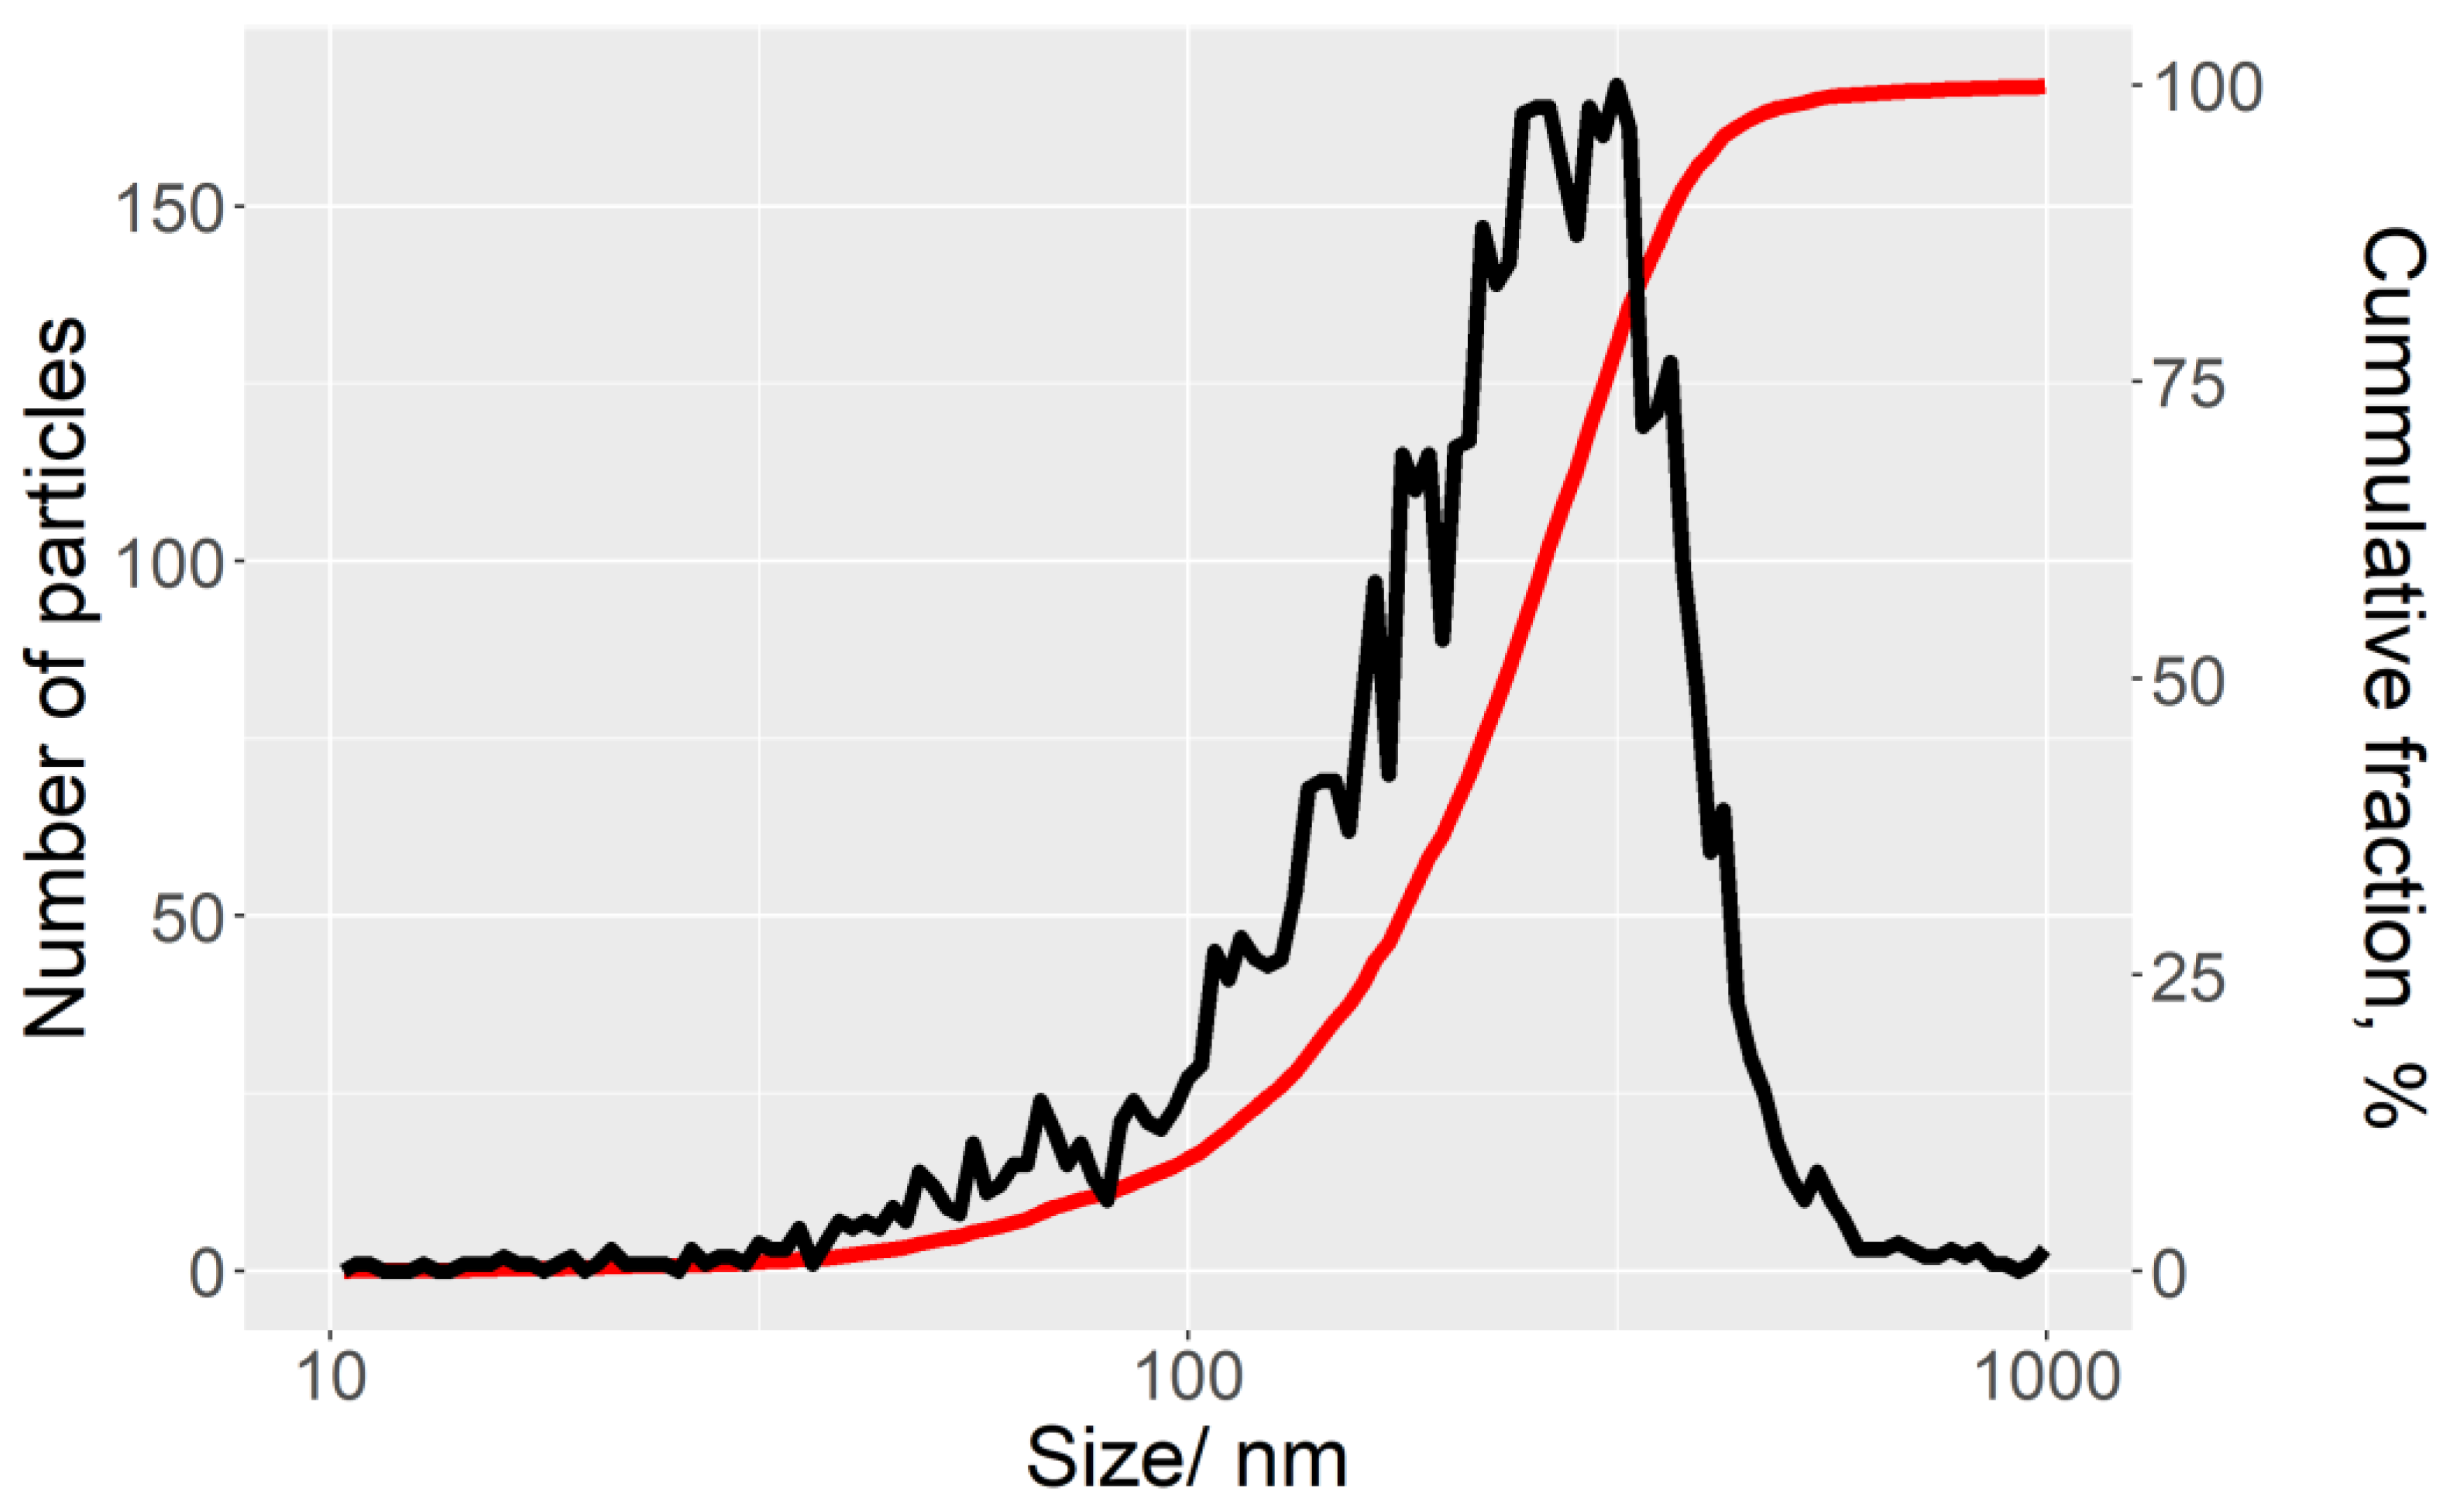
It should be noted that the yield of colloidal particles estimated from their concentration assessed by means of the NTA was quite low (Table 1). That fact could be caused by at least two reasons. First, the gaseous products and low-molecular species separated off by dialysis could indeed constitute the major fraction of the mixture under the probed reaction conditions (heating at 160 °C during 8 h). In that case, the yield of colloidal particles could be improved by tuning the reaction conditions, for example using a factorial-based approach [27]. Second, significant part of the prepared samples could be constituted by ultrasmall nanodots with size below 10 nm. This size is at the edge of the sensitivity of the scattering-based NTA instrument, and the corresponding particles could be counted inaccurately (although a small fraction of 7–15 nm particles was detected in the sample). To verify that suggestion, we plan to perform comprehensive particle size analysis by means of the NTA, TEM, AFM, and DLS in the future study. Another possible reason for the low yield of the particles, the formation of a large amount of insoluble products, was ruled out in the present study, since we did not observe any noticeable precipitate in the samples, irrespective of the composition. Let us notice that when the precursor concentration of the treatment temperature was increased (the data on these samples will be reported elsewhere), the precipitate was indeed formed during the synthesis.
Another feature of the samples prepared by us was the relatively low quantum yield of fluorescence estimated in our study (1–4%, Table 2). The relevant earlier studies have reported the quantum yield of 15 [26,27], 39–43% [28], and up to 48% [
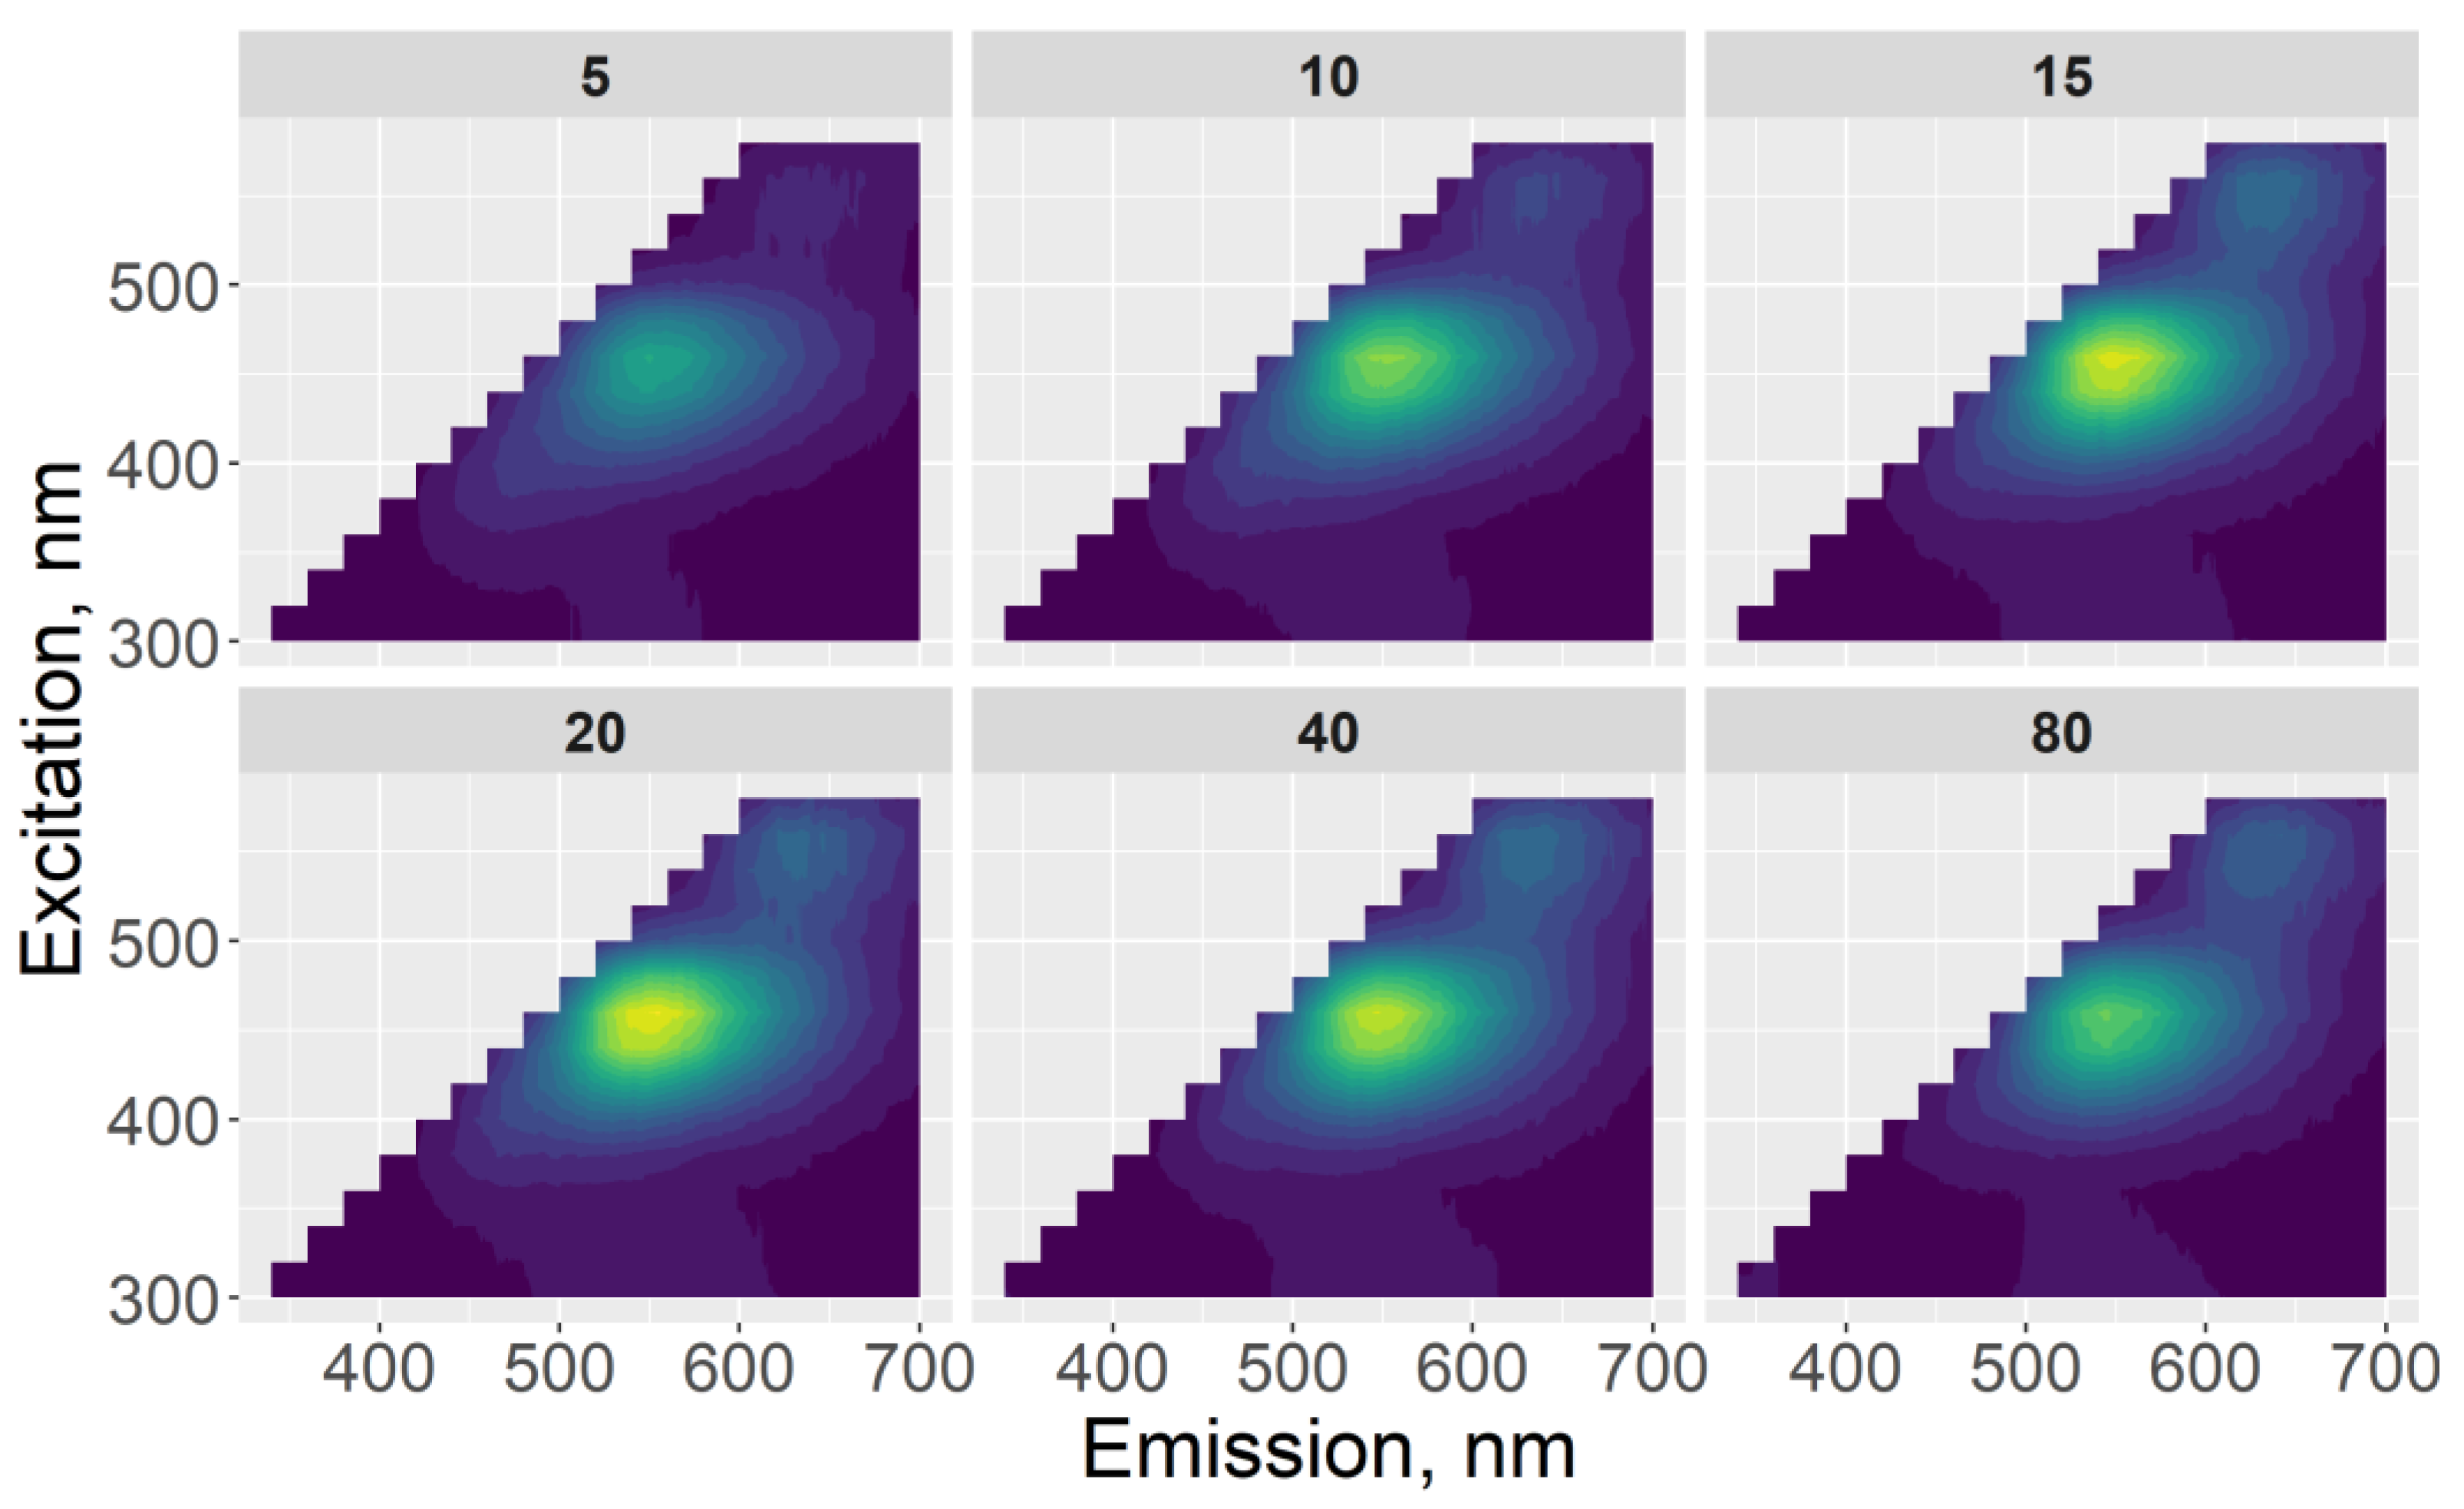
14]. Although the upper edge of the reported values seems unusually high (let us notice that the latter two reports stating the highest quantum yield have not mentioned the dialysis step of the samples purification, and the obtained products could be contaminated with low-molecular impurities), it was reasonable to assume that typical quantum yield of the urea–citric acid nanodots should be 15%. The unpleasantly low quantum yield determined in our study was caused by two different reasons, depending on the precursor mixture composition. In the case of the urea-rich products (7:1–3:1), the major reason was the fact that the strongest emission was excited at 540–550 nm (Figure 8), whereas we determined the quantum yield at the excitation wavelength 365 nm, with the corresponding band being relatively weak. From the shapes of the absorption and emission spectra of these samples, it is reasonable to assume that the quantum yield of fluorescence of the major emission band should be several times higher, but accurate data are not available at the moment. For the citric acid-rich samples (1:5 and 1:7), excitation at 365 nm corresponded to the major emission band (Figure 8). However, despite the excellent colloidal stability during storage observed for those samples, they contained a fraction of larger particles separable by centrifugation at 13k rpm during 30 min. Our preliminary results revealed that the emission intensity of the samples was strongly improved upon centrifugation. Therefore, it can be expected that further purification via centrifugation and/or fractional precipitation can noticeably improve the quantum yield observed for those samples. Finally, fluorescence of the colloidal products is pH-sensitive [27], and further enhancement of the quantum yield can be expected in basic media instead of the neutral solutions used in the present study.
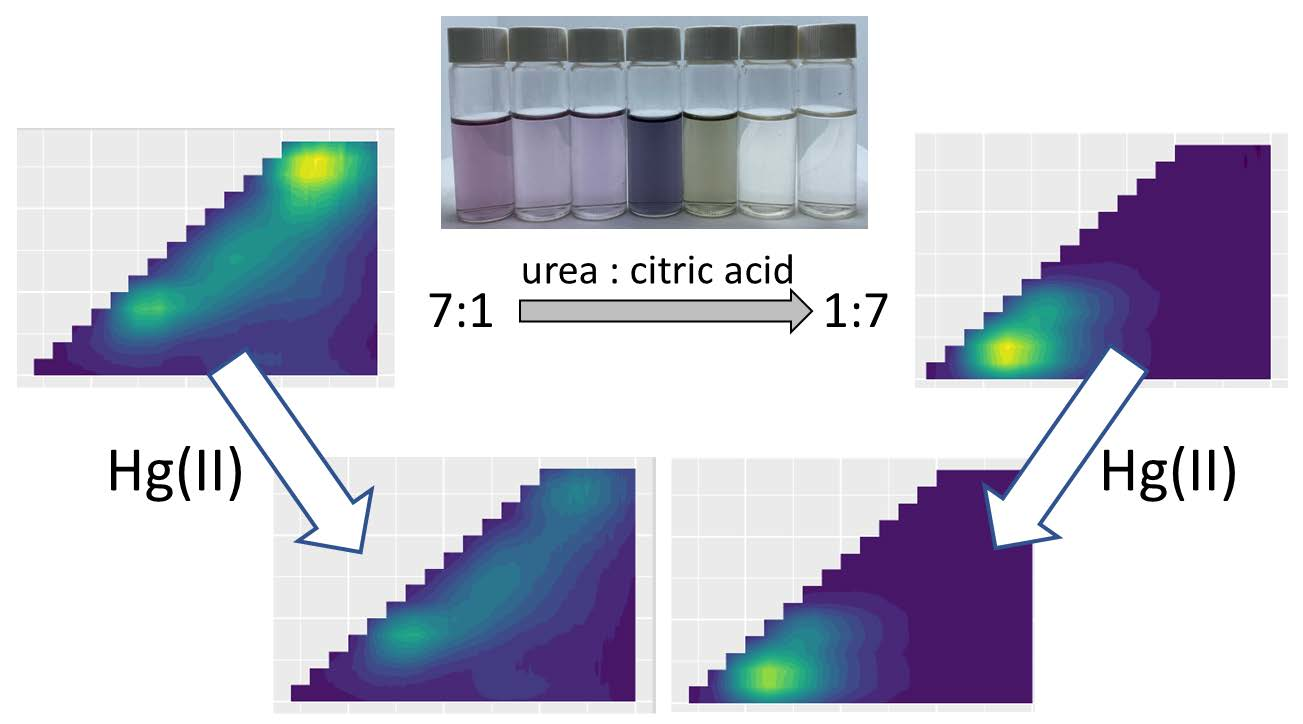
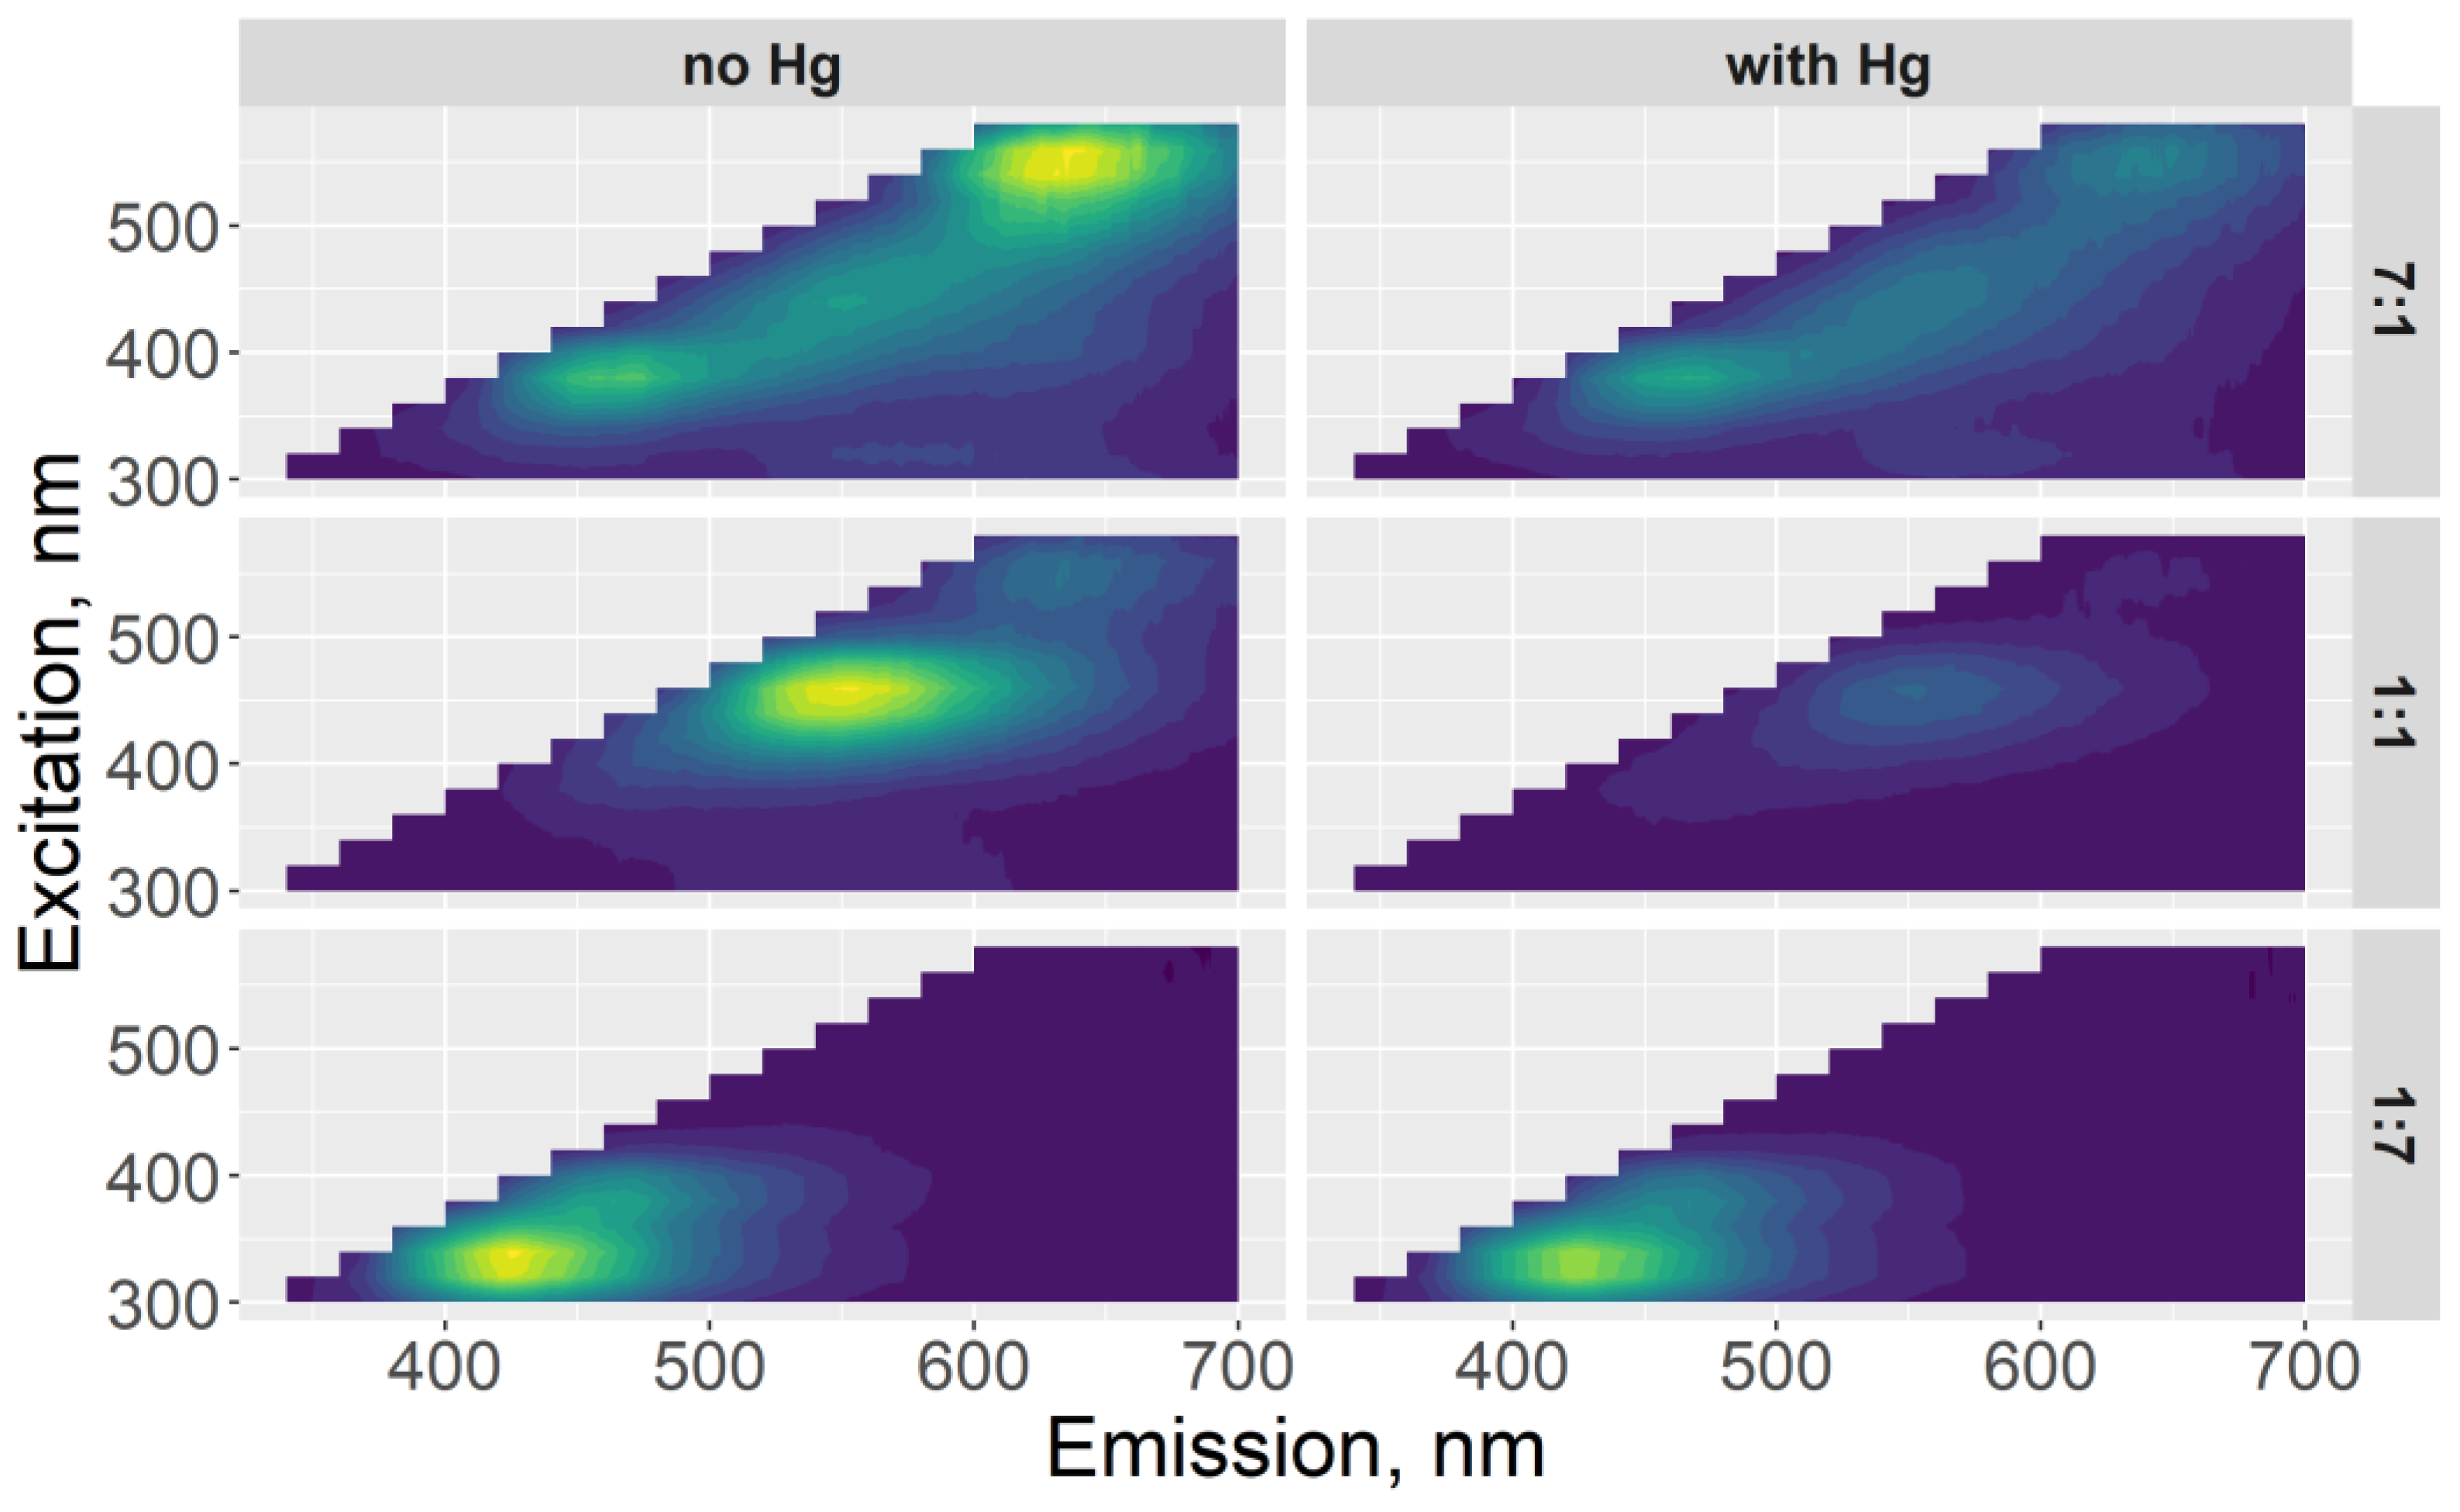
As shown in Figure 10 and Figure 11b, the composition of the precursor mixture affected the sensitivity of the obtained colloidal products to the presence of Hg(II) ions. The best results were obtained for the urea-rich samples (7:1–1:1), for which the detection limit was on the order of 0.1 µmol/L, whereas the citric-acid-rich ones revealed noticeable quenching of fluorescence at a Hg(II) concentration as high as 10 µmol/L. Even without the specific optimization of the detection conditions, the detection limit estimated in the present study was comparable to that reported elsewhere (0.06 µmol/L [29], 0.05 µmol/L [30]). It has been shown that the proper adjustment of the experimental conditions (for example, the concentration of the nanodots and pH [31]) can improve the detection limit by 1–2 orders of magnitude. Indeed, our trials demonstrated that changing the medium to a borate-buffered solution enhanced the quenching of the fluorescence of the obtained colloidal products excited at 365 nm. The effect of the medium on the excitation wavelength-dependent sensitivity and the selectivity to the presence of different heavy metals is still to be explored.
The effect of the different sensitivities of the emission bands to Hg(II) depending on the excitation wavelength (Figure 11a) has also been earlier reported for Cu(II) [28]. It is expected that the proper choice of the excitation wavelength can be used to decrease the detection limit to very low concentrations, but the simultaneous measurement of other less sensitive bands can extend the detection range. Moreover, it is very likely that different species can exhibit different affinities to the surface sites of carbon nanodots, giving rise to the emission bands at different wavelengths. If so, the simultaneous detection of several heavy metals using a single probe can be achieved. Another peculiar issue is the effect of the colloidal fraction on the quenching-based determination of metal ions. On the one hand, our study indicated that the relatively large colloidal particles reduce the fluorescence intensity and quantum yield; however, they can also increase the local concentration of the metals due to adsorption, and this effect can be beneficial for analytical purposes.
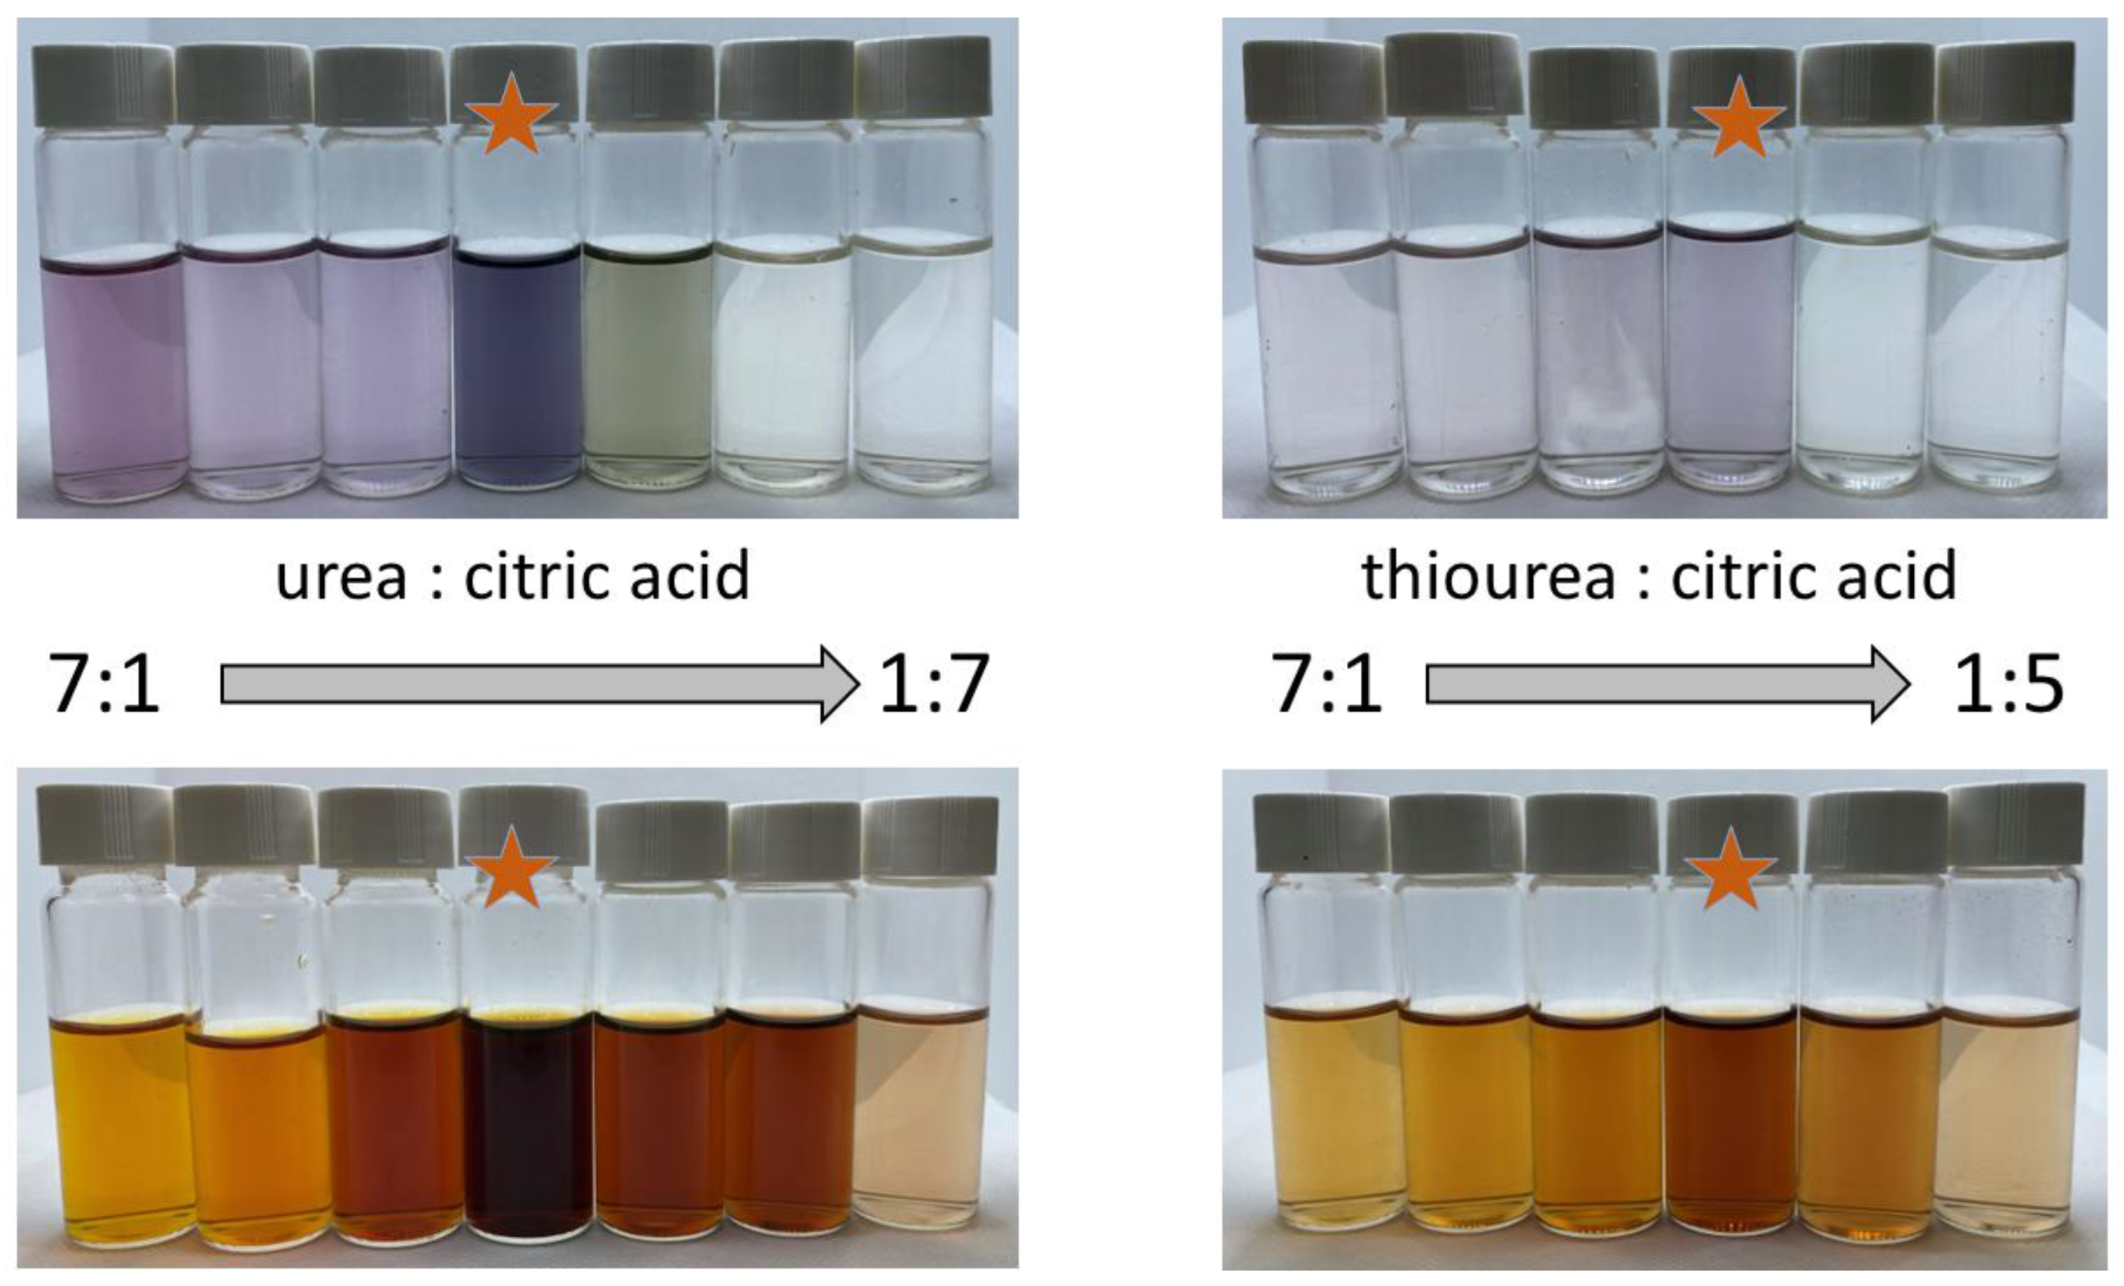
The optical properties of the colloidal products prepared from the thiourea–citric acid solutions in dimethylformamide appeared less dependent on the precursor mixture composition. In comparison with more diverse urea-based systems, only two groups of qualitatively different samples were revealed. Those prepared in excess of citric acid (1:3 and 1:5) exhibited no absorption bands in the visible-range region (Figure 4b), and only UV-induced fluorescence was observed (Figure 10). The samples prepared in excess of urea or at equal mass fractions of the precursors (7:1–1:1) exhibited an additional absorption band, with a maximum at about 550 nm (Figure 4b) and additional emission bands excited at 450 and 540 nm (Figure 10). Irrespective of the precursor ratio, the UV-excited band was the strongest, with the relative intensity of the additional bands being the highest at the thiourea–citric acid ratio of 3:1. In contrast to the urea-based systems, the position of the UV-induced band (excitation at 340 nm, emission at 440 nm) was identical for the 7:1–1:5 samples. The yield of the colloidal products was lower than in the urea-based systems, the sensitivity to Hg(II) ions was weaker, and the colloidal stability of those products during storage was poorer. Less diverse set of products (i.e., more selective reactions occurring during the synthesis) can indicate the fact that higher temperature and/or longer duration of solvothermal treatment is demanded in the case of the thiourea-based systems in comparison with the urea-based ones. The earlier reported possibility of redox and acid-base transformations involving the products of thiourea–citric acid thermolysis [22,23] make them worth further comprehensive investigation.

Author Contributions

Conceptualization, E.K. (Evgeny Karpushkin); data curation, E.K. (Evgeny Karpushkin) and E.K. (Ekaterina Kharochkina); funding acquisition, E.K. (Evgeny Karpushkin); investigation, E.K. (Ekaterina Kharochkina), E.M., and O.Z.; methodology, E.K. (Evgeny Karpushkin) and O.Z.; software, E.K. (Evgeny Karpushkin); supervision, E.K. (Evgeny Karpushkin) and V.S.; visualization, E.K. (Evgeny Karpushkin); writing—original draft, E.K. (Evgeny Karpushkin); writing—review and editing, V.S. All authors have read and agreed to the published version of the manuscript.

Funding

This research was funded by the Russian Foundation for Basic Research (project number 20-03-00692).

Data Availability Statement

Spectral data presented in this study and the R script for its processing are openly available at https://github.com/eukarr/urea_physchem (accessed on 30 November 2022).

Acknowledgments

NTA experiments were carried out using the equipment of MSU Shared Research Equipment Center “Technologies for obtaining new nanostructured materials and their complex study” and purchased by MSU in the frame of the Equipment Renovation Program (National Project “Science”) and the MSU Program of Development.

Conflicts of Interest

The authors declare no conflict of interest.

References

  1. Liu, J.; Li, R.; Yang, B. Carbon Dots: A New Type of Carbon-Based Nanomaterial with Wide Applications. ACS Cent. Sci. 2020, 6, 2179–2195. [Google Scholar] [CrossRef] [PubMed]
  2. Qu, S.; Wang, X.; Lu, Q.; Liu, X.; Wang, L. A Biocompatible Fluorescent Ink Based on Water-Soluble Luminescent Carbon Nanodots. Angew. Chem. Int. Ed. 2012, 51, 12215–12218. [Google Scholar] [CrossRef] [PubMed]
  3. Crista, D.M.A.; Esteves da Silva, J.C.G.; da Silva, L.P. Evaluation of Different Bottom-up Routes for the Fabrication of Carbon Dots. Nanomaterials 2020, 10, 1316. [Google Scholar] [CrossRef] [PubMed]
  4. Song, X.; Guo, Q.; Cai, Z.; Qiu, J.; Dong, G. Synthesis of multi-color fluorescent carbon quantum dots and solid state CQDs@SiO2 nanophosphors for light-emitting devices. Ceram. Int. 2019, 45, 17387–17394. [Google Scholar] [CrossRef]
  5. Strauss, V.; Wang, H.; Delacroix, S.; Ledendecker, M.; Wessig, P. Carbon nanodots revised: The thermal citric acid/urea reaction. Chem. Sci. 2020, 11, 8256–8266. [Google Scholar] [CrossRef]
  6. Kasprzyk, W.; Świergosz, T.; Bednarz, S.; Walas, K.; Bashmakova, N.V.; Bogdał, D. Luminescence phenomena of carbon dots derived from citric acid and urea—A molecular insight. Nanoscale 2018, 10, 13889–13894. [Google Scholar] [CrossRef]
  7. Sell, W.J.; Easterfield, T.H. LXXIII—Studies on Citrazinic Acid. Part 1. J. Chem. Soc. Trans. 1893, 63, 1035–1051. [Google Scholar] [CrossRef] [Green Version]
  8. Qu, D.; Zheng, M.; Zhang, L.; Zhao, H.; Xie, Z.; Jing, X.; Haddad, R.E.; Fan, H.; Sun, Z. Formation mechanism and optimization of highly luminescent N-doped graphene quantum dots. Sci. Rep. 2014, 4, 5294. [Google Scholar] [CrossRef] [Green Version]
  9. Kumar, P.; Bhatt, G.; Kaur, R.; Dua, S.; Kapoor, A. Synthesis and modulation of the optical properties of carbon quantum dots using microwave radiation. Fuller. Nanotub. Carbon Nanostruct. 2020, 28, 724–731. [Google Scholar] [CrossRef]
  10. Ogi, T.; Aishima, K.; Permatasari, F.A.; Iskandar, F.; Tanabe, E.; Okuyama, K. Kinetics of nitrogen-doped carbon dot formation via hydrothermal synthesis. New J. Chem. 2016, 40, 5555–5561. [Google Scholar] [CrossRef]
  11. Lai, X.; Liu, C.; He, H.; Li, J.; Wang, L.; Long, Q.; Zhang, P.; Huang, Y. Hydrothermal synthesis and characterization of nitrogen-doped fluorescent carbon quantum dots from citric acid and urea. Ferroelectrics 2020, 566, 116–123. [Google Scholar] [CrossRef]
  12. Seedad, R.; Khuthinakhun, S.; Ratanawimarnwong, N.; Jittangprasert, P.; Mantim, T.; Songsrirote, K. Carbon dots prepared from citric acid and urea by microwave-assisted irradiation as a turn-on fluorescent probe for allantoin determination. New J. Chem. 2021, 45, 22424–22431. [Google Scholar] [CrossRef]
  13. Gu, S.; Hsieh, C.-T.; Gandomi, Y.A.; Chang, J.-K.; Li, J.; Li, J.; Zhang, H.; Guo, Q.; Lau, K.C.; Pandey, R. Microwave growth and tunable photoluminescence of nitrogen-doped graphene and carbon nitride quantum dots. J. Mater. Chem. C 2019, 7, 5468–5476. [Google Scholar] [CrossRef]
  14. Gao, W.; Ma, Y.; Zhou, Y.; Song, H.; Li, L.; Liu, S.; Liu, X.; Gao, B.; Liu, C.; Zhang, K. High photoluminescent nitrogen-doped carbon dots with unique double wavelength fluorescence emission for cell imaging. Mater. Lett. 2018, 216, 84–87. [Google Scholar] [CrossRef]
  15. Zhang, W.; Chavez, J.; Zeng, Z.; Bloom, B.P.; Sheardy, A.; Ji, Z.; Yin, Z.; Waldeck, D.H.; Jia, Z.; Wei, J. Antioxidant Capacity of Nitrogen and Sulfur Codoped Carbon Nanodots. ACS Appl. Nano Mater. 2018, 1, 2699–2708. [Google Scholar] [CrossRef]
  16. Simões, E.F.C.; Leitão, J.M.M.; Esteves da Silva, J.C.G. Sulfur and nitrogen co-doped carbon dots sensors for nitric oxide fluorescence quantification. Anal. Chim. Acta 2017, 960, 117–122. [Google Scholar] [CrossRef]
  17. Qu, D.; Zheng, M.; Du, P.; Zhou, Y.; Zhang, L.; Li, D.; Tan, H.; Zhao, Z.; Xi, Z.; Sun, Z. Highly luminescent S, N co-doped graphene quantum dots with broad visible absorption bands for visible light photocatalysts. Nanoscale 2013, 5, 12272–12277. [Google Scholar] [CrossRef]
  18. Cui, M.; Li, X. Nitrogen and sulfur Co-doped carbon dots as ecofriendly and effective corrosion inhibitors for Q235 carbon steel in 1 M HCl solution. RSC Adv. 2021, 11, 21607–21621. [Google Scholar] [CrossRef]
  19. Masteri-Farahani, M.; Ghorbani, F.; Mosleh, N. Boric acid modified S and N co-doped graphene quantum dots as simple and inexpensive turn-on fluorescent nanosensor for quantification of glucose. Spectrochim. Acta Part A 2021, 245, 118892. [Google Scholar] [CrossRef]
  20. Xing, X.; Huang, L.; Zhao, S.; Xiao, J.; Lan, M. S,N-Doped carbon dots for tetracyclines sensing with a fluorometric spectral response. Microchem. J. 2020, 157, 105065. [Google Scholar] [CrossRef]
  21. Safardoust-Hojaghan, H.; Amiri, O.; Hassanpour, M.; Panahi-Kalamuei, M.; Moayedi, H.; Salavati-Niasari, M. S,N co-doped graphene quantum dots-induced ascorbic acid fluorescent sensor: Design, characterization and performance. Food Chem. 2019, 295, 530–536. [Google Scholar] [CrossRef] [PubMed]
  22. Yang, X.; Sui, L.; Wang, B.; Zhang, Y.; Tang, Z.; Yang, B.; Lu, S. Red-emitting, self-oxidizing carbon dots for the preparation of white LEDs with super-high color rendering index. Sci. China Chem. 2021, 64, 1547–1553. [Google Scholar] [CrossRef]
  23. Li, H.; Su, D.; Gao, H.; Yan, X.; Kong, D.; Jin, R.; Liu, X.; Wang, C.; Lu, G. Design of Red Emissive Carbon Dots: Robust Performance for Analytical Applications in Pesticide Monitoring. Anal. Chem. 2020, 92, 3198–3205. [Google Scholar] [CrossRef] [PubMed]
  24. Karpushkin, E.A.; Mesnyankina, E.A.; Tagirova, M.R.; Zaborova, O.V.; Sergeyev, V.G. How to Enhance Sensitivity of Carbonaceous Ultrafine Particles to Metal Ions. Russ. J. Gen. Chem. 2022, 92, 2042–2046. [Google Scholar] [CrossRef]
  25. Brouwer, A.M. Standards for photoluminescence quantum yield measurements in solution (IUPAC Technical Report). Pure Appl. Chem. 2011, 83, 2213–2218. [Google Scholar] [CrossRef] [Green Version]
  26. Omer, K.M.; Tofiq, D.I.; Hassan, A.Q. Solvothermal synthesis of phosphorus and nitrogen doped carbon quantum dots as a fluorescent probe for iron(III). Microchim. Acta 2018, 185, 466. [Google Scholar] [CrossRef]
  27. Pontes, S.M.A.; Rodrigues, V.S.F.; Carneiro, S.V.; Oliveira, J.J.P.; Moura, T.A.; Paschoal, A.R.; Antunes, R.A.; Oliveira, D.R.d.; Oliveira, J.R.; Fechine, L.M.U.D.; et al. One-pot Solvothermal Synthesis of Full-color Carbon Quantum Dots for Application in Light Emitting Diodes. Nano-Struct. Nano-Objects 2022, 32, 100917. [Google Scholar] [CrossRef]
  28. Chen, D.; Xu, M.; Wu, W.; Li, S. Multi-color fluorescent carbon dots for wavelength-selective and ultrasensitive Cu2+ sensing. J. Alloys Compd. 2017, 701, 75–81. [Google Scholar] [CrossRef]
  29. Tabaraki, R.; Sadeghinejad, N. Microwave assisted synthesis of doped carbon dots and their application as green and simple turn off–on fluorescent sensor for mercury (II) and iodide in environmental samples. Ecotoxicol. Environ. Saf. 2018, 153, 101–106. [Google Scholar] [CrossRef]
  30. Zhang, Y.; Jing, N.; Zhang, J.; Wang, Y. Hydrothermal synthesis of nitrogen-doped carbon dots as a sensitive fluorescent probe for the rapid, selective determination of Hg2+. Int. J. Environ. Anal. Chem. 2017, 97, 841–853. [Google Scholar] [CrossRef]
  31. Gao, Z.; Lin, Z.; Chen, X.; Zhong, H.; Huang, Z. A fluorescent probe based on N-doped carbon dots for highly sensitive detection of Hg2+ in aqueous solutions. Anal. Methods 2016, 8, 2297–2304. [Google Scholar] [CrossRef]
Figure 1. Scheme of preparation and separation of the considered low-molecular and colloidal products of the solvothermal treatment.
Physchem 03 00008 g001
Figure 2. Appearance of the products of the solvothermal treatment of mixtures of urea or thiourea with citric acid. The purified samples are in the top rows, the dialysates are in the bottom rows. The stars mark the samples obtained at 1:1 ratio of (thio)urea to citric acid.
Physchem 03 00008 g002
Figure 3. Typical differential (black line) and cumulative (red line) particle size distributions as per nanoparticle tracking analysis. Sample composition: urea/citric acid 3:1. Total number of tracked trajectories was 4713.
Physchem 03 00008 g003
Figure 4. Electronic absorption spectra of the purified samples. Initial mixture composition is marked in the legend. (a) Products of solvothermal treatment of mixtures of urea with citric acid; (b) Products of solvothermal treatment of mixtures of thiourea with citric acid.
Physchem 03 00008 g004
Figure 5. Comparison of electronic absorption spectra of the dialysates and purified samples. Initial mixture composition: (a) urea/citric acid = 1:1; (b) thiourea/citric acid = 1:1.
Physchem 03 00008 g005
Figure 6. Emission spectra of the purified samples (excitation wavelength 365 nm) (a,b) and comparison of emission spectra of the dialysates and purified samples (c,d). (a) Purified products of solvothermal treatment of mixtures of urea with citric acid (the mixture composition is given in the legend); (b) Purified products of solvothermal treatment of mixtures of thiourea with citric acid (the mixture composition is given in the legend). Initial mixture composition: (c) urea/citric acid = 1:1; (d) thiourea/citric acid = 1:1.
Physchem 03 00008 g006
Figure 7. Maps of emission spectra of a purified sample at different excitation wavelengths. Sample composition: urea/citric acid 1:1. Dilution factor is shown in the subplot captions.
Physchem 03 00008 g007
Figure 8. Maps of emission spectra of purified samples prepared from urea and citric acid at different excitation wavelengths. Sample composition (urea/citric acid) is shown in the subplot captions.
Physchem 03 00008 g008
Figure 9. Maps of emission spectra of purified samples prepared from thiourea and citric acid at different excitation wavelengths. Sample composition (thiourea: citric acid) is shown in the subplot captions.
Physchem 03 00008 g009
Figure 10. Effect of addition of 10 µmol/L of Hg(NO3)2 on the map of emission spectra of purified samples prepared from urea and citric acid. The presence of mercury(II) and the sample composition (urea: citric acid) are shown in the subplot captions.
Physchem 03 00008 g010
Figure 11. Relative intensity of emission of purified samples prepared from urea and citric acid as a function of Hg(NO3)2 concentration. (a) The 7:1 sample with different combinations of excitation and emission wavelengths (shown in the legend). (b) Samples of different composition (shown in the legend). Optimal combinations of excitation and emission wavelengths were estimated from the plots in Figure 9 as follows: λex 560 nm, λem 630 nm (7:1), λex 460 nm, λem 550 nm (1:1 and 1:3), and λex 340 nm, λem 420 nm (1:7).
Physchem 03 00008 g011
Figure 12. Effect of addition of 10 µmol/L of Hg(NO3)2 on the map of emission spectra of purified samples prepared from thiourea and citric acid. The presence of mercury(II) and the sample composition (thiourea: citric acid) are shown in the subplot captions.
Physchem 03 00008 g012
Table 1. Particle characteristics for the purified products of the solvothermal treatment of mixtures of urea with citric acid. The data are given as value ± standard deviation. See details in the text.
Urea/Citric AcidX10, nm 1X50, nm 2Concentration, mL−1Yield, %
7:1108 ± 5231 ± 10(7.2 ± 1.8) × 1090.14
5:1116 ± 3248 ± 2(6.7 ± 0.7) × 1090.17
3:192 ± 22222 ± 24(1.0 ± 0.2) × 10100.18
1:1112 ± 6232 ± 8(6.0 ± 0.3) × 10101.0
1:355 ± 18138 ± 28(1.2 ± 0.3) × 10100.06
1:5119 ± 14261 ± 11(1.2 ± 0.2) × 108<0.01
1:7119 ± 11258 ± 5(6.0 ± 0.4) × 106<0.01
1 Tenth percentile of the number-average particle diameter distribution. 2 Median of the number-average particles diameter distribution.
Table 2. Quantum yield of fluorescence (%) of the prepared samples. Excitation wavelength 365 nm.
Composition 1UreaThiourea
DialysatePurifiedDialysatePurified
7:17.91.914.42.3
5:19.32.214.72.4
3:111.21.211.41.3
1:115.21.216.61.3
1:320.33.36.02.2
1:516.71.66.63.2
1:73.64.0--
1 Mass ratio of urea or thiourea to citric acid during synthesis.
Disclaimer/Publisher’s Note: The statements, opinions and data contained in all publications are solely those of the individual author(s) and contributor(s) and not of MDPI and/or the editor(s). MDPI and/or the editor(s) disclaim responsibility for any injury to people or property resulting from any ideas, methods, instructions or products referred to in the content.

