

Analytic Hierarchy Process (AHP) Based Soil Erosion Susceptibility Mapping in Northwestern Himalayas: A Case Study of Central Kashmir Province


Abstract
:1. Introduction
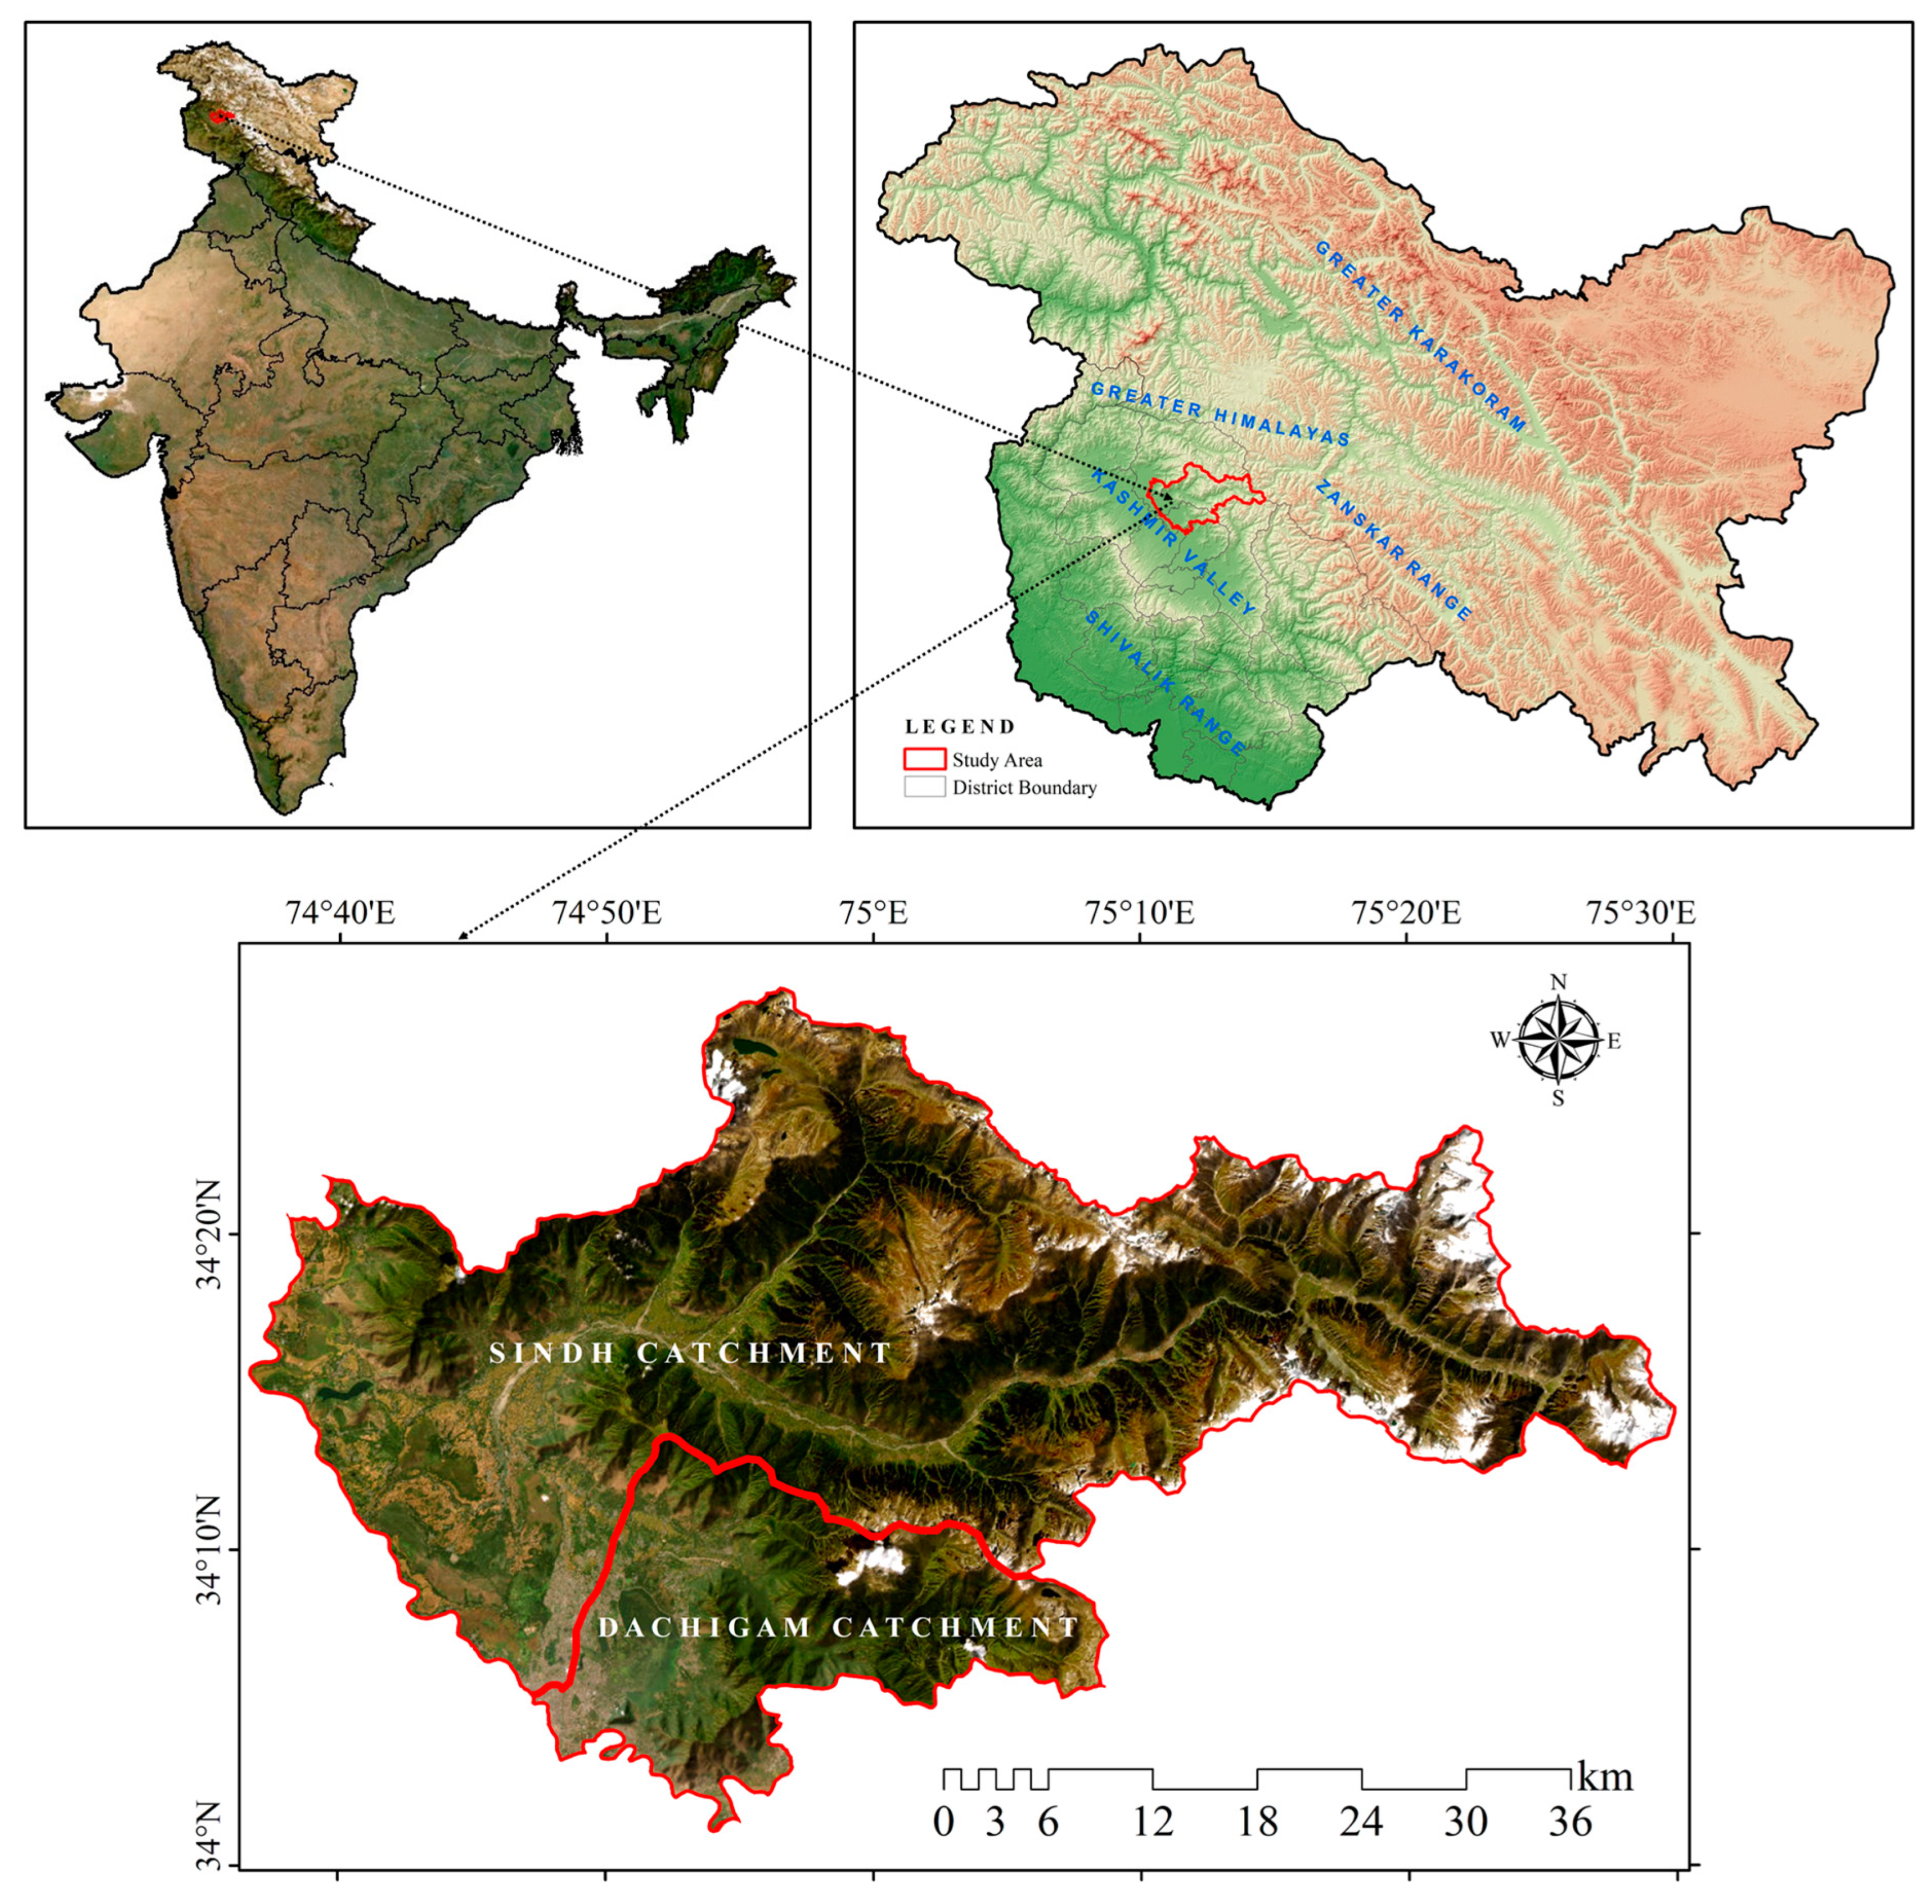
2. Study Area
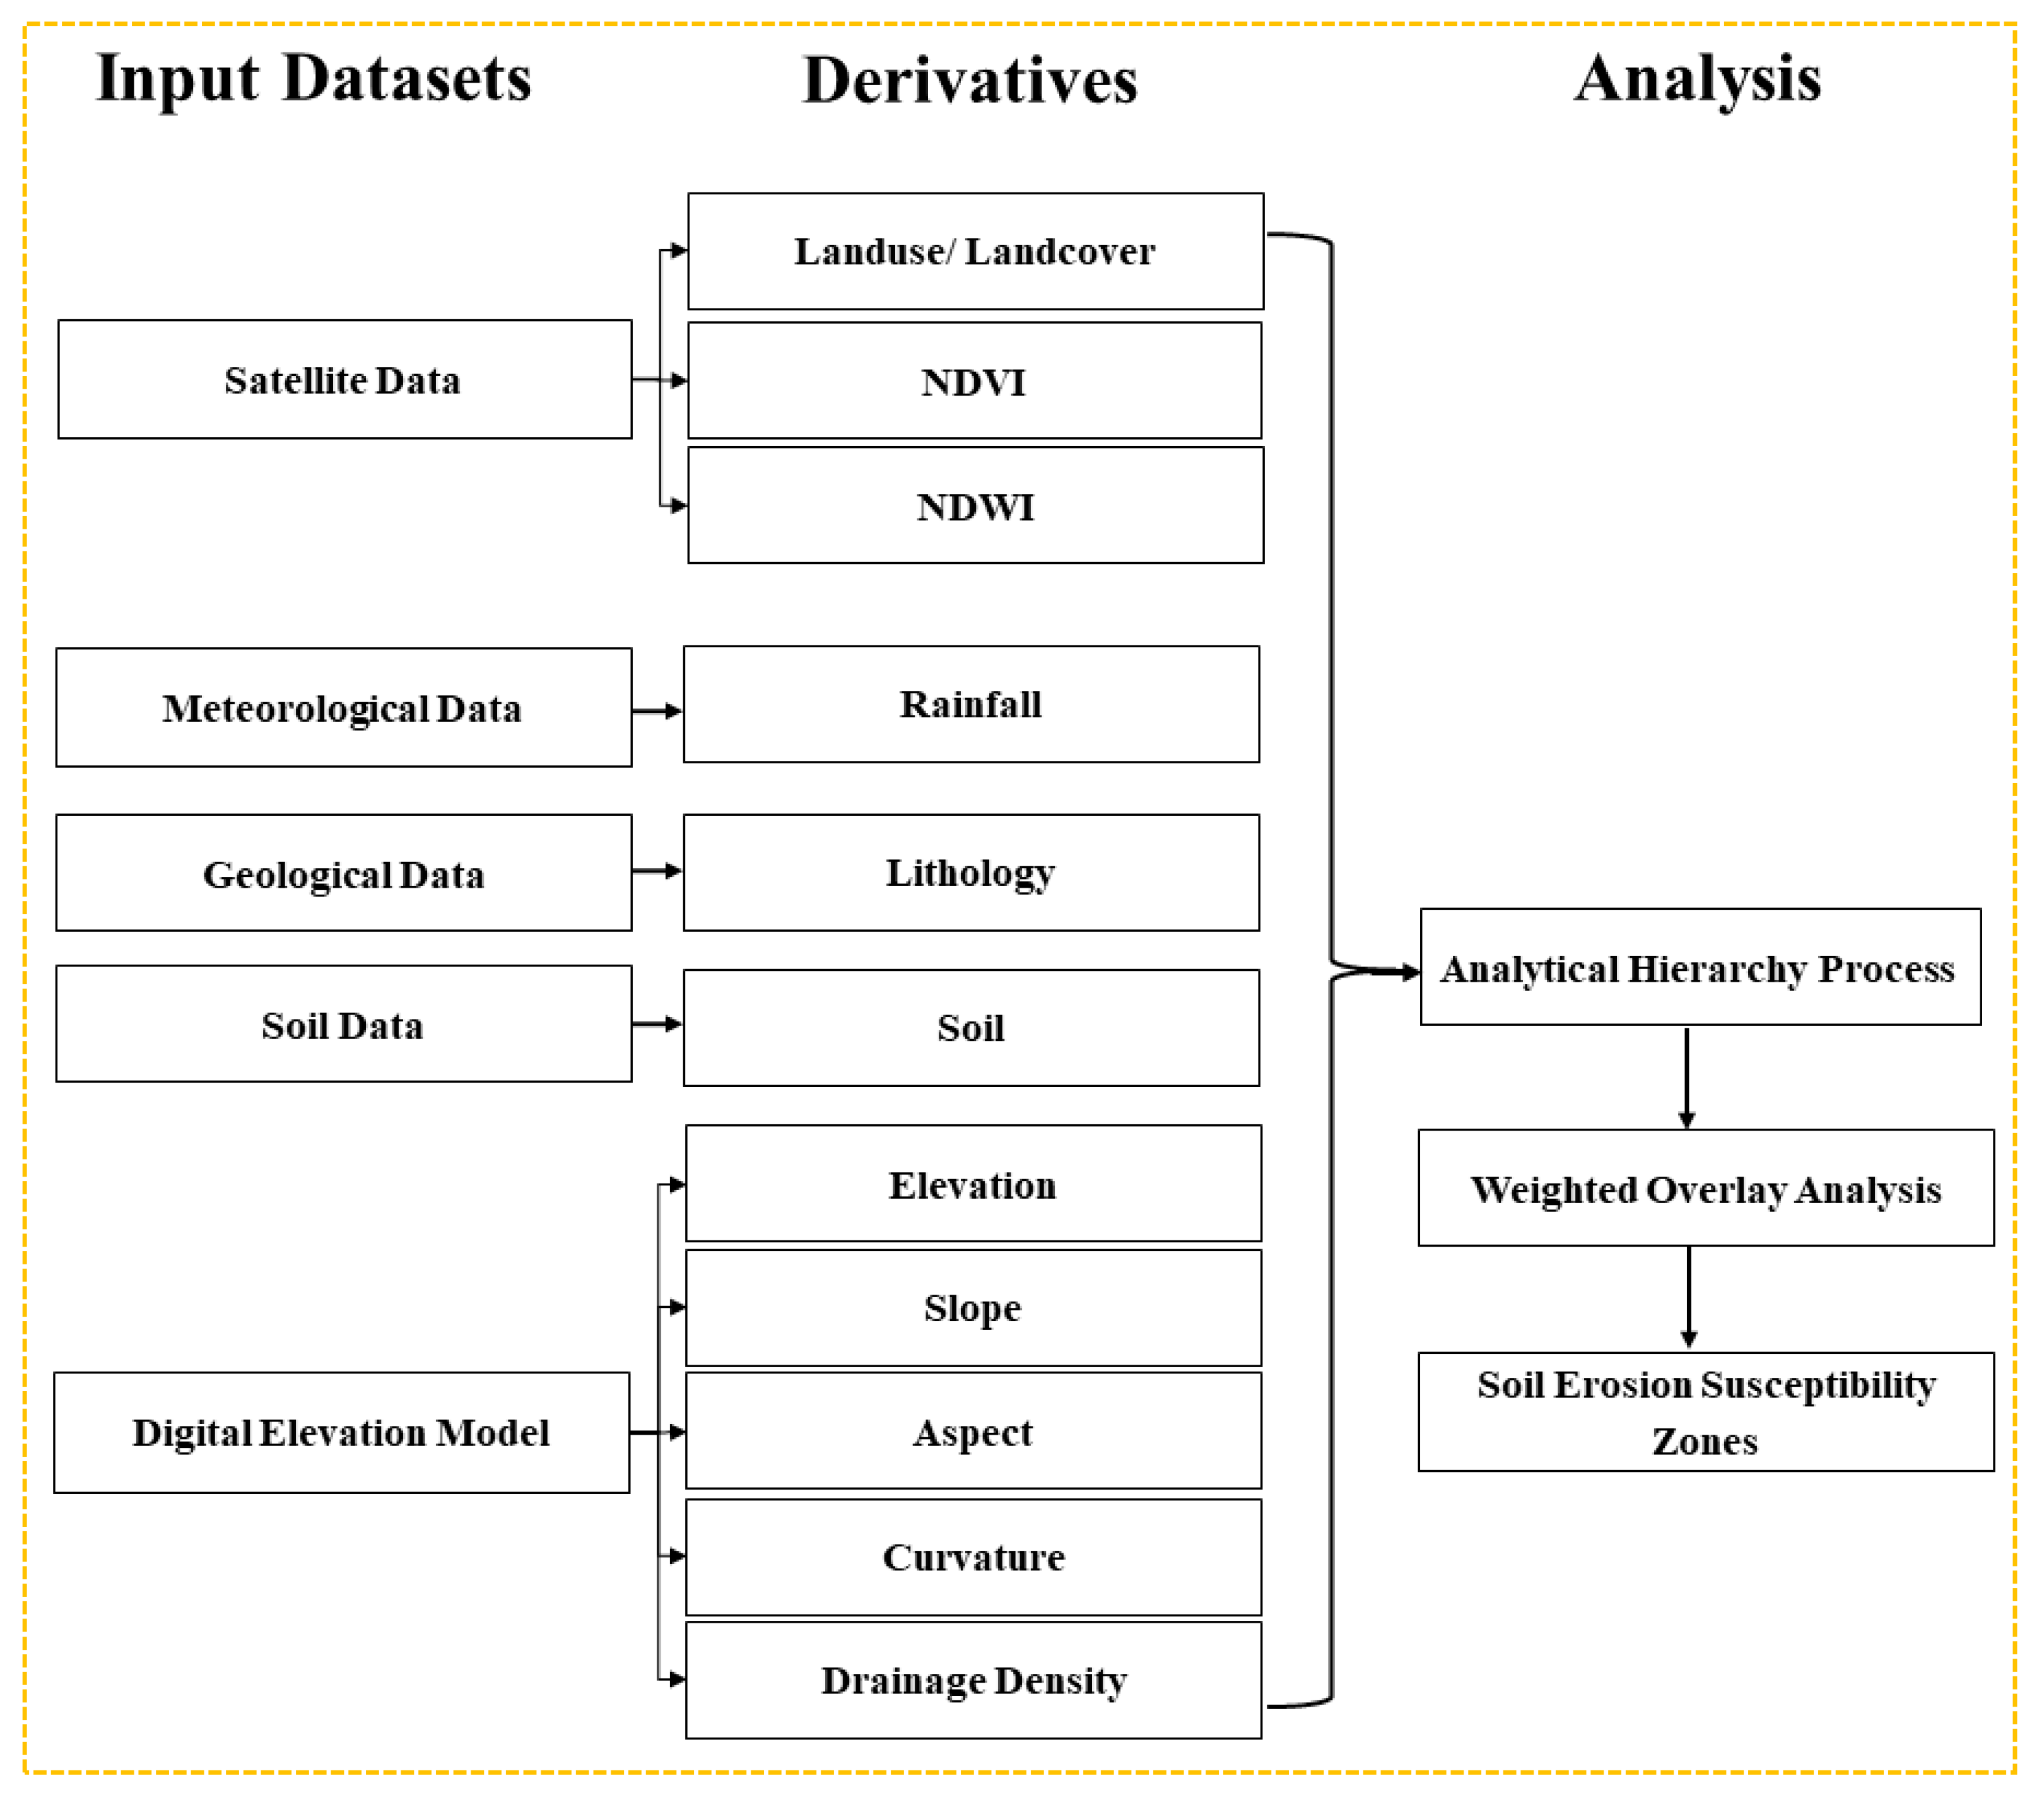
3. Materials and Methods
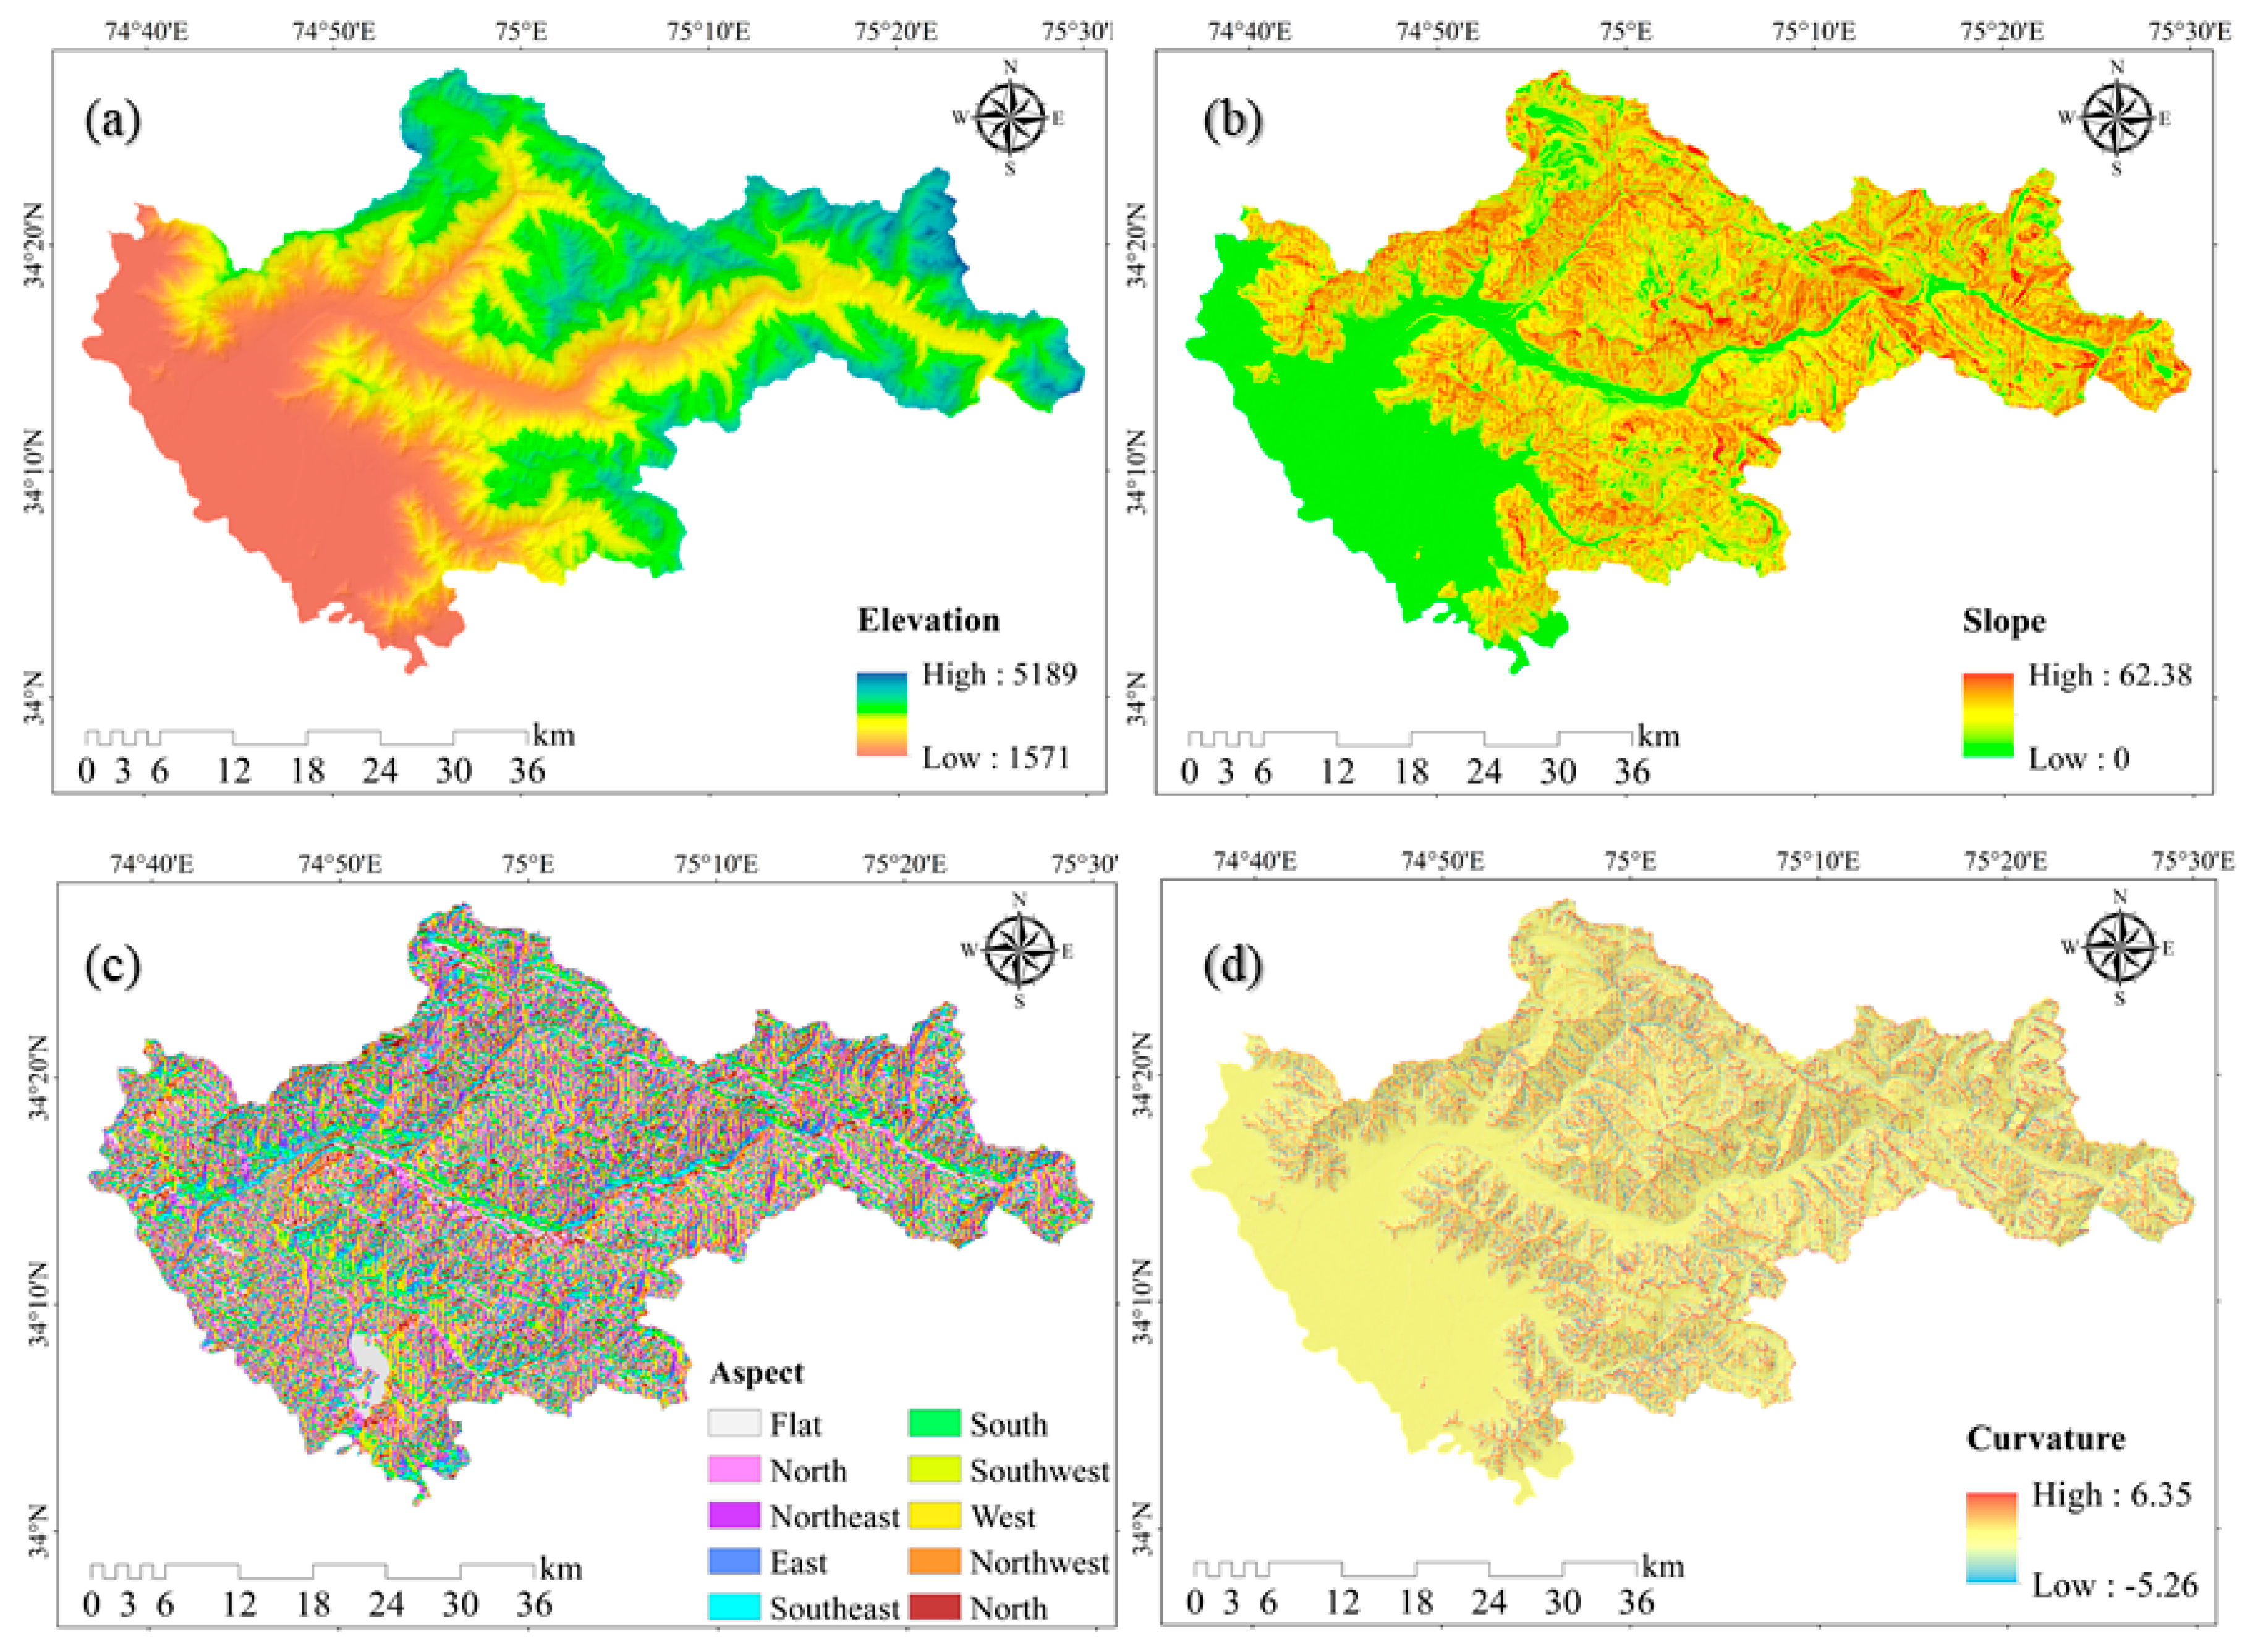
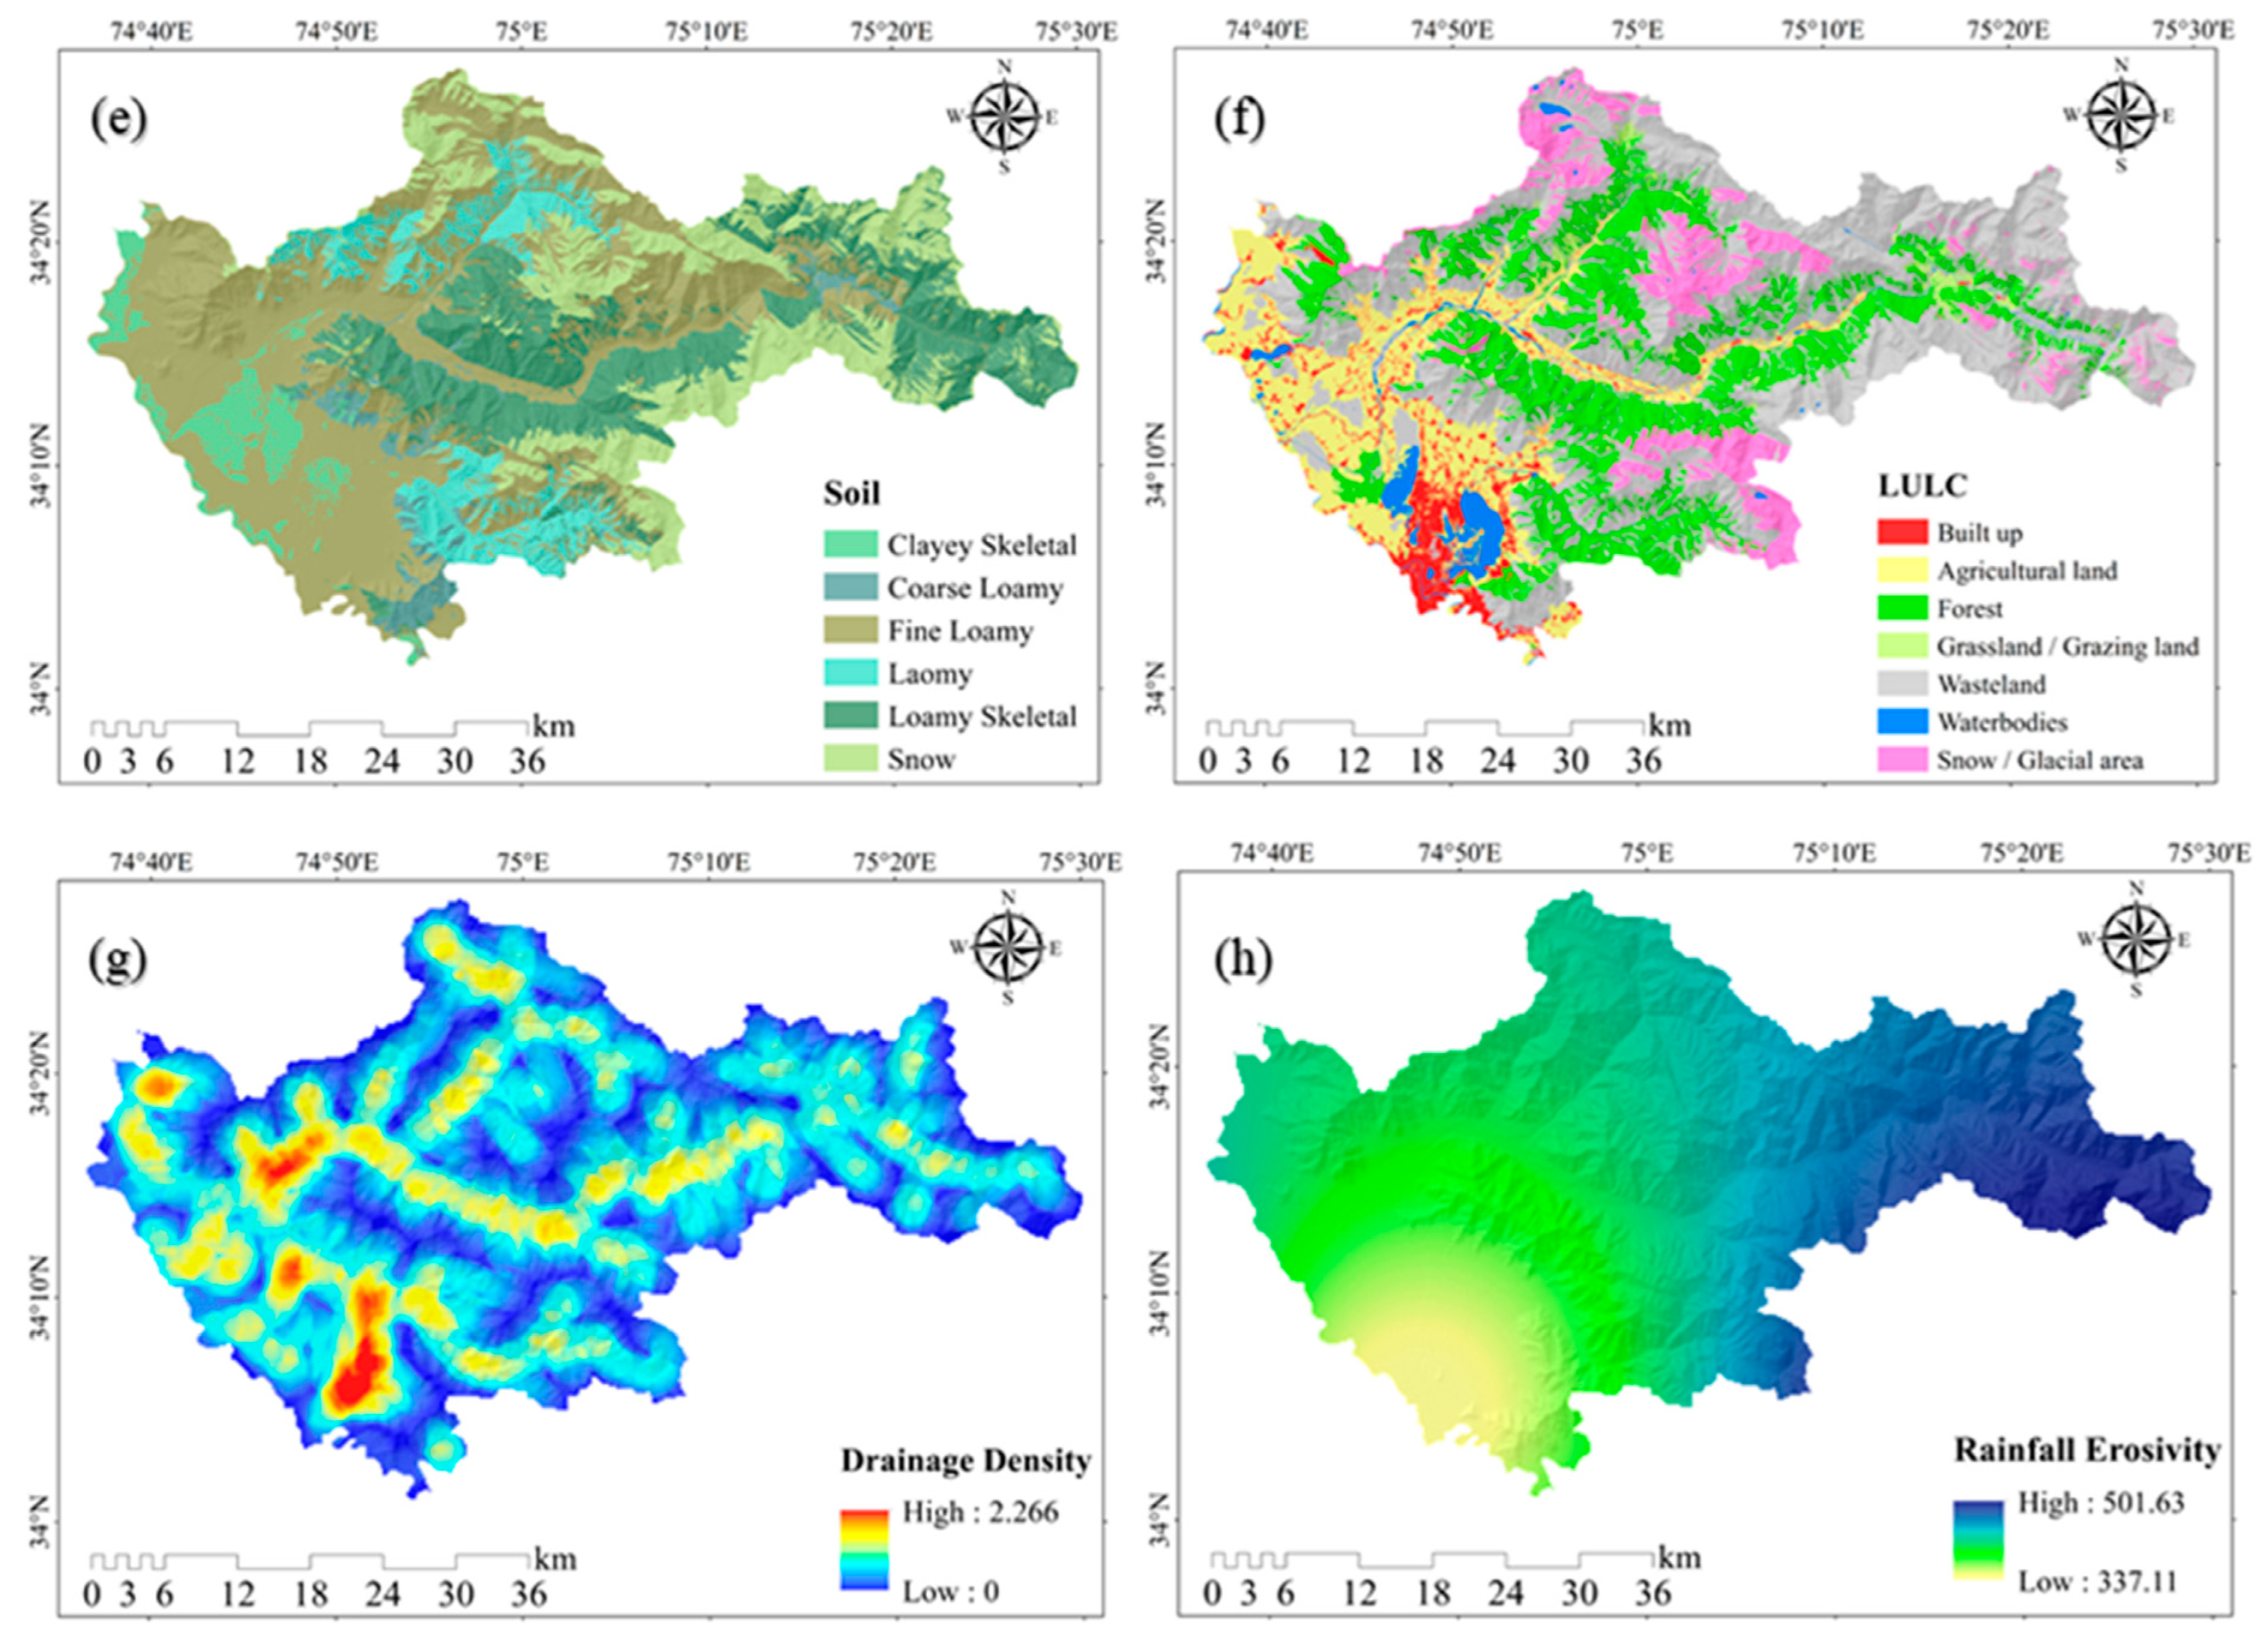
3.1. Soil Erosion Conditioning Parameters

| S. No. | Parameter | Source | Procedures | Reference |
|---|---|---|---|---|
| 1. | EL | SRTM DEM | 30 × 30 m DEM | [77] |
| 2 | SL | SRTM DEM | = no of contour cutting; i = contour interval | [78] |
| 3 | AS | SRTM DEM | [79] | |
| 4 | CU | SRTM DEM | CU = | [80] |
| 5 | SO | SLUSI | On screen digitization | [81] |
| 6 | LULC | IRS LISS-IV | On screen digitization | [82] |
| 7 | DD | SRTM DEM | Proximity analysis | [83] |
| 8 | RE | IMD | RE = 79 + 0.363R | [71] |
| 9 | LI | NRIS | On screen digitization | [84] |
| 10 | NDWI | LANDSAT | NDWI = | [85] |
| 11 | NDVI | LANDSAT | NDVI = | [86] |
3.2. Determination of Weights by the AHP Procedure
- (a)
- Development of the spatial database;
- (b)
- Establishment of evaluation criteria and hierarchical structure for multi-criteria questions;
- (c)
- Use the AHP method to compute the weight of the relative importance of the criteria;
- (d)
- Finally, the weighted sum method (WSM) is employed to estimate the severity of soil erosion.
3.3. Weighted Sum Method (WSM)
4. Results and Discussion
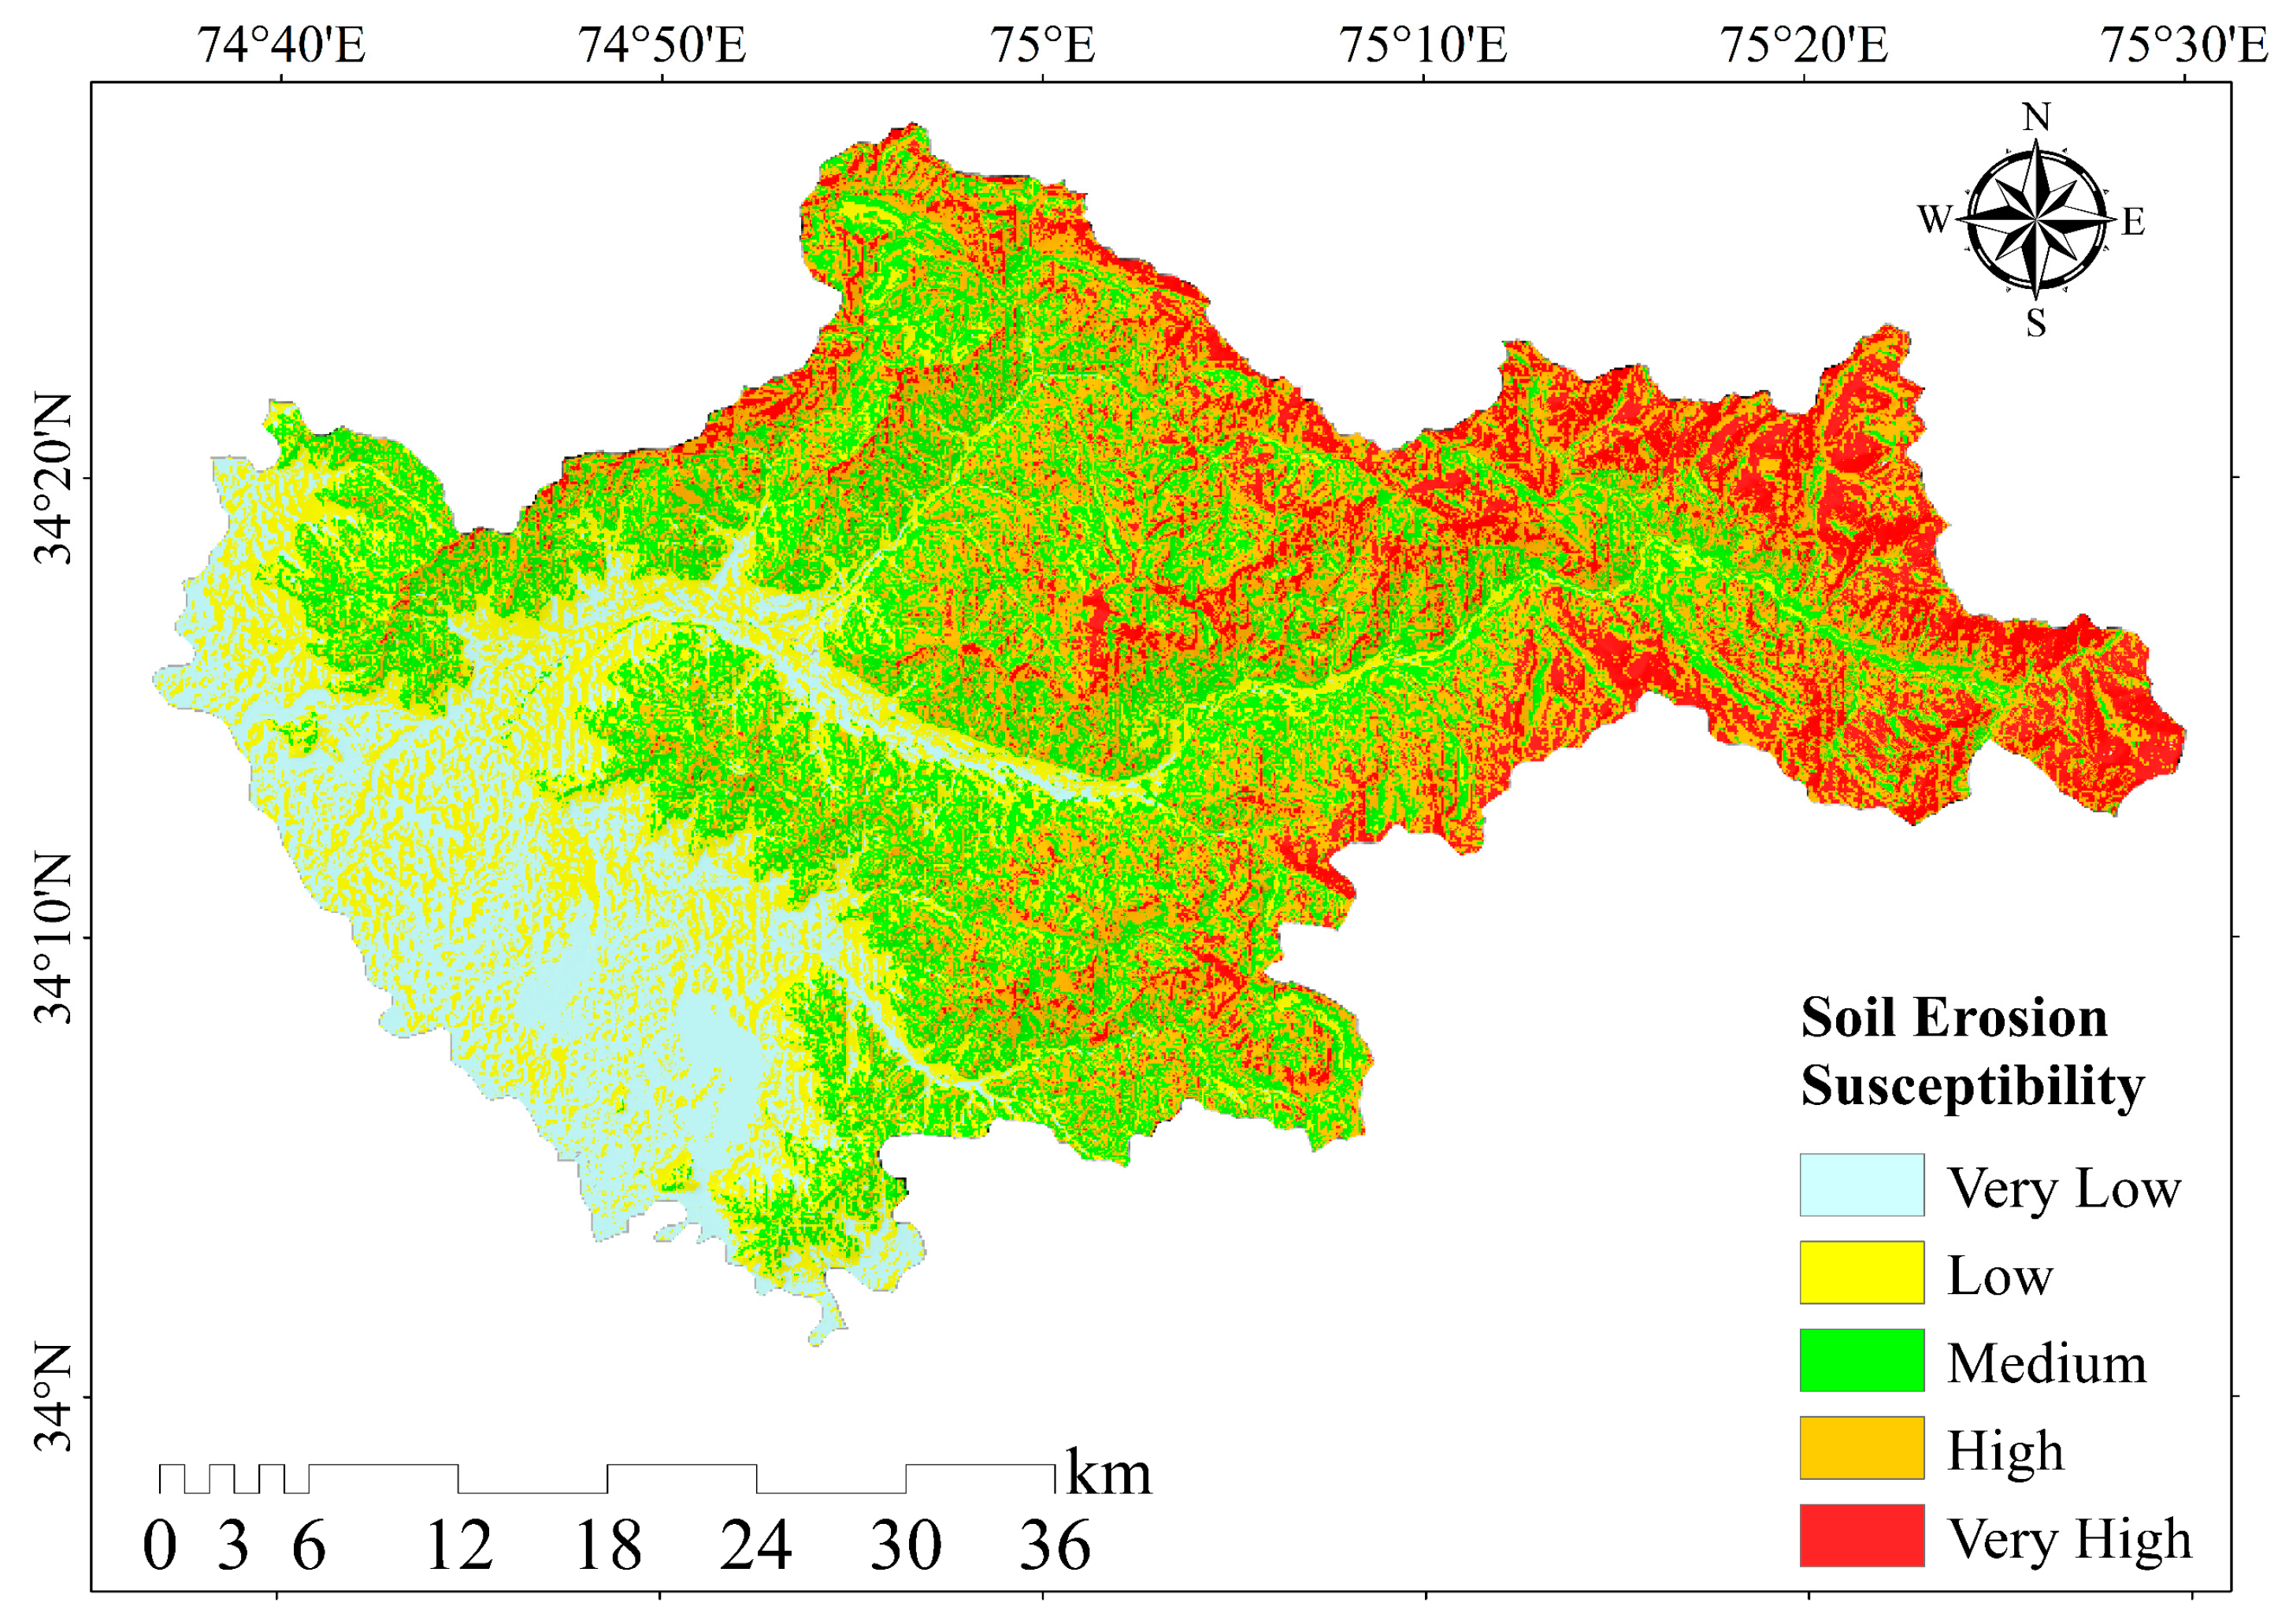
4.1. Soil Erosion Susceptibility Classes
4.2. Soil Erosion Influencing Parameters
5. Conclusions
Author Contributions
Funding
Institutional Review Board Statement
Informed Consent Statement
Data Availability Statement
Acknowledgments
Conflicts of Interest
References
- Boardman, J.; Poesen, J.; Evans, M. Slopes: Soil erosion. Geol. Soc. Lond. Mem. 2022, 58, 241–255. [Google Scholar] [CrossRef]
- Borrelli, P.; Robinson, D.A.; Panagos, P.; Lugato, E.; Yang, J.E.; Alewell, C.; Ballabio, C. Land use and climate change impacts on global soil erosion by water (2015–2070). Proc. Natl. Acad. Sci. USA 2020, 117, 21994–22001. [Google Scholar] [CrossRef]
- El-Swaify, S.A. Factors affecting soil erosion hazards and conservation needs for tropical steeplands. Soil Technol. 1997, 11, 3–16. [Google Scholar] [CrossRef]
- Stoddart, D.R. World erosion and sedimentation. In Introduction to Fluvial Processes; Routledge: Oxfordshire, UK, 2019; pp. 8–29. [Google Scholar]
- Comino, J.R.; Iserloh, T.; Lassu, T.; Cerdà, A.; Keestra, S.D.; Prosdocimi, M.; Ries, J.B. Quantitative comparison of initial soil erosion processes and runoff generation in Spanish and German vineyards. Sci. Total Environ. 2016, 565, 1165–1174. [Google Scholar] [CrossRef] [PubMed]
- García-Ruiz, J.M.; Beguería, S.; Nadal-Romero, E.; González-Hidalgo, J.C.; Lana-Renault, N.; Sanjuán, Y. A meta-analysis of soil erosion rates across the world. Geomorphology 2015, 239, 160–173. [Google Scholar] [CrossRef] [Green Version]
- Singh, G.; Babu, R.; Narain, P.; Bhushan, L.S.; Abrol, I.P. Soil erosion rates in India. J. Soil Water Conserv. 1992, 47, 97–99. [Google Scholar]
- Raymo, M.E.; Ruddiman, W.F. Tectonic forcing of late Cenozoic climate. Nature 1992, 359, 117–122. [Google Scholar] [CrossRef]
- Sandeep, P.; Reddy, G.O.; Jegankumar, R.; Kumar, K.A. Modeling and assessment of land degradation vulnerability in semi-arid ecosystem of Southern India using temporal satellite data, AHP and GIS. Environ. Model. Assess. 2021, 26, 143–154. [Google Scholar] [CrossRef]
- Saini, S.S.; Jangra, R.; Kaushik, S.P. Vulnerability assessment of soil erosion using geospatial techniques-A pilot study of upper catchment of Markanda river. Int. J. Adv. Remote Sens. GIS Geogr. 2015, 2, 9–21. [Google Scholar]
- Jain, S.K.; Kumar, S.; Varghese, J. Estimation of soil erosion for a Himalayan watershed using GIS technique. Water Resour. Manag. 2001, 15, 41–54. [Google Scholar] [CrossRef]
- Wadia, D.N. Geology of India, 4th ed.; Tata McGraw-Hill Publishing Co.: New Delhi, India, 1979. [Google Scholar]
- Pham, T.G.; Degener, J.; Kappas, M. Integrated universal soil loss equation (USLE) and Geographical Information System (GIS) for soil erosion estimation in A Sap basin: Central Vietnam. Int. Soil Water Conserv. Res. 2018, 6, 99–110. [Google Scholar] [CrossRef]
- Williams, J.R. Sediment routing for agricultural watersheds. JAWRA J. Am. Water Resour. Assoc. 1975, 11, 965–974. [Google Scholar] [CrossRef]
- Renard, K.G. Predicting Soil Erosion by Water: A Guide to Conservation Planning with the Revised Universal Soil Loss Equation (RUSLE); United States Government Printing: Washington, DC, USA, 1997. [Google Scholar]
- Alitane, A.; Essahlaoui, A.; El Hafyani, M.; El Hmaidi, A.; El Ouali, A.; Kassou, A.; Van Rompaey, A. Water Erosion Monitoring and Prediction in Response to the Effects of Climate Change Using RUSLE and SWAT Equations: Case of R’Dom Watershed in Morocco. Land 2022, 11, 93. [Google Scholar] [CrossRef]
- Baigorria, G.A.; Romero, C.C. Assessment of erosion hotspots in a watershed: Integrating the WEPP model and GIS in a case study in the Peruvian Andes. Environ. Model. Softw. 2007, 22, 1175–1183. [Google Scholar] [CrossRef]
- De Jong, S.M.; Paracchini, M.L.; Bertolo, F.; Folving, S.; Megier, J.; De Roo, A.P.J. Regional assessment of soil erosion using the distributed model SEMMED and remotely sensed data. Catena 1999, 37, 291–308. [Google Scholar] [CrossRef]
- Grum, B.; Woldearegay, K.; Hessel, R.; Baartman, J.E.; Abdulkadir, M.; Yazew, E.; Geissen, V. Assessing the effect of water harvesting techniques on event-based hydrological responses and sediment yield at a catchment scale in northern Ethiopia using the Limburg Soil Erosion Model (LISEM). Catena 2017, 159, 20–34. [Google Scholar] [CrossRef]
- Haregeweyn, N.; Yohannes, F. Testing and evaluation of the agricultural non-point source pollution model (AGNPS) on Augucho catchment, western Hararghe, Ethiopia. Agric. Ecosyst. Environ. 2003, 99, 201–212. [Google Scholar] [CrossRef]
- Lu, D.; Li, G.; Valladares, G.S.; Batistella, M. Mapping soil erosion risk in Rondonia, Brazilian Amazonia: Using RUSLE, remote sensing and GIS. Land Degrad. Dev. 2004, 15, 499–512. [Google Scholar] [CrossRef]
- Ouyang, W.; Hao, F.; Skidmore, A.K.; Toxopeus, A.G. Soil erosion and sediment yield and their relationships with vegetation cover in upper stream of the Yellow River. Sci. Total Environ. 2010, 409, 396–403. [Google Scholar] [CrossRef]
- Veihe, A.; Rey, J.; Quinton, J.N.; Strauss, P.; Sancho, F.M.; Somarriba, M. Modelling of event-based soil erosion in Costa Rica, Nicaragua and Mexico: Evaluation of the EUROSEM model. Catena 2001, 44, 187–203. [Google Scholar] [CrossRef] [Green Version]
- Mushtaq, F.; Lala, M.G.N.; Wadood, A. Estimation of soil erosion risk in upper catchment of Wular Lake, Jammu & Kashmir using RUSLE model. Int. J. Adv. Res. Sci. Eng. 2018, 7, 1828–1839. [Google Scholar]
- Tirkey, A.S.; Pandey, A.C.; Nathawat, M.S. Use of satellite data, GIS and RUSLE for estimation of average annual soil loss in Daltonganj watershed of Jharkhand (India). J. Remote Sens. Technol. 2013, 1, 20–30. [Google Scholar] [CrossRef]
- Yüksel, A.; Akay, A.E.; Gundogan, R.; Reis, M.; Cetiner, M. Application of GeoWEPP for determining sediment yield and runoff in the Orcan Creek watershed in Kahramanmaras, Turkey. Sensors 2008, 8, 1222–1236. [Google Scholar] [CrossRef] [Green Version]
- Cerdà, A.; Borja, M.E.L.; Úbeda, X.; Martínez-Murillo, J.F.; Keesstra, S. Pinus halepensis M. versus Quercus ilex subsp. Rotundifolia L. runoff and soil erosion at pedon scale under natural rainfall in Eastern Spain three decades after a forest fire. For. Ecol. Manag. 2008, 400, 447–456. [Google Scholar] [CrossRef] [Green Version]
- Eltner, A.; Mulsow, C.; Maas, H.G. Quantitative measurement of soil erosion from TLS and UAV data. Int. Arch. Photogramm. Remote Sens. Spat. Inf. Sci. 2013, 40, 4–6. [Google Scholar] [CrossRef] [Green Version]
- Bosco, C.; de Rigo, D.; Dewitte, O.; Poesen, J.; Panagos, P. Modelling soil erosion at European scale: Towards harmonization and reproducibility. Nat. Hazards Earth Syst. Sci. 2015, 15, 225–245. [Google Scholar] [CrossRef] [Green Version]
- Polidori, L.; El Hage, M. Digital elevation model quality assessment methods: A critical review. Remote Sens. 2020, 12, 3522. [Google Scholar] [CrossRef]
- Borrelli, P.; Paustian, K.; Panagos, P.; Jones, A.; Schütt, B.; Lugato, E. Effect of good agricultural and environmental conditions on erosion and soil organic carbon balance: A national case study. Land Use Policy 2016, 50, 408–421. [Google Scholar] [CrossRef]
- Prasuhn, V.; Liniger, H.; Gisler, S.; Herweg, K.; Candinas, A.; Clément, J.P. A high-resolution soil erosion risk map of Switzerland as strategic policy support system. Land Use Policy 2013, 32, 281–291. [Google Scholar] [CrossRef]
- Al-Rahbi, A.K.H.; Abushammala, M.F.; Qazi, W.A. Application of the analytic hierarchy process for management of soil erosion in Oman. Int. J. Anal. Hierarchy Process. 2020, 12, 104–116. [Google Scholar] [CrossRef]
- Aslam, B.; Maqsoom, A.; Alaloul, W.S.; Musarat, M.A.; Jabbar, T.; Zafar, A. Soil erosion susceptibility mapping using a GIS-based multi-criteria decision approach: Case of district Chitral, Pakistan. Ain Shams Eng. J. 2021, 12, 1637–1649. [Google Scholar] [CrossRef]
- Chen, S.; Liu, W.; Bai, Y.; Luo, X.; Li, H.; Zha, X. Evaluation of watershed soil erosion hazard using combination weight and GIS: A case study from eroded soil in Southern China. Nat. Hazards 2021, 109, 1603–1628. [Google Scholar] [CrossRef]
- Ni, J.R.; Li, X.X.; Borthwick, A.G.L. Soil erosion assessment based on minimum polygons in the Yellow River basin, China. Geomorphology 2008, 93, 233–252. [Google Scholar] [CrossRef]
- Pradeep, G.S.; Krishnan, M.N.; Vijith, H. Identification of critical soil erosion prone areas and annual average soil loss in an upland agricultural watershed of Western Ghats, using analytical hierarchy process (AHP) and RUSLE techniques. Arab. J. Geosci. 2015, 8, 3697–3711. [Google Scholar] [CrossRef]
- Rahman, M.R.; Shi, Z.H.; Chongfa, C. Soil erosion hazard evaluation—An integrated use of remote sensing, GIS and statistical approaches with biophysical parameters towards management strategies. Ecol. Model. 2009, 220, 1724–1734. [Google Scholar] [CrossRef]
- Wu, Q.; Wang, M. A framework for risk assessment on soil erosion by water using an integrated and systematic approach. J. Hydrol. 2007, 337, 11–21. [Google Scholar] [CrossRef]
- Agnihotri, D.; Kumar, T.; Jhariya, D. Intelligent vulnerability prediction of soil erosion hazard in semi-arid and humid region. Environ. Dev. Sustain. 2021, 23, 2524–2551. [Google Scholar] [CrossRef]
- Singh, G.; Singh, R.M.; Singh, S.; Kumar, A.R.S.; Jaiswal, R.K.; Chandola, V.K.; Nema, A.K. Multi-criteria analytical hierarchical process based decision support system for critical watershed prioritization of Andhiyarkhore catchment. Indian J. Soil Conserv. 2019, 47, 263–272. [Google Scholar]
- Pramanik, M.K. Site suitability analysis for agricultural land use of Darjeeling district using AHP and GIS techniques. Model. Earth Syst. Environ. 2016, 2, 1–22. [Google Scholar] [CrossRef] [Green Version]
- Kundu, S.; Khare, D.; Mondal, A. Landuse change impact on sub-watersheds prioritization by analytical hierarchy process (AHP). Ecol. Inform. 2017, 42, 100–113. [Google Scholar] [CrossRef]
- Oh, H.J.; Lee, S. Integration of ground subsidence hazard maps of abandoned coal mines in Samcheok, Korea. Int. J. Coal Geol. 2011, 86, 58–72. [Google Scholar] [CrossRef]
- Kim, K.D.; Lee, S.; Oh, H.J.; Choi, J.K.; Won, J.S. Assessment of ground subsidence hazard near an abandoned underground coal mine using GIS. Environ. Geol. 2006, 50, 1183–1191. [Google Scholar] [CrossRef]
- Lee, S.; Oh, H.J.; Kim, K.D. Statistical spatial modeling of ground subsidence hazard near an abandoned underground coal mine. Disaster Adv. 2010, 3, 11–12. [Google Scholar]
- Pradhan, B.; Lee, S. Utilization of optical remote sensing data and GIS tools for regional landslide hazard analysis by using an artificial neural network model. Earth Sci. Front. 2007, 14, 143–152. [Google Scholar]
- Yilmaz, I. A case study from Koyulhisar (Sivas-Turkey) for landslide susceptibility mapping by artificial neural networks. Bull. Eng. Geol. Environ. 2009, 68, 297–306. [Google Scholar] [CrossRef]
- Choi, J.K.; Kim, K.D.; Lee, S.; Won, J.S. Application of a fuzzy operator to susceptibility estimations of coal mine subsidence in Taebaek City, Korea. Environ. Earth Sci. 2010, 59, 1009–1022. [Google Scholar] [CrossRef]
- Ghafari, A.S.; Alasty, A. Design and real-time experimental implementation of gain scheduling PID fuzzy controller for hybrid stepper motor in micro-step operation. In Proceedings of the IEEE International Conference on Mechatronics, 2004, ICM’04, Istanbul, Turkey, 5 June 2004; IEEE: Piscataway, NJ, USA, 2004; pp. 421–426. [Google Scholar]
- Tehrany, M.S.; Shabani, F.; Javier, D.N.; Kumar, L. Soil erosion susceptibility mapping for current and 2100 climate conditions using evidential belief function and frequency ratio. Geomat. Nat. Hazards Risk 2017, 8, 1695–1714. [Google Scholar] [CrossRef] [Green Version]
- Kadavi, P.R.; Lee, C.W.; Lee, S. Application of ensemble-based machine learning models to landslide susceptibility mapping. Remote Sens. 2018, 10, 1252. [Google Scholar] [CrossRef] [Green Version]
- Lee, S.; Pradhan, B. Probabilistic landslide hazards and risk mapping on Penang Island, Malaysia. J. Earth Syst. Sci. 2006, 115, 661–672. [Google Scholar] [CrossRef] [Green Version]
- Costache, R.; Ngo, P.T.T.; Bui, D.T. Novel ensembles of deep learning neural network and statistical learning for flash-flood susceptibility mapping. Water 2020, 12, 1549. [Google Scholar] [CrossRef]
- Ijlil, S.; Essahlaoui, A.; Mohajane, M.; Essahlaoui, N.; Mili, E.M.; Van Rompaey, A. Machine Learning Algorithms for Modeling and Mapping of Groundwater Pollution Risk: A Study to Reach Water Security and Sustainable Development (Sdg) Goals in a Mediterranean Aquifer System. Remote Sens. 2022, 14, 2379. [Google Scholar] [CrossRef]
- Clerici, A.; Perego, S.; Tellini, C.; Vescovi, P. A procedure for landslide susceptibility zonation by the conditional analysis method. Geomorphology 2002, 48, 349–364. [Google Scholar] [CrossRef]
- Scheet, P.; Stephens, M. A fast and flexible statistical model for large-scale population genotype data: Applications to inferring missing genotypes and haplotypic phase. Am. J. Hum. Genet. 2006, 78, 629–644. [Google Scholar] [CrossRef] [PubMed] [Green Version]
- Zaz, S.N.; Romshoo, S.A. Assessing the geoindicators of land degradation in the Kashmir Himalayan region, India. Nat. Hazards 2012, 64, 1219–1245. [Google Scholar] [CrossRef]
- Mosavi, A.; Sajedi-Hosseini, F.; Choubin, B.; Taromideh, F.; Rahi, G.; Dineva, A.A. Susceptibility mapping of soil water erosion using machine learning models. Water. 2020, 12, 1995. [Google Scholar] [CrossRef]
- Conoscenti, C.; Di Maggio, C.; Rotigliano, E. Soil erosion susceptibility assessment and validation using a geostatistical multivariate approach: A test in Southern Sicily. Nat. Hazards 2008, 46, 287–305. [Google Scholar] [CrossRef]
- Halefom, A.; Teshome, A. Modelling and mapping of erosion potentiality watersheds using AHP and GIS technique: A case study of Alamata Watershed, South Tigray, Ethiopia. Model. Earth Syst. Environ. 2019, 5, 819–831. [Google Scholar] [CrossRef]
- Rahmati, O.; Haghizadeh, A.; Pourghasemi, H.R.; Noormohamadi, F. Gully erosion susceptibility mapping: The role of GIS-based bivariate statistical models and their comparison. Nat. Hazards 2016, 82, 1231–1258. [Google Scholar] [CrossRef]
- Zabihi, M.; Mirchooli, F.; Motevalli, A.; Darvishan, A.K.; Pourghasemi, H.R.; Zakeri, M.A.; Sadighi, F. Spatial modelling of gully erosion in Mazandaran Province, northern Iran. Catena 2018, 161, 1–13. [Google Scholar] [CrossRef]
- Yilmaz, C.; Topal, T.; Süzen, M.L. GIS-based landslide susceptibility mapping using bivariate statistical analysis in Devrek (Zonguldak-Turkey). Environ. Earth Sci. 2012, 65, 2161–2178. [Google Scholar] [CrossRef]
- Blanco, H.; Lal, R. Principles of Soil Conservation and Management; Springer: New York, NY, USA, 2008; Volume 167169. [Google Scholar]
- Jin, Z.; Zhao, Q.; Qin, X.; Zhang, J.; Zhang, H.; Qin, J.; Wang, L. Quantifying the impact of landscape changes on hydrological variables in the alpine and cold region using hydrological model and remote sensing data. Hydrol. Process. 2021, 35, e14392. [Google Scholar] [CrossRef]
- Sarkar, S.; Kanungo, D.P. An integrated approach for landslide susceptibility mapping using remote sensing and GIS. Photogramm. Eng. Remote Sens. 2004, 70, 617–625. [Google Scholar] [CrossRef]
- Nearing, M.A.; Yin, S.Q.; Borrelli, P.; Polyakov, V.O. Rainfall erosivity: An historical review. Catena. 2017, 157, 357–362. [Google Scholar] [CrossRef]
- Lee, J.H.; Heo, J.H. Evaluation of estimation methods for rainfall erosivity based on annual precipitation in Korea. J. Hydrol. 2011, 409, 30–48. [Google Scholar] [CrossRef]
- Singh, G.; Babu, R.; Chandra, S. Soil Loss Prediction Research in India; Technical Bulletin T-12/D-9; Central Soil and Water Conservation Research and Training Institute: Dehradun, India, 1981. [Google Scholar]
- Choudhury, M.K.; Nayak, T. Estimation of soil erosion in Sagar Lake catchment of Central India. In Proceedings of the International Conference on Water and Environment, Bhopal, India, 15–18 December 2003; Volume 15, pp. 387–392. [Google Scholar]
- Kumar, A.; Devi, M.; Deshmukh, B. Integrated remote sensing and geographic information system-based RUSLE modelling for estimation of soil loss in western Himalaya, India. Water Resour. Manag. 2014, 28, 3307–3317. [Google Scholar] [CrossRef]
- Mushtaq, F.; Lala, M.G.N. Assessment of hydrological response as a function of LULC change and climatic variability in the catchment of the Wular Lake, J&K, using geospatial technique. Environ. Earth Sci. 2017, 76, 1–19. [Google Scholar]
- Conforti, M.; Aucelli, P.P.; Robustelli, G.; Scarciglia, F. Geomorphology and GIS analysis for mapping gully erosion susceptibility in the Turbolo stream catchment (Northern Calabria, Italy). Nat. Hazards 2011, 56, 881–898. [Google Scholar] [CrossRef]
- Rhett, J.; Thompson, J.; Kolka, R. Wetland Soils, Hydrology, and Geomorphology; University of California Press: Berkeley, CA, USA, 2014. [Google Scholar]
- Sánchez-Ruiz, S.; Piles, M.; Sánchez, N.; Martínez-Fernández, J.; Vall-llossera, M.; Camps, A. Combining SMOS with visible and near/shortwave/thermal infrared satellite data for high resolution soil moisture estimates. J. Hydrol. 2014, 516, 273–283. [Google Scholar] [CrossRef]
- Saha, S.; Gayen, A.; Pourghasemi, H.R.; Tiefenbacher, J.P. Identification of soil erosion-susceptible areas using fuzzy logic and analytical hierarchy process modeling in an agricultural watershed of Burdwan district, India. Environ. Earth Sci. 2019, 78, 1–18. [Google Scholar] [CrossRef]
- Wentworth, C.K. A simplified method of determining the average slope of land surfaces. Am. J. Sci. 1930, 5, 184–194. [Google Scholar] [CrossRef]
- Horn, B.K. Hill shading and the reflectance map. Proc. IEEE 1981, 69, 14–47. [Google Scholar] [CrossRef] [Green Version]
- Zevenbergen, L.W.; Thorne, C.R. Quantitative analysis of land surface topography. Earth Surf. Process. Landf. 1987, 12, 47–56. [Google Scholar] [CrossRef]
- Wischmeier, W.H.; Johnson, C.B.; Cross, B.V. Soil erodibility nomograph for farmland and construction sites. J. Soil Water Conserv. 1971, 26, 5189. [Google Scholar]
- Vogelmann, J.E.; Sohl, T.; Howard, S.M. Regional characterization of land cover using multiple sources of data. Photogramm. Eng. Remote Sens. 1998, 64, 45–57. [Google Scholar]
- Pavelsky, T.M.; Smith, L.C. Remote sensing of hydrologic recharge in the Peace-Athabasca Delta, Canada. Geophys. Res. Lett. 2008, 35, 1–5. [Google Scholar] [CrossRef] [Green Version]
- Mahmood, T.H.; Hasan, K.; Akhter, S.H. Lithologic mapping of a forested montane terrain from Landsat 5 TM image. Geocarto Int. 2019, 34, 750–768. [Google Scholar] [CrossRef]
- McFeeters, S.K. The use of the Normalized Difference Water Index (NDWI) in the delineation of open water features. Int. J. Remote Sens. 1996, 17, 1425–1432. [Google Scholar] [CrossRef]
- Tucker, C.J. Red and photographic infrared linear combinations for monitoring vegetation. Remote Sens. Environ. 1979, 8, 127–150. [Google Scholar] [CrossRef] [Green Version]
- Uddin, K.; Abdul Matin, M.; Maharjan, S. Assessment of land cover change and its impact on changes in soil erosion risk in Nepal. Sustainability 2018, 10, 4715. [Google Scholar] [CrossRef] [Green Version]
- Mirmousavi, S.H. Regional modeling of wind erosion in the North West and South West of Iran. Eurasian Soil Sci. 2016, 49, 942–953. [Google Scholar] [CrossRef]
- Saaty, T.L. Basic theory of the analytic hierarchy process: How to make a decision. Rev. Real Acad. Cienc. Exactas Fis. Nat. 1999, 93, 395–423. [Google Scholar]
- Kayastha, P.; Dhital, M.R.; De Smedt, F. Application of the analytical hierarchy process (AHP) for landslide susceptibility mapping: A case study from the Tinau watershed, west Nepal. Comput. Geosci. 2013, 52, 398–408. [Google Scholar] [CrossRef]
- Saaty, T.L. The Analytic Hierarchy Process: Decision Making in Complex Environments. In Quantitative Assessment in Arms Control; Avenhaus, R., Huber, R.K., Eds.; Springer: Boston, MA, USA, 1984; pp. 285–308. [Google Scholar]
- Saaty, T.L. Decision making—The analytic hierarchy and network processes (AHP/ANP). J. Syst. Sci. Syst. Eng. 2004, 3, 1–35. [Google Scholar] [CrossRef]
- Pandey, A.; Mathur, A.; Mishra, S.K.; Mal, B.C. Soil erosion modeling of a Himalayan watershed using RS and GIS. Environ. Earth Sci. 2009, 59, 399–410. [Google Scholar] [CrossRef]
- Jhariya, D.C.; Kumar, T.; Pandey, H.K. Watershed prioritization based on soil and water hazard model using remote sensing, geographical information system and multi-criteria decision analysis approach. Geocarto Int. 2020, 35, 188–208. [Google Scholar] [CrossRef]
- Ashraf, A. Risk modeling of soil erosion under different land use and rainfall conditions in Soan river basin, sub-Himalayan region and mitigation options. Model. Earth Syst. Environ. 2020, 6, 417–428. [Google Scholar] [CrossRef]
- Yesuph, A.Y.; Dagnew, A.B. Soil erosion mapping and severity analysis based on RUSLE model and local perception in the Beshillo Catchment of the Blue Nile Basin, Ethiopia. Environ. Syst. Res. 2019, 8, 1–21. [Google Scholar] [CrossRef] [Green Version]
- Amin, M.; Romshoo, S.A. Comparative assessment of soil erosion modelling approaches in a Himalayan watershed. Model. Earth Syst. Environ. 2019, 5, 175–192. [Google Scholar] [CrossRef]
- Mushi, C.A.; Ndomba, P.M.; Trigg, M.A.; Tshimanga, R.M.; Mtalo, F. Assessment of basin-scale soil erosion within the Congo River Basin: A review. Catena 2019, 178, 64–76. [Google Scholar] [CrossRef]
- Kulimushi, L.C.; Choudhari, P.; Maniragaba, A.; Elbeltagi, A.; Mugabowindekwe, M.; Rwanyiziri, G.; Singh, S.K. Erosion risk assessment through prioritization of sub-watersheds in Nyabarongo river catchment, Rwanda. Environ. Chall. 2021, 5, 100260. [Google Scholar] [CrossRef]
- Das, B.; Bordoloi, R.; Thungon, L.T.; Paul, A.; Pandey, P.K.; Mishra, M.; Tripathi, O.P. An integrated approach of GIS, RUSLE and AHP to model soil erosion in West Kameng watershed, Arunachal Pradesh. J. Earth Syst. Sci. 2020, 129, 1–18. [Google Scholar] [CrossRef]
- Jaiswal, R.K.; Thomas, T.; Galkate, R.V.; Ghosh, N.C.; Singh, S. Watershed prioritization using Saaty’s AHP based decision support for soil conservation measures. Water Resour. Manag. 2014, 28, 475–494. [Google Scholar] [CrossRef]
- Bryan, R.B. Soil erodibility and processes of water erosion on hillslope. Geomorphology 2000, 32, 385–415. [Google Scholar] [CrossRef]
- Mahalder, B.; Schwartz, J.S.; Palomino, A.M.; Zirkle, J. Relationships between physical-geochemical soil properties and erodibility of streambanks among different physiographic provinces of Tennessee, USA. Earth Surf. Process. Landf. 2018, 43, 401–416. [Google Scholar] [CrossRef]
- Angulo-Martinez, M.; Beguería, S.; Navas, A.; Machin, J. Splash erosion under natural rainfall on three soil types in NE Spain. Geomorphology 2012, 175, 38–44. [Google Scholar] [CrossRef]
- Saedi, T.; Shorafa, M.; Gorji, M.; Moghadam, B.K. Indirect and direct effects of soil properties on soil splash erosion rate in calcareous soils of the central Zagross, Iran: A laboratory study. Geoderma 2016, 271, 1–9. [Google Scholar] [CrossRef]
- Cheng, Q.; Cai, Q.; Ma, W. Comparative study on rain splash erosion of representative soils in China. Chin. Geogr. Sci. 2008, 18, 155–161. [Google Scholar] [CrossRef] [Green Version]
- Fernández-Raga, M.; Palencia, C.; Keesstra, S.; Jordán, A.; Fraile, R.; Angulo-Martínez, M.; Cerdà, A. Splash erosion: A review with unanswered questions. Earth-Sci. Rev. 2017, 171, 463–477. [Google Scholar] [CrossRef] [Green Version]
- Fu, Y.; Li, G.L.; Zheng, T.H.; Li, B.Q.; Zhang, T. Splash detachment and transport of loess aggregate fragments by raindrop action. Catena 2017, 150, 154–160. [Google Scholar] [CrossRef]
- ÓGeen, A.T.; Elkins, R.; Lewis, D. Division of Agriculture and Natural Resources. 2006. Available online: https://ucanr.edu/ (accessed on 26 November 2022).
- McDonald, M.A.; Healey, J.R.; Stevens, P.A. The effects of secondary forest clearance and subsequent land-use on erosion losses and soil properties in the Blue Mountains of Jamaica. Agric. Ecosyst. Environ. 2002, 92, 1–19. [Google Scholar] [CrossRef]
- Chalise, D.; Kumar, L.; Shriwastav, C.P.; Lamichhane, S. Spatial assessment of soil erosion in a hilly watershed of Western Nepal. Environ. Earth Sci. 2018, 77, 685. [Google Scholar] [CrossRef]
- Chapin, F.S.; Oechel, W.C.; Van Cleve, K.; Lawrence, W. The role of mosses in the phosphorus cycling of an Alaskan black spruce forest. Oecologia 1987, 74, 310–315. [Google Scholar] [CrossRef] [PubMed]
- Kachouri, S.; Achour, H.; Abida, H.; Bouaziz, S. Soil erosion hazard mapping using Analytic Hierarchy Process and logistic regression: A case study of Haffouz watershed, central Tunisia. Arab. J. Geosci. 2015, 8, 4257–4268. [Google Scholar] [CrossRef]
- Mahapatra, S.K.; Reddy, G.O.; Nagdev, R.; Yadav, R.P.; Singh, S.K.; Sharda, V.N. Assessment of soil erosion in the fragile Himalayan ecosystem of Uttarakhand, India using USLE and GIS for sustainable productivity. Curr. Sci. 2018, 115, 108–121. [Google Scholar] [CrossRef]
- Yang, T.; Siddique, K.H.; Liu, K. Cropping systems in agriculture and their impact on soil health-A review. Glob. Ecol. Conserv. 2020, 23, e01118. [Google Scholar] [CrossRef]
- Jaafari, A.; Najafi, A.; Pourghasemi, H.R.; Rezaeian, J.; Sattarian, A. GIS-based frequency ratio and index of entropy models for landslide susceptibility assessment in the Caspian forest, northern Iran. Int. J. Environ. Sci. Technol. 2014, 11, 909–926. [Google Scholar] [CrossRef] [Green Version]
- Méndez-Toribio, M.; Meave, J.A.; Zermeño-Hernández, I.; Ibarra-Manríquez, G. Effects of slope aspect and topographic position on environmental variables, disturbance regime and tree community attributes in a seasonal tropical dry forest. J. Veg. Sci. 2016, 27, 1094–1103. [Google Scholar] [CrossRef]
- Gallardo-Cruz, J.A.; Pérez-García, E.A.; Meave, J.A. β-Diversity and vegetation structure as influenced by slope aspect and altitude in a seasonally dry tropical landscape. Landsc. Ecol. 2009, 24, 473–482. [Google Scholar] [CrossRef]
- Yang, Q.; Xie, Y.; Li, W.; Jiang, Z.; Li, H.; Qin, X. Assessing soil erosion risk in karst area using fuzzy modeling and method of the analytical hierarchy process. Environ. Earth Sci. 2014, 71, 287–292. [Google Scholar] [CrossRef]
- George, K.J.; Kumar, S.; Hole, R.M. Geospatial modelling of soil erosion and risk assessment in Indian Himalayan region—A study of Uttarakhand state. Environ. Adv. 2021, 4, 100039. [Google Scholar] [CrossRef]
- Makaya, N.; Dube, T.; Seutloali, K.; Shoko, C.; Mutanga, O.; Masocha, M. Geospatial assessment of soil erosion vulnerability in the upper uMgeni catchment in KwaZulu Natal, South Africa. Phys. Chem. Earth Parts A/B/C 2019, 112, 50–57. [Google Scholar] [CrossRef]
- Seutloali, K.E.; Beckedahl, H.R. A review of road-related soil erosion: An assessment of causes, evaluation techniques and available control measures. Earth Sci. Res. J. 2015, 19, 73–80. [Google Scholar] [CrossRef]
- McCloskey, J.T.; Lilieholm, R.J.; Cronan, C. Using Bayesian belief networks to identify potential compatibilities and conflicts between development and landscape conservation. Landsc. Urban Plan. 2011, 101, 190–203. [Google Scholar] [CrossRef] [Green Version]
- Rather, M.A.; Satish Kumar, J.; Farooq, M.; Rashid, H. Assessing the influence of watershed characteristics on soil erosion susceptibility of Jhelum basin in Kashmir Himalayas. Arab. J. Geosci. 2017, 10, 1–25. [Google Scholar] [CrossRef]
- Meraj, G.; Romshoo, S.A.; Yousuf, A.R. Geoinformatics approach to qualitative forest density loss estimation and protection cum conservation strategy-a case study of Pir Panjal range, J & K, India. Int. J. Curr. Res. Rev. 2012, 4, 47–61. [Google Scholar]
- Romshoo, S.A.; Bhat, S.A.; Rashid, I. Geoinformatics for assessing the morphometric control on hydrological response at watershed scale in the Upper Indus Basin. J. Earth Syst. Sci. 2012, 121, 659–686. [Google Scholar] [CrossRef] [Green Version]
- Saha, S. Geo-Environmental Evaluation for Exploring Potential Soil Erosion Areas of Jainti River Basin Using AHP Model, Eastern India. Univers. J. Environ. Res. Technol. 2018, 7, 38–55. [Google Scholar]
- Gómez-Gutiérrez, Á.; Conoscenti, C.; Angileri, S.E.; Rotigliano, E.; Schnabel, S. Using topographical attributes to evaluate gully erosion proneness (susceptibility) in two mediterranean basins: Advantages and limitations. Nat. Hazards 2015, 79, 291–314. [Google Scholar] [CrossRef]


| Intensity of Importance | Definition |
|---|---|
| 1 | Equal Importance |
| 3 | Moderate Importance |
| 5 | Strong Importance |
| 7 | Very Strong Importance |
| 9 | Extreme Importance |
| S. No. | Thematic Layers | Classes | Scale Value | Soil Severity |
|---|---|---|---|---|
| 1 | EL (m) | 1571–2001 | 1 | Very Low |
| 2001–2659 | 2 | Low | ||
| 2659–3298 | 3 | Medium | ||
| 3298–3906 | 4 | High | ||
| 3906–5189 | 5 | Very High | ||
| 2 | SL (degrees) | 0–8 | 1 | Very Low |
| 8–20 | 2 | Low | ||
| 20–30 | 3 | Medium | ||
| 30–38 | 4 | High | ||
| 38–62 | 5 | Very High | ||
| 3 | AS | −1–68 | 1 | Very Low |
| 68–143 | 2 | Low | ||
| 143–217 | 3 | Medium | ||
| 217–289 | 4 | High | ||
| 289–359 | 5 | Very High | ||
| 4 | CU | −5.26–0.98 | 1 | Very Low |
| −0.98–0.30 | 2 | Low | ||
| −0.30–0.25 | 3 | Medium | ||
| 0.25–0.98 | 4 | High | ||
| 0.98–6.35 | 5 | Very High | ||
| 5 | SO | Coarse Loamy | 1 | Very Low |
| Fine Loamy/Clayey Skeletal | 2 | Low | ||
| Loamy Skeletal/Loamy | 3 | Medium | ||
| 6 | LULC | Snow/Glacial area | 1 | Very Low |
| Waterbodies | 1 | Very Low | ||
| Built-up | 2 | Low | ||
| Forest | 2 | Low | ||
| Agricultural land | 3 | Medium | ||
| Grassland/Grazing Land | 4 | High | ||
| Wasteland | 5 | Very High | ||
| 7 | DD | 0–0.28 | 1 | Very Low |
| 0.28–0.56 | 2 | Low | ||
| 0.56–0.86 | 3 | Medium | ||
| 0.86–1.29 | 4 | High | ||
| 1.29–2.27 | 5 | Very High | ||
| 8 | RE | 337.12–375.18 | 1 | Very Low |
| 375.18–406.80 | 2 | Low | ||
| 406.80–435.19 | 3 | Medium | ||
| 435.19–464.86 | 4 | High | ||
| 464.86–501.64 | 5 | Very High | ||
| 9 | LI | Waterbody Mask | 1 | Very Low |
| Massive Granite Plutonic Rocks/Amygdaloidal basalt | 2 | Low | ||
| Phyllites Schists Slates/Quartzite Shale Phyllite Beds | 3 | Medium | ||
| Sandstone and Conglomerate/Sandstone/Claystone/Siltstone | 4 | High | ||
| Sand/Silt with Clay | 5 | Very High | ||
| 10 | NDWI | −0.98–0.24 | 1 | Very Low |
| −0.24–0.19 | 2 | Low | ||
| −0.19–0.13 | 3 | Medium | ||
| −0.13–0.07 | 4 | High | ||
| −0.07–0.16 | 5 | Very High | ||
| 11 | NDVI | −0.10–0.06 | 5 | Very High |
| 0.06–0.12 | 4 | High | ||
| 0.12–0.18 | 3 | Medium | ||
| 0.18–0.24 | 2 | Low | ||
| 0.24–1.0 | 1 | Very Low |
| EL | SL | AS | CU | SO | LULC | DD | RE | LI | NDWI | NDVI | |
| EL | 1 | 1 | 3 | 3 | 7 | 5 | 5 | 7 | 7 | 9 | 5 |
| SL | 1 | 1 | 3 | 2 | 3 | 4 | 5 | 5 | 4 | 3 | 3 |
| AS | 0.33 | 1 | 1 | 3 | 2 | 3 | 4 | 5 | 5 | 4 | 3 |
| CU | 0.33 | 0.33 | 1 | 1 | 3 | 2 | 3 | 4 | 5 | 5 | 4 |
| SO | 0.14 | 0.33 | 0.33 | 1 | 1 | 3 | 2 | 3 | 4 | 5 | 5 |
| LULC | 0.2 | 0.14 | 0.33 | 0.33 | 1 | 1 | 3 | 2 | 3 | 4 | 5 |
| DD | 0.2 | 0.2 | 0.14 | 0.33 | 0.33 | 1 | 1 | 3 | 2 | 3 | 4 |
| RE | 0.14 | 0.2 | 0.2 | 0.14 | 0.33 | 0.33 | 1 | 1 | 3 | 2 | 3 |
| LI | 0.14 | 0.14 | 0.2 | 0.2 | 0.14 | 0.33 | 0.33 | 1 | 1 | 3 | 2 |
| NDWI | 0.11 | 0.14 | 0.14 | 0.2 | 0.2 | 0.14 | 0.33 | 0.33 | 1 | 1 | 3 |
| NDVI | 0.2 | 0.11 | 0.14 | 0.14 | 0.2 | 0.2 | 0.14 | 0.33 | 0.33 | 1 | 1 |
| Sum | 3.79 | 4.59 | 9.48 | 11.34 | 18.2 | 20 | 24.8 | 31.66 | 35.33 | 40 | 38 |
| CR | 0.07 | ||||||||||
| Very Low | Low | Medium | High | Very High | |||||
|---|---|---|---|---|---|---|---|---|---|
| Area (km2) | Percentage (%) | Area (km2) | Percentage (%) | Area (km2) | Percentage (%) | Area (km2) | Percentage (%) | Area (km2) | Percentage (%) |
| 275.14 | 15% | 347.85 | 19% | 465.08 | 25% | 491.40 | 27% | 250.25 | 14% |
| Soil Erosion Susceptibility Class | Area Coverage (km2) and Percentage (%) | |||||||||||
|---|---|---|---|---|---|---|---|---|---|---|---|---|
| EL | SL | AS | CU | DD | RE | |||||||
| km2 | % | km2 | % | km2 | % | km2 | % | km2 | % | km2 | % | |
| Very Low | 499.44 | 27% | 412.74 | 23% | 339.82 | 19% | 96.26 | 5% | 502.41 | 27% | 266.51 | 15% |
| Low | 309.87 | 17% | 271.50 | 15% | 376.93 | 21% | 364.26 | 20% | 534.17 | 29% | 382.06 | 21% |
| Medium | 348.78 | 19% | 396.37 | 22% | 392.58 | 21% | 969.68 | 53% | 457.93 | 25% | 544.87 | 30% |
| High | 403.87 | 22% | 467.99 | 26% | 381.03 | 21% | 314.65 | 17% | 278.50 | 15% | 299.76 | 16% |
| Very High | 267.76 | 15% | 281.12 | 15% | 339.35 | 19% | 84.87 | 5% | 56.71 | 3% | 336.51 | 18% |
| Total Area | 1829.72 | |||||||||||
| Soil Erosion Susceptibility Class | Area Coverage (km2) and Percentage (%) | |||||||||
|---|---|---|---|---|---|---|---|---|---|---|
| LULC | LI | NDVI | NDWI | SO | ||||||
| km2 | % | km2 | % | km2 | % | km2 | % | km2 | % | |
| Very Low | 220.42 | 12% | 15.57 | 1% | 157.44 | 9% | 160.03 | 9% | 510.10 | 28% |
| Low | 525.61 | 29% | 181.17 | 10% | 407.74 | 22% | 441.33 | 24% | 742.33 | 41% |
| Medium | 286.08 | 16% | 558.13 | 31% | 531.08 | 29% | 521.09 | 28% | 577.29 | 32% |
| High | 30.73 | 2% | 488.30 | 27% | 441.58 | 24% | 427.22 | 23% | - | - |
| Very High | 766.87 | 42% | 586.54 | 32% | 291.87 | 16% | 280.04 | 15% | - | - |
| Total Area | 1829.72 | |||||||||
Disclaimer/Publisher’s Note: The statements, opinions and data contained in all publications are solely those of the individual author(s) and contributor(s) and not of MDPI and/or the editor(s). MDPI and/or the editor(s) disclaim responsibility for any injury to people or property resulting from any ideas, methods, instructions or products referred to in the content. |
© 2023 by the authors. Licensee MDPI, Basel, Switzerland. This article is an open access article distributed under the terms and conditions of the Creative Commons Attribution (CC BY) license (https://creativecommons.org/licenses/by/4.0/).
Share and Cite
Mushtaq, F.; Farooq, M.; Tirkey, A.S.; Sheikh, B.A. Analytic Hierarchy Process (AHP) Based Soil Erosion Susceptibility Mapping in Northwestern Himalayas: A Case Study of Central Kashmir Province. Conservation 2023, 3, 32-52. https://doi.org/10.3390/conservation3010003
Mushtaq F, Farooq M, Tirkey AS, Sheikh BA. Analytic Hierarchy Process (AHP) Based Soil Erosion Susceptibility Mapping in Northwestern Himalayas: A Case Study of Central Kashmir Province. Conservation. 2023; 3(1):32-52. https://doi.org/10.3390/conservation3010003
Chicago/Turabian StyleMushtaq, Fayma, Majid Farooq, Anamika Shalini Tirkey, and Bashir Ahmad Sheikh. 2023. "Analytic Hierarchy Process (AHP) Based Soil Erosion Susceptibility Mapping in Northwestern Himalayas: A Case Study of Central Kashmir Province" Conservation 3, no. 1: 32-52. https://doi.org/10.3390/conservation3010003