
Group Size Buffers against Energetic Stress in Honeybee Workers (Apis mellifera)

Naturwissenschaftliche Fakultät I, Martin-Luther-Universität Halle-Wittenberg, 06099 Halle (Saale), Germany
†
Current Address: Department of Chemistry, University of Nairobi, Nairobi P.O. Box 30197-00100, Kenya.
Stresses 2023, 3(2), 397-403; https://doi.org/10.3390/stresses3020029
Submission received: 2 March 2023
/
Revised: 24 March 2023
/
Accepted: 31 March 2023
/
Published: 4 April 2023
(This article belongs to the Section Animal and Human Stresses)
Abstract
:Individuals of the Western honeybee species, Apis mellifera, live in large groups of thousands of worker bees, a queen, and a few drones. Workers interact frequently with related individuals while performing various tasks. Although it is well understood why and under which conditions sociality can evolve, the consequences for individuals living in permanent groups are less well understood. As individuals of solitary species become stressed when kept at high density, it might be the opposite in obligate social species. Here, I use an experimental laboratory set-up to study the effect of varying group sizes on the magnitude and within-group variance of stress responses towards energetic and heat stress. While only a weak difference was found in the magnitude of an energetic stress response as a function of group size, the within-group variance showed a statistically significant positive relationship with group size for the glucose/trehalose ratio, a marker for energetic stress. The heat stress marker, hsp70AB gene expression, did not show any relationship to group size. Individuals of obligate social species seem to benefit from adaptations to permanent group living, e.g., buffering against stress, especially at a higher density of individuals. The consequences of infections and immune system activation in isolated individuals are discussed.
1. Introduction
The evolution of obligate group living is one of the major transitions in evolution [1]. The theoretical basis for the evolution of social insect colonies, including the reproductive division of labour resulting in castes showing different reproductive outputs, goes back to the seminal work of Hamilton [2,3]. Although this has been challenged recently [4], the basic idea of inclusive fitness explaining the evolution of worker sterility is still widely accepted today [5].
Although the ultimate reasons for group living in social insects are well studied and explained, the proximate, more mechanistic consequences of group living are still not explored in their completeness. Major benefits of group living are, amongst others, division of labour [6], social immunity [7], defence of the nest [8], cooperative brood care [9], and collective decision-making during the choice of a new nesting site [10].
In insects, there is a well-described stress response axis, which involves the brain, corpora cardiaca, which is the major neurohemal organ in insects, responsible for the release of numerous neuropeptides, and other peripheral organs especially those for energy storage as the fat body [11]. However, in obligate solitary insects like the fruit fly Drosophila melanogaster, crowding at larval stages results in increased stress levels evidenced by increased expression of heat shock proteins [12]. By contrast, obligate group-living organisms might show adaptations that reduce stress in situations of crowding as this is the usual level of exposure of individuals. Indeed, it has been shown that individuals of social insect species kept in isolation suffer from increased stress. In the ant Cataglyphis fellah, socially isolated individuals have a shorter life span as they suffer from increased energy metabolism [13]. Isolated ants are more active in exploring their environment and more likely to be searching for other members of their society. In bumblebees, extended periods of social isolation result in the degeneration of brain areas [14].
The Western honeybee (Apis mellifera) displays one of the most advanced forms of eusociality exhibiting a sophisticated system of division of labour, including complex patterns of chemical communication [15]. Furthermore, the foraging and nest-searching pattern, and recruitment of fellow nestmates to valuable resources or nesting sites is based on a complex dance language that includes the virtual transfer of information gathered in the vertical plane on the comb into the horizontal plane [16].
Small colonies, especially laboratory mini colonies kept in hoarding cages, do not show signs of typical social organisation. Such colonies appear to be suffering from increased stress compared to full colonies headed by naturally mated queens [17]. Extremely small colonies might not express normal physiological function. For example, colonies below 100 individuals do not produce wax [18]. In laboratory experiments, it has been shown that groups of 10 individuals have reduced longevity and hoard less per bee, while groups of 30 individuals up to 100 individuals do not show a difference in survival or hoarding rate [19].
Here, I will test in a controlled laboratory trial whether group size affects stress levels in individual workers dependent on the group size. Different stressors will be tested, heat, energetic stress, and the magnitude, as well as the variance within groups will be evaluated.
2. Results
2.1. Starvation Response
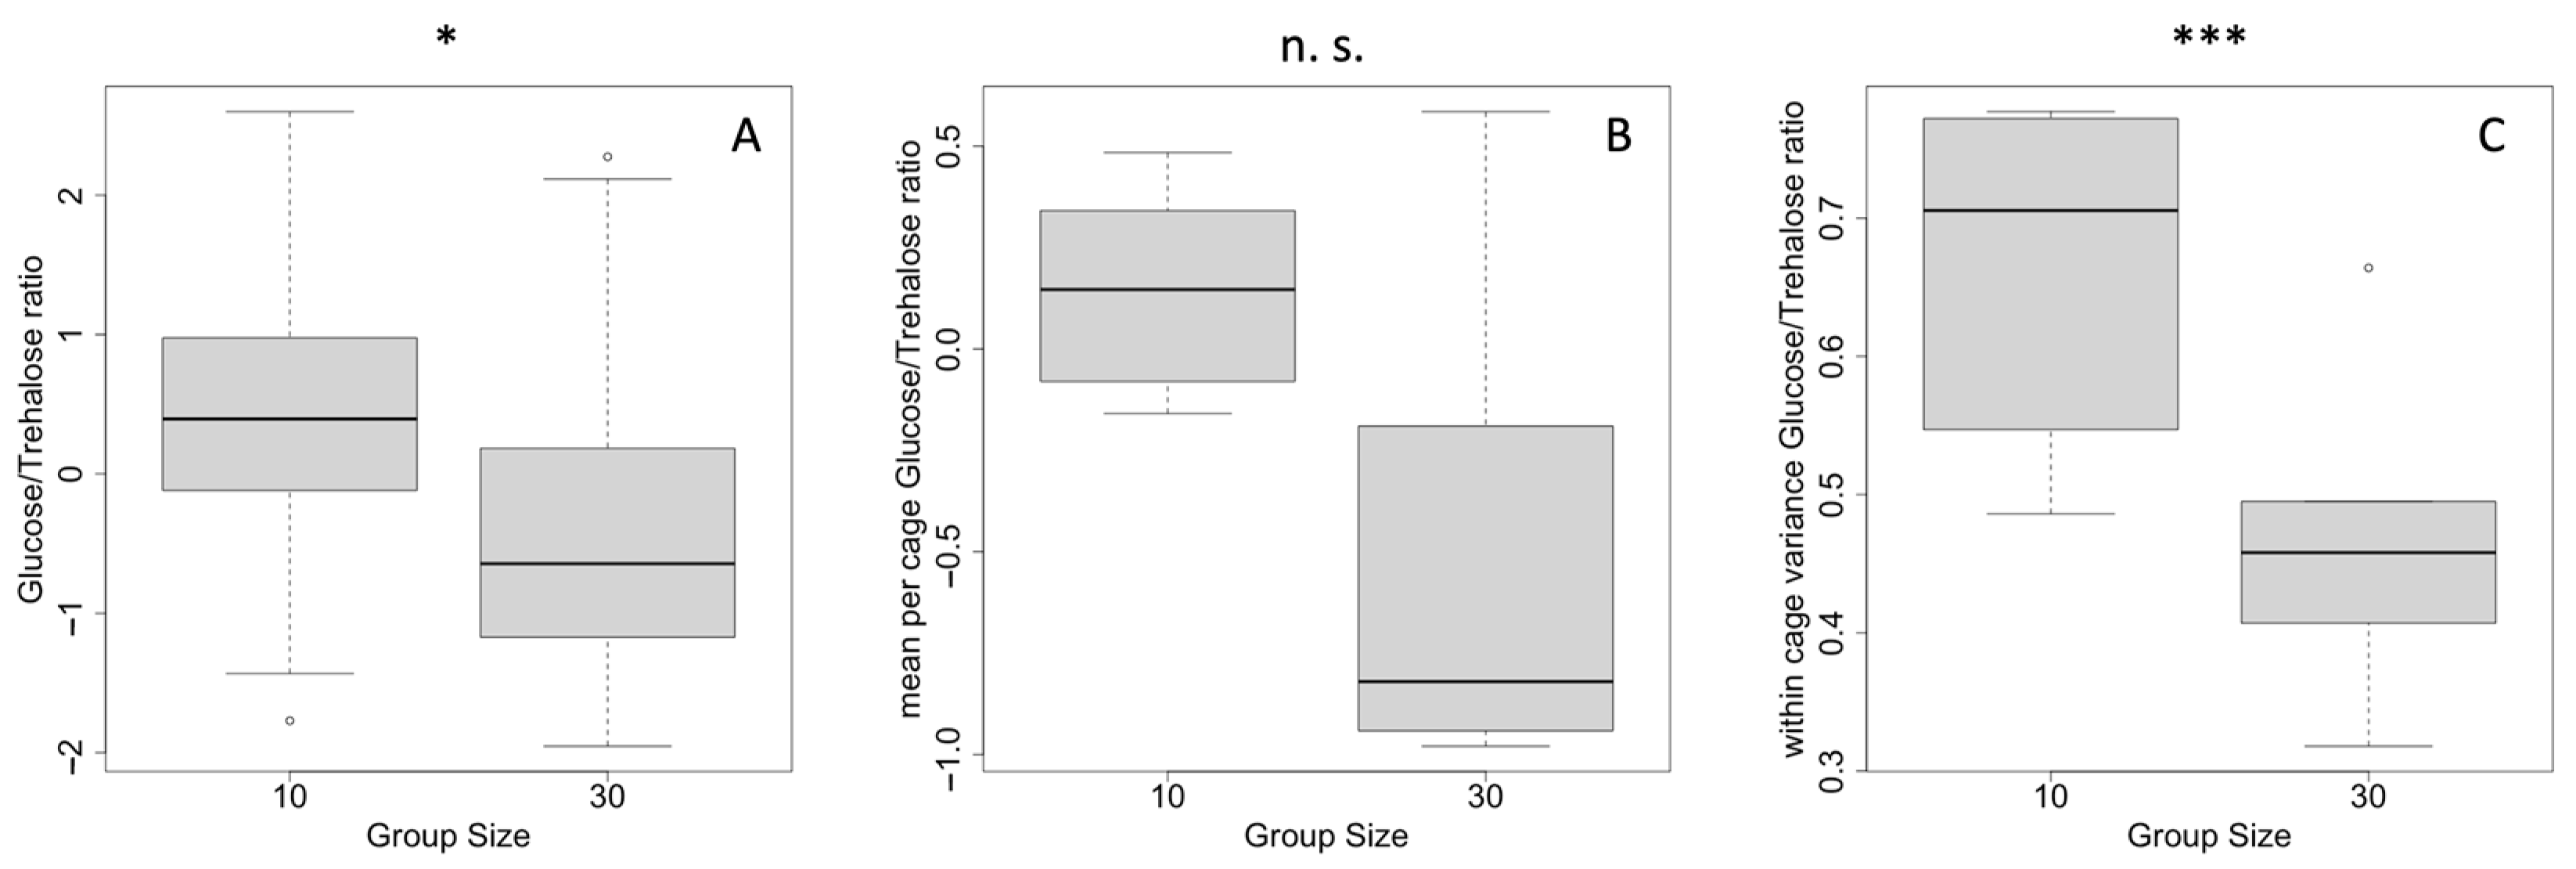
The worker bees kept in groups of 10 showed a significantly higher glucose/trehalose ratio compared to those bees kept in groups of 30 individuals (t-test, 2-sided, p < 0.001) (Figure 1A). When considering bees in different cages, the difference of the means of the cages of the groups of 10 (N = 6) and groups of 30 (N = 5) narrowly missed significance (t-test, 2-sided, p = 0.06) (Figure 1B). However, the standard deviations of the cages (within variation among the tested workers) were significantly lower in the group of 30 individuals compared to the groups composed of 10 individuals (t-test, 2-sided, p = 0.03) (Figure 1C).
2.2. Heat-Shock Response
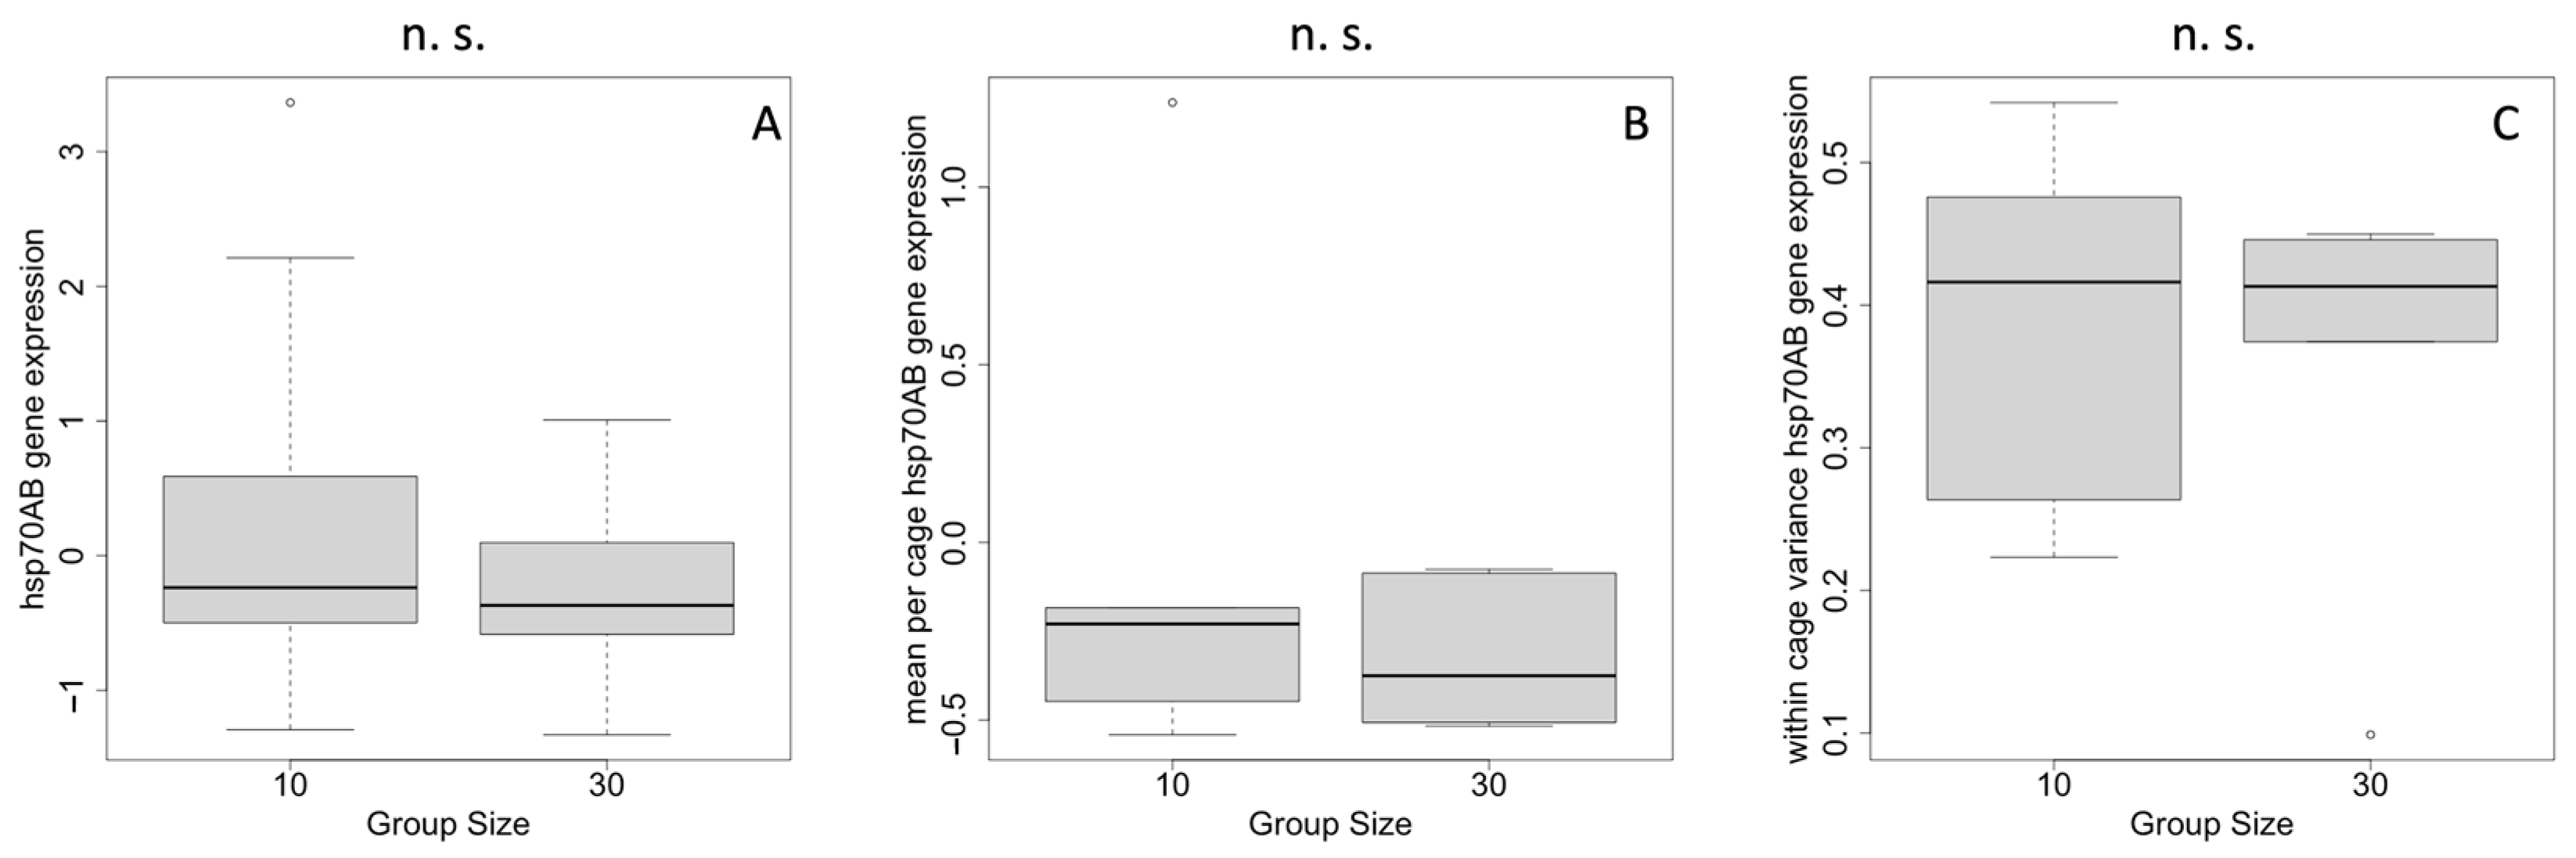
The absolute levels of hsp70AB gene expression did not differ among cages containing 10 or 30 individuals (t-test, 2-sided, p = 0.21) (Figure 2A). When taking the cages into account, the means of the expression levels still did not differ between group sizes (t-test, 2-sided, p = 0.43) (Figure 2B). The variance within the cages did not differ between different group sizes (t-test, 2-sided, p = 0.76) (Figure 2C).
3. Discussion
The effect of group size on different stress markers was analysed. The heat shock response (hsp70AB gene expression) and energetic stress (haemolymph glucose/trehalose ratio) were analysed in laboratory-kept groups of either ten or 30 workers. While the heat shock response showed no relationship to group size, the energetic stress marker showed a weak effect of a reduction of absolute stress levels in larger groups. More importantly, it showed that worker bees kept within a group are more similar to each other in their energetic stress response when the group is larger.
A honeybee colony is composed of different types of individuals related to each other, the queen, the mother of all other individuals and the only reproductive individual, her daughters—the workers, and her sons—the drones [20]. Worker bees are the largest group, who perform almost all the tasks needed like brood care, defence of the nest, and foraging for food. Workers frequently interact with each other to gather local information about various conditions, e.g., the presence of the queen, and the availability of resources. Thus, in such obligate social species as the honeybee, social interactions are the norm, while in solitary species high density of individuals can act as a stressor [12].
The lack of the social environment might act as a stressor in obligate social species. In the ant Camponotus fellah, socially isolated individuals are affected by higher mortality, which might be caused by reduced food intake and high energy expenditure [13]. Similar to ants kept in groups, isolated ants had a similar food intake, but their activity pattern was strongly increased, resulting in a negative energy balance. In bumblebees, the lack of social context results in impaired brain gene expression and failures in brain development [14]. Even limited social interactions helped to maintain normal brain function and development.
The variation of group size in the present study resulted in a difference in energy-related stress as measured by the ratio of haemolymph glucose to trehalose. While glucose is the main source of energy, trehalose consists of two glucose molecules linked by a 1,1-glycosidic bond and is the main storage form for glucose and is stored in the insect fat body. Upon increased energy expenditure, it will be released from the fat body to the haemolymph and converted to glucose for the generation of energy. Bees in smaller groups recruited more trehalose to maintain levels of glucose, which is known from earlier experiments [17,21].
More astonishing than the absolute levels of the glucose/trehalose ratio was the fact that larger groups showed less variation within their group amongst group members. In groups of ten individuals, some substantial within-group variation was still observed, while this within-group variation was lower in groups of 30 bees. Thus, larger group sizes buffer against social context-induced energetic stress. By contrast, heat shock responses are not linked to the recruitment of energy resources and hence, were not influenced by group size.
Energetic resources are important for social insects, especially the honeybee, with respect to diseases and parasites. These are frequently found in honeybees, sometimes as a by-product of human interference [22]. Diseases like the microsporidian Nosema ceranae result in an increased energetic demand as shown by reduction in haemolymph sugars [23,24]. However, resistant strains of the honeybee produced through artificial selection [25] escaped the manipulation of apoptosis by Nosema and no longer show signs of increased energetic needs [26,27]. In turn, this could indicate that isolated bees might suffer more strongly from diseases or parasites, as they might not be able to provide the needed energetic resources for fighting the disease. However, this has not been tested, neither has the implication that group size might not only buffer against energetic stress, but also reduce disease and parasite burden.
The increased stress of isolated individuals and their increased energy demand might also explain why they reduce their basic immune system level, as was shown for bumblebees. Isolated bumblebees reduce their phenoloxidase activity [28] and downregulate antimicrobial peptide genes [29,30]. Thus, costly immune system maintenance might not be possible for isolated individuals of obligate social species. However, with increasing social complexity it seems that there is a selection pressure elicited by group size. In bees, different levels of social organisation are found ranging from solitary to advanced levels of eusocial organisation with morphological castes, division of labour, and self-sacrifice through suicidal stinging [31]. Amongst bee species with different level of social complexity, an increase in antimicrobial activity is found in species with larger group sizes [32]. A similar trend is found in Thysanoptera, an insect order that shows a different evolutionary origin for sociality than bees, with species showing high antimicrobial activity when they live in large groups [33]. Thus, the phenotypic plastic response in bees of different group sizes is also reflected at the level of species differing in group size due to differences in social complexity.
4. Materials and Methods
4.1. Experimental Set Up
Bee samples were obtained from a natural colony of the Carniolan honeybee, Apis mellifera carnica, a subspecies of Western honeybee. In detail, a comb containing worker brood was taken from the colony and transferred to an incubator set at 35 °C and rel. humidity of approx. 60%. Emerging workers bees were collected daily, marked, and introduced in to hoarding cages made of stainless steel (9.5 × 8.5 × 5.5 cm for ten bees and 14.5 × 12 × 5 cm for 30 bees). Bees’ assignment to cages was random. For each group size (group of ten bees, group of 30 bees) three replicates were used and the whole set up was replicated at another time point using a different temporal sample of bee brood. The bees were given food in the form of sugar candy and water ad libitum. Workers were kept for seven days before they were snap frozen in liquid nitrogen. Samples were stored at −80 °C until further analysis.
4.2. Hemolymph Collection
For the analysis of starvation stress the glucose and trehalose titre in the haemolymph were determined. Snap frozen individuals (N = 10 per cage) were decapitated and from the thorax a droplet of haemolymph was collected using 1 µL microcapillaries (Sigma-Aldrich, Schnelldorf, Germany). To improve the amount collected, the thorax was pressured between two fingers. To avoid melanisation, sodium-cacodylate buffer (10 mM Na-cacodylate, 5 mM NaCl2, adjusted to pH 6.5) was added to the haemolymph (1:5) and samples were stored at −80 °C until subsequent processing.
4.3. Glucose/Trehalose Assay
Haemolymph glucose and trehalose titres were determined using a commercial trehalose kit (Megazyme International, Wicklow, Ireland). It measures the amount of free D-glucose through its conversion to gluconate-6-phosphate and NADPH by hexokinase + glucose-6-phosphatase. NADPH absorbance is read at 340 nm in a microplate reader (Synergy MX, BioTek, Bad Friedrichshall, Germany) and is a linear measure of D-glucose [34]. To determine the trehalose titre, it needs to be broken down by trehalase creating two molecules of glucose, which will be quantified as described before. [34].
The optimal haemolymph concentration was determined using a dilution series and a comparison to glucose (2 µg) and trehalose (1 µg) standards. Finally, samples were diluted 1:20 using sodium cacodylate buffer solution. The glucose and trehalose assays were conducted according to the instructions of the manufacturer. The duration of the assay was extended to 15 min (D-glucose step) and 30 min (trehalose step). Samples were run in duplicates. Blanks and standards were run on each microplate as negative and positive controls, respectively.
4.4. RNA Extraction, cDNA Synthesis, and qRT-PCR
Total RNA was extracted from the whole abdomens of three randomly chosen individuals of the 10- and 30-individual groups using Trizol reagent (Qiagen, Hilden, Germanny) [35] and was eventually dissolved in 20 µL DEPC-water (0.1% v/v DEPC). The quality and quantity of the RNA was determined using a spectrophotometer (Nanodrop 1000, peqlab, Erlangen, Germany). cDNA synthesis was done using 1 µg total RNA, 80 U M-MLV Reverse Transcriptase (Promega, Mannheim, Germany) and 0.8 µg Oligo (dT)15 Primer (Promega, Mannheim, Germany). The cDNA was cleaned using SureClean Plus (Bioline, Luckenwalde, Germany). The purified and cleaned cDNA was re-dissolved in 20 µL DEPC-water (0.1% v/v DEPC). The cDNA quality and quantity were determined using a spectrophotometer (Nanodrop 1000, peqlab, Erlangen, Germany).
Three house-keeping genes (HKG), RPS5, rp49, and GAPDH, were chosen to quantify the expression level of the heat shock protein (HSP) hsp70AB. For qRT-PCR reactions 10 ng/µL cDNA was used. Reactions contained: 1 µL cDNA, 5 µL SensiMixPlus SYBR & Fluorescein Kit (Bioline, Luckenwalde, Germany), 0.3 mM of each gene-specific primer and 3.4 µL DEPC-water (0.1% v/v DEPC). The cycling conditions were as follows: 1 cycle at 95 °C for 10 min, followed by 39 cycles at 95 °C for 15 s (denaturation), 57 °C for 30 s (primer annealing) and 72 °C for 30 s (elongation). Reactions were carried out in a CFX ConnectTM Real-Time PCR Detection System (Bio-Rad, Munich, Germany) in technical replicates. Melting curve analyses reading the fluorescence units between 55 °C and 98 °C at 1 °C intervals were done to verify the specificity of PCR amplifications. All PCR products showed one peak only during melting curve analysis indicative of a high specificity of the primers. Samples showing differences higher than 0.5 Ct-value between replicates were repeated as technical replicates.
4.5. Normalization of Gene Expression
Several HKGs were tested, which were not expected to be regulated by treatment conditions. Here, three HKG were used, RPS5, rp49, and GAPDH, which were shown to be suitable HKGs in Apis mellifera [17,36]. A subsample of five randomly chosen cDNA samples (10 ng/µL) was used. All samples with Ct-value differences higher than 0.5 between replicates were repeated. For evaluating the stability of the expression data for the HKGs, Normfinder [37] was used on the subsample. RPS5 and rp49 turned out to be the most stable reference genes across treatments and were used for subsequent standardization of the gene expression levels of the target gene.
4.6. Statistical Data Analysis
The glucose/trehalose assay data were analysed using the Mega-CalcTM software (Excel Add-in, www.megazyme.com (accessed on 16 April 2015)). We calculated the glucose/trehalose ratio as a sensitive indicator of stress.
Relative expression levels of the target gene hsp70AB were calculated using the ΔCt method [38] taking PCR efficiencies into account [39]. PCR efficiencies for HKGs and the target genes were determined using LinReg [40].
Honeybee worker groups consisting of ten or 30 individuals were analysed for their hsp70AB gene expression levels and the glucose/trehalose ratio. For both types of data, we used a z-transformation to reduce the association of mean and variance. As we detected in both data sets, cages that were outliers for the within-cage variance measured as the standard deviation of all measured individuals (hsp70AB expression: N = 3; glucose/trehalose ratio: N = 8–10). Outliers were more than 2 s. d. from the mean of the respective data set and were removed. All analyses were carried out using R 4.2.1 [41] and standard spreadsheet software.
Funding
I gratefully acknowledge the financial support for this research from the following organizations and agencies: Bundesministerium für Bildung und Forschung (BMBF) within the program FUGATO-Plus (FKZ: 0315126 to HMGL). The funders had no role in study design, data collection and analysis, decision to publish, or preparation of the manuscript.
Data Availability Statement
The data presented in this study are openly available in FigShare at https://figshare.com/search?q=doi%3A+10.6084%2Fm9.figshare.22497250 (accessed on 30 March 2023).
Acknowledgments
I would like to thank J. Richter for help with field and laboratory work.
Conflicts of Interest
The author declares no conflict of interest.
References
- Szathmáry, E.; Maynard-Smith, J. The major evolutionary transitions. Nature 1995, 374, 227–232. [Google Scholar] [CrossRef] [PubMed]
- Hamilton, W.D. The genetical evolution of social behaviour I. J. Theor. Biol. 1964, 7, 1–16. [Google Scholar] [CrossRef] [PubMed]
- Hamilton, W.D. The genetical evolution of social behaviour II. J. Theor. Biol. 1964, 7, 17–52. [Google Scholar] [CrossRef] [PubMed]
- Nowak, M.A.; Tarnita, C.E.; Wilson, E.O. The evolution of eusociality. Nature 2010, 466, 1057–1062. [Google Scholar] [CrossRef] [PubMed]
- Abbot, P.; Abe, J.; Alcock, J.; Alizon, S.; Alpedrinha, J.A.C.; Andersson, M.; Andre, J.-B.; van Baalen, M.; Balloux, F.; Balshine, S.; et al. Inclusive fitness theory and eusociality. Nature 2011, 471, E1–E4. [Google Scholar] [CrossRef] [Green Version]
- Beshers, S.N.; Fewell, J.H. Models of Division of labor in social insects. Annu. Rev. Entomol. 2001, 46, 413–440. [Google Scholar] [CrossRef] [Green Version]
- Cremer, S.; Armitage, S.A.O.; Schmid-Hempel, P. Social Immunity. Curr. Biol. 2007, 17, R693–R702. [Google Scholar] [CrossRef] [Green Version]
- Abbot, P. Defense in social insects: Diversity, division of labor, and evolution. Annu. Rev. Entomol. 2022, 67, 407–436. [Google Scholar] [CrossRef]
- Schultner, E.; Oettler, J.; Helanterä, H. The role of brood in eusocial Hymenoptera. Q. Rev. Biol. 2017, 92, 39–78. [Google Scholar] [CrossRef]
- Visscher, P.K. Group decision making in nest-site selection among social insects. Annu. Rev. Entomol. 2007, 52, 255–275. [Google Scholar] [CrossRef]
- Even, N.; Devaud, J.M.; Barron, A.B. General Stress Responses in the Honey Bee. Insects 2012, 3, 1271–1298. [Google Scholar] [CrossRef] [Green Version]
- Sørensen, J.G.; Loeschcke, V. Larval crowding in Drosophila melanogaster induces Hsp70 expression, and leads to increased adult longevity and adult thermal stress resistance. J. Insect Physiol. 2001, 47, 1301–1307. [Google Scholar] [CrossRef] [PubMed]
- Koto, A.; Mersch, D.; Hollis, B.; Keller, L. Social isolation causes mortality by disrupting energy homeostasis in ants. Behav. Ecol. Sociobiol. 2015, 69, 583–591. [Google Scholar] [CrossRef] [Green Version]
- Wang, Z.Y.; McKenzie-Smith, G.C.; Liu, W.; Cho, H.J.; Pereira, T.; Dhanerawala, Z.; Shaevitz, J.W.; Kocher, S.D. Isolation disrupts social interactions and destabilizes brain development in bumblebees. Curr. Biol. 2022, 32, 2754–2764. [Google Scholar] [CrossRef]
- Winston, M.L. The Biology of the Honey Bee; Harvard University Press: Cambridge, MA, USA, 1987. [Google Scholar]
- Dyer, F. The biology of the dance language. Annu. Rev. Entomol. 2002, 47, 917–949. [Google Scholar] [CrossRef] [PubMed]
- Lattorff, H.M.G. Increased stress levels in caged honeybee (Apis mellifera) (Hymenoptera: Apidae) workers. Stresses 2022, 2, 373–384. [Google Scholar] [CrossRef]
- Bosua, H.J.; Nicolson, S.W.; Archer, C.R.; Pirk, C.W.W. Effects of cage volume and bee density on survival and nutrient intake of honeybees (Apis mellifera L.) under laboratory conditions. Apidologie 2018, 49, 734–746. [Google Scholar] [CrossRef] [Green Version]
- Rinderer, T.E.; Baxter, J.R. Honey Bees: The Effect of Group Size on Longevity and Hoarding in Laboratory Cages. Ann. Entomol. Soc. Am. 1978, 71, 732. [Google Scholar] [CrossRef]
- Lattorff, H.M.G.; Moritz, R.F.A. Genetic underpinnings of division of labor in the honeybee. Trends Genet. 2013, 29, 641–648. [Google Scholar] [CrossRef] [Green Version]
- Blatt, J.; Roces, F. Haemolymph sugar levels in foraging honeybees (Apis mellifera carnica): Dependence on metabolic rate and in vivo measurement of maximal rates of trehalose synthesis. J. Exp. Biol. 2001, 204, 2709–2716. [Google Scholar] [CrossRef]
- Bartlett, L.J.; Rozins, C.; Brosi, B.J.; Delaplane, K.S.; de Roode, J.C.; White, A.; Wilfert, L.; Boots, M. Industrial bees: The impact of apicultural intensification on local disease prevalence. J. Appl. Ecol. 2019, 56, 2195–2205. [Google Scholar] [CrossRef] [Green Version]
- Mayack, C.; Naug, D. Energetic stress in the honeybee Apis mellifera from Nosema ceranae infection. J. Invertebr. Pathol. 2009, 100, 185–188. [Google Scholar] [CrossRef]
- Mayack, C.; Naug, D. Parasitic infection leads to decline in hemolymph sugar levels in honeybee foragers. J. Insect Physiol. 2010, 56, 1572–1575. [Google Scholar] [CrossRef] [PubMed]
- Huang, Q.; Kryger, P.; Le Conte, Y.; Lattorff, H.M.G.; Kraus, F.B.; Moritz, R.F.A. Four quantitative trait loci associated with low Nosema ceranae (Microsporidia) spore load in the honeybee Apis mellifera. Apidologie 2014, 45, 248–256. [Google Scholar] [CrossRef] [Green Version]
- Kurze, C.; Le Conte, Y.; Dussaubat, C.; Erler, S.; Kryger, P.; Lewkowski, O.; Müller, T.; Widder, M.; Moritz, R.F.A. Nosema Tolerant Honeybees (Apis mellifera) Escape Parasitic Manipulation of Apoptosis. PLoS ONE 2015, 10, e0140174. [Google Scholar] [CrossRef]
- Kurze, C.; Mayack, C.; Hirche, F.; Stangl, G.I.; Le Conte, Y.; Kryger, P.; Moritz, R.F.A. Nosema spp. infections cause no energetic stress in tolerant honeybees. Parasitol. Res. 2016, 115, 2381–2388. [Google Scholar] [CrossRef] [Green Version]
- Ruiz-González, M.X.; Moret, Y.; Brown, M.J.F. Rapid induction of immune density-dependent prophylaxis in adult social insects. Biol. Lett. 2009, 5, 781–783. [Google Scholar] [CrossRef] [PubMed]
- Richter, J.; Helbing, S.; Erler, S.; Lattorff, H.M.G. Social context dependent immune gene expression in bumblebees (Bombus terrestris). Behav. Ecol. Sociobiol. 2012, 66, 791–796. [Google Scholar] [CrossRef]
- Lattorff, H.M.G. Tissue specificity in social context-dependent lysozyme expression in bumblebees. Antibiotics 2020, 9, 130. [Google Scholar] [CrossRef] [PubMed] [Green Version]
- Rehan, S.M.; Toth, A.L. Climbing the social ladder: The molecular evolution of sociality. Trends Ecol. Evol. 2015, 30, 426–433. [Google Scholar] [CrossRef]
- Stow, A.; Briscoe, D.; Gillings, M.; Holley, M.; Smith, S.; Leys, R.; Silberbauer, T.; Turnbull, C.; Beattie, A. Antimicrobial defences increase with sociality in bees. Biol. Lett. 2007, 3, 422–424. [Google Scholar] [CrossRef] [PubMed] [Green Version]
- Turnbull, C.; Hoggard, S.; Gillings, M.; Palmer, C.; Stow, A.; Beattie, D.; Briscoe, D.; Smith, S.; Wilson, P.; Beattie, A. Antimicrobial strength increases with group size: Implications for social evolution. Biol. Lett. 2011, 7, 249–252. [Google Scholar] [CrossRef] [PubMed] [Green Version]
- Hartfelder, K.; Bitondi, M.M.G.; Brent, C.S.; Guidugli-Lazzarini, K.R.; Simões, Z.L.P.; Stabentheiner, A.; Tanaka, E.D.; Wang, Y. Standard methods for physiology and biochemistry research in Apis mellifera. J. Apic. Res. 2013, 52, 1–48. [Google Scholar] [CrossRef] [Green Version]
- Chomczynski, P.; Sacchi, N. Single-step method of RNA isolation by acid guanidinium thiocyanate-phenol-chloroform extraction. Anal. Biochem. 1987, 162, 156–159. [Google Scholar] [CrossRef] [PubMed]
- Lourenço, A.P.; Mackert, A.; Cristino, A.S.; Simões, Z.L.P. Validation of reference genes for gene expression studies in the honey bee, Apis mellifera, by quantitative real-time RT-PCR. Apidologie 2008, 39, 372–385. [Google Scholar] [CrossRef] [Green Version]
- Andersen, C.L.; Ledet-Jensen, J.; Ørntoft, T. Normalization of real-time quantitative RT-PCR data: A model based variance estimation approach to identify genes suited for normalization—Applied to bladder- and colon-cancer data-sets. Cancer Res. 2004, 64, 5245–5250. [Google Scholar] [CrossRef] [PubMed] [Green Version]
- Pfaffl, M.W. A new mathematical model for relative quantification in real-time RT-PCR. Nucleic Acids Res. 2001, 29, e45. [Google Scholar] [CrossRef] [PubMed]
- Erler, S.; Popp, M.; Lattorff, H.M.G. Dynamics of Immune System Gene Expression upon Bacterial Challenge and Wounding in a Social Insect (Bombus terrestris). PLoS ONE 2011, 6, e18126. [Google Scholar] [CrossRef] [PubMed]
- Ramakers, C.; Ruijter, J.M.; Deprez, R.H.L.; Moorman, A.F.M. Assumption-free analysis of quantitative real-time polymerase chain reaction (PCR) data. Neurosci. Lett. 2003, 339, 62–66. [Google Scholar] [CrossRef] [PubMed]
- R Development Core Team R. A Language and Environment for Statistical Computing; R Foundation for Statistical Computing: Vienna, Austria, 2008. [Google Scholar]
Figure 1.
Glucose/trehalose ratio dependent on group size. (A) means of all samples, (B) means of the cages, and (C) the standard deviation of the cages (within-cage variance). * p < 0.05; *** p < 0.001; n.s.—non-significant.
Figure 1.
Glucose/trehalose ratio dependent on group size. (A) means of all samples, (B) means of the cages, and (C) the standard deviation of the cages (within-cage variance). * p < 0.05; *** p < 0.001; n.s.—non-significant.

Figure 2.
Relative gene expression levels of hsp70AB dependent on group size. (A) means of all samples, (B) means of the cages, and (C) the standard deviation of the cages (within-cage variance). n.s.—non-significant.
Figure 2.
Relative gene expression levels of hsp70AB dependent on group size. (A) means of all samples, (B) means of the cages, and (C) the standard deviation of the cages (within-cage variance). n.s.—non-significant.

Disclaimer/Publisher’s Note: The statements, opinions and data contained in all publications are solely those of the individual author(s) and contributor(s) and not of MDPI and/or the editor(s). MDPI and/or the editor(s) disclaim responsibility for any injury to people or property resulting from any ideas, methods, instructions or products referred to in the content. |
© 2023 by the author. Licensee MDPI, Basel, Switzerland. This article is an open access article distributed under the terms and conditions of the Creative Commons Attribution (CC BY) license (https://creativecommons.org/licenses/by/4.0/).
Share and Cite
MDPI and ACS Style
Lattorff, H.M.G. Group Size Buffers against Energetic Stress in Honeybee Workers (Apis mellifera). Stresses 2023, 3, 397-403. https://doi.org/10.3390/stresses3020029
AMA Style
Lattorff HMG. Group Size Buffers against Energetic Stress in Honeybee Workers (Apis mellifera). Stresses. 2023; 3(2):397-403. https://doi.org/10.3390/stresses3020029
Chicago/Turabian StyleLattorff, H. Michael G. 2023. "Group Size Buffers against Energetic Stress in Honeybee Workers (Apis mellifera)" Stresses 3, no. 2: 397-403. https://doi.org/10.3390/stresses3020029