Article

Dynamic Metabolic Changes in Arabidopsis Seedlings under Hypoxia Stress and Subsequent Reoxygenation Recovery

Department of Energy Plant Research Laboratory, Michigan State University, East Lansing, MI 48824, USA
*
Authors to whom correspondence should be addressed.
Stresses 2023, 3(1), 86-101; https://doi.org/10.3390/stresses3010008
Submission received: 26 November 2022 / Revised: 23 December 2022 / Accepted: 27 December 2022 / Published: 2 January 2023
(This article belongs to the Special Issue Stress Markers in Plants: Importance of Selection and Investigation)

Abstract

:
Hypoxic stress, caused by the low cellular oxygen in the events of flooding or waterlogging, limits crop productivity in many regions of the world. Hypoxic stress in plants is often dynamic and followed by a reoxygenation process that returns the oxygen level to normal. Although metabolic responses to hypoxia have been studied in many plants, less is known about the recovery processes following stress removal. To better understand the dynamic metabolic shift from a low-oxygen environment to a reoxygenated environment, we performed time-course measurements of metabolites in Arabidopsis seedlings at 0, 6, 12, and 24 h of reoxygenation recovery after 24 h of hypoxia stress (100% N2 environment). Among the 80 metabolic features characterized using GC-MS, 60% of them were significantly changed under hypoxia. The reoxygenation phase was accompanied by progressively fewer metabolic changes. Only 26% significantly changed metabolic features by the 24 h reoxygenation. Hypoxia-induced metabolic changes returned to normal levels at different speeds. For example, hypoxia-induced accumulation of lactate decreased to a basal level after 6 h of reoxygenation, whereas hypoxia-induced accumulation of alanine and GABA showed partial recovery after 24 h of reoxygenation. Some metabolites, such as gluconate, xylose, guanine, and adenosine, constantly increased during hypoxia reoxygenation. These dynamic metabolic changes demonstrate the flexibility and complexity of plant metabolism during hypoxia stress and subsequent reoxygenation recovery.

1. Introduction

Flooding causes oxygen depletion and affects plants in many aspects, such as growth and development [1,2,3], meiosis [4], cell damage [5,6], respiration [5], seed germination [7,8], flowering [9], and photomorphogenesis [10], and eventually causes crop losses [11,12,13]. There has been a steady increase in the number of flood events on continents since 1950, as reported by the GRID-Arendal (http://www.grida.no/resources/6062, accessed on 30 December 2022), presenting challenges to crop production.
The hypoxia reoxygenation process has been better studied in animals than in plants [14,15]. Plants have very different responses to hypoxia and subsequent reoxygenation compared to animals and have developed strategies to allow survival during this process [16,17]. Hypoxia causes plant morphological abnormalities associated with a severe impairment in gas exchange [18]. In general, plants adopt two alternative strategies to react to hypoxic stress that have differences in phytohormone signaling and nitrogen source utilization [2,19]. Wetland plants are able to withstand hypoxic conditions more than terrestrial plants via escape strategies, which encourage the growth of specific organs to reach normoxic status, and quiescence strategies, which slow growth and conserve metabolic resources [2,20]. Conversely, terrestrial plants are unable to endure prolonged oxygen deficiency and severe anaerobic conditions but can endure short-term hypoxia stress through escape mechanisms, such as the development of adventitious roots, stem hypertrophy, and ethylene-mediated aerenchyma formation [21,22,23].
Hypoxia stress can trigger many plant responses at transcriptomic, proteomic, metabolomic, and enzyme activity levels [24]. Plant cells sense oxygen levels that largely depend on the stability of transcription factors belonging to group VII of the ethylene response factor family (ERFVIIs) [25,26,27,28,29,30]. Hypoxia-responsive miRNAs, trans-acting siRNAs, natural antisense siRNA (natsiRNA), and long non-coding RNAs (lncRNAs) were reported to play key regulatory roles in responses to hypoxia [13,31,32]. Transcriptome, DNA methylation, and metabolic changes have been reported in rice during hypoxia and the ensuing reoxygenation [33,34]. Analysis of the selective mRNA translation in anoxia-intolerant Arabidopsis seedlings that were hypoxic and then re-oxygenated shows that transcripts encoding proteins involved in cell wall formation, transcription, signaling, cell division, hormone metabolism, and lipid metabolism are translationally repressed under hypoxia but released after 1 h of reoxygenation [35]. Many hypoxia-induced genes do not significantly decrease after reoxygenation, which suggests that some hypoxia-induced transcripts are crucial for reoxygenation [35]. Conversely, the discovery of a group of Arabidopsis genes that are activated during hypoxia but only associate with ribosomes during reoxygenation [35] raises the possibility that postponing polysome dissociation during hypoxia may have evolutionary advantages [24].
Carbon and nitrogen metabolism are affected by hypoxia and reoxygenation, as oxygen availability greatly influences metabolism [36]. Ethanol fermentation is one of the primary metabolic adaptations that higher plants use to ensure energy production in hypoxic environments [37,38]. Alanine accumulates in both the roots and shoots of wheat under hypoxia, whereas gamma-aminobutyrate (GABA) and lactate accumulate in roots only [39]. During reoxygenation after hypoxia, the alanine aminotransferase/glutamate dehydrogenase cycle may reversibly produce pyruvate and NADH that can be directed to the tricarboxylic acid (TCA) cycle, which is fully functional under normoxic conditions. Regarding this carbon-nitrogen interaction, Arabidopsis grows more efficiently when fed nitrates in hypoxic conditions [40]. Under hypoxia, the mitochondrial electron transport chain reduces nitrite to NO, which is crucial for maintaining mitochondrial function, ATP production, and the electrochemical gradient [41,42]. Hypoxia can also significantly reduce nitrogen uptake, nitrogen content, and root biomass in poplar trees [43]. On the other hand, hypoxia upregulates the enzymes involved in nitrogen assimilation in tomato plants [44]. It has been suggested that foliar nitrate assimilation can improve the tolerance of roots to low-oxygen conditions by altering the transport of nitrogen-containing molecules from roots to shoots [45].
Although intensive work has focused on plant responses to hypoxia stress in the last 30 years, the physiological and biochemical events that occur during reoxygenation recovery are much less well understood. The recovery process involves reoxygenation and a darkness-to-light transition that results in light-induced photoinhibition, followed by the production of reactive oxygen species (ROS) and cellular damage [6,46]. Plant responses to reoxygenation appear to be coordinated through changes induced by light and oxygen by the regulation of hormones such as ethylene, ABA, and JA and ROS, which together control root and shoot processes such as water balance and transport, stomatal closure, chlorophyll degradation, and leaf senescence [19].
Metabolomics is an emerging field that helps researchers better understand an organism’s physiological and biochemical state and response to stress in the post-genomic era [47]. The comprehensive, quantitative, and qualitative analysis of metabolites, as the final products of cellular regulatory processes, offers a more accurate representation of the phenotype than genes and proteins, whose functions are influenced by post-translational modifications and epigenetic regulation [48,49,50]. Therefore, utilizing metabolomics to study how plants react to abiotic stresses is becoming increasingly common [51]. As plant central metabolites are mostly polar, a non-targeted approach was used to profile polar fractions of the extracts from plant seedlings exposed to hypoxia/reoxygenation environments. Time-course measurements of metabolites were used to reveal the dynamic metabolic changes during the post-hypoxia reoxygenation process.

2. Results

A time-course experiment was performed to understand how plant metabolism recovers following hypoxic stress (Figure 1). Untargeted metabolic profiling was conducted using GC-MS. Eighty metabolic features were quantified with 50 chemically identified and 30 corresponding to unknowns. An unsupervised multivariate statistical approach was used to obtain an overview of temporal changes of the metabolic changes in response to hypoxia and the following reoxygenation. Specifically, principal component analysis (PCA) was applied to compare hypoxia/reoxygenation-treated and ambient control samples at different time points. The first two principal components explained over 67% of the total variance among all samples (Figure 2A). The first component (PC1), accounting for 54.87% of the total variance, clearly separated the hypoxia/reoxygenation-treated samples from the ambient control samples. The second principal component (PC2) explained 12.67% of the total variance corresponding with the different time points following the stress removal. To identify the most influencing metabolite contributing to explaining the variance, the metabolic loadings in PC1 and PC2 are shown in Figure 2B. Metabolites with large loadings on PC1, such as GABA, inositol, glucose, and adenine, showed a positive contribution to the hypoxia/reoxygenation group. Metabolites with negative loadings on PC2, such as lactate, putrescine, and malonate, showed a positive contribution to the 0 h reoxygenation group.
Univariate statistical analyses were performed to identify metabolic features that are significantly different from the control and hypoxia/reoxygenation-treated samples at each time point. The numbers of significantly increased or decreased metabolites at each time point were summarized in Figure 3. The 24 h hypoxia induced a decrease in 30 metabolic features and an increase in 19 metabolic features (Figure 3). With the progression of oxygenation, the number of significantly changed metabolic features decreased (Figure 3). In the late oxygenation recovery phase, only 10 and 11 metabolic features were significantly decreased and increased, respectively (Figure 3). Volcano plots (Figure 4) showed metabolic changes in all metabolic features throughout the entire time course (Supplemental Dataset S1).
Among the chemically identified metabolites, there were several distinct temporal patterns in response to hypoxia followed by reoxygenation. Several metabolites drastically increased during hypoxia treatment but decreased during reoxygenation. Specifically, lactate showed a 44-fold increase in response to hypoxia and quickly decreased to a basal level at the 6 h reoxygenation (Figure 5A). Unlike lactate, several other hypoxia-induced metabolites, such as alanine, GABA, and glucose, did not decrease to their basal levels by the end of the 24 h reoxygenation, exhibiting partial recovery (Figure 5A). In contrast, another group of metabolites decreased during hypoxia but increased during reoxygenation. For example, the hypoxia-induced decreases in aspartate (75%), glutamine (50%), leucine (44%), and threonine (43%) were returned to the control level by the end of the 24 h reoxygenation (Figure 5B). However, the decreases in other metabolites, such as citrate and valine, were recovered much slower and to a lesser extent (Figure 5B).
For some metabolites, hypoxia-induced changes were maintained during the reoxygenation phase. Proline (2–4 fold), fructose (4–13 fold), glycine (2-fold), inositol (4–12 fold), and malonate (8–17 fold) were kept up-regulated in the hypoxia/reoxygenation-treated plants throughout the time-course (Figure 6A). In contrast, asparagine (2–3%), ornithine (5–7%), cysteine (44–60%), serine (11–19%), methionine (14–26%), and sinapinate (20–34%) were kept down-regulated under hypoxia/reoxygenation throughout the time-course (Figure 6B). Interestingly, gluconate, xylose, guanine, and adenosine constantly increased through the 24 h reoxygenation process (Figure 7).

3. Discussion

3.1. Ethanol and Lactate Fermentation

Hypoxia stress inhibits oxidative phosphorylation of mitochondrial respiration, causing a deficiency in ATP production [52]. To cope with the energy deficiency, pyruvate is channeled through several fermentation pathways to regenerate NAD+, maintaining fluxes through glycolysis to continue making more ATP. Pyruvate can be decarboxylated to acetaldehyde by pyruvate decarboxylase (PDC) and then reduced to ethanol by pyruvate decarboxylase (PDC) [53]. In this study, the increased expression of ADH was observed throughout the hypoxia/reoxygenation period (Figure 2), suggesting ethanol fermentation was active. Ethanol can be oxidized to acetaldehyde and acetate via ADH and aldehyde dehydrogenase. The ability of plants to recycle the carbon that would be lost as ethanol to acetate, and subsequent acetyl-CoA is thought to be important for post-hypoxic recovery [54,55]. Although acetate and acetyl-CoA were not analyzed in this study, the acetyl-CoA-derived metabolites, such as leucine and valine, decreased under hypoxia and increased under reoxygenation (Figure 5B).
Alternatively, pyruvate can be reduced to lactate via lactate dehydrogenase. We observed a drastic increase in lactate after hypoxia (Figure 5A), which is consistent with other studies in Arabidopsis [39]. The accumulation of lactate may lead to cellular acidification, impairing enzyme activities and cellular functions [56]. The elevation of lactate rapidly returned to a normal level at 6 h reoxygenation (Figure 5A), which has been observed in previous work [57]. This rapid recovery may help avoid the inhibitory effect of lactate accumulated under hypoxia.

3.2. Nitrogen Metabolism

An alternative metabolic fate of pyruvate is alanine via alanine aminotransferase (AlaAT), a transaminase that reversibly converts pyruvate and glutamate into alanine and 2-oxoglutarate. This reversible reaction facilitates the accumulation of alanine under hypoxia and breakdown of alanine under reoxygenation [58]. The increased alanine induced by hypoxia was not fully recovered (Figure 5A). The relatively high levels of alanine during reoxygenation would require the supply of glutamate as the substrate for AlaAT. The demand for glutamate could explain its low level throughout the hypoxia/reoxygenation (Figure 5B). Regeneration of glutamate is likely supported by reductive amination of 2-oxoglutarate via the NADH-dependent glutamate synthase (NADH-GOGAT) [59]. Glutamine was decreased by hypoxia but gradually increased by reoxygenation (Figure 5B). It is possible that the ATP-consuming enzyme glutamine synthetase was inhibited under hypoxia to mitigate energy deficiency but reactivated when energy was not limited during reoxygenation. This supports that matching energy production with metabolic demands is necessary for plants to perform photosynthesis efficiently [60].
Similarly to alanine, the hypoxia-induced GABA accumulation did not fully return to a normal level under reoxygenation (Figure 5A). GABA typically accumulates in response to various abiotic stresses, including hypoxia [51,61]. Hypoxia-induced elevation in the GABA level was found to be important for restoring membrane potential by pH-dependent regulation of H+-ATPase and/or by generating more energy via the fluxes through the GABA shunt pathway and TCA cycle [62].
Proline was found to maintain a high level under hypoxia/reoxygenation (Figure 6A), which agrees with previous findings. Anaerobic-germinated rice embryos have much greater proline abundance than aerobic-germinated rice embryos [33]. Prior to the breakdown and degradation of amino acids in storage proteins, proline synthesis takes place under anaerobic conditions as a major byproduct of seed nitrate assimilation [63,64]. Therefore, proline accumulation may be affected by ornithine-arginine-citrate metabolism under anoxia [35]. In this study, ornithine was maintained at a low level throughout the hypoxic reoxygenation period (Figure 6B). A previous study in rice found an anaerobic, enhanced basic amino acid carrier with the regulation of arginine and ornithine in anaerobic rice tissues [65].

3.3. Mitochondrial Metabolism

The TCA cycle intermediates, such as citrate and fumarate, were maintained at low levels under hypoxia and reoxygenation (Figure 5B, Supplemental Dataset S1). Previous studies reported significant changes in mRNA, protein, and enzyme activity levels of metabolites in TCA-cycle intermediates under hypoxia [66,67,68] can lead to accelerated oxidation during reoxygenation [54]. Transcripts encoding TCA cycle enzymes were reported to be down-regulated in response to oxygen depletion in poplar, rice, and Arabidopsis [68,69]. Both the transcript and protein levels of pyruvate dehydrogenase and malate dehydrogenase were reported to be downregulated in coleoptiles of rice seedlings under low oxygen [33,67,70,71,72]. Malate dehydrogenase activity was dramatically decreased in Lotus japonicus under waterlogging conditions [73]. The protein level of malate dehydrogenase was significantly decreased in rice coleoptiles under low oxygen [72]. The ccitrate level was slowly increased during 24 h reoxygenation, which is consistent with previous findings that genes encoding TCA cycle enzymes were activated under reoxygenation with increased levels of citrate and 2-oxoglutarate, suggesting a quick response to restore the aerobic TCA cycle [33].
Succinate showed a reverse trend, showing a relatively high level under hypoxia and reoxygenation (Supplemental Dataset S1). This is consistent with previous studies, as the well-known response to hypoxia in rice is the accumulation of succinate [33,72,74]. Succinate is a substrate for complex II in the mitochondrial electron transport chain [66]. Although low succinate dehydrogenase activity is still present in anoxic rice shoots, succinate may accumulate upon the electron saturation of ubiquinone pool because there is no terminal electron acceptor, O2 [73]. The well-recognized alanine accumulation under oxygen depletion [68] can also lead to the co-production of 2-oxoglutarate, which can be converted to succinyl-CoA and further metabolized to generate succinate and ATP [73]. Although the precise pathway(s) causing hypoxia succinate accumulation is yet unknown, it has been proposed that the increased activity of fumarate reductase and GABA shunt under hypoxia may be responsible [24,75]. The GABA shunt starts with the synthesis of GABA from glutamate, followed by the synthesis of succinic semialdehyde, and eventually, succinate [76]. Therefore, hypoxic succinate accumulation may be caused by increased activity of the GABA shunt.
The accumulation of malonate under hypoxia/reoxygenation (Figure 6A) was less commonly seen in previous studies. One possible metabolic source for malonate is malondialdehyde, which can be formed during lipid peroxidation [77]. Reoxygenation has been shown to strongly induce oxidative stress and antioxidant systems in lupin roots treated with hypoxia, and this is accompanied by the buildup of lipid peroxides [78]. Malonate is the precursor for malonyl-CoA synthetase; the resulting malonyl-CoA is important for mitochondrial fatty-acid biosynthesis [77]. The accumulation of malonate under hypoxia/reoxygenation may indicate a limitation in mitochondrial fatty acids, which would further limit lipoic acid biosynthesis, affecting the function of mitochondrial enzymes such as glycine decarboxylase [79]. Indeed, we observed a significant increase in glycine and a decrease in serine under hypoxia/reoxygenation (Figure 6).

3.4. Sugar Metabolism

Xylose was found to keep accumulating under reoxygenation (Figure 7). Fructose maintained a high level under hypoxia/reoxygenation (Figure 6A). These results are consistent with previous findings. Sugars, including fructose, glucose, arabinose, and trehalose, were observed to accumulate under reoxygenation after hypoxia, suggesting that carbohydrate pools will be restored once the anoxic energy crisis has been resolved [33]. Group-VII ethylene-responsive factors have been implicated in regulating sugar metabolism, fermentation, and/or growth in plants under low-oxygen conditions over the past decade [27,80,81,82]. Additionally, detached rice coleoptiles, which no longer receive sugar from the endosperm, are more vulnerable to hypoxia [83]. When glucose was provided externally, this effect was eliminated, indicating that mitochondria are sensitive to hypoxia in the glucose-dependent way [83]. Sucrose catabolism was reported to be required for the sucrose–ethanol metabolic transition under hypoxia [84]. The preferential pathway for sucrose metabolism under hypoxia is not the sucrose synthase pathway, but starch metabolism, which is necessary for plants to survive submersion and ensure the quick induction of genes encoding enzymes necessary for anaerobic metabolism [85,86].

3.5. Energy and Purine Metabolism

Interestingly, guanine and adenosine constantly increased through the time course of reoxygenation, which has been less frequently observed in earlier research. As adenosine is the precursor for ATP, the constant increase in adenosine may be related to increased energy demand during reoxygenation, where ATP is metabolized for energy production. The constant increase in guanine and adenosine may also be related to purine metabolism under hypoxia/reoxygenation. A previous study on rat astrocytes found hypoxia/hypoglycemia treatment led to increased levels of adenine-based purines, guanine-based purines, guanosine, and adenosine [87].

4. Materials and Methods

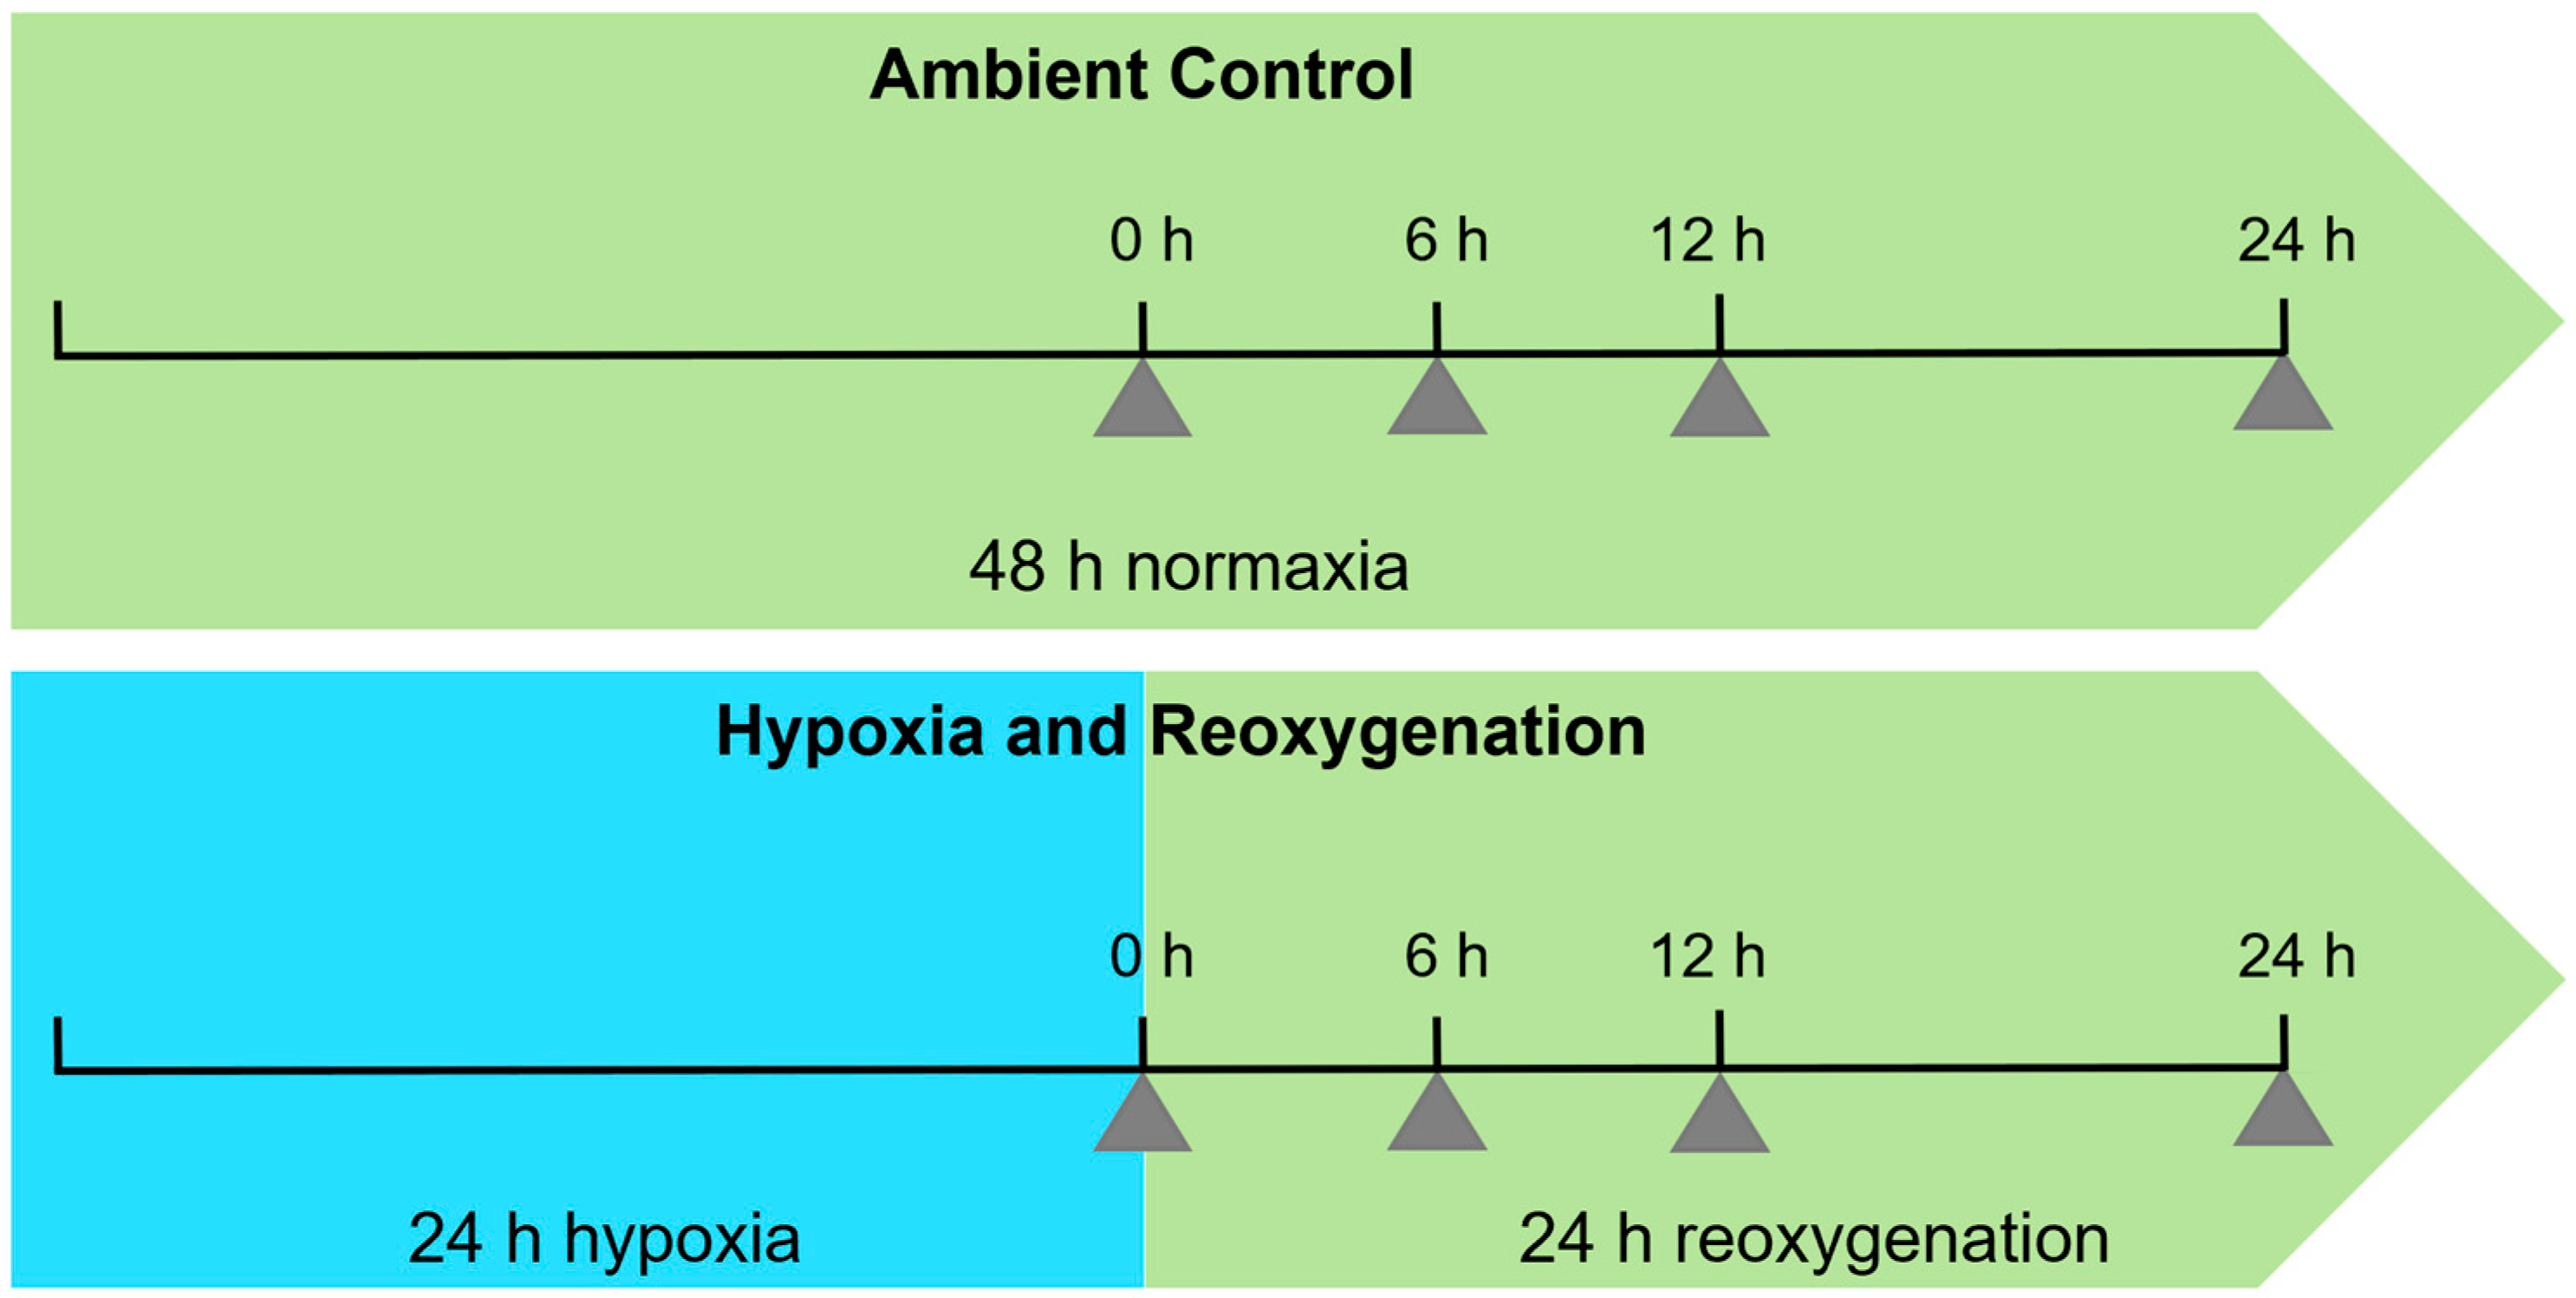
4.1. Plant Material and Growth Conditions

Arabidopsis thaliana wild-type (ecotype Col-0) seeds were sterilized and germinated in half-strength Murashige and Skoog agar media under constant light at 23 °C for 16 days. The seedlings on agar plates were transferred into a chamber for hypoxic treatment. For the hypoxic treatment, a 40 L chamber was filled with oxygen-depleted air (100% N2 gas) to replace the air in the chamber. For re-oxygenation treatment, the chamber was opened to replace the nitrogen atmosphere with air. The processes of hypoxia and reoxygenation were carried out in the dark to avoid oxygen generation during photosynthesis. Plates with seedlings were arranged in a randomized block design. A group of control plants was placed in another chamber exposed to ambient air under the same regimes of light and humidity. After 24 h of hypoxic stress in the darkness, hypoxia-treated seedlings were exposed to oxygen by opening the lid of the hypoxic chamber to replace the nitrogen atmosphere with air. To capture both early and late metabolic changes throughout the recovery phase, we harvested 50 whole seedlings at four time points, 0, 6, 12, and 24 h, upon reoxygenation. For each time point, 50 seedlings from an aerated (control) chamber that were not perturbed by the hypoxia stress were harvested at the same points of time as controls (Figure 1).

4.2. Metabolite Extraction, Derivatization, and GC-MS Analysis

Seedlings were quenched in liquid nitrogen at harvest, and ~100 mg of the frozen tissue for each replicate was homogenized. Polar metabolites were extracted and trimethylsilyl derivatized as described previously [88]. Briefly, 0.35 mL of hot methanol (60 °C) was added to the homogenized tissue and incubated at 60 °C for 10 min. After 10 min of sonication, 0.35 mL of chloroform and 0.3 mL of water were added, followed by 3 min of vortexing and 5 min of centrifugation at 13,000× g. The extracts were separated into two phases; 200 μL of the upper phase (polar fraction) was removed, dried, and derivatized with methoxyamine hydrochloride and N,O-Bis(trimethylsilyl)trifluoroacetamide (BSTFA) with 1% (w/v) trimethylchlorosilane. One microliter of trimethylsilyl-derivatized samples was separated on an Agilent 6890 series gas chromatograph equipped with a 60-m DB-5 MS column (0.25 mm × 0.25 μm) and analyzed in scanning and positive electron ionization mode using an Agilent 5973 series quadrupole mass spectrometer (Agilent Technologies, Santa Clara, USA). Metabolites were identified as described previously [88]. Peak areas of the analytes were normalized to the peak area of the internal standard (ribitol) and sample dry weight.

4.3. Statistical Analyses

Statistical analyses were performed using R (Version 4.0, R Development Core Team 2008, http://www.R-project.org, accessed on 30 December 2022). The means of three biological replicates were used to determine the fold changes between the treated and control samples. Student’s t-test was performed to identify significantly changed metabolites between the treated and control samples at each time point. The p-values were adjusted by Benjamini–Hochberg correction to control the false discovery rate at 0.05. Volcano plots were obtained by plotting the log2 (fold change) against the −log10 (adjusted p-value) of the metabolites. Data visualization was conducted using the ggplot2 package.

5. Conclusions

In summary, we found the typical hypoxia-induced metabolic increases (lactate, alanine, GABA, and glucose) and decreases (aspartate, glutamine, leucine, threonine, citrate, and valine) returned to normal levels at different speeds during the reoxygenation recovery, suggesting the distinct roles of these metabolites in orchestrating carbon and nitrogen metabolism during the reoxygenation recovery. Future work on understanding how these metabolic changes are regulated at enzymatic, transcriptional, and posttranslational levels would help devise strategies to engineer plants to cope with hypoxia/reoxygenation. Moreover, metabolites such as gluconate, xylose, guanine, and adenosine constantly increased during reoxygenation, highlighting the important roles of sugar, energy, and purine metabolism in post-hypoxia recovery. These reoxygenation-responsive metabolites can serve as biomarkers to compare genotypes with different recovery capabilities. The distinct patterns of metabolic changes reveal the complexity and flexibility of plant metabolism during hypoxia stress and subsequent reoxygenation recovery.

Supplementary Materials

The following supporting information can be downloaded at: https://www.mdpi.com/article/10.3390/stresses3010008/s1. Dataset S1: Fold change and statistics of metabolites.

Author Contributions

Research and investigation, X.F.; analysis and writing, Y.X. and X.F. All authors have read and agreed to the published version of the manuscript.

Funding

This research received no external funding.

Data Availability Statement

The data presented in this study are available in Supplementary Materials.

Acknowledgments

We thank Basil Nikolau at Iowa State University for supporting this research.

Conflicts of Interest

The authors declare no conflict of interest.

References

  1. Fu, X.; Peng, S.; Yang, S.; Chen, Y.; Zhang, J.; Mo, W.; Zhu, J.; Ye, Y.; Huang, X. Effects of Flooding on Grafted Annona Plants of Different Scion/Rootstock Combinations. Agric. Sci. 2012, 3, 249–256. [Google Scholar] [CrossRef] [Green Version]
  2. Nakamura, M.; Noguchi, K. Tolerant Mechanisms to O2 Deficiency under Submergence Conditions in Plants. J. Plant Res. 2020, 133, 343–371. [Google Scholar] [CrossRef] [Green Version]
  3. Weits, D.A.; van Dongen, J.T.; Licausi, F. Molecular Oxygen as a Signaling Component in Plant Development. New Phytol. 2021, 229, 24–35. [Google Scholar] [CrossRef] [PubMed] [Green Version]
  4. Kelliher, T.; Walbot, V. Hypoxia Triggers Meiotic Fate Acquisition in Maize. Science 2012, 337, 345–348. [Google Scholar] [CrossRef] [Green Version]
  5. Deutsch, C.; Ferrel, A.; Seibel, B.; Pörtner, H.O.; Huey, R.B. Climate Change Tightens a Metabolic Constraint on Marine Habitats. Science 2015, 348, 1132–1135. [Google Scholar] [CrossRef] [PubMed] [Green Version]
  6. Yeung, E.; Bailey-Serres, J.; Sasidharan, R. After The Deluge: Plant Revival Post-Flooding. Trends Plant Sci. 2019, 24, 443–454. [Google Scholar] [CrossRef]
  7. Gibbs, D.J.; MdIsa, N.; Movahedi, M.; Lozano-Juste, J.; Mendiondo, G.M.; Berckhan, S.; Marín-delaRosa, N.; VicenteConde, J.; SousaCorreia, C.; Pearce, S.P.; et al. Nitric Oxide Sensing in Plants Is Mediated by Proteolytic Control of Group VII ERF Transcription Factors. Mol. Cell 2014, 53, 369–379. [Google Scholar] [CrossRef] [Green Version]
  8. Considine, M.J.; Diaz-Vivancos, P.; Kerchev, P.; Signorelli, S.; Agudelo-Romero, P.; Gibbs, D.J.; Foyer, C.H. Learning to Breathe: Developmental Phase Transitions in Oxygen Status. Trends Plant Sci. 2017, 22, 140–153. [Google Scholar] [CrossRef] [Green Version]
  9. Le Gac, A.L.; Laux, T. Hypoxia Is a Developmental Regulator in Plant Meristems. Mol. Plant 2019, 12, 1422–1424. [Google Scholar] [CrossRef]
  10. Abbas, M.; Berckhan, S.; Rooney, D.J.; Gibbs, D.J.; Vicente Conde, J.; Sousa Correia, C.; Bassel, G.W.; Marín-De La Rosa, N.; León, J.; Alabadí, D.; et al. Oxygen Sensing Coordinates Photomorphogenesis to Facilitate Seedling Survival. Curr. Biol. 2015, 25, 1483–1488. [Google Scholar] [CrossRef]
  11. Herzog, M.; Striker, G.G.; Colmer, T.D.; Pedersen, O. Mechanisms of Waterlogging Tolerance in Wheat—A Review of Root and Shoot Physiology. Plant Cell Environ. 2016, 39, 1068–1086. [Google Scholar] [CrossRef] [PubMed]
  12. Sjøgaard, K.S.; Valdemarsen, T.B.; Treusch, A.H. Responses of an Agricultural Soil Microbiome to Flooding with Seawater after Managed Coastal Realignment. Microorganisms 2018, 6, 12. [Google Scholar] [CrossRef] [PubMed] [Green Version]
  13. Yu, J.; Zhang, Y.; Zhong, J.; Ding, H.; Zheng, X.; Wang, Z.; Zhang, Y. Water-Level Alterations Modified Nitrogen Cycling across Sediment-Water Interface in the Three Gorges Reservoir. Environ. Sci. Pollut. Res. 2020, 27, 25886–25898. [Google Scholar] [CrossRef]
  14. Granger, D.N.; Kvietys, P.R. Reperfusion Injury and Reactive Oxygen Species: The Evolution of a Concept. Redox Biol. 2015, 6, 524–551. [Google Scholar] [CrossRef] [Green Version]
  15. Mallet, R.T.; Manukhina, E.B.; Ruelas, S.S.; Caffrey, J.L.; Downey, H.F. Cardioprotection by Intermittent Hypoxia Conditioning: Evidence, Mechanisms, and Therapeutic Potential. Am. J. Physiol.-Hear. Circ. Physiol. 2018, 315, H216–H232. [Google Scholar] [CrossRef] [Green Version]
  16. Tamang, B.G.; Fukao, T. Plant Adaptation to Multiple Stresses during Submergence and Following Desubmergence. Int. J. Mol. Sci. 2015, 16, 30164–30180. [Google Scholar] [CrossRef] [Green Version]
  17. Phukan, U.J.; Mishra, S.; Shukla, R.K. Waterlogging and Submergence Stress: Affects and Acclimation. Crit. Rev. Biotechnol. 2016, 36, 956–966. [Google Scholar] [CrossRef]
  18. Van Den Dries, N.; Gianní, S.; Czerednik, A.; Krens, F.A.; De Klerk, G.J.M. Flooding of the Apoplast Is a Key Factor in the Development of Hyperhydricity. J. Exp. Bot. 2013, 64, 5221–5230. [Google Scholar] [CrossRef]
  19. León, J.; Castillo, M.C.; Gayubas, B. The Hypoxia-Reoxygenation Stress in Plants. J. Exp. Bot. 2021, 72, 5841–5856. [Google Scholar] [CrossRef] [PubMed]
  20. Fukushima, A.; Kuroha, T.; Nagai, K.; Hattori, Y.; Kobayashi, M.; Nishizawa, T.; Kojima, M.; Utsumi, Y.; Oikawa, A.; Seki, M.; et al. Metabolite and Phytohormone Profiling Illustrates Metabolic Reprogramming as an Escape Strategy of Deepwater Rice during Partially Submerged Stress. Metabolites 2020, 10, 68. [Google Scholar] [CrossRef]
  21. Hwang, J.H.; Yu, S.I.; Lee, B.H.; Lee, D.H. Modulation of Energy Metabolism Is Important for Low-Oxygen Stress Adaptation in Brassicaceae Species. Int. J. Mol. Sci. 2020, 21, 1787. [Google Scholar] [CrossRef] [Green Version]
  22. Mignolli, F.; Todaro, J.S.; Vidoz, M.L. Internal Aeration and Respiration of Submerged Tomato Hypocotyls Are Enhanced by Ethylene-Mediated Aerenchyma Formation and Hypertrophy. Physiol. Plant. 2020, 169, 49–63. [Google Scholar] [CrossRef] [PubMed]
  23. Safavi-Rizi, V.; Herde, M.; Stöhr, C. RNA-Seq Reveals Novel Genes and Pathways Associated with Hypoxia Duration and Tolerance in Tomato Root. Sci. Rep. 2020, 10, 1692. [Google Scholar] [CrossRef] [PubMed] [Green Version]
  24. Shingaki-Wells, R.; Millar, A.H.; Whelan, J.; Narsai, R. What Happens to Plant Mitochondria under Low Oxygen? An Omics Review of the Responses to Low Oxygen and Reoxygenation. Plant Cell Environ. 2014, 37, 2260–2277. [Google Scholar] [CrossRef]
  25. Bui, L.T.; Giuntoli, B.; Kosmacz, M.; Parlanti, S.; Licausi, F. Constitutively Expressed ERF-VII Transcription Factors Redundantly Activate the Core Anaerobic Response in Arabidopsis Thaliana. Plant Sci. 2015, 236, 37–43. [Google Scholar] [CrossRef]
  26. Papdi, C.; Pérez-Salamõ, I.; Joseph, M.P.; Giuntoli, B.; Bögre, L.; Koncz, C.; Szabados, L. The Low Oxygen, Oxidative and Osmotic Stress Responses Synergistically Act through the Ethylene Response Factor VII Genes RAP2.12, RAP2.2 and RAP2.3. Plant J. 2015, 82, 772–784. [Google Scholar] [CrossRef] [Green Version]
  27. Licausi, F.; Van Dongen, J.T.; Giuntoli, B.; Novi, G.; Santaniello, A.; Geigenberger, P.; Perata, P. HRE1 and HRE2, Two Hypoxia-Inducible Ethylene Response Factors, Affect Anaerobic Responses in Arabidopsis Thaliana. Plant J. 2010, 62, 302–315. [Google Scholar] [CrossRef]
  28. Park, H.Y.; Seok, H.Y.; Woo, D.H.; Lee, S.Y.; Tarte, V.N.; Lee, E.H.; Lee, C.H.; Moon, Y.H. AtERF71/HRE2 Transcription Factor Mediates Osmotic Stress Response as Well as Hypoxia Response in Arabidopsis. Biochem. Biophys. Res. Commun. 2011, 414, 135–141. [Google Scholar] [CrossRef] [PubMed]
  29. Yang, C.Y.; Hsu, F.C.; Li, J.P.; Wang, N.N.; Shih, M.C. The AP2/ERF Transcription Factor AtERF73/HRE1 Modulates Ethylene Responses during Hypoxia in Arabidopsis. Plant Physiol. 2011, 156, 202–212. [Google Scholar] [CrossRef] [PubMed] [Green Version]
  30. Giuntoli, B.; Shukla, V.; Maggiorelli, F.; Giorgi, F.M.; Lombardi, L.; Perata, P.; Licausi, F. Age-Dependent Regulation of ERF-VII Transcription Factor Activity in Arabidopsis Thaliana. Plant Cell Environ. 2017, 40, 2333–2346. [Google Scholar] [CrossRef]
  31. Song, Y.; Zhang, D. The Role of Long Noncoding Rnas in Plant Stress Tolerance. Methods Mol. Biol. 2017, 1631, 41–68. [Google Scholar] [PubMed]
  32. Moldovan, D.; Spriggs, A.; Yang, J.; Pogson, B.J.; Dennis, E.S.; Wilson, I.W. Hypoxia-Responsive MicroRNAs and Trans-Acting Small Interfering RNAs in Arabidopsis. J. Exp. Bot. 2010, 61, 165–177. [Google Scholar] [CrossRef] [PubMed] [Green Version]
  33. Narsai, R.; Howell, K.A.; Carroll, A.; Ivanova, A.; Millar, H.; Whelan, J. Defining Core Metabolic and Transcriptomic Responses to Oxygen Availability in Rice Embryos and Young Seedlings. Plant Physiol. 2009, 151, 306–322. [Google Scholar] [CrossRef] [PubMed] [Green Version]
  34. Narsai, R.; Secco, D.; Schultz, M.D.; Ecker, J.R.; Lister, R.; Whelan, J. Dynamic and Rapid Changes in the Transcriptome and Epigenome during Germination and in Developing Rice (Oryza Sativa) Coleoptiles under Anoxia and Re-Oxygenation. Plant J. 2017, 89, 805–824. [Google Scholar] [CrossRef] [PubMed] [Green Version]
  35. Branco-Price, C.; Kaiser, K.A.; Jang, C.J.H.; Larive, C.K.; Bailey-Serres, J. Selective MRNA Translation Coordinates Energetic and Metabolic Adjustments to Cellular Oxygen Deprivation and Reoxygenation in Arabidopsis Thaliana. Plant J. 2008, 56, 743–755. [Google Scholar] [CrossRef] [PubMed]
  36. Schmidt-Rohr, K. Oxygen Is the High-Energy Molecule Powering Complex Multicellular Life: Fundamental Corrections to Traditional Bioenergetics. ACS Omega 2020, 5, 2221–2233. [Google Scholar] [CrossRef]
  37. Bui, L.T.; Novi, G.; Lombardi, L.; Iannuzzi, C.; Rossi, J.; Santaniello, A.; Mensuali, A.; Corbineau, F.; Giuntoli, B.; Perata, P.; et al. Conservation of Ethanol Fermentation and Its Regulation in Land Plants. J. Exp. Bot. 2019, 70, 1815–1827. [Google Scholar] [CrossRef] [Green Version]
  38. Cho, H.Y.; Loreti, E.; Shih, M.C.; Perata, P. Energy and Sugar Signaling during Hypoxia. New Phytol. 2021, 229, 57–63. [Google Scholar] [CrossRef] [Green Version]
  39. Mustroph, A.; Barding, G.A.; Kaiser, K.A.; Larive, C.K.; Bailey-Serres, J. Characterization of Distinct Root and Shoot Responses to Low-Oxygen Stress in Arabidopsis with a Focus on Primary C- and N-Metabolism. Plant Cell Environ. 2014, 37, 2366–2380. [Google Scholar] [CrossRef]
  40. Wany, A.; Gupta, A.K.; Kumari, A.; Mishra, S.; Singh, N.; Pandey, S.; Vanvari, R.; Igamberdiev, A.U.; Fernie, A.R.; Gupta, K.J. Nitrate Nutrition Influences Multiple Factors in Order to Increase Energy Efficiency under Hypoxia in Arabidopsis. Ann. Bot. 2019, 123, 691–705. [Google Scholar] [CrossRef]
  41. Gupta, P.; De, B. Metabolomics Analysis of Rice Responses to Salinity Stress Revealed Elevation of Serotonin, and Gentisic Acid Levels in Leaves of Tolerant Varieties. Plant Signal. Behav. 2017, 12, e1335845. [Google Scholar] [CrossRef] [PubMed]
  42. Gupta, K.J.; Mur, L.A.J.; Wany, A.; Kumari, A.; Fernie, A.R.; Ratcliffe, R.G. The Role of Nitrite and Nitric Oxide under Low Oxygen Conditions in Plants. New Phytol. 2020, 225, 1143–1151. [Google Scholar] [CrossRef]
  43. Liu, B.; Rennenberg, H.; Kreuzwieser, J. Hypoxia Affects Nitrogen Uptake and Distribution in Young Poplar (Populus × Canescens) Trees. PLoS ONE 2015, 10, e0136579. [Google Scholar] [CrossRef] [PubMed] [Green Version]
  44. Horchani, F.; Aschi-Smiti, S. Prolonged Root Hypoxia Effects on Enzymes Involved in Nitrogen Assimilation Pathway in Tomato Plants. Plant Signal. Behav. 2010, 5, 1583–1589. [Google Scholar] [CrossRef] [PubMed]
  45. Oliveira, H.C.; Freschi, L.; Sodek, L. Nitrogen Metabolism and Translocation in Soybean Plants Subjected to Root Oxygen Deficiency. Plant Physiol. Biochem. 2013, 66, 141–149. [Google Scholar] [CrossRef] [PubMed]
  46. Mommer, L.; Visser, E.J.W. Underwater Photosynthesis in Flooded Terrestrial Plants: A Matter of Leaf Plasticity. Ann. Bot. 2005, 96, 581–589. [Google Scholar] [CrossRef] [PubMed]
  47. Dettmer, K.; Aronov, P.A.; Hammock, B.D. Mass Spectrometry-Based Metabolomics. Mass Spectrom. Rev. 2007, 26, 51–78. [Google Scholar] [CrossRef] [PubMed]
  48. Shulaev, V.; Cortes, D.; Miller, G.; Mittler, R. Metabolomics for Plant Stress Response. Physiol. Plant. 2008, 132, 199–208. [Google Scholar] [CrossRef]
  49. Xu, Y.; Fu, X.; Sharkey, T.D.; Shachar-Hill, Y.; Walker, B.J. The Metabolic Origins of Non-Photorespiratory CO2 Release during Photosynthesis: A Metabolic Flux Analysis. Plant Physiol. 2021, 186, 297–314. [Google Scholar] [CrossRef]
  50. Xu, Y.; Wieloch, T.; Kaste, J.A.M.; Shachar-Hill, Y.; Sharkey, T.D. Reimport of Carbon from Cytosolic and Vacuolar Sugar Pools into the Calvin-Benson Cycle Explains Photosynthesis Labeling Anomalies. Proc. Natl. Acad. Sci. USA 2022, 119, e2121531119. [Google Scholar] [CrossRef]
  51. Xu, Y.; Fu, X. Reprogramming of Plant Central Metabolism in Response to Abiotic Stresses: A Metabolomics View. Int. J. Mol. Sci. 2022, 23, 5716. [Google Scholar] [CrossRef] [PubMed]
  52. Bailey-Serres, J.; Fukao, T.; Gibbs, D.J.; Holdsworth, M.J.; Lee, S.C.; Licausi, F.; Perata, P.; Voesenek, L.A.C.J.; van Dongen, J.T. Making Sense of Low Oxygen Sensing. Trends Plant Sci. 2012, 17, 129–138. [Google Scholar] [CrossRef] [PubMed]
  53. Tadege, M.; Dupuis, I.; Kuhlemeier, C. Ethanolic Fermentation: New Functions for an Old Pathway. Trends Plant Sci. 1999, 4, 320–325. [Google Scholar] [CrossRef] [PubMed]
  54. Tsuji, H.; Meguro, N.; Suzuki, Y.; Tsutsumi, N.; Hirai, A.; Nakazono, M. Induction of Mitochondrial Aldehyde Dehydrogenase by Submergence Facilitates Oxidation of Acetaldehyde during Re-Aeration in Rice. FEBS Lett. 2003, 546, 369–373. [Google Scholar] [CrossRef] [Green Version]
  55. Fu, X.; Yang, H.; Pangestu, F.; Nikolau, B.J. Failure to Maintain Acetate Homeostasis by Acetate-Activating Enzymes Impacts Plant Development. Plant Physiol. 2020, 182, 1256–1271. [Google Scholar] [CrossRef] [Green Version]
  56. Davies, D.D.; Grego, S.; Kenworthy, P. The Control of the Production of Lactate and Ethanol by Higher Plants. Planta 1974, 118, 297–310. [Google Scholar] [CrossRef]
  57. Tsai, K.J.; Lin, C.Y.; Ting, C.Y.; Shih, M.C. Ethylene-Regulated Glutamate Dehydrogenase Fine-Tunes Metabolism during Anoxia-Reoxygenation. Plant Physiol. 2016, 172, 1548–1562. [Google Scholar] [CrossRef] [Green Version]
  58. Diab, H.; Limami, A.M. Reconfiguration of N Metabolism upon Hypoxia Stress and Recovery: Roles of Alanine Aminotransferase (AlaAt) and Glutamate Dehydrogenase (GDH). Plants 2016, 5, 25. [Google Scholar] [CrossRef] [Green Version]
  59. António, C.; Päpke, C.; Rocha, M.; Diab, H.; Limami, A.M.; Obata, T.; Fernie, A.R.; van Dongen, J.T. Regulation of Primary Metabolism in Response to Low Oxygen Availability as Revealed by Carbon and Nitrogen Isotope Redistribution1[OPEN]. Plant Physiol. 2016, 170, 43–56. [Google Scholar] [CrossRef]
  60. Walker, B.J.; Kramer, D.M.; Fisher, N.; Fu, X. Flexibility in the Energy Balancing Network of Photosynthesis Enables Safe Operation under Changing Environmental Conditions. Plants 2020, 9, 301. [Google Scholar] [CrossRef]
  61. Xu, Y.; Freund, D.M.; Hegeman, A.D.; Cohen, J.D. Metabolic Signatures of Arabidopsis Thaliana Abiotic Stress Responses Elucidate Patterns in Stress Priming, Acclimation, and Recovery. Stress Biol. 2022, 2, 1238812. [Google Scholar] [CrossRef]
  62. Wu, Q.; Su, N.; Huang, X.; Cui, J.; Shabala, L.; Zhou, M.; Yu, M.; Shabala, S. Hypoxia-Induced Increase in GABA Content Is Essential for Restoration of Membrane Potential and Preventing ROS-Induced Disturbance to Ion Homeostasis. Plant Commun. 2021, 2, 100188. [Google Scholar] [CrossRef] [PubMed]
  63. Reggiani, R.; Mattana, M.; Aurisano, N.; Bertani, A. Utilization of Stored Nitrate during the Anaerobic Germination of Rice Seeds. Plant Cell Physiol. 1993, 34, 379–383. [Google Scholar] [CrossRef]
  64. Reggiani, R.; Nebuloni, M.; Mattana, M.; Brambilla, I. Anaerobic Accumulation of Amino Acids in Rice Roots: Role of the Glutamine Synthetase/Glutamate Synthase Cycle. Amino Acids 2000, 18, 207–217. [Google Scholar] [CrossRef] [PubMed]
  65. Taylor, N.L.; Howell, K.A.; Heazlewood, J.L.; Tan, T.Y.W.; Narsai, R.; Huang, S.; Whelan, J.; Millar, A.H. Analysis of the Rice Mitochondrial Carrier Family Reveals Anaerobic Accumulation of a Basic Amino Acid Carrier Involved in Arginine Metabolism during Seed Germination. Plant Physiol. 2010, 154, 691–704. [Google Scholar] [CrossRef] [PubMed] [Green Version]
  66. Couée, I.; Defontaine, S.; Carde, J.P.; Pradet, A. Effects of Anoxia on Mitochondrial Biogenesis in Rice Shoots: Modification of in Organello Translation Characteristics. Plant Physiol. 1992, 98, 411–421. [Google Scholar] [CrossRef] [PubMed] [Green Version]
  67. Howell, K.A.; Cheng, K.; Murcha, M.W.; Jenkin, L.E.; Millar, A.H.; Whelan, J. Oxygen Initiation of Respiration and Mitochondrial Biogenesis in Rice. J. Biol. Chem. 2007, 282, 15619–15631. [Google Scholar] [CrossRef] [Green Version]
  68. Narsai, R.; Rocha, M.; Geigenberger, P.; Whelan, J.; Van Dongen, J.T. Comparative Analysis between Plant Species of Transcriptional and Metabolic Responses to Hypoxia. New Phytol. 2011, 190, 472–487. [Google Scholar] [CrossRef]
  69. Mustroph, A.; Lee, S.C.; Oosumi, T.; Zanetti, M.E.; Yang, H.; Ma, K.; Yaghoubi-Masihi, A.; Fukao, T.; Bailey-Serres, J. Cross-Kingdom Comparison of Transcriptomic Adjustments to Low-Oxygen Stress Highlights Conserved and Plant-Specific Responses. Plant Physiol. 2010, 152, 1484–1500. [Google Scholar] [CrossRef] [Green Version]
  70. Millar, A.H.; Trend, A.E.; Heazlewood, J.L. Changes in the Mitochondrial Proteome during the Anoxia to Air Transition in Rice Focus around Cytochrome-Containing Respiratory Complexes. J. Biol. Chem. 2004, 279, 39471–39478. [Google Scholar] [CrossRef]
  71. Lasanthi-Kudahettige, R.; Magneschi, L.; Loreti, E.; Gonzali, S.; Licausi, F.; Novi, G.; Beretta, O.; Vitulli, F.; Alpi, A.; Perata, P. Transcript Profiling of the Anoxic Rice Coleoptile. Plant Physiol. 2007, 144, 218–231. [Google Scholar] [CrossRef] [PubMed] [Green Version]
  72. Shingaki-Wells, R.N.; Huang, S.; Taylor, N.L.; Carroll, A.J.; Zhou, W.; Harvey Miller, A. Differential Molecular Responses of Rice and Wheat Coleoptiles to Anoxia Reveal Novel Metabolic Adaptations in Amino Acid Metabolism for Tissue Tolerance. Plant Physiol. 2011, 156, 1706–1724. [Google Scholar] [CrossRef] [Green Version]
  73. Rocha, M.; Licausi, F.; Araújo, W.L.; Nunes-Nesi, A.; Sodek, L.; Fernie, A.R.; van Dongen, J.T. Glycolysis and the Tricarboxylic Acid Cycle Are Linked by Alanine Aminotransferase during Hypoxia Induced by Waterlogging of Lotus Japonicus. Plant Physiol. 2010, 152, 1501–1513. [Google Scholar] [CrossRef] [PubMed] [Green Version]
  74. Menegus, F.; Cattaruzza, L.; Chersi, A.; Fronza, G. Differences in the Anaerobic Lactate-Succinate Production and in the Changes of Cell Sap PH for Plants with High and Low Resistance to Anoxia. Plant Physiol. 1989, 90, 29–32. [Google Scholar] [CrossRef] [Green Version]
  75. Fox, T.C.; Kennedy, R.A. Mitochondrial Enzymes in Aerobically and Anaerobically Germinated Seedlings of Echinochloa and Rice. Planta 1991, 184, 510–514. [Google Scholar] [CrossRef]
  76. Shelp, B.J.; Bown, A.W.; McLean, M.D. Metabolism and Functions of Gamma-Aminobutyric Acid. Trends Plant Sci. 1999, 4, 446–452. [Google Scholar] [CrossRef]
  77. Guan, X.; Nikolau, B.J. AAE13 Encodes a Dual-Localized Malonyl-CoA Synthetase That Is Crucial for Mitochondrial Fatty Acid Biosynthesis. Plant J. 2016, 85, 581–593. [Google Scholar] [CrossRef] [PubMed]
  78. Garnczarska, M.; Bednarski, W.; Morkunas, I. Re-Aeration—Induced Oxidative Stress and Antioxidative Defenses in Hypoxically Pretreated Lupine Roots. J. Plant Physiol. 2004, 161, 415–422. [Google Scholar] [CrossRef]
  79. Fu, X.; Guan, X.; Garlock, R.; Nikolaua, B.J. Mitochondrial Fatty Acid Synthase Utilizes Multiple Acyl Carrier Protein Isoforms. Plant Physiol. 2020, 183, 547–557. [Google Scholar] [CrossRef] [Green Version]
  80. Xu, K.; Xu, X.; Fukao, T.; Canlas, P.; Maghirang-Rodriguez, R.; Heuer, S.; Ismail, A.M.; Bailey-Serres, J.; Ronald, P.C.; Mackill, D.J. Sub1A Is an Ethylene-Response-Factor-like Gene That Confers Submergence Tolerance to Rice. Nature 2006, 442, 705–708. [Google Scholar] [CrossRef]
  81. Hattori, Y.; Nagai, K.; Furukawa, S.; Song, X.J.; Kawano, R.; Sakakibara, H.; Wu, J.; Matsumoto, T.; Yoshimura, A.; Kitano, H.; et al. The Ethylene Response Factors SNORKEL1 and SNORKEL2 Allow Rice to Adapt to Deep Water. Nature 2009, 460, 1026–1030. [Google Scholar] [CrossRef] [PubMed]
  82. Hinz, M.; Wilson, I.W.; Yang, J.; Buerstenbinder, K.; Llewellyn, D.; Dennis, E.S.; Sauter, M.; Dolferus, R. Arabidopsis RAP2.2: An Ethylene Response Transcription Factor That Is Important for Hypoxia Survival. Plant Physiol. 2010, 153, 757–772. [Google Scholar] [CrossRef] [PubMed] [Green Version]
  83. Vartapetian, B.B.; Andreeva, I.N.; Kozlova, G.I. The Resistance to Anoxia and the Mitochondrial Fine Structure of Rice Seedlings. Protoplasma 1976, 88, 215–224. [Google Scholar] [CrossRef]
  84. Bieniawska, Z.; Paul Barratt, D.H.; Garlick, A.P.; Thole, V.; Kruger, N.J.; Martin, C.; Zrenner, R.; Smith, A.M. Analysis of the Sucrose Synthase Gene Family in Arabidopsis. Plant J. 2007, 49, 810–828. [Google Scholar] [CrossRef] [PubMed]
  85. Santaniello, A.; Loreti, E.; Gonzali, S.; Novi, G.; Perata, P. A Reassessment of the Role of Sucrose Synthase in the Hypoxic Sucrose-Ethanol Transition in Arabidopsis. Plant Cell Environ. 2014, 37, 2294–2302. [Google Scholar] [CrossRef]
  86. Loreti, E.; Valeri, M.C.; Novi, G.; Perata, P. Gene Regulation and Survival under Hypoxia Requires Starch Availability and Metabolism. Plant Physiol. 2018, 176, 1286–1298. [Google Scholar] [CrossRef] [PubMed]
  87. Ciccarelli, R.; Di Iorio, P.; Giuliani, P.; D’Alimonte, I.; Ballerini, P.; Caciagli, F.; Rathbone, M.P. Rat Cultured Astrocytes Release Guanine-Based Purines in Basal Conditions and after Hypoxia/Hypoglycemia. Glia 1999, 25, 93–98. [Google Scholar] [CrossRef]
  88. McVey, P.A.; Alexander, L.E.; Fu, X.; Xie, B.; Galayda, K.J.; Nikolau, B.J.; Houk, R.S. Light-Dependent Changes in the Spatial Localization of Metabolites in Solenostemon Scutellarioides (Coleus Henna) Visualized by Matrix-Free Atmospheric Pressure Electrospray Laser Desorption Ionization Mass Spectrometry Imaging. Front. Plant Sci. 2018, 9, 1348. [Google Scholar] [CrossRef]
Figure 1. Scheme of the experimental design and time-points of sample collection for transcript and metabolite analyses. For the hypoxia and reoxygenation treatment, Arabidopsis seedlings were exposed to oxygen-depleted air (100% N2 gas) for 24 h in a hypoxia chamber and sampled after 0, 6, 12, and 24 h upon reoxygenation. The control plants were maintained in an aerated chamber, stayed unstressed throughout the experiment, and were sampled at the same points as the controls.
Stresses 03 00008 g001
Figure 2. Principal component analysis (PCA) of metabolic profiles of Arabidopsis seedlings in response to hypoxia stress and subsequent reoxygenation recovery. (A) The score plot of PCA. Samples under hypoxia treatment and recovery are shown in triangles, and control samples grown in the chamber filled with air are shown in circles. Time points are indicated by different colors. (B) The PCA loading plot.
Stresses 03 00008 g002
Figure 3. Overview of significantly changed metabolic features in response to hypoxia and reoxygenation. The Student’s t-test was performed to identify significantly changed metabolites between the treatment and control samples at each time point. Total significantly increased and decreased metabolites at each time point are shown.
Stresses 03 00008 g003
Figure 4. Volcano plots showing significantly changed metabolic features between hypoxia/reoxygenation treated and control plants at each time point. Red dots indicate significantly increased metabolites, and blue dots indicate significantly decreased metabolites with an adjusted p-value after Benjamini–Hochberg correction to control the false discovery rate at 0.05. The data points in each plot represent 80 metabolic features described in Supplemental Dataset S1.
Stresses 03 00008 g004
Figure 5. Hypoxia-induced metabolic changes returned during oxygenation. (A) Lactate, alanine, GABA, and glucose increased during hypoxia but decreased during reoxygenation. (B) Aspartate, glutamine, leucine, threonine, valine, and citrate decreased during hypoxia but increased during reoxygenation. Data are presented as box plots (center line at the median, upper bound at 75th percentile, lower bound at 25th percentile) with whiskers extended to the extreme data points (n = 3).
Stresses 03 00008 g005
Figure 6. Metabolites kept up-regulated or down-regulated during hypoxia and reoxygenation. (A) Fructose, proline, glycine, inositol, and malonate maintained up-regulated during hypoxia and reoxygenation. (B) Asparagine, ornithine, cysteine, serine, methionine, and sinapinate kept down-regulated during hypoxia and reoxygenation. Data are presented as box plots (center line at the median, upper bound at 75th percentile, lower bound at 25th percentile) with whiskers extended to the extreme data points (n = 3).
Stresses 03 00008 g006
Figure 7. Metabolites that keep accumulating during the post-hypoxia reoxygenation. Data are presented as box plots (center line at the median, upper bound at 75th percentile, lower bound at 25th percentile) with whiskers extended to the extreme data points (n = 3).
Stresses 03 00008 g007
Disclaimer/Publisher’s Note: The statements, opinions and data contained in all publications are solely those of the individual author(s) and contributor(s) and not of MDPI and/or the editor(s). MDPI and/or the editor(s) disclaim responsibility for any injury to people or property resulting from any ideas, methods, instructions or products referred to in the content.

