1. Introduction
Rapid urbanization in Africa, Asia, and Latin America has been accompanied by massive growth of urban informal economies [
1,
2,
3,
4]. Urban livelihoods for low-income households are increasingly reliant on informal economic activities. Opportunities for participation in the urban informal food economy occur all along food supply chains from production to transportation to processing to distribution to marketing to recycling. Food retailing on city streets and urban marketplaces is the most important and visible informal activity in almost all towns and cities. In relation to its central role in mitigating food insecurity, the OECD notes that “it would be misleading to address food security without taking into account a large part of the economy that provides jobs, incomes and essential services for the urban population. Despite its important role, the informal economy is still poorly defined, poorly measured and consequently poorly taken into account in food security policies” [
5]. As well as boosting household income, informal food retail plays a role in alleviating poverty and food insecurity in participating and other households [
5]. The governance of the urban informal food sector varies considerably from benign neglect to harsh controls involving “widespread evictions, relocations and hostile regulatory and political environments” [
6]. Rarely is it openly valued and supported [
7,
8,
9,
10].
There are different views in the general literature on the reasons why households participate in urban informal food retailing [
11]. The dominant perspective in the social science research literature is that the sector attracts necessity or survival participants, desperate people without other options [
12,
13]. These participants face intense competition and high rates of business failure. Incomes are low and unpredictable, and profits and stock are transferred to the household, inhibiting enterprise growth. Food enterprises are run by individuals with little education and limited job prospects. Many are run by women who are marginalized by gender discrimination. They operate long hours, with low margins, and have little expansion potential. An alternative perspective favored by business management researchers is that the informal economy attracts opportunistic individuals who choose to participate despite other opportunities. They are motivated by choice not necessity and exploit economic opportunities for growth through entrepreneurial energy and innovation [
14,
15,
16,
17,
18]. Moreover, they reinvest enterprise profits in business expansion and create employment for community members.
In the African context, food marketing is a major activity in the urban informal sector [
19,
20,
21]. One of the pervasive ideas about the informal sector is that food retailing is survivalist rather than opportunistic. The literature on the urban informal sector in Namibia, for example, is dominated by survivalist perspectives. Reasons for involvement in the informal sector include the inability of the formal sector to keep pace with rapid urbanization and create enough formal employment opportunities, leaving poor and marginalized households to fend for themselves [
22,
23,
24,
25]. Loan financing for business establishment and growth is non-existent and the failure rate is high [
26,
27,
28]. A female vendor quoted in an earlier study summarized her survivalist enterprise this way: “What I’m getting from selling is very little and is not significantly different from those who are not doing anything. But you cannot sit back and do nothing.” Or, as another observed: “How do you choose when you have nothing to choose from? There are no jobs—they need to create jobs with their skills and not wait for someone else to do it” [
25]. A small number of studies in Namibia do view the informal sector as an entrepreneurial space to establish and grow small and medium-sized enterprises and fulfil the business aspirations and potential of informal sector entrepreneurs [
29,
30,
31].
In a paper on the informal sector in Brazil, Williams and Youssef conclude that research on informal sector participation requires a “both/and” rather than “either/or” approach. [
32]. In other words, the informal sector in a given city may well contain both survivalists and opportunists. The aim of this paper is to assess whether research and policy on the informal sector in Africa requires a “both/and” rather than the more conventional “either/or” approach. In other words, does the informal sector in African cities contain both survivalists and opportunists and, if that is the case, how can we distinguish between them? To answer these questions, this paper draws on data from a representative survey of food vendors conducted in Windhoek, Namibia, in 2018. The first section of the paper provides a contextual overview of the history and recent expansion of the informal food sector in rapidly-urbanizing Namibia. The paper then presents the survey methodology and the criteria used to distinguish between survivalism and opportunism. The next section presents the survey results followed by a discussion of their significance. The conclusion returns to the implications of adopting the “both/and” model for future research and informal sector policy-making.
2. Informal Food Business in Namibia
Since independence from South Africa in 1990, the urbanized population of Namibia has grown through natural increase and rural-urban migration. The proportion of the population living in urban areas increased from 28% in 1991 to 48% in 2016 [
33]. The largest city in the country is the capital, Windhoek, with a population that grew from 235,000 in 1991 to 341,000 by 2011 and to 416,000 by 2016. Around 40% of the city’s population are migrants born in other parts of the country. The dramatic growth of Windhoek is highly visible in the urban landscape since most migrants live in sprawling informal settlements in the northern part of the city with rudimentary housing and services [
34,
35,
36]. At the time of the last Census in 2011, one-third (or 27,000) of all residential units in Windhoek were tin shelters in informal settlements. More than 3500 new informal houses are added to the city every year. In 2016, approximately 42% of the Windhoek population lived in informal housing [
33]. In the Khomas Region where Windhoek is located, the unemployment rate was 32% in 2018, with youth unemployment at 43% [
37]. For many school-leavers the informal sector is the only viable place to try and make a living [
38]. A total of slightly over 64,000 people were informally employed or self-employed (or 38% of all employees) in 2018.
During the colonial period, informal sector activity in Windhoek was tightly policed and controlled by the South African administration [
39,
40]. In the first decade of independence, the sector began to grow despite the official view that informality was inimical to a modern post-colonial city. In 2001, the informal sector was viewed as relatively small and insignificant compared with other cities in Africa. This has changed dramatically in the last two decades, with massive growth in the number and visibility of informal sector vendors across the urban landscape. A 2016 official survey of the informal sector in Namibia found that over half of the enterprises (55%) were involved in wholesale and retail trade, followed by manufacturing (16%) and agriculture (15%) [
41]. A total of 69% were owned by women and 92% were sole owners. Only 23% had any employees and only 11% had been in business since before 2000, with 27% starting between 2000 and 2009 and the rest (62%) starting between 2010 and 2016.
The informal sector in Windhoek is also extremely diverse with many different activities and occupations. The 2016 Survey lists 81 separate occupations amongst the 3461 respondents in urban Namibia as a whole [
41].
Table 1 provides a summary of the main occupations. Food and drink related occupations made up 68% of those in the sector with the most important being retail at 39% (and 27% of the total), bars at 11% (and 7.5% of the total),
kapana (grilled meat) sellers, and fruit and vegetable vendors (both at 9% of the total). Informal vendors dealing specifically with food constituted 83% of vendors in the food and drink category and 56% of vendors overall (although not all retailers necessarily sold food). Other important occupations included cosmetics and beauty (including hair braiding and hair dressing), tailoring, clothes sales, and transportation. Overall, these data provide strong evidence for the considerable importance of food vending in the informal sector.
Rapid urbanization has driven the fundamental transformation of the Namibian food system to meet the growing demand for affordable food [
42]. Local supermarkets and major supermarket chains from South Africa are now found throughout Windhoek and have been edging ever closer to the city’s informal settlements [
43]. These supermarkets now command the largest share of the city’s food retail market and are patronized by almost all households in the city although for different reasons. Middle and high-income households source virtually all their food from supermarkets in the CBD and suburban shopping malls. Moreover, these supermarkets offer prepared meals and other value-added options. Low-income households, including those in the informal settlements, tend to shop monthly at budget supermarkets to purchase staple foods, such as maize flour and rice in bulk [
23]. These budget supermarkets do not offer value-added options, such as prepared meals, and therefore do not present a direct source of competition with street and market vendors. Household daily and weekly needs for other foods are largely met by purchasing food from the vibrant informal food sector [
44]. While cooking facilities in the informal settlements are rather basic, most households do eat a cooked meal once a day.
Recent surveys of household food security in Windhoek provide strong supporting evidence for the importance of the informal food sector to consumers in the city [
45,
46].
Table 2 shows the six main types of formal and informal food outlet in Windhoek in 2016, the percentage of households that patronized each source in the previous year, and the frequency of patronage. Almost half of all households had bought food at the city’s open markets, with 29% having patronized street vendors and 19% tuck shops. Over 80% of those buying food from street vendors and tuck shops did so at least once per week or almost every day. Open markets were patronized less frequently but still significantly more often than supermarkets. In the city’s informal settlements, food buying from informal vendors is even more frequent. For example, over 60% of those who buy from street vendors do so on a daily basis.
Another distinctive feature of the Windhoek informal sector is the variety of types of activity [
47,
48]. Most numerous and visible are street vendors who set up their goods along the main thoroughfares on temporary structures, such as tables or crates, and often under portable shelters, such as umbrellas. These vendors sell a limited variety and quantity of fresh or processed foods and drinks purchased from supermarkets or wholesalers and transport them to their chosen site for the day. Outside many supermarkets in the city, it is common to see street vendors as well, selling perishables in smaller quantities than within the supermarket. The growth of street vending and expansion throughout the city has led the local government to adopt a carrot and stick management approach. The police are regularly called in to remove street vendors, especially in the CBD. More positively, the city has established a series of fenced and roofed “open markets” in various parts of the city with fixed stands and services, such as toilets, potable water, and electricity. The official thinking is that the spread of street vending can be contained if vendors can be persuaded to relocate to open markets [
48]. In practice, this hope has not been fully realized. The open markets have attracted some vendors but street vending has also continued to expand. Indeed, street vendors can now be found on the outside of the open markets, leading to opposition from those on the inside who pay fees for their stands and services.
One strategy adopted by vendors to minimize police harassment has been to cluster together and build their own fixed structures and shelters which would be more difficult to remove. A growing number of “clusters” have now been recognized by the city which has given them the designation of informal markets (to distinguish them from the city’s open markets). A more specialized type is the mobile vendor who sells goods from house to house or from the back of a vehicle. Mobile vendors often specialize in the sale of fish they have caught or bought, especially in the informal settlements. In addition, the informal settlements are host to other types of fixed location vending. First, there are home shops which specialize in home brewing but may also sell food. Second, there are the tuck shops (sometimes called spazas), which are informal shops built from tin or disused containers.
Against the backdrop of this discussion of the character of the informal food sector in Windhoek, and the nature of the policy response to the growth of informality, the following sections of the paper present the results of a comprehensive survey of the informal food sector in the city in 2018.
3. Methodology
The analysis of the informal food sector in Windhoek, Namibia tests the following research hypotheses:
H1. The informal food sector in Windhoek comprises both survivalist and opportunist enterprises;
H2. Survivalist and opportunistic food vendors can be differentiated from one another in terms of their individual characteristics, enterprise features, and business practices;
H3. Entrepreneurial motivation (EM) provides a robust set of metrics for distinguishing survivalist and opportunistic food vendors.
First, the location of all informal food traders in Windhoek was geolocated over a three-day period and mapped. Our objective was a comprehensive list of types and location of all traders and to create a population to draw a representative sample from. At this stage, a total of 2421 food traders were identified. Second, we drew a random sample using a stratification strategy to select the number of vendors of each type that was proportional to their share of the overall population (
Table 3). Third, a tablet-based questionnaire was used to survey randomly selected business owners up to the maximum number of each type. The survey collected data on (a) vendor characteristics including age and sex and household characteristics; (b) the reasons for starting an informal food business; and (c) enterprise characteristics including startup date, capitalization, income and expenditure, foods sourced and sold, interactions with the formal sector, and employment generation.
For the statistical analysis, the nine main types of enterprises were grouped into four categories (
Table 4): (1) Street Vendors including mobile vendors and those operating outside of supermarkets; (2) Informal Market Vendors including those in recognized clusters and at transport hubs; (3) Open Market Vendors including vendors both on the inside and outside of open markets; and (4) Tuck Shops and Home Shops. Five variables were selected for the descriptive statistical analysis and to assess whether they provide a basis for distinguishing between survivalists and opportunists in the informal food sector in Windhoek: (1) Entrepreneurial motivation (EM); (2) length of time since startup; (3) business financing; (4) use of profits and stock; and (5) employment generation.
To capture data on entrepreneurial motivation (EM), first, we formulated a set of rationale statements from the EM literature on the initiation of business enterprise and asked respondents to rate each one on a scale from 1 (no importance), 2 (little importance), 3 (moderate importance), 4 (very important), and 5 (extremely important) [
49]. Then, we calculated a mean score for each criterion and selected the top four survivalist and the top four opportunistic statements for further analysis.
For the modeling exercise, we selected four motivations as the response variables deemed to be most representative of survivalism (S) and opportunism (O), respectively:
S1: I needed more money just to survive;
S2: I was unemployed and unable to find a job;
O1: I have always wanted to run my own business;
O2: I wanted my control over my own time/to be my own boss.
Explanatory variables chosen for the analysis included:
Owner characteristics: sex, age, education, migration status;
Household characteristics: household size, consumption of business stock by family;
Business characteristics: type of ownership, year established, business type, startup capital, current worth, employees;
Business practices: use of public transport, selling goods on credit, and keeping business records.
An ordinal regression was estimated for four models based on S1, S2, O1, and O2. The model allows us to calculate the likelihood or odds ratio (OR) of remaining at a particular rank, and the chance of moving to another rank lower or higher than the one selected. Furthermore, the model allows us to estimate the strength of the relationship between the ranked responses and the independent variables. Regression coefficients were interpreted as odds ratios (OR), with OR > 1 indicating that the independent variable was positively associated with the response variable, while OR < 1 suggests a negative association, if the p-value is less than 0.05.
4. Results
4.1. Entrepreneurial Motivation
Table 5 differentiates between four survivalist and four opportunistic reasons for starting an informal food enterprise and rates each on a scale from 1 (no importance) to 5 (extremely important). The table shows the distribution of responses and the mean (out of 5). Overall, survivalist motivations were more significant with a mean score range between 3.33 and 4.05 (compared with 1.47 to 3.08 for opportunistic motivations). The three main survivalist motivations, in order of importance, were needing more money just to survive, wanting to give family greater financial security, and making money to remit to family in the home area. Around 70% of respondents rated these motivations as very important (4) or extremely important (5). By contrast, the most significant opportunistic motivation—always wanting to run their own business—was very/extremely important to only 41% of respondents. However, only a quarter of the respondents said that the desire to run their own business or to be their own boss was completely unimportant to them.
There is a definite possibility that some vendors had mixed motivations and had both survivalist and opportunistic reasons for starting an informal enterprise. However, only 5% of the respondents rated both S1 and O1 as important or extremely important, which suggests that the sector is primarily composed of both survivalists (60–70%) and opportunists (30–40%).
4.2. Startup Date
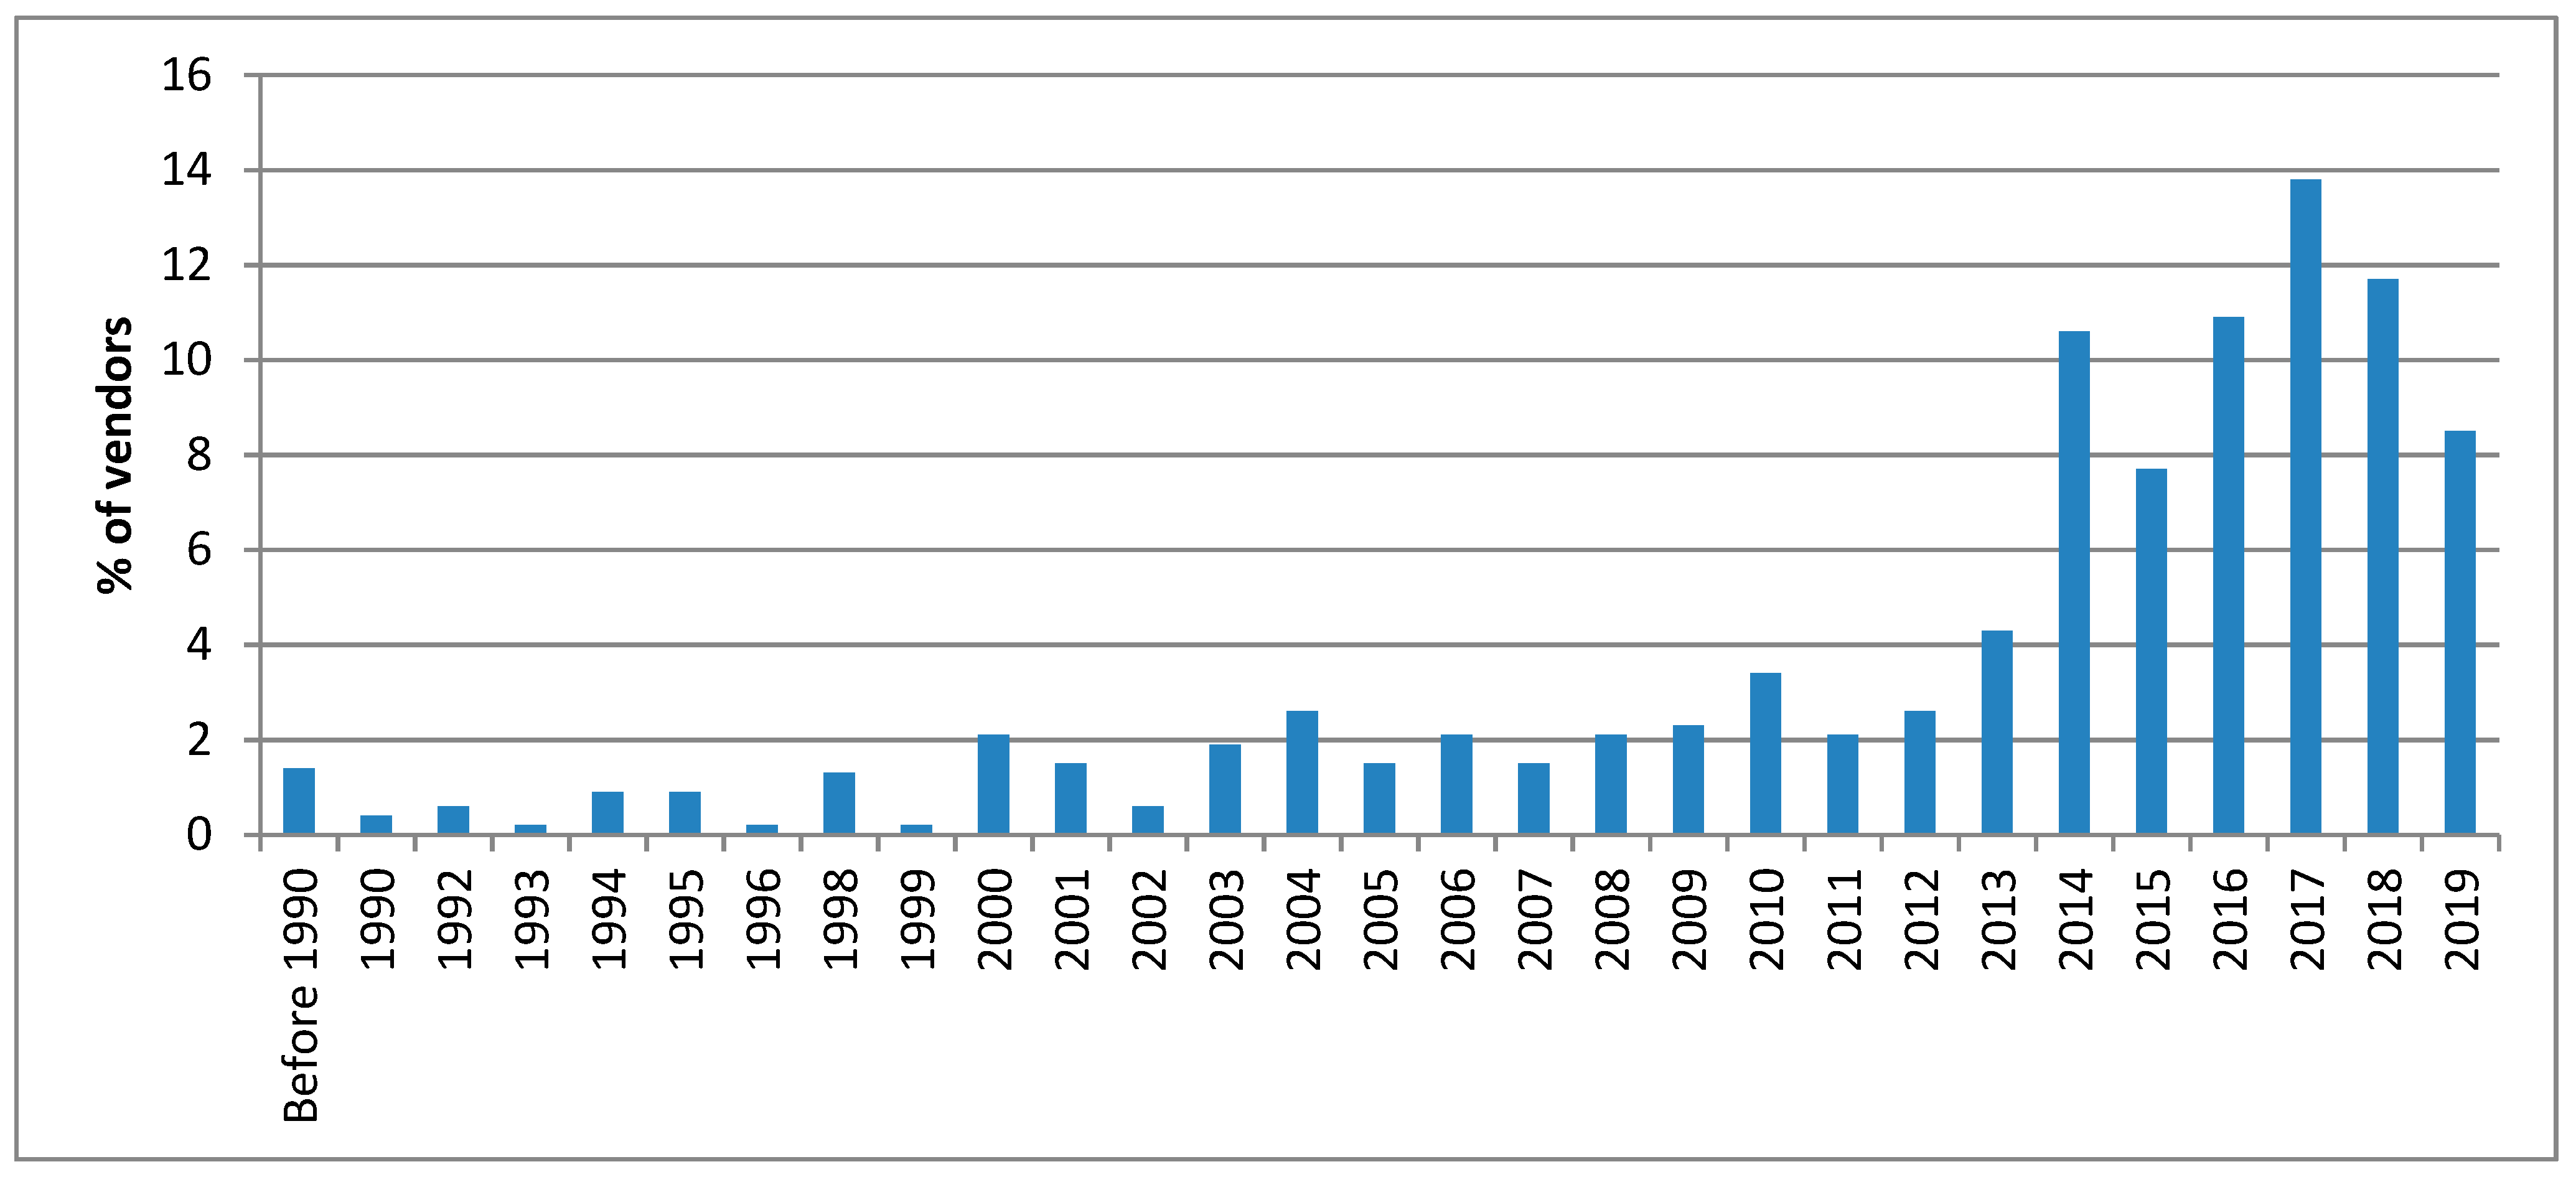
Most food vendors in Windhoek are recent entrants to this highly competitive sector (
Figure 1). Three-quarters had entered in the previous decade, and nearly half in the previous 5 years. Only 6% had been in business for over 20 years. Another 18% had started in the 2000s. Widespread unemployment under conditions of rapid urbanization is certainly one explanation for the surge. Over 60% of those surveyed said that unemployment and being unable to find a job were important reasons for entering the sector. Only 25% said these reasons were unimportant to them; these respondents stressed that they had a job but the remuneration was insignificant or that their job did not make maximum use of their skills and experience.
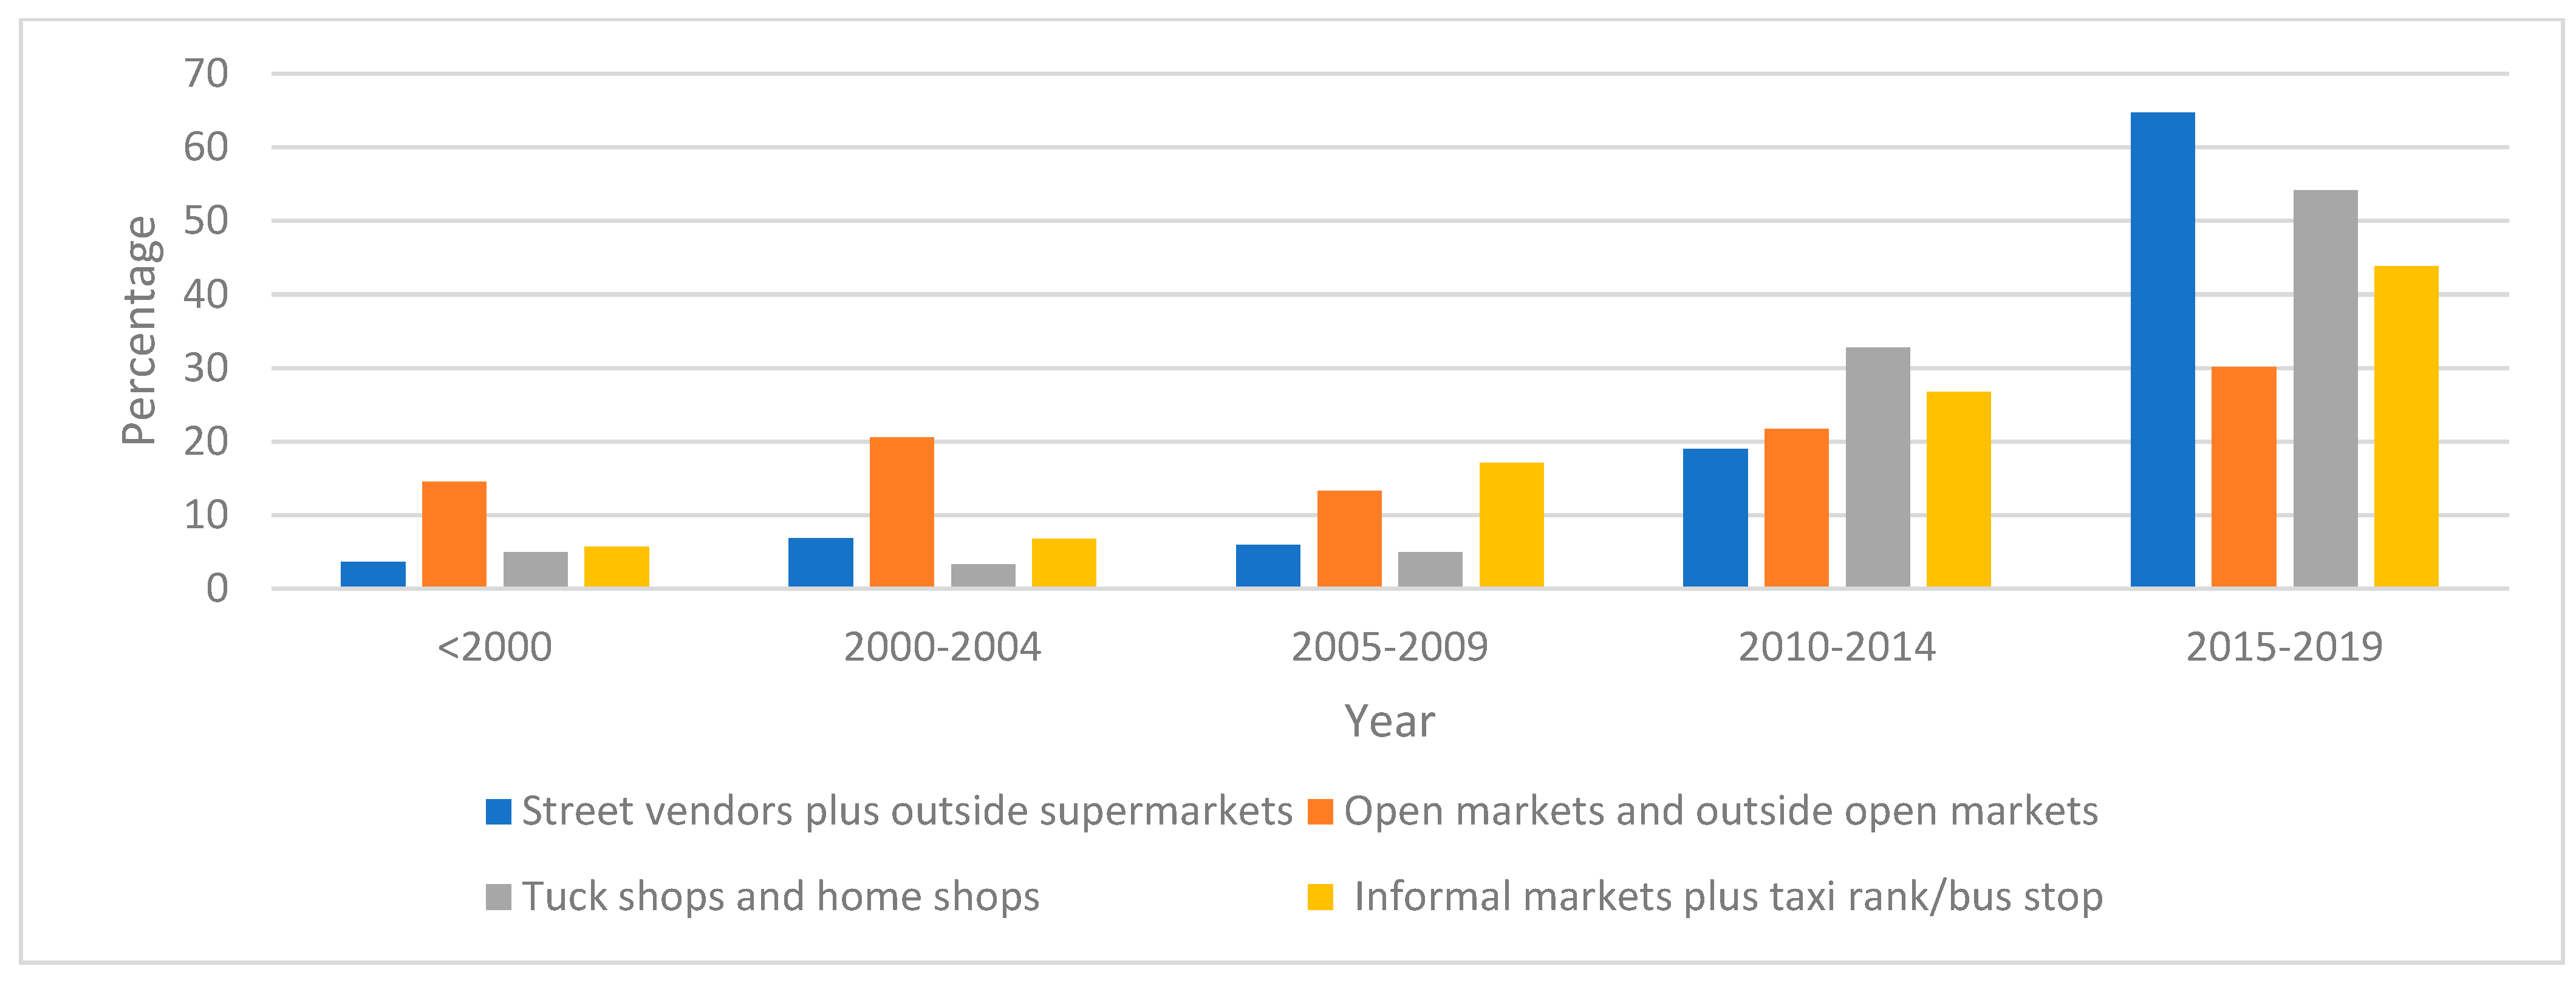
Figure 2 disaggregates the time profile by the four main types of business. While recent entrants dominate all four, there is considerable variation between them. For example, two-thirds of street vendors began trading after 2014 compared with only 30% of open market vendors. Nearly half of the latter started operating before 2010, compared with only 16% of street vendors. Tuck shop operations also tend to be more recent.
To test whether recent entrants to the sector were more likely to be survivalists or opportunists, we compared the motivation scores for vendors who started their business in the previous 5 years with those who had been operating for more than 5 years.
Table 6 shows the mean scores for two survivalist and two opportunistic motivations broken down by startup date. The results suggest that survivalist motivations may have become less important over time, while opportunistic motivations have remained relatively constant.
4.3. Business Financing
Informal sector startups in Namibia are mostly self-financed and under-capitalized. Loan financing from formal institutions, such as banks, is unavailable and informal money lenders charge usurious interest rates.
Table 7 shows that personal savings were the most important source of startup capital for almost 80% of the vendors. Other minor sources included gifts and loans from relatives. Very few had borrowed money from formal or informal lenders.
Over half of the surveyed enterprises had startup capital of less than NAD 500 (USD 28) and another third started with between NAD 501 and NAD 2,000 (USD 110). Only 7% invested NAD 4000 (USD 220) or more (
Table 8). Moreover, the table shows the current self-estimated worth of the businesses. The proportion of enterprises with the lowest level of capitalization declined from 53% to 40%. Similarly, the proportion with NAD 3,001 (USD 165) or more increased from 8% to 23%.
4.4. Use of Business Income and Stock
A common characteristic of informal food vending in Africa is the fluid boundary between the business enterprise and the household of the business owner. Survivalists are more likely than opportunists to use business income for household needs and to divert food purchased for the business to the household. Most owners (77%) said that they purchased food for the household with daily earnings from the business while only a quarter did not. This practice inevitably reduces the amount of income available for reinvestment in the business. In terms of the diversion of business stock to the household, 94% of the owners said that they personally consume food from the business and 69% that their family members do this as well (
Table 9). In addition, one-third divert business stock to supply other people and relatives as well as neighbours.
4.5. Job Creation
In Windhoek, the creation of employment for others did not rank particularly high as a motivation for starting a food business, with mean indicates between 1.47 and 2.01.
Table 10 shows that around 20% of respondents said providing jobs was very/extremely important to them.
However, employment creation appears to be more of an aspiration than a reality. In practice, as
Table 11 shows, most vendors were self-employed and only 7% of the vendors had employees. In total, these 500 businesses had generated only 35 jobs between them.
5. Determinants of Survivalism and Opportunism
5.1. Survivalist Enterprises
Models 1 and 2 assess the characteristics of survivalist enterprises based on the strength of the relationship (calculated as Odds Ratios or OR) between survivalist motivations (S1 and S4) and independent variables including individual vendor characteristics (such as sex, age, level of education, and size of household), business features (such as type of enterprise, durability, startup capital, current worth), and various business practices (
Table 12). For the analysis, we selected four business practices from the survey: (a) Use of public transportation (such as buses and minibus taxis) to transport stock; (b) offering credit to customers; (c) maintaining business records; and (d) consumption of business stocks by the vendor’s household.
First, on individual vendor characteristics, both Models 1 and 2 show that female business owners have higher odds of being survivalists than males (Model 1: OR 1.42; Model 2: OR 1.11). The amount of education is also a predictor of whether a vendor is more likely to be a survivalist. Vendors with primary education have higher odds of being survivalists than those with secondary education (Model 1: OR 1.43; Model 2: OR 1.30). The high rates of youth unemployment in the country indicate that survivalists are also more likely to be younger adults (Model 1: OR 2.04; Model 2: OR 1.59) or youth (Model 1: OR 1.18; Model 2: OR 1.90).
Second, in terms of enterprise characteristics, the results are less clearcut. In both models, survivalists are more likely to have initiated their business relatively recently. For example, in both models, the odds of being survivalist are generally higher if the business started in the last decade. However, the relationship is not perfect since Model 1 suggests that there are some survivalists who started in the 1990s. The best predictor of survivalism is the type of enterprise in which a vendor is engaged although the models do produce differing results. Model 1 predicts that survivalists are most likely to be informal market vendors (OR 1.93) followed by tuck/home shops (OR 1.55). In Model 2, survivalists are most likely to be open market vendors (OR 1.50), followed by tuck/home shops (OR 1.28). In general, the amount of startup capital is an inconsistent guide to survivalism in contrast to the current worth of business. The greater the current worth, the less likely the enterprise is to be survivalist.
Finally, we hypothesized that survivalists would be more likely to use public transportation, would not be able to offer credit, would be less likely to keep records; and would transfer food from the business for home consumption. Model 2 suggests that those using public transportation are significantly more likely to be survivalists (OR 8.07) and that those who do not offer credit have significantly higher odds of being survivalists (OR 0.19). Neither model suggests that keeping business records or consumption of business stocks by the households are strong predictors of survivalism.
5.2. Opportunist Enterprises
Models 3 and 4 assess the characteristics of survivalist enterprises based on the strength of the relationship between survivalist motivations (O1 and O2) and the same independent variables including individual vendor characteristics, informal business features, and operational factors (
Table 13). For the analysis, we again selected four business practices from the survey: (a) Use of public transportation (e.g., buses, minibus taxis) to transport stock; (b) offering credit to customers; (c) keeping business records; and (d) consumption of business stocks by the vendor’s household.
First, opportunists are less likely to be female than male (Model 3: OR 0.79; Model 4: OR 0.85), and more likely to be better-educated. Those with tertiary education have the highest odds of being opportunistic (Model 3: OR 1.78; Model 4: OR 1.80). Young people under the age of 25 are significantly more likely to see themselves as opportunists when compared with older adults (Model 3: OR 4.92; Model 4: OR 4.70). Other independent variables that do not differentiate significantly or consistently between survivalists and opportunists include the migration status of the household head and household size.
Second, in both Models 3 and 4, those who started their business between 2000 and 2004 are most likely to be opportunists (Model 3: OR 2.17; Model 4: OR 1.69). In Model 4, sole ownership is more likely to predict opportunism, whereas in Model 3, it is less likely (similar ambiguity around ownership is evident in Models 1 and 2). The best predictors of opportunism, as with survivalism, are the type of business and some business practices. Both models confirm that street vendors are significantly more likely to be opportunistic than the other types. Moreover, opportunists have better startup capital and higher odds of employing others; however, the number of employing enterprises is very small to draw any firm conclusions.
Third, the only consistent business practice in Models 3 and 4 is keeping business records, with opportunists more likely to keep records than not (Model 3: OR 1.25; Model 4: OR 1.19), although Model 4 indicates that opportunists are also more likely to offer credit than not (OR 1.21).
6. Discussion
In this paper, the first part of the analysis focused on five common descriptive metrics from the literature for assessing whether an informal food enterprise is opportunistic rather than survivalist: The rationale for starting a food business, the durability of the business, financing arrangements, the usage of profits and stock, and the employment generation potential. The first metric seeks to uncover the reasons for starting an informal business. From the responses to fifteen potential reasons in the questionnaire design, we extracted the data for four that we deemed most representative of survivalist motivations, and four most representative of opportunistic motivations (or eight in total) (
Table 5). All four survivalist motivations rated more highly overall (with indicates between 3.33 and 4.05) than any of the opportunistic motivations (ranging from 1.47 to 3.08). Since all respondents answered every question, this suggests that survivalism is generally the primary motivation for entering the food sector.
As many as one-third of respondents said that survivalist motivations were of little or no importance to them. In addition, the most significant opportunistic motivation—always wanting to run their own business—was very/extremely important to 41% of respondents. At the very least, this suggests that there was a sizable minority of vendors who had a strong opportunistic impulse. Some individuals rated both sets of motivation as important to them. This suggests that opportunistic motivations were not only present in this population, but that some vendors held a mix of survivalist and opportunistic motivations for starting a business. Therefore, the dichotomy between survivalism and opportunism is a potentially false one in two senses: First, the informal food sector is composed of survivalists and opportunists. Second, some individual vendors are both survivalist and opportunistic. However, we found that only a small number of respondents (around 5%) could be classified as both.
A basic challenge with the EM methodology is that it relies on the recall of motivations in the past rather than assessing motivations at the time of the actual decision. First, the longer the time elapsed since that decision, the greater the likelihood of faulty recall. Second, it assumes that the social, economic, and labour market conditions that prompt a decision are the same for all vendors and remain constant over time. Third, it does not allow for changes in entrepreneurial motivation and transition from one to the other, i.e., survivalists who become opportunistic over time and vice-versa. In this study, all three difficulties were mitigated somewhat by the finding that many vendors (over 60%) had entered the sector within the previous 5 years (63% between 2014 and 2019).
Survivalism and opportunism are potentially related to the length of time a business has been in operation. For example, is there is a correlation between the ability of a business to survive and grow, and the length of time it has been in operation? If this was the case, those who have been in business for longer would be more likely to score higher on opportunistic motivations than those who have only recently started out. However, as
Table 6 showed, there is no major difference in EM between vendors who started in the last 5 years and those who have been operating for more than 5 years. While older entrants did score marginally higher on opportunistic motivations, they also scored marginally higher on survivalist motivations.
The third metric relates to the source of business financing and the amount of capital invested. Opportunists are theoretically more likely than survivalists to be able to secure external financing from formal lending institutions, such as banks who apply strict lending criteria based on their assessment of the viability of the business. As
Table 6 shows, personal savings were the major source of business capital for all vendors and only one vendor out of over 450 had obtained a bank loan in order to start their business. This indicates that the source of business financing is not a useful yardstick for distinguishing opportunists from survivalists. Moreover, the low initial capitalization of informal food enterprises does not allow us to distinguish between survivalist and opportunistic startups on this basis alone. Although current worth is more reliant on subjective judgement, a comparison with startup capital does indicate that there has been some business growth over time. However, business growth was not confined to opportunists: 48% of opportunistic enterprises (O1) had experienced growth as well as 44% of survivalists (S1).
Fourth, in theory, survivalists are more likely than opportunists to funnel business income and food stocks to support their household members. On the other hand, opportunists would be more likely to reinvest income in the business and reserve stocks for future sales. Around three-quarters of the respondents said that they purchase food for the household with daily earnings from the business. A similar proportion (69%) transfer food from the business for household consumption, while a third also feed non-household members including neighbours. In summary, this metric does not clearly distinguish between opportunistic and survivalist orientations as the practical reality is that the boundaries between household and business are necessarily porous for all.
Finally, the employment creation potential of the informal sector has been well-documented [
49,
50]. In theory, opportunists are more likely than survivalists to generate jobs for others as their businesses expand. However, in Windhoek, this hope has not yet been realized in the informal food sector as over 90% of the respondents run their businesses themselves with no employees. Therefore, employment creation is not a useful metric for distinguishing survivalism from opportunism in Namibia.
In the second part of the analysis, we used logistic ordinal modeling to identify the characteristics of individual vendors, their businesses, and their households, which are most strongly associated with survivalism or opportunism. Clear and often complementary differences emerged between Models 1 and 2, on the one hand, and Models 3 and 4, on the other hand. On individual vendor characteristics, the models found that the odds of being survivalist were stronger for females with lower levels of education. The reverse was true with the opportunist models, which found that the odds of being opportunistic were higher for males and increased with education. The findings on age were more ambiguous since younger adults and youth were more likely than their older peers to be both survivalists and opportunists. However, the strength of the association was significantly stronger in Models 3 and 4. Therefore, for example, youth under the age of 25 were more than four times as likely to be opportunists than adults who were over the age of 40. Migration status did not show a consistent relationship with survivalism or opportunism.
The gendered dimensions of participation in the informal food sector have been explored in a small number of unpublished studies [
25,
48,
51]. They found that women face greater challenges than men in accessing the formal labour market. In addition, particularly in urban areas, there are a significant number of female-centred households in which women are the sole providers for household members, including their children. Even in male-headed nuclear and extended households, patriarchal norms assign the tasks of food procurement and preparation primarily to women. In these circumstances of gender inequity, women are more likely than men to be survivalists in their orientation. This expectation is born out by the models which find that men are more likely to be opportunists than women.
The models provide further insights into some of the issues raised in the discussion of descriptive statistics above. With regard to the year of business establishment, Model 3 found that the odds of being opportunistic were indeed higher for businesses that started more than 5 years ago compared with recent startups. However, Models 1 and 2 complicate this relationship since both suggest that the odds of being survivalist are also higher for businesses that started more than 5 years ago. Model 4 is inconclusive. Therefore, we need to be wary of drawing a definitive conclusion on whether recent entrants are more opportunistic or not. The picture is not significantly clearer with regard to financing. For example, Models 1 and 2 suggest that the odds of being survivalist decline with increased startup capital, while Models 3 and 4 indicate the same thing for the odds of being opportunistic. Current wealth generates a similar finding. The primary conclusion to draw from these contradictory results is that neither when a business had started nor the amount of startup capital nor the current worth are consistent predictors of whether a vendor is more likely to be survivalist or opportunistic. The relationship is more robust when it comes to the business type. All four models agree that street vendors are less likely to be survivalist and more likely to be opportunistic than the other types. On business practices, they also agree that those who offer credit to customers are more likely to be opportunists and less likely to be survivalists. The keeping of business records is not a reliable predictor of one or the other, nor are household size or whether business food stocks are consumed in the household.
7. Conclusions
The analysis of the informal food sector in the capital city of Windhoek tested three research hypotheses: H1. The informal food sector in Windhoek comprises both survivalist and opportunist enterprises; H2. Survivalist and opportunistic food vendors can be differentiated from one another in terms of their individual characteristics, enterprise features, and business practices; and H3. Entrepreneurial motivation (EM) provides a robust set of metrics for distinguishing survivalist and opportunistic food vendors.
Rather than seeing the sector as the domain of either economic survivalists (the dominant narrative hitherto) or economic opportunists (the minority opinion), it should be seen as comprising both survivalists and opportunists. Our general conclusion is that the H1 “both/and” hypothesis carries the most weight in Windhoek’s informal food sector. The evidence indicates that most participants in the sector are present since they lack any alternative and need to generate income for the everyday survival of their household members. Out of necessity, business income and stock are transferred to meet household needs, reducing the amount available for reinvestment in the business. At the same time, there is clearly a minority of vendors who are more opportunistic in their orientation.
On H2, the analysis shows that both groups are largely self-financed with little infusions of loan finance from the banking system. They are primarily single-person micro-enterprises that create little employment for others. In addition, their ability to reinvest income in business growth is undermined by the need to channel income and stock for household needs. Clearly, there are operating challenges common to all informal food micro-enterprises, survivalists, and opportunists, which need to be addressed to maximize their growth potential and economic contribution. To test H3, this paper deploys EM to identify similarities and differences between survivalists and opportunists in the informal food sector of Windhoek. Entrepreneurial motivation (EM) is shown to be a useful measure of what motivates individuals to start an enterprise in a sector characterized by intense competition, low profit margins, long working hours, high failure rates, and vulnerability to exploitation and theft of stock and income.
In general, opportunists tend to be younger and better educated than survivalists and are more likely to be working on city streets. Contrary to our initial expectation that street vending is most likely a survivalist enterprise, the low overheads, mobility, and flexibility of street vending appear to attract those of a more opportunistic bent. Given that street food vending is generally more attractive to opportunists, it is therefore ironic that this sub-sector elicits the greater antipathy from policy-makers and the police who characterize street food vending as unsightly, unhealthy, and uncontrollable, a response to street food vending not confined to Namibia [
6,
9,
19,
52]. After a decade or more of attempts to erase street food vending, the City of Windhoek has adopted a policy of informalized containment, declaring that food vending is permissible as long as it is confined to designated sites under municipal control, such as open markets [
47]. Out of these sites, a policy of harassment, arrest, and confiscation of stock is vigorously pursued leading to sometimes violent confrontation between the police and vendors. To maximize the inclusive growth potential of street food vending, fundamental rethinking of the dominant paradigm that characterizes it as unsightly, unhealthy, and uncontrollable is a necessary first step.
Four major directions for future research are suggested by the analysis and conclusions of this paper. Each has potential policy implications for Namibia and African cities more generally. First, while the survey data allow us to distinguish between survivalists and opportunists operating in the same urban space, the cross-sectional and retrospective nature of the data do not permit an analysis of individual changes in status from survivalism to opportunism (and vice-versa) or an identification of the factors which might promote or inhibit that transition. Therefore, additional longitudinal research and EM indicators administered at different points in time would assist in identifying these enabling conditions as well as identifying points of policy support and intervention.
Second, more research is needed on the gendered dimensions of entrepreneurship in the informal food sector. Traditionally, the sector was dominated by older women who had few formal job opportunities but younger, unemployed men are increasingly entering the sector. In Windhoek, 66% of food vendors are now women and 34% are men. This paper indicates that men are more likely than women to be opportunists and women are more likely to be survivalists. Therefore, additional research is needed on what gender-specific obstacles deter women entrepreneurs from being more opportunistic. In policy terms, a gender analysis suggests that it is inadequate to simply back opportunistic winners as men would benefit more than women, which would further entrench gender inequality. Moreover, policy needs to focus on supporting survivalist women to be more opportunistic.
Third, our survey only sampled current businesses. While the data show that most enterprises entered the sector comparatively recently, it is also possible that business failure and churn are a significant contributor to this profile. Certainly, the broader survey showed that informal food businesses face many operating challenges (including, for example, exclusion from the formal banking sector, intense competition, and political opposition) [
53]. Therefore, additional research is needed with failed businesses to understand both how common it is and what policy supports could be put in place to minimize risk.
Finally, one of the major conclusions in this paper is that opportunists and survivalists tend to be attracted to different types of food business. We had anticipated that street vendors, who are the most visible enterprises on the urban landscape, would primarily be survivalists in character, whereas the opposite turned out to be the case. Clearly, additional research is needed on the reasons why street vending is more attractive than formal and informal markets and tuck/home shops for opportunists. However, as we note, it is precisely street vendors who bear the brunt of police opposition and harassment. If the aim of policy is to support opportunism and assist enterprises to transition to the formal sector, then recurrent attacks on street vending are both counter-intuitive and economically unproductive.


