Article

Bond Behavior of WAAM Reinforcements in Comparison to Conventional Steel Reinforcements

1
TUM School of Engineering and Design, Department of Materials Engineering, Centre for Building Materials, Technical University of Munich, 81245 Munich, Germany
2
TUM School of Engineering and Design, Department of Mechanical Engineering, Institute for Machine Tools and Industrial Management (iwb), Technical University of Munich, 85748 Garching, Germany
*
Author to whom correspondence should be addressed.
Constr. Mater. 2023, 3(2), 217-232; https://doi.org/10.3390/constrmater3020014
Submission received: 28 February 2023 / Revised: 27 April 2023 / Accepted: 3 May 2023 / Published: 9 May 2023

Abstract

:
Additive manufacturing is becoming increasingly important in the construction industry. Wire arc additive manufacturing (WAAM) can be integrated into the selective paste intrusion (SPI) to enable the simultaneous printing of reinforced concrete. The bond behavior of a WAAM reinforcement was investigated with pull-out tests and compared to alternative reinforcement types to analyze the stress transfer between the different components. In the first step, the surface of all the reinforcement types was recorded using a laser-based line scan measuring system. This permits the evaluation of the surface parameters, such as the surface roughness Rq, or the related rib area fR. The WAAM reinforcement showed a bond behavior in the pull-out tests that was comparable to a reinforcing steel bar. Both the bond stresses achieved, and the occurring scatter of the measurement results at the characteristic slip values were almost the same. Even without existing transverse ribs, the WAAM reinforcement reached maximum bond stresses similar to the reinforcing steel. An evaluation of the surface roughness revealed a linear relationship with the maximum bond stress achieved with a logarithmic scaling of Rq. The bond work Wτ, which is a measure of the system stiffness, showed that WAAM reinforcements and reinforcing steel bars have approximately similar behavior.

1. Introduction

1.1. Motivation and State of the Art

Additive manufacturing (AM) is increasingly being established in the construction industry. Large industrial companies have already additively manufactured the first residential buildings with success [1]. The advantage of AM in general, but especially in the building industry, is the faster and cheaper production by a higher degree of automation, thus enhancing economic aspects. In addition, the sustainability can be increased through new methods, such as the manufacturing with supplementary cementitious materials, for example calcined clay instead of pure Portland cement clinker, or optimized structures, which focus on material savings while maintaining the same load-bearing capacity [2].
A major challenge in using additive manufacturing for concrete structures is the complete integration of the reinforcements, which are essential for standard concrete structures [3]. Most structural elements bear various loads. Therefore, standard concrete components should be able to transfer both tensile and flexural forces. With additive manufacturing in construction, the reinforcement is often inserted in, or placed by hand, or alternatively, the element can be designed so that the concrete only has to withstand compressive loads.
One method to address the challenge for the complete and automated integration of a steel reinforcement is to combine the selective paste intrusion (SPI) process with the wire arc additive manufacturing (WAAM) process, as shown in Figure 1. SPI is a particle-bed-based process where a cement paste is selectively applied on a layer of aggregates at the locations where the concrete structure is to be formed (Figure 1b,c) [4]. WAAM enables the production of steel components with a high degree of geometrical freedom by melting a steel wire with an electrical arc and depositing the molten metal layer by layer (Figure 1a) [5].
The layerwise deposition of the molten steel creates a characteristic surface profile, which significantly affects the bond strength between the reinforcement steel bar and the surrounding concrete matrix. The bond strength is crucial, as it determines how effectively the reinforced concrete structural element can transfer the tensile and flexural forces, and reduce crack widths.

1.1.1. WAAM Technology

According to ISO/ASTM 52900:2021 [6], WAAM is part of the process category termed the directed energy deposition of metals with an electrical arc (DED-Arc/M). WAAM is a formative deposition welding process [7], which involves using a gas-shielded arc welding process (e.g., the cold metal transfer (CMT) process). In all gas metal arc welding processes, the arc is formed between the substrate plate and a consumable wire electrode. The CMT process synchronizes the wire movement with the arc ignition. As soon as the wire electrode touches the substrate material, the forward feed is stopped, and the wire gets retracted. During the retraction, an arc is ignited through arc discharge between the substrate and the wire electrode. The arc preheats the substrate and subsequently melts the wire. After a defined arc phase, the feed is reversed into a forward movement. The CMT process starts by laying down the molten metal drop. When the droplet is laid down, the wire has contact with the substrate, and a short circuit occurs. Afterwards, the CMT cycle starts again. The key advantages of this technique include a reduced necessary welding current and the absence of spattering while welding [8].
Within the process of CMT welding, there are different working modes with unique characteristics. One of these modes is the CMT cycle step, which is suitable for manufacturing concrete reinforcements. The CMT cycle step enables the user to control the exact number of deposited metal drops by predefining the number of CMT cycles per welding phase. Between the welding phases, it is also possible to define an interval break with a length between 0 and 2 s to lower the heat input. With the cycle step mode, the size of the welding spots can be reproduced precisely by deciding how many drops are deposited in the same spot.
Various deposition strategies exist for the WAAM process. The deposition techniques can be classified into continuous and discrete [9]. The discrete technique is also called point-by-point [9,10], or dot-by-dot [11,12]. Continuous strategies are used to produce wall-shaped or massive structures with WAAM [13]. Discrete techniques are utilized to produce bar structures with relatively small diameters [12,13,14,15].
There is an increasing interest in the research of bar structures manufactured by WAAM for their use as reinforcements. Mechtcherine et al. [15] printed rebars for their use as concrete reinforcements with a discrete deposition strategy. A profiled form of the bars was chosen to improve the connection between the concrete and the bars. The bars had a diameter of 8 mm and a layer height of 1.4 mm, and were printed with a fully automatic, adaptive process control. Mechtcherine et al. [15] recognized that the typical negative welding effects, such as the formation of a martensitic microstructure or thermally induced stresses, are limited when printing cylindrical bars. This is caused by the rotational symmetry of the bar, reducing the issue of a localized heat input [15].
Müller et al. [16] printed bars dot-by-dot and paused the process between layers until an interlayer temperature of 200 °C was reached. The interlayer temperature was monitored by a pyrometer. The analyzes conducted were focused on investigating the influence of the process parameters and different welding processes on the surface topology and the mechanical properties of printed steel bars. Thereby, the uneven surface of the bars was considered, as such reinforcement elements are not post-processed. The investigation of the surface topology showed a lower waviness and more regularly built layers for bars printed with the CMT cycle step (point-to-point surface waviness (PtP) of 0.35 mm), than with CMT (PtP of 0.89 mm). Computed tomography (CT) scans showed small pores for both CMT modes. However, the CMT cycle step resulted in a higher number of pores. This was attributed to the combination of short welding times with small weld pools, which are typical for this mode. Longitudinal strain measurements unveiled a more even strain distribution for a bar manufactured with the CMT cycle step compared to a CMT-manufactured bar [16].
A review by Riegger and Zaeh [17] showed that discrete deposition strategies can be used to manufacture bars with diameters from 3 to 10 mm. For the production of larger diameters, a continuous strategy can be beneficial. This strategy was implemented in the experiments to determine the temperature development in the bars produced by WAAM [4]. Weger et al. [4] produced weld beads with a diameter of 12 mm using circular welding trajectories. Riegger and Zaeh [17] adapted this technique and qualified it for inclined rebars with overhang angles α of up to 60°. A linear correlation between α and the effective bar diameter, as well as a quadratic correlation between α and the surface waviness for bar structures manufactured with a continuous strategy were found.

1.1.2. Bond Mechanisms

The construction of reinforced concrete combines the advantages of both materials: the tensile load-bearing capacity of steel, and the compressive load-bearing capacity of concrete under nearly identical coefficients of thermal expansion. At the beginning of the reinforced concrete construction, mainly round or rectangular “irons” were used [18]. With the increase in the steel strength, the surface geometry of the reinforcing steels was also further developed [18]. To be able to transfer the tensile forces of the reinforcing steel into the surrounding concrete, the surface geometry of the reinforcing steel is of particular importance, in addition to the sufficient strength of the concrete. The force transfer is ensured by the bond stresses in the shear joint. The bond stresses τ can be calculated as according to Equation (1). The applied force F acts in the shear joint surface, based on the simplified assumption of a cylinder with the diameter ds and the length lb [19].
τ = F π · d s · l b
The source of the bond stress during testing [19] can be exemplarily divided into three characteristic mechanisms, which depend on the relative displacement s (in the following, also referred as “slip”) between the reinforcement and the concrete (see Figure 2):
  • Adhesive bond;
  • Shear bond;
  • Friction bond.
The adhesive bond of the cement paste to the steel surface generates bond forces in the contact zone. The force transfer is ensured by the cement paste penetrating into the rough steel surface, and by physiochemical bonds in the form of capillary and adhesive forces [20]. It is assumed that the adhesive bond has already been destroyed at very low relative displacements between the steel and the concrete [20]. After the chemical adhesion breaks down, the transversal ribs induce significant stresses into the concrete. The interfacial transition zone (ITZ) between the reinforcement and the concrete represents a weak link between both materials due to the increased porosity in this zone [21]. In this state, micro-cracks originate at the tips of the ribs, allowing the reinforcement to slip [22]. Due to the tensile force in the steel, both tangential σt and radial stresses σr are generated by supporting the transversal ribs. The resulting compressive stresses are introduced along the concrete consoles (concrete between the transversal ribs) into the concrete in the form of a compression cone [23]. Between the compressive stresses, a tension ring is formed (as displayed in Figure 3). The tensile strength of the concrete must withstand these ring tensile stresses, with mainly the steep and high ribs generating high ring tensile stresses [22]. The concrete cover and the size of the uncracked tensile zone primarily determine the size of the magnitude of the ring tensile stresses. With a further load increase, the ribs then begin to shear the concrete, and as a result, the maximum load-bearing capacity is achieved. Due to the relatively high compressive strength, the shear resistance can be significantly increased until the maximum load has been reached. The shear bond is considered the most effective type of force transfer between the steel and the concrete (see Figure 2). As soon as relative displacements occur, the friction bond is activated in addition to the shear bond. After the shearing of all the concrete consoles, this is the only remaining force transfer mechanism. The friction bond can be affected by the condition of the steel surface (e.g., surface roughness Rq, according to [24]), the roughness of the shear joint surface, or any transverse pressure that may be present [25]. For plain bars, this is the only possibility of force transfer available after the adhesive bond has been destroyed.
Two failure modes can be distinguished. As the load increases, the concrete consoles are destroyed until they shear off completely. A so-called pull-out channel is then formed. The continuous pulling of the steel out of the concrete is characteristic of this failure mode. This failure occurs with a sufficient concrete cover (which is at least three times the bar diameter) or a constriction effect generated by a transverse reinforcement [20]. In the case of an insufficient concrete cover, or a lack of a transverse reinforcement, the formed cracks lead to the splitting of the surrounding concrete. As a result, there is an abrupt decrease in the bond resistance (see Figure 2) [20].
There are numerous factors influencing bond behavior. These can be assigned to the two components steel and concrete, but also to the load or the structural geometry. The geometry of the reinforcing steel, or more precisely the transversal rib geometry, primarily determines the bond behavior [20]. For this purpose, Rehm [20] introduced the ratio of the rib height a to the rib spacing c to classify the possible load transfer. From this, the value of the related rib area fR was developed. This is the ratio between the rib area projected perpendicular to the reinforcement axis FR (normal projection area), and the shell shear area FM between two ribs. In his investigations, Rehm [20] found out that higher forces can be transferred to the concrete with an increasing related rib area. According to Filho et al. [26], the rib height a has the greatest influence on the transferable forces. Accordingly, the standard DIN 488-2 [27] specifies the minimum values (5% quantile values) for fR and guiding values for the a for reinforcing steel bars. With a decreasing c, the fR increases. Martin and Noakowski [25] found out that the initial stiffness rises with an increasing related fR. They also compared plain round bars with a painted surface to reinforcing steels with standard, artificially scarred, or chromium-plated surfaces. Artificial scarring was produced by filing or punching. They determined that the bond resistance decreases for very smooth surfaces. Roughening or artificial scarring of the mill scale surface improved the bond behavior. This was observed at the maximum bond stress and at characteristic points (e.g., τ0.01 or τ0.1). However, no significant difference was found between natural scarring due to corrosion and artificially produced mechanical scarring [25]. Therefore, it was concluded that the bond stress related to the concrete strength depends linearly on the surface roughness and the related fR.
The bond work Wτ is calculated according to Equation (2) by the integral of the bond stress–slip curve, which is marked as the blue area in Figure 2. Besides the bond stress at the characteristic points (τ0.001, τ0.01, or τ0.1), it can be considered as a measure of the system stiffness.
W τ = 0 s i τ d s

1.2. Approach

This study aims to determine the performance of the WAAM reinforcement, and to compare it to the performance of conventionally manufactured reinforcement. Therefore, reinforcement bars were produced with WAAM. Together with the other types of reinforcements, they were tested for their ability to withstand tensile loading and force transfer between the concrete and the reinforcement steel. To accomplish this, tensile tests and surface scans of the bond area were carried out. Following this, pull-out tests were conducted to determine the bond behavior. Explanatory approaches for the bond behavior of the different reinforcement types were derived based on the surface roughness measured with the surface scans. In addition to the reinforcement specimens (rebars and threaded rods), plain round bars were investigated regarding their bond strength.

2. Materials and Methods

2.1. Materials

The bond behavior of the WAAM reinforcements was investigated through conducting pull-out tests according to RILEM [19]. In addition, a classification of commonly used reinforcement types was carried out. For this purpose, four different reinforcement types were used:
  • Reinforcing steel bars B500B (B500B) [27];
  • Plain bars S355J2 (S355) [28];
  • Galvanized threaded rods with a strength class of 8.8 (GTR) [29];
  • WAAM reinforcement (WAAM).
To ensure comparability, the same nominal diameter of 12 mm was used for all the series. Five tensile tests and five pull-out tests were performed for each conventional reinforcement type (B500B, S355, and GTR). For a larger database of the new material, 15 tensile tests and 5 pull-out tests of the WAAM reinforcement were carried out. The latter were produced in two series with the same parameters (Table 1). The pull-out specimens were also produced in two series with the same concrete recipe. B500B and S355 were used in the first pull-out test series, followed by GTR and WAAM in the second pull-out series.

2.2. WAAM Production
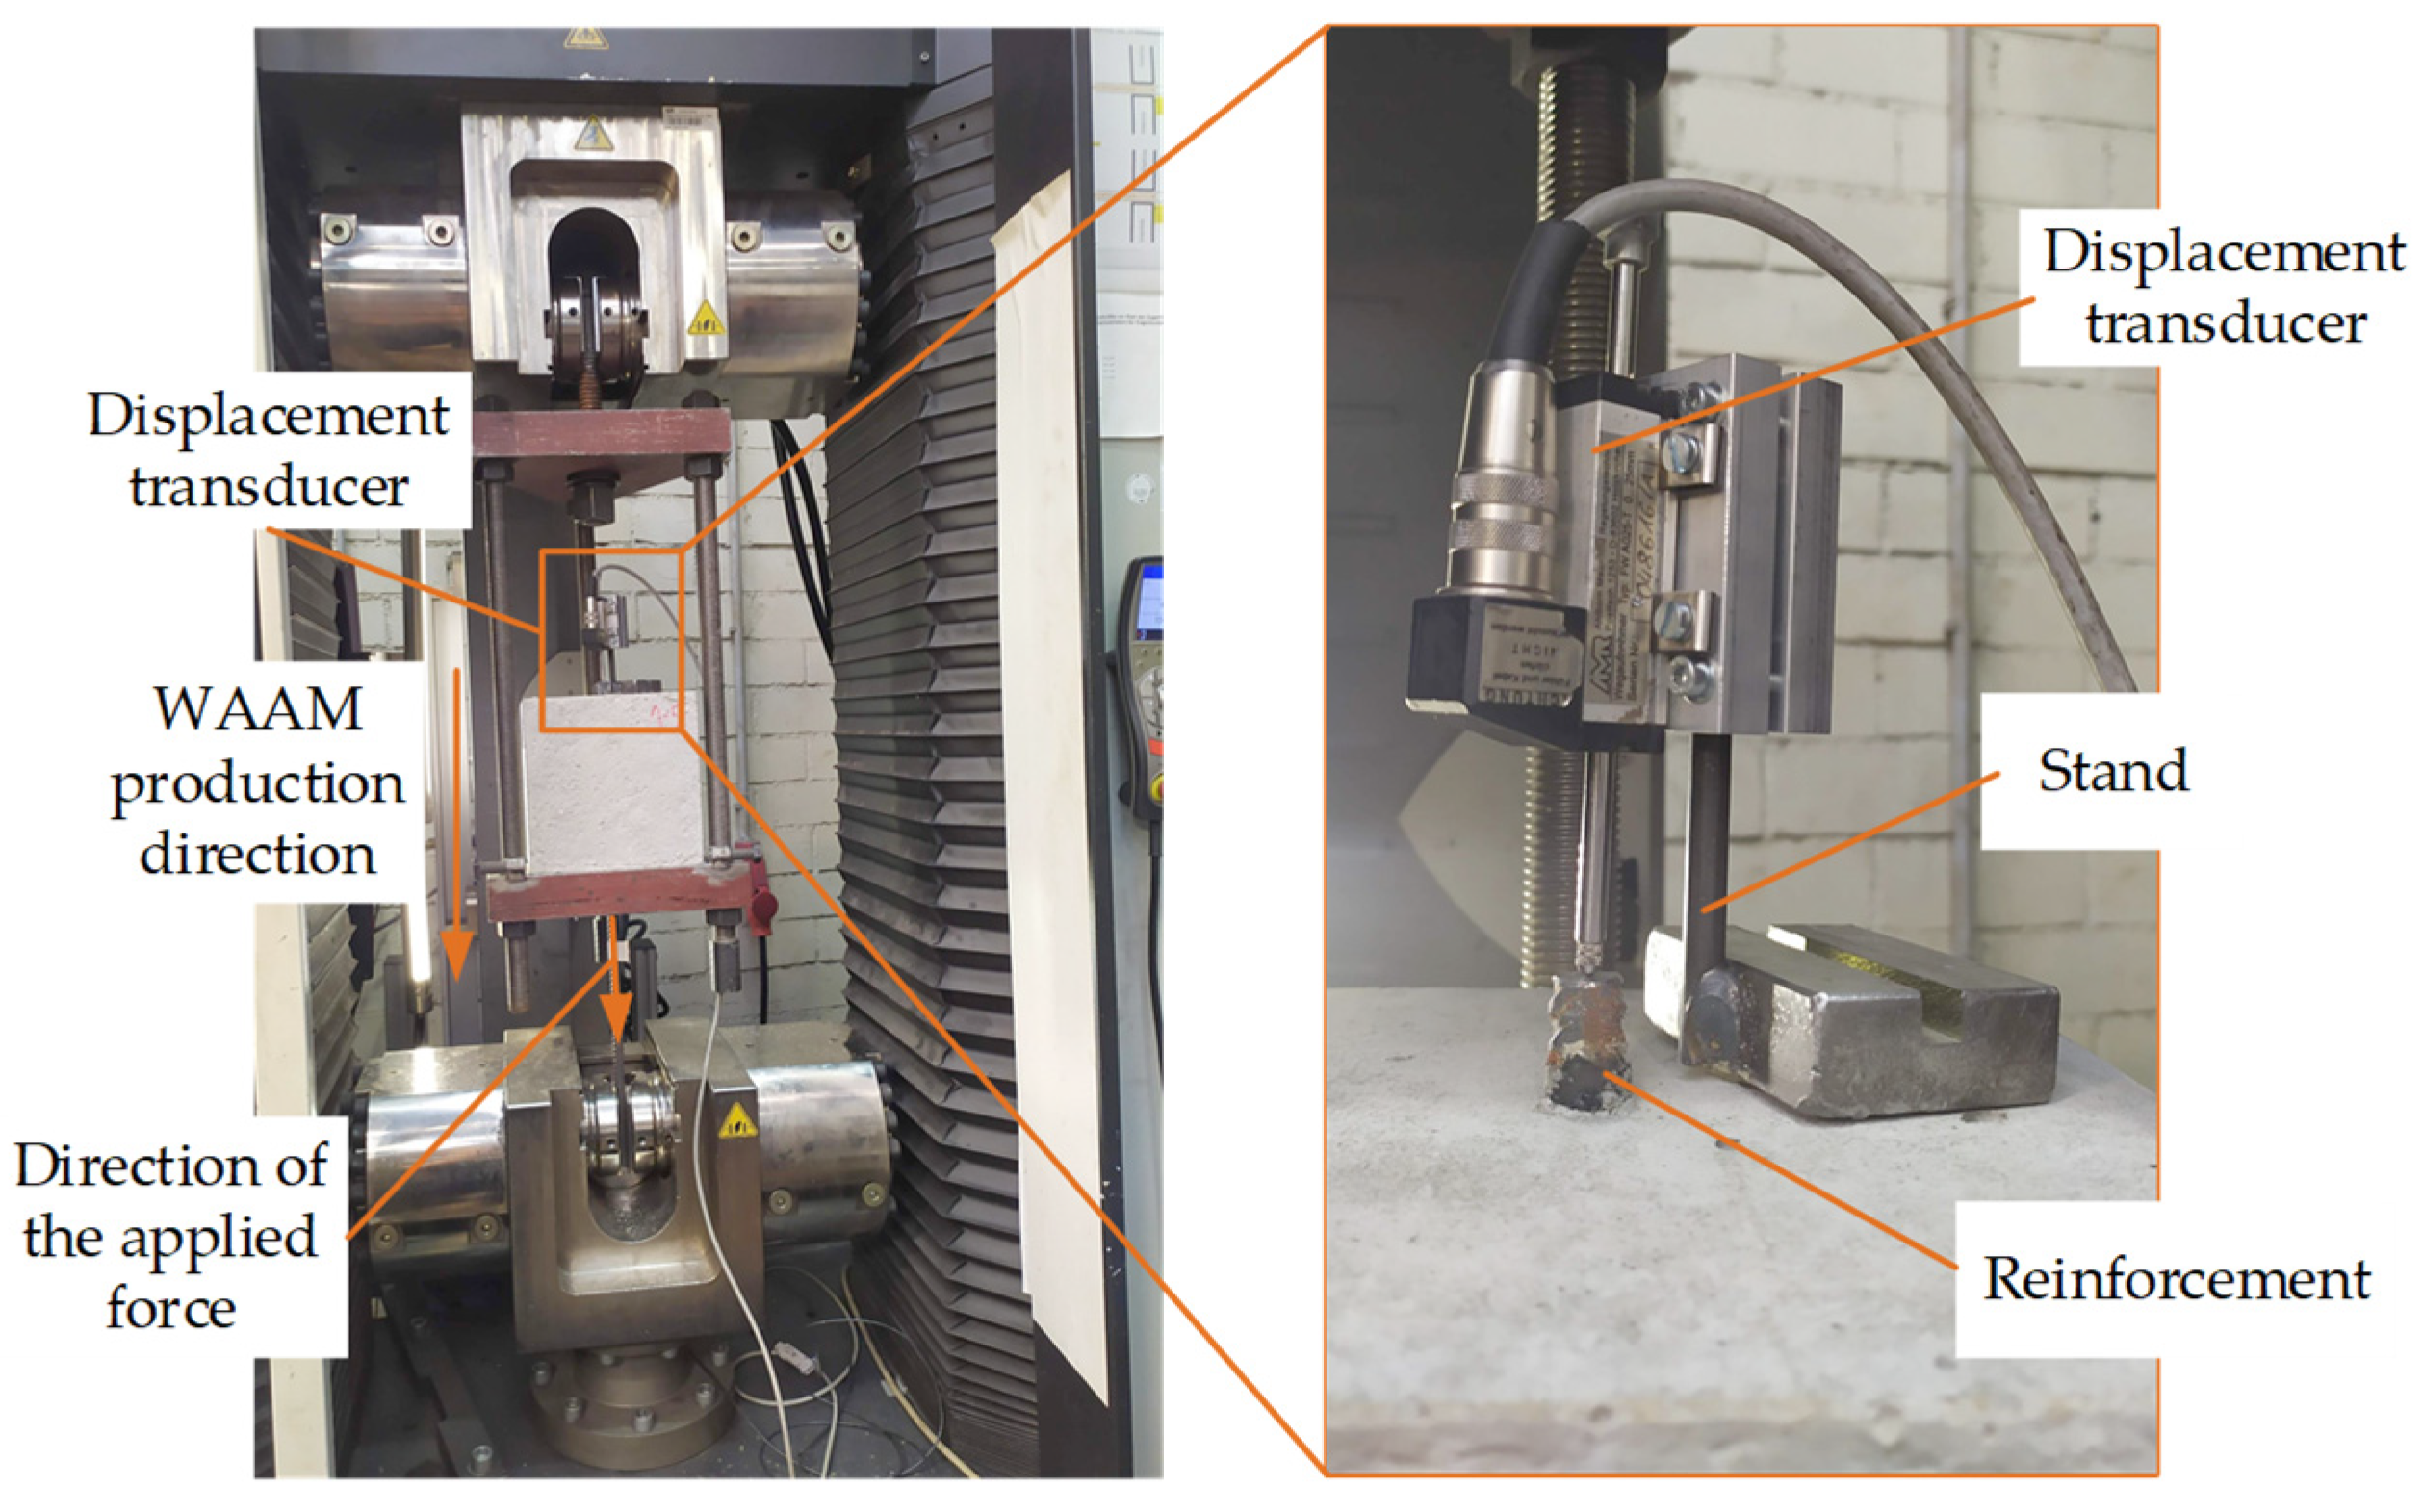
The WAAM reinforcements were produced using the CMT cycle step process. A Fronius TPS400i (Fronius, Wels, Austria) was used as the welding power source. The position of the welding torch was manipulated by an industrial robot of the type Motoman MH24 (Yaskawa, Kitakyushu, Japan). A plate consisting of the mild steel S235JR was used as the substrate. Ten WAAM bars were manufactured simultaneously (see Figure 4) with a solid wire electrode made of G4Si1 in accordance with DIN EN ISO 14341 [30]. Each bar had a length of 600 mm to fulfill the requirements of the free length for the tensile tests [31] and the pull-out tests [19]. The specimens were used for tensile or pull-out testing. M21-ArC-18 was used as an inert gas in accordance with DIN EN ISO 14175 [32]. The stick-out was adaptively controlled and, if necessary, manually corrected every 200 mm of the printed height. A continuous strategy with a circular welding trajectory as used by Weger et al. [4] and described in Section 1.1.1 was deployed. The circular trajectories were welded with a welding speed of 0.25 m/min as listed in Table 1. The starting point of each layer was always chosen with an offset of 90° to the layer below. The bars were cut from the steel plate by an angle grinder after complete cooling. Table 1 shows the applied process parameters.

2.3. Tensile Tests

The tensile tests were carried out in accordance with DIN EN ISO 15630-1 [31]. For this purpose, five specimens of each series were mounted in a Zwick Z600 (ZwickRoell, Ulm, Germany). A videoXtens (ZwickRoell, Germany) optical extensometer recorded the strain. The test speeds were set according to [33]. A force-controlled load of 30 (N/mm2)/s was applied until the upper yield strength Re,H was reached. Following this, a strain-controlled load of 0.00025 s−1 was applied. The Young’s modulus was determined by regression between 100 and 300 N/mm2.

2.4. Pull-Out Tests

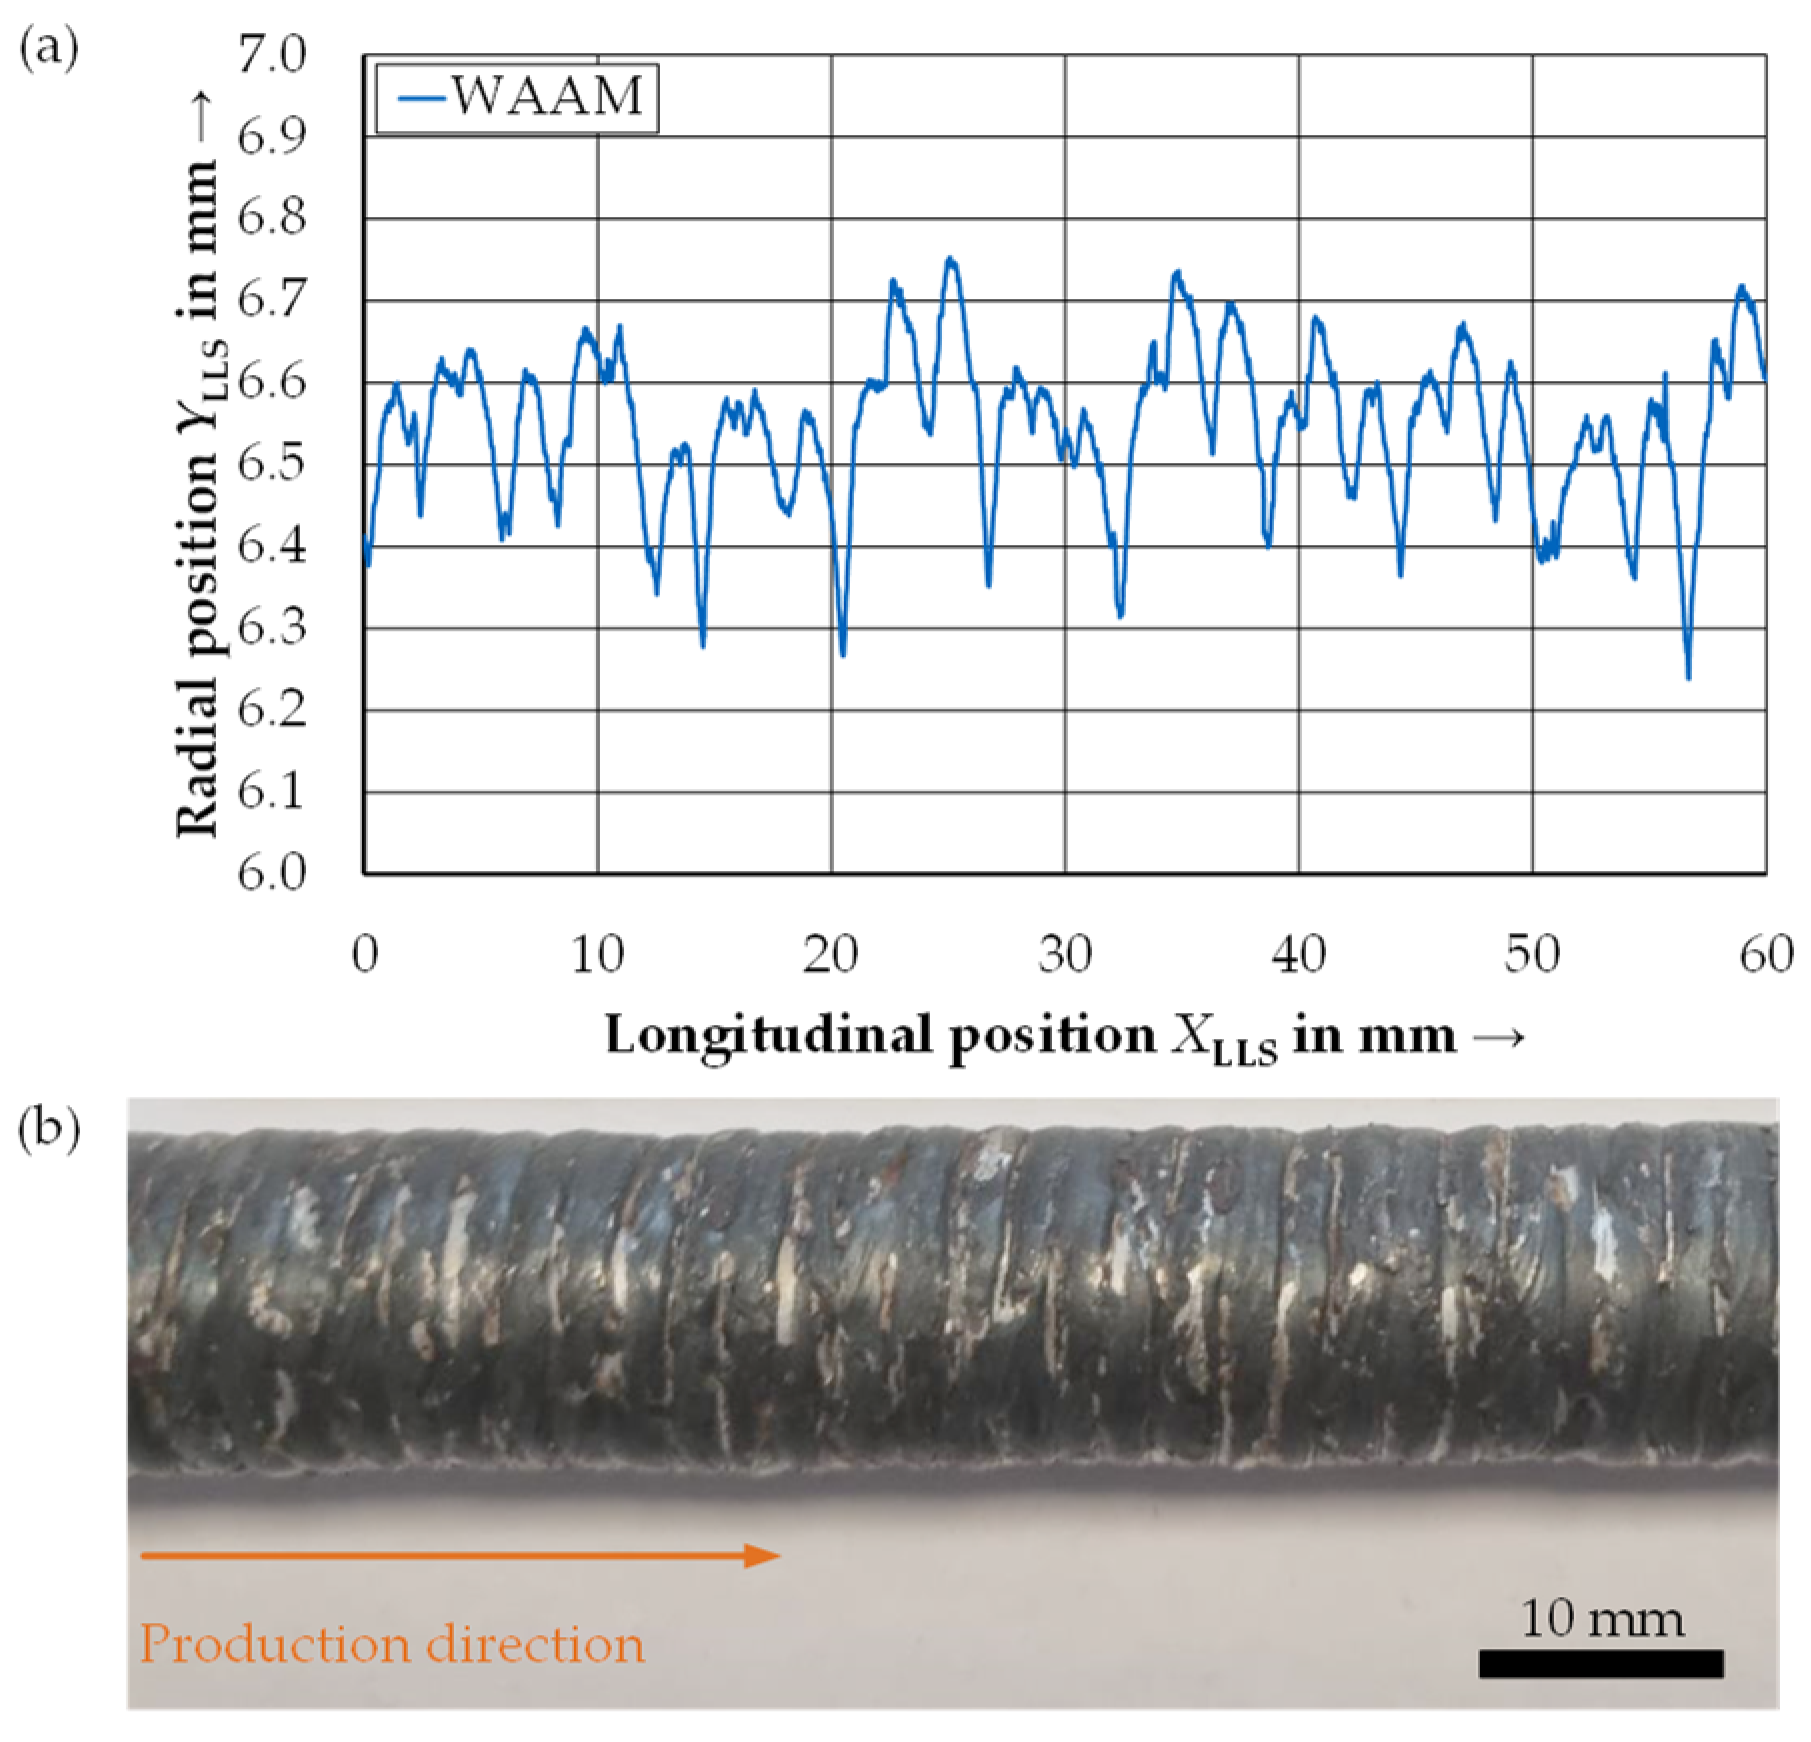
2.4.1. Characterization of the Reinforcements

In the first step, the surface of the reinforcement in the bond area of all the pull-out specimens was scanned using a laser-based line scan (LLS) measuring system, which was developed at the cbm (TUM, Munich, Germany). For the LLS, the same setup as described in [34] was used. The whole circumference was digitalized to precisely analyze the surface (e.g., related rib area fR, and surface roughness Rq). Therefore, a very small quadratic measuring grid was utilized with a step width of 0.01885 mm in the axial and the circumferential directions, respectively.

2.4.2. Formwork Construction and Concreting

Five pull-out specimens were built for each reinforcement type as according to RILEM [19]. The reinforcement was positioned in the middle of the cube with an edge length of 200 mm to avoid a premature splitting of the concrete. With a nominal diameter ds of 12 mm, the bond length was 60 mm (=5·ds) for every reinforcement type. The remaining length of 140 mm was isolated from the concrete by a plastic tube. A flowable normal concrete C 30/37 with an ordinary Portland cement (CEM I 42.5 N), a water-to-cement ratio of 0.6, and gravel with the steady grain size distribution B16 as according to [35] were all used. The slump [36] and the air void content [37] were determined in order to analyze the fresh concrete properties. The concrete was poured into the pull-out modules in two layers and then compacted for 30 s using a vibrating table at 30 Hz. Besides the pull-out specimens, six cylinders (d = 100 mm and h = 200 mm) for each series were produced to investigate the compressive [38] and splitting tensile strengths [39] at the time of the pull-out tests. All specimens were demolded after 7 days and assessed after 28 days. Over the whole storage duration, the samples were stored under a humid jute scarf and a plastic film at a temperature of 20 °C to avoid the production of shrinkage cracks.

2.4.3. Testing

The tests were carried out in accordance with RILEM [19]. As shown in Figure 5, the specimens were placed vertically on a compression platen in the Zwick Z600. The tension force was then applied at the lower end (see Figure 5). As according to [19], for a ds of 12 mm, the loading rate was accordingly set to 72 N/s. In addition, the displacement transducer FWA025TR (Ahlborn, Germany) with a maximum resolution of 0.001 mm was used to record the slip. The console of the FWA025TR was mounted on a stand, which was glued to the concrete specimen with epoxy, and the tip was attached to the unloaded upper end of the reinforcement. For each specimen, the load was applied until reaching bond failure.

2.4.4. Inspection of the Tested Specimens

In order to be able to examine the bond zone (e.g., investigation of the porosity of the ITZ) after the pull-out test, all specimens were opened by sawing. For this purpose, the concrete was cut 80 mm deep on both sides along the bar axis to not destroy the bond zone. A chisel was applied to these incisions. As a result of the leverage effect, the concrete was able to be broken up without damaging the bond zone, and the bond zone was then made visible for inspection.

3. Results and Discussion

3.1. Reinforcement Characterization

Five tensile tests were performed for each conventional reinforcement type and fifteen tests were conducted for the WAAM reinforcement. Table 2 shows the results with the minimum and maximum values of the upper yield strength (Re,H), yield strength at 0.2% plastic deformation (Rp0.2), tensile strength (Rm), and uniform elongation (Agt). The stress values were calculated using the ideal cross-section. The cross-sectional area was calculated by measuring the length and the weight of the reinforcements, and assuming an ideal density ρ of 7.85 kg/dm3 along with an ideal circular cross-section. Regarding the WAAM samples of production series one, only one specimen is listed in Table 2. Two specimens failed before reaching Re,H, and two samples failed before reaching Rm. All fractures originated in the clamping area and, thus, had to be subsequently withdrawn. For all the tests, the machine settings for the reinforcing steel were used. It was assumed that the clamping pressure specified in the settings had led to the premature failure (i.e., an invalid result). Therefore, the clamping pressure was reduced for test series two. In this test series, no further fracture was observed in the clamping area, with all the fractures having occurred in the free length.
Compared to the reinforcing steel, the plain bars S355 achieved a lower Re,H and Rm, but also a higher ductility. The plain bars consisted of a ferrite/pearlite microstructure, whereas the reinforcing steel bar possessed an outer martensite ring due to the Tempcore® process [40]. The results were in good agreement with the literature, where ferrite/pearlite microstructures demonstrated a lower strength and a higher ductility than the martensitic microstructure [41]. The cold-formed threaded rods did not show a distinct yield strength. Therefore, Rp0.2 was calculated. The measured elongation of the GTR samples indicated a smaller ductility compared to the other specimens. The WAAM reinforcement achieved the lowest Re,H and Rm compared to the other reinforcement types. Both test series showed comparable results in terms of the mechanical properties. The measured mechanical properties of the WAAM reinforcements were in good agreement with the results of Mechtcherine et al. [15]. They obtained an average Rp0.2 of 306.99 N/mm2 and an average Rm of 526.10 N/mm2. Despite a clearly recognizable distinct yield strength in the stress-strain diagram, Rp0.2 is given in [15] since a comparison is made there with a cold-formed reinforcing steel. Compared to the strength of the concrete used for the pull-out tests (Section 3.2), it was assumed that the reinforcement elements were only loaded below the Re,H, and Rp0.2, respectively. Furthermore, the WAAM reinforcement showed a comparable ductility to S355. However, only one result could be used for the WAAM characterization.
The fR (B500B and GTR) and the surface roughness Rq (S355, GTR, and WAAM) were determined using the LLS data. Therefore, the whole bond area was able to be observed. Table 3 lists the range of the respective values. The fR could not be determined for WAAM and S355, as a regular ribbing was necessary for the calculation. For B500B, only the roughness on the top of the ribs was decisive for the friction bond, which could not be reliably analyzed. Consequently, Rq could not be calculated for B500B. The entire thread was used to determine the surface roughness of the GTR, which accounts for the high roughness values compared to the other reinforcement types. Figure 6 shows the surface profile of one line scan of the WAAM reinforcement (Figure 6a) and its surface (Figure 6b). For clarity, both images were scaled the same.

3.2. Concrete Characterization
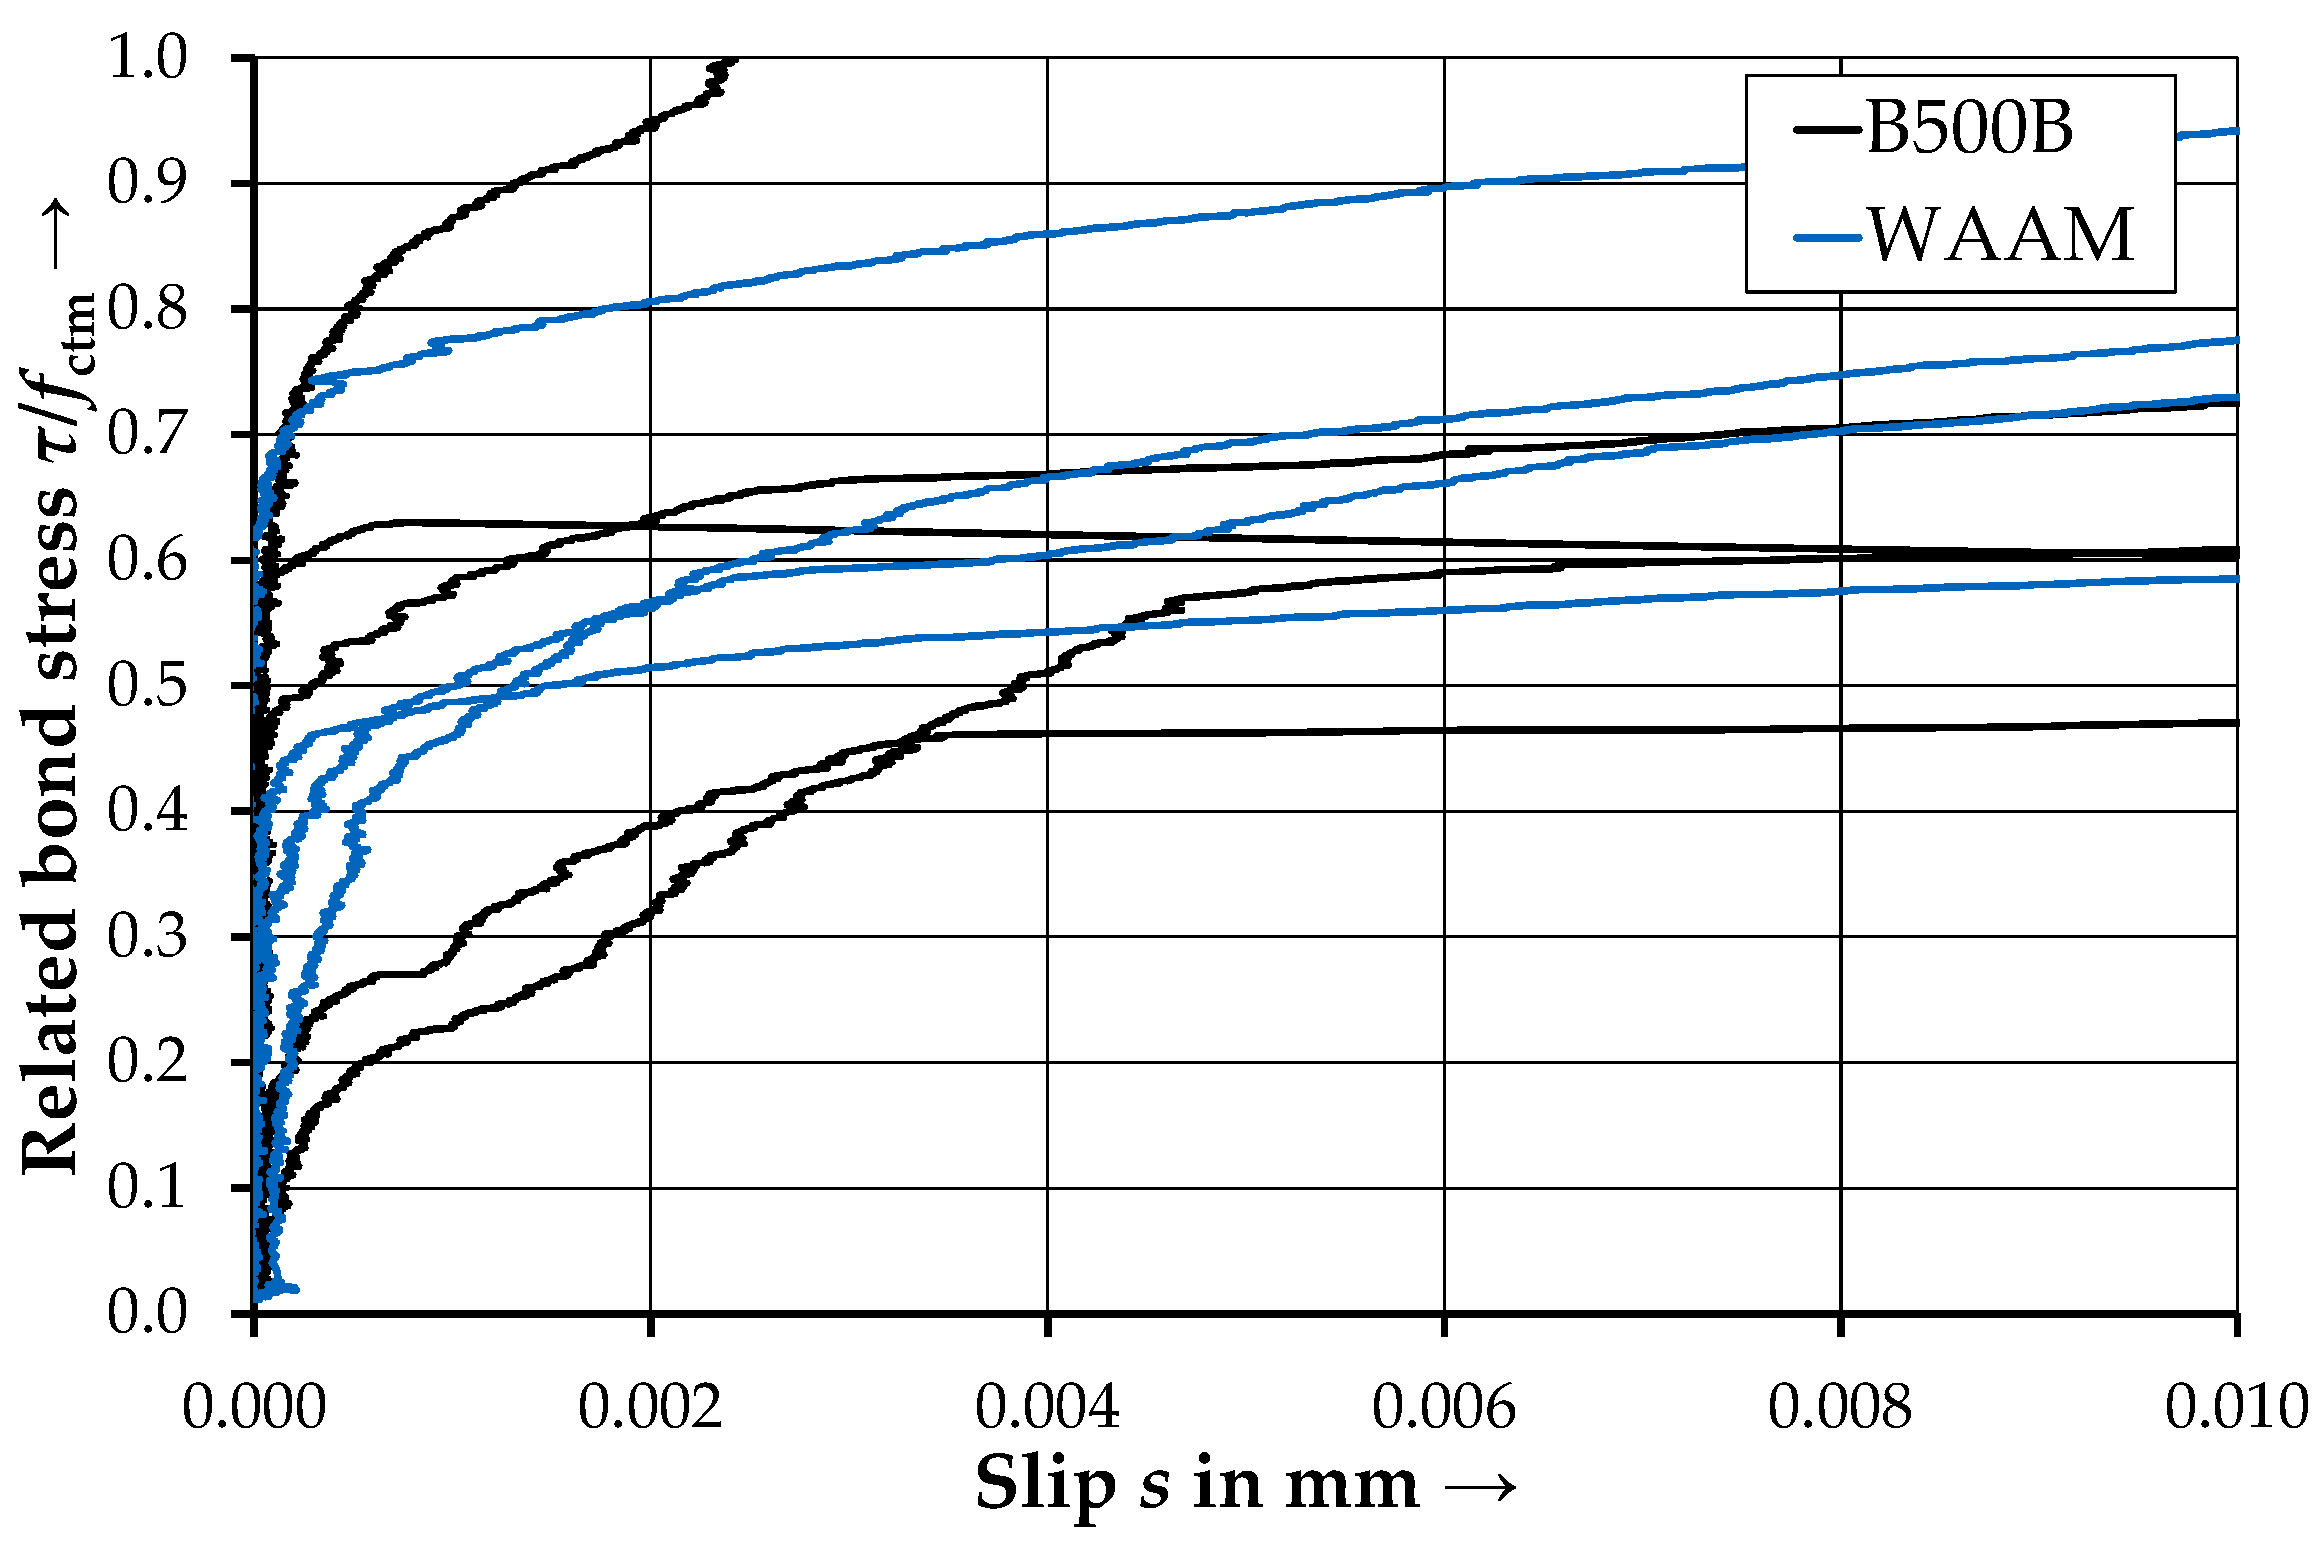
Table 4 lists the decisive fresh and hardened concrete properties for both pull-out series. The values given for the fresh concrete temperature, the compressive strength, and the splitting tensile strength are the mean values calculated from three measurements each. The slump, the fresh concrete density, and the air void content were determined with one measurement each. The small deviations indicated a good comparability of both production series, especially concerning the hardened concrete properties.

3.3. Bond Behavior

Five pull-out tests were carried out for each reinforcement type. One pull-out test of the WAAM series could not be evaluated due to negative slip values. It was assumed that the epoxy used as the glue to adhere the displacement transducer was not completely hardened, thereby leading to a negative slip due to shrinkage. For comparability, the bond stresses, calculated by Equation (1), were related to the splitting tensile strength fctm of the respective concrete series. Figure 7a shows the related bond stress-slip curves of all the specimens. All S355 specimens showed very low bond stresses due to their plain surface. After the adhesive bond was destroyed, only the friction bond remained. The GTR specimens showed the highest maximum bond stresses τmax with very low slip values at the same time. The reinforcing steel bars and the WAAM reinforcement displayed an almost similar behavior, with the maximum bond stresses tending to be slightly higher for the reinforcing steel bars. The inspection of the bond zone after testing revealed no conspicuities regarding an increased porosity. For all the reinforcement types (except S355), the sheared concrete consoles were visible (see Figure 7b).
In the next step, the aforementioned assumption of an elastic behavior of the reinforcements in the pull-out test was validated. To determine the load capacity, the forces occurring at every τmax were divided by the forces measured at Re,H,mean and Rp0.2,mean (Table 2), respectively. For the WAAM reinforcement, the mean value was taken from both test series. The mean values of the load capacity are given in Table 5. All the obtained values were below 100%, which confirms the assumption of an elastic behavior of the reinforcements. Although the WAAM reinforcement showed the lowest mechanical properties (Re,H and Rm), failure was always observed in the bond zone.
Figure 8 shows the bond stress-slip behavior of all the single WAAM and B500B specimens in the first 10 µm. For four out of five reinforcing steels of the type B500B, a substantial slip increase could be observed at or shortly after the destruction of the adhesive bond (forming an almost horizontal gradient in the bond stress-slip curve, as shown in Figure 8). In contrast, the transition for the WAAM reinforcement was found to be much smoother. After the destruction of the adhesive bond, the transverse ribs began to load the surrounding concrete. The interfacial transition zone (ITZ) between the steel and the concrete was deformed first. This zone is typically considered the weakest link due to its increased porosity [21]. It was assumed that the uniform and the regularly arranged transversal ribs of the reinforcing steel provide uniform stress transfer to the concrete along the entire bond length. A possible consequence of the uniform loading of the ITZ could therefore be a sudden failure. In contrast, the WAAM reinforcement was found to have a comparatively irregular surface. This probably led to a comparatively more irregular force insertion into the surrounding concrete. As a possible consequence, the ITZ gradually failed, depending on the load capacity of the respective area.
The surface roughness Rq was used to classify the bond behavior of the WAAM reinforcement in comparison to the S355 and the GTR samples. Figure 9 shows the related maximum bond stress τmax/fctm against the surface roughness Rq. With an increasing surface roughness Rq, higher maximum bond stresses were achieved. The results show a linear relationship across all three reinforcement types with a logarithmic scaling of the surface roughness. In [42], investigations were carried out on the bond behavior of plain S355 round bars with a different surface roughness (e.g., mill scale artificially roughened by sandblasting). Those results can be placed in the above-mentioned context.
Figure 10 shows the bond work Wτ (calculated by Equation (2)) for the characteristic slip values s0.001, s0.01, s0.1, and s(τmax). The minimum, maximum, and mean values were depicted for each series. Both axes were logarithmically scaled, except for s(τmax). The value of s(τmax) was individually determined for every pull-out test. For better comparability, s(τmax) represents the slip value of all the maximum bond stresses shown in Figure 10.
For the S355 series, no value for s(τmax) exists since τmax was already reached at a slip between 0.001 mm and 0.01 mm in all the pull-out tests.
The GTR specimens had a high initial stiffness due to their high related rib area fR, which was reflected in a high bond work at low slip values. This was in good agreement with the results from the literature [25]. Compared to the other three reinforcement types, the GTR was machined by metal cutting of an existing cold-formed raw material. As a result, it had the highest surface uniformity. After overcoming the initial effects (destruction of the ITZ), it was assumed that this led to a uniform force transfer into the concrete. After reaching a slip of 0.1 mm, the bond work was only able to be increased slightly. This could be attributed to the small spacing of the individual threads of only 1.75 mm (of the standard M12 thread). Consequently, no, or only small concrete consoles could be formed in the intermediate space, which fail more easily under shear when the load increases.
The B500B and WAAM reinforcements had approximately the same initial stiffness. The B500B had comparatively broader spread values for Wτ at a slip of 0.001 mm. This is compatible with the results shown in Figure 8, which resulted in a sharp increase in slip for the reinforcing steel following the destruction of the adhesive bond. The transition from the adhesive bond to the shear bond was more uniform for the WAAM reinforcement, which was reflected in a lower scatter. In the following, both curves showed an approximately congruent course with respect to the bond work and the existing scatter of the results. At τmax, however, an increase in the scatter was observed for the WAAM reinforcement. This was also attributed to the different surface geometry, which in the case of the B500B, had a higher repeatability due to the regularly arranged transverse ribs. This presumably also led to a lower scatter at Wτ,max. In contrast to the sickle-shaped transverse rib with two longitudinal ribs of the B500B as according to DIN 488-2 [27], the WAAM reinforcement showed the shape of a circumferential thread accompanied by low surface elevations as a result of the manufacturing process. The latter was visible in the geometry, with the starting point of each layer always being offset by 90° to the layer below. This may have led to a more uniform force transfer into the concrete over the complete circumference, thereby yielding a high bond work.

4. Conclusions and Outlook

In this study, reinforcements produced by WAAM were investigated. This reinforcement type was compared with alternative reinforcement elements, such as reinforcing steel bars, galvanized threaded rods, and plain bars. For this purpose, the surface was scanned by a laser-based line scan measuring system to investigate the surface topology. In the next step, pull-out test specimens were produced to unveil the bond behavior. The following findings can be emphasized:
  • The reinforcements produced by WAAM showed a similar pull-out behavior as the used reinforcing steel bar. This was particularly evident in the bond stresses achieved at the characteristic slip values of 0.001, 0.01, and 0.1 mm, respectively, which were all at comparable levels. After the destruction of the adhesive bond, a sudden increase in the slip was observed in four of five reinforcing steel bars but did not arise for the WAAM reinforcement.
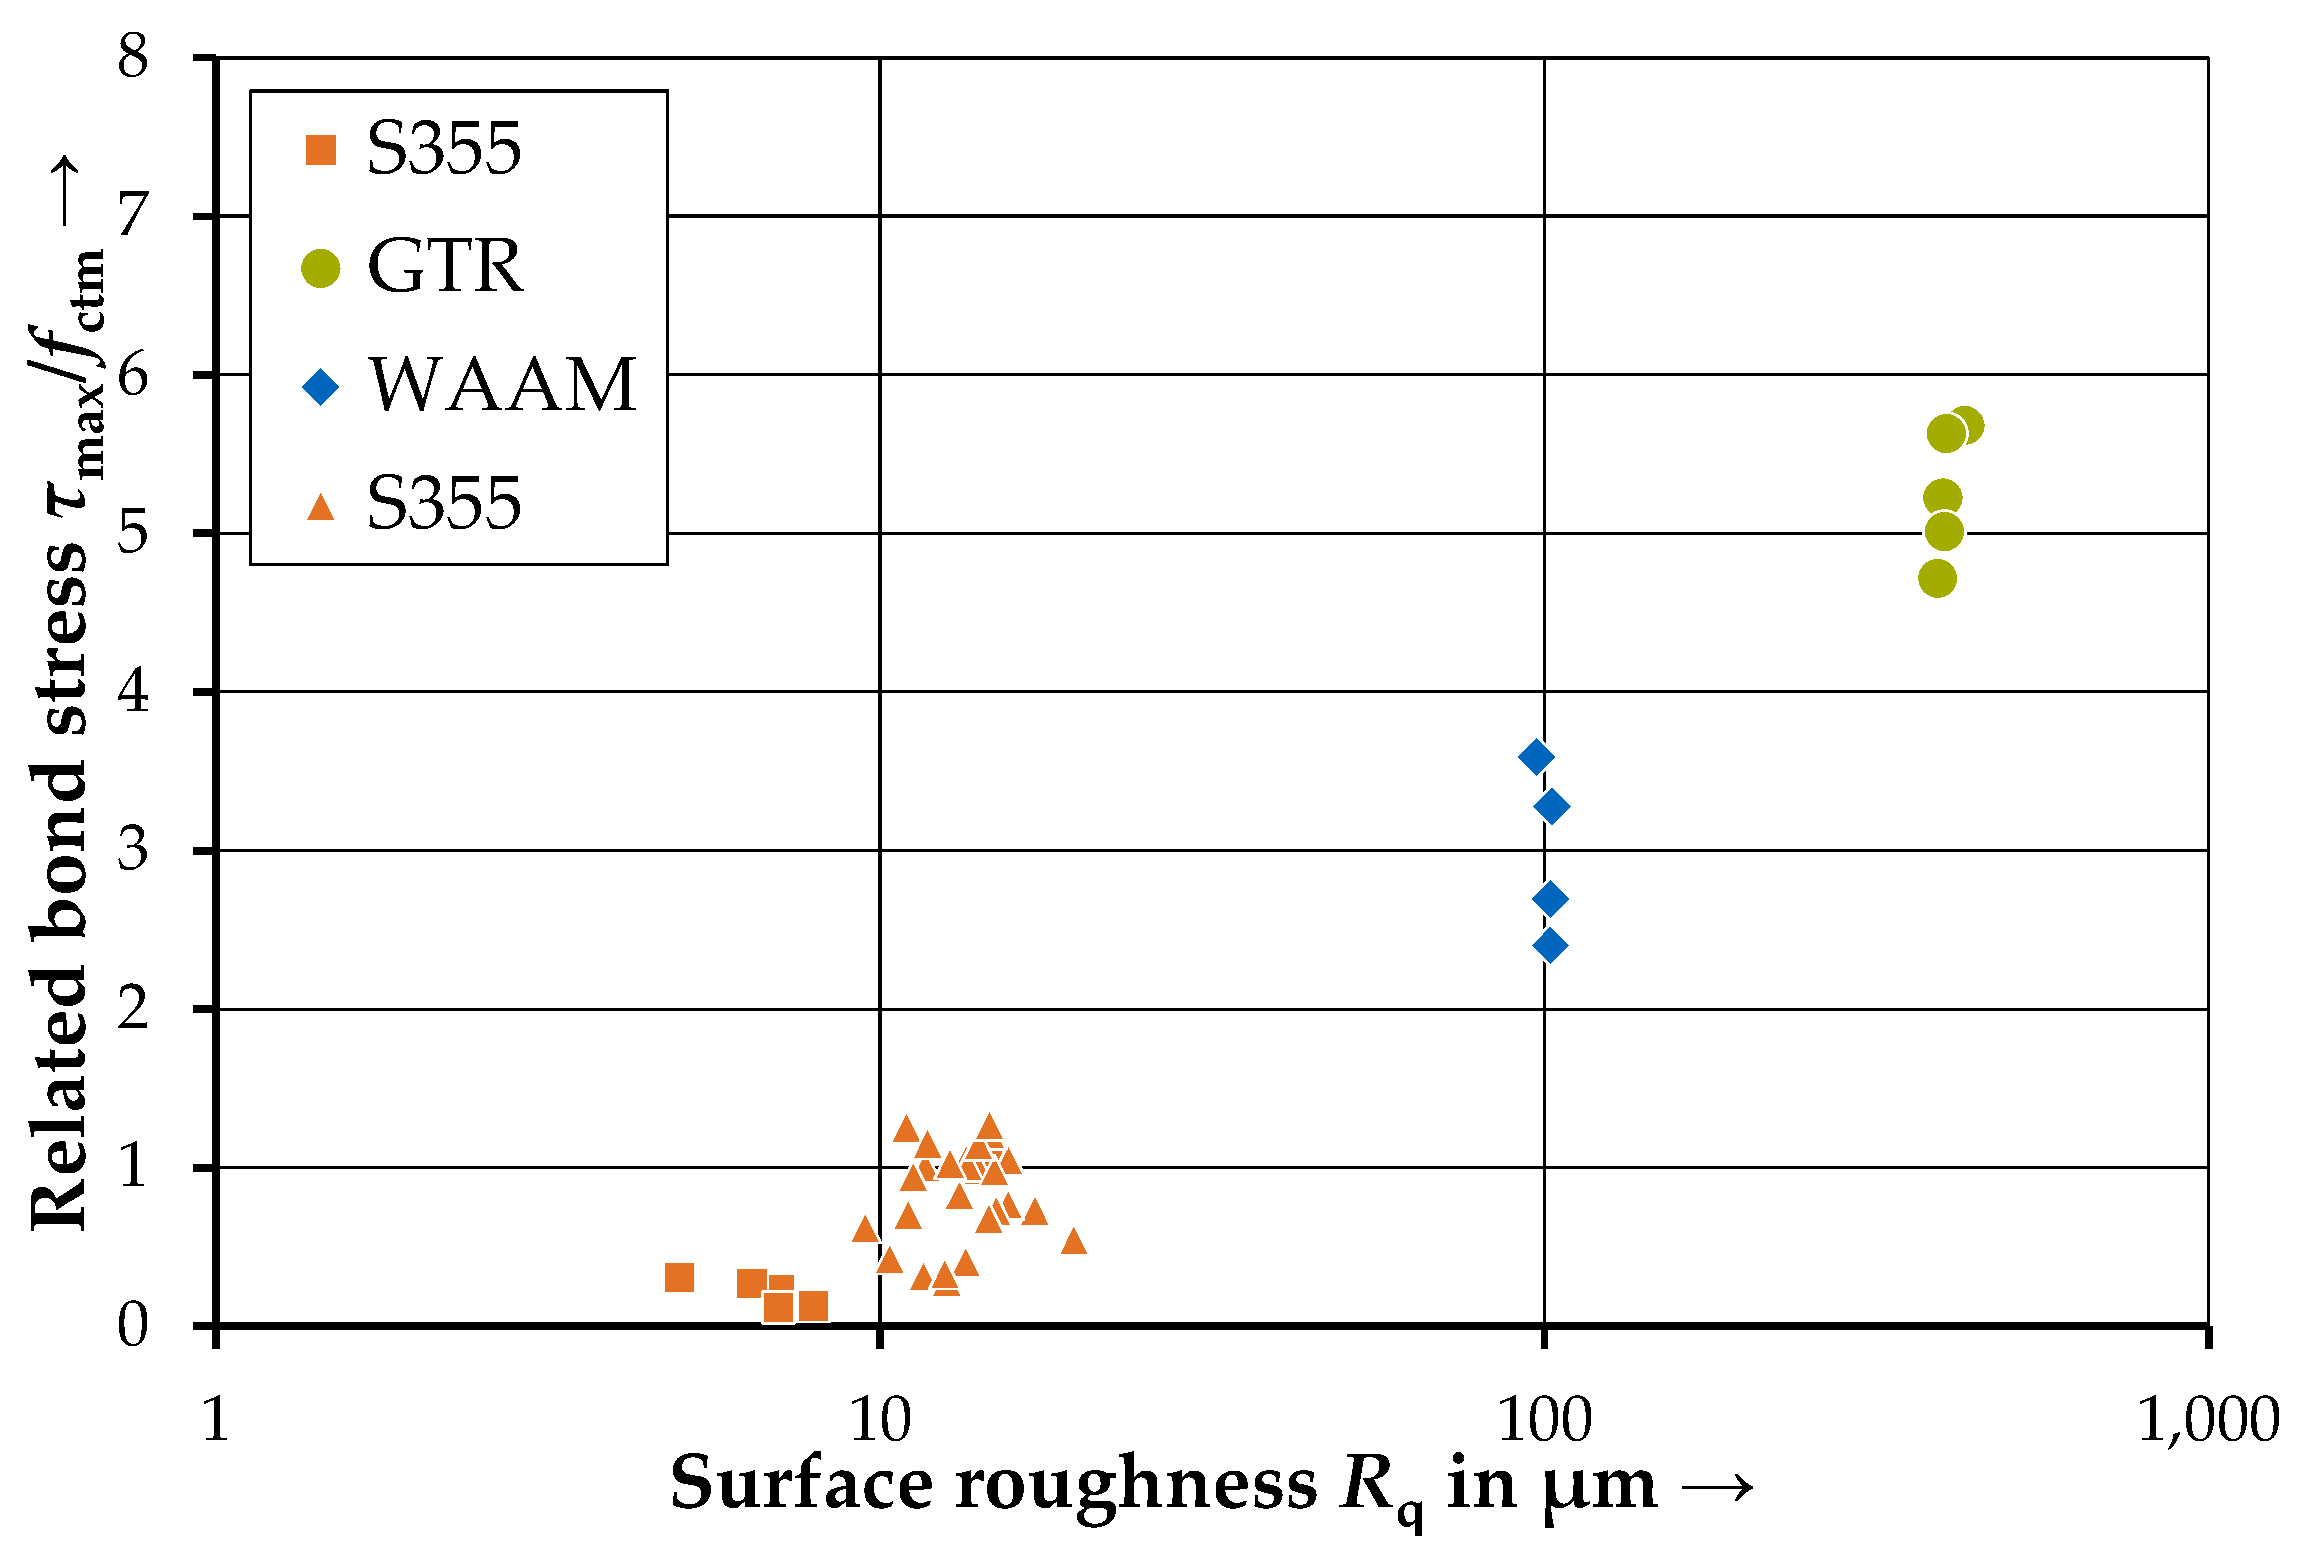
  • A comparison of the maximum bond stresses τmax achieved for the WAAM reinforcements, plain bars, and the threaded rods showed a linear relationship in a logarithmic scaling of the surface roughness Rq. With an increasing surface roughness, higher maximum bond stresses were achieved.
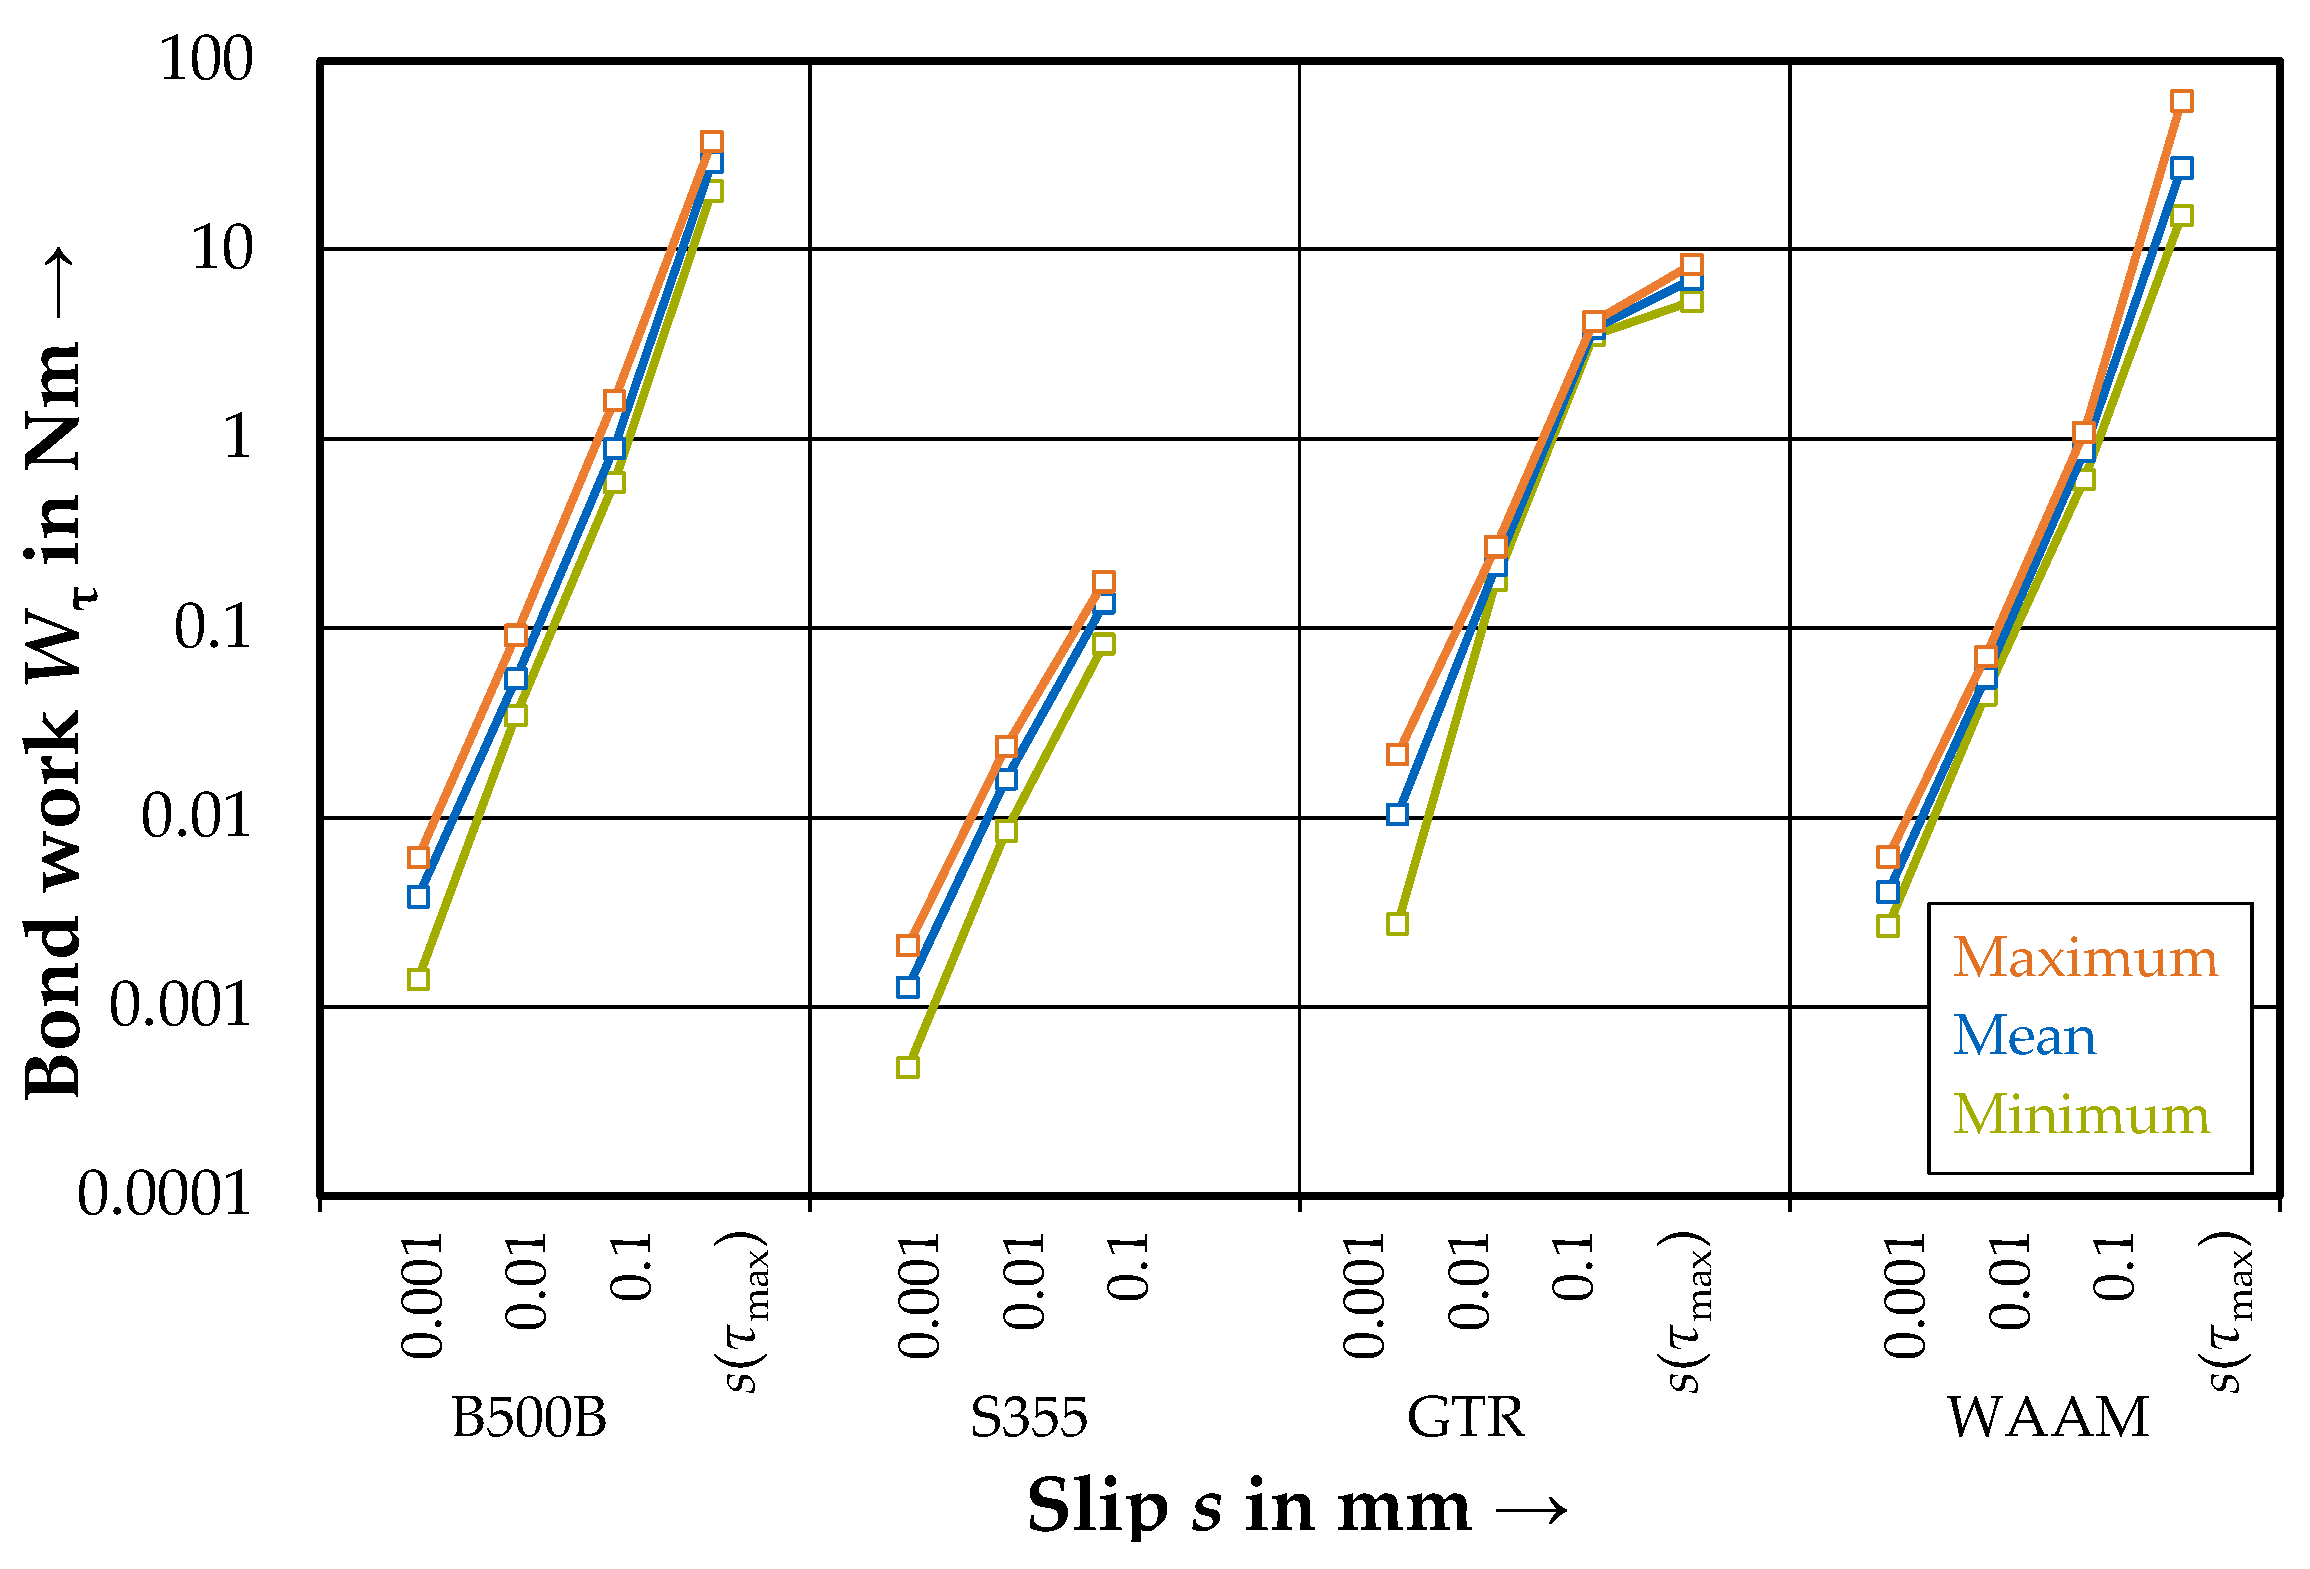
  • Concerning the bond work Wτ, the highest initial stiffness was observed for the threaded rods, whereas the plain bars represented the lower limit within this study. Reinforcing steel bars and WAAM reinforcements showed a similar course of the bond work at the characteristic points, whereby the WAAM reinforcement showed a smaller scattering of the values.
The use of the WAAM reinforcements in civil engineering is a promising area of research. Further investigations must be carried out. For instance, the durability of WAAM-reinforced concrete, and the bond behavior of WAAM in concrete printed by SPI have yet to be analyzed. Furthermore, the effect of temperatures induced by WAAM on the properties of SPI-printed concrete and, thus, on the bond behavior is currently being investigated. Additionally, further research should be conducted on mapping the WAAM surfaces to the related rib area fR. This value could then be used to precisely adjust the bond properties in different loaded areas. Additionally, an intentional modulation of the reinforcement surfaces produced with WAAM has the potential to increase fR and, therefore, the bond strength.

Author Contributions

Conceptualization, K.T., S.R. and K.O.; resources, S.R., F.R. and A.S.; writing—original draft preparation, K.T., S.R., F.R. and A.S.; writing—review and editing, K.T., S.R., F.R., A.S., K.O., T.K., S.B., M.F.Z. and C.G.; visualization, K.T., S.R. and K.O.; supervision, K.O., T.K., S.B., M.F.Z. and C.G.; project administration, T.K., S.B., M.F.Z. and C.G.; funding acquisition, M.F.Z. and C.G. All authors have read and agreed to the published version of the manuscript.

Funding

This research was funded by the Deutsche Forschungsgemeinschaft (DFG, German Research Foundation)—Project number 414265976—TRR 277.

Data Availability Statement

Data are available from the authors on reasonable request.

Conflicts of Interest

The funders had no role in the design of the study; in the collection, analyzes, or interpretation of the data; in the writing of the manuscript; or in the decision to publish the results.

References

  1. Bos, F.P.; Menna, C.; Pradena, M.; Kreiger, E.; Leal da Silva, W.R.; Rehman, A.U.; Weger, D.; Wolfs, R.J.M.; Zhang, Y.; Ferrara, L.; et al. The realities of additively manufactured concrete structures in practice. Cem. Concr. Res. 2022, 156, 106746. [Google Scholar] [CrossRef]
  2. Meibodi, M.; Bernhard, M.; Jipa, A.; Dillenburger, B. The Smart Takes from the Strong: 3D printing stay-in-place formwork for concrete slab construction. In Fabricate 2017; Glynn, R., Sheil, B., Menges, A., Skavara, M., Lee, E., Eds.; UCL Press: London, UK, 2017; pp. 210–218. [Google Scholar]
  3. Mechtcherine, V.; Buswell, R.; Kloft, H.; Bos, F.P.; Hack, N.; Wolfs, R.; Sanjayan, J.; Nematollahi, B.; Ivaniuk, E.; Neef, T. Integrating reinforcement in digital fabrication with concrete: A review and classification framework. Cem. Concr. Compos. 2021, 119, 103964. [Google Scholar] [CrossRef]
  4. Weger, D. Additive Manufacturing of Concrete Structures by Selective Paste Intrusion—SPI. Ph.D. Thesis, TU München, Munich, Germany, 2020. [Google Scholar]
  5. Weger, D.; Baier, D.; Straßer, A.; Prottung, S.; Kränkel, T.; Bachmann, A.; Gehlen, C.; Zaeh, M.F. Reinforced Particle-Bed Printing by Combination of the Selective Paste Intrusion Method with Wire and Arc Additive Manufacturing—A First Feasibility Study. In Proceedings of the Second RILEM International Conference on Concrete and Digital Fabrication, DC 2020, Online, 6–8 July 2020; RILEM Bookseries. Springer: Cham, Switzerland, 2020; Volume 28. [Google Scholar] [CrossRef]
  6. DIN EN ISO/ASTM 52900:2022-03; Additive Manufacturing—General Principles—Fundamentals and Vocabulary (ISO/ASTM 52900:2021). Beuth Verlag: Berlin, Germany, 2022. [CrossRef]
  7. Schuler, V.; Twrdek, J. Praxiswissen Schweißtechnik. In Werkstoffe, Prozesse, Fertigung, 6th ed.; Springer: Wiesbaden, Germany, 2019. [Google Scholar] [CrossRef]
  8. Bruckner, J. Schweißpraxis Aktuell: CMT-Technologie. In Cold Metal Transfer—Ein Neuer Metall-Schutzgas-Schweißprozess; WEKA-Media: Kissing, Germany, 2013; ISBN 978-3-8111-6879-4. [Google Scholar]
  9. Ariza, I.; Mirjan, A.; Gandia, A.; Casas, G.; Cros, S.; Gramazio, F.; Kohler, M. In place detailing: Combining 3D printing and robotic assembly. In ACADIA 2018 Recalibration: On Imprecision and Infidelity, Proceedings of the 38th Annual Conference of the Association for Computer Aided Design in Architecture, Mexico City, Mexico, 18–20 October 2018; Anzalone, P., Del Signore, M., Wit, A.J., Eds.; ACADIA: Fargo, ND, USA, 2018; pp. 312–321. [Google Scholar]
  10. Mitropoulou, I.; Ariza, I.; Bernhard, M.; Dillenburger, B.; Gramazio, F.; Kohler, M. Numerical Sculpting: Volumetric Modelling Tools for In Place Spatial Additive Manufacturing. In Impact: Design with All Senses. DMSB 2019; Gengnagel, C., Baverel, O., Burry, J., Ramsgaard Thomsen, M., Weinzierl, S., Eds.; Springer: Cham, Switzerland, 2020. [Google Scholar] [CrossRef]
  11. Van Bolderen, G. Exploration of Stability of 3D-Printed Steel Members: A Study to Buckling Behaviour of Wire and Arc Additively Manufactured Stainless Steel Tubular Columns. Master’s Thesis, TU Delft, Delft, The Netherlands, 2017. Available online: http://resolver.tudelft.nl/uuid:cf099386-6a89-44f6-849c-0738177e7ea1 (accessed on 10 February 2023).
  12. Laghi, V.; Palermo, M.; Gasparini, G.; Trombetti, T. Computational design and manufacturing of a half-scaled 3D-printed stainless steel diagrid column. Addit. Manuf. 2020, 36, 101505. [Google Scholar] [CrossRef]
  13. Rodrigues, T.A.; Duarte, V.; Miranda, R.M.; Santos, T.G.; Oliveira, J.P. Current Status and Perspectives on Wire and Arc Additive Manufacturing (WAAM). Materials 2019, 12, 1121. [Google Scholar] [CrossRef] [PubMed]
  14. Abe, T.; Sasahara, H. Layer geometry control for the fabrication of lattice structures by wire and arc additive manufacturing. Addit. Manuf. 2019, 28, 639–648. [Google Scholar] [CrossRef]
  15. Mechtcherine, V.; Grafe, J.; Nerella, V.N.; Spaniol, E.; Hertel, M.; Füssel, U. 3D-printed steel reinforcement for digital concrete construction—Manufacture, mechanical properties and bond behaviour. Constr. Build. Mater. 2018, 179, 125–137. [Google Scholar] [CrossRef]
  16. Müller, J.; Grabowski, M.; Müller, C.; Hensel, J.; Unglaub, J.; Thiele, K.; Kloft, H.; Dilger, K. Design and Parameter Identification of Wire and Arc Additively Manufactured (WAAM) Steel Bars for Use in Construction. Metals 2019, 9, 725. [Google Scholar] [CrossRef]
  17. Riegger, F.; Zaeh, M.F. Additive Fertigung von Stahlbewehrungen: Integration von WAAM-Bewehrungen in den Partikelbett-3D-Druck mit der selektiven Zementleim-Intrusion. Z. Wirtsch. Fabr. 2022, 17, 448–451. [Google Scholar] [CrossRef]
  18. Bindseil, P.; Schmitt, M.O.A. Betonstähle vom Beginn des Stahlbetonbaus bis zur Gegenwart; Verlag Bauwesen: Berlin, Germany, 2002. [Google Scholar]
  19. RILEM TC. RC 6 Bond test for reinforcement steel. 2. Pull-out test. In RILEM Recommendations for the Testing and Use of Constructions Materials; E & FN SPON: London, UK, 1994. [Google Scholar] [CrossRef]
  20. Rehm, G. Über die Grundlagen des Verbundes zwischen Stahl und Beton. In Deutscher Ausschuss für Stahlbeton; Ernst & Sohn Verlag: Berlin, Germany, 1961. [Google Scholar]
  21. Scrivener, K.L. Characterisation of the ITZ and its quantification by test methods. In Engineering and Transport Properties of the Interfacial Transition Zone in Cementitious Composites; Alexander, M.G., Arliguie, G., Ballivy, G., Bentur, A., Marchand, J., Eds.; RILEM: Ile-de-France, France, 1999. [Google Scholar]
  22. Tepfers, R.; Achillides, Z.; Azizinamini, A.; Balázs, G.; Vliet, A.B.; Cabrera, J.; Cairns, J. Bond of Reinforcement in Concrete; fib Bulletin No. 10, State-of-art report; Fib: Lausanne, Switzerland, 2000. [Google Scholar] [CrossRef]
  23. Deutsche Forschungsgemeinschaft. Bewehrte Betonbauteile unter Betriebsbedingungen—Forschungsbericht; Eligehausen, R., Kordina, K., Schießl, P., Eds.; Wiley-VCH: Weinheim, Germany, 2000. [Google Scholar]
  24. DIN EN ISO 4287; Geometrical Product Specifications (GPS)—Surface Texture: Profile Method—Terms, Definitions and Surface Texture Parameters (ISO 4287:1997 + Cor 1:1998 + Cor 2:2005 + Amd 1:2009). Beuth Verlag: Berlin, Germany, 2010. [CrossRef]
  25. Martin, H.; Noakowski, P. Verbundverhalten von Betonstählen—Untersuchung auf der Grundlage von Ausziehversuchen. In Vollstöße durch Übergreifung von Zugbeanspruchten Rippenstählen in Normalbeton. Deutscher Ausschuss für Stahlbeton; Beuth Verlag: Berlin, Germany, 1981; Volume 319, pp. 99–175. [Google Scholar] [CrossRef]
  26. Silva Filho, L.C.P.; Vale Silva, B.; Dal Bosco, V.I.; Gomes, L.E.S.; Barbosa, M.P.; Lorrain, M.S. Analysis of the influence of rebar geometry variations on bonding strength in the pull-out test. In Proceedings of the Bond in Concrete 2012: Bond, Anchorage, Detailing—Volume 1: General Aspects of Bond, Brescia, Italy, 17–20 June 2012; Cairns, J.W., Metelli, G., Plizzari, G.A., Eds.; Creations: Brisbane, Australia, 2012. [Google Scholar]
  27. DIN 488-2; Reinforcing Steels—Reinforcing Steel Bars. Beuth Verlag: Berlin, Germany, 2009. [CrossRef]
  28. DIN EN 10025-2; Hot Rolled Products of Structural Steels—Part 2: Technical Delivery Conditions for Non-Alloy Structural Steels. Beuth Verlag: Berlin, Germany, 2020. [CrossRef]
  29. DIN 976-1; Fasteners—Stud Bolts—Part 1: Metric Thread. Beuth Verlag: Berlin, Germany, 2016. [CrossRef]
  30. DIN EN ISO 14341; Welding Consumables—Wire Electrodes and Weld Deposits for Gas Shielded Metal Arc Welding of Non Alloy and Fine Grain Steels—Classification (ISO 14341:2020). Beuth Verlag: Berlin, Germany, 2020. [CrossRef]
  31. DIN EN ISO 15630-1; Steel for the Reinforcement and Prestressing of Concrete—Test Methods—Part 1: Reinforcing Bars, Rods and Wire (ISO 15630-1:2019). Beuth Verlag: Berlin, Germany, 2019. [CrossRef]
  32. DIN EN ISO 14175; Welding Consumables—Gases and Gas Mixtures for Fusion Welding and Allied Processes (ISO 14175:2008). Beuth Verlag: Berlin, Germany, 2008. [CrossRef]
  33. DIN EN ISO 6892-1; Metallic Materials—Tensile Testing—Part 1: Method of Test at Room Temperature (ISO 6892-1:2019). Beuth Verlag: Berlin, Germany, 2020. [CrossRef]
  34. Osterminski, K.; Gehlen, C. Development of a laser-based line scan measurement system for the surface characterization of reinforcing steel. Mater. Test. 2019, 61, 1051–1055. [Google Scholar] [CrossRef]
  35. DIN 1045-2; Concrete, Reinforced and Prestressed Concrete Structures—Part 2: Concrete—Specification, Properties, Production and Conformity—Application Rules for DIN EN 206-1. Beuth Verlag: Berlin, Germany, 2008. [CrossRef]
  36. DIN EN 12350-5; Testing Fresh Concrete—Part 5: Flow Table Test. Beuth Verlag: Berlin, Germany, 2019. [CrossRef]
  37. DIN EN 12350-7; Testing Fresh Concrete—Part 7: Air Content—Pressure Methods. Beuth Verlag: Berlin, Germany, 2022. [CrossRef]
  38. DIN EN 12390-3; Testing Hardened Concrete—Part 3: Compressive Strength of Test Specimens. Beuth Verlag: Berlin, Germany, 2022. [CrossRef]
  39. DIN EN 12390-6; Testing Hardened Concrete—Part 6: Tensile Splitting Strength of Test Specimens. Beuth Verlag: Berlin, Germany, 2022. [CrossRef]
  40. Noville, J.F. TEMPCORE®, the most convenient process to produce low cost high strength rebars from 8 to 75 mm. In Proceedings of the METEC & 2nd ESTAD 2015, European Steel Technology and Application Days, Düsseldorf, Germany, 15–19 June 2015. [Google Scholar]
  41. Rappl, S.; Shahul Hameed, M.Z.; Krempaszky, C.; Osterminski, K. Mechanical and surface geometric properties of reinforcing bars and their significance for the development of near-surface notch stresses. Mathematics 2023, 11, 1910. [Google Scholar] [CrossRef]
  42. Rappl, S. Untersuchungen zur Bedeutung der ITZ auf das Verbundverhalten von Stahl in Beton. Master’s Thesis, TU München, Munich, Germany, 2019. [Google Scholar]
Figure 1. Combination of WAAM and SPI to produce reinforced elements (based on [5]); (a) WAAM of the reinforcement, (b) spreading of one aggregate layer, (c) local intrusion of the cement paste in the aggregate layer, (d) finished, still embedded component, (e) component after removing the surrounding unbound aggregates; z: building direction.
Constrmater 03 00014 g001
Figure 2. Bond stress-slip diagram for reinforcing steel with sufficient and insufficient concrete cover and plain round steel in accordance with [20].
Constrmater 03 00014 g002
Figure 3. Stress distribution by force transfer between the reinforcing steel and the concrete in accordance with [23].
Constrmater 03 00014 g003
Figure 4. Experimental setup of the WAAM process; z: building direction.
Constrmater 03 00014 g004
Figure 5. Experimental setup of the pull-out tests.
Constrmater 03 00014 g005
Figure 6. Result of one LLS of a WAAM specimen with an enlarged y-axis, (a) and picture of the surface quality (b) including the production direction (orange).
Constrmater 03 00014 g006
Figure 7. Bond stress-slip curves of the pull-out tests for all the test series, (a) and picture of the sheared concrete consoles (b).
Constrmater 03 00014 g007
Figure 8. Bond stress-slip curves of all the pull-out tests for the types B500B and WAAM indicating the transition from the adhesive bond to the shear bond.
Constrmater 03 00014 g008
Figure 9. Related bond stress τmax/fctm and surface roughness for S355, WAAM, and GTR with additions (∆S355) from the literature [42].
Constrmater 03 00014 g009
Figure 10. Bond work Wτ for all the test series at characteristic slip values.
Constrmater 03 00014 g010
Table 1. Parameters used for the WAAM process.
ParameterUnitValue
Diameter of the wire electrode mm1.2
Wire feed speedm/min3.2
Welding currentA136
Welding voltageV17.6
Welding speedm/min0.25
Cooling times96
Stick-outmm12
Shielding gas flow ratel/min12
Table 2. Results of the tensile tests.
UnitB500BS355GTRWAAM Series One (1)WAAM Series Two (2)
Min.Max.Min.Max.Min.Max. Min.Max.
Re,HN/mm2549560421435--348316332
Rp0.2N/mm2----563579---
RmN/mm2647658536540719739481454476
Agt%9.811.014.015.43.95.016.014.417.5
Young’s modulusN/mm2200,400214,800163,400187,000188,000
Production process-Tempcore®Hot rollingCold forming and metal cuttingAdditive manufacturing
(1) single value. (2) ten values.
Table 3. Related rib area fR and surface roughness Rq.
SpecimenfRRq in µm
MinMaxMinMax
B500B0.0690.074--
S355--5.08.0
GTR0.614 (1)391.0429.3
WAAM--97.2102.6
(1) same fR-value for all specimens.
Table 4. Results of concrete tests.
TestUnitSeries 1Series 2
Fresh concrete temperature°C19.719.8
Slump diametercm40.540.5
Fresh concrete densitykg/m324202420
Air void contentvol. %3.23.6
Compressive strength fckN/mm242.841.0
Splitting tensile strength fctmN/mm23.63.6
Table 5. Load capacity of the reinforcements during the pull-out test.
ReinforcementLoad Capacity in %
B500B55.5
S3553.5
GTR84.7
WAAM60.6
Disclaimer/Publisher’s Note: The statements, opinions and data contained in all publications are solely those of the individual author(s) and contributor(s) and not of MDPI and/or the editor(s). MDPI and/or the editor(s) disclaim responsibility for any injury to people or property resulting from any ideas, methods, instructions or products referred to in the content.

