Article

Effect of Electrochemical Corrosion on the Properties of Modified Concrete

1
Department of Geotechnical Engineering and Building Materials, Kalashnikov Izhevsk State Technical University, 426009 Izhevsk, Russia
2
Faculty of Civil Engineering, Brno University of Technology, 601 90 Brno, Czech Republic
*
Author to whom correspondence should be addressed.
Constr. Mater. 2023, 3(2), 202-216; https://doi.org/10.3390/constrmater3020013
Submission received: 17 February 2023 / Revised: 11 April 2023 / Accepted: 19 April 2023 / Published: 25 April 2023
(This article belongs to the Special Issue Advances in Concrete Binders and Reinforced Concrete)

Abstract

:
Analysis of the use of reinforced concrete structures confirmed the destruction of reinforced products based on Portland cement due to stray currents, which makes it impossible to achieve the required durability and reliability of structures. The present work shows the results of a study on the diffusion permeability of samples with different degrees of electrical conductivity. The relative value of the electrode potential was measured by the open circuit potential method. The novelty of this work is its analysis of the quantitative and qualitative characteristics of the structure of the mineral matrix with specified electrical properties after long-term exposure to electrochemical corrosion. In this work, an assessment was carried out, for the first time, on the effects of electrochemical corrosion on modified composites with predominantly electrically conductive and electrically insulating properties. An increase in the electrical conductivity of the composite was found to reduce the potential difference. The use of such composites helped protect the reinforcement from electrochemical corrosion.

1. Introduction

Reinforced concrete, a widely used building material, generally does not need protection from environmental influences under normal conditions. The state of most reinforced concrete buildings and products dating back to the first decades of the 20th century confirms a sufficient degree of material durability [1,2,3,4,5,6,7]. However, during a detailed examination of the structures in operation, both local [8,9,10] and significant defects were found to be caused mainly by various corrosion processes [11,12]. In Refs. [13,14,15,16,17], two main reasons were given for the development of defects: reinforcement corrosion due to direct current; and reinforcement corrosion due to stray currents.
Stray current refers to an electric charge flowing through materials and structures that are not elements of a specially designed electrical circuit [2,4]. When stray current reaches the reinforcement, a cathodic oxygen reduction reaction is initiated in a medium with a high pH, which is provided by the pore solution of the matrix. At the same time, in the area of contact between the reinforcement and the concrete, an anodic reaction occurs, which is accompanied by corrosion of the metal. Various research methods have been suggested to study the effect of stray currents on the processes of corrosion on the reinforcing steel in reinforced concrete [18,19,20,21,22,23].
In Refs. [24,25,26,27], the authors distinguished between different electrochemical methods, which included potentiodynamic and galvanodynamic techniques. The potentiodynamic method evaluates the passivating effect of concrete in relation to steel reinforcement and assesses the dependence of electric current density on the electric potential of steel reinforcements. The corrosion rate can be indirectly estimated via the diffusion current density, icorr (mA/cm2). The passive state is characterized by the corrosion current density 1 × 10⁻⁷ A/cm2 (0.1 μA/cm2), corresponding to a corrosion rate of 1 µm per year [3,5].
The main cause of destructive processes in reinforced concrete under the influence of both direct and stray currents was found to be the ionic nature of the electrical conductivity of the mineral matrix [5,11]. The authors in Ref. [14] found that the directed transfer of Ca2+ and OH ions were the main carriers of electric charge in concrete, occurring in accordance with the signs of charges.
The authors in Refs. [28,29,30,31] analyzed the influence of chloride ions and described the electroosmotic effect as a process of movement intensification in capillary-porous objects. The analyses showed that this process can descriptively characterize the electrochemical reaction of oxygen reduction in concrete, as well as the electrolysis of water.
These electrochemical reactions are most often caused by the flow of electric current through the steel–concrete interface, during which electrochemical corrosion influences both the mineral matrix and the reinforcement [3,5,32,33,34].
The current from a positively charged reinforcement bar can flow into the mineral matrix in two ways: the dissolution of iron; and ionization of the liquid phase around the bar (formation of OH ions). However, taking into account the results of studies on the electrical breakdown of liquids [35,36,37,38] in a solution and directly in the mineral matrix, the degree of ionization of OH ions can be estimated based on the value of the diffusion current. The value of the diffusion current can characterize the processes underlying the initialization and intensification of the electrochemical corrosion of reinforced concrete. A previous study in Ref. [39] determined the threshold values of the current density; by overcoming these values, it is possible to estimate the corrosion rate. Current density in a range of 0.01 to 0.1 mA/cm2 characterizes the corrosion process as insignificant. Current density in a range of 0.1 to 1 mA/cm2 allows us to estimate the rate of electrochemical corrosion as an average. The current density above 1 mA/cm2 indicates a significant rate of destructive processes.
Ultimately, the reasons for the onset of corrosion processes among metal elements are as follows: intensification of the effect of chlorides on concrete; and a decrease in the pH of the pore fluid due to the cyclic effects of stray currents [40,41].
The properties of the aggregates also contribute to the process of electrochemical corrosion. Thus, moisture, impurities, and air permeability can accelerate the process of electrochemical corrosion. The use of a fine aggregate containing impurities such as salts can negatively affect the hydrogen index, leading to deterioration of the protective oxide film on the surface of the metal [2,4,11,14,33,34].
It is known that in the process of electrochemical corrosion, not all the elements of the expansive phase participate in the destruction of the concrete [6,7]. The authors in Refs. [28,39] found that part of the new formations fills the pinholes around the reinforcement, while another part moves in the process of diffusion from the steel–concrete interface into the depth of the capillary–pore space.
Previous studies showed that destructive processes are characterized by a number of indicators that predetermine the corrosion rate. However, the main influence lies in the indicator, whose changes occur slower compared to other indicators since such a parameter largely characterizes the entire reaction process [7,8]. In turn, to obtain the most reliable characteristics of the corrosion process, it is necessary to simulate the process at a slow pace with extremely low concentrations of an aggressive solution [14,27].
Since the stages of material degradation cannot be observed directly, conclusions and a detailed description of possible mechanisms are carried out, both based on indirect measurements, observations, and indicators, as well as the quantitative physicochemical and electrical characteristics of the samples and solutions under study [5,6].
An additional method for assessing the nature of the influence of corrosion processes on mineral matrices is the study of the microstructure [26], which is used to analyze the corrosion resistance of geopolymers [36], alkali-resistant modified concretes [39], etc.
Today, methods for protection against electrochemical corrosion are aimed at the protection of concrete and the local protection of reinforcements. Methods for protecting the mineral matrix include the use of compounds with a low water–cement ratio [2], waterproofing [6], protective coatings [15], and regulation of electrical properties [39]. In turn, the methods of local reinforcement protection include cathodic protection [4] and organic and inorganic inhibitors [7]. The waterproofing and cathodic protection of concrete is costly. The use of coatings inhibits the initialization of corrosion, and plant extracts are organic nondurable materials [20]. Previous studies showed that reinforcing steel can be protected through the formation of a galvanic pair in artificial stone with conductive additives or due to the electrical insulation of the reinforcement from the environment [14,39].
The use of modification is promising and facilitates variability among the required properties of the product, including durability. Analysis of the research results shows that the applied zinc oxide additives [26], as well as the additives of natural pozzolana of volcanic origin and granulated blast-furnace slag [35], have a significant effect on the packing density of the mineral matrix and its electrical performance. Thus, after 600 days of immersion in a 3.5% NaCl solution, the value of the active polarization curves was 17 mV, while that of the passive curves was 20 mV when modified with pozzolans and slag. In turn, modification of the matrix with 3% zinc oxide after 200 days of testing presented a polarization curve of 490 mV and icorr = 1.3 mA/cm2, which indicates a pronounced corrosion process.
However, recent studies in the field of the effect of carbon nanostructures on the properties of mineral matrices consider these modifiers from a point of view of their impact on electrochemical corrosion [32,39]. In works on forming an electrically conductive cluster structure by introducing a suspension of nanodispersed materials [37], it was found that the low volume resistivity of concrete promotes the formation of galvanic coupling with steel reinforcement, yielding a potential reduction in the impact of electrochemical corrosion on reinforced concrete.
Thus, the corrosion of reinforcing steel in concrete with given electrical characteristics is of an electrochemical nature and can be differentiated into certain stages. Each stage of the process is determined by the diffusion and degree of resistance of the matrix to the flow of current. As a result, the indicator whose mineral matrix features specific volumetric electrical resistance characterizes a sequential system of connections, from which it follows that the rate of the corrosion process is due to this parameter. However, the regularities of the influence of the electrical properties of concrete on resistance to electrochemical corrosion have not yet been sufficiently studied. The results of the study presented in this article are aimed at a quantitative and qualitative assessment of the effect of corrosion processes on modified composites, with electrical characteristics from pronounced dielectric to electrically conductive, which are necessary to understand the operation of these materials and predict their durability.

2. Materials and Methods

2.1. Material

The effect of electrical properties on the resistance of reinforced concrete to the effects of stray currents and anodic polarization was studied on cylinder samples with h = 100 mm and d = 100 mm. The following composites in Table 1 were analyzed: a control composite, an electrically conductive composite with an additive in the form of a suspension of industrial soot, and an electrically insulating composite with an additive based on industrial sulfur.
The following components were used to prepare the composites.
Portland cement was produced by OJSC Novoroscement, Novorosiysk, Russia grade CEM I 42.5N. The chemical composition of the cement in percentages was as follows: CaO, 66.73%; SiO2, 23.22%; Al2O3, 5.16%; Fe2O3, 4.42%; and SO3, 0.47%. The mineralogical composition of cement was as follows: C3S, 65%; C2S, 13%; C3A, 4%; and C4AF, 18%.
Quartz sand meeting the requirements of GOST 8736-2014 was used as a filler, with a fineness modulus FM = 1.25.
Calcium nitrate, corresponding to GOST 4142-77 Calcium nitrate, was used to stabilize the electrically conductive properties. Before being added to the mixture, the calcium nitrate was dissolved in the mixing liquid.
A suspension of industrial soot was used as a component to form an electrically conductive cluster structure. For optimal distribution in the matrix, the industrial soot was used in the form of a UPC-MIX-1 suspension produced by Novy Dom LLC, Izevsk, Udmurt Republic, Russia the composition of which included industrial soot, 32%; water, 20%; propylene glycol, 10%; and special additives, 8%. Analysis of the distribution of solid phase particles in the suspension, performed with a laser diffraction analyzer, is shown in Figure 1. Analysis of the distribution of particles shows that the additive is characterized by a polysized dispersed phase, represented by micro- and nanoparticles in a wide range from 0.03 to 10 μm (Table 1).
Industrial soot was used to impart dielectric properties, with the pre-treatment and additive percentages being selected based on previous studies [43]. Industrial soot was processed using the associative sol-gel technology [44], which was obtained with industrial sulfur grade 9998 produced by Taneko JSC, Nizhnekamsk, Russia, corresponding to GOST 127.1-93. The main properties of industrial sulfur were as follows: physical and mechanical properties, particle shape, hemispherical properties, and bulk density of 1.3 g/cm3; physical and chemical properties and mass fraction of sulfur of 99.99%; mass fraction of ash, 0.005%; mass fraction of organic substances, 0.005; mass fraction of water, 0.01%.
Sodium chloride was used as the main component of the electrolyte solution and corresponded to GOST 4233-77. For the study, according to the work in [26,27], the concentration of sodium chloride in the solution was selected as 5%.

2.2. Specimen Preparation

The program of the presented study included the preparation of control samples, electrically insulating composites, and electrically conductive composites (Table 2). For each composite, cylinder samples were formed from dough of a normal density. The mixture was prepared in accordance with the technology described in previous works [44].
At the stage of molding the samples, a reinforcement was laid according to the scheme shown in Figure 2. Two days after molding, the samples were removed from the molds; samples of the electrically insulating composite underwent additional stepwise thermal catalytic treatment at 180 °C for 60 h. Subsequently, all samples were kept under normal hardening conditions at 20 ± 2 °C. After 28 days of hardening, the samples were subjected to cyclic electrochemical corrosion.

2.3. Corrosion Acceleration and Testing Procedure

In the natural environment, the diffusion of chlorides in the mineral matrix proceeds rather slowly. To intensify the diffusion process, we used the galvanodynamic method of applying voltage with an open circuit potential. According to the scheme presented in Figure 2, a cyclic current was applied to the samples of each composite immersed in a 5% NaCl solution.
Analysis of accelerated electrochemical corrosion was performed by applying direct electric current to the electrodes with parameters of I = 5 A and U = 30 V; the duration of voltage supply was 6 h every day for 7 months [35]. The parameters were selected to simulate the effects of stray current during peak load hours, which are characterized by limited exposure time under natural operating conditions.
The measurements were carried out using a three-electrode circuit. This scheme included steel reinforcement (working electrode), a stainless steel plate, and a saturated silver chloride reference electrode of the 2nd category.
Determination of the degree of permeability was evaluated using MNIPI E7-20 by recording the value of the potential in millivolts according to the magnitude of the current passing through the sample. The galvanodynamic characteristics of the samples were obtained with a step change in the current strength I in mA [20]. After each increase in the current value, the sample was exposed until the potential E stabilized.
The calculation of the corrosion current density i, μA/cm2, at each fixed value of potential was determined by the following formula:
i = I S ,
where I is the current strength, μA; and S is the working surface area, cm2.
Next, the area of the working surface of the reinforcement in contact with concrete, S (mm2) was calculated by the following formula:
S = π D l + π D 2 4 ,
where D is the steel rod diameter, cm; and l is the length of a steel rod immersed in concrete, cm [14].
Based on the obtained results, a graph of the polarization curve was plotted in the following coordinates: along the abscissa axis, we plotted the corrosion current density i, mA/cm2; along the ordinate axis, we plotted the potential of the working electrode E, mV. The coefficient of variation defined corresponding to GOST 8.207 was 11.4%.

2.4. Test Methods and Preparation of Specimens

Sampling for the study of the microstructure was conducted in the near-electrode zone, and 3 samples of each composite were taken. To conduct differential chemical analysis, samples were also taken from the near-electrode zone.
Scanning electron microscopy (SEM) and EMA elemental mapping analysis were used to study the concrete surface, which was in direct contact with the steel reinforcement until it was separated from the matrix, in order to assess the nature of new formations at the steel–concrete interface. The measurements were carried out on a Scios Field Emission scanning electron-ion (FIB), FEI, USA microscope at the Federal Research Center “Crystallography and Photonics” of the Russian Academy of Sciences at an accelerating voltage of 5 kV without surface treatment.
To study complex changes, we used differential thermal analysis of samples from the control and modified composites, including thermogravimetric analysis (TG). The methods of differential thermogravimetry (DTG) and differential scanning calorimetry (DSC) were applied. Laboratory studies were carried out on a TGA/DSC1 thermal analyzer from Mettler-Toledo Vostok CJSC, Switzerland. Conditions were as follows: measurement interval from 50 to 1100 °C; heating rate, 10 °C/min; platinum crucibles; and working medium, air.

3. Results and Discussions

The results of the conducted studies describe the anodic processes of electrochemical corrosion on reinforcements and the processes occurring in the matrix structure.
The graph in Figure 3 shows the dependence of the current density and its changes over time for composites with different electrical characteristics. Analysis of the obtained data established that the increase in current density for the control sample ranged from 0.07 (day 30) to 0.41 mA/cm2 (day 160), which indicates a period of electrochemical corrosion at an average rate. In the control sample, the current density decreased from day 140 to the end due to the growth of products in the expansive phase that have dielectric properties, as well as the appearance of cracks in the sample. Moreover, in the period from 150 to 170 days, cracks 2 to 5 mm in size appeared on the surfaces of the samples.
For samples of the electrically insulating composite, the current density overcame the threshold value of 0.12 mA/cm2 on day 120, after which the parameter increased and reached a value of 0.62 mA/cm2 on day 200, which also characterized the average rate of the corrosion process. Neither obvious defects nor changes in the surface of the sample of the electrically insulating composite were observed during the entire period of the experiment.
For the electrically conductive composite, this parameter ranged from 0 to 0.1 mA/cm2 during the entire experiment (with an insignificant rate of the process), with no obvious destructive processes. Analyzing the indicators of the control and electrically insulating composites, and considering the research in [4,14], it can be assumed that for both composites, the pH of the matrix in the anode zone will decrease, predetermining the course of anodic reactions.
Data on the current density also indicated that, in parallel with the processes that triggered anodic reactions, Ca2+ ions moved from the anodic zone, leading to the destruction of new hydrate formations. The destruction of hydrosilicates and the migration of calcium ions led to an increase in the porosity of the matrix located in close proximity to the anode zone.
Figure 4 shows the data on changes in the polarizing voltage over time. Analysis of the polarization curves established that the application of a positive potential to the steel led to the release of oxygen in the control composite during the first month of testing and during the first three months of testing in the electrically insulating composite. The process started at a potential above 100 mV.
At the same time, as shown in Refs. [4,5,6,20,35], an increase in the consumption of OH ions and the difficulty of their migration in the mineral matrix led to a decrease in the pH level at the surface of the reinforcement, which intensified electrochemical corrosion processes.
The intense dissolution of iron, associated with a sharp decrease in the pH level at the anode, was expressed in the alignment of the polarization curve for the fourth and subsequent months of the study into an almost vertical line for the control and electrically insulating composites.
At the same time, the stable polarizing curve of the electrically conductive composite, without sharp breaks, indicates the effectiveness of the use of electrically conductive components and also confirms the formation of a steel–concrete galvanic couple, which ensured the unhindered passage of electric current and the passive state of the metal.
Thus, analysis of the polarization curve demonstrates that the rate of electrochemical corrosion of steel under action simulating the effect of a stray current for the control and electrically insulating composites was intensified by a reinforcement potential of at least 100 mV.
During the study, the appearance of brown traces on the surfaces of the samples was noted, indicating the migration of iron hydroxide from the reinforcement to the surface of the sample, which was accompanied by a destructive effect on the structure of the matrix.
To analyze the characteristics of this process, the matrix morphology in the adjacent anode zone (steel–concrete contact zone) was analyzed.
The results of the conducted SEM and EDX analyses and mapping results are presented in Figure 5 and Figure 6.
Under the action of an electric field, calcium and iron ions move towards the cathode and combine with OH ions. As a result, based on the microstructure shown in Figure 5, a significant amount of calcium hydroxide and aluminoferrite crystals are formed in the pore space and become localized in the area close to the cathode. At the same time, crystallization of calcium hydroxide occurs in the form of rare, rather large crystals, 200–300 µm in size, which are shaped as uniaxial plates or elongated prisms, as observed in the electrical insulating composite (Figure 5b).
The cleavage morphology of the electrically conductive sample (Figure 5c) is characterized by a dense structure, pore filling, and the absence of structural defects. This morphology indicates that the formation of hydrosilicates occurs both through calcium ions entering due to internal diffusion and through ions extracted from the initial grain into the silica gel layer filling the pore space.
In addition, the results obtained using scanning electron microscopy (Figure 5) suggest an increase in the total porosity of the control sample, with enlargement of the pore diameter. The appearance of through channels in the matrix of the electrically insulating composite, located in the immediate vicinity of the anode, was also noted; the diameter of these channels ranged from 3 to 12 μm.
These factors indicate the process of liquid electrolysis in the samples, which was accompanied by the formation of iron hydroxide, ferrous or trivalent iron in the steel–concrete contact zone, and the migration of these formations into the concrete structure, which was confirmed by the results of mapping the steel–concrete contact zone (Figure 6).
All described processes led to a change in the pore space of the concrete and in the nature of new formations [4,14,20,45].
Mapping confirmed the hypothesis regarding the migration of dissolved iron towards the cathode through the matrix structure. The results shown in Figure 6a demonstrate the presence of migration processes of iron and chlorine. The volume of migrating elements can be estimated by the presence of a color image of the elements on the map. On the left side of the map, the presence of chlorine is marked in pink; on the right side, the amount of iron is indicated in yellow. By analyzing the distribution of elements in the matrix, we can conclude that the electric field provides a uniform distribution of these elements in the structure.
The results for the electrical insulating composite shown in Figure 6b demonstrate an uneven distribution of iron and chlorine ions, which is associated with the insulating properties of the matrix causing the accumulation of voltage up to the breakdown voltage.
In the structure of the electrically conductive composite (Figure 6c), the migration of iron ions from the anode towards the cathode, as well as chlorine ions from the cathode to the anode, cannot be observed. The iron elements presented in the image could be attributed to the component composition of the mineral matrix.
To determine the relationship and interpret the causes of changes in indicators, differential scanning calorimetry and thermogravimetric analysis were carried out. The resulting curves are shown in Figure 7 and Figure 8.
Figure 7 and Figure 8 show the results of the DSC and TG analyses presented in the form of temperature curves, and data on the mass losses of samples during heating are shown in Table 3 and Table 4. Comparative analysis showed that in the range from 90 to 400 °C, a peak of 157.5 °C for electrically conductive and 150 °C for electrically insulating compounds was associated with dehydration of the set stone hydration products. At the same time, the peak of 149.5 °C in the control composite was associated only with the dehydration of gel and crystalline products of cement hydration. These conclusions were confirmed by the value of weight loss for these reactions. For the electrically conductive composite, the weight loss was 4.5%, and for the control composite, weight loss was 2.1%. The exothermic effect of the electrically conductive composite, 531.5 °C, whose peak height surpasses its width, is indicative of the carbon black oxidation reaction. This effect overlapped with other effects identified for other composites, such as the decomposition of calcium hydroxide and recrystallization of silicon oxide. Endothermic effects in the region of 450–520 °C in the control and electrically insulating composites were also attributable to the thermal decomposition of a significant amount of calcium hydroxide. Endothermic effects in the region of 574–576.5 °C in the control and electrically insulating composites could also be attributed to the recrystallization of silicon oxide.
The temperature effect and weight loss in the temperature range of 655–800 °C for the composite without additives could also be attributed to the decomposition of hydroaluminoferrites and calcium carbonate. At the same time, the endothermic effects of the electrically conductive and electrically insulating composites with peaks at 802 °C were associated with the decomposition of calcium carbonate, the removal of chemically bound water from calcium hydrosilicates, and ettringite.
Most previous studies focused on the early stages of the electrochemical corrosion process. This study evaluated the electrochemical corrosion process over the long term, focusing on changes in the mineral matrix and how these changes can be evaluated to assess the electrochemical corrosion process. Based on the experimental data obtained, it can be assumed that a combination of the applied methods can be used to comprehensively characterize the process of the electrochemical corrosion of reinforced concrete in the long term and predict the operational features of mineral matrices with different electrical characteristics under operation in an environment that would stimulate the occurrence of electrochemical corrosion. Based on the results of the present research, we suggest that the developed electrically conductive composite could serve as an effective and universal method of protection for reinforcing steel.

4. Conclusions

The test results for the reinforced concrete samples aged in an electrolyte solution for 7 months suggest the following conclusions:
  • We established that the stability of the mineral matrix in relation to the rate of penetration of chlorine ions was, to a certain extent, dependent on the electrical characteristics. Thus, the control and electrically insulating composites were characterized by an average corrosion rate and significant destructive damage, while the electrically conductive composite was characterized by a low rate of the corrosion process and the absence of visible defects in the structure;
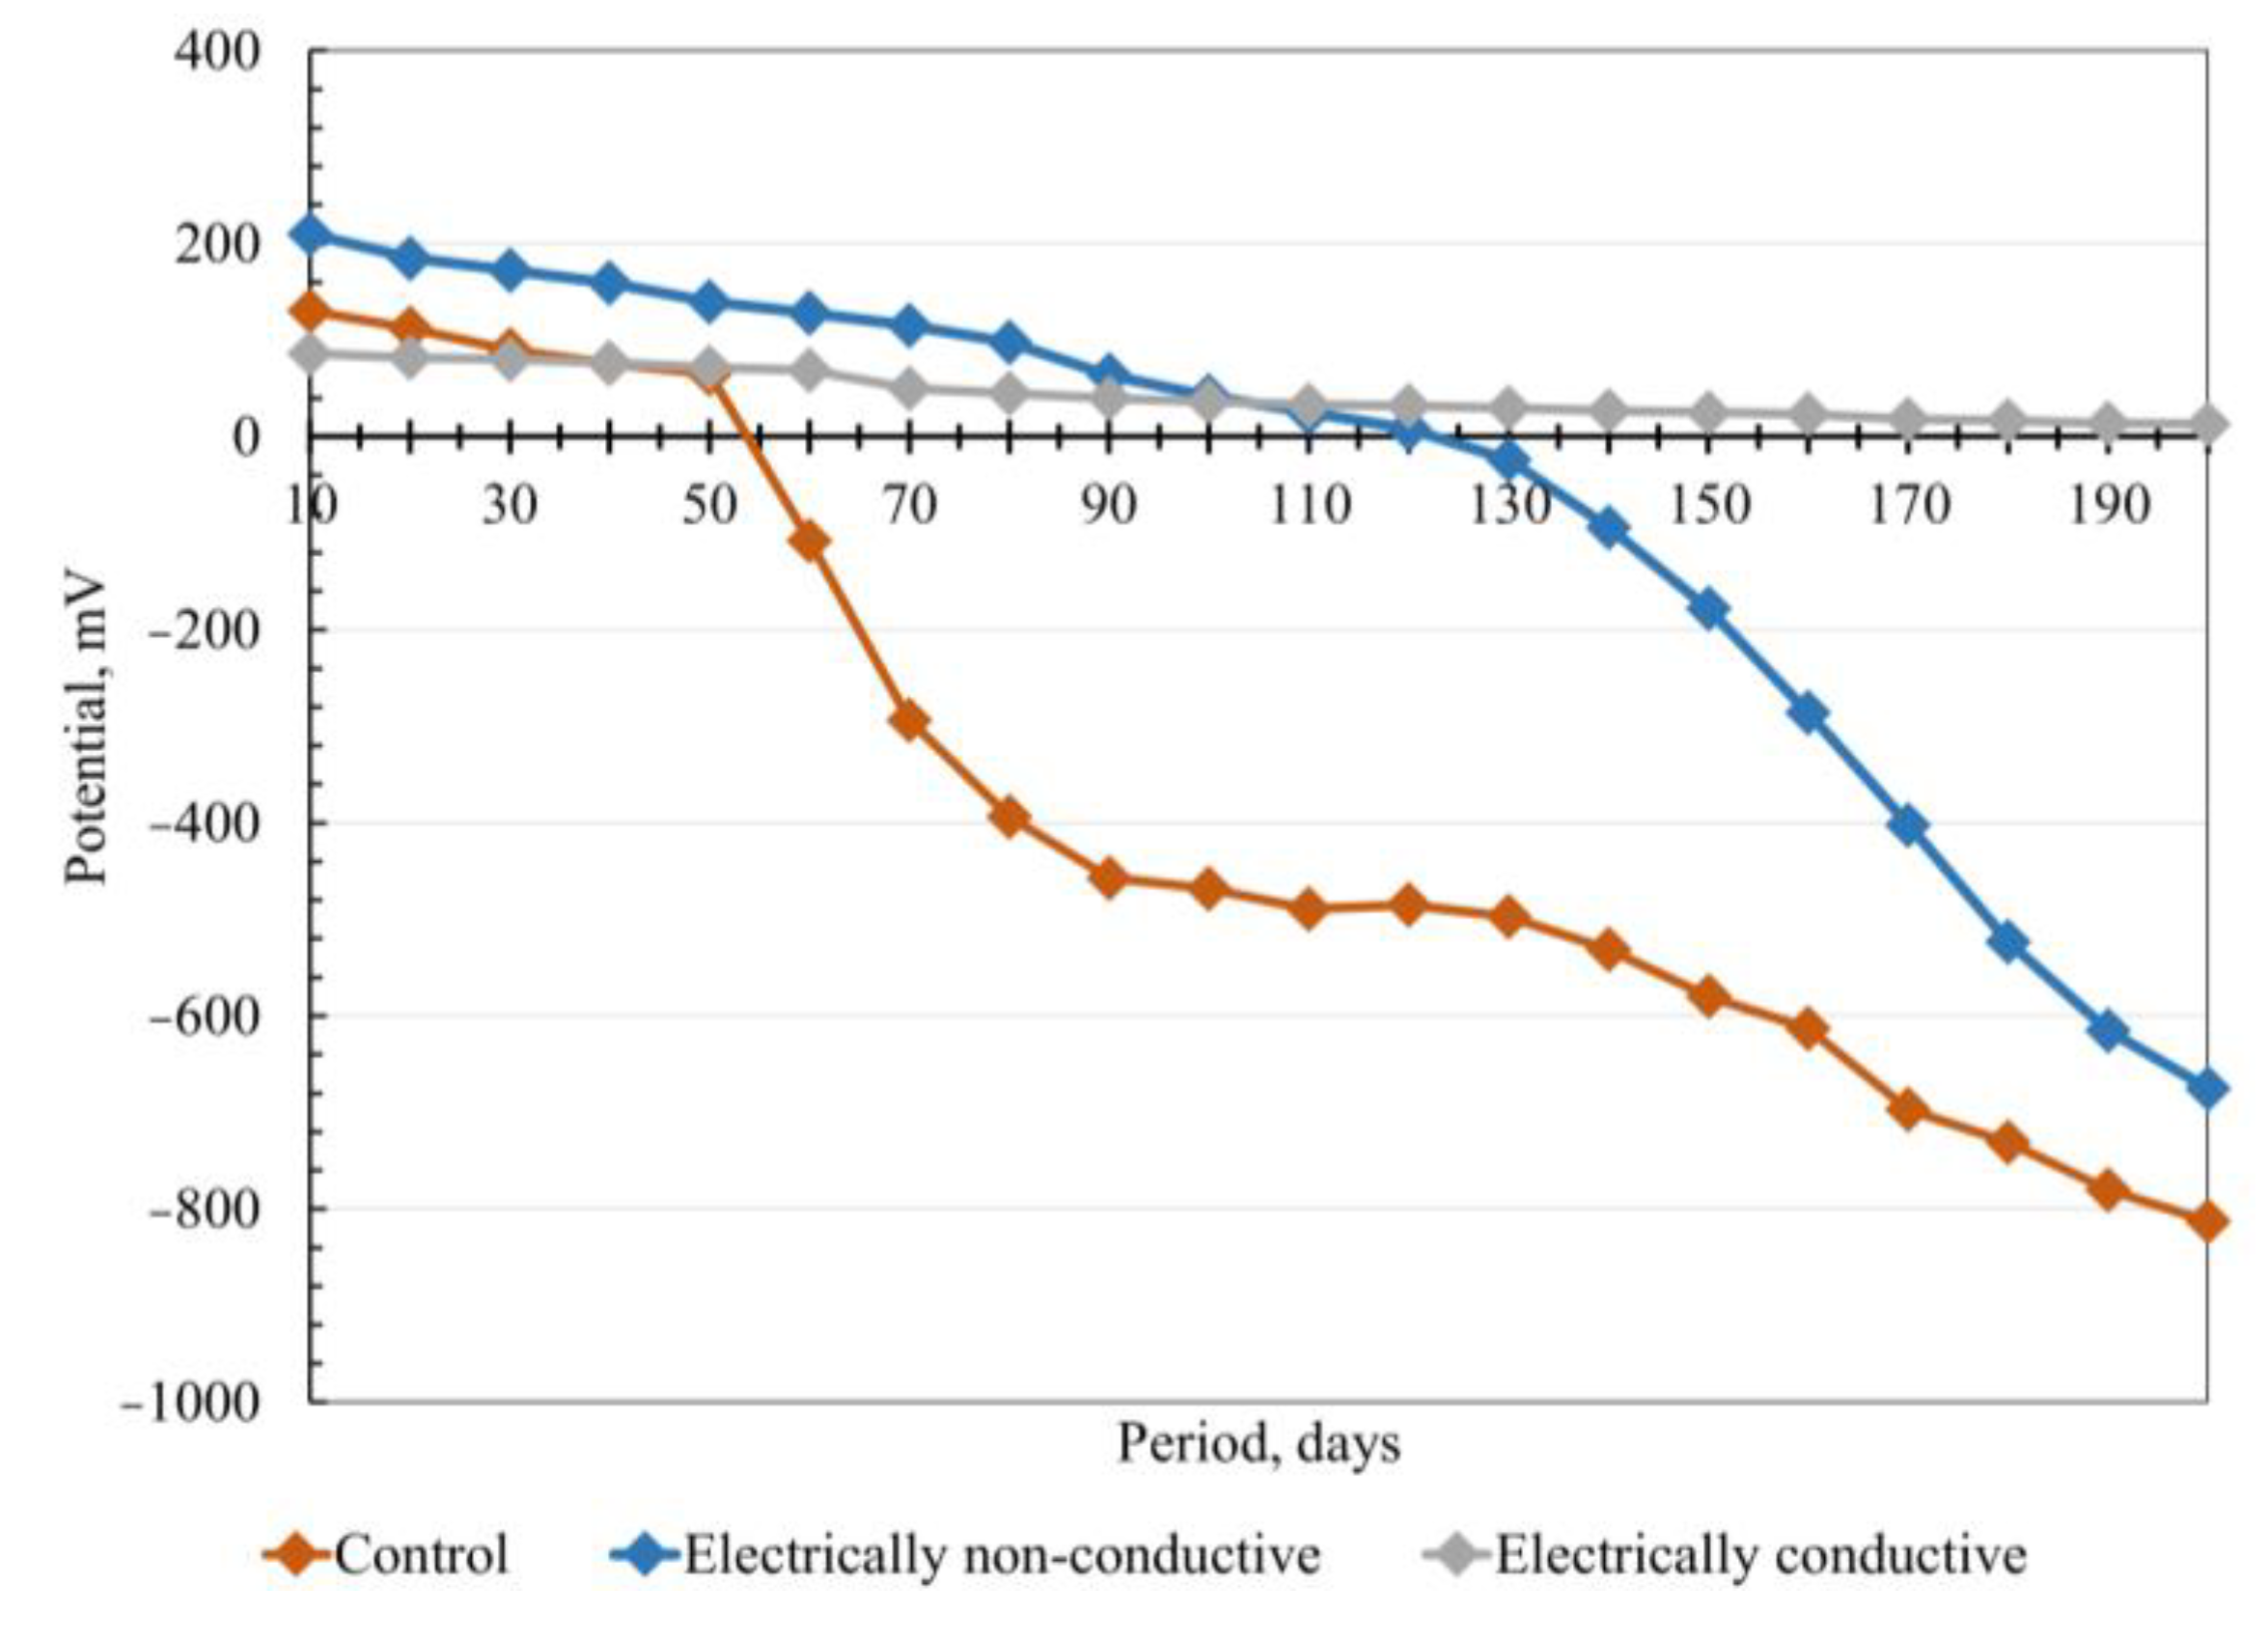
  • The conductivity index for the control composite was 813 mV, while that for the electrically insulating composite was 675 mV. Thus, for the control and electrical insulation composites, the probability of the corrosion process was as high as 90%. The electrical insulating composite was not effective for protection against electrochemical corrosion. Concrete structures based on these composites are not protected against stray currents. The results, therefore, confirm the effectiveness of increasing the electrical conductivity of the mineral matrix and the possibility of using such composites as effective protection for reinforcing steel;
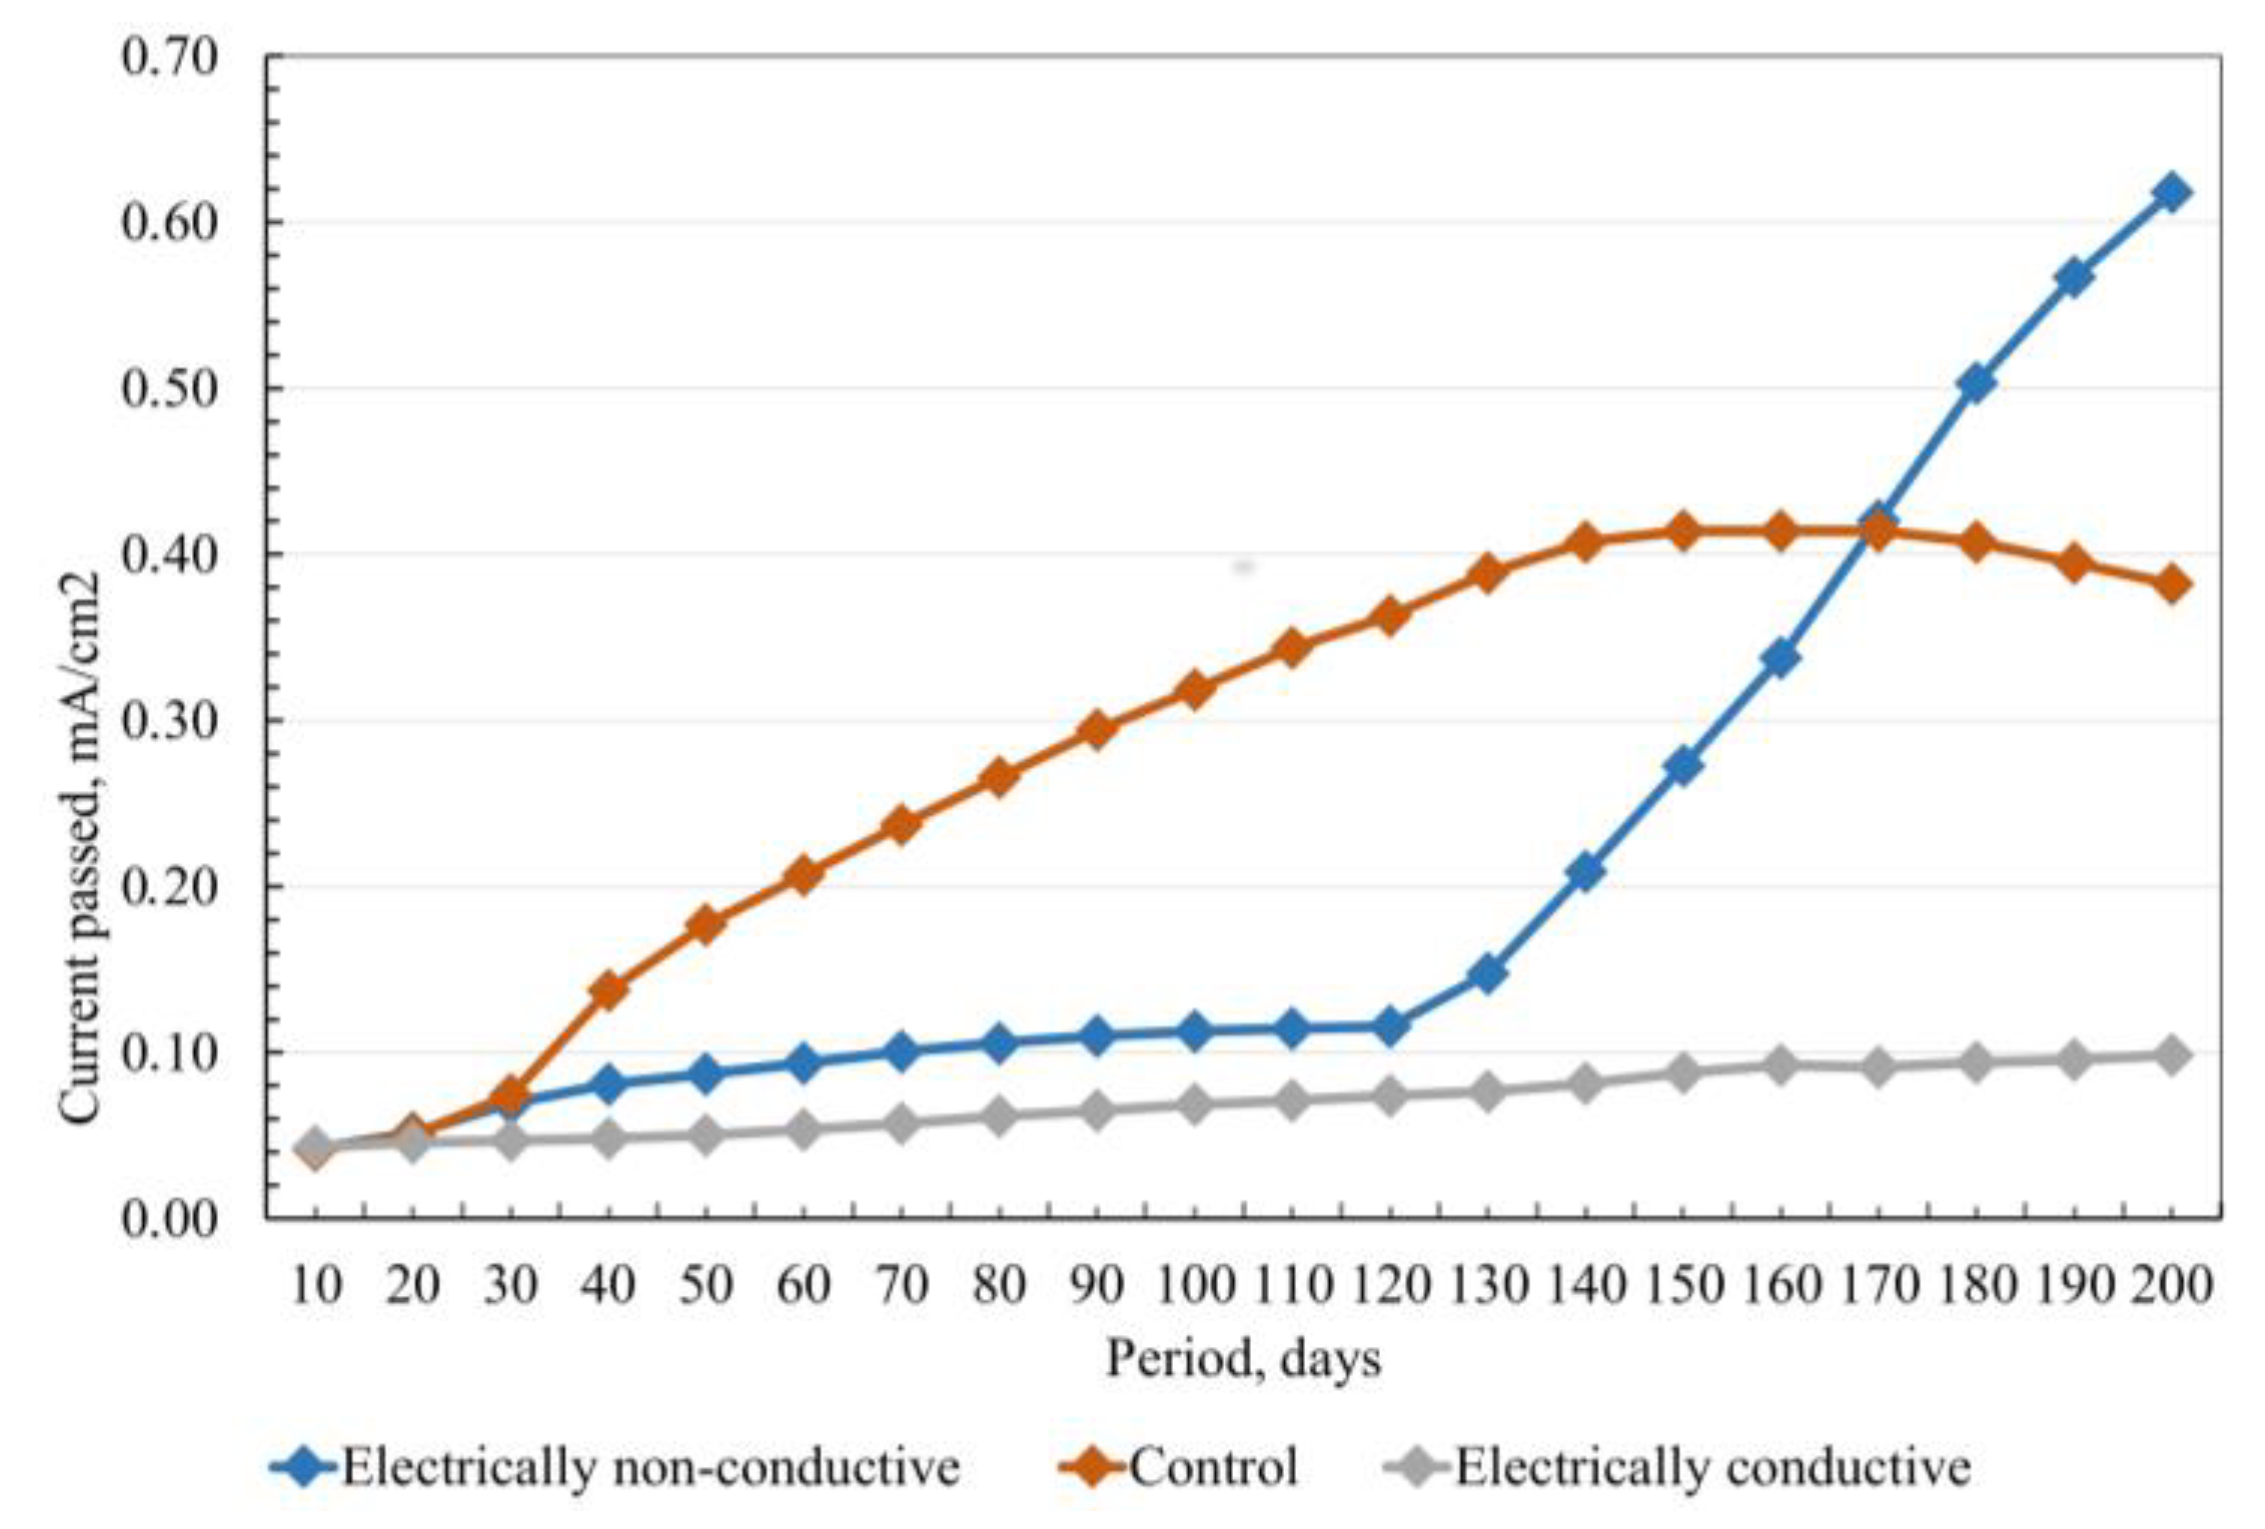
  • The values of the current density flowing from the reinforcement into the mineral matrix and the nature of the process over time confirmed the deterioration of the protective film on the reinforcement for all three composites. Dissolving iron in the reinforcement led to an increase in the current density. The change in current density for the control composite after 150 days indicated a disruption in the passivity of the metal;
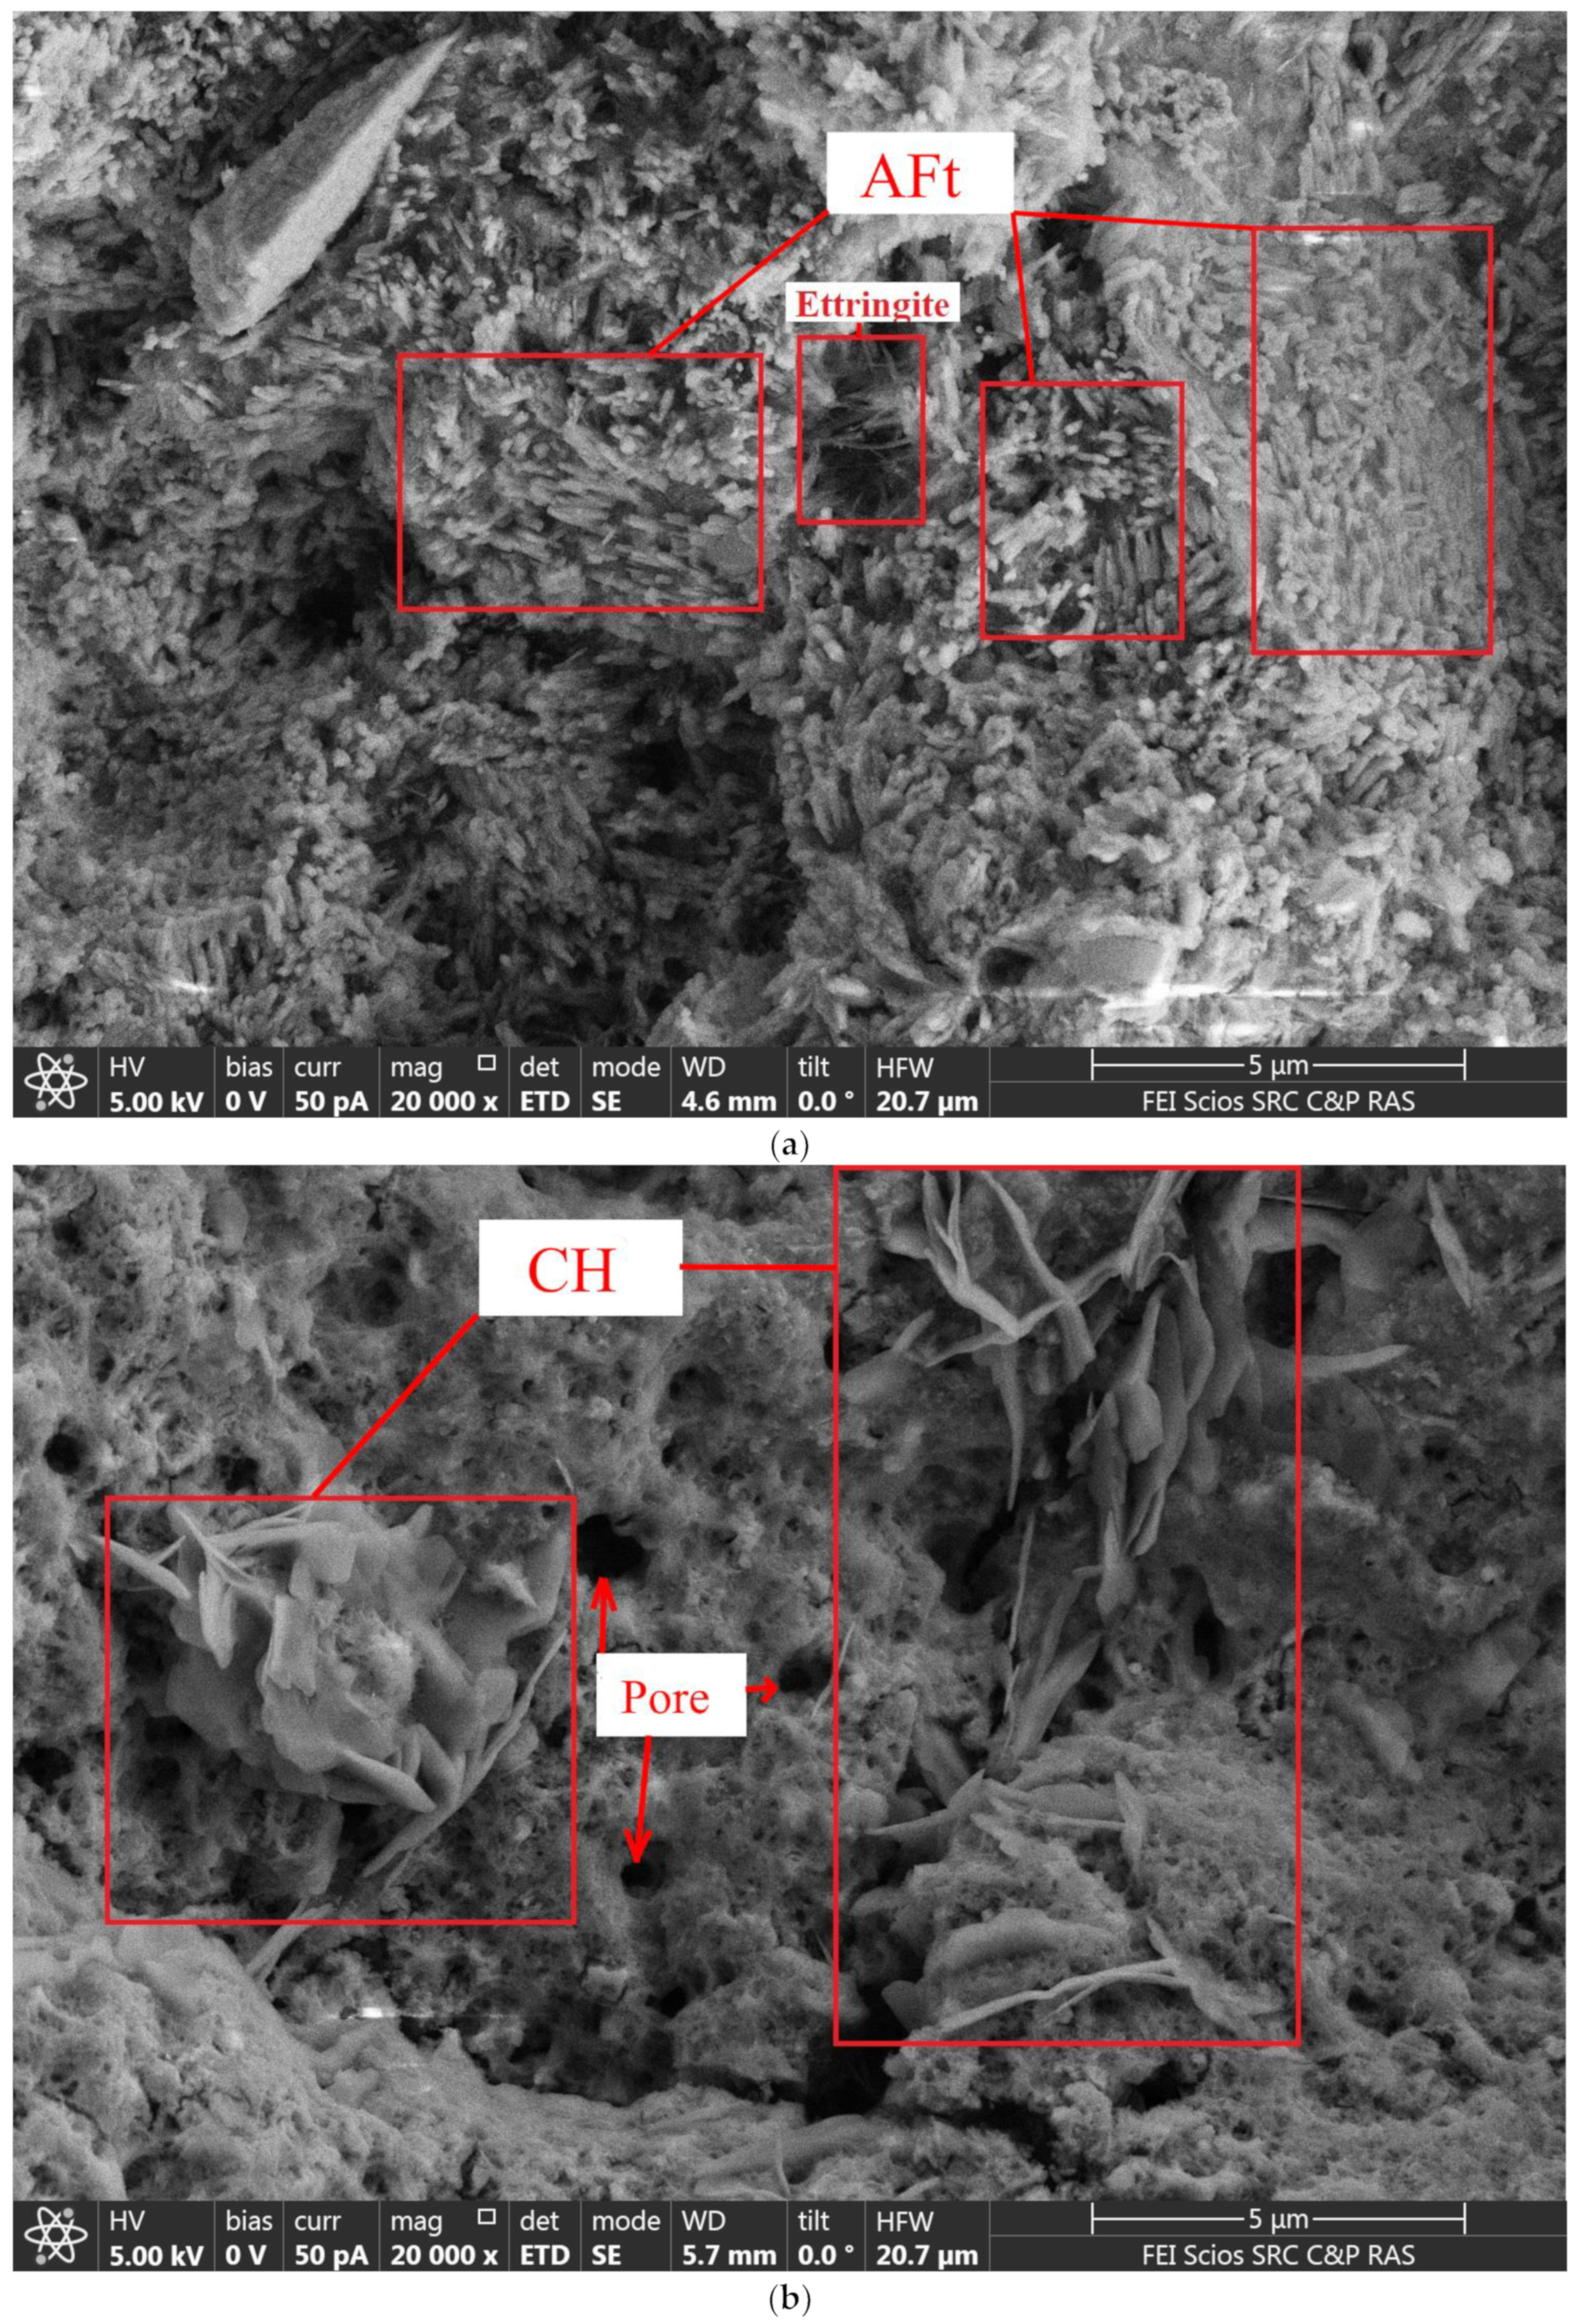
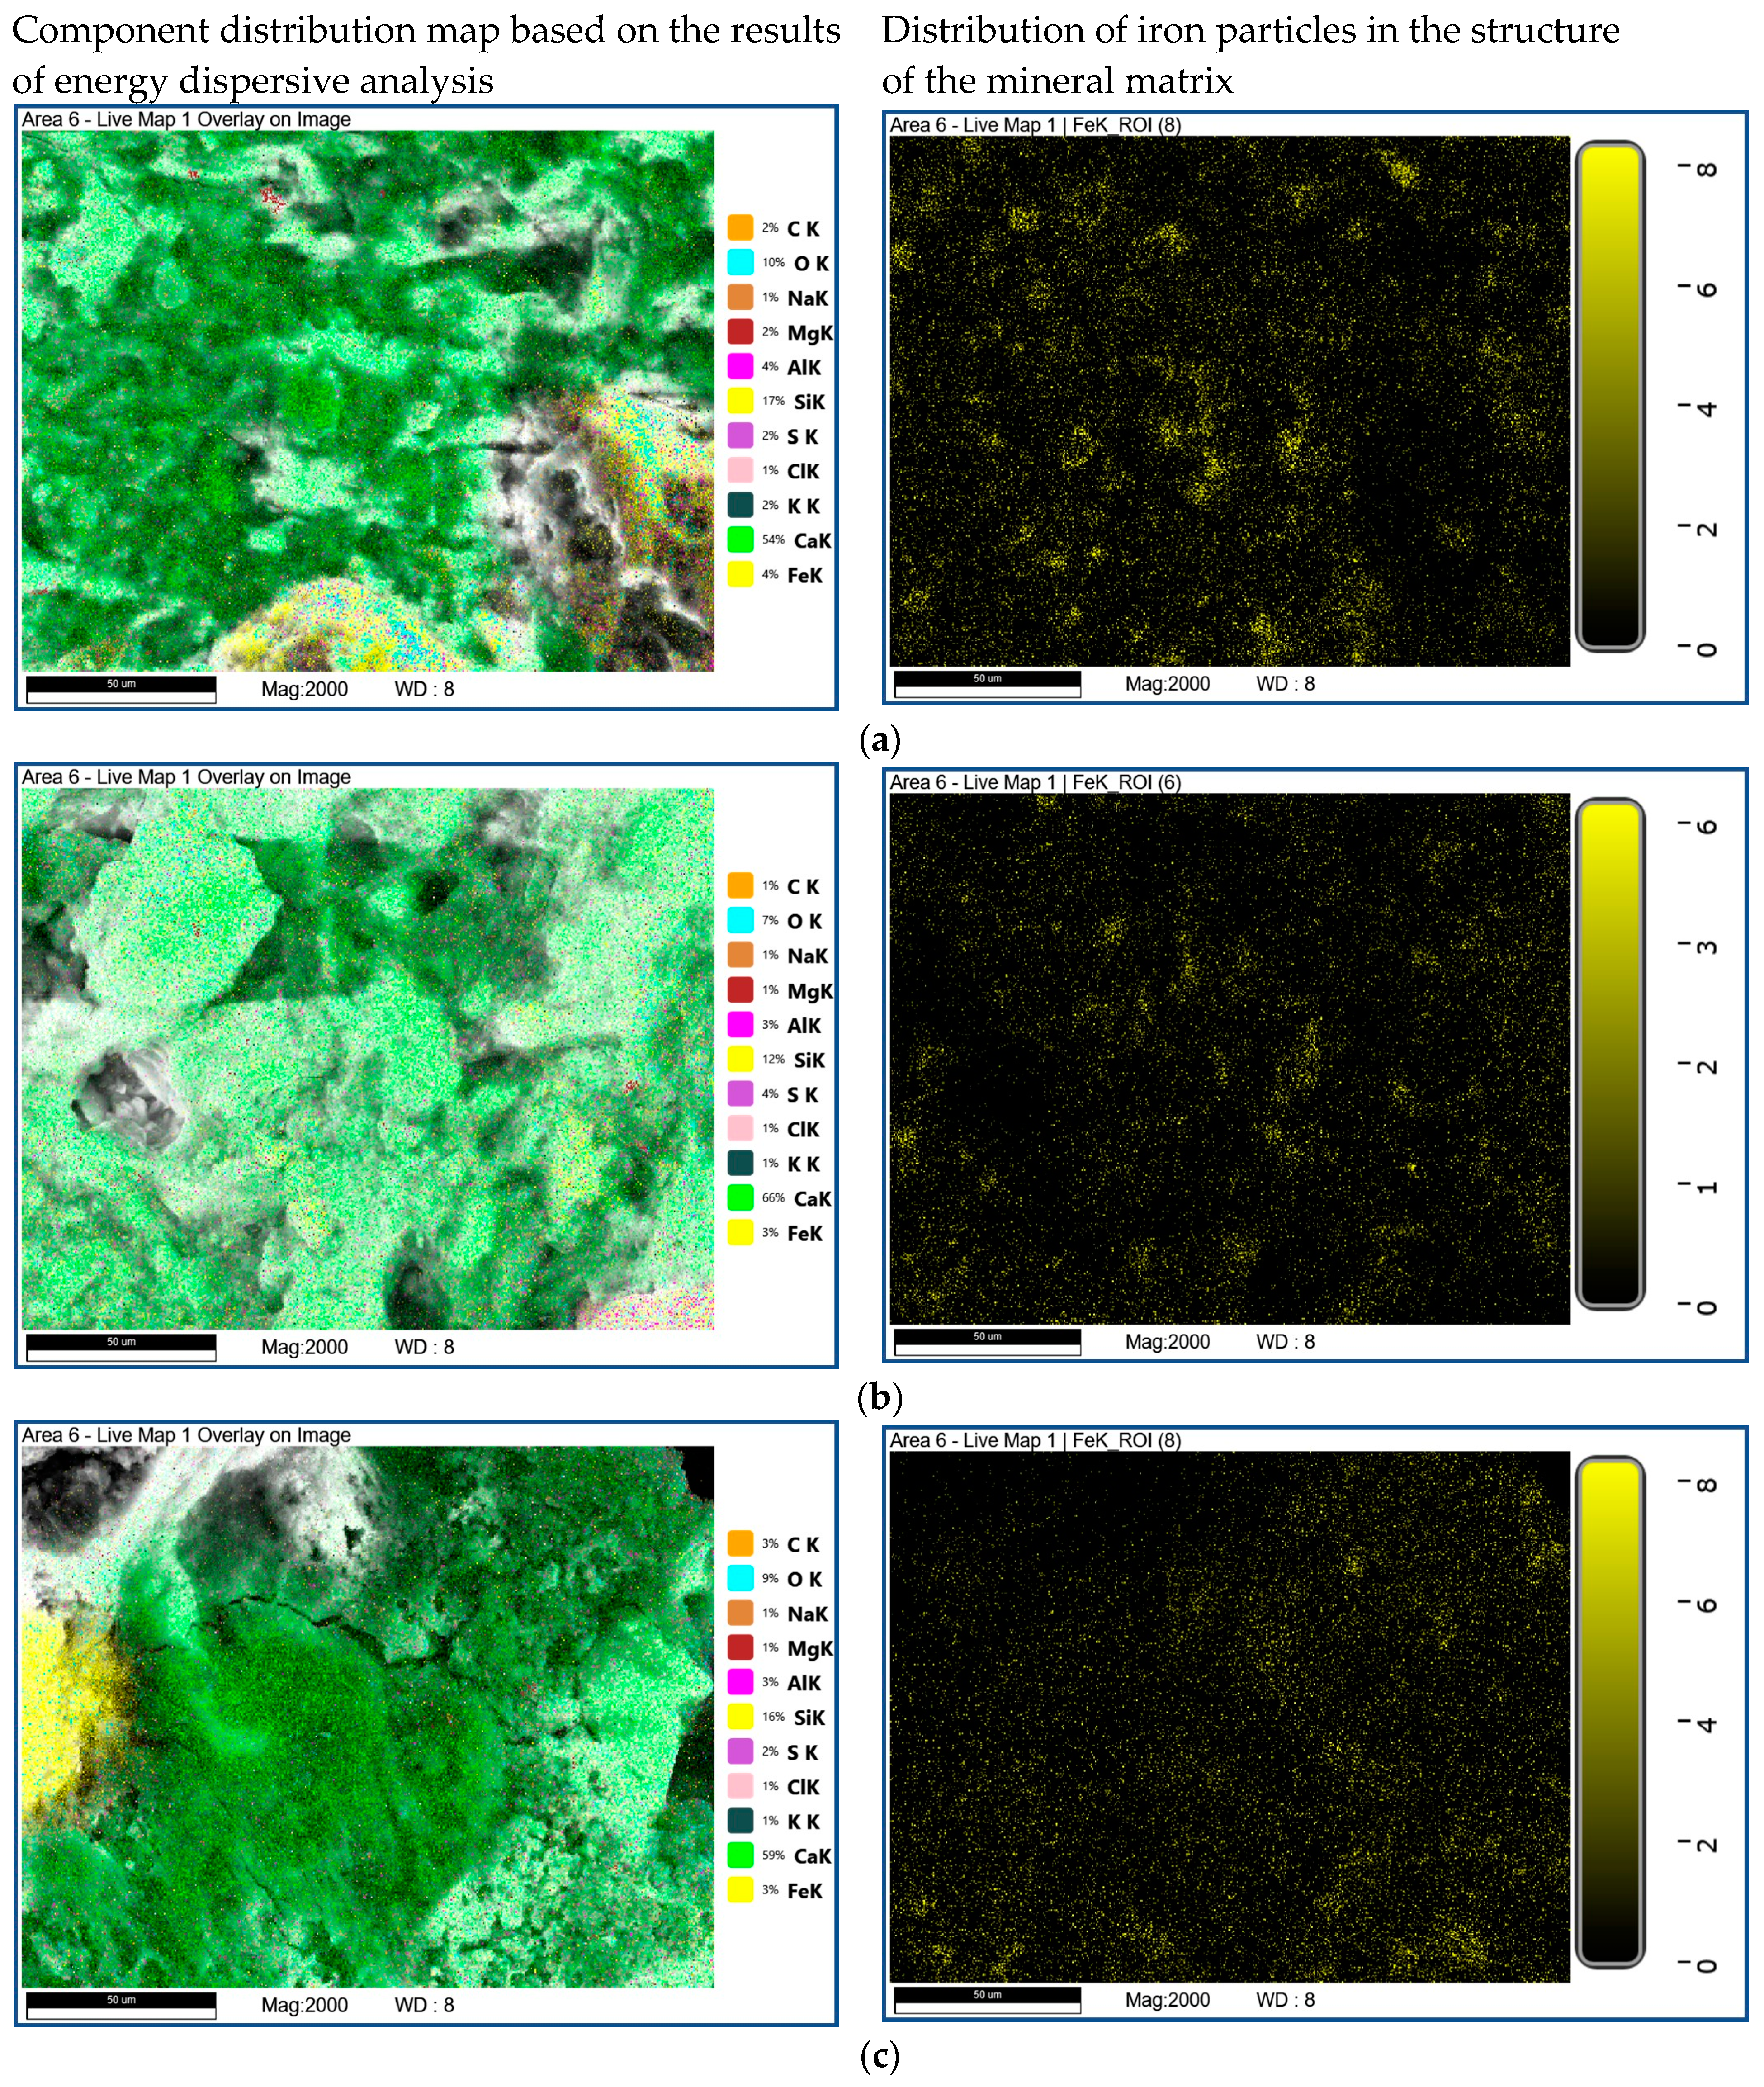
  • Morphological analysis of new formations showed the presence of an expansive phase, uniaxial calcium hydroxide crystals, and a significant amount of calcium aluminoferrites. These new formations were evenly distributed in the control and electrically conductive composites, while their location was mainly concentrated in the near-surface zone of the mineral matrix, which was associated with the migration of elements towards the cathode;
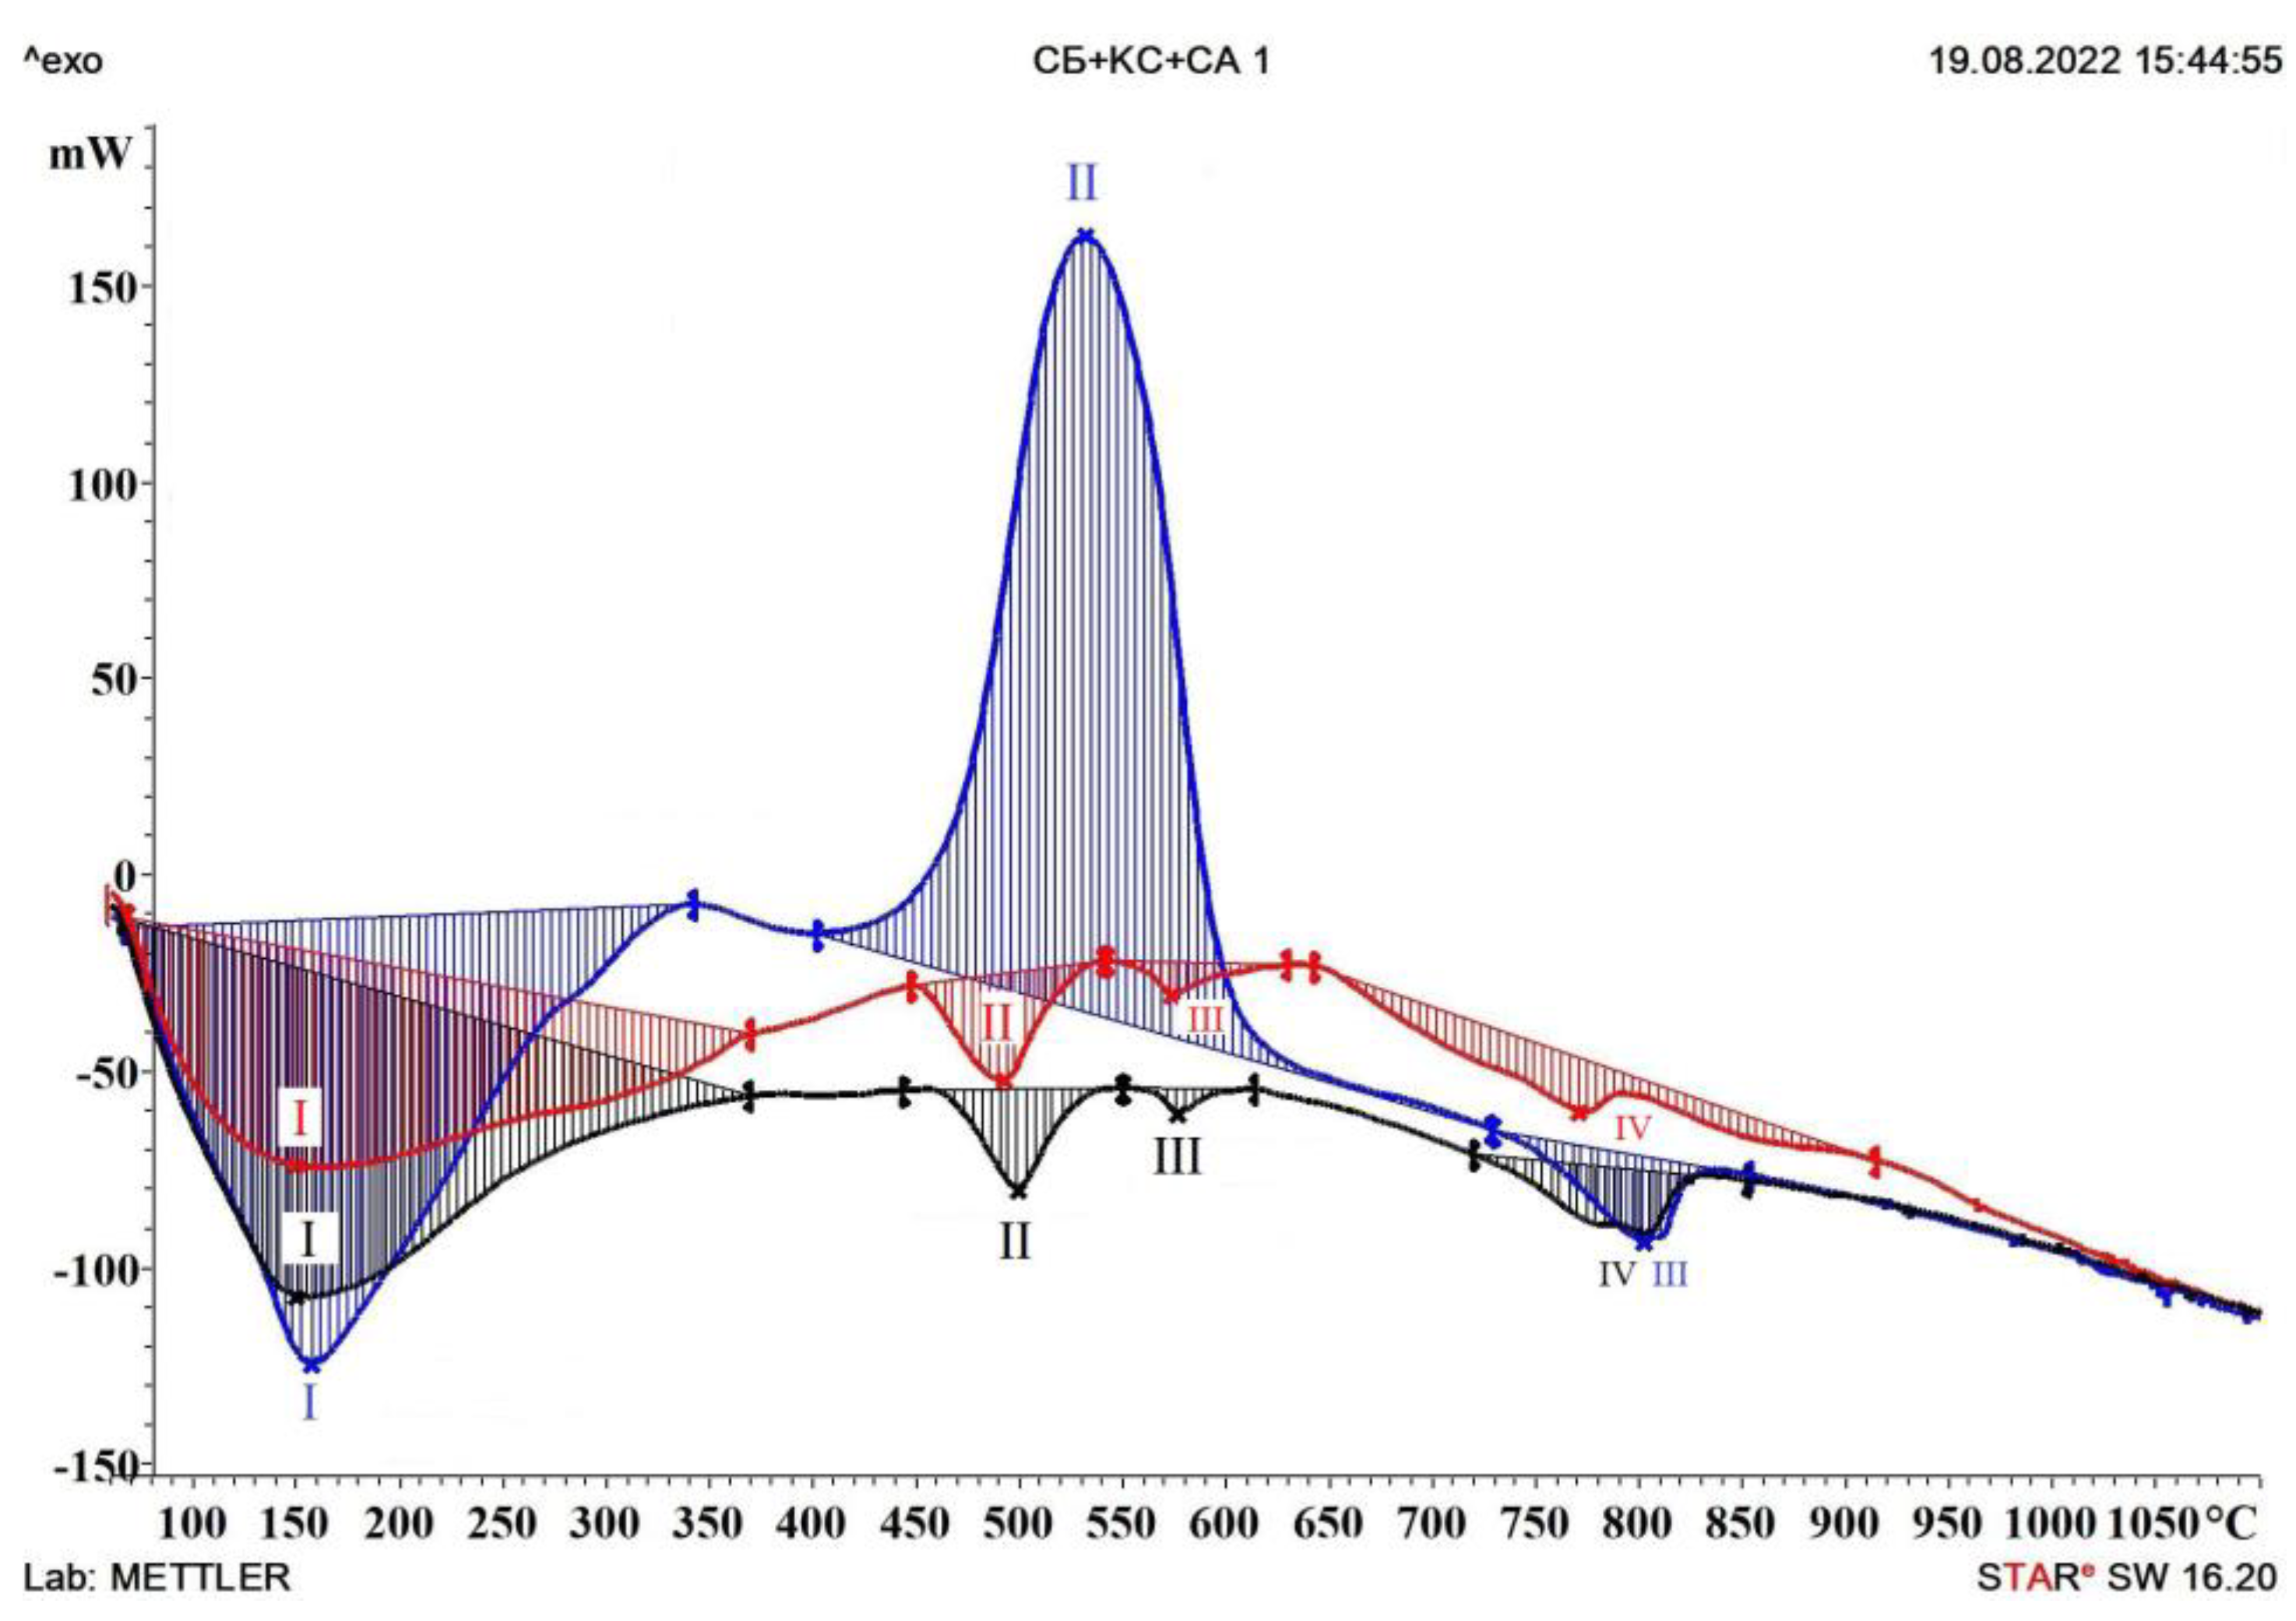
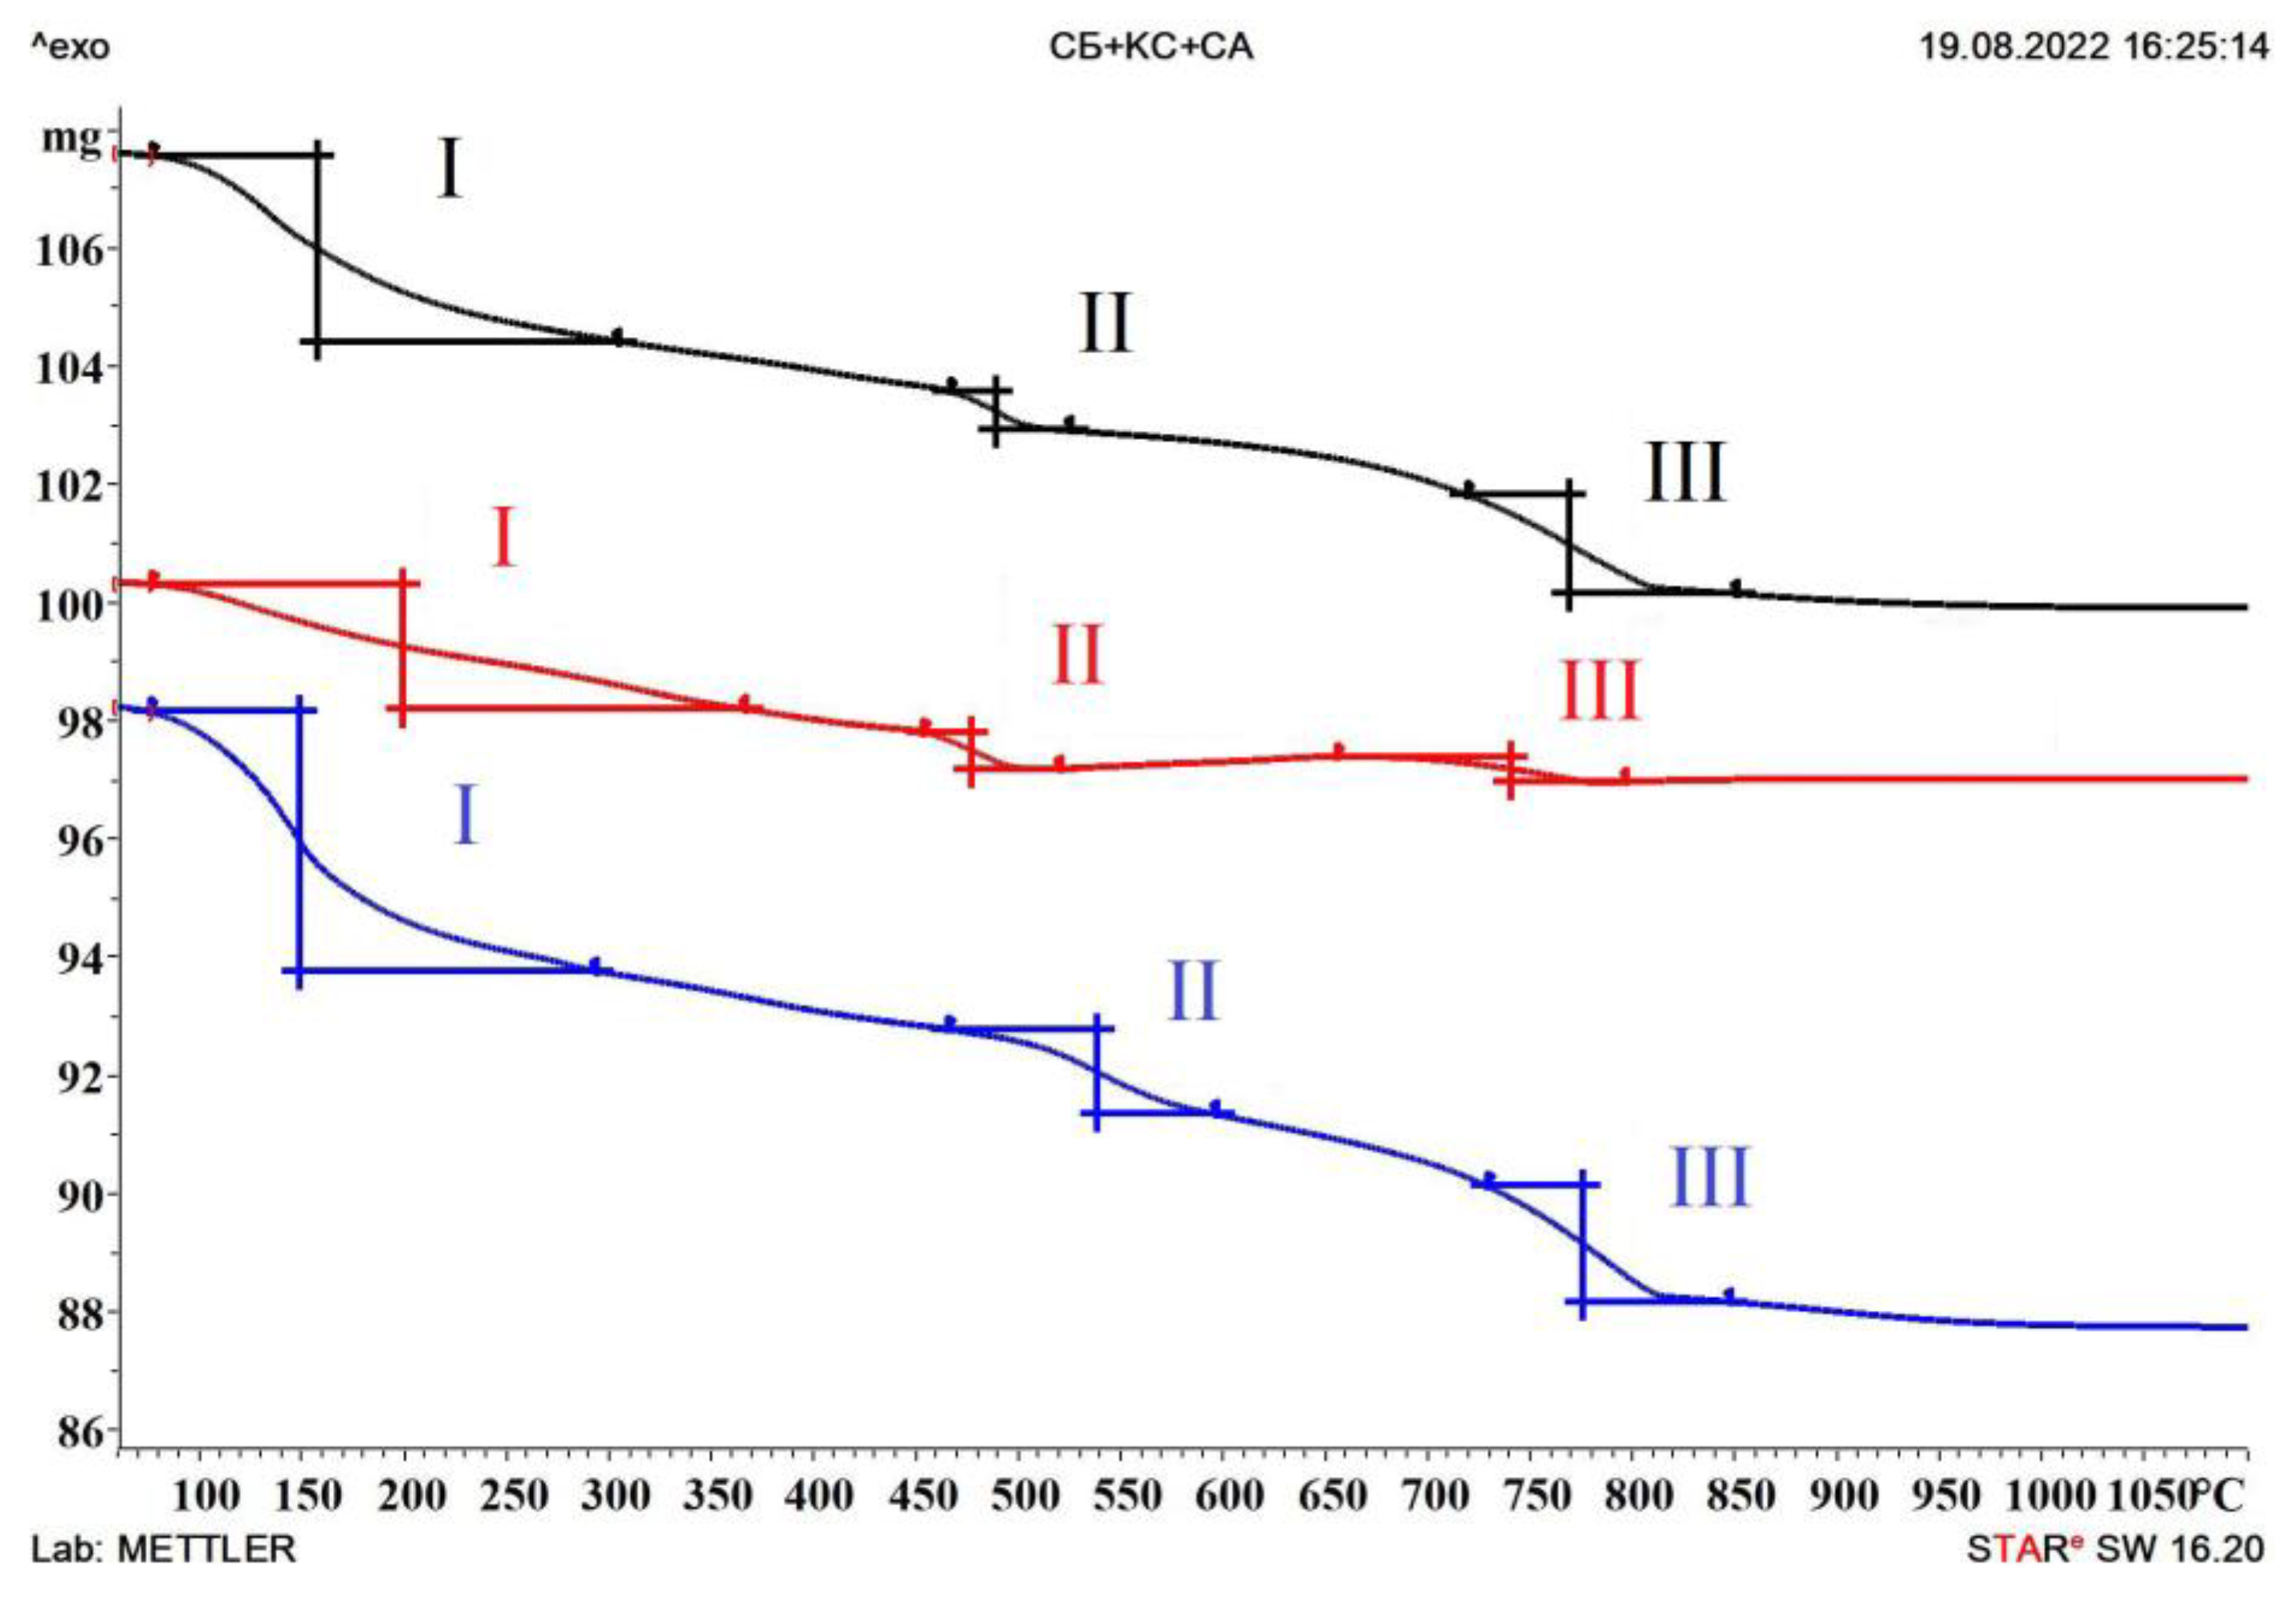
  • Comparative analysis of the results for the differential thermal analysis made it possible to establish differences between the features of the effects of electrochemical corrosion on the physicochemical properties of the mineral matrix with different electrical characteristics. The electrically insulating and electrically conductive composites were characterized by a greater mass loss as a result of the dissociation of cement hydration products in temperature ranges of 90 to 400 and 720 to 850 °C.
In the future, we plan to study the effects of electrochemical corrosion on reinforced samples of high-density concrete with specified electrical characteristics, as well as the properties of coatings based on industrial sulfur when exposed to electrochemical corrosion.

Author Contributions

Conceptualization, A.G. (Anastasiya Gordina) and A.G. (Aleksandr Gumenyuk); methodology, A.G. (Aleksandr Gumenyuk) and I.P.; software, A.G. (Anastasiya Gordina) and A.G. (Aleksandr Gumenyuk); validation, G.Y. and V.Č.; investigation, A.G. (Aleksandr Gumenyuk) and I.P.; resources, G.Y.; data curation, A.G. (Anastasiya Gordina) and I.P.; writing—original draft preparation, A.G. (Aleksandr Gumenyuk) and I.P.; writing—review and editing, I.P. and A.G. (Anastasiya Gordina); visualization, A.G. (Aleksandr Gumenyuk); supervision, G.Y. and V.Č.; project administration, A.G. (Anastasiya Gordina). All authors have read and agreed to the published version of the manuscript.

Funding

The present study was funded by RFBR and CSF under the research projects No. 19-53-26011 and No. 20-09072J.

Data Availability Statement

Not applicable.

Acknowledgments

Not applicable.

Conflicts of Interest

The authors declare no conflict of interest.

References

  1. Ramachandran, V.S. Calcium chloride in concrete—Applications and ambiguities. Can. J. Civ. Eng. 1978, 5, 213–221. [Google Scholar] [CrossRef] [Green Version]
  2. Stark, J.; Wicht, B. Concrete Durability/Translation from German, 1st ed.; RIA Quintet: Weimar, Germany, 2004; p. 295. [Google Scholar]
  3. Alekseev, S.N. Corrosion and Protection of Reinforcement in Concrete. In NIIZHB Gosstroj USSR; Strojizdat: Russia, Moscow, 1968; p. 245. [Google Scholar]
  4. Tuutti, K. Corrosion of Steel in Concrete; Swedish Cement and Concrete Research Institute: Stockholm, Sweden, 1982; p. 473. [Google Scholar]
  5. Jones, D.A. Principles and Prevention of Corrosion, 2nd ed.; Prentice-Hall, Inc.: New York, NY, USA, 1996. [Google Scholar]
  6. Lvovich, V.F. Impedance Spectroscopy: Applications to Electrochemical and Dielectric Phenomena; John Wiley & Sons, Inc.: Hoboken, NJ, USA, 2012. [Google Scholar]
  7. Bertolini, L.; Polder, R.B. TNO Report—Concrete Resistivity and Reinforcement Corrosion Rate as a Function of Temperature and Humidity of the Environment; TNO Building and Construction Research: Brussel, Belgium, 1997. [Google Scholar]
  8. Al-Akhras, N.; Makableh, Y.; Dagamseh, D. Evaluating composite nanomaterials to control corrosion of reinforcing steel using different tests. Case Stud. Constr. Mater. 2022, 16, e00963. [Google Scholar] [CrossRef]
  9. Park, J.; Jung, M. Evaluation of the Corrosion Behavior of Reinforced Concrete with an Inhibitor by Electrochemical Impedance Spectroscopy. Materials 2021, 14, 5508. [Google Scholar] [CrossRef]
  10. John, D.G.; Searson, P.C.; Dawson, J.L. Use of AC Impedance Technique in Studies on Steel in Concrete in Immersed Conditions. Br. Corros. J. 1981, 16, 102–106. [Google Scholar] [CrossRef]
  11. Hornbostel, K.; Larsen, C.K.; Geiker, M.R. Relationship between concrete resistivity and corrosion rate—A literature review. Cem. Concr. Compos. 2013, 39, 60–72. [Google Scholar] [CrossRef]
  12. Bolzoni, F.; Brenna, A.; Ormellese, M. Recent advances in the use of inhibitors to prevent chloride-induced corrosion in reinforced concrete. Cem. Concr. Res. 2022, 154, 106719. [Google Scholar] [CrossRef]
  13. Chen, Z.; Koleva, D. Corrosion Behavior of Reinforcing Steel Undergoing Stray Current and Anodic Polarization. Materials 2021, 14, 261. [Google Scholar] [CrossRef] [PubMed]
  14. Bernatsky, A.F. Electrical Insulating Concrete (Technology, Properties, Constructions); EDN: Novosibirsk, Russia, 2016; p. 186. [Google Scholar]
  15. Pan, T.; Nguyen, T.A.; Shi, X. Assessment of Electrical Injection of Corrosion Inhibitor for Corrosion Protection of Reinforced Concrete. Transp. Res. Rec. J. Transp. Res. Board 2008, 2044, 51–60. [Google Scholar] [CrossRef] [Green Version]
  16. Thi, H.Y.N.; Yokota, H.; Hashimoto, K. Effects of Electrochemical Chloride Extraction on Hydrated Products of Various Cement Paste Systems. J. Adv. Concr. Technol. 2015, 13, 564–582. [Google Scholar] [CrossRef] [Green Version]
  17. Gouda, V.K. Corrosion and corrosion inhibition of reinforcing steel I. Immersed in alkaline solution. Br. Corros. 1970, 5, 198–203. [Google Scholar] [CrossRef]
  18. Mundra, S.; Provis, J.L. Mechanisms of passivation and chloride-induced corrosion of mild steel in sulfide-containing alkaline solutions. J. Mater. Sci. 2021, 56, 14783–14802. [Google Scholar] [CrossRef]
  19. Liu, Y.; Shi, X. Stochastic Modeling of Service Life of Concrete Structures in Chloride-Laden Environments. J. Mater. Civ. Eng. 2012, 24, 381–390. [Google Scholar] [CrossRef]
  20. Kim, J.-K.; Yee, J.-J.; Kee, S.-H. Electrochemical Deposition Treatment (EDT) as a Comprehensive Rehabilitation Method for Corrosion-Induced Deterioration in Concrete with Various Severity Levels. Sensors 2021, 21, 6287. [Google Scholar] [CrossRef] [PubMed]
  21. Wenger, F.; Galland, J. Analysis of local corrosion of large metallic structures or reinforced concrete structures by electrochemical impedance spectroscopy (EIS). Electrochim. Acta 1990, 35, 1573–1578. [Google Scholar] [CrossRef]
  22. Morris, W.; Vico, A.; Vazquez, M. Chloride induced corrosion of reinforcing steel evaluated by concrete resistivity measurements. Electrochim. Acta 2004, 49, 4447–4453. [Google Scholar] [CrossRef]
  23. Andrade, C.; Alonso, C. Corrosion rate monitoring in the laboratory and on-site. Constr. Build. Mater. 1996, 10, 315–328. [Google Scholar] [CrossRef]
  24. Garg, R.; Garg, R.; Singla, S. Experimental Investigation of Electrochemical Corrosion and Chloride Penetration of Concrete Incorporating Colloidal Nanosilica and Silica fume. J. Electrochem. Sci. Technol. 2021, 12, 440–452. [Google Scholar] [CrossRef]
  25. Poupard, O.; Aït-Mokhtar, A.; Dumargue, P. Corrosion by chlorides in reinforced concrete: Determination of chloride concentration threshold by impedance spectroscopy. Cem. Concr. Res. 2004, 34, 991–1000. [Google Scholar] [CrossRef]
  26. Zhang, F.; Wei, F.; Wu, X.; Hu, Z.; Li, X.; Gao, L. Study on Concrete Deterioration and Chloride Ion Diffusion Mechanism by Different Aqueous NaCl-MgSO4 Concentrations. Buildings 2022, 12, 1843. [Google Scholar] [CrossRef]
  27. Zhang, F.; Hu, Z.; Dai, L.; Wen, X.; Wang, R.; Zhang, D.; Song, X. Study on Corrosion Mechanism of Different Concentrations of Na2SO4 Solution on Early-Age Cast-In-Situ Concrete. Materials 2021, 14, 2018. [Google Scholar] [CrossRef]
  28. Abdulsada, S.A.; Kristaly, F.; Torok, T.I. Distribution of corrosion products at the steel-concrete interface of XD3 concrete samples. Mag. Civ. Eng. 2020, 100, 10005. [Google Scholar] [CrossRef]
  29. Ma, Z.; Shen, J.; Wang, C.; Wu, H. Characterization of sustainable mortar containing high-quality recycled manufactured sand crushed from recycled coarse aggregate. Cem. Concr. Compos. 2022, 132, 104629. [Google Scholar] [CrossRef]
  30. Liu, Y.; Lin, P.; Ma, J. Diffusion Behavior of Chloride Ions in Concrete Box Girder under the Influence of Load and Carbonation. Materials 2020, 13, 2117. [Google Scholar] [CrossRef] [PubMed]
  31. Aperador, W.; Bautista-Ruiz, J.; Sánchez-Molina, J. Effect of Immersion Time in Chloride Solution on the Properties of Structural Rebar Embedded in Alkali-Activated Slag Concrete. Metals 2022, 12, 1952. [Google Scholar] [CrossRef]
  32. Runci, A.; Provis, J.L.; Serdar, M. Revealing corrosion parameters of steel in alkali-activated materials. Corros. Sci. 2023, 210, 110849. [Google Scholar] [CrossRef]
  33. Abdel-Gaber, A.; Khamis, E.; Abo-ElDahab, H.; Adeel, S. Inhibition of aluminium corrosion in alkaline solutions using natural compound. Mater. Chem. Phys. 2008, 109, 297–305. [Google Scholar] [CrossRef]
  34. Pan, C.; Li, X.; Mao, J. The Effect of a Corrosion Inhibitor on the Rehabilitation of Reinforced Concrete Containing Sea Sand and Seawater. Materials 2020, 13, 1480. [Google Scholar] [CrossRef] [Green Version]
  35. Izmailov, N.A. Electrochemistry of Solutions; Chemistry: Moscow, Russia, 1976; 488p. [Google Scholar]
  36. Ganeshan, M.; Venkataraman, S. Durability and microstructural studies on fly ash blended self-compacting geopolymer concrete. Eur. J. Environ. Civ. Eng. 2021, 25, 2074–2088. [Google Scholar] [CrossRef]
  37. Lialikov, U.S. Physico-Chemical Methods of Analysis, 5th ed.; Chemistry: Moscow, Russia, 1973; p. 536. [Google Scholar]
  38. Li, C.; Jiang, L. The role of chloride binding mechanism in the interpretation of chloride profiles in concrete containing limestone powder. J. Sustain. Cem.-Based Mater. 2023, 12, 24–35. [Google Scholar] [CrossRef]
  39. Aguirre-Guerrero, A.M.; Robayo-Salazar, R.A.; de Gutiérrez, R.M. Corrosion resistance of alkali-activated binary reinforced concrete based on natural volcanic pozzolan exposed to chlorides. J. Build. Eng. 2021, 33, 101593. [Google Scholar] [CrossRef]
  40. Martinez, I.; Castellote, M. Preliminary Study of the Influence of Supplementary Cementitious Materials on the Application of Electro Remediation Processes. Materials 2021, 14, 6126. [Google Scholar] [CrossRef] [PubMed]
  41. Criado, M.; Bernal, S.A.; Garcia-Triñanes, P.; Provis, J.L. Influence of slag composition on the stability of steel in alkali-activated cementitious materials. J. Mater. Sci. 2018, 53, 5016–5035. [Google Scholar] [CrossRef] [PubMed] [Green Version]
  42. Yakovlev, G.; Polyanskikh, I.; Gordina, A.; Pudov, I.; Černý, V.; Gumenyuk, A.; Smirnova, O. Influence of Sulphate Attack on Properties of Modified Cement Composites. Appl. Sci. 2021, 11, 8509. [Google Scholar] [CrossRef]
  43. Gordina, A.; Gumenyuk, A.; Polyanskikh, I.; Yakovlev, G.; Pudov, I. Study of the Structure and Properties of Electrical Sand Concrete under Prolonged Exposure to Sulfate Environment. Materials 2022, 15, 8542. [Google Scholar] [CrossRef]
  44. Gumeniuk, A.; Hela, R.; Polyanskikh, I.; Gordina, A.; Yakovlev, G. Durability of Concrete with Man-made Thermoplastic Sulfur Additive. IOP Conf. Series Mater. Sci. Eng. 2020, 869, 032012. [Google Scholar] [CrossRef]
  45. Samchenko, S.V. Formirovanie and Genesis Struktury Cementnogo Kamny; MGSU, Ai Pi Er Media, EBS ASV: Moscow, Russia, 2016; p. 284. [Google Scholar]
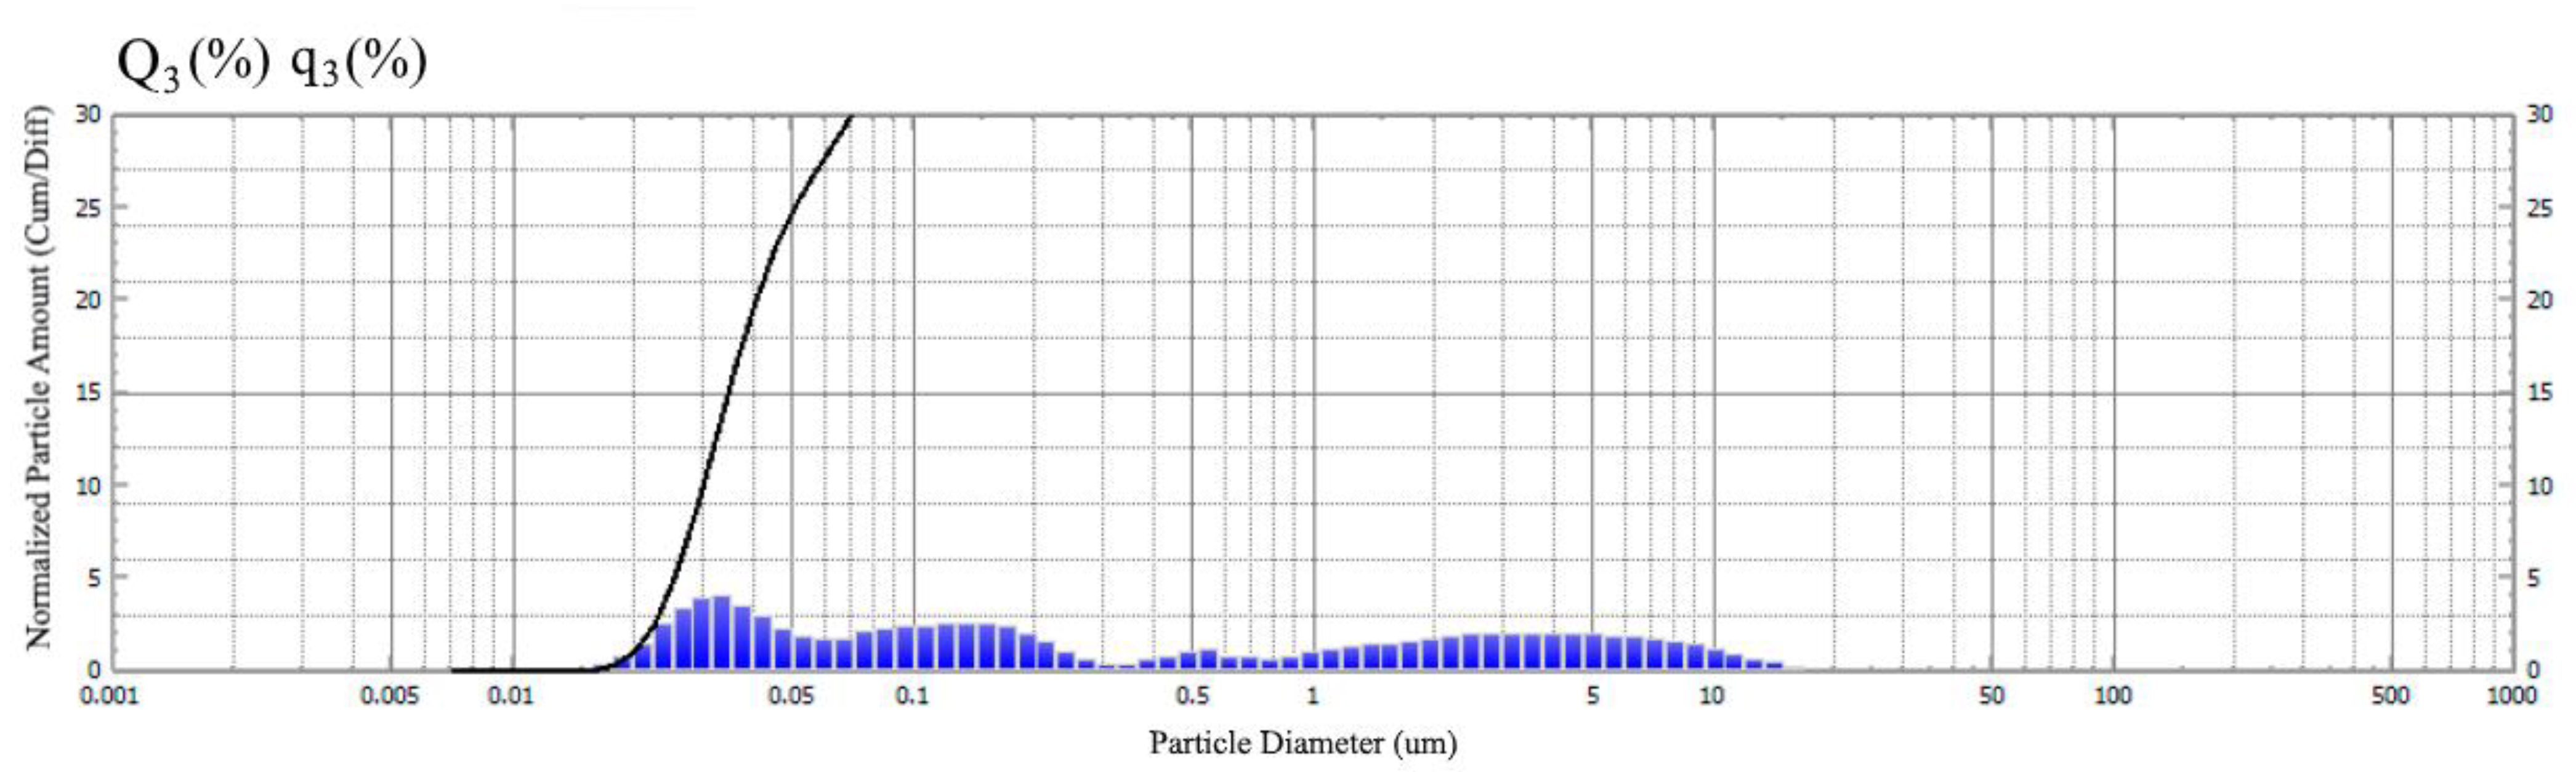
Figure 1. Granulometric composition of the dispersed phase of the electrically conductive additive [42].
Constrmater 03 00013 g001
Figure 2. Scheme of the voltage supply method.
Constrmater 03 00013 g002
Figure 3. Change in current density for samples with different electrical parameters.
Constrmater 03 00013 g003
Figure 4. Electric potential of reinforcement located in samples subjected to electroosmotic action of NaCl 5%.
Constrmater 03 00013 g004
Figure 5. Results of the study of the microstructure of samples of the control (a), electrically insulating (b), and electrically conductive (c) composites.
Constrmater 03 00013 g005aConstrmater 03 00013 g005b
Figure 6. Results of energy dispersive X-ray spectroscopy combined with mapping. All samples were taken from the areas located near the reinforcing bars: control (a), electrically insulating (b), and electrically conductive (c) composites.
Constrmater 03 00013 g006
Figure 7. Spectra of differential scanning calorimetry: control (red), electrically conductive (blue), and electrically insulating (black) compounds after 200 days in 5% NaCl solution.
Constrmater 03 00013 g007
Figure 8. Thermogravimetric analysis curves: control (red), electrically conductive (blue), and electrically insulating (black) compounds.
Constrmater 03 00013 g008
Table 1. Distribution parameters of the granulometric composition of the electrically conductive additive in % by weight [42].
Particle Sizes, μmContent, %
0.014–0.09134.8
0.1–1.0528.3
1.05–2036.9
Table 2. Component ratio of composites.
SampleCEM I 42.5, gQuartz Sand, gIndustrial Soot, %Industrial Sulfur, %Calcium Nitrate, %Polymer–Cement RatioWater–
Cement Ratio
Reference8001600----0.5
Non-conductive concrete-7-0.5
Electrically conductive concrete7-3-
Table 3. Comparison of the intensity of effects in the studied composites.
EffectControlEffectElectrically ConductiveEffectElectrically Non-Conductive
StartPeakEndStartPeakEndStartPeakEnd
I−2043068.1149.5366.9I−2929068.3157.5293.7I−2584065.3150305.2
II−2229.21453.7492520.8II35730465.1531.5596.5II−1741.22467.8499.5525.2
III−519.93558.6574603.2III−2052.32729802847.2III−241.2564.9576.5595.0
IV−3215.61655.0771796.2 IV−1869.35718.7802851.1
Table 4. Comparison of results for thermograms of the studied composites.
StageControlElectrically ConductiveElectrically Non-ConductiveEffect
Temperature RangeMass Loss, %Temperature RangeMass Loss, %Temperature RangeMass Loss, %
I68.1–366.92.168.3–293.74.565.3–305.22.9dehydration of cement hydration products
II453.7–520.80.6465.1–596.51.5 *467.8–525.20.6thermal decomposition of calcium hydroxide
III, IV655–796.20.4729–847.22.1718.7–851.11.6decomposition of hydroalumoferrites, calcium hydrosilicates, and calcium carbonate
* This effect for the electrically conductive composite was due to the carbon black oxidation reaction. This thermal effect overlapped with all other effects.
Disclaimer/Publisher’s Note: The statements, opinions and data contained in all publications are solely those of the individual author(s) and contributor(s) and not of MDPI and/or the editor(s). MDPI and/or the editor(s) disclaim responsibility for any injury to people or property resulting from any ideas, methods, instructions or products referred to in the content.

