1. Introduction
Construction, rehabilitation, and maintenance of highway pavements require obtaining, processing, transporting, manufacturing, and placement of large amounts of construction materials. Pavements, in fact, represent one of the most important infrastructural assets and require massive investments. The need to design and provide a sustainable maintenance service is becoming a priority and this comes mutually with the intention to reduce impacts caused by maintenance treatments to the environment.
Several tools are available to quantify and compare materials and techniques in terms of environmental sustainability. Unfortunately, articles and manuals describing such tools base the evaluation of the environmental impact on a different set of data. This makes it difficult to adopt a single, universally-recognized method to have a direct comparison of pavement preservation and maintenance treatment options in terms of environmental sustainability [
1].
With the recent inclusion of environmental consideration into public procurement, also known as Green Public Procurement (GPP), a comprehensive and official approach to the sustainability analysis of flexible pavements is needed. Starting from that, a third-parties verified declaration known as Environmental Product Declaration (EPD) certification was introduced.
In 2013, the EU founded the EDGAR project, aiming at supporting the National Road Administrations in the sustainability assessment of novel green bituminous mixtures and bridging the gap between innovation and adoption [
2]. The methodology developed within the project considered both the environmental aspects which rule the EPD declaration, but also socio-economic factors and a long-term vision of sustainable aspects. In 2013, starting from the Norwegian EFFEKT model [
3], the LICCER model was presented with the objective to provide planners with quantitative information to assess life cycle cumulative energy consumption and greenhouse gas emissions of road corridor alternatives [
4]. Additional efforts were also made in the characterization of maintenance operations with the HERMES project that developed a methodology enabling the selection of the best available technology and strategy with the lowest cost for the environment and society. The overall objective of this research project was to establish a long-term dynamic inventory of carbon emissions deriving from the analysis of a variety of urban roads, based on best practices in Europe and China [
5]. All of the projects mentioned emphasize the complexity of the assessments resulting from the large number of factors to be considered. In some cases, the models developed are based on simplifications that consider a limited set of parameters included in EPD certifications. In each project, however, the need to have a single indicator that is overall representative of the environmental impact is noted. Lastly, it can be pointed out that, none of the mentioned projects took into account parameters related to performance and, in particular, the durability of the materials considered.
Starting from these considerations, the present work proposes to develop an innovative index named Environmental Asphalt Rating (EAR) which, still starting from the parameters derivable from EPD certifications, aims to:
Unambiguously quantify the potential environmental impact due to different maintenance strategies;
Provide to Autostrade per l’Italia (ASPI), in its capacity as contracting authority, a reference parameter for the evaluation of technical offers and the assignment of scores in the tender phase in terms of environmental impact;
Monitor and fully estimate the impacts on the basis of the bids submitted by the awarded contractors.
The EAR index proposed here has been designed as a dimensionless value that can collect and summarize all the information that can be extracted from EPD certifications. To do this, it was necessary to define values to normalize the different parameters in order to make them comparable in numerical terms and congruent from a physical and mathematical point of view. Moreover, since the different environmental parameters do not have the same impact in relation to the specific application context under study, it was decided to assign different weights to the different parameters. The definition of these weights has been described in
Section 5.1.
The index obtained through the normalization and weighting processes of the different parameters then provides a dimensionless number summarising the different environmental impacts of a given pavement maintenance process. However, the opinion of the authors is that an environmental impact index defined only from the parameters derived from EPD certifications cannot be considered exhaustive if it does not also take into account the mechanical performance and the service life of the mixtures evaluated through the index itself. Since the index must be able to quantify any proposals for improvement over the entire life cycle, the assessment must necessarily also take into account the service life of the asphalt mixtures considered in order to compare them to reference mixtures (i.e., the current state-of-the-art). For this reason, alongside the environmental parameters, it was decided to create performance parameters to be applied to the overall definition of the EAR index. These parameters are used as multiplier coefficients for the EAR index obtained from environmental data only, as will be explained in the next Section
Section 5.2.
Finally, the EAR index was set in order to have variability between zero and one, hypothetical values representing the minimum and maximum environmental impact, respectively. On the contrary, the value of the index does not have a maximum threshold value but increases as the environmental impact increases. The decision not to have a maximum threshold value was also supported by the fact that it is not possible to identify absolute reference values against which to relate the value of the index.
2. Regulatory Framework
The issue of environmental aspects in public administration spending appeared for the first time in the Green Paper “Public Procurement in the European Union”, a communication adopted by the European Commission on 27 November 1996 (COM (1996) 583) [
6], which introduced the possibility of integrating environmental aspects into the definition of procedures for the purchase of goods and services and the execution of works. The Green Paper takes note of the role of the Public Administration as a consumer, which can condition the supplier market towards products and production processes that pursue sustainability.
European Union legislators have implemented the Green Paper through a series of communications and directives. Communications COM (2001) 264 [
7], and COM (2001) 274 [
8], emphasized that EU member states should use public procurement to promote environmentally friendly products and services and that EU law offers the possibility of integrating environmental considerations into public procurement procedures. Communication COM (2003) 302 [
9] explicitly requires member states to adopt National Action Plans for Green Public Procurement (GPP). The GPP is defined in the Communication COM (2008) 400 [
10] as “a process whereby public authorities seek to procure goods, services and works with a reduced environmental impact throughout their life cycle when compared to goods, services and works with the same primary function that would otherwise be procured". GPP is a voluntary instrument so each Member State and public authorities can determine the extent to which they implement it. In Italy, the legislation has been implemented in the National Action Plan on Green Public Procurement (PAN GPP) [
11], updated by the Ministerial Decree of 10 April 2013. From this plan comes the Minimum Environmental Criteria (CAM) that, as far as flooring is concerned, is currently being defined. Subsequently, the inclusion of the CAM within the tender documentation was introduced by Legislative Decree 50/2016 [
12].
In general, the regulatory framework discussed shows how public bodies and infrastructure managers are called upon to set environmental objectives and to do so by preparing criteria that are scientifically supported, easily verifiable, and that tend to encourage innovation in products and processes to reduce their impact on the environment. It is from these considerations that the present study and the formulation of the EAR environmental index proposed here originated.
3. Environmental Product Declaration EPD
The development of the index for the quantification of the environmental impact of the asphalt concrete production and paving cycle developed in this article stems from the information and the adopted procedures for the production of the Environmental Product Declaration (EPD) certification. EPD certification has been presented and described in the standards ISO 14025 and EN 15804 [
13,
14]. It is based on the adoption of common criteria and calculation rules derived from the Life Cycle Assessment (LCA) methodology applicable to a very wide range of products and processes. As discussed in the introduction, several scientific works, including the not previously mentioned work [
15], have demonstrated their effectiveness in assessing the production process and use of asphalt concrete.
Furthermore, in the present work, it was decided to adopt this certification because it allows the use of common and internationally recognized criteria and calculation rules for a large number of product categories, reporting information in a common and uniform format. To ensure this uniformity and harmonization of EPD certification formats, documents called Product Category Rules (PCRs) have been defined. These PCRs define the principles and requirements for the drafting of EPDs for each specific category of product or service. Specifically, the PCRs for asphalt concrete have been developed by the National Pavement Association [
16].
For the entire life cycle of materials, the assessment of environmental impact is carried out through the determination of several environmental factors described below by means of summary tables: parameters related to emissions (
Table 1), consumption of resources intended as raw materials and as energy (
Table 2), generation of waste and the management of different output flows (
Table 3).
All the pollutant components shown in the respective tables are quantified throughout production, installation (construction), use, and end-of-life phases, also assessing the potential for reuse, recovery, or recycling. All the different phases are reported and briefly described in the
Table 4.
Table 4 also indicates the relative codifications described in the EN standards used and reported in the EPD certifications. The phases considered in this study are highlighted in grey.
For the establishment of EPD certifications, it is possible to identify three different approaches that consider different system boundaries by considering only some of the phases described in
Table 4. These approaches are referred to as:
From cradle to gate. This is the most widely used approach to quantify the impact of the production cycle of materials, including the production and procurement of raw materials. In relation to the production phases, it can be said to correspond to phases A1 + A2 + A3.
From cradle to grave. This approach evaluates the entire production, construction, use, and end-of-life cycle, i.e., from stage A1 to stage D.
From cradle to gate with options. This last one is a hybrid approach that includes the minimum requirements present in the cradle-to-gate option with a few additional information modules from the cradle-to-grave EPD variation.
In the case of asphalt concretes, and in the context of maintenance works, the approach most commonly followed is the “from cradle to gate” one, since performance in terms of construction, use and end-of-life depends on variables that are difficult to control and measure [
15]. However, in the case under consideration, it was deemed appropriate to also quantify the phases of transport to the site and paving, i.e., phases A4 and A5, as they are strongly correlated with the effective organizational skills and efficiency of the machines employed by the contractor. In fact, in the context of maintenance works, a maximum distance of the production site from the paving site is set and the average distance of the production sites, with respect to the highway axis, represents a rewarding requirement. The hybrid approach has also been used to assess the impact of the transport phase in the yard and the paving phase with respect to the entire production cycle. Referring to
Table 4, the parts in grey represent the phases considered in this study.
4. Data Collection
EPD certification can be issued by specific certifying bodies and all published certifications can be consulted at the “EPD Italia” database [
17]. Therefore, the work of defining the EAR index continued with a collection of data derived from EPD certifications related to asphalt concrete published internationally [
18,
19,
20,
21,
22,
23,
24]. These certifications have been used to define the environmental impact due to phases A1, A2, and A3, as described in the next subsection. For what concern phases A4 and A5, referred to the impact due to the execution phase, the EPDs certifications very often provide no information. For this reason, it has been chosen to identify reference values (which have been used in the normalization process) no longer based on EPD certifications, but based on some characteristics of maintenance worksites commonly performed on Italian highway networks, better described in the following
Section 4.2.
4.1. EPD Certified Asphalt Mixtures
Publicly available EPD certifications were used to collect data on asphalt mixtures produced in European facilities. The names of the plants, the state in which they are located, and the reference to the EPD certification are listed below:
In addition to the EPD certifications of the plants mentioned above, the data reported in the following summary reports relating to the national contexts:
Environmental Product Declaration from Cradle to Gate. Production of hot mix asphalt concrete representative of the French market [
25] referred to in the following as “French market”.
Two summary reports provided by The Norwegian EPD Foundation representative of the asphalt mixtures of the Norwegian market, one for the wearing course [
26] and one for the base course [
27]. In the following, they will be referred to as “Norge wearing” and “Norge base”.
4.2. Impact Estimation of Construction Process Stage
The evaluations related to phases A4 and A5 (i.e., transport and laying of the asphalt concrete at the site) were carried out considering a typical work shift of 8 h during which there is an overlap of the phases of production of the asphalt concrete with the phases of the installation of the site, milling and transport to the landfill of the milled material. Specifically, the following assumptions were made for the various transport and installation phases:
Site signage installation operations have been neglected in the analysis.
For the analysis of emissions and consumption relating to the arrival of operating machinery at the construction site, the maximum distance between the production plant and the construction site allowed by the specifications, equal to , has been considered (i.e., the worst case).
During the production cycle, a quantity of produced material equal to 400 tons was considered as well as the use of 10 trucks to transport the asphalt granulate to the storage site and the hot mix from the production plant to the construction site. For the tractor-trailers, 4 trips of each were considered. The machines are transported by means of an articulated lorry equipped with a semi-trailer. It has been assumed that this operation involves 10 trips of .
The consumption of operating machinery was estimated in terms of hours of use for each 8-h shift. The adopted operating machines and the parameters for the evaluation of emissions related to phases A4 and A5 are reported in
Table 5.
The data extracted by the mentioned summary reports and construction process stage impact estimation are reported in
Table 6.
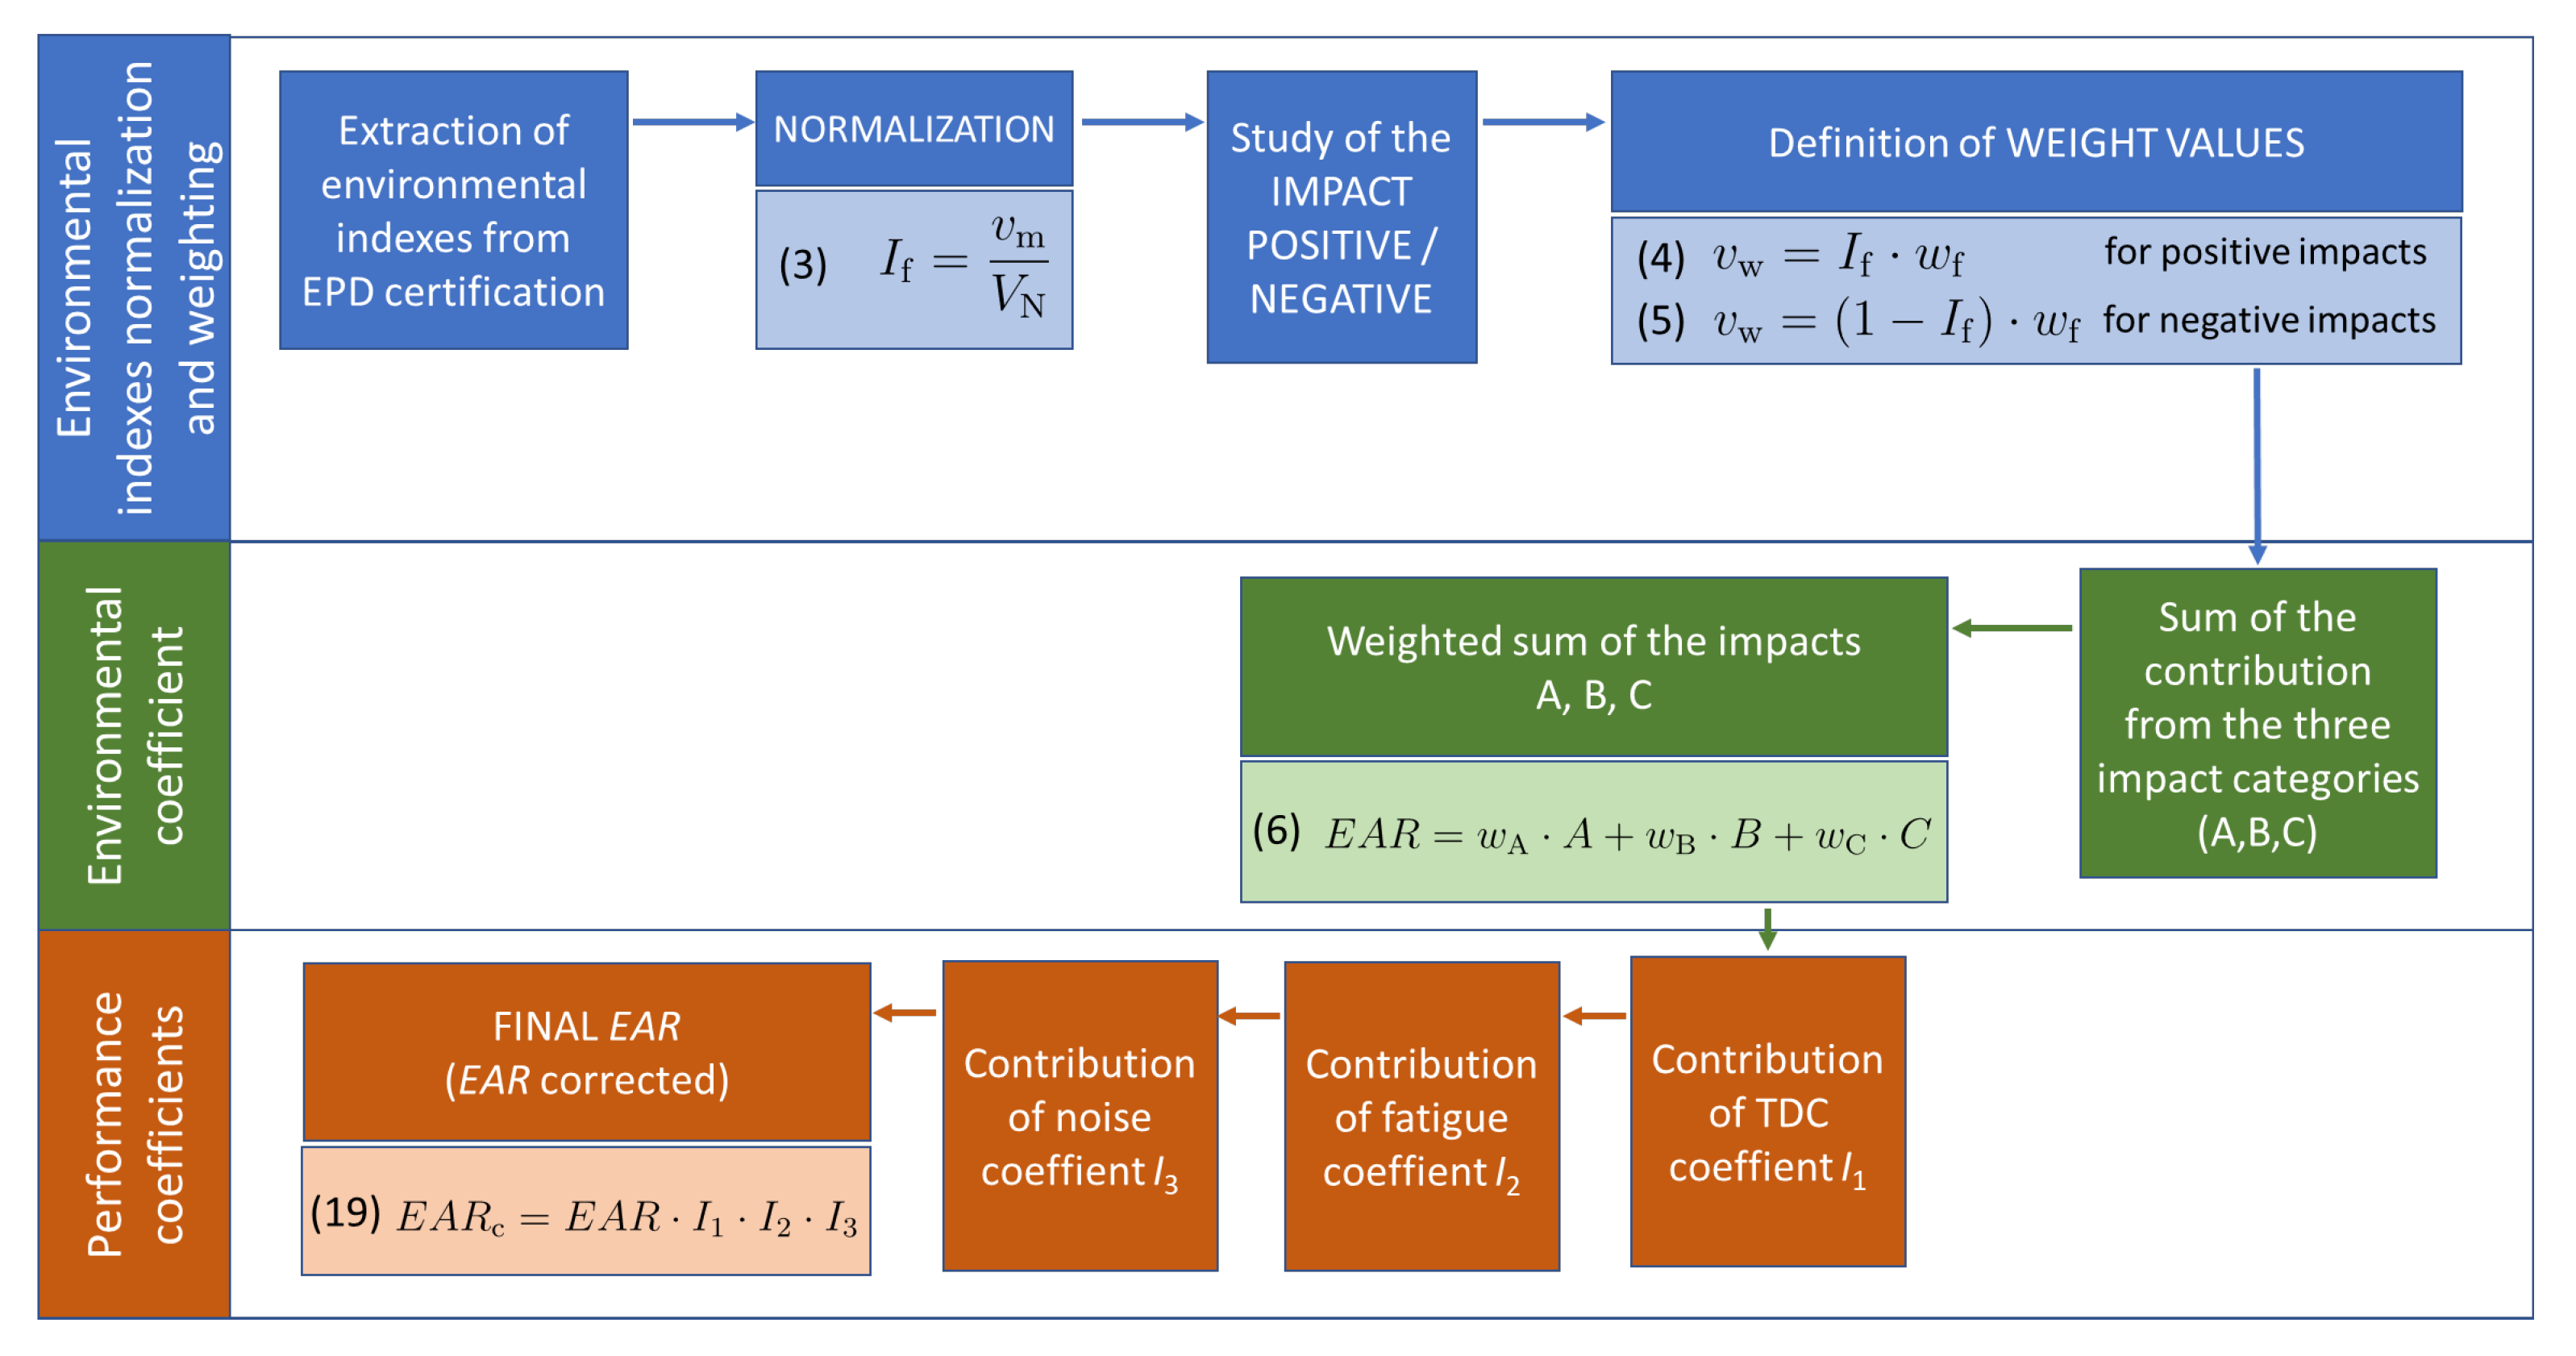
5. Data Processing and Definition of the EAR Index
As mentioned in the introduction, the process of calculating the EAR index for a generic asphalt mixture involves two main steps:
Normalization and weighting of the EPD parameters ( calculation). The first stage involves the normalization of the values of each individual EPD parameter. Moreover, since the different environmental parameters do not have the same impact in relation to the specific application context under study, it was decided to assign different weights to each parameter. Subsequently, the EAR index value is obtained through a linear combination of the different impact categories (emissions, use of resources, and output flows and waste categories).
Correction according to the expected performance of the asphalt mixture ( calculation).
Details of the calculation process of both indicators,
and
, have been given in
Section 5.1 and
Section 5.2.
5.1. Definition of the Normalization and Weight Values
The identification of factors for normalizing the environmental parameters started from the following considerations:
The parameters PERE and PENRE, related to resource consumption, are defined as a linear combination of other parameters namely:
Therefore, it was decided not to directly consider PERE and PENRE for the calculation of the EAR index in order to avoid redundancies.
At the current state of technology, the measurement of fresh water consumption and energy consumption material production data is highly error-prone. Therefore, in the current definition of the index, these parameters have been associated with a weight of zero. Nevertheless, the index has been defined so that these parameters can be included in the future as a result of advances in measurement technologies.
For normalization purposes, it was necessary to distinguish factors into positive versus negative ones. Positive factors mean those parameters whose environmental impact is lesser the greater the value presented by them. Conversely, negative factors are those parameters for which an increasing value implies a greater environmental impact. For example, the SM factor is considered a positive factor since it represents the number of materials used in the mixture and obtained from recycling processes (such as, for example, milled material or synthetic aggregates obtained from blast furnace slag). On the contrary, GWP represents the global warming potential in terms of kg of CO equivalent for which a higher value implies a higher negative impact on the environment. The factors labeled as positive are: PERM, PERT, SM, and RSF, CRU, MFR, MER, EEE, EET.
For all indicators, the normalization factor has been assumed to be equal to the maximum value obtained from the investigated sample consisting of EPD-certified mixtures.
The values of the weights have been identified through a preliminary assessment of the most significant impacts of the entire asphalt production process. In general, it is important to note that the impacts falling into category [A]—Emissions and impacts falling into category and [B]—Use of resources, are mutually influenced, especially since the production of CO is directly related to fuel consumption. The sum of the weights associated with each category has been set equal to 10. The highest weight was associated with GWP, while all factors associated with category [B] were given the same weight (with the exception of the PERE, PENRE and FW parameters as discussed above).
The normalization factors (indicated as
in the following), have been established as the maximum values reported in the EPD considered in the present study with the addiction of the impacts due to the phases A4 and A5. Both normalization and weight factors (indicated as
in the following) are reported in
Table 7.
For the calculation of the EAR index, the absolute value of each environmental parameter
is normalized through the normalization factor
obtaining a value that expresses the relative impact
of each environmental parameter:
The weighted value
for each parameter is obtained as a combination of the relative impact and the weighting factor according to the following relationships:
the overall value for each category is derived as the sum of the respective contributions. For convenience, the results of the three different sums are indicated with the same symbol associated with the environmental impact category (i.e.,
A,
B e
C).
Finally, the value of the EAR index is evaluated as the weighted sum of the three contributions
A,
B and
C according to the following equation:
The application of the three different weights
,
and
for each environmental impact category, respectively, equal to 0.65, 0.25, and 0.10, was decided on the basis of the following considerations:
Emissions are quantified through established methodologies and therefore it was decided to emphasize the impact by assigning a higher coefficient;
Energy consumption and emissions are mutually affected;
Since the from cradle to the gate approach has been adopted, a lower coefficient was chosen to be applied to the "output flows and waste category.
Table 8 shows an example of EAR index calculation for the wearing course of the Norwegian market (Norge wearing). The source data are the ones reported in
Table 6.
5.2. Definition of the Performance Coefficients
As already briefly discussed at the beginning of this section, in order to correctly assess the environmental impact of a generic bituminous mixture, it is necessary to also consider its performance. In fact, even if a benefit in terms of emissions and consumption can be obtained for the whole production process, it is still necessary to verify that the service life and the mechanical characteristics of the mixture are equal or higher than the traditional mixtures already adopted.
To do this, a series of parameters have been identified that allow the definition of corrective performance coefficients to be applied to the EAR index defining a corrected EAR index indicated as . The main effort in the definition of these performance coefficients was represented by the identification of models that allow quantifying the most significant performance aspects for each type of mixture starting from the pre-qualification data of the materials. Pre-qualification is a procedure for the verification and acceptance of bituminous mixtures carried out in the Fiano Romano laboratory which is currently performed for all the mixtures used in Autostrade per l’Italia’s maintenance process.
Regarding mechanical performance, two different coefficients were evaluated for open and dense-graded mixtures, respectively. For open-graded surface mixtures, a coefficient related to the behavior with respect to the top-down cracking phenomenon was considered. For dense graded mixtures instead, it was decided to consider a coefficient related to fatigue behavior. Finally, a coefficient has been considered to take into account the noise to be applied to all surface mixtures, both open and dense-graded. The models illustrated in the following sections have been chosen on the basis of the data required as input from each model. In fact, it was chosen to take advantage of all the information on the mixtures obtained in the pre-qualification phase in order to both not vary the procedures for pre-qualification and analysis of materials and easily extend the assessment to the asphalt mixtures already used in the past.
5.2.1. TDC Coefficient
At a structural level, the occurrence of top-down cracking (TDC) is an increasingly common problem on highway networks characterized by draining mixtures and in correspondence with particularly strong superstructures. This phenomenon was fully investigated in Phase 1 of the HiPER project: a project launched by the Autostrade per l’Italia group in 2020 aimed at optimizing the management of motorway pavement maintenance processes [
28] during which a model and a methodology for calculating and quantifying the TDC based on traffic volume, age of the asphalt and the indirect tensile strength of the material were identified. The parameters used in the model are actually available following pre-qualification, making this methodology particularly well suited for the purpose.
The evaluation of the TDC coefficient (simply indicated as
) follows the procedure developed by Canestrari et al. [
29], which starts from the evaluation of the
traffic factorn according to (
7), that expresses the passages of
standard axles of
(i.e.,
) scaled by a factor equal to
.
The second and third steps consider the evaluation of the
aging factor a of the pavement according to (
8) and the parameter
linked to the indirect tensile strength value (
) of the wearing course of draining mixtures according to (
9).
is the age of the pavement expressed in years.
Finally, the
, expressed in millimeters, can be evaluated for different passages
as:
In the evaluation of the
index, the corresponding multiplication factor
is evaluated by setting the age of the asphalt mixture equal to 10 years and a traffic volume equal to
as:
The value of
is used to normalize the
index. It was obtained by applying the model described in (
11) by setting a value
equal to 10 years (which is a typical value for pavement resurfacing) and annual traffic equal to
. The value of
is the average value obtained by varying
between 0.4 and 0.9 (which are the limit values imposed by the specifications [
30,
31,
32,
33,
34]) and is therefore taken as the reference value.
Hence, the coefficient owns a value higher than 1 if the characteristics of the asphalt mixture lead to a top-down cracking type lesion deeper than after 10 years. It is worth recalling that this coefficient applies to the open-graded mixtures but it is set equal to one for all other kinds of mixtures.
5.2.2. Fatigue Coefficient
One of the most widely used parameters in the literature for the mechanical characterization of bituminous materials is represented by the complex stiffness modulus
. This parameter depends on temperature, loading speed, age, and other characteristics of the mixture. As suggested by the American standard NCHRP Project 1-37A Report [
35] at level 3 of the analysis, it is possible to evaluate
by means of the sigmoidal function at the reference temperature of
(i.e., about
):
where
is the viscosity of bitumen (equal to
),
f is the frequency of the load expressed in hertz,
is the percentage of void content in the asphalt mixture,
is the percentage effective content of bitumen,
,
,
are the percentage retained on the
,
and 4 sieve, respectively,
is the percentage passing on the 200 sieve.
All these parameters are requested during the pre-qualification stage except the viscosity. However, this parameter can be derived, according to (
13) on the base of the penetration grade of bitumen which is information available downstream the pre-qualification stage.
is the value of the penetration test of the asphalt binder. Once the complex stiffness modulus is derived, it is possible to use its absolute value
E to evaluate the residual number of standard fatigue axles
for each mixture through the following relationship:
where
is the maximum horizontal strain at the base of the asphalt mixture. Three different reference values of
have been assumed in order to take into account the different typologies of pavement:
for dense graded asphalt concrete;
for binder asphalt concrete;
for base asphalt concrete.
and have been assumed as follows:
;
;
.
It may be noted that, using (
14), a value of
referring to a standard
axles is obtained. This value has been reported to a value referred to standard axles of
(i.e., the reference load in the Italian context) through (
15) [
31,
32,
33,
34]:
Finally, the coefficient to be applied at the EAR index can be evaluated, for each mixture, according to the equation:
in which the number of cycles to fatigue failure, expressed in terms of 120 kN standard axle, is normalized by a factor
assumed equal to:
Eighty-four for dense graded asphalt concrete;
Ninety-one for binder asphalt concrete;
One-hundred-and-five for base asphalt concrete.
Furthermore, in this case, it is recalled that the coefficient applies to the closed graded mixtures but it is set equal to one for all other kinds of mixtures.
5.2.3. Noise Coefficient
The last parameter related to the characteristics of the mixtures that have been considered is related to the acoustic emissions. It is known from the literature that acoustic performances are strictly related to surface texture, temperature, size, and shape of the aggregates. Moreover, noise represents an environmental parameter that, in the opinion of the authors, is worth taking into account as it has a relevant impact on people’s health and quality of life. In order to evaluate the performance of surface mixtures from this point of view as well, it has been decided to adopt the model proposed by Losa et al. in 2013 [
36] that links acoustic emissions, represented by the close proximity rolling noise index
to the sieve diameter associated with the 95th percentile of the passerby
, the fractal dimension
, and characteristics in terms of percentage of voids in the asphalt mixture
and percentage of voids in the mineral aggregates
:
S is the reference speed assumed equal to and is the reference speed equal to . More specifically, the term associated with the ratio represents the granulometric properties of the mixture while the one associated with the ratio represents the properties of the compacted asphalt mixtures and in particular, the contribution of the voids to the reduction of noise.
Finally, the index related to noise emissions associated with the EAR index is evaluated as:
where
is the reference limit value assumed equal to
. The
index is applied to all surface mixtures while it is set equal to 1 for all base, binder, and base-binder mixtures.
5.3. Final Calculation of the EAR Index
For the definition of the EAR index, the last required step consists of applying the different performance indexes
,
and
defined in the previous paragraphs, as multiplicative coefficients of the
index according to the formula:
The methodology and the different steps followed to obtain the
and
indices have been summarized in the flowchart in
Figure 1.
6. Results and Discussion
Based on the illustrated procedure, EAR index values were calculated for all EPD-certified mixtures analyzed in this study, resulting in the values shown in the following
Figure 2. The
values obtained vary in a range from 29.58 to 63.23, demonstrating good variability in the results.
As can be seen from data summarized in
Table 9, the greatest impact on the composition of the EAR index is due to the raw material production stage, which impacts about 60%, followed by the in-plant production stage, which impacts for 20%. The impact of the transportation (A2 and A4) and material paving phases is the least incisive.
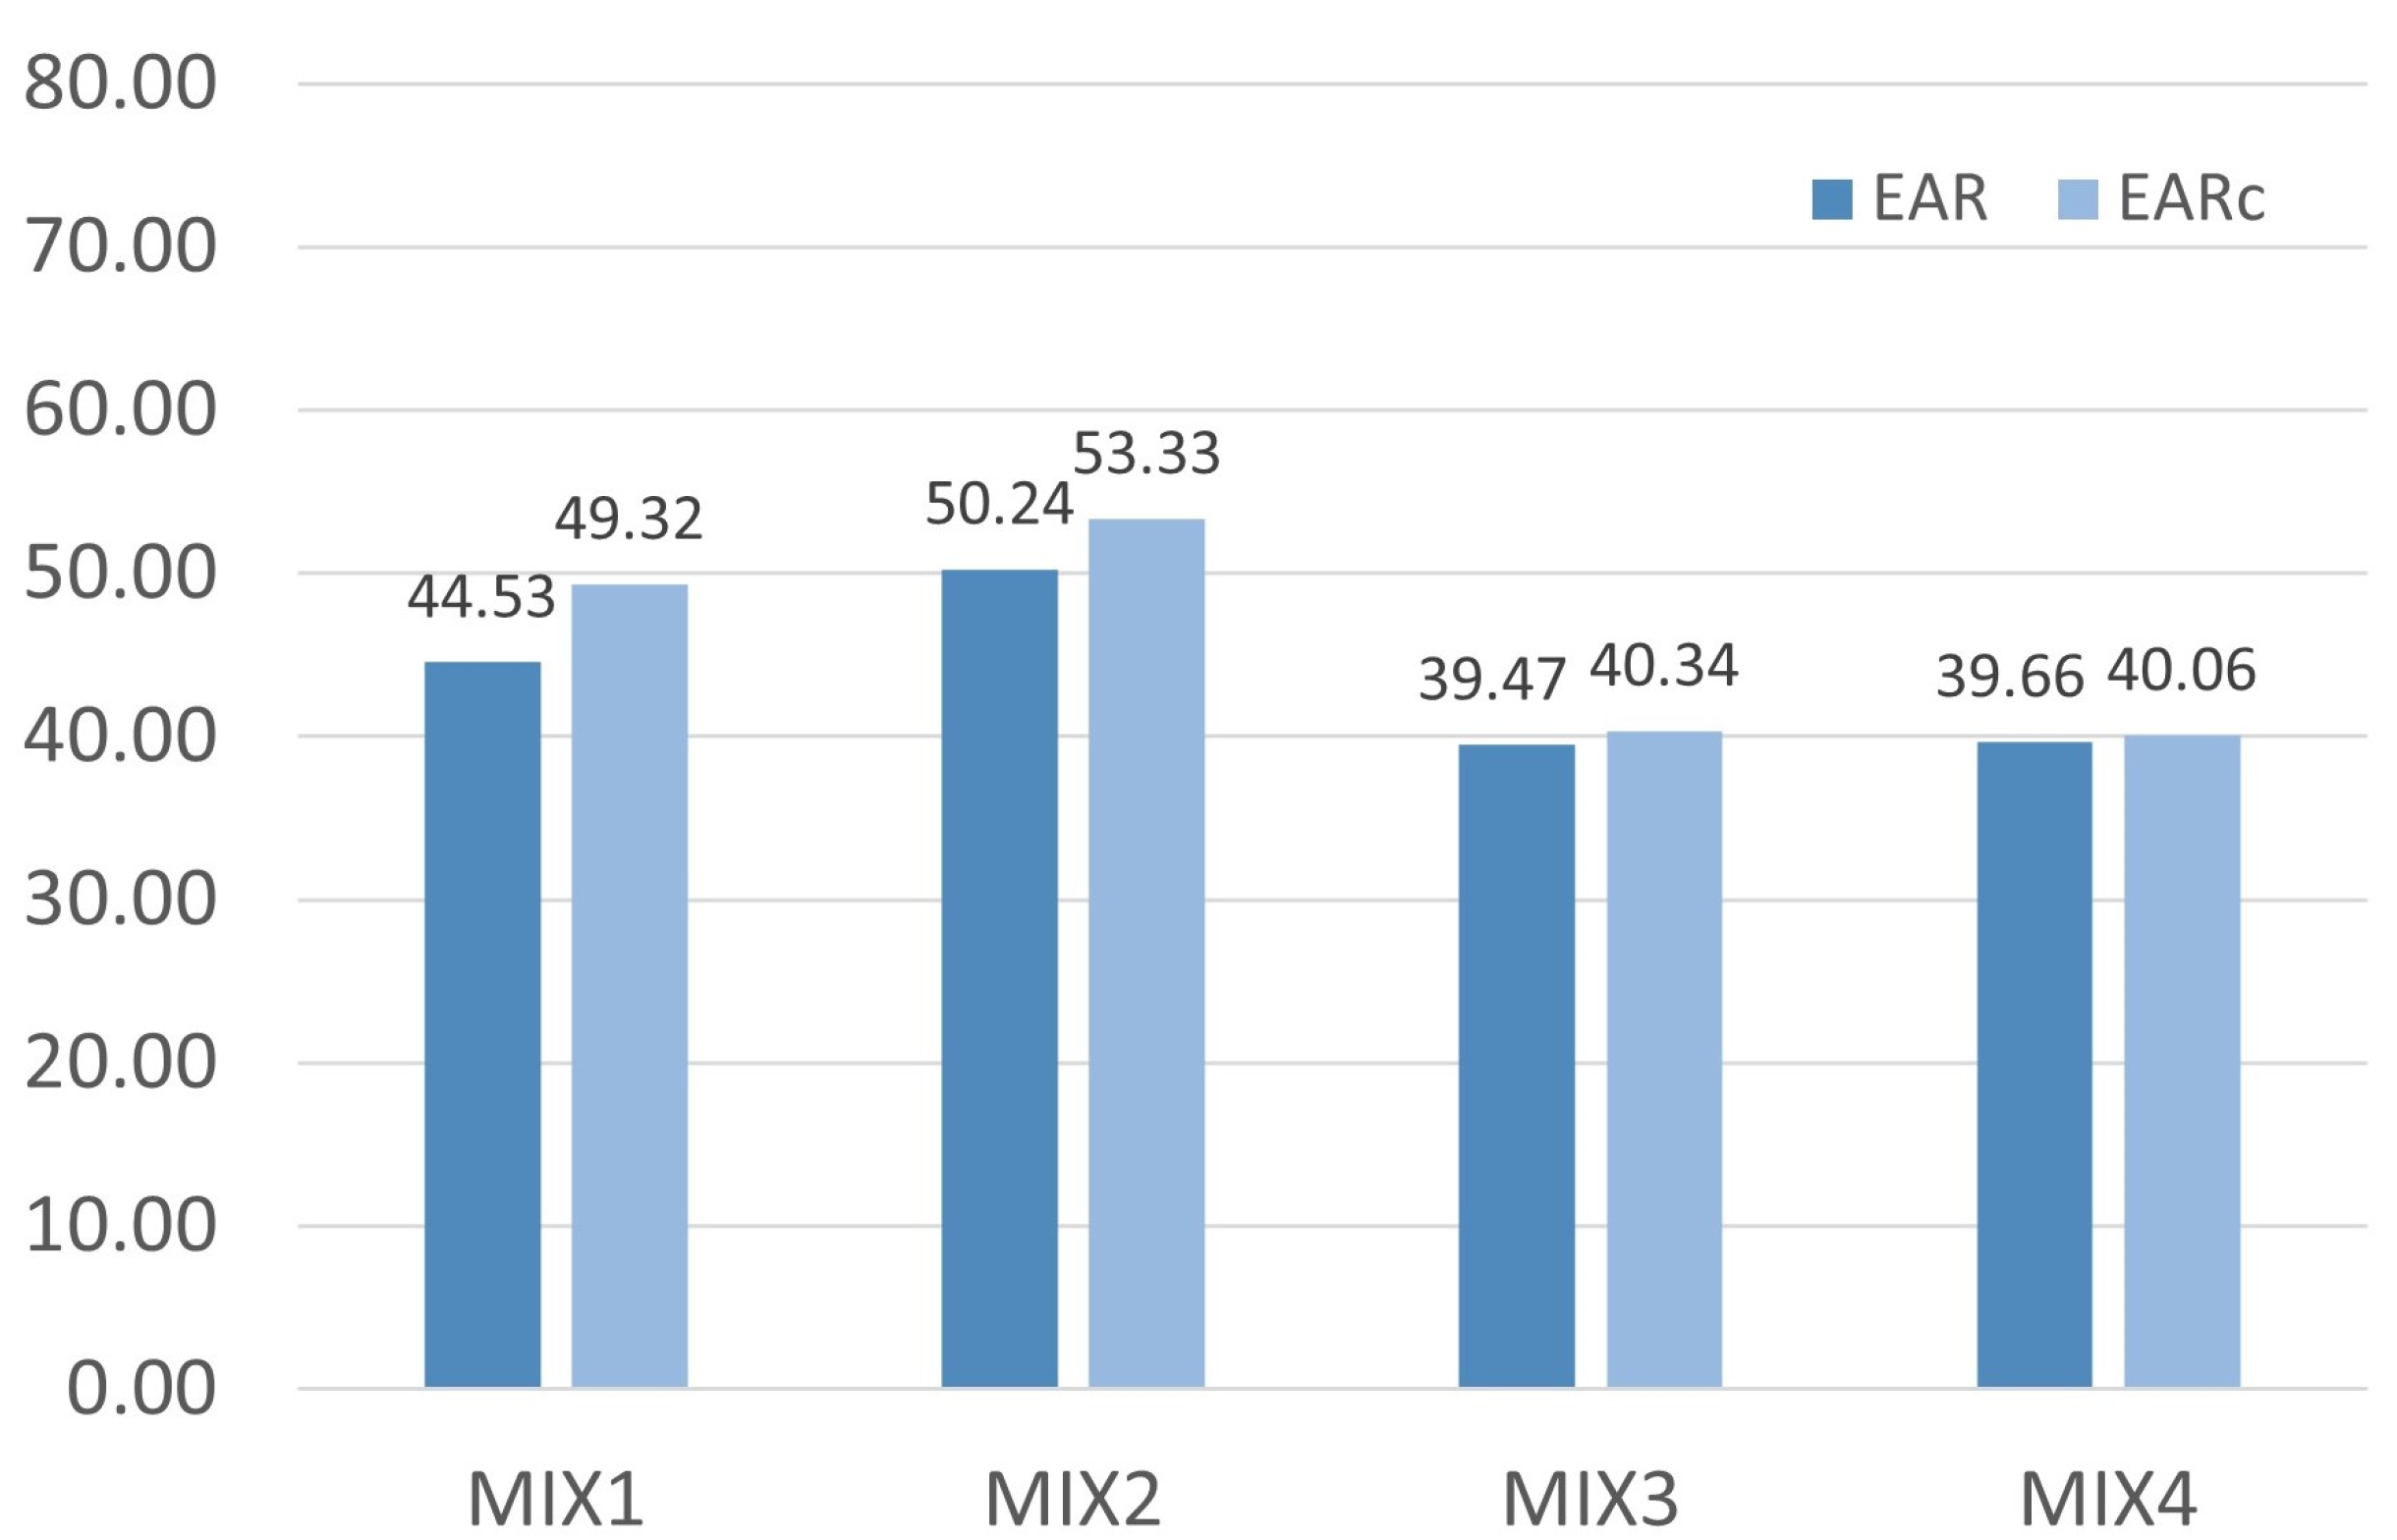
Based on the available data on the analyzed mixtures, a direct calculation of the
is not possible since no such data are available for the considered EPD-certified mixtures. However, to provide a comprehensive example of the application of the proposed methodology, it was decided to derive the corrective parameters from the pre-qualification data available for mixtures similar to Norge Wearing (labeled as MIX1 and MIX2) and Norge Base (labeled as MIX3 and MIX4). The pre-qualification values of the equivalent mixtures are summarized in
Table 10 while the derived coefficients
,
a and
and the corresponding corrected value of the EAR index are reported in
Table 11.
As visible in
Table 11, the value of
is equal to 1 for all mixtures as the
coefficient only applies to open-graded mixtures. Even for the
coefficient applied to base mixtures (MIX3 and MIX4), the value is the same and equal to 1 since this kind of mixture is not involved in the rolling noise generation process.
Finally, the obtained values of
and
are reported in
Figure 3.
The application of performance coefficients ensures effective differentiation between mixtures. It can be seen that the difference between EAR and is more pronounced for wearing courses than for base courses. This is mainly due to the application of the corrective parameter related to the impact of noise emissions.
7. Conclusions
The present study has been carried out with the aim of developing a tool for monitoring the environmental impact resulting from pavement maintenance works. The study was based on a certified methodology for measuring environmental impact that ensures the repeatability and quality of the results. As shown in the work, EPD certifications make it possible to take into account all the variables involved, including future benefits obtained from new production technologies, eco-friendly materials, and other future aspects that may affect the environmental impact of pavement maintenance.
In general, the EPD certification contains a detailed list of information related to the environmental impact of the production processes used to manufacture a given product. On the other hand, the calculation process illustrated in the work starts from this list of values and leads to the definition of a synthetic index that can be more easily implemented within Pavement management tools. It should be borne in mind that while EPD certification is standardized for any type of product, the process of calculating the EAR index is specific to asphalt mixes and that, therefore, the standardization values, as well as the choice of weights, have been determined on the basis of the specific production process. The developed methodology also allows for the evaluation of environmental performance as a function of mechanical performance: the application of performance multipliers, defined in
Section 5.2 is intended to ensure a "performance parity" evaluation and thus to assess the impact associated with the effective useful life of the material.
The EAR index can be applied at different stages of maintenance:
Design stage of maintenance operations: the impact is calculated from the quantities and types of asphalt concrete planned in the project. At this stage, the index considered is the maximum derived from the analysis of the mixture authorized and therefore takes the name “Potential Impact".
The index can be used as a reward criterion for awarding scores to the bids of competitors in tenders. The calculation of the index may be made on the basis of EPD certifications submitted by the contractor for each proposed mixture and on the basis of the location of the facilities on the territory, i.e., the average distance of the construction site from the facility. The score for each individual bid may be awarded according to the decrease in the EAR index compared to the potential impact described in the previous point.
In the monitoring phase: the index may be recalculated based on data obtained from the execution of works and material control.
The results derived from the considered EPD certifications show values of the EAR index ranging from a minimum of 31.42 to a maximum of 78.95. For each EAR value, the impact in terms of emissions (Category A), resource consumption (Category B), and reuse potential (Category C) has been quantified. As discussed in
Section 5.1, the most decisive contribution is given by Category A. This is also because of the combination of weights adopted among the three categories discussed in
Section 5.1.
Further considerations concern the impacts due to the different phases of the asphalt production and paving cycle: in all cases examined, the greatest impact is due to the raw material production phase (phase A1) followed, respectively, by the impact of in-plant production (phase A3) and transportation for raw material procurement (phase A2). The lowest impact is due to the transport and paving phase at the site (phases A4 and A5).
Finally, the application of performance coefficients ensured the effective differentiation between mixtures. This is of paramount importance in order to be able to guarantee that the quantification of the environmental impact is effectively related to the performance of the mixtures.
Subsequent steps related to the procedure that is the subject of this article will involve the calculation of the and indexes for a number of mixtures to date used in maintenance cycles related to pavement management, with a view to regularly adopting the indicator as part of a Pavement Management System.
Author Contributions
Conceptualization, D.C., V.C., C.T.; methodology, D.C., V.C. and C.T.; validation, D.C., C.T.; formal analysis, D.C., C.T.; investigation, D.C., V.C. and C.T.; data curation, D.C. and C.T.; writing—original draft preparation, V.C., D.C., C.T.; writing—review and editing, V.C., D.C., C.T. All authors have read and agreed to the published version of the manuscript.
Funding
This research received no external funding.
Data Availability Statement
Not applicable.
Acknowledgments
The authors would like to thank our colleagues A. Cosci and M. Ramunno of the Pavimental group for their support in retrieving data about their plants.
Conflicts of Interest
The authors declare no conflict of interest.
References
- Gransberg, D.D.; Tighe, S.L.; Pittenger, D.; Miller, M.C. Sustainable Pavement Preservation and Maintenance Practices. In Climate Change, Energy, Sustainability and Pavements; Springer: Berlin/Heidelberg, Germany, 2014; pp. 393–418. [Google Scholar]
- CEDR Call 2013: Energy Efficiency EDGAR. Evaluation and Decision Process for Greener Asphalt Roads. Final Report. 2016. Available online: https://www.cedr.eu/download/other_public_files/research_programme/call_2013/energy_efficiency/edgar/D4-6-Final-report_vFinal-revised.pdf (accessed on 19 October 2022).
- Straume, A. 2011: Dokumentasjon av modul for beregning av energiforbruk og klimagassutslipp i EFFEKT. SINTEF Notat, Prosjektnr. 60R085, 2011-09-14 (in Norwegian).
- Brattebø, H.; O’Born, R.; Miliutenko, S.; Birgirsdottir, H.; Lundberg, K.; Toller, S.; Potting, J. LICCER Model Technical Report. Account of Technical Backgrounds of the LICCER Model. Report nr. 4.2. (Final Report). December 2013. Available online: https://www.cedr.eu/download/other_public_files/research_programme/eranet_road/call_2011/energy/liccer/05_liccer_d4.2_technical-report.pdf (accessed on 19 October 2022).
- Anastasio, S.; Wu, S.; Bohne, R.A.; Passer, A.; Spaun, S.; Kristensen, T.; Hoxha, E. Integrated evaluation of energy and emission reduction potential and management strategies for urban road systems. In Proceedings of the IOP Conference Series: Earth and Environmental Science, Graz, Austria, 11–14 September 2019; Volume 323, p. 012091. [Google Scholar]
- COM(96) 583; Green Paper Public Procurement in the European Union: Exploring the Way Forward. Communication of the Commission of the European Communities. 1996. Available online: https://op.europa.eu/en/publication-detail/-/publication/f49ef575-c032-44de-a7ff-4c21c0b0da28/language-en (accessed on 19 October 2022).
- COM(2001) 264; A Sustainable Europe for a Better World: A European Union Strategy for Sustainable Development. Communication of the Commission of the European Communities. 2001. Available online: https://eur-lex.europa.eu/legal-content/EN/TXT/?uri=celex%3A52001DC0264 (accessed on 19 October 2022).
- COM(2001) 274; Commission interpretative communication on the Community Law Applicable to Public Procurement and the Possibilities for Integrating Environmental Considerations into Public Procurement. Communication of the Commission of the European Communities. 2001. Available online: https://eur-lex.europa.eu/legal-content/EN/TXT/?uri=celex%3A52001DC0274 (accessed on 19 October 2022).
- COM(2003) 302; Integrated Product Policy. Building on Environmental Life-Cycle Thinking. Communication of the Commission of the European Communities. 2003. Available online: https://eur-lex.europa.eu/legal-content/EN/TXT/?uri=celex%3A52003DC0302 (accessed on 19 October 2022).
- COM(2008) 400; Public Procurement for a Better Environment. Communication of the Commission of the European Communities. 2009. Available online: https://eur-lex.europa.eu/legal-content/EN/TXT/?uri=CELEX:52008DC0400 (accessed on 19 October 2022).
- Italian Ministry of the Environment and the Protection of Natural Resources. Action Plan for the Environmental Sustainability of Consumption in the Public Administration Sector (or National Action Plan on Green Public Procurement—GPP NAP). 2013. Available online: https://www.mite.gov.it/sites/default/files/archivio/allegati/GPP/all.to_21_PAN_GPP_definitivo_EN.pdf (accessed on 19 October 2022).
- DECRETO LEGISLATIVO 18 Aprile 2016, n. 50 Attuazione delle direttive 2014/23/UE, 2014/24/UE e 2014/25/UE sull’aggiudicazione dei contratti di concessione, sugli appalti pubblici e sulle procedure d’appalto degli enti erogatori nei settori dell’acqua, dell’energia, dei trasporti e dei servizi postali, nonche’ per il riordino della disciplina vigente in materia di contratti pubblici relativi a lavori, servizi e forniture. Available online: https://www.gazzettaufficiale.it/atto/serie_generale/caricaDettaglioAtto/originario?atto.dataPubblicazioneGazzetta=2016-04-19&atto.codiceRedazionale=16G00062 (accessed on 19 October 2022).
- UNI EN ISO 14025; Environmental Labels and Declarations—Type III Environmental Declarations-Principles and Procedures. ISO: Geneva, Switzerland, 2010.
- UNI EN 15804; Sustainability of Construction Works-Environmental Product Declarations-Core Rules for the Product Category of Construction Products. UNI: Milan, Italy, 2019.
- Moretti, L.; Mandrone, V.; D’Andrea, A.; Caro, S. Comparative “from cradle to gate” life cycle assessments of Hot Mix Asphalt (HMA) materials. Sustainability 2017, 9, 400. [Google Scholar] [CrossRef]
- National Apshalt Pavament Association. Product Category Rules (PCR) For Asphalt Mixtures; National Apshalt Pavament Association: Greenbelt, MD, USA, 2017. [Google Scholar]
- EPD Italy Website. Available online: https://www.epditaly.it/en/ (accessed on 19 October 2022).
- NCC Industry Nordic AB. Environmental Product Declaration for Asphalt Mixtures from Stockholm ASPHALT plant—Riksten. 2020. Available online: https://www.environdec.com/library/epd2305 (accessed on 19 October 2022).
- Environmental Product Declaration BREG EN EPD no. 000103. 10 March 2016. Available online: https://tarmac.com/wp-content/plugins/tarmac.com/components/downloads/file-download.php?download_id=6883 (accessed on 19 October 2022).
- NCC Industry Nordic AB. Environmental Product Declaration for Asphalt Mixtures from Göteborg Asphalt Plant—Kärra. 26 August 2020. Available online: https://www.environdec.com/library/epd2080 (accessed on 19 October 2022).
- NCC Industry Nordic AB. Environmental Product Declaration for Asphalt Mixtures from Uddevalla Asphalt Plant—Porsen. 2019. Available online: https://www.environdec.com/library/epd1641 (accessed on 19 October 2022).
- Svevia AB. EPD Asphalt Manufactured in Stationary Plant-AG, ABb, ABT, ABS (Swedish Version with English Summary). 2020. Available online: https://www.environdec.com/library/_?Epd=19865 (accessed on 19 October 2022).
- NCC Industry AB. Environmental Product Declaration for NCC Green Asphalt from Arlanda Asphalt Plant. 30 January 2017. Available online: https://portal.environdec.com/api/api/v1/EPDLibrary/Files/9ec6b96a-7d30-4f36-593b-08d90559b7e2/Data (accessed on 19 October 2022).
- Declaración Ambiental de Producto 1 TONELADA METRICA DE MEZCLA ASFÁLTICA AC16 surf 50/70 S. 15 April 2019. Available online: https://www.environdec.com/library/epd1569 (accessed on 19 October 2022).
- USIRF Routes de France. Environmental Product Declaration from Cradle to Gate Production of Hot Mix Asphalt Concrete Representative of the French Market. 1 January 2016. Available online: https://www.routesdefrance.com/wp-content/uploads/juin_EPD_USIRF_hot-mix-asphalt-production.pdf (accessed on 19 October 2022).
- EPD from the Norwegian EPD Foundation for Product Agb 11. Asfalt (Slitelag). 14 September 2017. Available online: https://www.epd-norge.no/getfile.php/138362-1514982392/EPDer/Byggevarer/Asfalt/NEPD-1390-456_Agb-11-Asfalt-slitelag-_1.pdf (accessed on 19 October 2022).
- EPD from the Norwegian EPD Foundation for Product Ag 16 Asfalt (Baerela). 14 September 2017. Available online: https://www.epd-norge.no/getfile.php/138363-1514982423/EPDer/Byggevarer/Asfalt/NEPD-1389-456_Ag-16-Asfalt–baerelag-_1.pdf (accessed on 19 October 2022).
- Spinelli, P. Pavimentazioni Autostradali: Strategie per una Manutenzione Sostenibile. 2013. Available online: https://www.unem.it/wp-content/uploads/2021/04/Pavimentazioni-autostradali-strategie-per-una-manutenzione-sostenibile.pdf (accessed on 19 October 2022).
- Canestrari, F.; Ingrassia, L.P.; Virgili, A. Asemi-empirical model for top-down cracking depth evolution in thick asphalt pavements with open-graded friction courses. J. Traffic Transp. Eng. 2022, 9, 244–260. [Google Scholar]
- Organization for Economic Co-Operation and Development OECD. OECD Full Scale Pavement Test; OECD Road Research Group: Paris, France, 1991. [Google Scholar]
- Battiato, G.; Camomilla, G.; Malgarini, M.; Scapaticci, C. Measurements of the Aggressiveness of Goods Traffic on Road Pavement–Nardò Experiment. Report n. 3 Tandem Effect Evaluation, Autostrade vol. 1, 1983. Autostrade 1983, 1. [Google Scholar]
- Christison, J.T. Pavement Response to Heavy Truck Axle Loadings: The Canadian Vehicle Weights and Dimensions Study. In Proceedings of the International Symposium on Heavy Vehicle Weight and Dimensions, Kelowna, BC, Canada, 8–13 June 1986. [Google Scholar]
- Huhtala, M. The Effect of Different Trucks on Road Pavements. In Proceedings of the International Symposium on Heavy Vehicle Weight and Dimensions, Kelowna, BC, Canada, 8–13 June 1986. [Google Scholar]
- Huhtala, M.; Pihlajamaki, J.; Pienimaki, M. The Effect of Tire and Tire Pressure on Road Pavements, Transportation Research Record, Board Annual Meeting. Transp. Res. Rec. Board Annu. Meet. 1989, 1227, 107–114. [Google Scholar]
- ARA, Inc.; ERES Consultants Division. Guide for Mechanistic-Empirical Design of New and Rehabilitated Pavement Structures; NCHRP 1-37A Final Report. ARA, Inc., ERES Consultants Division: Champaign, IL, USA, 2004. [Google Scholar]
- Losa, M.; Leandri, P.; Licitra, G. Mixture design optimization of low-noise pavements. Transp. Res. Rec. 2013, 2372, 25–33. [Google Scholar] [CrossRef]
| Disclaimer/Publisher’s Note: The statements, opinions and data contained in all publications are solely those of the individual author(s) and contributor(s) and not of MDPI and/or the editor(s). MDPI and/or the editor(s) disclaim responsibility for any injury to people or property resulting from any ideas, methods, instructions or products referred to in the content. |
© 2023 by the authors. Licensee MDPI, Basel, Switzerland. This article is an open access article distributed under the terms and conditions of the Creative Commons Attribution (CC BY) license (https://creativecommons.org/licenses/by/4.0/).


