Article

Influence of the Type of Cement on the Durability of Concrete Structures Exposed to Various Carbonation Environments in Greece: A Contribution to the Sustainability of Structures

by
Christos Tassos
1,*,
Kosmas K. Sideris
1,*,
Alexandros Chatzopoulos
1,
Emmanouel Tzanis
2 and
Marios S. Katsiotis
2
1
Laboratory of Building Materials, Department of Civil Engineering, Democritus University of Thrace, 67100 Xanthi, Greece
2
Research, Innovation & Quality Department, TITAN Cement Group, 11143 Athens, Greece
*
Authors to whom correspondence should be addressed.
Constr. Mater. 2023, 3(1), 14-35; https://doi.org/10.3390/constrmater3010002
Submission received: 16 November 2022 / Revised: 31 December 2022 / Accepted: 8 January 2023 / Published: 14 January 2023
(This article belongs to the Special Issue Advances in Concrete Binders and Reinforced Concrete)

Abstract

:
The research objective of this paper is to investigate the effect of different types of cement and different climatic conditions on the durability of reinforced concrete structures to understand and address issues of durability and erosion. The types of cement used were CEM I 42.5N, CEM II/A-M (P-LL) 42.5N and CEM II/B-M (W-P-LL) 32.5N. Mixtures of three different cement mortars and six different concretes were prepared with these three types of cement. Cement mortars were produced according to the European standard EN 196-1. Concrete mixtures were of the strength classes C25/30 and C30/37. Concrete mixtures produced according to the specifications of the European standard EN 206 may have a shorter service life due to carbonation-induced corrosion if the choice of the cement type is not made carefully. The results indicate that the carbonation rate of concrete mixtures is significantly influenced by the type and strength class of the cement used. Using meteorological data from six regions of Greece, an empirical carbonation prediction model for these regions was obtained.

1. Introduction

In the construction industry, the most commonly used material is reinforced concrete. Reinforced concrete is a composite material that results from the reinforcement of concrete (a mixture of aggregates, cement and water, which after a chemical reaction turns into a solid body) with another higher strength material. The aim is to combine the properties of the above materials to create a new material that will satisfy the needs of construction. Concrete is a cheap material with high compressive strength, but very low tensile strength. For this reason, steel is used to provide concrete with the required tensile properties. However, steel, as a metal alloy, has low resistance to corrosion; this is one of the reasons that it must be covered with a layer of concrete [1]. The corrosion of the reinforcement begins with carbonation [2]. The phenomenon of carbonation essentially describes the effect of carbon dioxide (CO2) on a material, which leads to significant safety problems of reinforced concrete works, due to the reduction of the cross-section of the reinforcement. The carbonation of the cement paste leads to a decrease in the pH, which makes the material less alkaline [3].
Thus, carbonation of reinforced concrete structures constitutes an important problem during their service life due to effect of environmental exposure, and it is clear that the prediction of concrete carbonation is critical for the design of durable and sustainable structures.
Over the past few decades, researchers have carried out a variety of studies on carbonation prediction, creating numerous carbonation models [4,5,6,7,8,9,10,11,12,13,14,15]. Chen et al. [16] investigated the influence of temperature, CO2 concentration and relative humidity on the carbonation depth and compressive strength of concrete. Wang et al. [17] studied the influence of carbonation on both the ingress and distribution of chlorides in three different types of concretes by comparing results from exposure to chlorides before carbonation and after carbonation. Liu et al. [18] studied the effects of temperature, relative humidity and CO2 concentration on carbonation depth of concrete and the variation laws of concrete carbonation depth under coupling effects of environment factors. Merah et al. [19] studied the resistance of two types of cements against accelerated carbonation, producing two different concretes based on ordinary Portland cements with additions and subjecting them to an accelerated carbonation chamber. Wajeeha et al. [20] examined the effect of carbonation on the strength properties and carbonation depth of ordinary Portland cement (OPC) concrete using two different water-to-cement ratios (w/c) and two different replacement percentages of natural coarse aggregate (NCA) with recycled coarse aggregate (RCA). Neves et al. [21] investigated the relationship between natural and accelerated concrete carbonation resistance by taking cores from real structures and subjecting their non-carbonated inner parts to accelerated carbonation resistance testing, allowing the assessment of natural and accelerated carbonation resistance on the same specimen. Leemann et al. [22] studied the carbonation resistance of mortar and concrete when cement with mineral additions is employed, comparing carbonation coefficients determined in the different exposure conditions. Boualleg et al. [23] investigated the influence of the environment on the properties of mortars and cement, and the correlation between compressive strength, natural carbonation, non-evaporable water and portlandite content. Zhao et al. [24] studied the effect of material factors, i.e., the type and the particle size of cement, the calcium oxide content in the fly ash, the fineness modulus of the fine aggregate and the types and dosages of superplasticizers, on the carbonation properties of the concrete. Lin et al. [25] examined the effects of quartz, limestone and type of cement (BRC and ordinary Portland cement) on the carbonation curing and normal curing of cement paste. Elsalamawy et al. [26] investigated the effect of variation of RH on carbonation resistance of concrete made with different cementitious materials: CEMI42.5N, CEMIII/A42.5N and CEMIII/A42.5N with 10% silica fume as an addition. However, researchers have mainly focused on carbonation models, materials composition, water-to-cement ratio (w/c) and external environmental factors [18], and due to the difficulty of modeling the procedure of carbonation in concrete most of these models have not achieved a high level of universal approval. The model which has, however, attained wide recognition in recent times is t fib-Model Code (2010)/fib 34 (2006) [10,11,27].
The EN 206 standard [28] in the requirements for class XC4 includes restrictions on the composition of concrete, but makes no reference to the type of cement. Moreover, there are no studies in the literature that systematically investigate the influence of cement type on carbonation in connection with different environmental characteristics of exposure. In addition, there are no large-scale studies that have investigated the influence of local environmental characteristics of different areas of a particular country on carbonation and durability. Therefore, in this study, an empirical model is derived, taking into account specific characteristics of the Greek region and providing the possibility of predicting the depth of carbonation with fairly high accuracy.
The aim of this study is to underline the omission in the standards, which do not impose restrictions on the type of cement used and do not take into account the characteristics of the microclimate of each area. Thus, this study correlates the severity of exposure to carbon dioxide with meteorological data, mainly annual fluctuations in the relative humidity of the atmosphere.
For this purpose, three different cement mortars and six different concretes were prepared using three different types of cement. These were CEM I 42.5N (Portland cement), CEM II/A-M (P-LL) 42.5N (Portland composite cement) and CEM II/B-M (W-P-LL) 32.5N (Portland composite cement) according to EN 197-1 [29]. Cement mortars and concretes were subjected to tests of compressive strength and carbonation resistance in natural and accelerated circumstances. Some samples were left exposed for three years in the open air in selected areas of Greece, while others were exposed for one hundred and eighty days in a carbonation chamber. The areas in Greece were Xanthi, Thessaloniki, Ioannina, Voiotia, the center of Athens and Patras, as presented in the Figure 1.

2. Materials and Methods

Three different cement mortars and six different concretes of the C25/30 and C30/37 strength classes (compressive strength of 3625 psi and 4350 psi) were produced. Three different types of cement were chosen for study: CEM I 42.5N (Portland cement), CEM II/A-M (P-LL) 42.5N (Portland composite cement) and CEM II/B-M (W-P-LL) 32.5N (Portland composite cement). CEN Standard sand [28] with specific grain size distribution between 0.08 and 2.00 mm was used for the cement mortars. The concretes were made from coarse aggregates consisting of crushed granite with a maximum grain of 32 mm, crushed sand and river silicate sand. The compositions of the mortars followed the ratio 0.5:1:3 for water, cement and sand, according to the EN 196-1 regulation [30]. Specimens of mortars were produced according to EN 196 [30] and specimens of concrete were produced according to EN 12390 [31].
High-range water reduction polymer with carboxylate ether admixture at various dosages was used to achieve workability in concretes. The chemical analysis and specific weight of the cements used are shown in Table 1. In cement mortars, no admixture was used.
The coarse aggregates used (with a maximum grain of 32 mm) were crushed granite, river sand, crushed sand and standard sand for cement mortars. The grain size distribution of all aggregates according to DIN 4187-8 [32] is shown in Table 2 and in Figure 2. The granulometric curve is presented. There were no changes in materials during the study process in order to avoid any alterations in the results.
All cement mortars and concrete mixtures produced were tested for mechanical and durability properties. The mechanical property measured was compressive strength at the ages of 2, 7, 14, 28, 90, 180 and 365 days for cement mortars and at the ages of 2, 7, 28, 180 and 365 days for concretes. The durability properties estimated were accelerated carbonation at the ages of 28, 56, 90, 120 and 180 days and natural carbonation at the ages of 3, 6, 9, 12, 18, 24, 30 and 36 months. Natural carbonation of cement mortars was measured on the specimens that were exposed in the selected areas of Greece. Natural carbonation of concretes was estimated from specimens that were exposed in Xanthi.
The specimens produced for the tests were prisms sized 40 × 40 × 160 mm for cement mortars, 150 mm edge cubes and 60 × 100 mm (D × H) cylinders for concretes. The specimens produced for the test of compressive strength were maintained in the curing chamber (T = 20 °C, RH > 98%) until the test date. The specimens produced for the carbonation tests followed different maintenance programs according to each experiment, as analyzed below.
The coarse aggregates used—gravel (2–16 mm) and pebbles (8–32 mm)—were of granite origin with a specific gravity of 2.65, while the specific gravity of all types of sand was 2.67. All aggregates had no water absorption. The mix design and characteristics of all mortars and concretes are shown in Table 3 and Table 4.

2.1. Compressive Strength

The specimens prepared to measure compressive strength at different ages were 30 prisms sized 40 × 40 × 160 mm for each type of cement mortar, used as broken halves according to EN 196-1 [30], and 21 edge cubes 150 mm for each concrete, according to EN 12390-4 [31]. All samples were stored in a maintenance chamber (T = 20 °C, RH > 98%) until the age of the tests. The loading rate used in measuring the compressive strength of mortars was 2400–2500 N/s, while the loading rate for the concrete specimens was 0.6 MPa/s, as described in the relevant standards EN 196-1 [30] and EN 12390-3 [33].

2.2. Accelerated Carbonation

The specimens that were used to measure the accelerated carbonation depth were 21 prisms 40 × 40 × 160 mm for each type of cement of cement mortars and 21 cylindrical specimens 60 × 100 mm for each concrete, according to the procedure described in the EN 14630 standard [34]. The specimens were placed in a maintenance chamber (T = 20 °C, RH > 98%) for 3 days and then stored in an indoor laboratory environment (T = 20 ± 2 °C, RH = 50–60%) until 28 days of age. At 28 days, they were transferred to the accelerated carbonation chamber (T = 20 °C, RH = 55%, CO2 = 1%) to calculate accelerated carbonation depth. The specimens remained in this chamber until the time of each measurement and, after being removed from their exposure, were broken in half. The freshly broken surfaces were sprayed with a phenolphthalein indicator [35] to measure the depth of carbonation with two values from each side of each prism and eight values from each side of each cylindrical specimen.

2.3. Natural Carbonation

The specimens that were used to measure the natural carbonation depth had the same dimensions as in the accelerated carbonation (30 prisms 40 × 40 × 160 mm for each type of cement of cement mortars for each area of exposure and 30 cylindrical specimens 60 × 100 mm for concretes). These specimens were stored in the maintenance chamber for 3 days and then stored in an indoor laboratory environment (T = 20 ± 2 °C, RH = 50–60%) until 28 days of age. At 28 days, the specimens of concrete were exposed to the open air in an unsheltered environment in the court of the building materials laboratory in Xanthi (AVG T = 14.2 °C, AVG RH = 67.7%), in this way simulating the XC4 exposure class of northern Greece. The specimens of cement mortar were divided into sets, wrapped in protective films and transported via a certified transport company within 24 h to the selected areas determined to simulate the natural carbonation conditions of different Greek regions. These specimens also remained outdoors in the unsheltered open air until the time of each measurement. The sets of specimens that had been transported to other areas were sent to the laboratory for measurement at the appropriate age. All specimens, after being removed from their exposure location, were broken in half and sprayed with a phenolphthalein indicator [35] for the measurement of carbonation depth, with two values from each side of each prism and eight values from each side of each cylindrical specimen. The values of carbonation depth of the mortars that were exposed in the selected areas will be used as a starting point for the prediction of concrete carbonation, which will be checked for reliability with concrete samples at a future time.
Specimens of concrete exposed to the open air unsheltered environment in the court of the building materials laboratory in Xanthi are shown in Figure 3.

3. Results and Discussion

3.1. Compressive Strength

3.1.1. Cement Mortars

The values of the compressive strength of all cement mortars are presented in Table 5 and are shown graphically in Figure 4.
The compressive strength of the cements used was in conformity with their specifications. M1 and M2 mixtures produced with cement of 42.5 fineness presented normal results at 28 days of age within the limits of the standard (42.5–62.5 MPa); specifically, the M1 mixture had a result of 54.4 MPa and the M2 mixture a result of 48.1 MPa. The situation was similar in the measurements of the M3 mixture, in which cement of 32.5 fineness was used, which had a result of 42.3 MPa at the age of 28 days, within the limits set by the standard (32.5–52.5 MPa).
The mixtures in which CEM I 42.5N and CEM II/A-M (P-LL) 42.5N cement were used had improved results at all measurement ages compared to the mixture with CEM II/B-M (W-P-LL) 32.5N cement with the same water/cement ratio. The results are in agreement with our current knowledge and cement mortar standards. The rate of hydrate formation into the capillary pores primarily depends on the w/c ratio, cement components and fineness, curing temperature and curing time [36,37]. For the same w/c ratio and curing conditions, the chemical composition and fineness of the cement will be the dominant factors [36,38]. This difference in the microstructure level leads to changes in both the volume of pores and the structure of the specimens, which affect compressive strength. The volume of pores and the number of microcracks for the specimens with 42.5 cement are lower compared to those with 32.5 cement [39,40].

3.1.2. Concretes

Compressive strength was measured at 2, 7, 28, 180 and 365 days for all concretes according to EN 12390–4 [31]. At each measurement, three 150 mm edge cubes were used, which came from three different portions of mixing concrete. The separation of the specimens was random to obtain unbiased results. Specifically, at 28 days, which determines the concrete strength class, six cubes were used. The results of the compressive strength of the concretes are shown in Table 6, Figure 5 and Table 7, Figure 6 for C25/30 and C30/37 strength classes, respectively.
From the beginning of the measurements at 2 days of age, it was obvious that the C1 and C4 mixtures produced with CEM I 42.5N cement had improved compressive strength values. This trend continued for the measurements of all ages until the final one at 365 days. The rest of the mixtures showed lower compressive strength values in comparison with C1 and C4. The use of CEM II/B-M (W-P-LL) 32.5N cement appears to have important negative effects on compressive strength values, since the C3 and C6 concrete mixtures had values of 34.0 MPa for the C25/30 strength class and 43.3 MPa for the C30/37 strength class at 28 days of age. C2 and C5 concrete mixtures presented higher compressive strength values than C3 and C6 concretes but their results were closer to the results of mixtures with ordinary Portland cement. Nevertheless, all concrete mixtures met the minimum requirements of compressive strength for each of their strength class.
Okumu et al. [41] measured the compressive strength of concretes using two types of cements—42.5N and 32.5N—at 7, 14 and 28 days of age. At 28 days, the average difference in compressive strength between concretes with 32.5N and 42.5N cement was 8.35 MPa. Vanoutrive et al. in “Rilem TC 281-CCC: Carbonation of concrete with supplementary cementitious materials” [42] tested concretes with CEM I 42.5N, CEM II 42.5N and CEM III 42.5N cements distributed by HeidelbergCement AG (Germany). The results in compressive strength were similar for all three concretes, with values from 39.5 MPa to 41.0 MPa. Ekolu et al. [43] measured the compressive strength of various concretes with water/cement ratios of 0.4, 0.5 and 0.65 using cement types CEM I 42.5N, CEM II 42.5N, CEM IV 32.5R and CEM II 52.5N. The results showed the great significance of the water/cement ratio and the negative effects of 32.5 fineness cement on compressive strength at 28 days of age, as in this research.

3.2. Carbonation Depth

3.2.1. Cement Mortars

The accelerated carbonation depth of all cement mortars is shown in Table 8 and represented graphically in Figure 7. The results of natural carbonation are presented in Table 9, Table 10, Table 11, Table 12, Table 13 and Table 14 and represented graphically for exposure in Xanthi in Figure 7.
Mixtures M1 and M2, in which CEM I 42.5N and CEM II/A-M (P-LL) 42.5N cements were used, showed lower depths of accelerated carbonation penetration at all measurement ages.
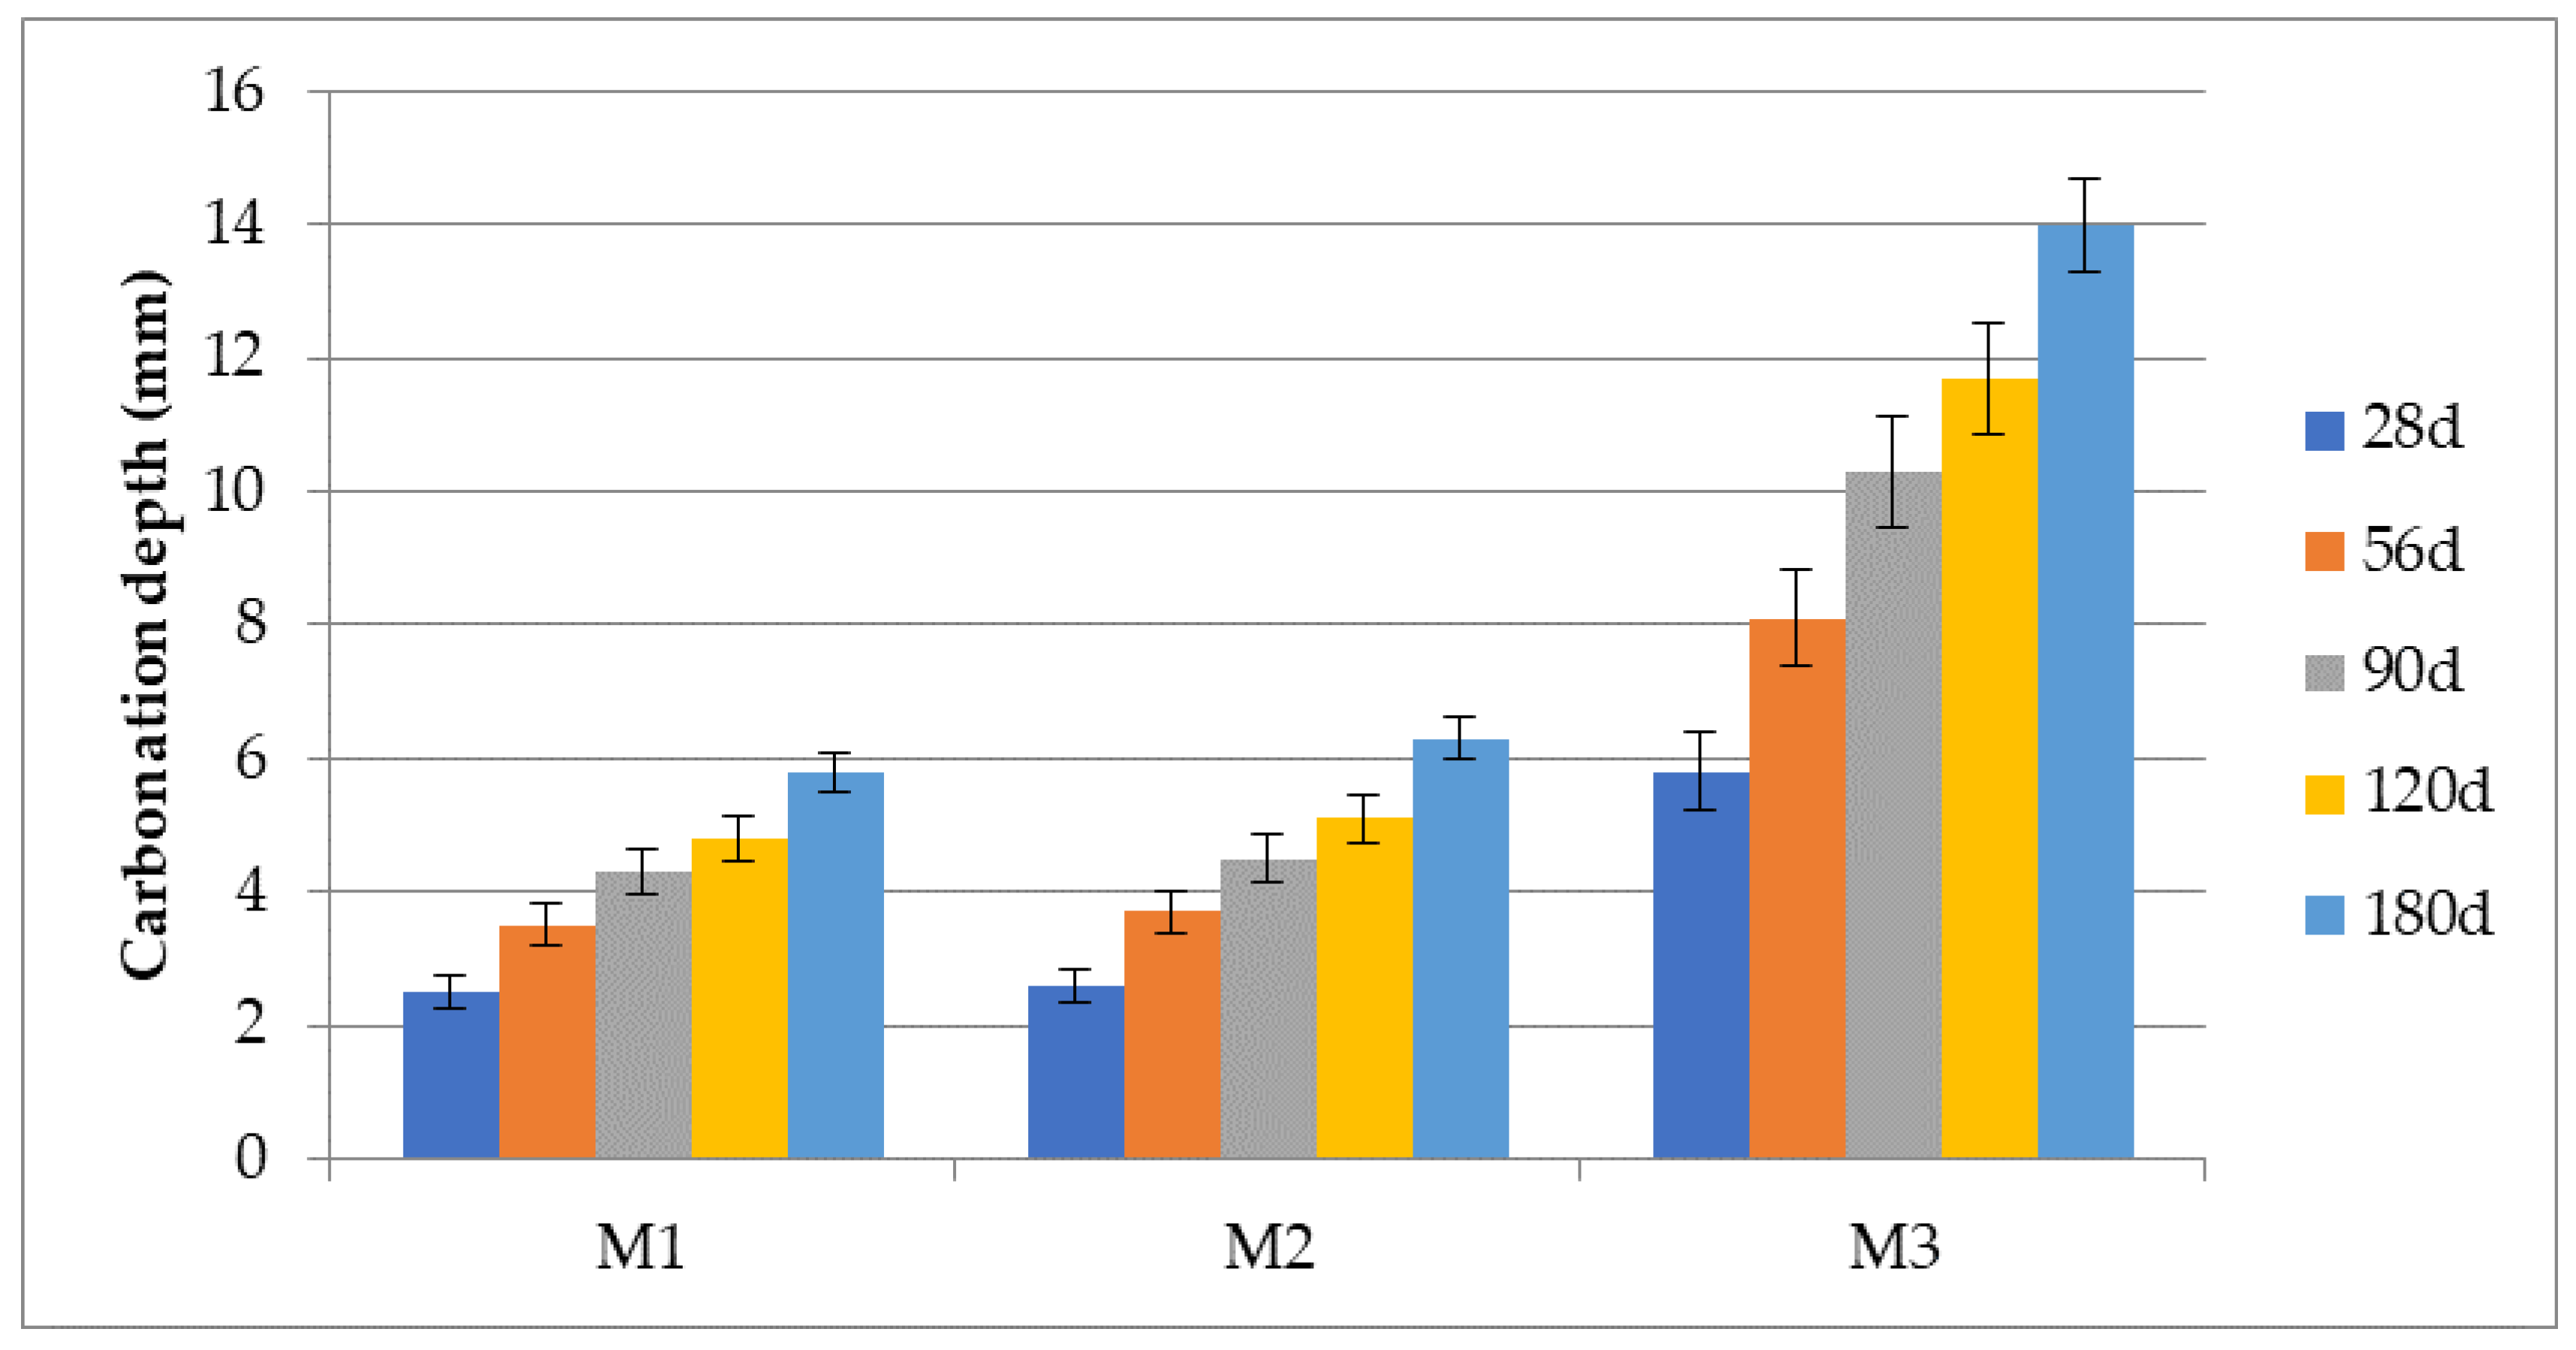
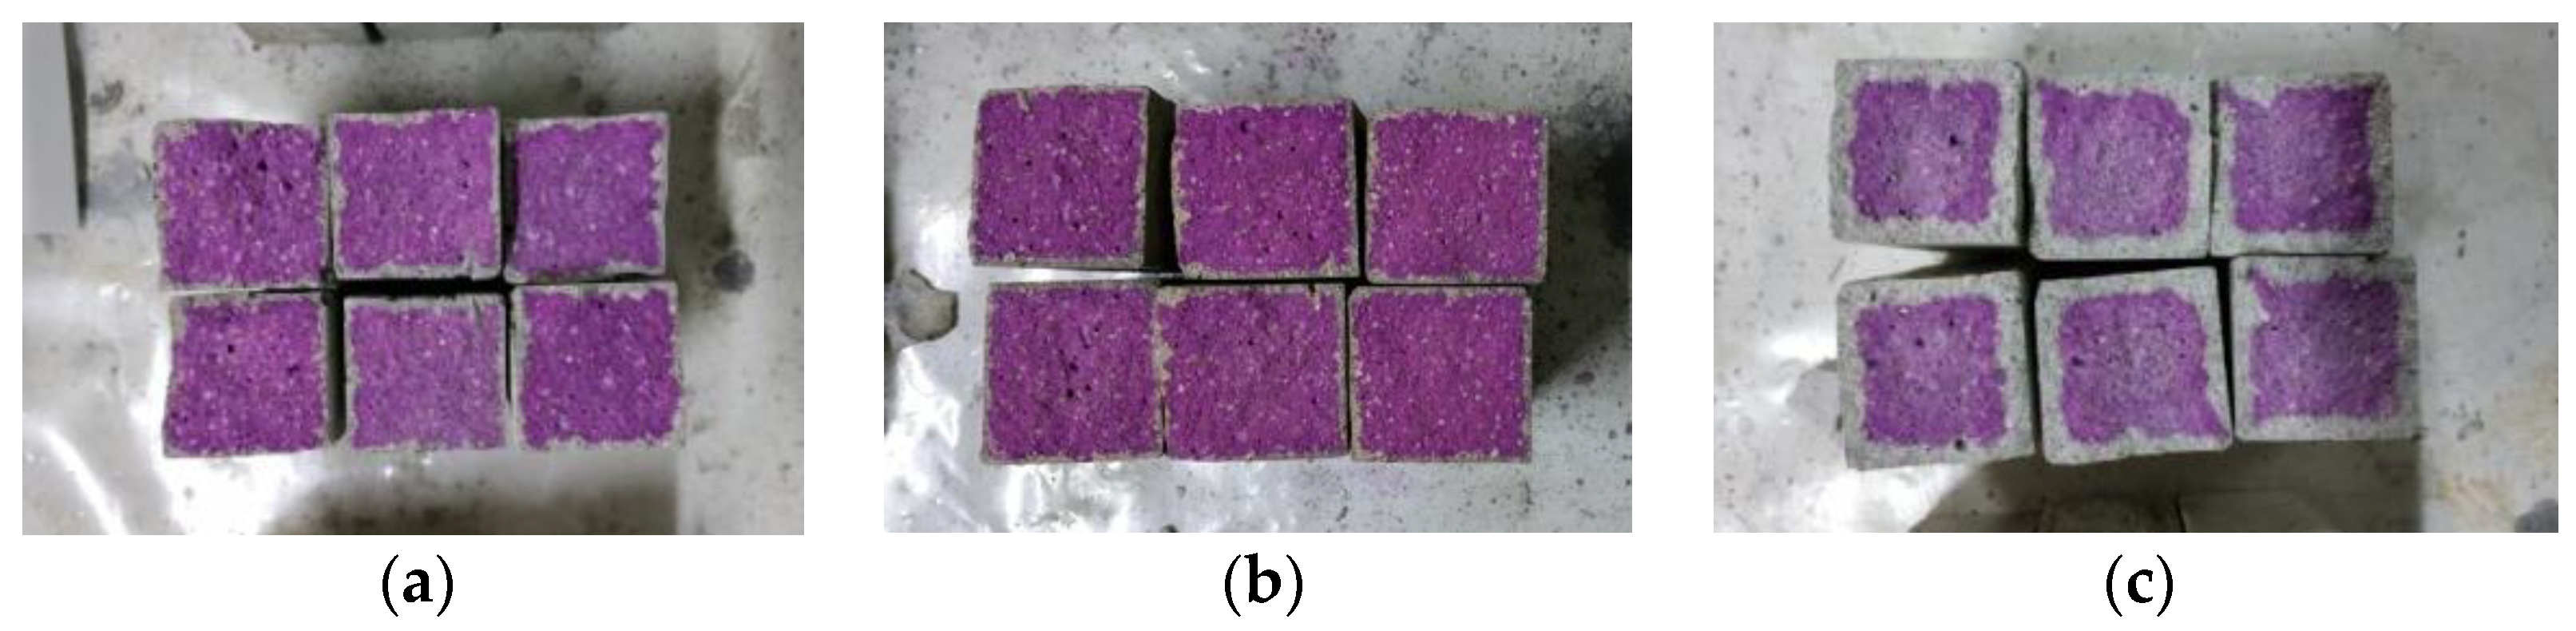
The examples in Figure 8 show the difference in carbon dioxide penetration between mixtures M1, M2 and M3 at the same measurement age.
The above figure shows the negative effect of the use of 32.5 fineness cement in carbonation resistance. At all ages, the values of carbonation depth were significantly higher in the M3 mixture (c) than the values in the M1 and M2 mixtures whose carbonation depths were similar to each other (a,b).
According to Vanoutrive et al. [40], specimens tested at 1% CO2 are characterized by a lower carbonation depth when CEM II is used than specimens with CEM I. Nonetheless, the differences in carbonation depth between CEM I- and CEM II-based mortar were found to be non-significant, as was the case in this study. Singh and Singh [44] observed that, in general, higher compressive strength implies higher carbonation resistance. This is in agreement with the results of the present research. Torre et al. [
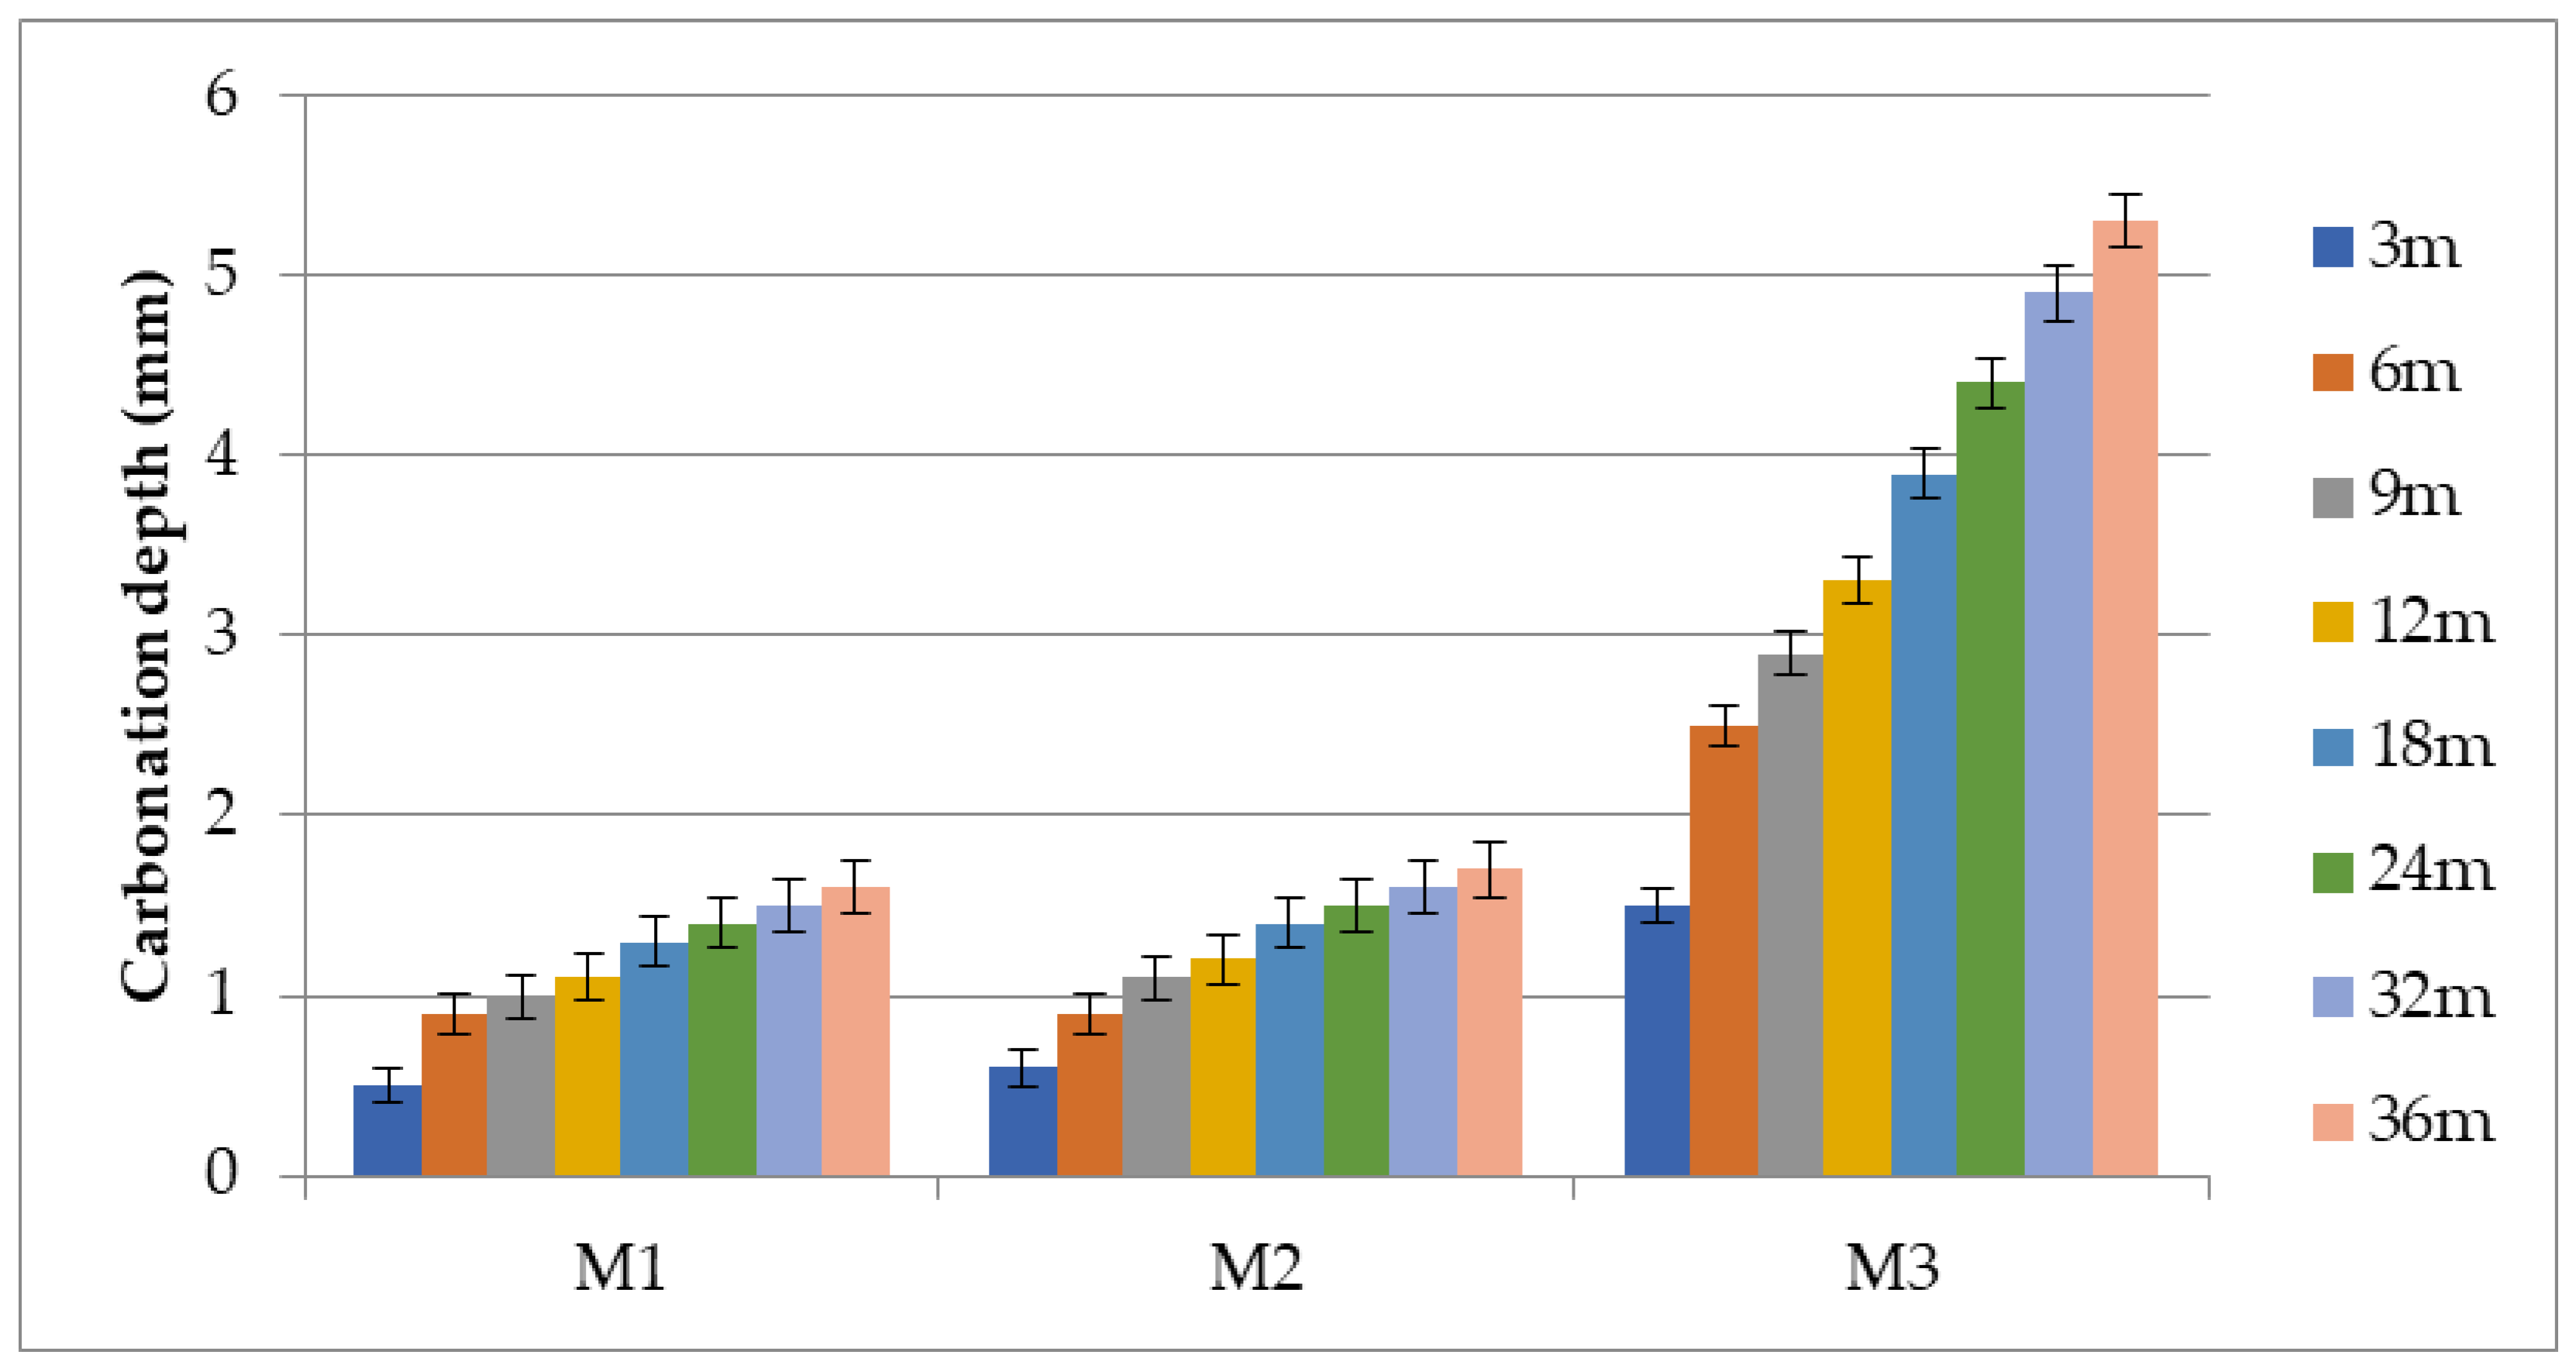
45] found that there were differences in the carbonation speed and depth of cement mortars with Portland cement made by different companies, a fact that shows the possibility of diversity in the results found in the literature. Depth of natural carbonation and standard deviation of mortar mixtures exposed in Xanthi is shown in Table 9 and Figure 9.
Table 9. Depth (mm) of natural carbonation and standard deviation of mortar mixtures exposed in Xanthi.
(mm)M1M2M3
3m0.5 (0.50)0.6 (0.52)1.5 (0.55)
6m0.9 (0.57)0.9 (0.55)2.5 (0.54)
9m1.0 (0.61)1.1 (0.58)2.9 (0.57)
12m1.1 (0.58)1.2 (0.56)3.3 (0.54)
18m1.3 (0.58)1.4 (0.63)3.9 (0.59)
24m1.4 (0.63)1.5 (0.62)4.4 (0.60)
30m1.5 (0.61)1.6 (0.64)4.9 (0.63)
36m1.6 (0.60)1.7 (0.61)5.3 (0.63)
The overall picture of the results of the mixtures exposed outdoors in the Xanthi area is similar to that of accelerated carbonation. The mixtures Μ1 and M2, in which CEM I 42.5N and CEM II/A-M (P-LL) 42.5N cements were used, also showed lower depths of carbonation penetration at all measurement ages up to 3 years. The volume of pores and the number of microcracks of these specimens were lower, this being a decisive factor in their reduced carbonation level [36]. Table 10 presents the values of natural carbonation depth in the selected regions of Greece at 36 months of age.
Table 10. Depth (mm) of natural carbonation and standard deviation at 36 months of age.
M1M2M3
Xanthi1.6 (0.67)1.7 (0.59)5.3 (0.64)
Thessaloniki1.6 (0.62)1.7 (0.65)5.4 (0.62)
Ioannina2.4 (0.72)2.6 (0.68)6.1 (0.67)
Voiotia1.9 (0.70)2.0 (0.74)5.4 (0.72)
Center of Athens1.9 (0.81)2.1 (0.75)5.3 (0.85)
Patras2.3 (0.75)2.5 (0.84)5.9 (0.80)
All the results of natural carbonation from all selected areas confirm the results of accelerated carbonation and reinforce the conclusion that the use of CEM I 42.5N and CEM II/A-M (P-LL) 42.5N cements has a beneficial effect on carbonation resistance. The effect of cement strength class on carbonation can also be investigated at the microlevel. The difference between the properties of cements with various strength classes is due to differences between their constituent compounds, especially the main components in the hydration products [39,40]. This difference in the microstructure level leads to changes in both volume of pores and structure of the specimens, which are factors that affect compressive strength [36]. The volume of pores and the number of microcracks for samples with 42.5 cement are lower compared to samples of 32.5 cement [39,40,46].
At the same time, studying the variations of the results between the selected areas points to the fact that the exposure environment greatly influences the penetration of carbonation. Mortars exposed in areas such as Patras and Ioannina showed increased depths of carbonation compared to mortars exposed in other areas. For this reason, the correlation of carbonation evolution of each cement mortar with the meteorological data of the exposure areas was investigated.
Most papers in the literature generally report on carbonation depth after a specific time of exposure. However, the resistance to carbonation used for service life prediction modeling is mostly expressed as a coefficient, which is the relation between the carbonation depth and time of exposure [42]. Several analytical models are used to describe the relationship between carbonation depth (x) and concrete age (t). The most widely used is the analytic solution of Fick’s first law in the form:
x = k·t0.5
where x is the carbonation front depth, t is the exposure time and k is the carbonation coefficient. This coefficient depends on environmental conditions such as CO2 concentration and humidity, and concrete characteristics such as w/c ratio and type of cement, and therefore varies significantly from one structure to another [47].
During the evolution of the experiments, a convergence of the k coefficient to specific values was observed with the addition of each new measurement, as was a simultaneous reduction of the standard deviation of the results. This fact is confirmed by Vanoutrive et al. [40], who concluded that carbonation rates based on carbonation depths at greater exposure ages show lower deviation; therefore, these values are considered to serve as a good estimate of the potential resistance to carbonation of the tested mixtures. Based on this conclusion, in the present paper, five values were used until the 180 days of exposure for accelerated carbonation (ages of 28, 56, 90, 120 and 180 days) and eight values for up to 3 years of exposure for natural carbonation (ages of 3, 6, 9, 12, 18, 24, 30 and 36 months) in order to achieve more stable and reliable results. In Table 11, the values of the k coefficient for the cement mortars tested in accelerated carbonation are presented.
Table 11. k coefficient of cement mortars exposed to accelerated carbonation.
M1M2M3
k (mm/day 1/2)0.4310.4661.050
R20.1270.0780.153
Table 12 presents the values of the k coefficient for all cement mortars that were exposed to natural carbonation in the selected areas.
Table 12. k coefficient (mm/day 1/2) and coefficient of determination R2 of cement mortars exposed in the selected areas.
M1M2M3
kR2kR2kR2
Xanthi0.8610.9780.9030.9721.9160.969
Thessaloniki1.0200.9671.0710.9662.2400.963
Ioannina1.5990.9691.6790.9703.3920.969
Voiotia1.2960.9481.3610.9472.7740.945
Center of Athens1.3020.9511.3620.9482.7960.944
Patras1.5080.9621.5820.9643.2530.959
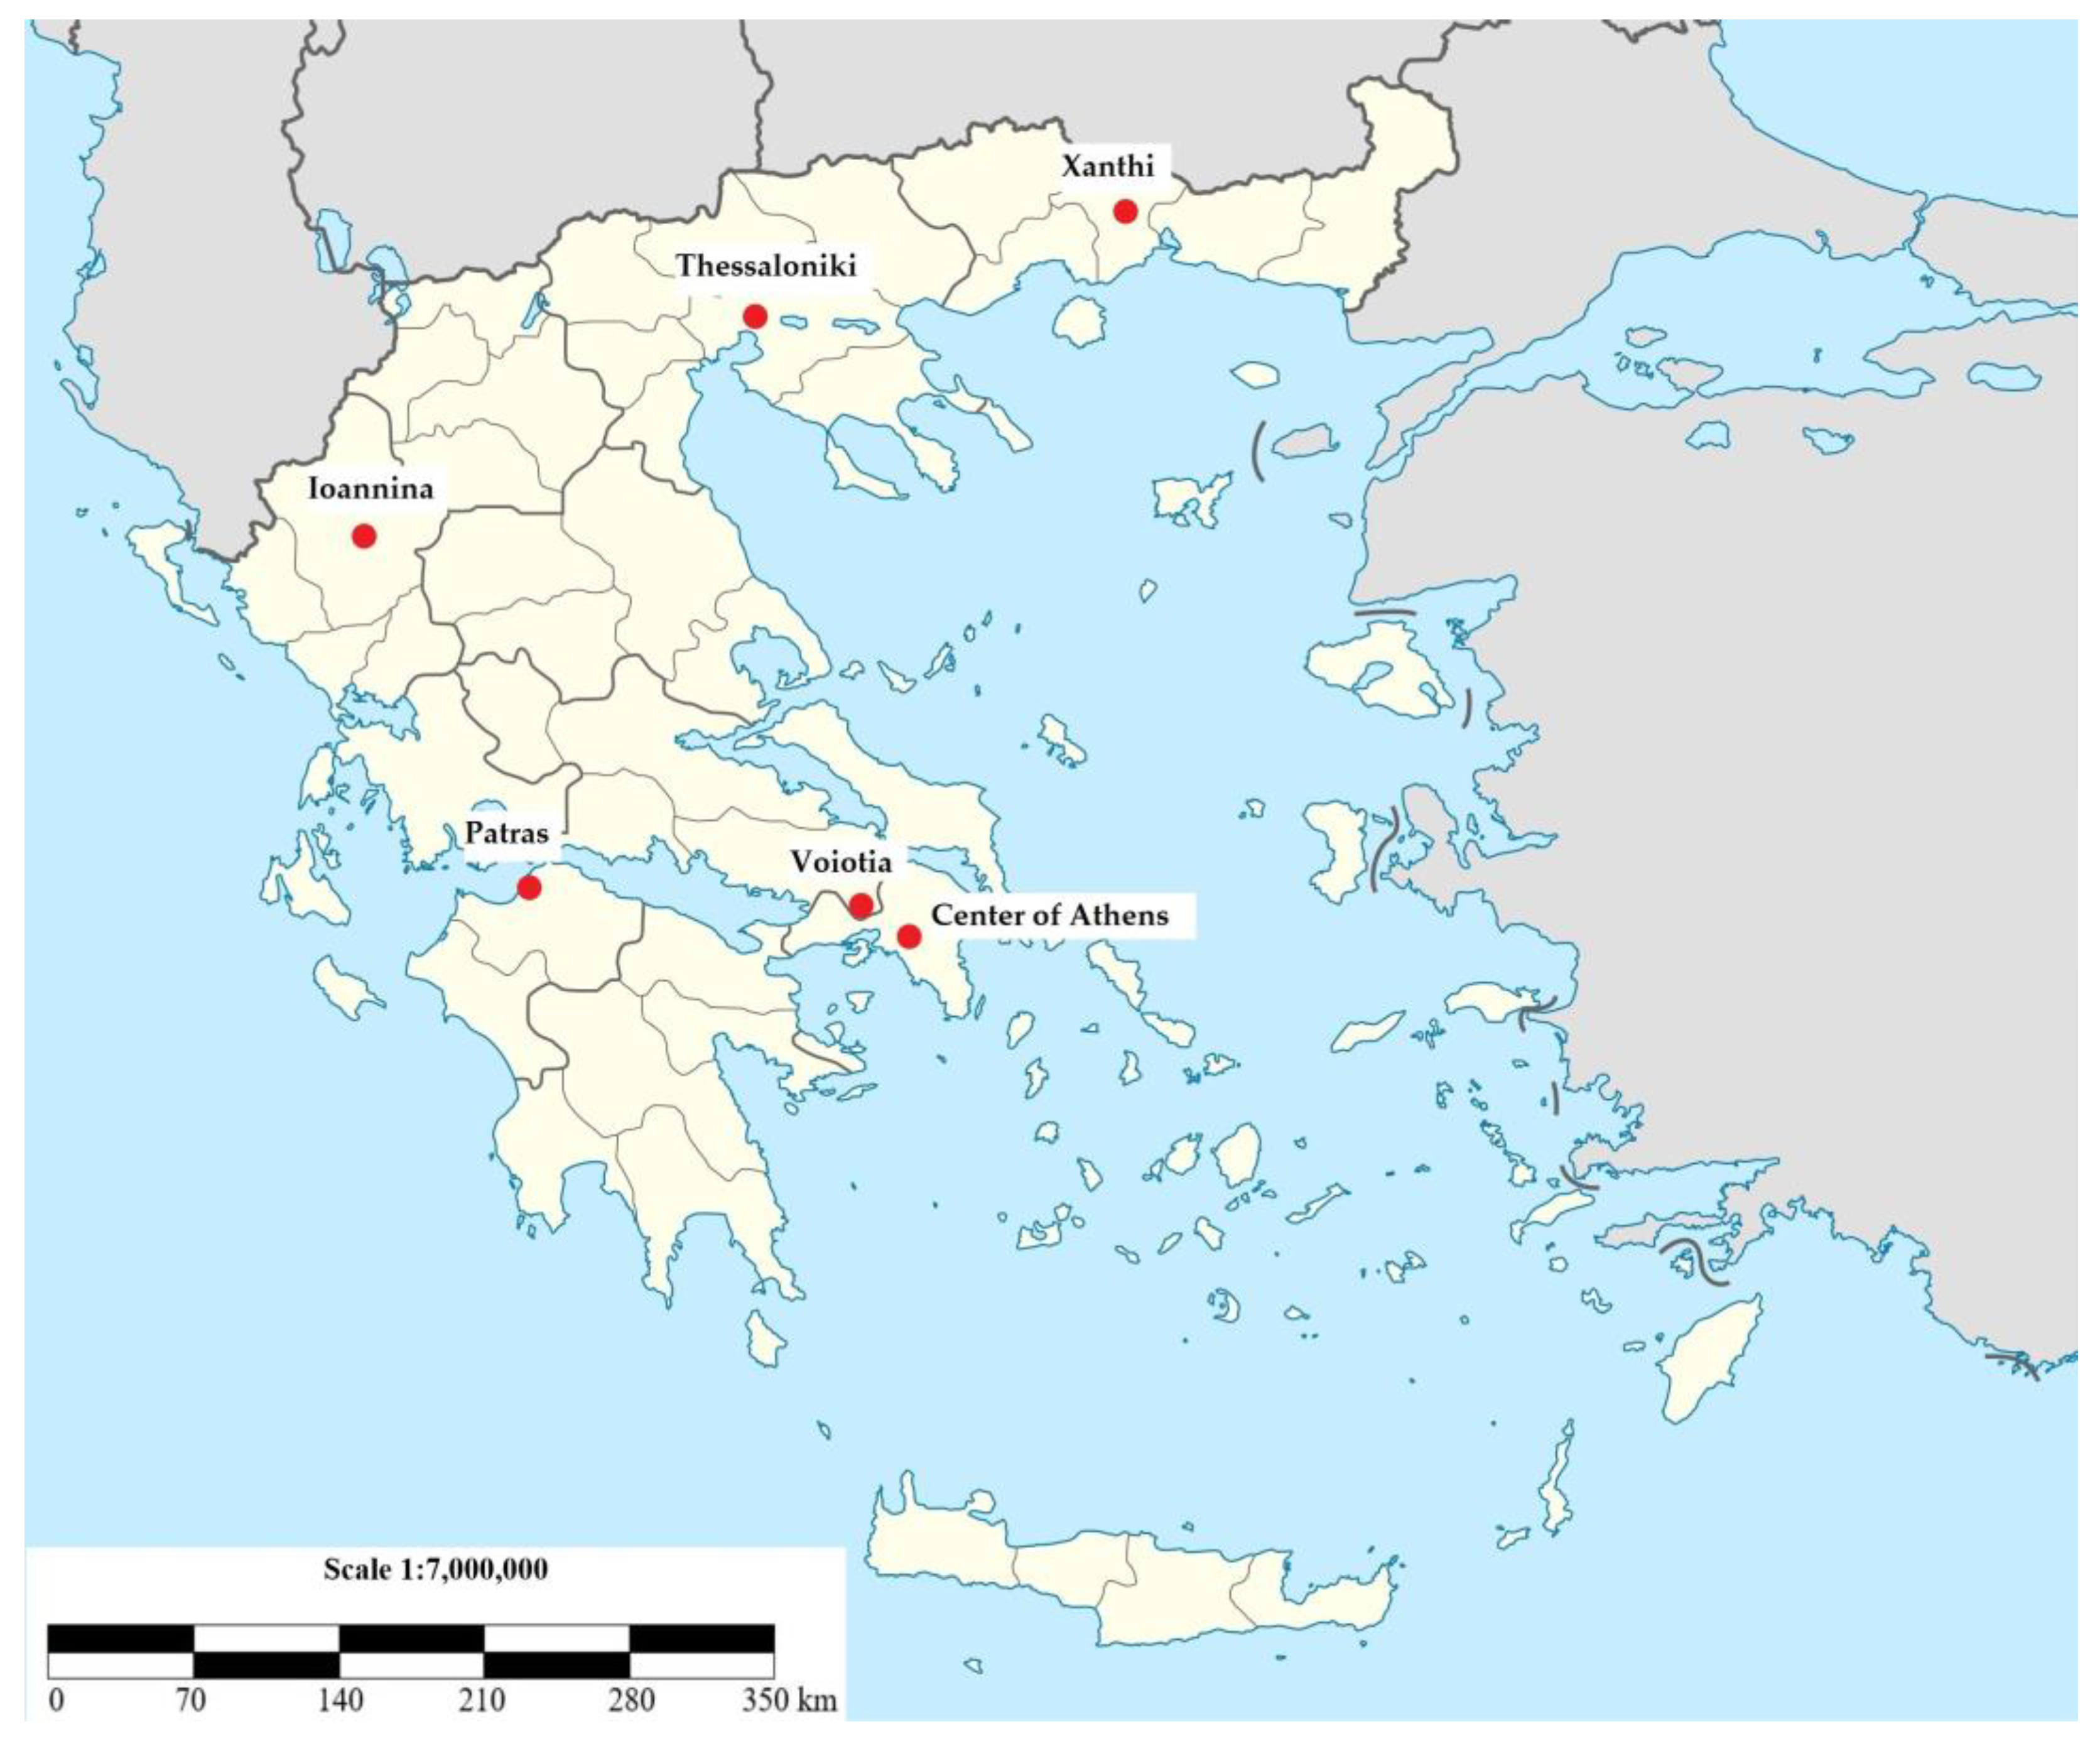
Table 13 shows average annual temperature (T), relative humidity (RH), annual rainfall (mm) and rainfall higher than 25 mm (days) in the exposure areas for the three years of exposure (2019–2021).
Table 13. Average annual temperature (T), relative humidity (RH), annual rainfall (mm) and rainfall higher than 25 mm (days) in exposure areas [48].
CityT (°C)RH (%)Rainfall (mm)Rainfall > 25 mm (Days)
Xanthi14.267.746230
Thessaloniki15.966.644840
Ioannina19.669.2108080
Voiotia18.459.139511
Center of Athens17.861.341123
Patras18.666.379357
An increase in the carbonation coefficient k was observed in this study for cement mortars that were exposed in areas with higher average annual temperatures and higher average relative humidity for all three types of cement used. Haque and Khaiat [49] studied about 50 buildings located from 0.5 to 18 km from the coast of Kuwait. They found that the coastal structures exposed to higher temperatures showed higher values of carbonation depth than the near-coastal structures. The same paper recommends that concrete structures situated in hot dry coastal regions should be built with a compressive strength at least in the range of 30–50 MPa, in order to avoid premature durability problems. Monteiro et al. [47] investigated 47 samples from existing concrete structures with ages up to 99 years and found that k = 3.76 mm/year0.5. Ta et al. [50] concluded that the carbonation coefficient depends on many influencing parameters such as compressive strength, ambient temperature and relative external humidity.
Taking into account that, in large urban centers such as Athens and Thessaloniki, the concentration of carbon dioxide is greater (420–450 ppm in Athens and Thessaloniki during the testing period, while the relevant values in Xanthi, Ioannina and Patra were 380–410 ppm) [48], the conclusion is strengthened that the combination of high temperature, humidity and precipitation had a negative effect on the carbonation of the specimens, as Ioannina and Patras are not the largest and most densely populated cities that were examined, but nevertheless presented the highest coefficient k.
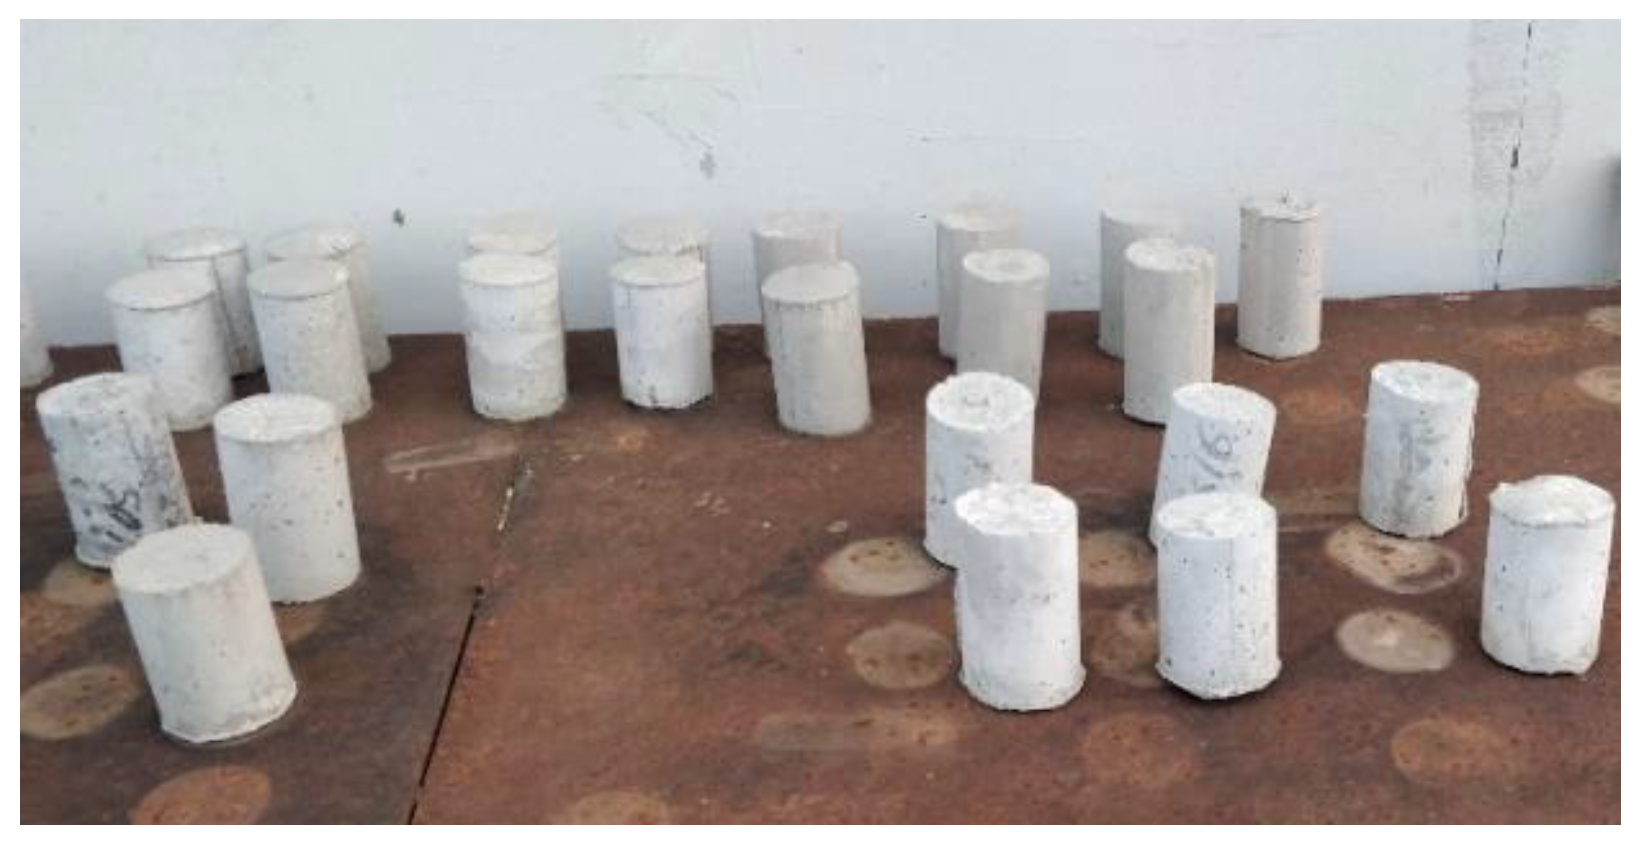
3.2.2. Concretes

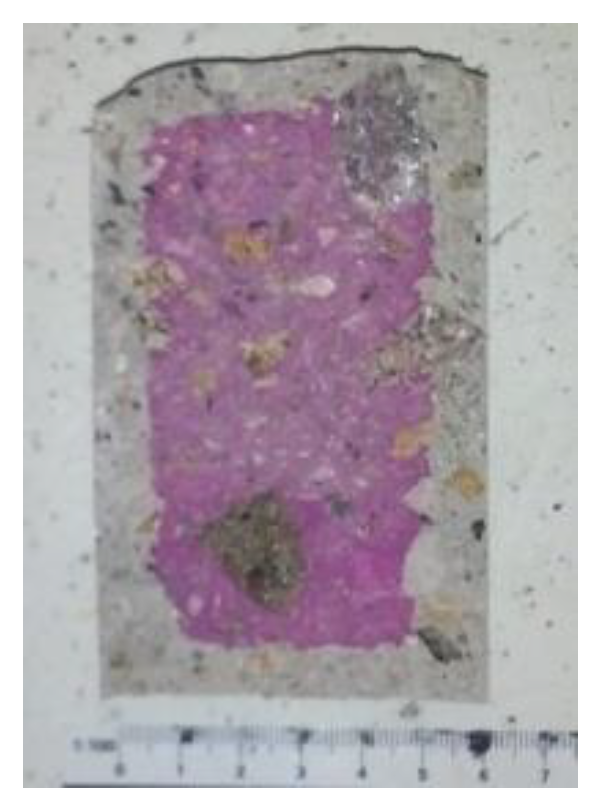
Carbonation depth due to accelerated exposure was measured after 28, 56, 90 and 180 days and natural carbonation depth was measured after 3, 6, 9, 12, 18, 24, 30 and 36 months of exposure. A freshly broken surface sprayed with a phenolphthalein indicator [35] is shown in Figure 10.
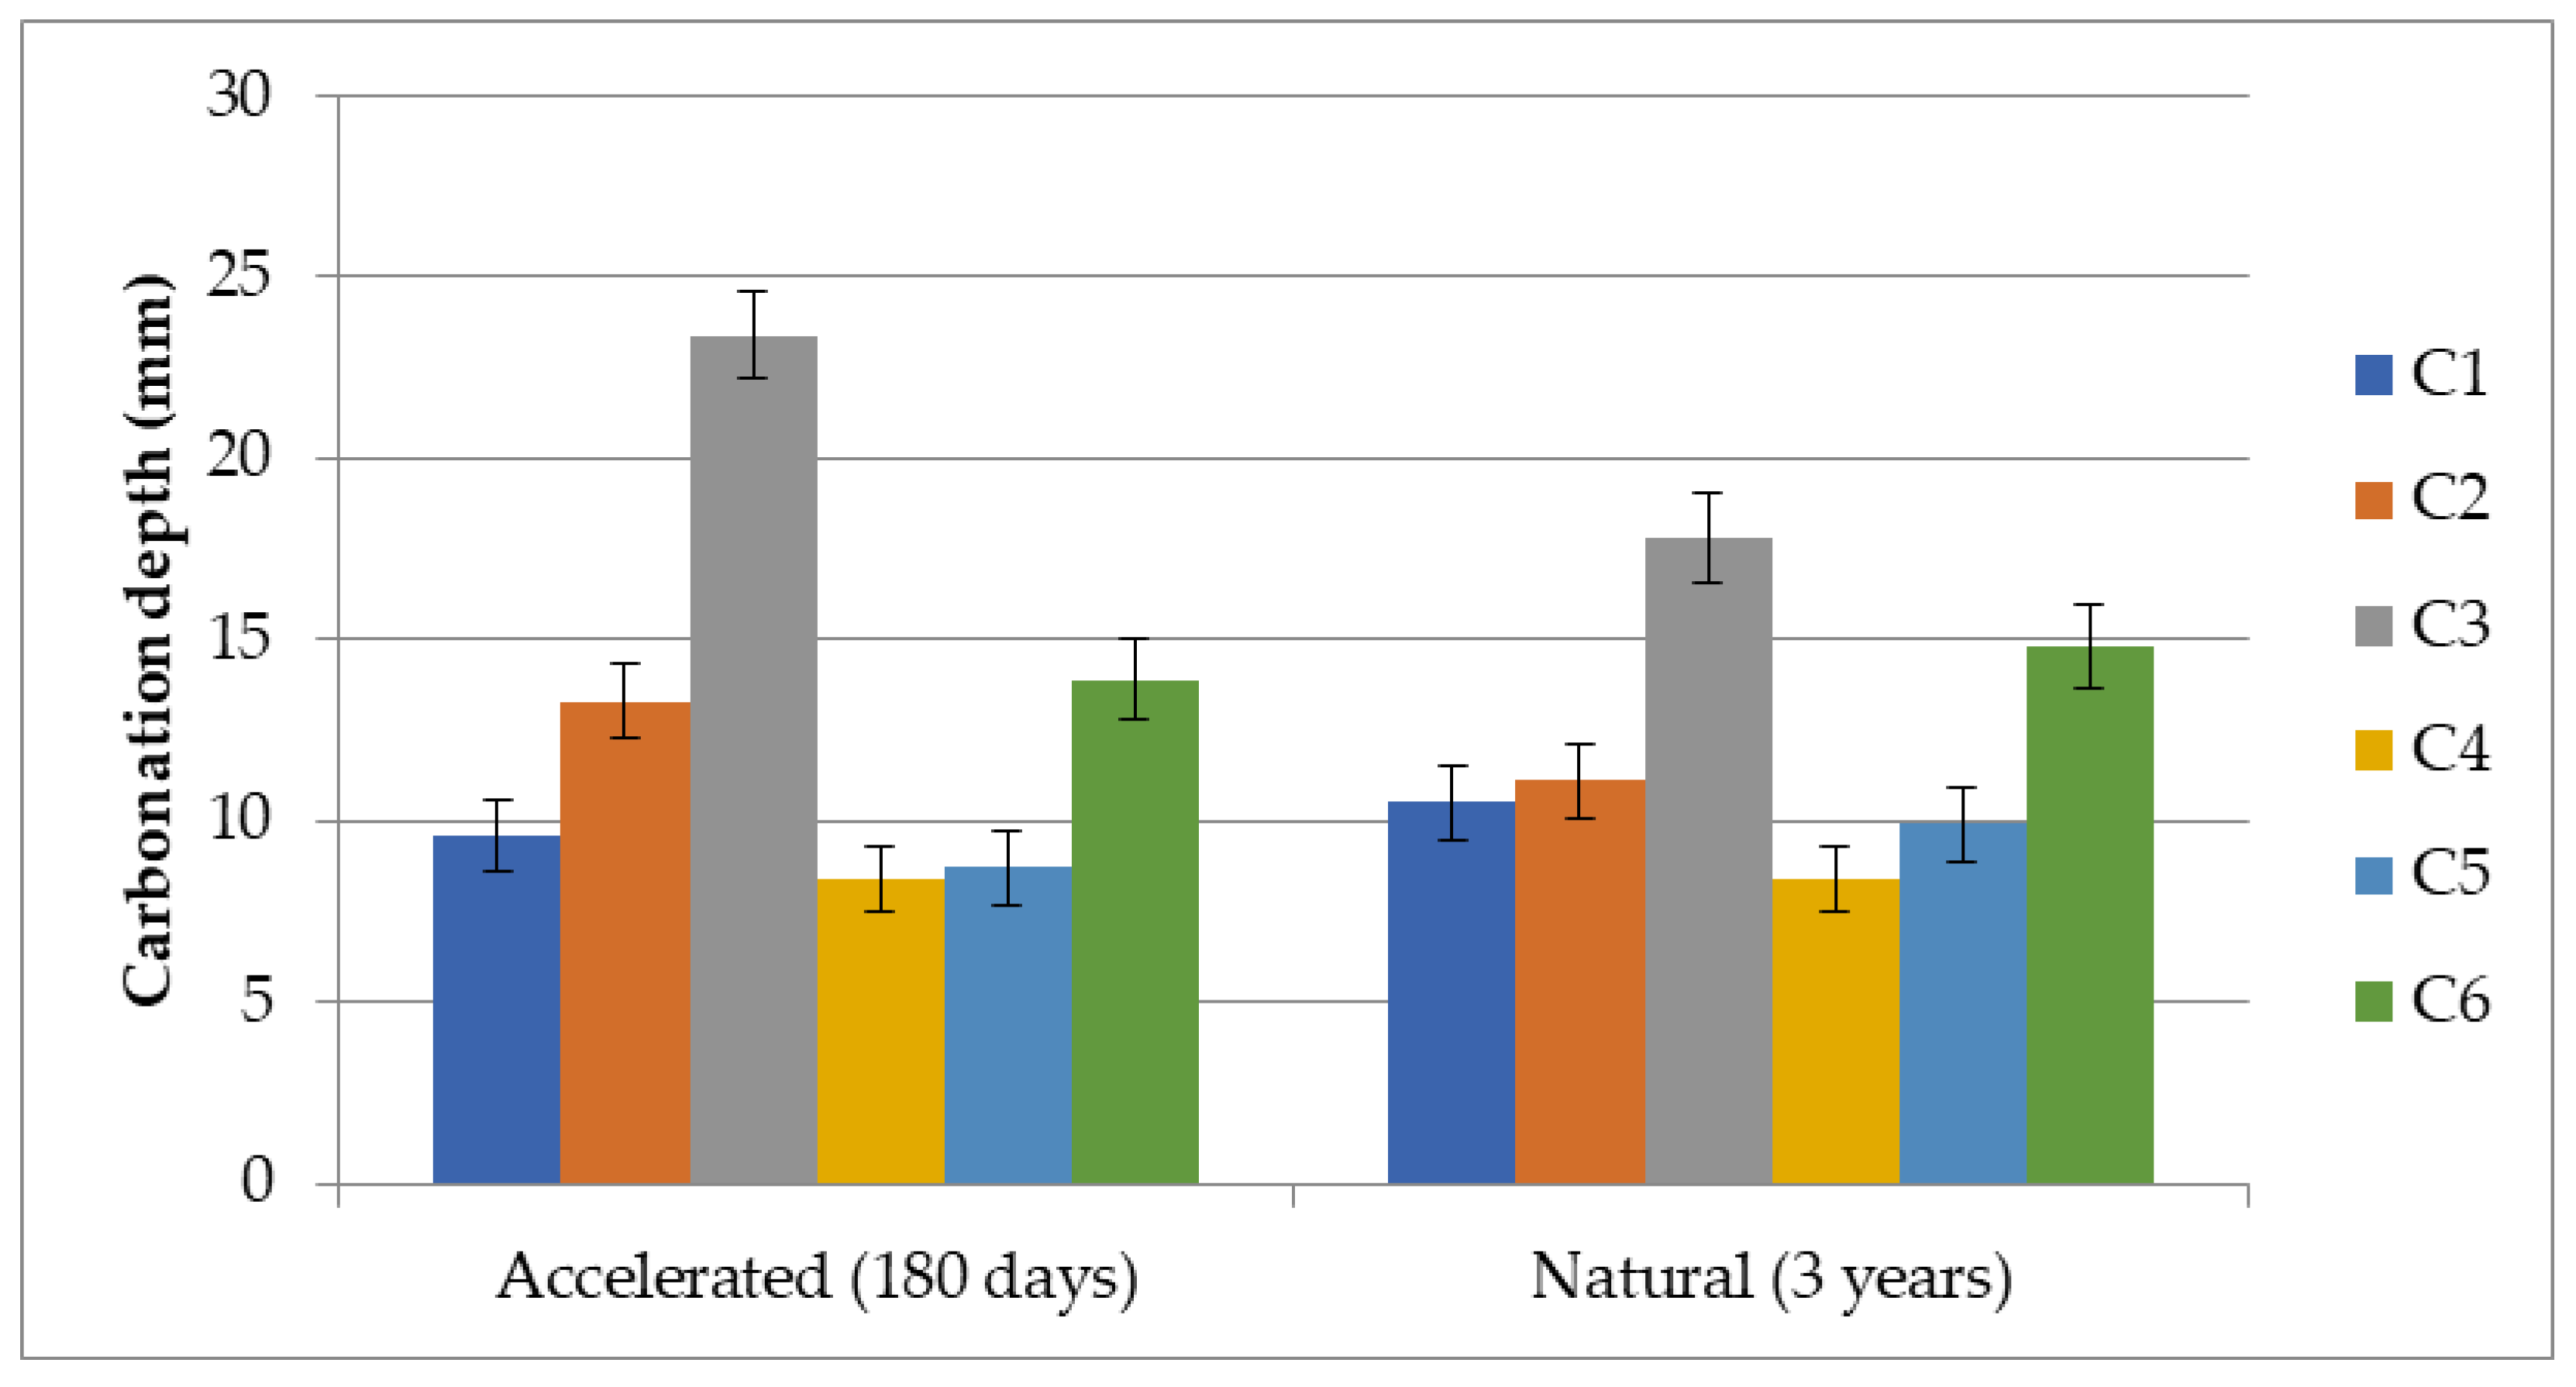
The final values of carbonation depth for all mixtures in accelerated and natural carbonation are shown in Table 14 and Table 15, and are represented graphically in Figure 11.
Table 14. Carbonation depth and standard deviation of C25/30 strength class mixtures.
(mm)C1C2C3
Accelerated (180 days)9.613.323.4
s1.021.141.27
Natural (3 years)10.511.117.8
s0.990.941.18
The above figure shows the positive effect of the use of CEM I cement on carbonation resistance in concrete. All mixtures of both strength classes have lower values of carbonation depth in both accelerated and natural carbonation. In Table 16 and Table 17 are presented k coefficient of C25/30 and C30/37 strength class concretes.
Concrete structures that come into contact with atmospheric air are always subjected to carbonation; therefore, this category of durability is particularly important for the sustainability of construction projects in areas such as Greece and the Mediterranean, where the phenomenon of carbonation is more intense due to local climatic conditions [51,52]. For this reason, it is extremely useful to have a means of predicting carbonation in Greece. For this purpose, in the present study, the results of carbonation of cement mortars were combined and compared with concrete results in order to find a correlation between them. Carbonation testing is often executed on a mortar scale, which is then assumed to be representative of the concrete scale [42]. The ratios of the k values between cement mortars and concretes were calculated, showing high homogeneity, and are presented in Table 18 for accelerated carbonation. In the tables that follow, knat-concrete is the k coefficient for natural carbonation of concrete, kacc-concrete is the k coefficient for accelerated carbonation of concrete, knat,mortar is the k coefficient for natural carbonation of mortar and kacc-mortar is the k coefficient for accelerated carbonation of mortar.
Vanoutrive et al. [42] concluded that the carbonation coefficient of concrete was 1.18 times that of mortar in accelerated carbonation. Papadakis et al. [53] found a factor of 1.1 between the mortar and concrete scales. The findings of the present study estimate this factor values from 1.46 to 1.67, depending on the different design of each mixture.
The ratios of the k values between accelerated and natural carbonation were calculated and are shown in Table 19 for concrete mixtures
The ratios of the k values between cement mortars and concretes were calculated, showing high homogeneity, and are presented in Table 20 for natural carbonation.
The ratios of the k values between accelerated and natural carbonation were calculated and are shown in Table 21 for mortar mixtures for the six areas of exposure.
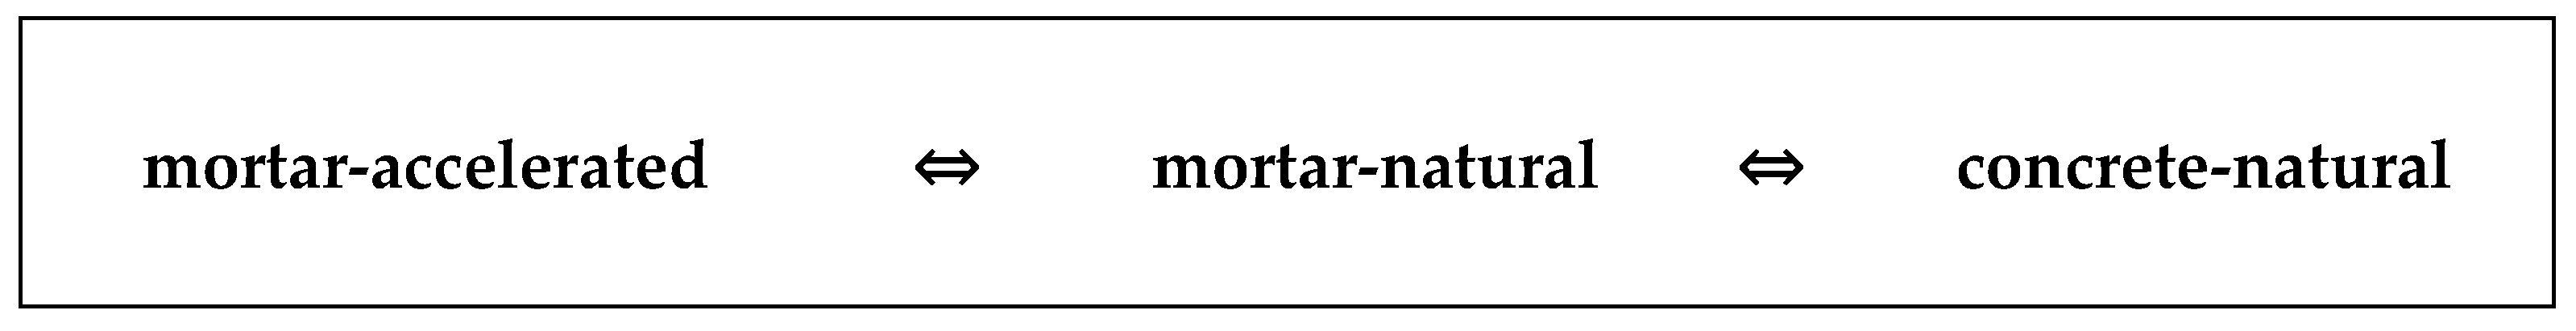
The high homogeneity of the results and their verification show the capability of empirically predicting the carbonation depth of concrete constructions at least in the six selected regions, and possibly even in regions with climatic conditions that are closely similar to those of the tested areas. Using the k coefficient ratios of Table 18, Table 19, Table 20 and Table 21, according to the sequence presented in Figure 12, a general empirical rule is deduced for the prediction of concrete carbonation in the selected areas.
As already stated, the aim of the present research is the prediction of natural carbonation of concrete starting from the accelerated carbonation of mortar. According to Figure 12, the way to correlate these two values is through the natural carbonation of mortars, specifically by using the ratios of k coefficients of Table 20 and Table 21.
For the most effective use of the empirical model, the following equation was formulated:
knat-concrete = kacc-mortar ÷ enp × scp × cemp × rp × acurp
where knat-concrete is the required k coefficient for natural carbonation of concrete, kacc-mortar is the given k coefficient for accelerated carbonation of mortar, enp is the environmental parameter according to Table 22, scp is the w/c ratio parameter according to Table 23, cemp is the cement parameter according to Table 24, rp is the rainfall parameter according to Table 25 and acurp is the curing parameter according to Table 26 [54].
Equation (2) was used to calculate k coefficients for concretes in the selected areas, as presented in Table 27.
Table 28 presents a comparison of the results of knat-concrete coefficient due to real exposure and the same results according to Equation (2). The differences between them are also shown in the table.
The differences in the knat-concrete coefficient between real exposure in Xanthi and the prediction model range from 2.7–7.6%, with these percentages being considered low, providing that the prediction model shows high reliability.

3.3. Service Life of Concretes Exposed to Natural Carbonation

The scenario that follows refers to a construction exposed to natural carbonation. Service life against carbonation was calculated using the equation proposed by Tuutti [55]:
tL = ti + tp
In this equation, tL is the total service life of the structure in years, ti is the time in years when the carbonation depth reaches the reinforcement (initiation of corrosion, this was calculated using the following Equation (4)) and tp is the propagation period, which is equal to 15 years for the case of an XC4 environment with moderate humidity according to the LNEC E 465 standard [54].
t i = ( x k ) 2
In this equation, x is the depth of carbonation in mm and k is the coefficient of carbonation in mm/day ½.
The calculation of the carbonation coefficient k was performed by linear regression on the eight different carbonation depth values measured up to 3 years of age, as described and presented above.
The selected exposure class was XC4 according to Standard EN 206 [28], with clear reinforcement cover of 35 mm. The calculated service life values of all concrete mixtures for all selected areas are presented in Table 29 and Figure 13.
Service life in terms of carbonation penetration is significantly greater when CEM II/B-M (W-P-LL) 32.5N cement is not used for both strength classes of C25/30 and C30/37. It is worth mentioning that the mixture C6 of strength class C30/37 has a shorter service life than mixtures C1 and C2 of strength class C25/30 in all areas of exposure, a fact that indicates the negative effect of CEM II/B-M (W-P-LL) 32.5N cement on carbonation resistance.
The prediction of service life in this study shows great differences between the areas of exposure. Areas such as Ioannina and Patras, where mean relative humidity and mean temperatures are higher, tend to present higher k values and, as a result, shorter service life of structures. Haque and Khaiat [49] concluded that structures in coastal regions exposed to higher temperatures present a higher depth of carbonation. Ekolu [27] observed a great variety of carbonation depths and k coefficients in 44 existing reinforced concrete structures. These great differences were largely due to the different climatic conditions of the areas where the structures were located.

4. Conclusions

For all properties studied, though to varying degrees, the type of cement used and meteorological conditions of exposure areas played a decisive role in the results of the measurements, both at an early stage and at a later stage. There was significantly increased compressive strength of both cement mortar and concrete mixtures in which CEM I 42.5N and CEM II/A-M (P-LL) 42.5N cements were used, confirming the existing literature. Characteristically, at 28 days of age, the compressive strength of the Μ3 mixture was 22% lower compared to M1 and C3, and the strength of C6 was nearly 27% lower compared to C1 and C4.
The values of the k coefficient confirm the negative effect of CEM II/B-M (W-P-LL) 32.5N cement in both mortars and concrete mixtures.
The correlation of k values with the meteorological data of exposure areas indicates an increase in the k for cement mortars in areas with a higher average annual temperatures, higher average relative humidity and higher rainfall, such as Ioannina and Patras, for all three types of cement used. On the other hand, the microclimates of Xanthi and Thessaloniki were shown to keep the k coefficient low.
The correlation of ratios of k coefficients for all classes of mixtures and exposures tested led us to an empirical prediction model for service life of concrete structures in the selected areas. The empirical model has 2.7–7.6% approximation to real results, characterizing it as reliable.
According to the empirical model of this study, a decreased service life of about 40% is estimated in Ioannina and Patras, where mean relative humidity and mean temperatures are higher, with service lives of 19.1–27.0 years for C25/30 concretes and 20.5–31.0 years for C30/37 concretes in these two areas. Meteorological conditions with RH higher than 65% and temperature higher than 18 °C significantly affect the service life of the concretes investigated.
Real measurements and predictions of this study showed that service life of 50 years with 35 mm clear cover according to the EN 206 standard [28] is not achieved in all circumstances despite conforming to the notes of the standard. A significant reduction of service life was observed in the areas of Ioannina and Patras but also in all areas with the use of CEM II/B-M (W-P-LL) 32.5N cement despite the fact that all other notes of the standard were applied.
The verification of the empirical model with real results shows the capability to predict the carbonation depth of concrete constructions at least in the six selected regions, and possibly in regions with climatic conditions closely similar those of the tested areas, using data of mortars exposed to accelerated carbonation as a starting point.
Durability indicators and calculation of the maximum lifetime of the concretes provided us with an economic and technical analysis showing that CEM I 42.5N and CEM II/A-M (P-LL) 42.5N cements increase the useful lifetime of structures in terms of corrosion due to carbonation, in contrast to CEM II / B-M (W-P-LL) 32.5N cement, the use of which leads to not achieving the useful lifetime target. This can result in the reduction of required repairs to structures in order to achieve an effective life of 50 years and, overall, a noticeable reduction in the cost of constructions.

Author Contributions

Conceptualization, K.K.S., E.T. and M.S.K.; methodology, K.K.S. and E.T.; software, C.T.; validation, C.T., K.K.S. and A.C.; formal analysis, C.T.; investigation, C.T.; resources, K.K.S.; data curation, C.T.; writing—original draft preparation, C.T.; writing—review and editing, K.K.S.; visualization, C.T.; supervision, K.K.S.; project administration, C.T. and A.C. All authors have read and agreed to the published version of the manuscript.

Funding

This research received no external funding.

Data Availability Statement

The data presented in this study are available upon request from the corresponding authors.

Acknowledgments

The authors wish to thank Sika Hellas S.A. for providing the chemical admixtures used in the current research.

Conflicts of Interest

The authors declare no conflict of interest.

References

  1. Sukanchan, P. Recent Advances in Corrosion Science: A Critical Overview and a Deep Comprehension. In Direct Synthesis of Metal Complexes; Kharisov, B., Ed.; Elsevier: Amsterdam, The Netherlands, 2018; pp. 379–411. [Google Scholar] [CrossRef]
  2. Fuhaid, A.F.A.; Niaz, A. Carbonation and Corrosion Problems in Reinforced Concrete Structures. Buildings 2022, 12, 586. [Google Scholar] [CrossRef]
  3. Caritha, V.; Athira, G.; Bahurudeen, A.; Shekhar, S. Carbonation of alkali activated binders and comparison with the performance of ordinary Portland cement and blended cement binders. J. Build. Eng. 2022, 53, 104513. [Google Scholar] [CrossRef]
  4. Ekolu, S.O. A review on effects of curing, sheltering, and CO2 concentration upon natural carbonation of concrete. Constr. Build. Mater. 2016, 127, 306–320. [Google Scholar] [CrossRef]
  5. Tang, L.; Utgenannt, P.; Lindvall, A.; Boubitsas, D. Validation of Models and Test Methods for Assessment of Durability of Concrete Structures in the Road Environment; CBI Betonginstitutet: Stockholm, Sweden, 2010. [Google Scholar]
  6. Ikuton, B.D.; Ekolu, S. The Effect of a Modified Zeolite Additive as a Concrete Improver: Modified Zeolite Additive as Concrete Improve; LAP Lambert Academic Publishing: Saarbruecken, Germany, 2012; pp. 132–148. [Google Scholar]
  7. Zhijian, S.Z.; Wang, W.; Cheng, C.; Tang, X. Predicting method for time-dependent concrete carbonation depth (I): Traditional model and its error distribution. Electron. J. Geotech. Eng. 2013, 18, 2298–2308. [Google Scholar]
  8. Czarnecki, L.; Woyciechowski, P. Modelling of concrete carbonation; is it a process unlimited in time and restricted in space? Bull. Pol. Acad. Sci. Tech. Sci. 2015, 63, 43–54. [Google Scholar] [CrossRef]
  9. Zhang, X.; Zhou, X.; Zhou, H.; Gao, K.; Wang, Z. Studies on forecasting of carbonation depth of slag high performance concrete considering gas permeability. Appl. Clay Sci. 2013, 79, 36–40. [Google Scholar] [CrossRef]
  10. Model Code, Model Code 2010 Final Draft; International Federation for Structural Concrete (FIB): Lausanne, Switzerland, 2012.
  11. Schießl, P.; Gehlen, C. (Eds.) fib 34: Model Code for Service-Life Design; FIB: Lausanne, Switzerland, 2006; p. 126. [Google Scholar]
  12. Kari, O.P.; Puttonen, J.; Skantz, E. Reactive transport modelling of long-term carbonation. Cem. Concr. Compos. 2014, 52, 42–53. [Google Scholar] [CrossRef]
  13. He, R.; Jia, H. Carbonation depth prediction of concrete made with fly ash. Electron. J. Geotech. Eng. 2011, 16, 605–614. [Google Scholar]
  14. Silva, A.; Neves, R.; Brito, J. Statistical modelling of carbonation in reinforced concrete. Cem. Concr. Compos. 2014, 50, 73–81. [Google Scholar] [CrossRef]
  15. Hills, T.P.; Gordon, F.; Florin, N.H.; Fenell, P.S. Statistical analysis of the carbonation rate of concrete. Cem. Concr. Res. 2015, 72, 98–107. [Google Scholar] [CrossRef]
  16. Chen, Y.; Liu, P.; Yu, Z. Effects of Environmental Factors on Concrete Carbonation Depth and Compressive Strength. Materials 2018, 11, 2167. [Google Scholar] [CrossRef] [PubMed]
  17. Wang, Y.; Nakukuttan, S.; Bai, Y.; Basheer, P.A.M. Influence of combined carbonation and chloride ingress regimes on rate of ingress and redistribution of chlorides in concretes. Constr. Build. Mater. 2017, 140, 173–183. [Google Scholar] [CrossRef] [Green Version]
  18. Liu, P.; Yu, Z.; Chen, Y. Carbonation depth model and carbonated acceleration rate of concrete under different environment. Cem. Concr. Compos. 2020, 114, 103736. [Google Scholar] [CrossRef]
  19. Merah, A.; Korichi, Y.; Khenfer, M.M. Effect of cement types on carbonation depth of concrete. J. Build. Mater. Struct. 2020, 7, 87–94. [Google Scholar] [CrossRef]
  20. Mahmood, W.; Khan, A.R.; Ayub, T. Carbonation Resistance in Ordinary Portland Cement Concrete with and without Recycled Coarse Aggregate in Natural and Simulated Environment. Sustainability 2021, 14, 437. [Google Scholar] [CrossRef]
  21. Neves, R.; Branco, F.; Brito, J. Field assessment of the relationship between natural and accelerated concrete carbonation resistance. Cem. Concr. Compos. 2013, 41, 9–15. [Google Scholar] [CrossRef]
  22. Leemann, A.; Nygaard, P.; Kaufmann, J.; Loser, R. Relation between carbonation resistance, mix design and exposure of mortar and concrete. Cem. Concr. Compos. 2015, 62, 33–43. [Google Scholar] [CrossRef]
  23. Boualleg, S.; Bencheikh, M.; Belagraa, L.; Daoudi, A.; Chikouche, M.A. The Combined Effect of the Initial Cure and the Type of Cement on the Natural Carbonation, the Portlandite Content, and Novevaporable Water in Blended Cement. Adv. Mater. Sci. Eng. 2017, 2017, 5634713. [Google Scholar] [CrossRef] [Green Version]
  24. Zhao, H.; Sun, W.; Wu, X.; Gao, B. The Effect of the Material Factors on the Concrete Resistance Against Carbonation. KSCE J. Civ. Eng. 2018, 22, 1265–1274. [Google Scholar] [CrossRef]
  25. Lin, R.S.; Wang, X.Y.; Han, Y. Effects of cement types and addition of quartz and limestone on the normal and carbonation curing of cement paste. Constr. Build. Mater. 2021, 305, 124799. [Google Scholar] [CrossRef]
  26. Elsalamawy, M.; Mohamed, A.R.; Kamal, E.M. The role of relative humidity and cement type on carbonation resistance of concrete. Alexandria Eng. J. 2019, 54, 1257–1264. [Google Scholar] [CrossRef]
  27. Ekolu, S.O. Model for natural carbonation prediction (NCP): Practical application worldwide to existing real life functioning concrete structures. Eng. Struct. 2018, 224, 111126. [Google Scholar] [CrossRef]
  28. EN 206-1; Concrete—Part 1: Specification, Performance, Production and Conformity. European Committee for Standardisation: London, UK, 2013.
  29. EN 197-1; Cement—Composition, Specifications and Conformity Criteria for Common Cements. European Committee for Standardisation: London, UK, 2011.
  30. EN 196-1; Methods of Testing Cement. Determination of Strength. Romanian Standards Association: Bucharest, Romania, 2016.
  31. EN 12390-4:2019; Testing Hardened Concrete—Part 4: Compressive Strength—Specification for Testing Machines. CEN (European Committee for Standardization): Brussels, Belgium, 2019.
  32. DIN 4187; Screening Surfaces, Perforated Plates for Test Sieves, Round Hole Perforation. Deutsches Institut fur Normung e.V.: Berlin, Germany, 1974.
  33. EN 12390-4:2019; Testing Hardened Concrete—Part 3: Compressive Strength of Test Specimens. European Committee for Standardization: Brussels, Belgium, 2019.
  34. EN 14630; Products and Systems for the Protection and Repair of Concrete Structures. Test Methods. Determination of Carbonation Depth in Hardened Concrete by the Phenolphthalein Method. NBN Bureau for Standardisation: Brussels, Belgium, 2007.
  35. RILEM TC 56-MHM: CPC-18 Measurement of hardened concrete carbonation depth. Mater. Struct. 1988, 21, 453–455. [CrossRef]
  36. Yousuf, F.; Xiaosheng, W. Investigation of the early-age microstructural development of hydrating cement pastes through electrical resistivity measurements. Case Stud. Constr. Mater. 2020, 13, e00391. [Google Scholar] [CrossRef]
  37. Liu, Z.; Zhang, Y.; Jiang, Q. Continuous tracking of the relationship between resistivity and pore structure of cement pastes. Constr. Build. Mater. 2014, 53, 26–31. [Google Scholar] [CrossRef]
  38. Soroka, E. Portland Cement Paste and Concrete; Macmillan International Higher Education: London, UK, 1979. [Google Scholar]
  39. Mahdinia, S.; Eskandari-Naddaf, H.; Shadnia, R. Effect of cement strength class on the prediction of compressive strength of cement mortar using GEP method. Constr. Build. Mater. 2019, 198, 27–41. [Google Scholar] [CrossRef]
  40. Kargari, A.; Eskandari-Naddaf, H.; Kazemi, R. Effect of cement strength class on the generalization of Abrams’ law. Struct. Concr. 2018, 20, 493–505. [Google Scholar] [CrossRef]
  41. Okumu, V.A.; Shitote, S.M.; Oyawa, W.O. Influence of Constituent Materials Properties on the Compressive Strength of in Situ Concrete in Kenya. Open J. Civ. Eng. 2017, 7, 63–81. [Google Scholar] [CrossRef] [Green Version]
  42. RILEM TC 281-CCC: Outcomes of a round robin on the resistance to accelerated carbonation of Portland, Portland-fly ash and blast-furnace blended cements. Mater. Struct. 2022, 55, 99. [CrossRef]
  43. Ekolu, S.O.; Murugan, S. Durability Index Performance of High Strength Concretes Made Based on Different Standard Portland Cements. Adv. Mater. Sci. Eng. 2012, 2012, 410909. [Google Scholar] [CrossRef] [Green Version]
  44. Singh, N.; Singh, S. Carbonation and electrical resistance of self compacting concrete made with recycled concrete aggregates and metakaolin. Constr. Build. Mater. 2016, 121, 400–409. [Google Scholar] [CrossRef]
  45. Torre, A.; Valerio, J.; Basurto, J.; Mosquera, L.; Quintana, N. Measurement of the speed of absorption of CO2 by Portland cement pastes and pure and additive mortars. In Proceedings of the the 18th LACCEI International Multi-Conference for Engineering, Education, and Technology: Engineering, Integration, and Alliances for a Sustainable Development. Hemispheric Cooperation for Competitiveness and Prosperity on a Knowledge-Based Economy, Virtual, 27–31 July 2020. [Google Scholar] [CrossRef]
  46. Neville, A.M. Properties of Concrete; Longman: London, UK, 1995. [Google Scholar]
  47. Monteiro, I.; Branco, F.; Brito, J.; Neves, R. Statistical analysis of the carbonation coefficient in open air concrete structures. Constr. Build. Mater. 2012, 29, 263–269. [Google Scholar] [CrossRef]
  48. Hellenic National Meteorological Service. Available online: http://emy.gr/emy/en (accessed on 5 August 2021).
  49. Haque, M.N.; Al-Khaiat, H. Carbonation of concrete structures in hot dry coastal regions. Cem. Concr. Compos. 1997, 19, 123–129. [Google Scholar] [CrossRef]
  50. Ta, V.-L.; Bonnet, S.; Kiesse, T.S.; Ventura, A. A new meta-model to calculate carbonation front depth within concrete structures. Constr. Build. Mater. 2016, 129, 172–181. [Google Scholar] [CrossRef] [Green Version]
  51. Koutsogianni, C. Influence of Local Environmental Conditions on the Long Term Carbonation and Service Life of Reinforced Concrete Structures. Master’s Thesis, Democritus Univeristy of Thrace, Xanthi, Greece, 2017. [Google Scholar]
  52. Chatzopoulos, A.; Sideris, K.K.; Tassos, C. Production of concretes using slag aggregates: Contribution of increasing the durability and sustainability of constructions. Case Stud. Constr. Mater. 2021, 15, e00711. [Google Scholar] [CrossRef]
  53. Papadakis, V.G.; Vayenas, C.G.; Fardis, M.N. Fundamental modeling and experimental investigation of concrete carbonation. ACI Mater. J. 1991, 88, 363–373. [Google Scholar]
  54. LNEC E 465; Concrete. Methodology for Estimating the Concrete Performance Properties Allowing to Comply with the Design Working Life of Reinforced or Pre-Stressed Concrete Structures under Environmental Exposures XC and XS. Laboratório Nacional de Engenharia Civil: Lisboa, Portugal, 2005.
  55. Tuutti, K. Corrosion of Steel in Concrete. Ph.D. Thesis, Lund University, Stockholm, Sweden, 1982. [Google Scholar]
Figure 1. Selected areas for exposure.
Constrmater 03 00002 g001
Figure 2. Grain size distribution (granulometric curve) of all aggregates.
Constrmater 03 00002 g002
Figure 3. Specimens of concrete exposed to the open air unsheltered environment in the court of the building materials laboratory in Xanthi.
Constrmater 03 00002 g003
Figure 4. Compressive strength (MPa) of mortar mixtures.
Constrmater 03 00002 g004
Figure 5. Compressive strength (MPa) of C25/30 strength class mixtures.
Constrmater 03 00002 g005
Figure 6. Compressive strength (MPa) of C30/37 strength class mixtures.
Constrmater 03 00002 g006
Figure 7. Accelerated carbonation depth of cement mortars.
Constrmater 03 00002 g007
Figure 8. M1 mixture (a), M2 mixture (b) and M3 mixture (c) after being sprayed with phenolphthalein.
Constrmater 03 00002 g008
Figure 9. Depth of natural carbonation of mortar mixtures exposed to the outdoor environment of Xanthi.
Constrmater 03 00002 g009
Figure 10. Concrete mixture after being sprayed with phenolphthalein.
Constrmater 03 00002 g010
Figure 11. Accelerated and natural carbonation depth of all tested concrete mixtures.
Constrmater 03 00002 g011
Figure 12. Sequence of k coefficient correlations.
Constrmater 03 00002 g012
Figure 13. Service life of concrete mixtures due to carbonation.
Constrmater 03 00002 g013
Table 1. Chemical analysis and specific weight of cements.
CEM I 42.5CEM II/A-M
(P-LL) 42.5
CEM IΙ/B-Μ
(W-P-LL) 32.5
SiO220.8623.8528.00
2O35.385.229.00
Fe2O32.734.135.50
CaO60.8858.248.00
MgO2.313.202.20
SO33.133.303.20
K2O1.930.681.50
Na2O-0.320.50
TiO2-0.24-
P2O5-0.06-
SrO-0.03-
Cr2O3-0.02-
ZnO-0.01-
Spec. weight3.103.103.15
Table 2. Percentage passing through sieves for all aggregates.
Sieves (mm)0.0750.1250.250.512481631.5
Standard sand110183367100100100100100
Crushed sand8.115.521.330.649.480100100100100
River sand7.610.514.515.949.199.4100100100100
Gravel0000011973100100
Crushed stone00000001669100
Table 3. Mix design and characteristics of mortars.
Mix DesignM1M2M3
g
CEM I 42.5N45000
CEM II/A-M (P-LL) 42.5N04500
CEM II/B-M (W-P-LL) 32.5N00450
Standard sand135013501350
Water225225225
W/C0.500.500.50
Slump (mm)13.513.514.0
Table 4. Mix design and characteristics of C25/30 and 30/37 strength classes concretes.
Mix DesignC 25/30
CEM I 42.5N
C 25/30
CEM II/A-M (P-LL) 42.5N
C 25/30
CEM II/A-M (P-LL) 42.5N +
CEM II/B-M (W-P-LL) 32.5N
C 30/37
CEM I 42.5N
C 30/37
CEM II/A-M (P-LL) 42.5N
C 30/37
CEM II/A-M (P-LL) 42.5N +
CEM II/B-M (W-P-LL) 32.5N
kg/m3C1C2C3C4C5C6
CEM I 42.5N30030003503500
CEM II/A-M (P-LL) 42.5N0015000200
CEM II/B-M (W-P-LL) 32.5N0015000150
River sand400400400400400400
Crushed sand500500500500500500
Gravel270270270270270270
Crushed stone630630630630630630
Water180180180175175175
Superplasticizer1.171.171.171.41.41.4
W/C0.60.60.60.50.50.5
Slump (cm)162218.5171521
Table 5. Compressive strength (MPa) and standard deviation of mortar mixtures.
(MPa)M1M2M3
fc2 (s)25.7 (0.83)18.8 (0.95)11.8 (0.69)
fc7 (s)38.4 (0.56)30.0 (0.87)21.9 (0.72)
fc14 (s)52.6 (0.90)40.6 (0.89)30.0 (0.71)
fc28 (s)54.4 (0.87)48.1 (0.72)42.3 (0.60)
fc90 (s)56.1 (0.99)54.1 (0.79)49.2 (0.74)
fc180 (s)57.0 (0.72)55.9 (0.80)51.1 (0.78)
fc365 (s)57.8 (0.91)56.5 (0.76)52.4 (0.70)
Table 6. Compressive strength (MPa) and standard deviation of C25/30 strength class mixtures.
(MPa)C1C2C3
fc2 (s)26.4 (0.74)23.9 (0.99)18.1 (1.01)
fc7 (s)41.7 (1.12)32.7 (0.77)24.3 (0.64)
fc28 (s)46.1 (0.88)39.7 (0.65)34.0 (0.75)
fc180 (s)55.0 (0.72)43.3 (0.89)40.2 (0.81)
fc365 (s)60.2 (0.92)47.9 (0.55)46.8 (0.76)
Table 7. Compressive strength (MPa) and standard deviation of C30/37 strength class mixtures.
(MPa)C4C5C6
fc2 (s)30.0 (0.98)24.0 (1.02)22.7 (0.84)
fc7 (s)50.4 (0.91)36.1 (0.89)34.5 (0.93)
fc28 (s)58.7 (0.54)46.7 (0.92)43.3 (0.76)
fc180 (s)65.8 (0.85)53.4 (0.73)51.8 (1.13)
fc365 (s)70.4 (0.67)59.2 (0.77)55.7 (0.87)
Table 8. Depth (mm) of accelerated carbonation and standard deviation of mortar mixtures.
(mm)M1M2M3
28d2.5 (0.64)2.6 (0.61)5.8 (0.91)
56d3.5 (0.67)3.7 (0.80)8.1 (1.03)
90d4.3 (0.75)4.5 (0.81)10.3 (1.07)
120d4.8 (0.72)5.1 (0.71)11.7 (1.05)
180d5.8 (0.74)6.3 (0.67)14.0 (0.97)
Table 15. Carbonation depth of C30/37 strength class mixtures.
(mm)C4C5C6
Accelerated (180 days)8.48.713.9
s0.890.941.05
Natural (3 years)8.49.914.8
s0.911.071.19
Table 16. k coefficients of C25/30 strength class concretes.
kC1C2C3
Accelerated0.7160.7581.755
Natural5.6786.0259.949
Table 17. k coefficients of C30/37 strength class concretes.
kC4C5C6
Accelerated0.6400.6821.565
Natural4.8485.2748.532
Table 18. Ratio of carbonation coefficient (kacc-concrete/kacc-mortar) for strength classes C25/30 and C30/37 of concrete and mortar specimens exposed to accelerated carbonation.
C1-M1C2-M2C3-M3C4-M1C5-M2C6-M3
kacc-concrete/kacc-mortar1.661.631.671.481.461.49
Table 19. Ratio of carbonation coefficient (kacc-concrete/knat-concrete) for strength classes C25/30 and C30/37 of specimens exposed in Xanthi and in the carbonation chamber.
C1C2C3C4C5C6
kacc-concrete/knat-concrete0.130.130.180.130.130.18
Table 20. Ratio of carbonation coefficient (knat,concrete/knat,mortar) for strength classes C25/30 and C30/37 of specimens exposed in Xanthi.
C1-M1C2-M2C3-M3C4-M1C5-M2C6-M3
knat,concrete/knat,mortar6.596.675.195.635.844.45
Table 21. Ratio kacc-mortar/knat-mortar of cement mortars.
kacc-mortar/knat-mortarM1M2M3
Xanthi0.500.520.55
Thessaloniki0.420.440.47
Ioannina0.270.280.31
Voiotia0.330.340.38
Center of Athens0.330.340.38
Patras0.290.290.32
Table 22. Environmental parameter enp.
CEM I 42.5CEM II 42.5CEM II 32.5
RH > 65%/T > 18 °C0.280.2850.315
RH < 65%/T > 17 °C0.330.340.38
RH > 65%/T < 18 °C0.460.480.51
Table 23. Ratio w/c parameter scp.
scp
0.606.63
0.505.74
Table 24. Cement parameter cemp.
cemp
Exclusively 42.5 cement1.00
Combination 42.5–32.5 cement0.78
Table 25. Rainfall parameter rp.
Rainfall > 25 mm (Days)rp
<200.96
20–350.97
36–500.98
51–700.99
>701.00
Table 26. Curing parameter acurp [54].
Curing Period (Days)acurp
11.82
31.00
70.61
Table 27. Prediction of k coefficients of all concretes for all selected areas.
knat-concreteC1C2C3C4C5C6
Xanthi6.036.2410.335.225.418.94
Thessaloniki6.096.3110.435.275.469.03
Ioannina10.2110.8417.248.849.3914.92
Voiotia8.318.7213.727.207.5511.88
Center of Athens8.408.8113.867.277.6312.00
Patras10.1010.7317.078.759.2914.77
Table 28. knat-concrete values of real exposure and prediction model.
knat-concreteC1C2C3C4C5C6
Xanthi (reality)5.686.039.954.855.278.53
Xanthi (prediction)6.036.2410.335.225.418.94
Difference%6.23.53.87.62.74.8
Table 29. Service life (years) of concrete mixtures due to carbonation.
C1C2C3C4C5C6
Xanthi48.746.426.560.056.930.3
Thessaloniki48.145.826.359.156.130.0
Ioannina26.825.419.130.728.920.5
Voiotia32.731.121.538.736.523.7
Center of Athens32.430.821.438.236.023.5
Patras27.025.619.231.029.220.6
Disclaimer/Publisher’s Note: The statements, opinions and data contained in all publications are solely those of the individual author(s) and contributor(s) and not of MDPI and/or the editor(s). MDPI and/or the editor(s) disclaim responsibility for any injury to people or property resulting from any ideas, methods, instructions or products referred to in the content.

