Article

Experimental Investigation on the Compressive Stress-Sensing Ability of Steel Fiber-Reinforced Cement-Based Composites under Varying Temperature Conditions

1
Aix Marseille Univ, Centrale Marseille, CNRS, LMA, 13453 Marseille, France
2
Aix Marseille Univ, CNRS, IUSTI, 13453 Marseille, France
*
Author to whom correspondence should be addressed.
Constr. Mater. 2022, 2(4), 258-275; https://doi.org/10.3390/constrmater2040017
Submission received: 28 August 2022 / Revised: 3 October 2022 / Accepted: 19 October 2022 / Published: 27 October 2022
(This article belongs to the Topic Multifunctional Concrete for Smart Infrastructures)

Abstract

:
This study investigates the piezoresistive (self-sensing) properties of short stainless-steel fiber-reinforced mortar under varying temperature conditions. Different reinforced mortars were produced by varying fiber and aggregate content. First, Electrical Impedance Spectroscopy (EIS) measurements were used to characterize the electrical properties of the mortar specimens. EIS measurements were performed at temperatures of 24 °C, 35 °C, and 50 °C. Second, to investigate the self-sensing capacity of the different composites, the fractional changes of electrical impedance at 1 kHz were monitored under two conditions: temperature variation alone (cooling down from 35 °C or 50 °C to room temperature), and temperature variation combined with cyclic compressive loading (up to 5 MPa). The results of the former were used to compensate for the effect of temperature variations in the latter. Both temperature and mechanical loading produced meaningful variations in the electrical impedance and piezoresistivity of the investigated composites. Conclusions are drawn with respect to the stress and temperature sensitivity of the composites. The real and imaginary parts of the electrical impedance of the mortar produced with the highest fiber volume fraction (0.01%) and higher aggregate content (volume fraction of 60%) were distinctly sensitive to temperature and stress, which suggests the possibility of using the same composite as a stress and temperature sensor.

1. Introduction

The adequate incorporation of electrically conductive admixtures into cement-based materials results in an enhancement of the electrical conducting properties and makes it possible to use the resulting composite as a piezoresistive sensor [1,2,3,4,5,6,7]. The piezoresistive properties of composites are enhanced at admixture volume fractions near the percolation threshold, wherein small changes in mechanical strain produce large changes in the resistivity of the material. The mechanisms enabling the piezoresistivity are attributed to the varying electrical contact resistance between the single admixture units and the matrix upon the application of mechanical stimuli [5]. The development of piezoresistive cementitious composites has garnered much attention in the scientific communities working on Structural Health Monitoring (SHM) of civil engineering structures. The main advantages of cement-based sensors when compared to current off-the-shelf sensor technologies include their reduced cost, their double function as a sensor and load-bearing material, the possibility of a large sensing coverage, and their durability, which is comparable to that of the hosting structure [8]. Potential SHM applications span from damage detection and localization [9,10,11,12,13,14,15,16,17], traffic monitoring [18,19], to structural system identification [11,16,20,21,22,23,24].
Today, a myriad of electrically conductive fillers has already been investigated including carbon black, carbon nanotubes, carbon fibers, steel fibers, and nickel powders among the most popular [13,25,26,27,28,29,30,31,32]. The combination of different admixtures may also display a synergetic behavior [3,33,34,35,36,37]. The selection of the cement-based sensor constituents (including the form and nature of the electrically conductive admixture) must be motivated by factors including the resulting self-sensing capability, the ease of manufacturing, the durability performance, and the cost (among many others). In the particular case of using short fibers, some well-known benefits are obtained, such as superior mechanical properties (e.g., fracture toughness and bending strength) and improved long-term durability [3,8,38,39,40,41]. Despite the wealth of research studies conducted over the last three decades, today cement-based sensor technology has not achieved full market penetration. One of the main hindrances that limit the practical implementation of cement-based sensors is the understanding of their performance under varying environmental conditions [6]. Several studies have examined the variation of the electrical conduction of cement-based sensors upon varying temperature conditions [42,43,44,45,46,47]. Overall, the resistivity of the composites decreases with increasing temperature and such dependence appears to be mitigated as the volume fraction of filler increases. Since cement-based sensors are typically sensitive to mechanical stress and temperature, it becomes necessary to characterize their piezoresistive behavior at different temperatures as well as to provide a means for untangling both contributions in the sensor response.
This study investigates the piezoresistive properties of cement-based sensors under varying temperature conditions through AC measurements. Temperature variations were balanced out of the mechanical measurements by characterizing beforehand the response of the sensor to the sole action of temperature variations. The approach is demonstrated on cement-based sensors produced with micron-sized diameter stainless-steel fibers, even though it can reasonably be extensible to the more profusely investigated carbon-based admixtures. Different fiber and aggregate contents were considered to obtain mortars with very different electrical properties. First, Electrical Impedance Spectroscopy (EIS) measurements were used to characterize the electrical properties of the mortar specimens. These were performed at different (static) temperatures 24 °C, 35 °C, and 50 °C. Most of the previous studies have mainly focused on resistivity measurements conducted at a sole frequency or using DC. Electrical Impedance Spectroscopy (EIS) provides a more complete picture of the electrical makeup of the composite and is widely used to characterize cement-based materials [48,49,50,51] and electrically conductive cement-based composites [52,53,54,55,56,57]. Second, the variations of the electrical impedance were monitored under two conditions: temperature variation alone and temperature variation combined with cyclic compressive loading. Finally, conclusions are drawn considering the electrical sensitivity of the cement-based sensors to temperature variations and mechanical compressive stress.

2. Experimental Details

2.1. Materials

Different prismatic mortar samples (4 × 4 × 16 cm) were produced by varying aggregate and stainless-steel fiber volume fractions; three samples per type of mortar were produced. The cement type was CEM I 52.5R according to EN 197-1 [58]. The aggregate was siliceous with a maximum sieve size of 2 mm. Two aggregate volume fractions were used: 60% (denoted as “A”) and 40% (denoted as “B”). Stainless-steel fibers Beki-Shield® GR90/C02/6 were used as the conductive phase. These fibers measure 6 mm in length and 8 μm in diameter and were bundled in a water-soluble polymeric binder. Different fiber volume fractions were investigated: 0% (plain mortar), 0.05%, and 0.10%, which were designated to provide a variety of electrically conductive behavior thanks to allowing various degrees of percolation of the conductive fibers within the mortar matrix.
Table 1 summarizes the mortar designations and mixture proportions. The water-to-cement ratio (w/c) was set to 0.40 for all the mixes. In every mix, different amounts of superplasticizer (Glenium ACE 550) were used to achieve a plastic consistency in the fresh state. The necessary amounts of superplasticizer were ascertained beforehand on trial batches.
The mixes were prepared in a standard 5 L planetary mixer compliant with EN 196-1 [59]. First, cement, sand, and fibers were dry mixed for 1 min. Then, water and superplasticizer were poured and mixed at low speed for 1 min. Subsequently, the mixer was stopped for 90 s while the mix was stirred by hand and the bowl was scrapped. Then, the mixing was continued for 1 min. The samples were removed from molds after 24 h, and moist cured at 20 °C for 28 days. Then, the samples were oven-dried at 50 °C for three days before testing. This initial heat treatment sought to minimize the effects of varying moisture during the experimental campaign. Subsequent temperature preconditioning of the samples before electrical impedance and piezoresistive measurements further helped to reduce moisture content. The mass of the samples was recurrently verified with a centigram precision scale to confirm that meaningful variations of mass were not produced during the experimental campaign.

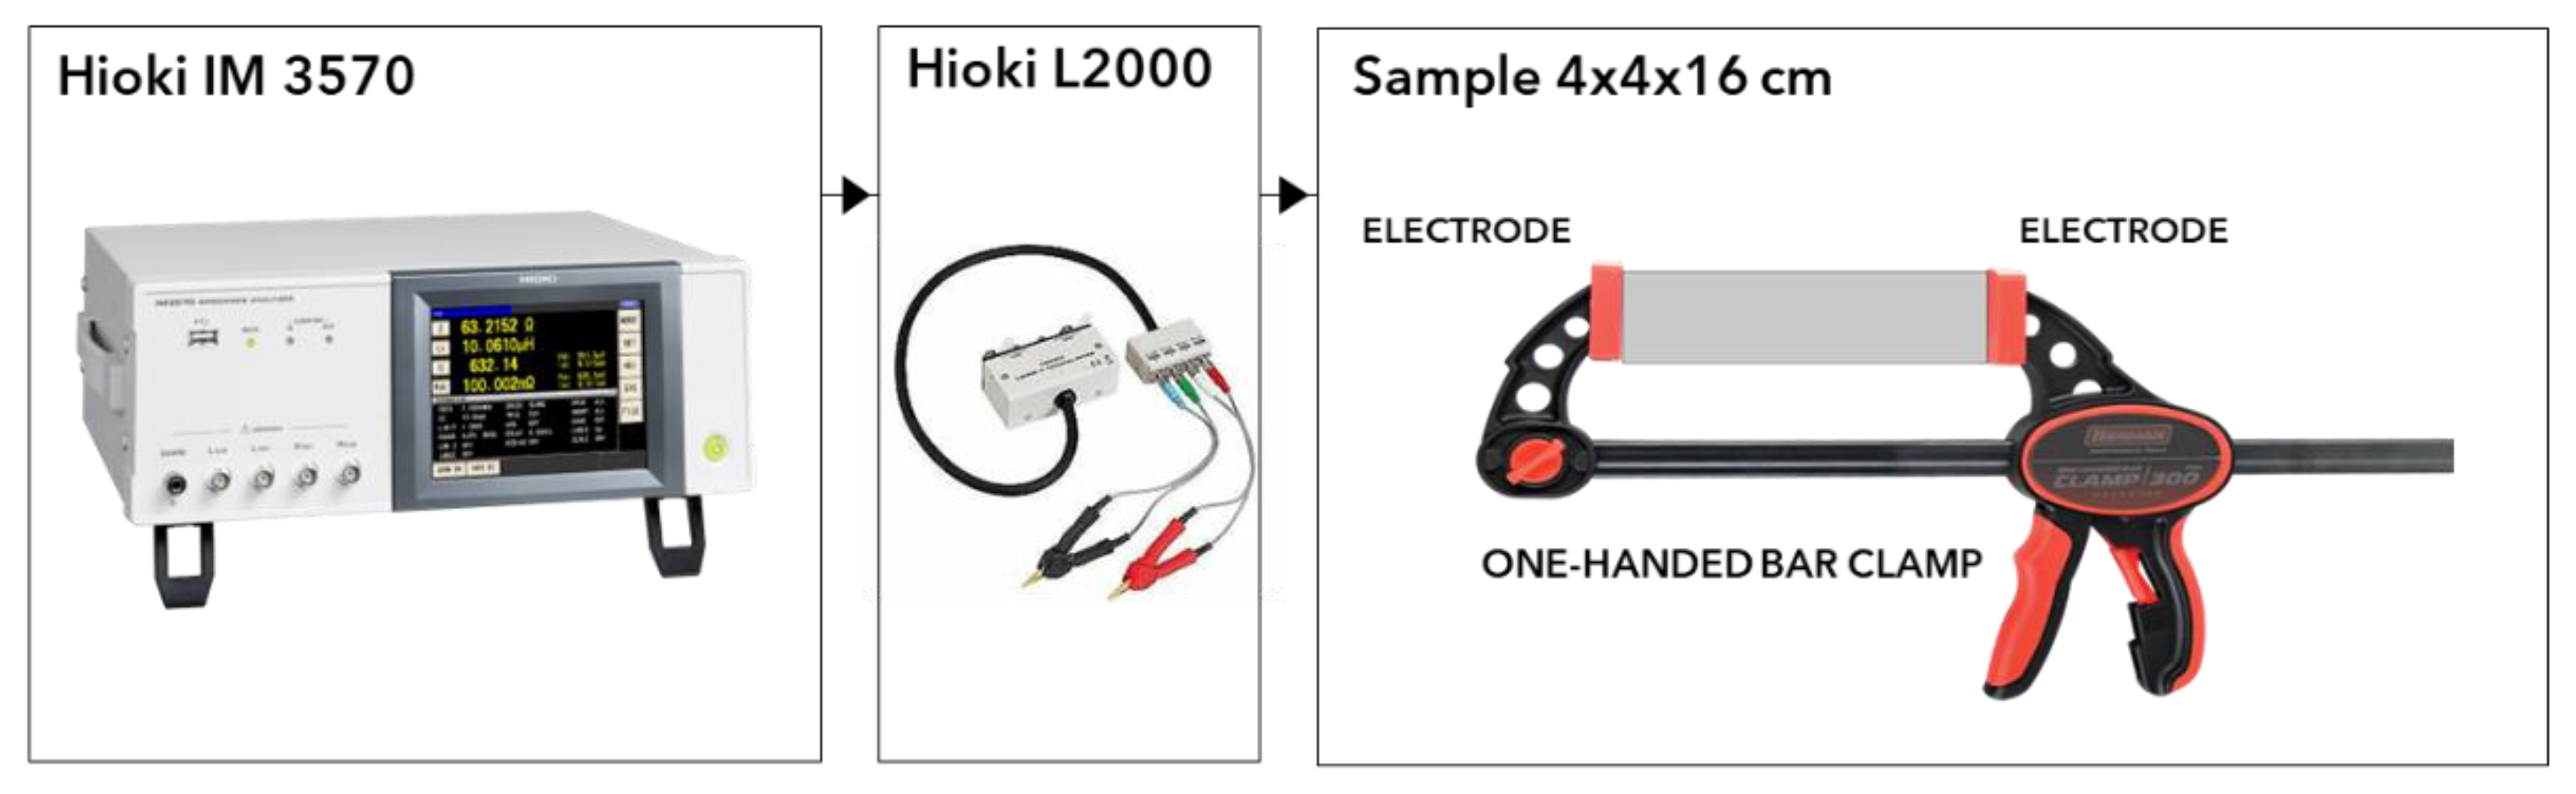
2.2. Electrical Properties Characterization and Testing Configuration

All the electrical measurements were performed on a two-electrode testing configuration. Two copper plates that matched the square sections of the sample were used as electrodes. The squared surfaces of the samples (40 × 40 mm2) were slightly polished with sandpaper and painted with a nickel powder-based coating. Once the applied coating was touch-dry (after ~5 min), two copper foil tape sheets were affixed onto these surfaces. The objective of such sample preparation is to enhance the electrical contact between the electrodes and the specimens. Electrical Impedance Spectroscopy (EIS) measurements were performed with an LCR-meter (Hioki, model IM 3570, and a four-terminal probe model L2000). The apparatus measures the electrical impedance within the frequency range of 4 Hz to 5 MHz. The electrical probes were clamped to the sample as shown in the schematic representation of the EIS testing configuration in Figure 1. The mortar samples were initially dried until reaching constant mass at 50 °C and then preconditioned and tested at the following temperatures: 24 °C (room temperature); 35 °C and 50 °C. The samples were briefly retired from the oven (one at a time) for performing the EIS measurements and then reintroduced to the oven (for 24 h) for reconditioning them to a different temperature.
Figure 2a shows a Nyquist representation of the electrical impedance spectrum summarizing common features observed in cement-based materials incorporating electrically conductive short fibers [52,53,56,60,61]. At the lowest frequency range (commonly within the 10−2–10−3 Hz range) a first branch may eventually be generated because of the electrodes. Then, with increasing AC frequency several arcs are developed. For the first arc, the cementitious matrix controls the transfer of charge through the material and the generation of a second arc is a characteristic feature of cement-based materials incorporating electrically conductive fibers below the percolation threshold. The latter is often dubbed “dual-arc” (or dual-cusp) behavior [52,53]. The cusp values formed between these arcs correspond to the matrix and composite resistance (see Figure 2a). Therefore, the frequency range used herein (4 Hz to 5 MHz) allowed for ascertaining the second cusp (or composite resistance), whereas the eventual generation of the spurious electrode arc and the development of the first cusp (matrix resistance) were not observed.
The EIS results were modeled by an equivalent circuit capable of describing the variations of the electrical impedance within the investigated frequency range. In practice, it is possible to find more than one equivalent circuit that fits a given EIS data. Very different circuits were previously proposed to describe the EIS data of electrically conductive cement-based composites [53]. Herein, the equivalent circuit model shown in Figure 2b was used to fit the EIS data. A similar equivalent circuit was satisfactorily used to model EIS data of cement paste and mortar [62] and steel fiber-reinforced cementitious composites [56]. It consists of an N series of circuits (herein N = 2) composed of a resistor in parallel to a constant phase element (or Cole element). It reads as
Z ( ω ) = n = 1 n = N R n R n · T n · ( i · ω ) P n + 1  
wherein Rn, Tn, and Pn are the parameters of the resistance and the constant phase element parameters of the nth RC circuit. The parameter Pn takes on a value of 1 for a perfect capacitor; values lower than 1 enable the representation of depressed semicircles in the Nyquist plot which are commonly observed in cement composites incorporating electrically conductive fibers. The equivalent circuit model was fitted to all reinforced mortars and then used to obtain a reliable estimation of the second cusp value (the composite resistance, Rcomposite) at different temperatures.

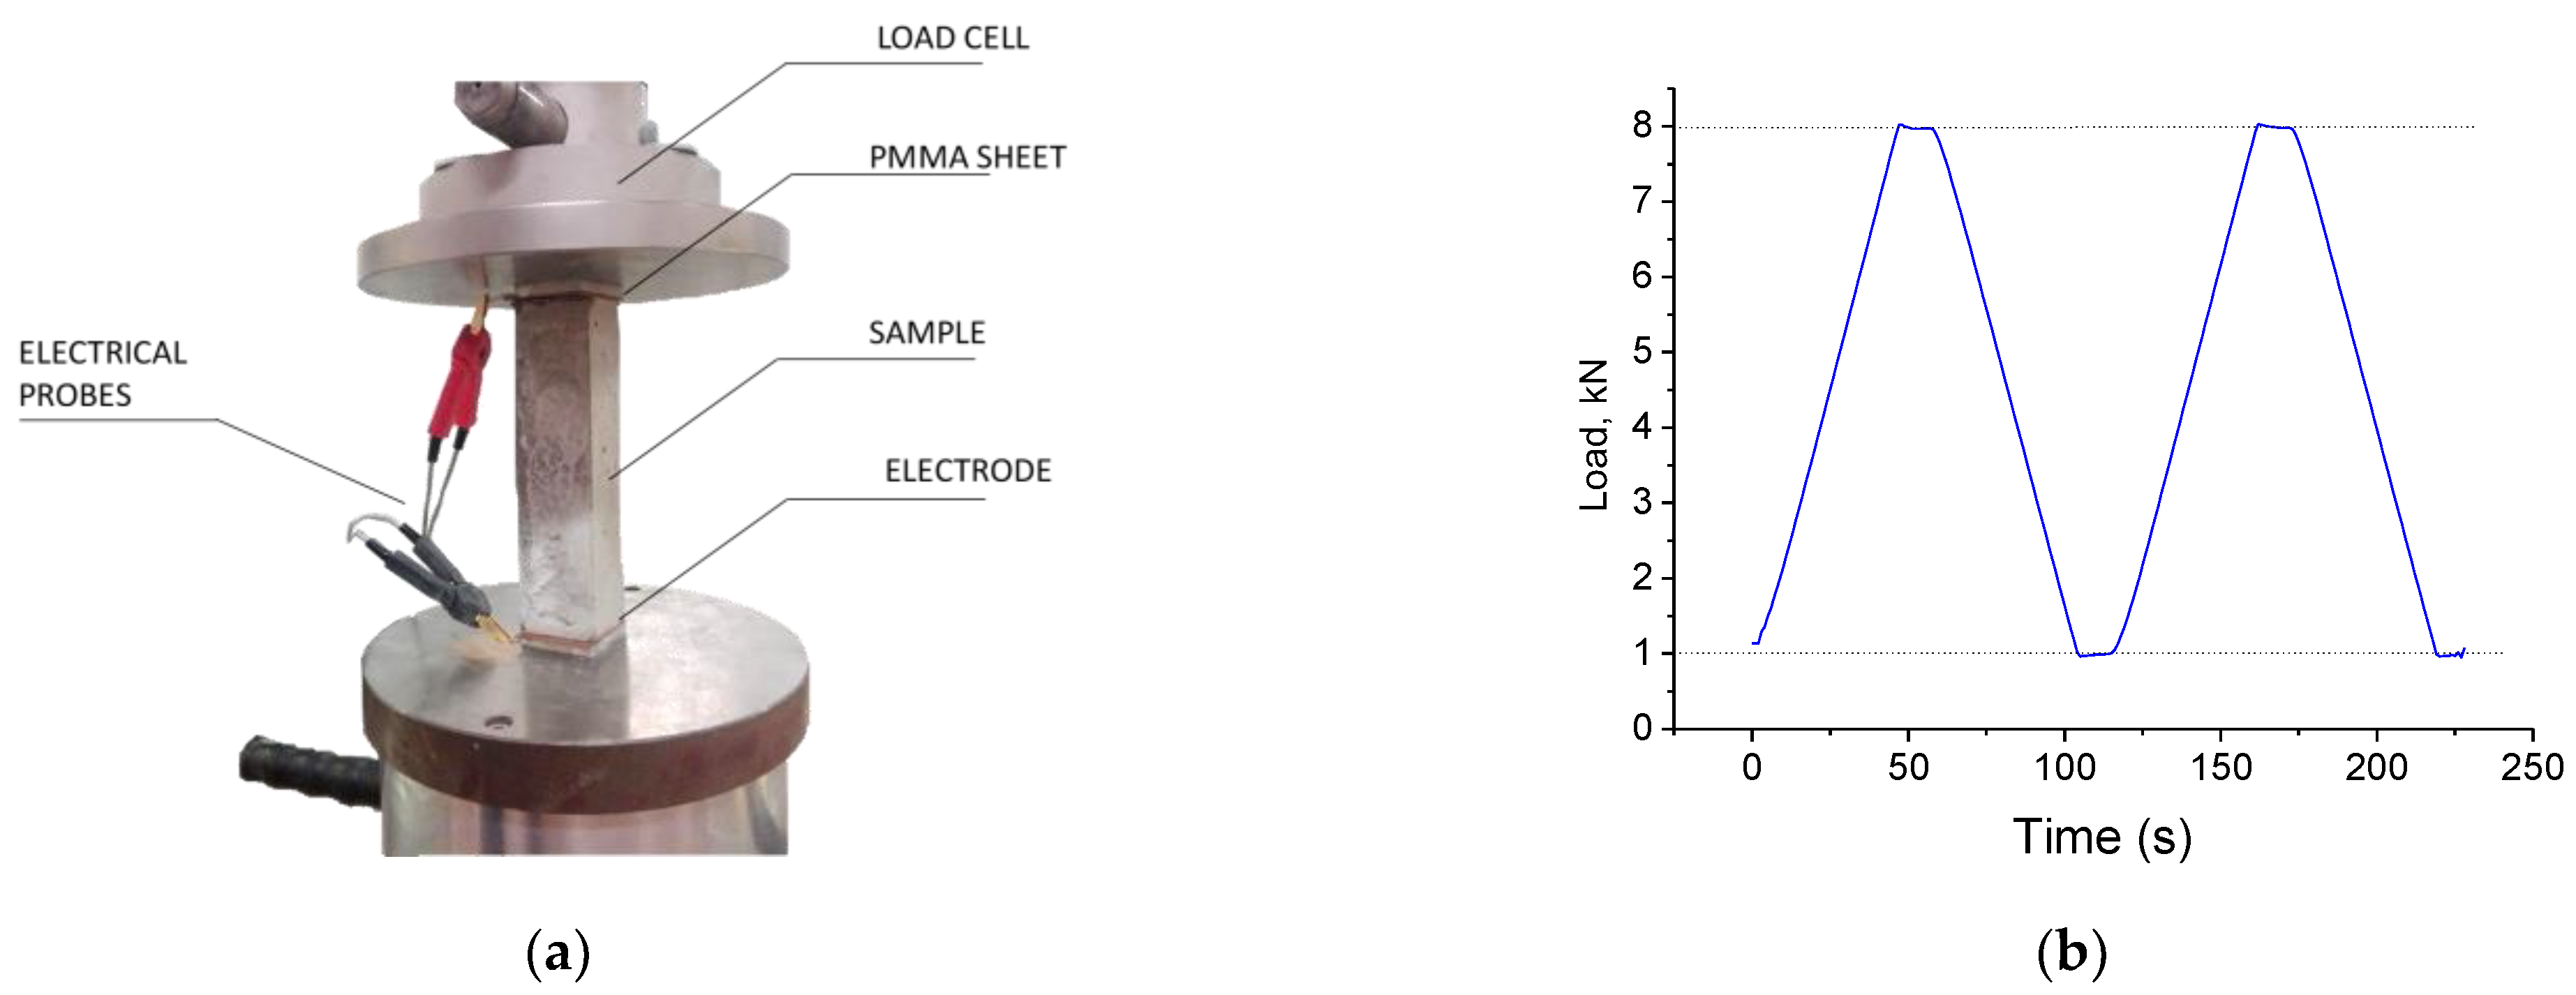
2.3. Stress-Sensing Capacity

To investigate the stress-sensing capacity of the composites, the variations of electrical impedance at 1 kHz were monitored under varying compressive loading at room temperature (24 °C). The compression load was applied to the concrete samples with a servo-controlled compression testing machine (model 3R) while the changes of electrical impedance at 1 kHz were monitored with the LCR-meter Hioki, model IM 3570, and a four-terminal probe model L2000. Figure 3a,b show the compressive test configuration and the loading procedure. Two thin square plates (40 × 40 × 3 mm3) made of polymethyl methacrylate avoided any possible leakage of current within the compression testing rig. The load was perpendicularly applied onto the square surfaces (4 × 4 cm2). The loading procedure (shown in Figure 3b) consisted of a preload of 1kN and two loading/unloading cycles, at a loading rate of 0.1 MPa·s−1 and an amplitude of 5 MPa. The load was maintained for 12 s in between the loading and unloading phases. Overall, the test lasted 230 s. The electrical impedance measurements started after the preload of 1 kN and were monitored at a sampling rate of 1 Hz. Comparable loading and monitoring protocols can be found elsewhere [6]. There is, however, no consensus in the existing literature on what concerns the number of cycles, loading amplitude, or loading rate. Herein, two cycles (two loading and two unloading phases) were considered adequate to evaluate the piezoresistive behavior of the samples. The gentle loading rate and maximum amplitude of the loading protocol (well below the expected ultimate compressive strength of mortars produced with CEM I 52.R) are meant to not produce significant damage to the samples.
The response of the cement-based sensors is commonly idealized as a linear function of the stress (or strain). Herein, the real (Z′) and imaginary (Z″) parts of the electrical impedance at 1 kHz were used to obtain the figures of merit
f = ( Z Z o ) / Z o σ
wherein the subscript “o” denotes the values obtained at a reference unloaded condition and σ is the compressive strength (considered to be negative). Moreover, the cosine similarity was used is used to quantify the linear resemblance between the impedance (Z) and load (L) during the loading test as
R = Z · L Z · L
R = Z · L Z · L
The values of R are equal to 1 or −1 for a perfect resemblance and 0 otherwise. To investigate the effect of varying sample temperature on the stress-sensing capacity, the stress-sensing experiment was repeated during the natural cooling-down of the samples, which were beforehand preconditioned at 50 °C and 35 °C. The measured electrical impedance (ZM) is expected to depend on load (ΔL) and temperature (ΔT) variations as
Z ( Δ L , Δ T ) = Z o + k L · Δ L + k T · Δ T + e r r o r
wherein the Zo corresponds to the electrical impedance at the reference temperature and unloaded condition, and the coefficients kL and kT express the change of impedance per unit of load (subscript L) and temperature (subscript T)—higher-order dependencies were not considered. Previous studies that investigated the piezoresistive behavior of cement-based sensors under simultaneous loading and temperature variations [46,47] used a compensation circuit to balance out the contribution of the temperature out of the electrical measurements. Herein, to untangle load and temperature effects in the measured electrical impedance, an additional set of measurements was conducted under the sole influence of temperature variations. To do so, the samples were again preconditioned at the same target temperatures (35 °C and 50 °C), mounted on the compression testing rig without application of compressive loading, and left to cool down while monitoring the electrical impedance variations. The test duration was evenly set to ~230 s (akin to the duration of the loading procedure). The objective of this step is to obtain the variations of electrical impedance (Z) produced during the cooling down of the samples, which were found to be well described by a linear relationship as
Z T = Z i + b · t
wherein Zi is the average electrical impedance at the beginning of the cool down (t = 0), and b expresses the rate of change of electrical impedance because of varying sample temperatures. Thereby, the effect of varying temperature on the electrical impedance during the loading experiment can be compensated out of the measured impedance (ZM) as
Z L = Z M Z T
The same test procedure was conducted at room temperature and repeated for the samples conditioned at 35 °C and 50 °C. The compensated impedance results (ZL) were then used to evaluate the stress-sensing factors f′, f″ and the similarity parameters R′ and R″. Temperature measurements were performed on selected samples using a temperature data logger (Testo 176 T4) and type K thermocouples to check the sample temperature during the cooling-down. It should be noted that a temperature gradient naturally develops as the samples cool down, therefore different results would be expected for different sample dimensions. In any event, the evaluation of the rate of change of electrical impedance because of varying temperature (b) is instrumental to untangling coupled loading and temperature effects from ZM.

3. Results and Discussion

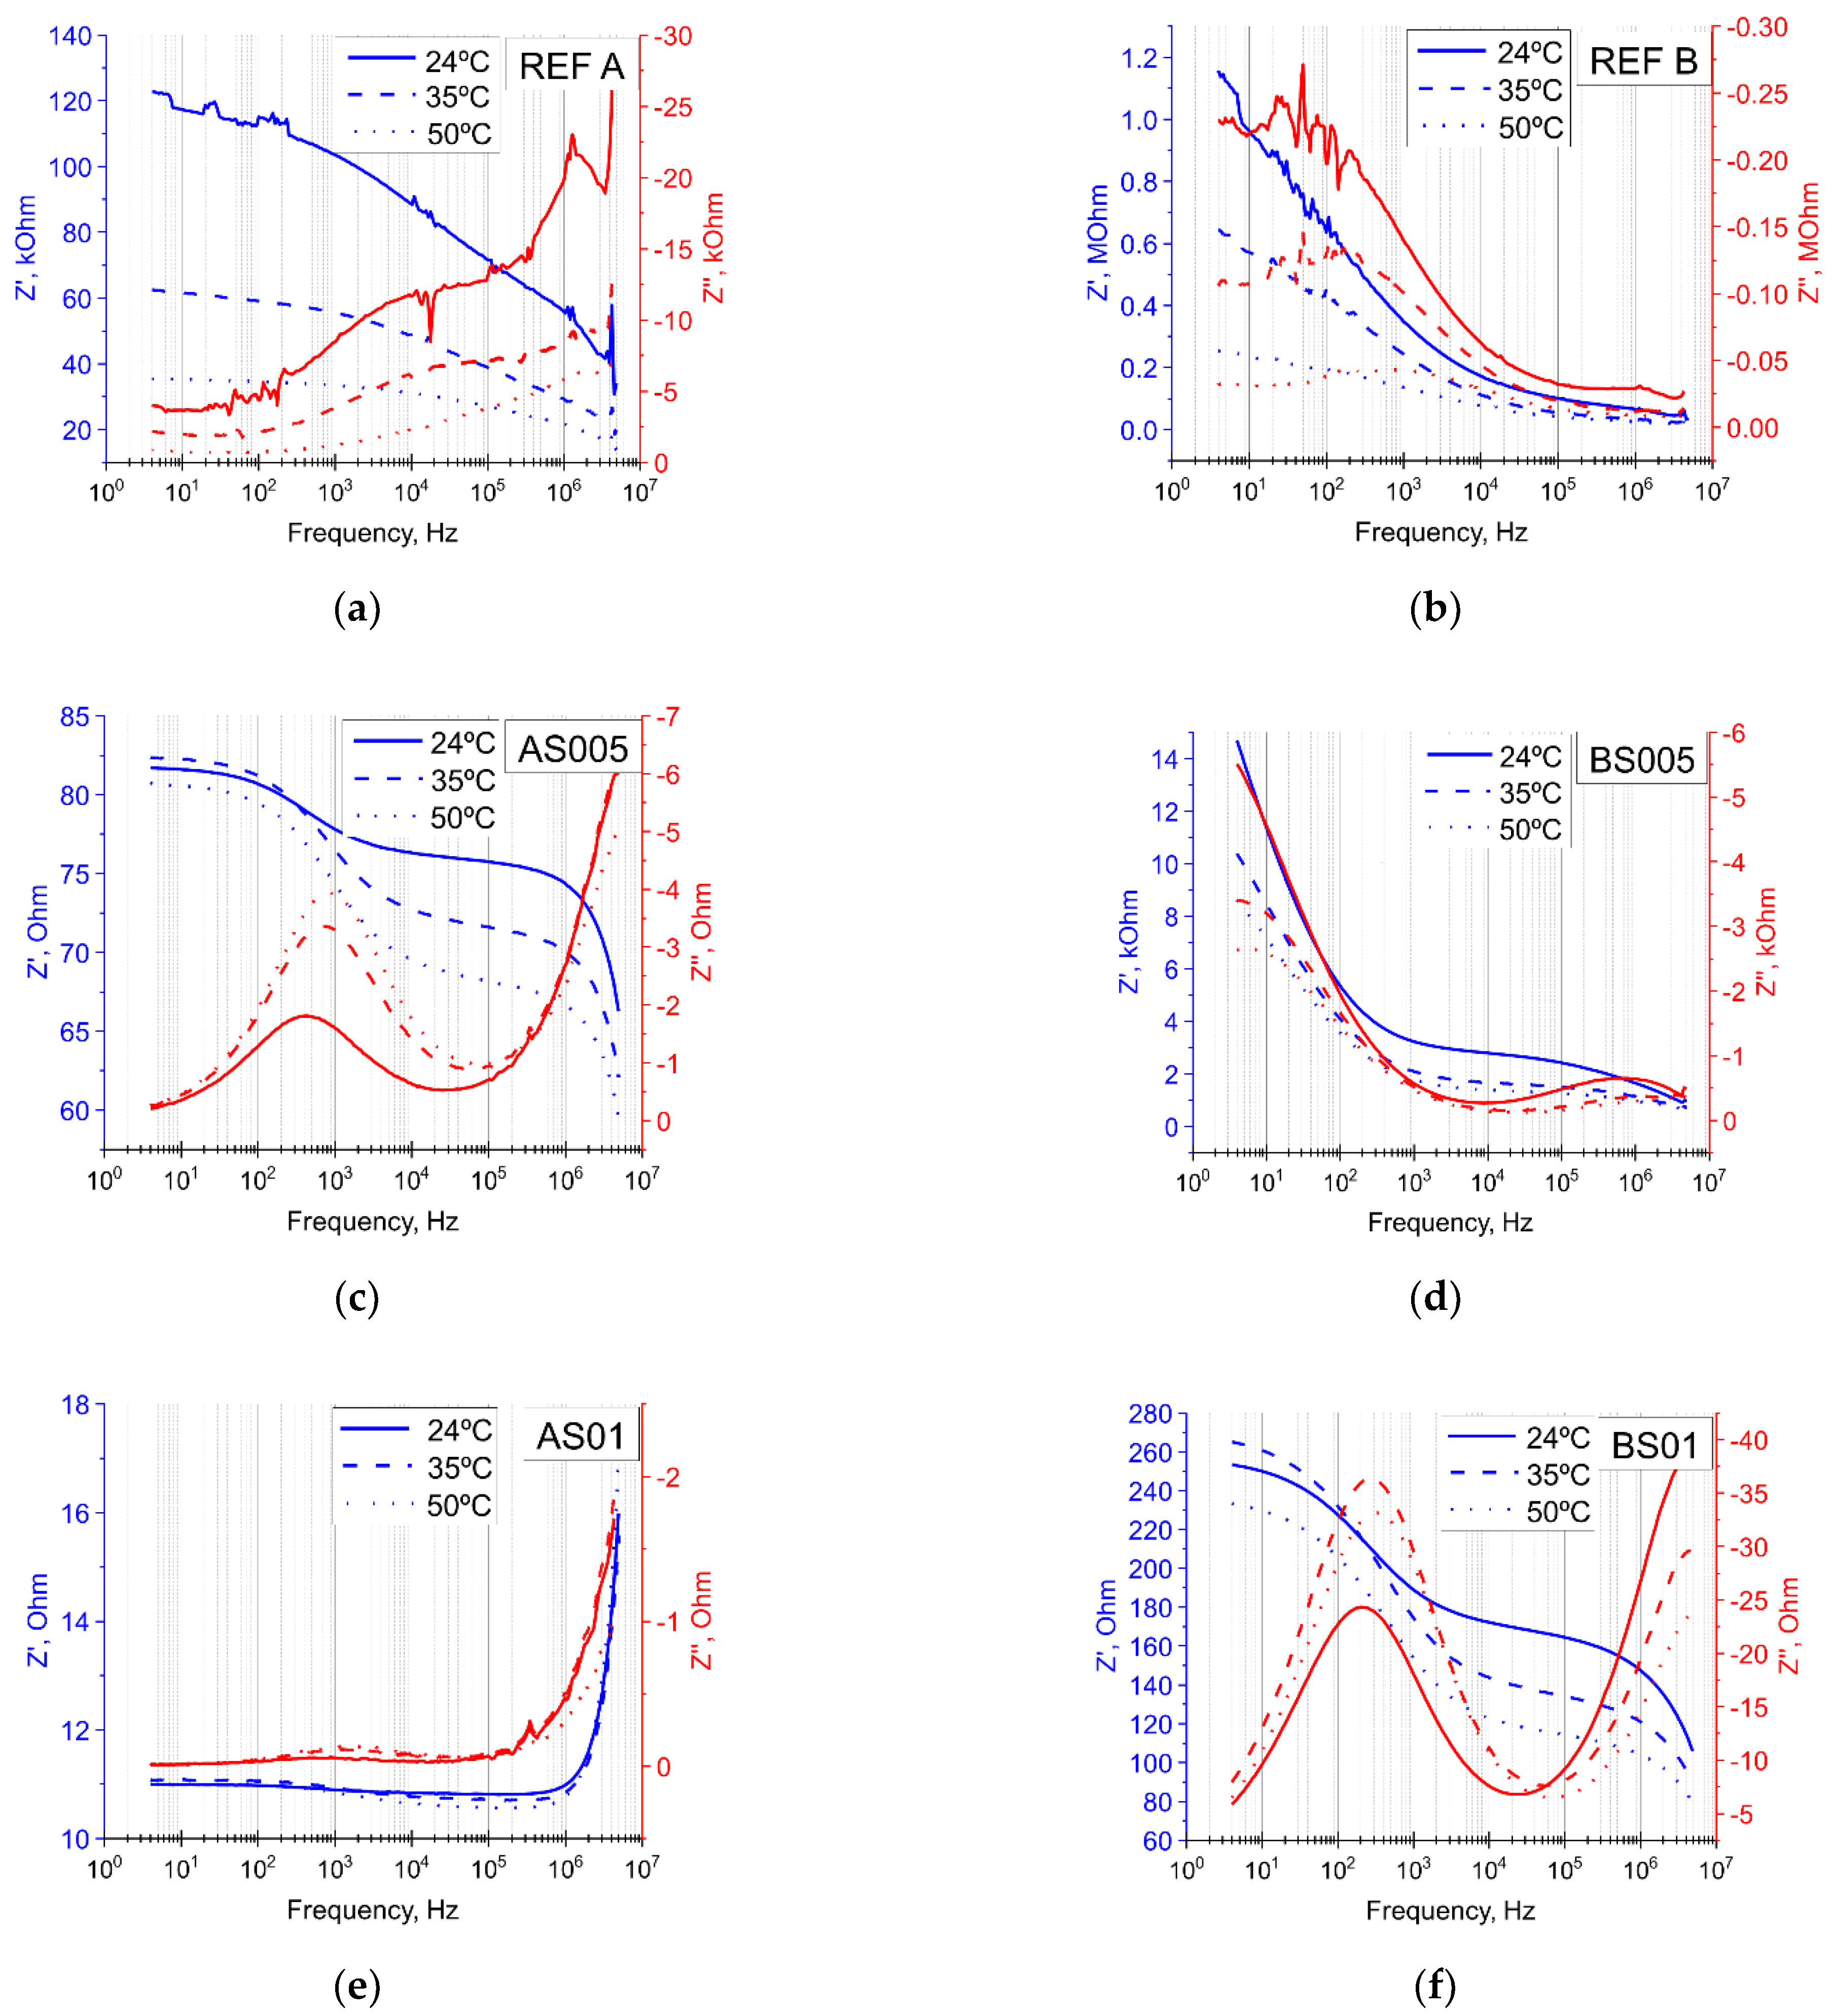
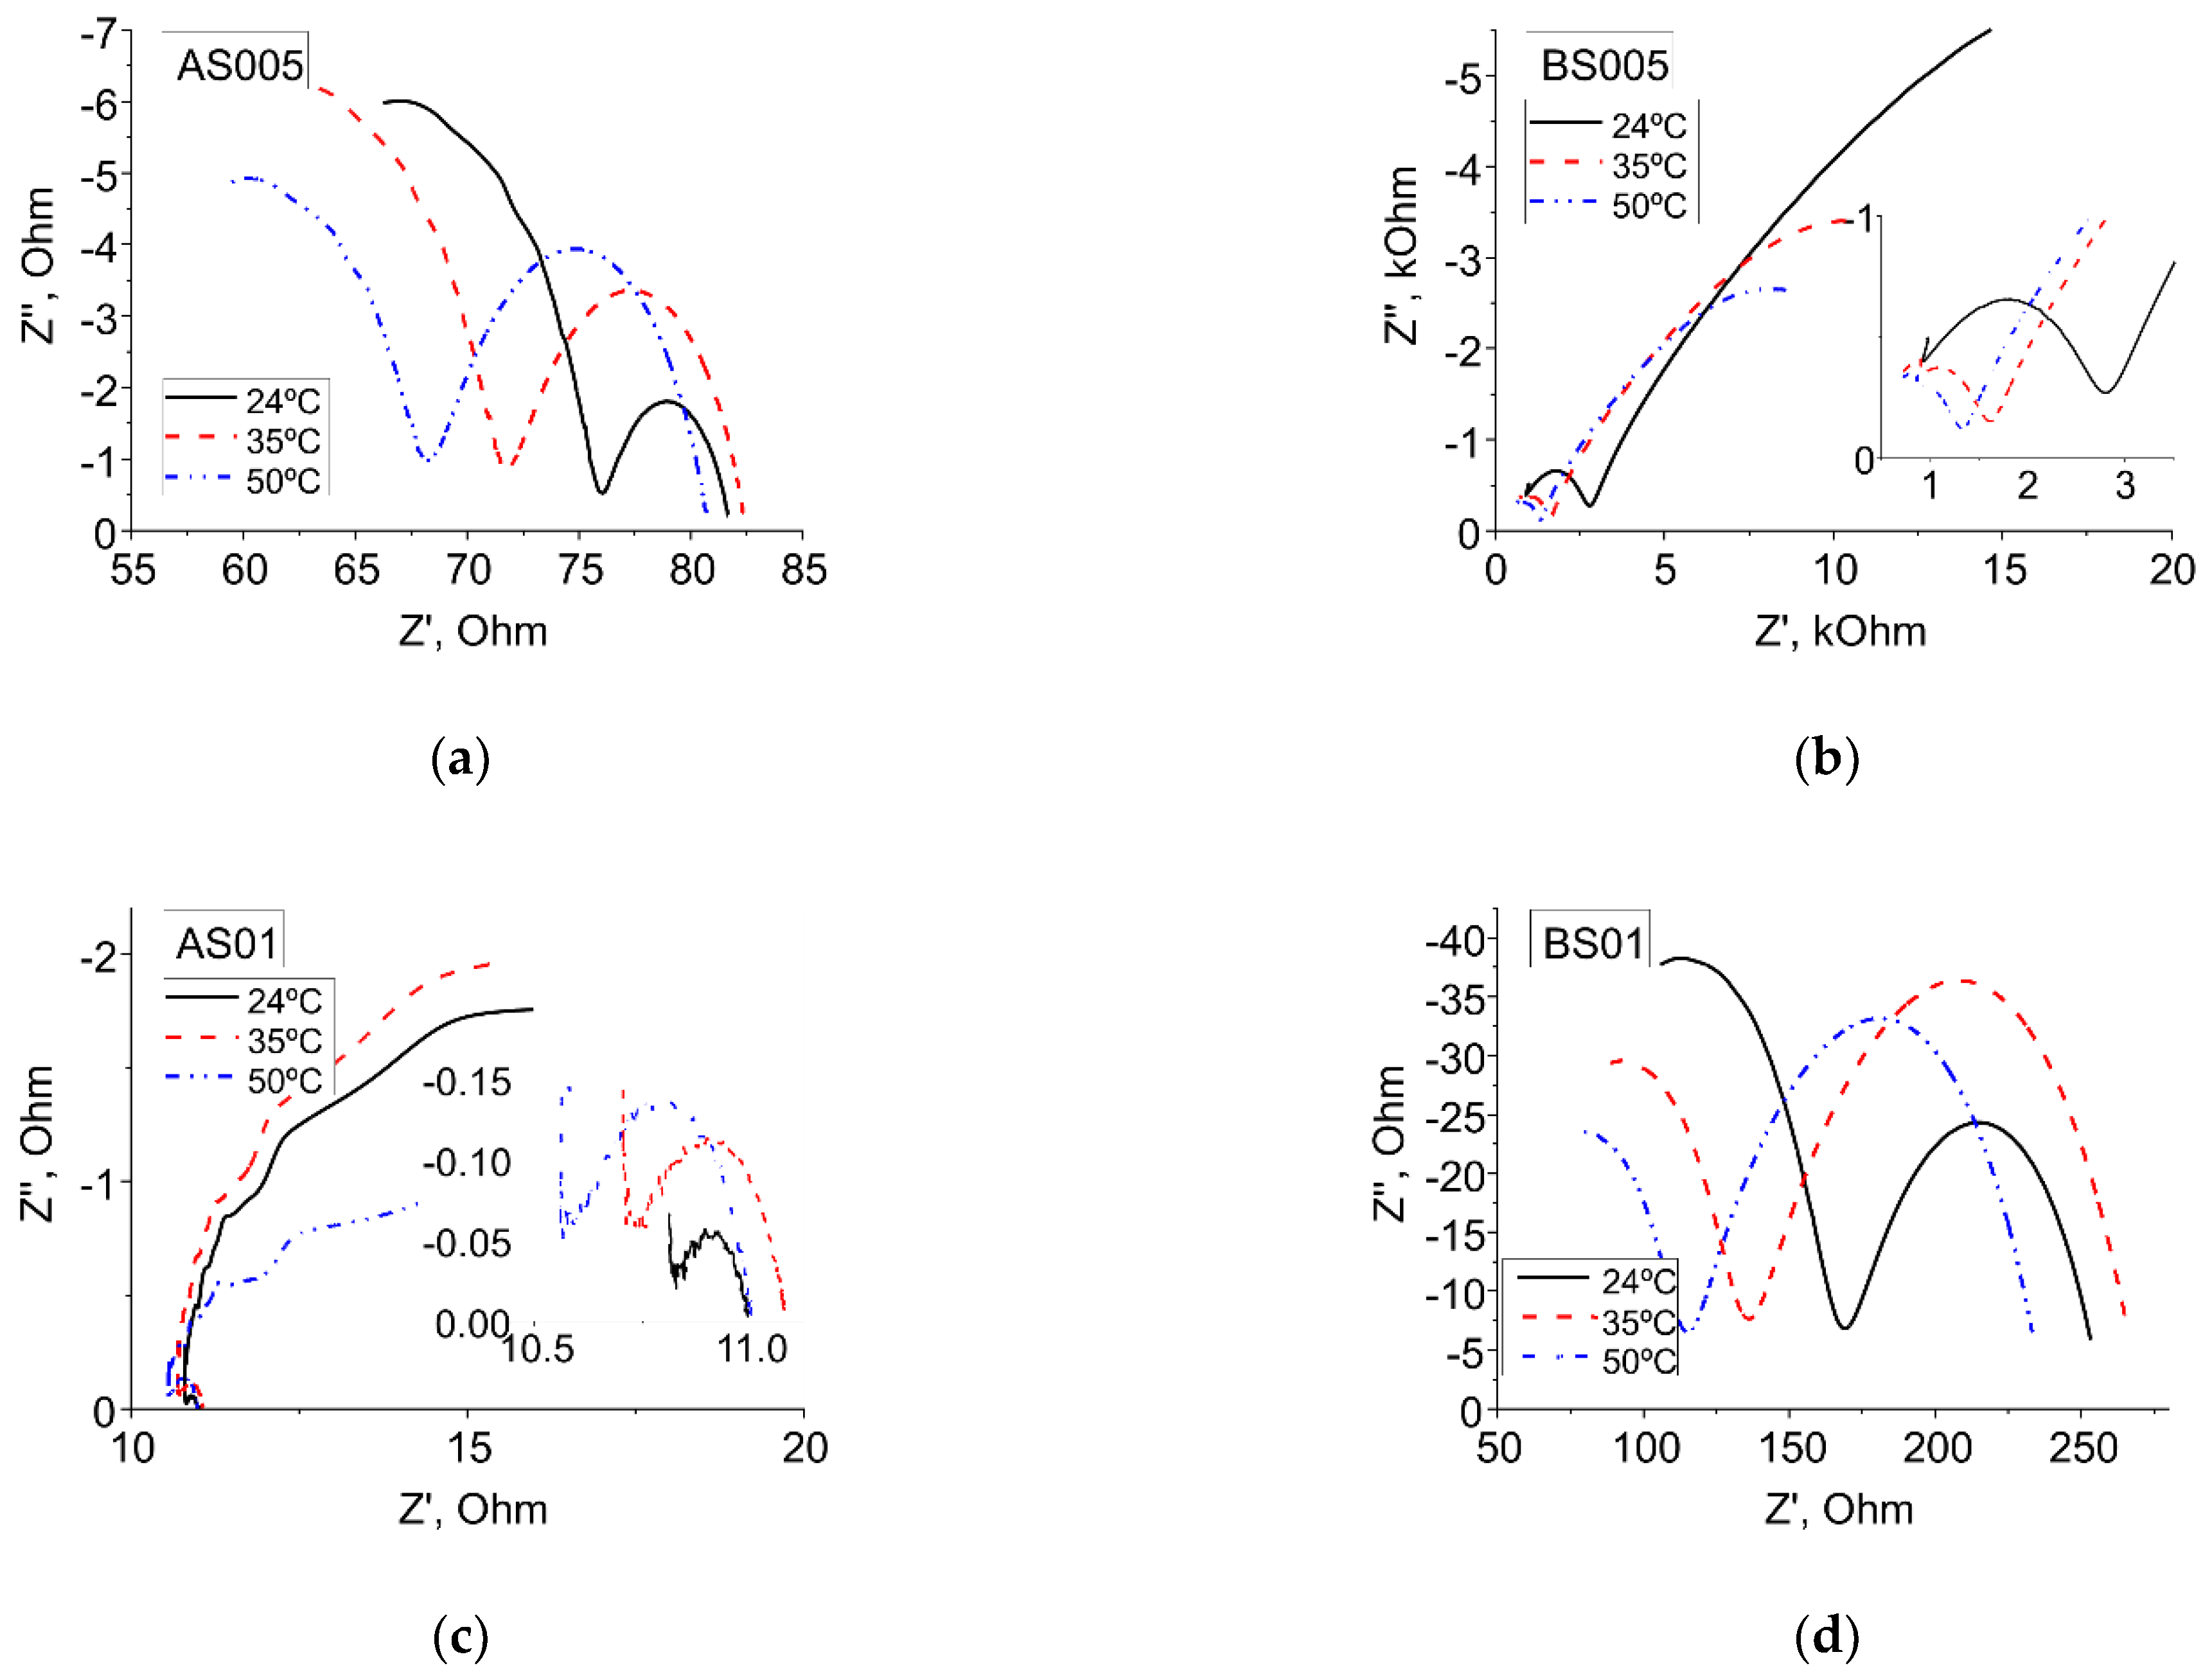
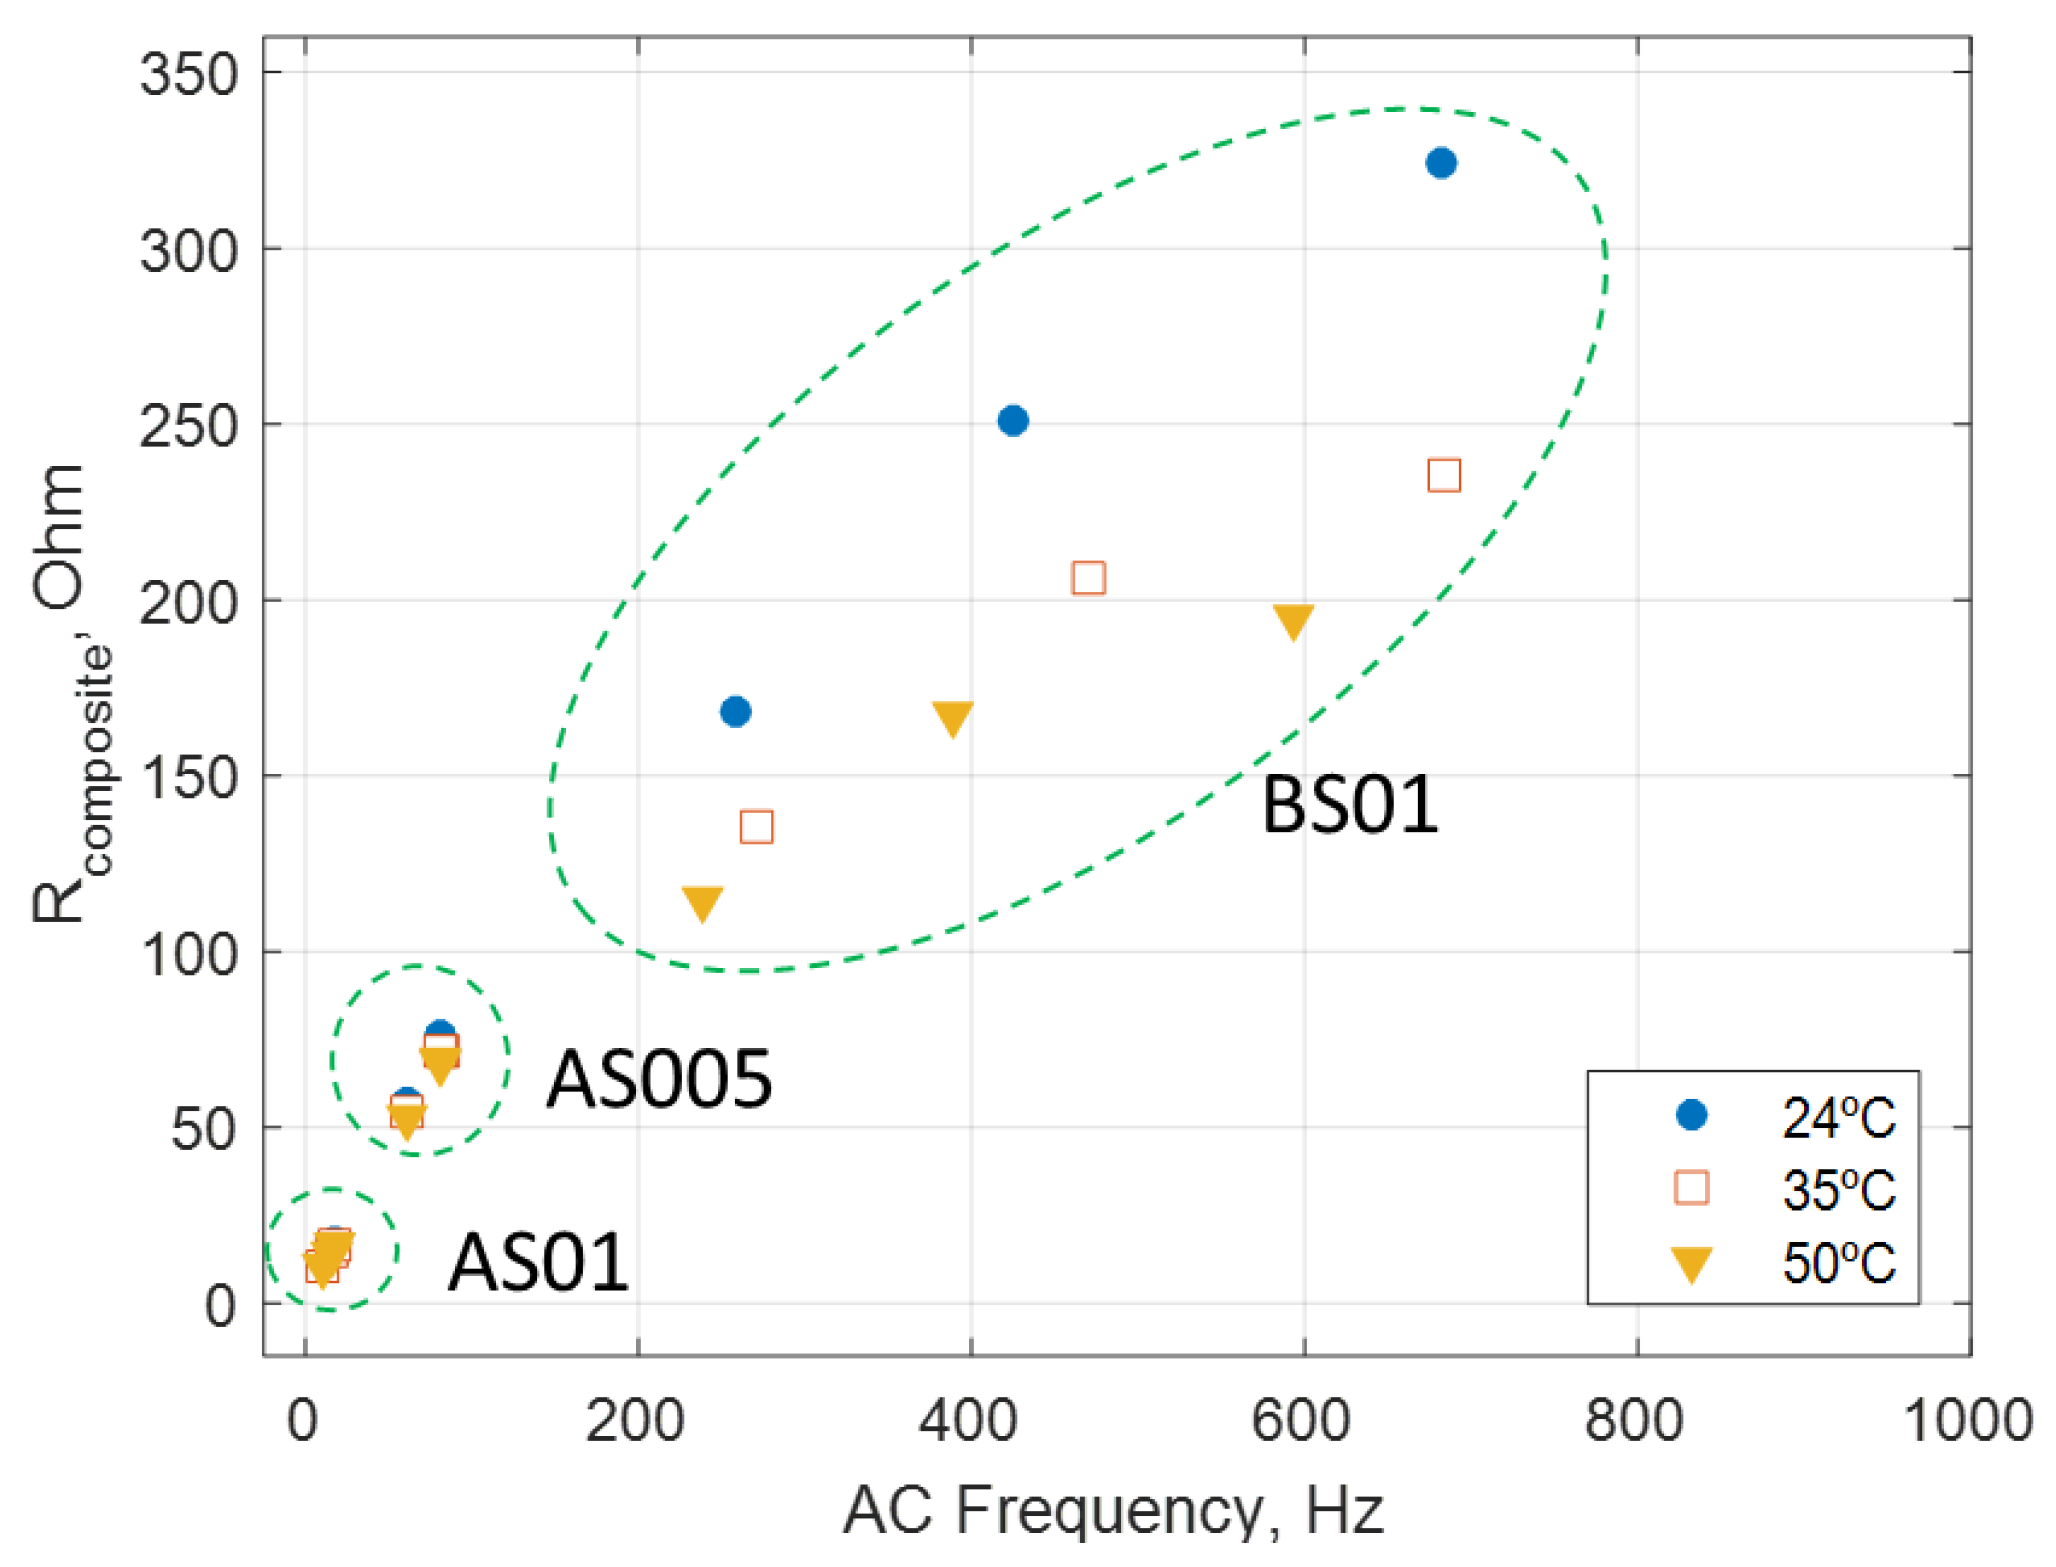
3.1. Electrical Impedance Spectroscopy Characterization

Figure 4a–f show the resistance and reactance plots for different mortars at different temperatures; one representative sample per type of mortar is shown. The values of resistance in plain mortars were in the order of 105–106 Ω (Figure 4a,b). These values are in good agreement with previous reported EIS data for plain mortars [63,64,65,66]. The incorporation of steel fibers into the mortar matrix led to a remarkable enhancement of electrical conduction. The resistance values found for mortars bearing steel fibers decreased to 101–102 Ω (Figure 4c–f). Interestingly, contrariwise to the rest of the reinforced mortars, the electrical resistance of the mortar AS01 remained virtually constant between 4 Hz and ~1 MHz and exhibited a remarkable increase in the electrical resistance at higher frequencies (>1 MHz). The extraordinary results obtained for the AS01 suggest the generation of a skin effect for which the extent of current penetration into the material decreases with increasing AC frequency, hence, leading to an apparent increase in resistance. This effect was also reported in electrically conductive composites in other studies [67,68] for the highest filler volume fractions investigated therein.
Figure 5a–d show the corresponding Nyquist plots for the reinforced mortars. The results confirmed that the single material arc typically observed for plain mortars coalesced into the formation of several arcs, which is a common feature of electrically conductive reinforced cement-based composites [52,60]. The formation of an oxide layer at the fiber–matrix interface of steel fibers is considered to be responsible for the dual-cusp behavior [52,53,60,61,69]. This contention is also reasonable for stainless-steel fibers considering the high pH environment expected for Portland cement mortar (pH~13). The high-impedance oxide layer acts as an insulator at low AC frequencies and as a conductor at higher ones, leading to the formation of several arcs [61]. The AC frequencies below which this transition occurs (indicated by the cusp value, Rcomposite) are commonly found below ~1 kHz [61,70].
Table 2 summarizes the equivalent circuit parameter results and the resulting AC frequency and composite resistance (Rcomposite) pair obtained for every sample and at different temperatures. The equivalent circuit results further substantiated that the electrical response considerably varied among the different composites. For identical fiber volume fractions, the resistance values of the mortar series A (with higher aggregate content) were consistently lower than mortar series B. Moreover, the mortars series B considerably exhibited larger material arcs than series A and the cusp value (Rcomposite) was consistently formed at higher AC frequencies. This result juxtaposes previous studies, which concluded that the incorporation of aggregate impairs electrical conduction [42,71]. When electrically conductive phases are incorporated into the composite, the transfer of charge is primarily governed by the conductive phases and the aggregate is rather acting as an insulating phase. However, in other instances, the incorporation of aggregates resulted in an improvement in the electrical conduction of cement-based sensors [72]. According to the results of previous studies [42,71,72], possible factors leading to such discrepancies could be attributed to the aggregate nature, sieve size distribution, or even the eventual use of adjuvants [65,66], which may ultimately affect the resulting pore texture and so either enhance or impair the electrical conduction. Similar variations of electrical impedance spectra of carbon and steel fiber-reinforced cement-based materials were also ascribed to fiber dispersion, geometry (aspect ratio), fiber orientation, or volume fraction [55,61]. Herein, the precise causes leading to such differing results on the EIS data among the different mortars are not fully understood and deserve further study.
In any event, regardless of the mortar composition, the AC frequency at which the cusp value was formed consistently decreased with the value of composite resistance. Moreover, the electrical conduction was enhanced and so the cusp values (composite resistance) decreased and were consistently produced at higher AC frequencies. Figure 6 shows the relationship between composite resistance and AC frequency for mortars AS01, AS005, and BS01. These results are in good agreement with existing literature which also reported the formation of the composite cusp at frequencies below 1 kHz [52], [53]. The cusp values of mortar BS005 were far more scattered (see Table 2), which was also a sign of their inferior percolation. The electrical properties of the plain mortars exhibited a strong dependence on the sample temperature over the entire frequency range [73,74]. In contrast, the reinforced mortars exhibited moderated variations of the electrical properties with varying sample temperatures and the extent of such variations decreased as the electrical conduction was enhanced by the incorporation of metallic fibers. These results are also in good agreement with previous studies, which reported an enhancement of the electrical conduction with increasing sample temperature, and likewise, the composites with worse electrical conduction exhibited more prominent dependences on sample temperature [43,44,70].

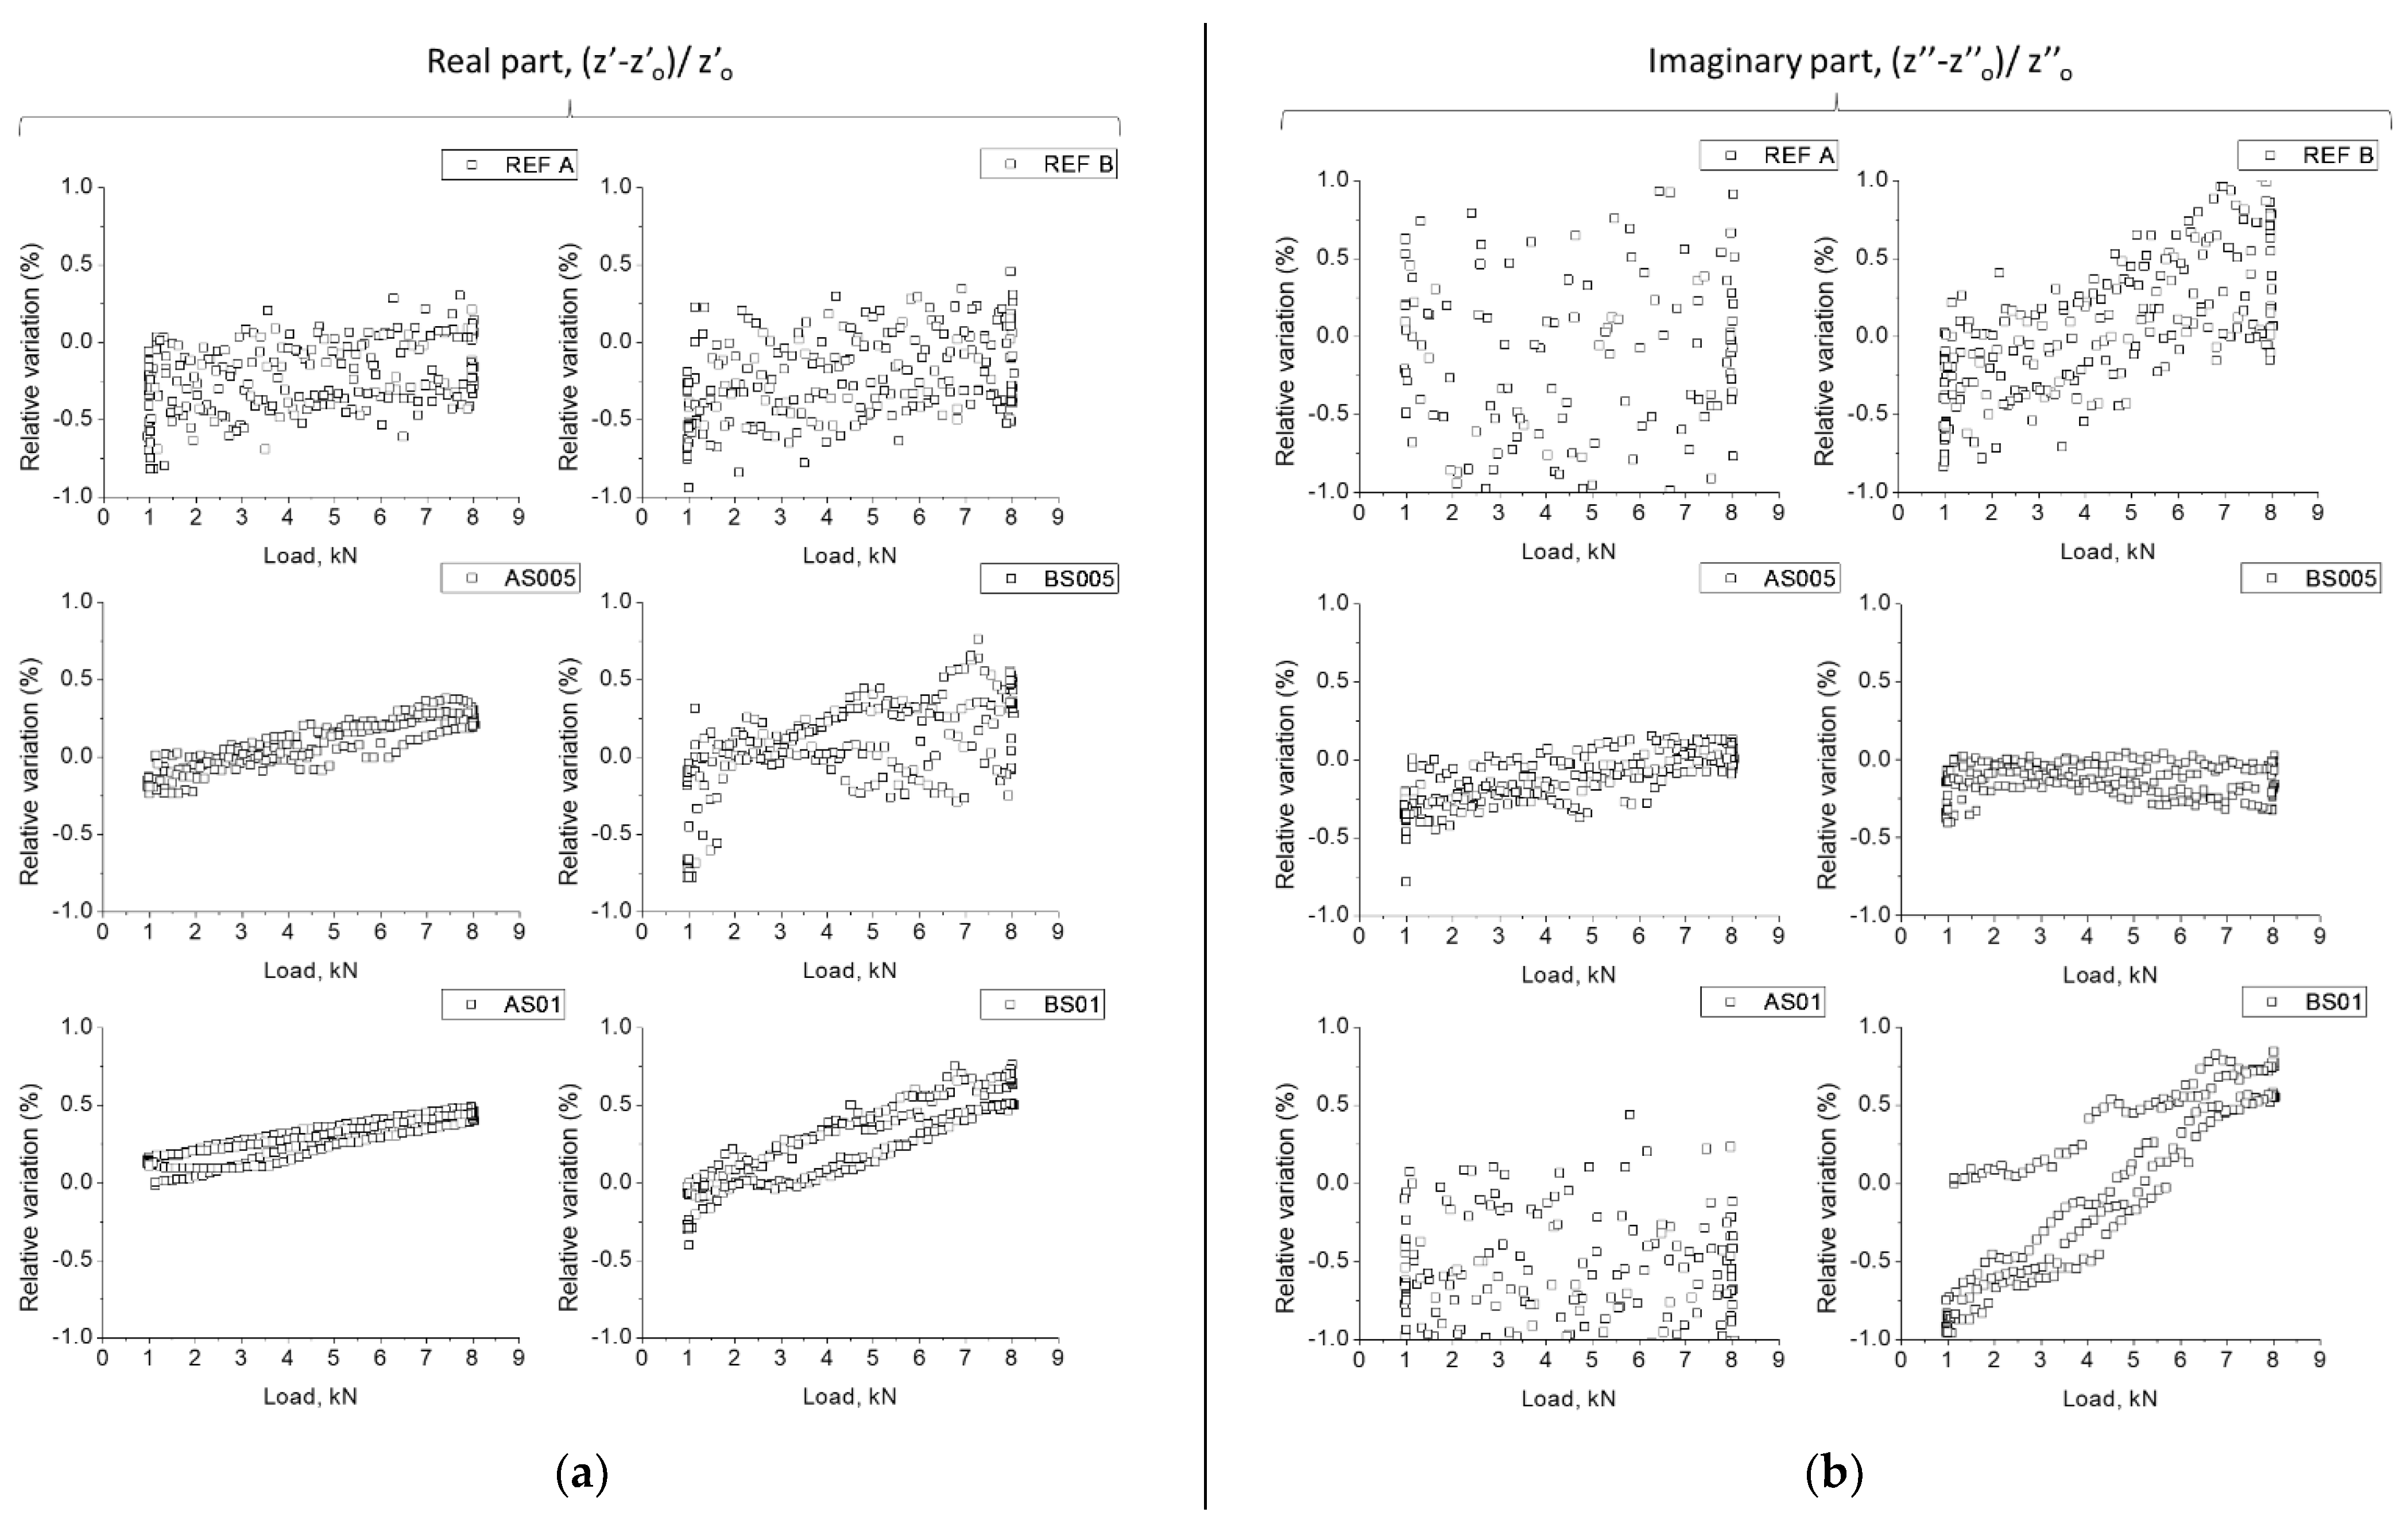
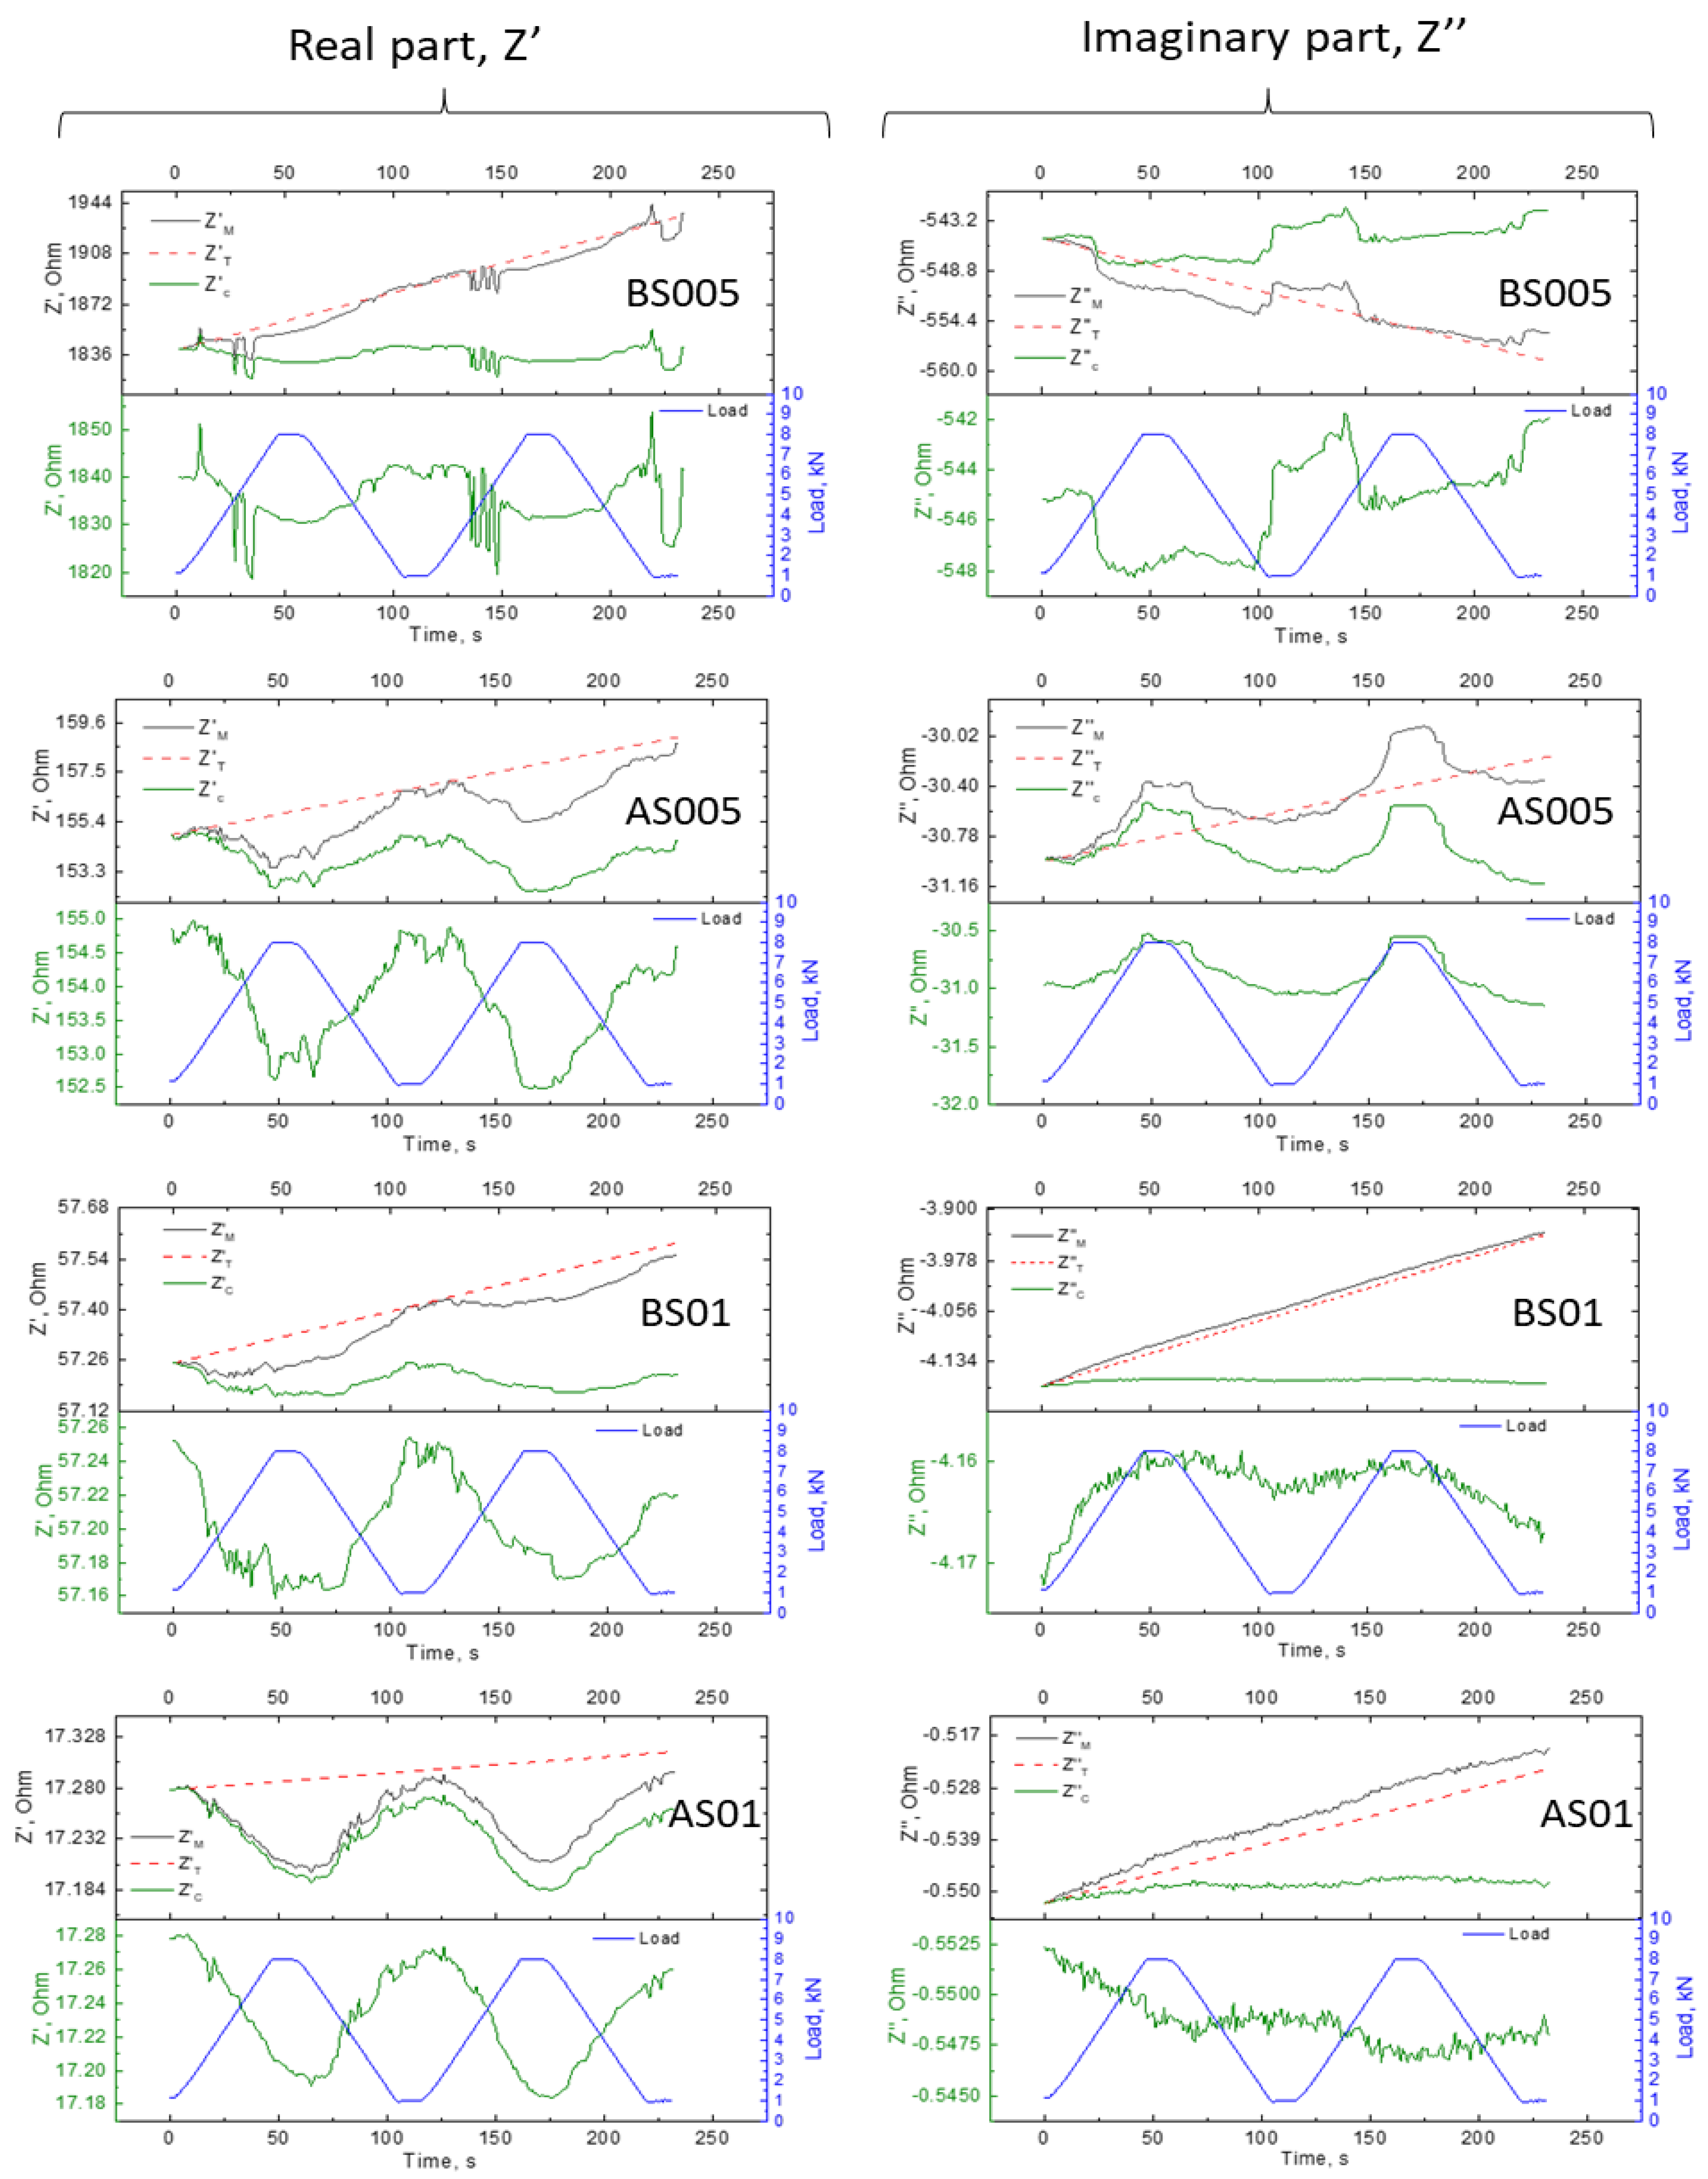
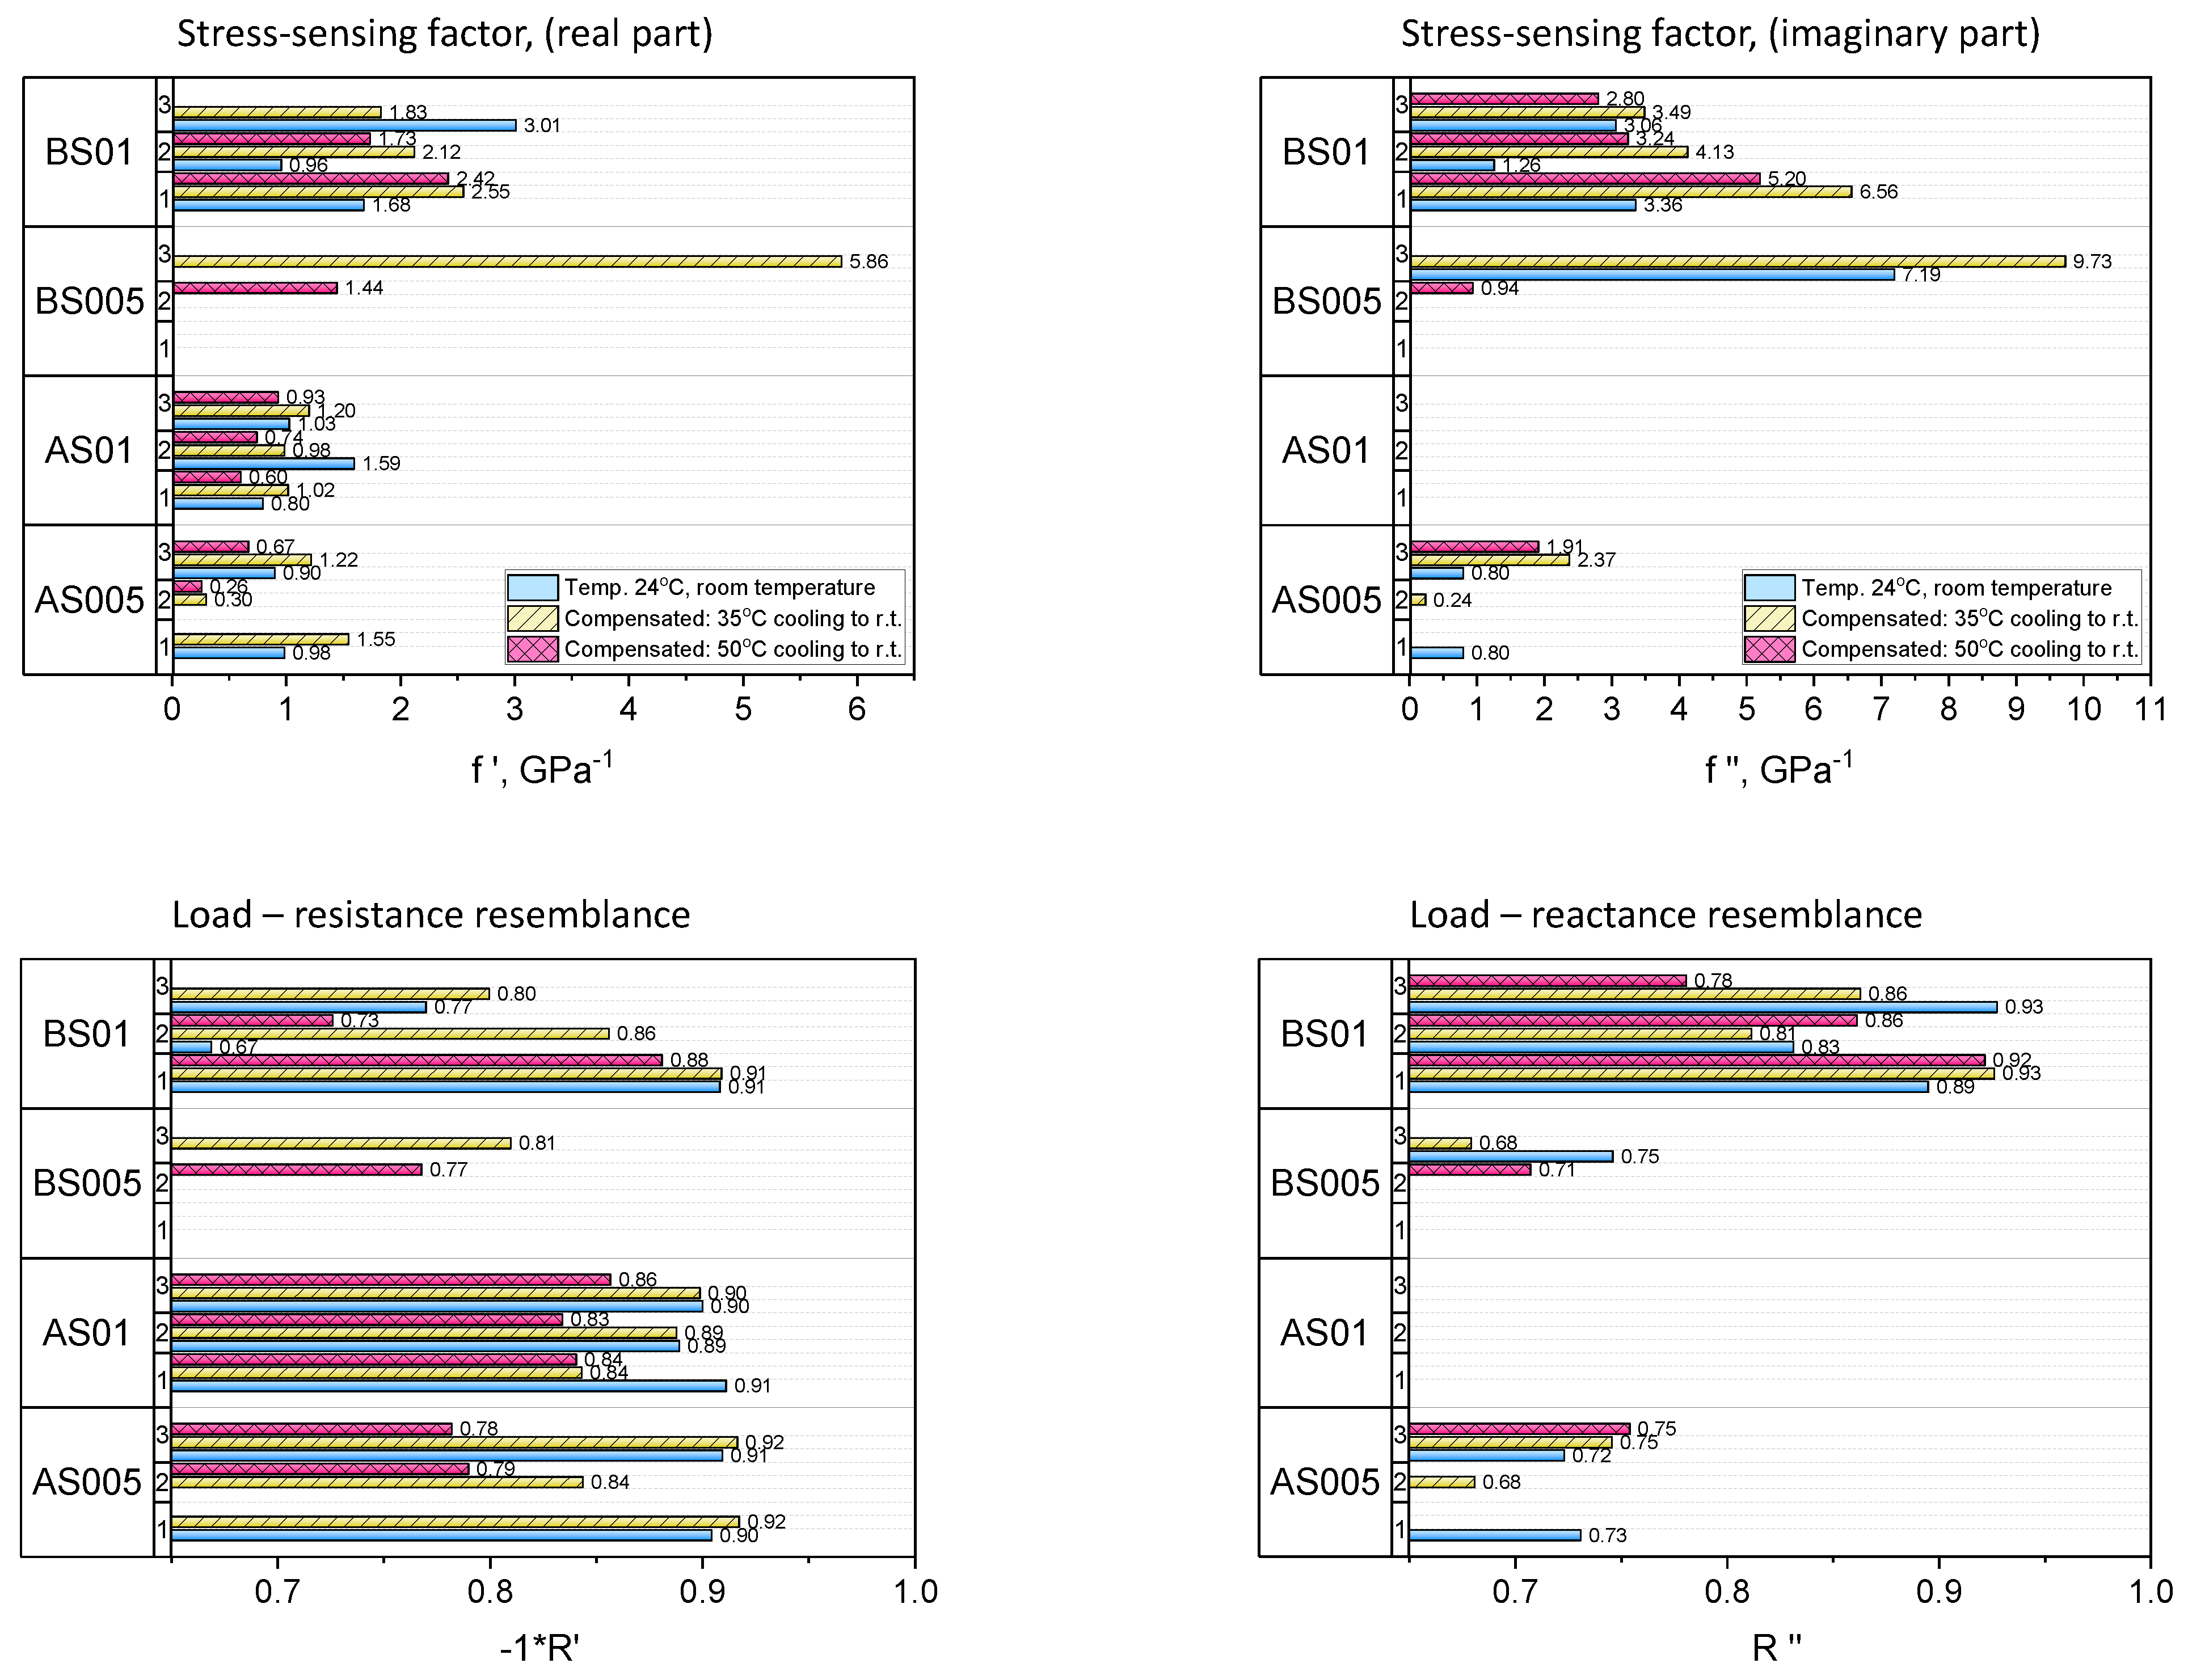
3.2. Stress-Sensing Capacity and Influence of Varying Sample Temperature

Figure 7a,b show the variations of resistance (Z′) and reactance (Z″) as a function of load obtained at room temperature (one representative sample per type of composite). The results show that plain mortars (REF-A and REF-B) were practically insensitive to the compressive loading since the variations of either electrical property were poorly correlated to the carrying load and, in general, the results were remarkably scattered. Interestingly, the reactance values of the mortar REF-B (with less aggregate content) exhibited better sensitivity to load than the REF-A. Indeed, this side result is the effect of the capacitance-based sensitivity of cement paste [75] and the incorporation of aggregate appears to inhibit such a sensing method. Still, inferring the carrying load from electrical measurements seems not feasible for plain mortars. Moreover, later it is shown that the electrical properties of plain mortars (REF-A and REF-B) exhibit a strong dependence on sample temperature. In contrast, the mortars incorporating stainless-steel fibers exhibited less scattered data and, in general, enhanced sensitivity to stress. Increasing compressive load resulted in a linear decrease in electrical resistance and reactance. The mechanisms leading to the piezoresistive behavior in electrically conductive cement-based composites are attributed to the variation of the contact resistance and distance between the dispersed conductive phase [5,76]. A decrease in the distance between fibers upon longitudinal compressive strain deformation is expected to improve the transmission of electrical current between adjacent fibers and may thus result in a reduction of the magnitude of the impedance of the mortar sample. Overall, the results show that higher correlations were obtained for the samples that exhibited enhanced conductive properties. The best results were obtained for the mortar AS01, whose variations of electrical resistance seemingly retraced the load data. All three samples consistently exhibited similar behavior. This was less blatant for the reactance, which was not sensitive to the load. The results also showed better linearity for percolated mortars.
Figure 8a shows typical variations of resistance and reactance at 1 kHz obtained for one mortar sample AS005 preconditioned at 50 °C as it cooled down at room temperature. Figure 8b shows the corresponding temperature measurements for the same sample as per measured by the thermocouples affixed to the sample surface. The results show that the resistance and reactance values linearly increased as the temperature linearly decreased. Similar trends were found for the rest of the mortars. For reference, we did not find meaningful differences between the cooling rates measured through thermocouples in different mortars (on average~−0.012 °C·s−1). Overall, the results shown in Figure 8a,b underpin the use of Equations (7) and (8) to compensate for the influence of the temperature on the electrical impedance temperature variations.
Table 3 summarizes the obtained values of b′ and b″ (measured in Ohm/s) for every mortar sample. The resistance and reactance varied at very different rates (b′ and b″) during the cooling down. Again, the results suggest that higher variations of electrical resistance and reactance upon varying sample temperatures were produced for plain mortars and, in general, the mortars with better electrical conduction properties exhibited a reduced dependence on temperature variations. Of special interest are the results obtained for the mortar AS01, for which only the reactance values exhibited meaningful variations during the cool-down. Therefore, the estimation of the parameters b′ and b″ are instrumental to detrend the impedance measurements during coupled load and temperature variations and obtaining a reliable estimation of the stress-sensing factors f′ and f″, as described in Section 2.3.
Figure 9 shows the monitoring of the electrical impedance at 1 kHz during coupled compression cyclic loading and varying temperature for representative samples of mortars BS005, BS01, AS005, and AS01 preheated at 50 °C. These results exemplify the compensation of the temperature variations out of those produced by compressive loading. The results show that the variations of the electrical properties are largely governed by the variations of temperature for mortars AS005, BS005, and BS01. The variations of the impedance of the mortar BS005 show a poor resemblance to the loading data. The need for such compensation is, however, less apparent for the mortar AS01, as could be also deduced from the comparatively lower values of the parameter b′, summarized in Table 3.
Finally, Figure 10 summarizes the stress-sensing factors f′ and f″ and cosine similarity metrics (cos(θ)′ and cos(θ)″) obtained after compensating for the effect of the temperature variation on the electrical impedance measurements of every sample. No clear relationship between stress-sensing factors and temperature was found. The mortar BS01 presented the highest sensitivity to stress. Reactance and resistance were similarly sensitive to varying stress. The mortar AS01 exhibited the best performance regarding sample-to-sample variation and test repeatability. The stress-sensing factor was ~1 GPa−1 on average (standard deviation of 0.28 GPa−1). For reference, the compressive elastic modulus measured on spare samples of the same mortar mixes were 29.6 GPa and 44.4 GPa for mortars with 40% and 60% volume fractions. Therefore, the estimated gauge factor (that is, the figure of merit relating the relative variations of resistance to compressive strain) was comparable to previously reported values for other piezoresistive cement-based sensors [28,45]. A compendium of gauge factors reported in the literature can be found in [6]. The reactance values of the AS01 mortar were not sensitive to the variations of load, yet they did exhibit meaningful variations with decreasing temperature (see Table 3). Inversely, the resistance values were sensitive to stress and insensitive to temperature variations. This divergent sensitivity to either stress or temperature suggests the possibility of using the same composite as temperature and stress sensor by reading reactance and resistance variations (AC measurements).

4. Conclusions

This study investigates the electrical properties and stress-sensing capacity of different mortars reinforced with short stainless-steel fibers under varying temperature conditions. Different mortars were produced by varying aggregate and fiber volume fractions. The obtained results demonstrate that the incorporation of steel fibers into the mortar composition led to an extraordinary enhancement of the electrical conduction and a considerable alteration of the electrical impedance spectrum. For equal steel fiber volume fractions, an increase in aggregate content resulted in higher electrical conductivity. Contrariwise to the rest of the mortars, the electric resistance of the mortar AS01 exhibited an increase in resistance at AC frequencies above 1 MHz.
All reinforced mortars exhibited the dual-arc behavior on a Nyquist representation of the EIS data. The cusp value attributed to the composite resistance consistently decreased with increasing temperature and, in general, the frequency at which the cusp value was formed also increased. In general, the temperature dependence of the electrical features derived from the analysis of EIS data was more prominent for the mortars with worse electrical conduction properties. The same can be concluded from the monitoring of the preheated samples (at 35 °C and 50 °C) during the cool-down to room temperature, through the measurement of the impedance at a fixed AC frequency (herein at 1 kHz). Again, the mortars with superior electrical conduction properties manifested lower variations of impedance with varying sample temperatures. As the degree of fiber percolation increases, the transfer of charge is mainly produced by electronic mechanisms, whilst ionic conduction is the dominating mechanism in plain mortars. Accordingly, the temperature dependence of the electrical properties is the reflection of the dominating mechanisms of electrical conduction in the material. These results are in good agreement with previous studies, which reported an enhancement of the electrical conduction with increasing sample temperature and likewise, the composites with better electrical performances inhibited the dependence on sample temperature.
The stress-sensing properties were evaluated on all mortars through impedance measurements at 1 kHz. Moreover, the stress-sensing testing protocol was repeated under varying temperature conditions. For this latter purpose, the samples were preheated and left to cool down to room temperature while simultaneously subjected to compressive loading/unloading cycles. The temperature variations were successfully compensated out of impedance measurements to assess the stress-sensing ability of the composites. The mortar with the highest fiber volume fraction (0.1%) and lower aggregate content exhibited the highest sensitivity to stress. Reactance and resistance were similarly sensitive to varying stress. The mortar with the highest fiber volume fraction (0.1%) and higher aggregate content (volume fraction of 60%) exhibited the best performance regarding sample-to-sample variation and test repeatability. In contrast, the reactance values were not sensitive to the variations of load, yet they did exhibit meaningful variations with decreasing temperature. Inversely, the resistance values were sensitive to stress and insensitive to temperature variations. This different sensitivity to either stress or temperature suggests the possibility of using the same composite for temperature and stress. One may also think of temperature self-compensation of the piezoresistive sensor by using AC measurements.

Author Contributions

Conceptualization, F.D.; methodology, F.D.; software, J.N.E. and F.D.; validation, F.D., J.N.E. and C.P.; formal analysis, F.D. and J.N.E.; investigation, F.D. and J.N.E.; resources, F.D.; data curation, F.D. and J.N.E.; writing—original draft preparation, J.N.E.; writing—review and editing, F.D., J.N.E. and C.P.; visualization, F.D., J.N.E. and C.P.; supervision, F.D.; project administration, F.D. and C.P.; funding acquisition, F.D. and C.P. All authors have read and agreed to the published version of the manuscript.

Funding

The project leading to this publication has received funding from the Excellence Initiative of Aix-Marseille University, A*MIDEX, Labex MEC.

Data Availability Statement

The data presented in this study are available on request from the corresponding author.

Acknowledgments

The authors thank Hamza Allam (Université Paris-Est Créteil) and Francisco Javier Baeza (Universitat d’Alacant) for valuable discussions during the course of this study.

Conflicts of Interest

The authors declare no conflict of interest.

References

  1. Chen, P.W.; Chung, D.D.L. Concrete as a new strain stress sensor. Compos. Part B Eng. 1996, 27, 11–23. [Google Scholar] [CrossRef]
  2. Carmona, F.; Canet, R.; Delhaes, P. Piezoresistivity of heterogeneous solids. J. Appl. Phys. 1987, 61, 2550–2557. [Google Scholar] [CrossRef]
  3. Banthia, N.; Djeridane, S.; Pigeon, M. Electrical resistivity of carbon and steel micro-fiber reinforced cements. Cem. Concr. Res. 1992, 22, 804–814. [Google Scholar] [CrossRef]
  4. Chen, P.-W.; Chung, D.D.L. Carbon fiber reinforced concrete for smart structures capable of non-destructive flaw detection. Smart Mater. Struct. 1993, 2, 22–30. [Google Scholar] [CrossRef]
  5. Chung, D.D.L. A critical review of piezoresistivity and its application in electrical-resistance-based strain sensing. J. Mater. Sci. 2020, 55, 15367–15396. [Google Scholar] [CrossRef]
  6. Dong, W.; Li, W.; Tao, Z.; Wang, K. Piezoresistive properties of cement-based sensors: Review and perspective. Constr. Build. Mater. 2019, 203, 146–163. [Google Scholar] [CrossRef]
  7. Han, B.; Wang, Y.; Dong, S.; Zhang, L.; Ding, S.; Yu, X.; Ou, J. Smart concretes and structures: A review. J. Intell. Mater. Syst. Struct. 2015, 26, 1303–1345. [Google Scholar] [CrossRef]
  8. Han, B.; Yu, X.; Ou, J. Self-Sensing Concrete in Smart Structures; Elsevier: Amsterdam, The Netherlands, 2014. [Google Scholar] [CrossRef]
  9. Downey, A.; D’Alessandro, A.; Baquera, M.; García-Macías, E.; Rolfes, D.; Ubertini, F.; Laflammea, S.; Castro-Triguero, R. Damage detection, localization and quantification in conductive smart concrete structures using a resistor mesh model. Eng. Struct. 2017, 148, 924–935. [Google Scholar] [CrossRef] [Green Version]
  10. Bontea, D.-M.; Chung, D.D.L.; Lee, G.C. Damage in carbon fiber-reinforced concrete, monitored by electrical resistance measurement. Cem. Concr. Res. 2000, 30, 651–659. [Google Scholar] [CrossRef]
  11. Hou, T.-C.; Lynch, J.P. Conductivity-based strain monitoring and damage characterization of fiber reinforced cementitious structural components. Proc. SPIE 2005, 5765, 419–429. [Google Scholar] [CrossRef]
  12. Peled, A.; Torrents, J.M.; Mason, T.O.; Shah, S.P.; Garboczi, E.J. Electrical impedance spectra to monitor damage during tensile loading of cement composites. ACI Mater. J. 2001, 98, 313–322. [Google Scholar] [CrossRef]
  13. Li, M.; Lin, V.W.J.; Lynch, J.P.; Li, V.C. Carbon Black Engineered Cementitious Composites—Mechanical and Electrical Characterization. In SP-292: Structural Health Monitoring Technologies; American Concrete Institute: Farmington Hills, MI, USA, 2013; Volume 292, pp. 59–73. [Google Scholar] [CrossRef]
  14. Gupta, S.; Gonzalez, J.G.; Loh, K.J. Self-sensing concrete enabled by nano-engineered cement-aggregate interfaces. Struct. Health Monit. 2017, 16, 309–323. [Google Scholar] [CrossRef] [Green Version]
  15. Downey, A.; D’Alessandro, A.; Ubertini, F.; Laflamme, S. Automated crack detection in conductive smart-concrete structures using a resistor mesh model. Meas. Sci. Technol. 2018, 29, 035107. [Google Scholar] [CrossRef] [Green Version]
  16. Laflamme, S.; D’Alessandro, A.; Castro-Triguero, R.; Downey, A.; Garcia-Macias, E.; Ubertini, F. Continuous and embedded solutions for SHM of concrete structures using changing electrical potential in self-sensing cement-based composites. In Nondestructive Characterization and Monitoring of Advanced Materials, Aerospace, and Civil Infrastructure; SPIE: Bellingham, WA, USA, 2017; Volume 101691G. [Google Scholar] [CrossRef] [Green Version]
  17. Konsta-Gdoutos, M.S.; Aza, C.A. Self sensing carbon nanotube (CNT) and nanofiber (CNF) cementitious composites for real time damage assessment in smart structures. Cem. Concr. Compos. 2014, 53, 162–169. [Google Scholar] [CrossRef]
  18. Han, B.; Yu, X.; Kwon, E. A self-sensing carbon nanotube/cement composite for traffic monitoring. Nanotechnology 2009, 20, 445501. [Google Scholar] [CrossRef]
  19. Shi, Z.Q.; Chung, D.D.L. Carbon fiber-reinforced concrete for traffic monitoring and weighing in motion. Cem. Concr. Res. 1999, 29, 435–439. [Google Scholar] [CrossRef]
  20. Ranade, R.; Zhang, J.; Lynch, J.P.; Li, V.C. Influence of micro-cracking on the composite resistivity of Engineered Cementitious Composites. Cem. Concr. Res. 2014, 58, 1–12. [Google Scholar] [CrossRef]
  21. Ding, S.; Wang, Y.-W.W.; Ni, Y.-Q.Q.; Han, B. Structural modal identification and health monitoring of building structures using self-sensing cementitious composites. Smart Mater. Struct. 2020, 29, 055013. [Google Scholar] [CrossRef]
  22. D’Alessandro, A.; Birgin, H.B.; Ubertini, F. Carbon Microfiber-Doped Smart Concrete Sensors for Strain Monitoring in Reinforced Concrete Structures: An Experimental Study at Various Scales. Sensors 2022, 22, 6083. [Google Scholar] [CrossRef]
  23. D’Alessandro, A.; Ubertini, F.; García-Macías, E.; Castro-Triguero, R.; Downey, A.; Laflamme, S.; Meoni, A.; Materazzi, A.L. Static and Dynamic Strain Monitoring of Reinforced Concrete Components through Embedded Carbon Nanotube Cement-Based Sensors. Shock Vib. 2017, 2017, 3648403. [Google Scholar] [CrossRef] [Green Version]
  24. Ubertini, F.; Materazzi, A.L.; D’Alessandro, A.; Laflamme, S. Natural frequencies identification of a reinforced concrete beam using carbon nanotube cement-based sensors. Eng. Struct. 2014, 60, 265–275. [Google Scholar] [CrossRef] [Green Version]
  25. Monteiro, A.O.; Cachim, P.B.; Costa, P.M.F.J. Self-sensing piezoresistive cement composite loaded with carbon black particles. Cem. Concr. Compos. 2017, 81, 59–65. [Google Scholar] [CrossRef] [Green Version]
  26. Ferdiansyah, T.; Turatsinze, A.; Balayssac, J. Design and characterization of self-sensing steel fiber reinforced concrete. MATEC Web Conf. 2018, 199, 11008. [Google Scholar] [CrossRef] [Green Version]
  27. Nguyen, D.L.; Lam, M.N.-T.; Kim, D.J.; Song, J. Direct tensile self-sensing and fracture energy of steel-fiber-reinforced concretes. Compos. Part B Eng. 2020, 183, 107714. [Google Scholar] [CrossRef]
  28. Wen, S.; Chung, D.D.L. A comparative study of steel- and carbon-fibre cement as piezoresistive strain sensors. Adv. Cem. Res. 2003, 15, 119–128. [Google Scholar] [CrossRef]
  29. Han, B.G.; Han, B.Z.; Ou, J.P. Experimental study on use of nickel powder-filled Portland cement-based composite for fabrication of piezoresistive sensors with high sensitivity. Sens. Actuators A Phys. 2009, 149, 51–55. [Google Scholar] [CrossRef]
  30. Dinesh, A.; Suji, D.; Pichumani, M. Electro-mechanical investigations of steel fiber reinforced self-sensing cement composite and their implications for real-time structural health monitoring. J. Build. Eng. 2022, 51, 104343. [Google Scholar] [CrossRef]
  31. Yoo, D.Y.; You, I.; Lee, S.J. Electrical properties of cement-based composites with carbon nanotubes, graphene, and graphite nanofibers. Sensors 2017, 17, 1064. [Google Scholar] [CrossRef]
  32. Yoo, D.Y.; You, I.; Zi, G.; Lee, S.J. Effects of carbon nanomaterial type and amount on self-sensing capacity of cement paste. Meas. J. Int. Meas. Confed. 2019, 134, 750–761. [Google Scholar] [CrossRef]
  33. Han, B.; Ou, J. Embedded piezoresistive cement-based stress/strain sensor. Sens. Actuators A Phys. 2007, 138, 294–298. [Google Scholar] [CrossRef]
  34. Lee, S.H.; Kim, S.; Yoo, D.Y. Hybrid effects of steel fiber and carbon nanotube on self-sensing capability of ultra-high-performance concrete. Constr. Build. Mater. 2018, 185, 530–544. [Google Scholar] [CrossRef]
  35. Ding, Y.; Liu, G.; Hussain, A.; Pacheco-Torgal, F.; Zhang, Y. Effect of steel fiber and carbon black on the self-sensing ability of concrete cracks under bending. Constr. Build. Mater. 2019, 207, 630–639. [Google Scholar] [CrossRef]
  36. Lee, S.Y.; Le, H.V.; Kim, D.J. Self-stress sensing smart concrete containing fine steel slag aggregates and steel fibers under high compressive stress. Constr. Build. Mater. 2019, 220, 149–160. [Google Scholar] [CrossRef]
  37. Loamrat, K.; Sappakittipakorn, M.; Sukontasukkul, P.; Banthia, N. Effect of Carbon Fiber and Graphite Powder on Resistivity of Cement-based Sensor under Compression. KMUTNB Int. J. Appl. Sci. Technol. 2014, 7, 29–35. [Google Scholar] [CrossRef] [Green Version]
  38. Toutanji, H.A.; El-Korchi, T.; Katz, R.N. Strength and reliability of carbon-fiber-reinforced cement composites. Cem. Concr. Compos. 1994, 16, 15–21. [Google Scholar] [CrossRef]
  39. ACI Committee 544. Report on the Physical Properties and Durability of Fiber-Reinforced Concrete; American Concrete Institute: Farmington Hills, MI, USA, 2010. [Google Scholar]
  40. Bentur, A.; Mindess, S. Fibre Reinforced Cementitious Composites, 2nd ed.; Taylor & Francis Group: London, UK; New York, NY, USA, 2007. [Google Scholar]
  41. Paul, S.C.; van Zijl, G.P.A.G.; Šavija, B. Effect of Fibers on Durability of Concrete: A Practical Review. Materials 2020, 13, 4562. [Google Scholar] [CrossRef]
  42. Reza, F.; Batson, G.B.; Yamamuro, J.A.; Lee, J.S. Volume Electrical Resistivity of Carbon Fiber Cement Composites. ACI Mater. J. 2001, 98, 25–35. [Google Scholar]
  43. Chang, C.; Song, G.; Gao, D.; Mo, Y.L. Temperature and mixing effects on electrical resistivity of carbon fiber enhanced concrete. Smart Mater. Struct. 2013, 22, 035021. [Google Scholar] [CrossRef]
  44. Chacko, R.M.; Banthia, N.; Mufti, A.A. Carbon-fiber-reinforced cement-based sensors. Can. J. Civ. Eng. 2007, 34, 284–290. [Google Scholar] [CrossRef] [Green Version]
  45. del Moral, B.; Baeza, F.J.; Navarro, R.; Galao, O.; Zornoza, E.; Vera, J.; Farcas, C.; Garcés, P. Temperature and humidity influence on the strain sensing performance of hybrid carbon nanotubes and graphite cement composites. Constr. Build. Mater. 2021, 284, 122786. [Google Scholar] [CrossRef]
  46. Ou, J.; Han, B. Piezoresistive cement-based strain sensors and self-sensing concrete components. J. Intell. Mater. Syst. Struct. 2009, 20, 329–336. [Google Scholar] [CrossRef]
  47. Song, X.H.; Zheng, L.X.; Li, Z.Q. Temperature Compensation in Deformation Testing for Smart Concrete Structures. Key Eng. Mater. 2009, 326–328, 1503–1506. [Google Scholar] [CrossRef]
  48. Cabeza, M.; Merino, P.; Nóvoa, X.R.; Sánchez, I. Electrical effects generated by mechanical loading of hardened Portland cement paste. Cem. Concr. Compos. 2003, 25, 351–356. [Google Scholar] [CrossRef]
  49. Sánchez, I.; Nóvoa, X.R.; de Vera, G.; Climent, M.A. Microstructural modifications in Portland cement concrete due to forced ionic migration tests. Study by impedance spectroscopy. Cem. Concr. Res. 2008, 38, 1015–1025. [Google Scholar] [CrossRef]
  50. Cabeza, M.; Merino, P.; Miranda, A.; Nóvoa, X.R.; Sanchez, I. Impedance spectroscopy study of hardened Portland cement paste. Cem. Concr. Res. 2002, 32, 881–891. [Google Scholar] [CrossRef]
  51. Tumidajski, P.J. Electrical conductivity of Portland cement mortars. Cem. Concr. Res. 1996, 26, 529–534. [Google Scholar] [CrossRef]
  52. Mason, T.O.; Campo, M.A.; Hixson, A.D.; Woo, L.Y. Impedance spectroscopy of fiber-reinforced cement composites. Cem. Concr. Compos. 2002, 24, 457–465. [Google Scholar] [CrossRef]
  53. Torrents, J.; Mason, T.; Garboczi, E. Impedance spectra of fiber-reinforced cement-based composites: A modeling approach. Cem. Concr. Res. 2000, 30, 585–592. [Google Scholar] [CrossRef]
  54. Allam, H.; Duplan, F.; Clerc, J.P.; Amziane, S.; Burtschell, Y. About electrical resistivity variation during drying and improvement of the sensing behavior of carbon fiber-reinforced smart concrete. Constr. Build. Mater. 2020, 264, 120699. [Google Scholar] [CrossRef]
  55. Allam, H.; Duplan, F.; Amziane, S.; Burtschell, Y. Assessment of manufacturing process efficiency in the dispersion of carbon fibers in smart concrete by measuring AC impedance. Cem. Concr. Compos. 2021, 127, 104394. [Google Scholar] [CrossRef]
  56. Berrocal, C.G.; Hornbostel, K.; Geiker, M.R.; Löfgren, I.; Lundgren, K.; Bekas, D.G. Electrical resistivity measurements in steel fibre reinforced cementitious materials. Cem. Concr. Compos. 2018, 89, 216–229. [Google Scholar] [CrossRef] [Green Version]
  57. Berrocal, C.; Lundgren, K.; Löfgren, I. Influence of Steel Fibres on Corrosion of Reinforcement in Concrete in Chloride Environments: A Review. In Proceedings of the 7th International Conference Fibre Concrete 2013 Proceedings, Paris, France, 2–4 September 2013. [Google Scholar]
  58. EN 197-1:2012; Cement—Composition, Specifications and Conformity Criteria for Common Cements. CEN: Brussels, Belgium, 2012.
  59. EN 196-1:2016; Methods of Testing Cement. Part 1: Determination of Strength. CEN: Brussels, Belgium, 2016.
  60. Hixson, A.D.; Woo, L.Y.; Campo, M.A.; Mason, T.O.; Garboczi, E.J. Intrinsic conductivity of short conductive fibers in composites by impedance spectroscopy. J. Electroceram. 2001, 7, 189–195. [Google Scholar] [CrossRef]
  61. Woo, L.Y.; Wansom, S.; Ozyurt, N.; Mu, B.; Shah, S.P.; Mason, T.O. Characterizing fiber dispersion in cement composites using AC-Impedance Spectroscopy. Cem. Concr. Compos. 2005, 27, 627–636. [Google Scholar] [CrossRef]
  62. Keddam, M.; Takenouti, H.; Nóvoa, X.R.; Andrade, C.; Alonso, C. Impedance measurements on cement paste. Cem. Concr. Res. 1997, 27, 1191–1201. [Google Scholar] [CrossRef]
  63. McCarter, W.J.J. A parametric study of the impedance characteristics of cement-aggregate systems during early hydration. Cem. Concr. Res. 1994, 24, 1097–1110. [Google Scholar] [CrossRef]
  64. Princigallo, A.; van Breugel, K.; Levita, G. Influence of the aggregate on the electrical conductivity of Portland cement concretes. Cem. Concr. Res. 2003, 33, 1755–1763. [Google Scholar] [CrossRef]
  65. Xu, G.; Beaudoin, J.J.; Jolicoeur, C.; Pagé, M. The effect of a polynaphthalene sulfonate superplasticizer on the contribution of the interfacial transition zone to the electrical resistivity of mortars containing silica and limestone fine aggregate. Cem. Concr. Res. 2000, 30, 683–691. [Google Scholar] [CrossRef]
  66. Xu, G.; Beaudoin, J.J. Effect of polycarboxylate superplasticizer on contribution of interfacial transition zone to electrical conductivity of Portland cement mortars. ACI Mater. J. 2000, 97, 418–424. [Google Scholar]
  67. Zhang, M.Q.; Zeng, H.M.; Wang, H.F.; Yao, X. An equivalent circuit model for electric conductive polymer composites. Adv. Compos. Lett. 1993, 2, 096369359300200. [Google Scholar] [CrossRef]
  68. Almuhammadi, K.; Bera, T.K.; Lubineau, G. Electrical impedance spectroscopy for measuring the impedance response of carbon-fiber-reinforced polymer composite laminates. Compos. Struct. 2017, 168, 510–521. [Google Scholar] [CrossRef] [Green Version]
  69. Torrents, J.M.; Mason, T.O.; Peled, A.; Shah, S.P.; Garboczi, E.J. Analysis of the impedance spectra of short conductive fiber-reinforced composites. J. Mater. Sci. 2001, 36, 4003–4012. [Google Scholar] [CrossRef]
  70. Solgaard, A.O.S.; Geiker, M.; Edvardsen, C.; Küter, A. Observations on the electrical resistivity of steel fibre reinforced concrete. Mater. Struct. 2014, 47, 335–350. [Google Scholar] [CrossRef]
  71. Chiarello, M.; Zinno, R. Electrical conductivity of self-monitoring CFRC. Cem. Concr. Compos. 2005, 27, 463–469. [Google Scholar] [CrossRef]
  72. Baeza, F.J.; Chung, D.D.L.; Zornoza, E.; Andión, L.G.; Garcés, P. Triple percolation in concrete reinforced with carbon fiber. ACI Mater. J. 2010, 107, 396–402. [Google Scholar]
  73. Castellote, M.; Andrade, C.; Alonso, M.C. Standardization, to a Reference of 25 °C, of Electrical Resistivity for Mortars and Concretes in Saturated or Isolated Conditions. ACI Mater. J. 2003, 99, 119–127. [Google Scholar]
  74. Spragg, R.P.; Castro, J.; Nantung, T.; Paredes, M.; Weiss, J. Variability Analysis of the Bulk Resistivity Measured Using Concrete Cylinders. Adv. Civ. Eng. Mater. 2012, 1, 104596. [Google Scholar] [CrossRef] [Green Version]
  75. Chung, D.D.L.; Wang, Y. Capacitance-based stress self-sensing in cement paste without requiring any admixture. Cem. Concr. Compos. 2018, 94, 255–263. [Google Scholar] [CrossRef]
  76. García-Macías, E.; D’Alessandro, A.; Castro-Triguero, R.; Pérez-Mira, D.; Ubertini, F. Micromechanics modeling of the uniaxial strain-sensing property of carbon nanotube cement-matrix composites for SHM applications. Compos. Struct. 2017, 163, 195–215. [Google Scholar] [CrossRef]
Figure 1. Electrical Impedance Spectroscopy testing configuration.
Constrmater 02 00017 g001
Figure 2. (a) Conceptual Nyquist representation of typical EIS data of cement-based composites incorporating electrically conductive short fibers and (b) equivalent circuit.
Constrmater 02 00017 g002
Figure 3. (a) General overview of the testing configuration for evaluating the stress-sensing ability of the composites, and (b) compression loading procedure.
Constrmater 02 00017 g003
Figure 4. Bode plots for different mortars at different sample temperatures. (a) REF-A; (b) REF-B; (c) AS005; (d) BS005; (e) AS01; and (f) BS01.
Constrmater 02 00017 g004
Figure 5. Nyquist plots for reinforced mortars at different sample temperatures: (a) AS005; (b) BS005; (c) AS01; and (d) BS01.
Constrmater 02 00017 g005
Figure 6. Cusp values (AC frequency and Rcomposite) for mortars AS01, AS005, and BS01. One point per sample and at different temperatures are shown.
Constrmater 02 00017 g006
Figure 7. (a) Relative variation of the resistance (real part, Z′) and (b) relative variation of the reactance (imaginary part, Z″) with compressive loading for representative mortars at room temperature.
Constrmater 02 00017 g007
Figure 8. (a) Representative variations of resistance and reactance at 1 kHz during the cooling down of one sample AS005 pre-conditioned at 50 °C and (b) temperature variations measured by two thermocouples (affixed to the sample surfaces).
Constrmater 02 00017 g008
Figure 9. Variations of Z′ (left) and Z″ (right) during coupled loading and varying temperature conditions (preheated at 50 °C and cooling during the loading cycling) for representative samples of BS005, AS005, BS01, and AS01 mortars. Temperature-compensated results are also shown and compared with the loading.
Constrmater 02 00017 g009
Figure 10. Comparison of stress-sensing factors f′ and f″ and cosine similarity (R′ and R″) after compensating for the variations of impedance during the cooling down of the samples. Different patterns and colors are used for every preconditioning temperature.
Constrmater 02 00017 g010
Table 1. Mortar designations and mixture proportions.
MortarW/CAggregate Volume FractionFiber Volume Fraction
REF A0.400.6-
AS0050.05%
AS010.10%
REF B0.4-
BS0050.05%
BS010.10%
Table 2. Equivalent circuit fitting results and cusp values.
SampleT, °CEquivalent Circuit ParametersCusp Values
R1,
Ohm
T1,
SP1 Ohm−1
(×10−4)
P1R2,
Ohm
T2,
SP2 Ohm−1
(×10−8)
P2Rcomposite, OhmFrequency, Hz
AS0051245.86.60.7076.041.60.6776.081.8
23.810.00.7057.321.80.6857.361.1
35.37.390.7075.751.50.6775.781.1
13510.62.270.7171.923.30.6371.982.5
27.13.30.7154.193.60.6454.261.3
39.42.60.7171.432.90.6371.480.8
15012.31.70.7268.527.30.5868.580.8
28.42.50.7152.377.80.5952.460.8
311.41.90.7169.076.10.5969.180.5
AS01 (*)1240.2190.30.6710.820.30.8910.811.0
20.387.70.6914.670.90.7914.715.0
30.560.50.6916.991.80.7517.017.5
1350.447.80.7010.720.70.8410.711.1
20.723.00.7114.473.20.7114.515.2
30.916.10.7216.63100.6316.617.5
1500.432.70.7110.585.10.6810.611.0
20.816.00.7314.24270.5614.215.0
31.112.10.7216.30620.5016.317.4
BS005124181140.10.6128014.00.57280120,915
285450.10.5840520.70.65405212,597
341000.10.5624020.60.6824026502
135125030.10.5915761.40.64157614,079
2100960.10.5825770.60.69257712,673
345090.10.5316810.40.7216816190
150101680.10.5812951.20.66129511,463
268350.10.5818680.60.6818688703
345090.10.5316810.30.7216816190
BS0112490.11.20.62168.23.90.67168.2258.3
2357.10.60.60324.42.20.69324.4681.5
3174.90.80.62250.62.50.68250.6425.5
135135.60.70.62135.55.30.65135.5271.1
2449.10.50.60235.52.30.69235.5684.6
3265.00.40.61206.23.00.68206.2471.2
150123.50.70.62114.85.90.65114.8238.3
2397.70.40.601952.60.69195.0592.7
3221.00.50.61167.23.40.67167.2388.2
* Equivalent circuit parameters of AS01 samples were obtained for frequencies below 1 MHz.
Table 3. Monitoring of the cooling down through AC impedance at 1 kHz without application of compressive load: Coefficients b′ and b″ results.
SampleInitial Temperature, °Cb′, Ohm·s−1 (×10−4)b″, Ohm·s−1 (×10−4)
AS0051353.823.61
24.815.10
35.405.19
15012.416.1
212.79.84
316.814.1
AS01135--0.20
2--0.31
3--0.47
150--0.81
2--0.90
31.501.27
BS0051353516.2−0.02
29817.7−0.13
37765.0−0.19
1505622.2−588.4
27043.6−475.3
35165.0−537.4
BS0113583.116.6
2228.210.4
3141.825.7
150177.234.1
2473.421.5
3333.538.5
Publisher’s Note: MDPI stays neutral with regard to jurisdictional claims in published maps and institutional affiliations.

