Article

Development of Innovative Plate Load Testing Equipment for In-Situ Saturated Clays Soils

by
Ibrahim Umaru
1,2,*,
Mustapha Mohammed Alhaji
2,
Musa Alhassan
2,
Taiye Elisha Adejumo
2,
Babawuya Alkali
3,
Abdullahi Haruna Birniwa
4 and
Ahmad Hussaini Jagaba
1,*
1
Department of Civil Engineering, Abubakar Tafawa Balewa University, Bauchi 740272, Nigeria
2
Department of Civil Engineering, Federal University of Technology, Minna 920101, Nigeria
3
Department of Mechatronics Engineering, Federal University of Technology, Minna 920101, Nigeria
4
Department of Chemistry, Sule Lamido University, Kafin-Hausa PMB 048, Nigeria
*
Authors to whom correspondence should be addressed.
Geotechnics 2023, 3(2), 142-160; https://doi.org/10.3390/geotechnics3020009
Submission received: 21 December 2022 / Revised: 24 February 2023 / Accepted: 22 March 2023 / Published: 27 March 2023

Abstract

:
This study proposes a method of gradually loading plate load on-site using lever arms to squeeze out pore water from clayey soils, allowing the soil to settle. Several types of tests were conducted, including a conventional field plate load test (CFPLT), a numerical field plate load test (NFPLT) and an innovative field plate load test (IFPLT) proposed in this study. Three trial pits with soils of varied engineering properties were studied using CFPLT, which employed the use of a heavy jack for load application, the NFPLT test using PLAXIS and an IFPLT, which employed a lever arm to magnify the applied static load. Disturbed soil samples collected from these trial pits were tested for index properties while the undisturbed soil samples were tested using the undrained triaxial compression test (UTCT) and laboratory consolidation tests. The results of the index properties classified these three clay soils as silt of low plasticity (ML) for clay from site 1, and clay of low plasticity (CL) for clay from site 2 and 3. The cohesion and angle of internal friction from the UTCT recorded cohesion values were 28, 29 and 37 kN/m2 for sites 1, 2 and 3, respectively, while the angle of internal friction values were 13, 8 and 6° for sites 1, 2 and 3, respectively. The plate load testing using the three methods showed similar graph pattern except that the allowable load occurred at approximately 350 kN/m2 for the CFPLT and 150 kN/m2 for the IFPLT. The high value of bearing capacity in CFPLT is due to the short period of time taken to load from a jack, which allowed the test to be completed within a short period of time. The ultimate bearing capacities computed from the laboratory test have values of 315.0, 231.0 and 270.0 kN/m2 for sites 1, 2 and 3, respectively. These values agree closely with the bearing capacities obtained for CFPLT but higher than the values recorded for the IFPLT. This is probably due to the long period of sustained loading during testing, which allowed for dissipation of pore water during each loading. Settlements obtained using the IFPLT were close to 25 mm, which is recommended as minimum settlements for building structures BS 8004, 1986.

1. Introduction

Bearing capacity and settlement are the key parameters required for the design of shallow foundations [1]. The traditional method of gathering undisturbed samples and conducting laboratory tests on them produces erroneous bearing capacity and settlement values in most cases due to sample disturbance and other processes that go with sample collection and laboratory tests. Research on the effect of sample disturbance on soil-bearing capacities and settlement was carried out by [2,3,4]. The implication of designing without consideration for sample disturbance has been examined [5]. There is also a limitation to normal soil test usage due to the nature of soil deposits such as gravelly and difficult-to-sample soils [6]. Plate load testing is an in-situ test that provides a more accurate bearing capacity estimate for soil deposits. Various plate load testing equipment for both laboratory and field applications has been developed based on size and purpose of operation. Laboratory load bearing plates were developed by researchers, including [7,8,9,10,11,12,13]. The equipment was employed on representative undisturbed soil samples in the laboratory that recorded similar trends in the load-settlement characteristics graphs, the results of which can be employed in large-scale foundations using appropriate formulae. The load bearing equipment studied by [14,15,16,17,18] is basically for field application. This equipment are employed directly on the in-situ soil deposits to obtain the load-settlement characteristics directly without soil disturbance from sample collection and transportation.
A study of three plate sizes (0.30, 0.50 and 0.80 m in diameter) in sand examined the effect of plate sizes in load bearing tests [19]. This is due to the stress bulb originating from the base of the foundation. Results from this study did not show any clear failure pattern for the various plate sizes [20]. However, for constant loading, the settlement was observed to increase with an increase in plate size. The use of a 1.8m diameter plate in plate load testing over weathered in-situ chalk was studied [21]. The common parameters that can be evaluated with application of load bearing testing equipment are deformation modulus, modulus of subgrade reaction, settlement, and allowable bearing pressure [22,23,24]. These parameters are required for the design of various engineering infrastructures ranging from pavements, shallow foundations for civil engineering structures and slopes.
The plate load test basically consists of loading a circular steel plate placed at a foundation level to determine bearing capacity and settlements using either a medium or industrial hydraulic jack for load application. These loads applied to the foundation soil produce deformation, which is read through the dial gauge [15,16,25,26,27]. The hydraulic jack used does not sustain the constant applied load or pressure for a long duration, which leads to a drop in the loading during the test [28,29]. These drops in pressure could lead to either under estimation or over estimation of bearing capacity and settlement of shallow foundation for an intended structure. This test is not suitable for saturated clay soils, which will require constant sustained loading over a period to allowed gradual dissipations of pore water pressure before increments of loading.
This study is aimed at developing an innovative field plate load test equipment whose supporting bases are fixed firmly into the ground to avoid extrusion of the supporting bases during load application. This plate load test uses a constant load applied at the top of a lever arm and is sustained for 24 h before the addition of another loading.

2. Methodology

Laboratory Test Procedures

Three soil samples were collected from three different trial pits located at Federal University of Technology, Minna, north central Nigeria. Disturbed soil samples were collected from each of the trial pits for classification tests. Undisturbed soil samples were also collected from each of the trial pits and used for the undrained triaxial compression test and consolidation test. A conventional plate loading test with a circular base plate of 30 cm loaded with an industrial jack was used for plate load testing in each of the trial pits. The deformation readings were recorded for each loading increase, after which the load-settlement graph was plotted. The proposed innovative plate loading test was also used in each of the three trial pits with constant loadings of 5, 10, 20, 40, 80 and 160 kg, which translates to constant loadings of 7, 14, 28, 56, 112 and 224 kN/m2, respectively.
A numerical analysis using PLAXIS was used to develop a load-settlement characteristic graph from the engineering parameters obtained from the laboratory samples.

3. Results

3.1. Index Properties Test

The result of the index properties of soils from the three trial pits were classified as silt of low plasticity (ML) for Trial pit 1 and clay of low plasticity (CL) for Trial pits 2 and 3, according to the Unified Soil Classification System (USCS). The soils were classified as A-5, A-4 and A-6 according to the American Association of State Highway and Transport Officials (AASHTO) soil classification [30] for the soils from Trial pits 1, 2 and 3, respectively. The soil samples have a specific gravity (Gs) of 2.51, 2.61 and 2.57 for Trial pits 1, 2 and 3, respectively. The liquid limit and plastic limit values are 37.5, 32.5 and 35.50% and also 13.76, 11.87 and 13.02% for Trial pits 1, 2 and 3, respectively [31]. The results of the index properties are summarized in Table 1.

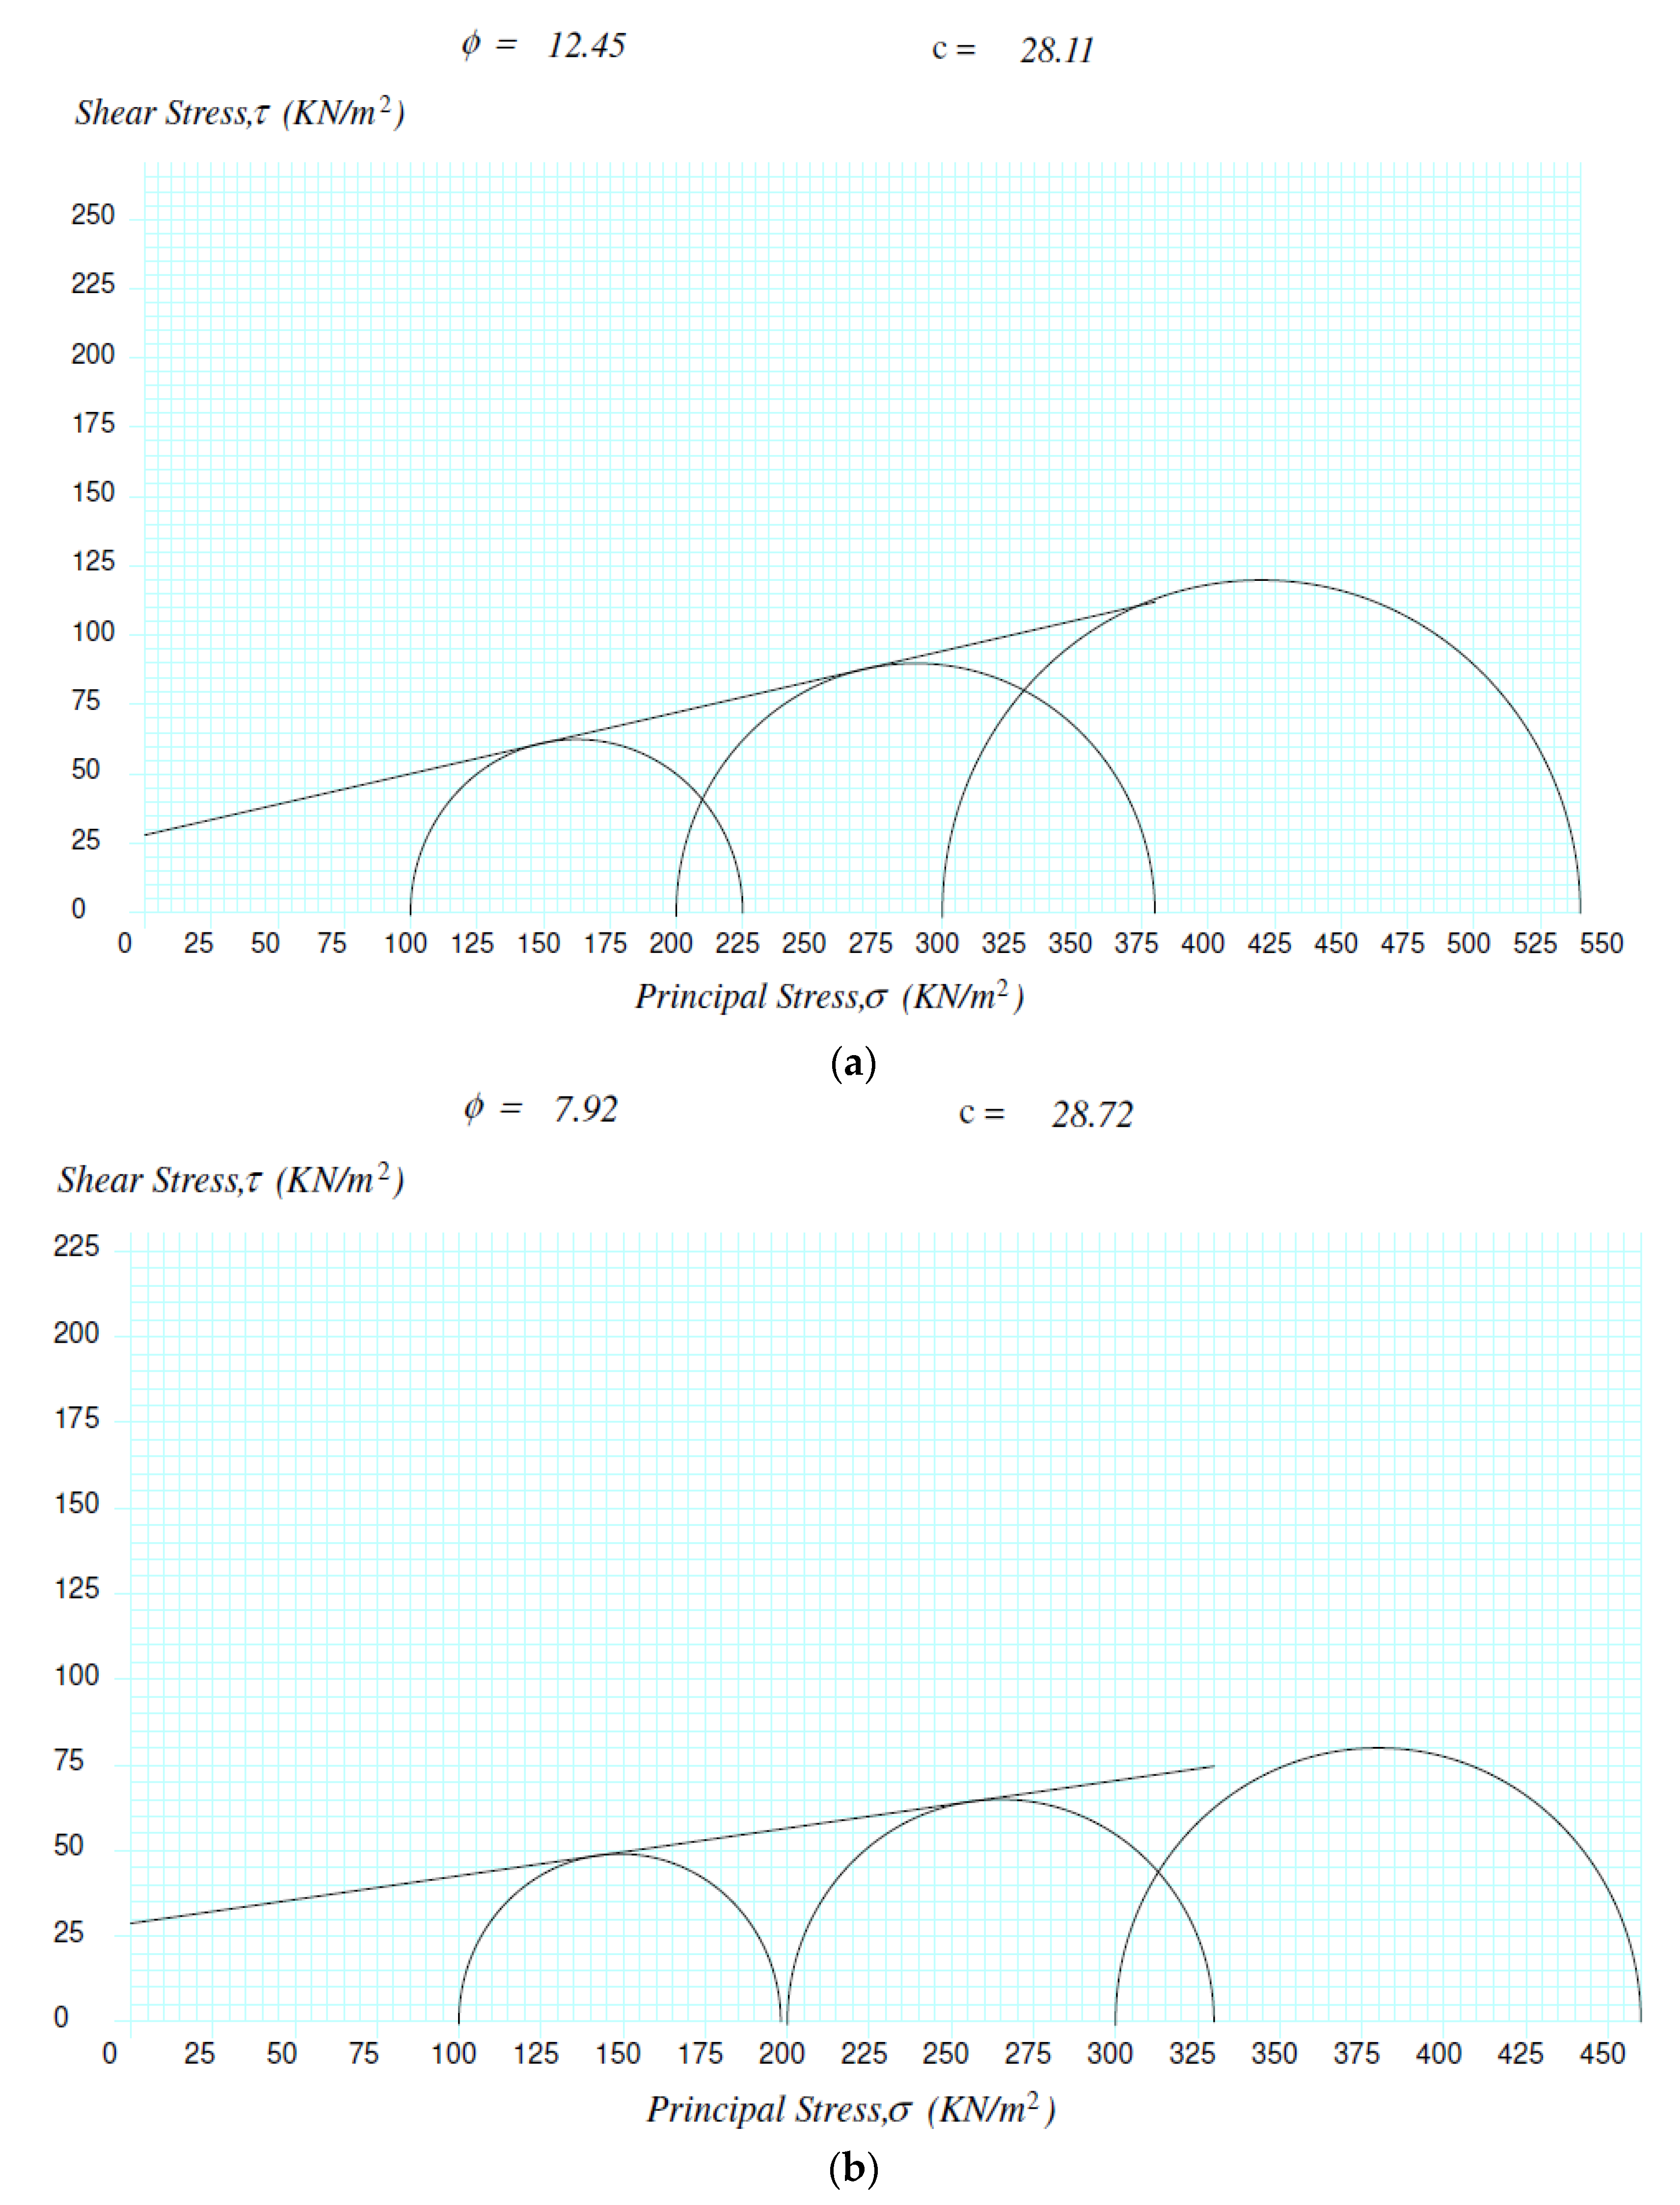
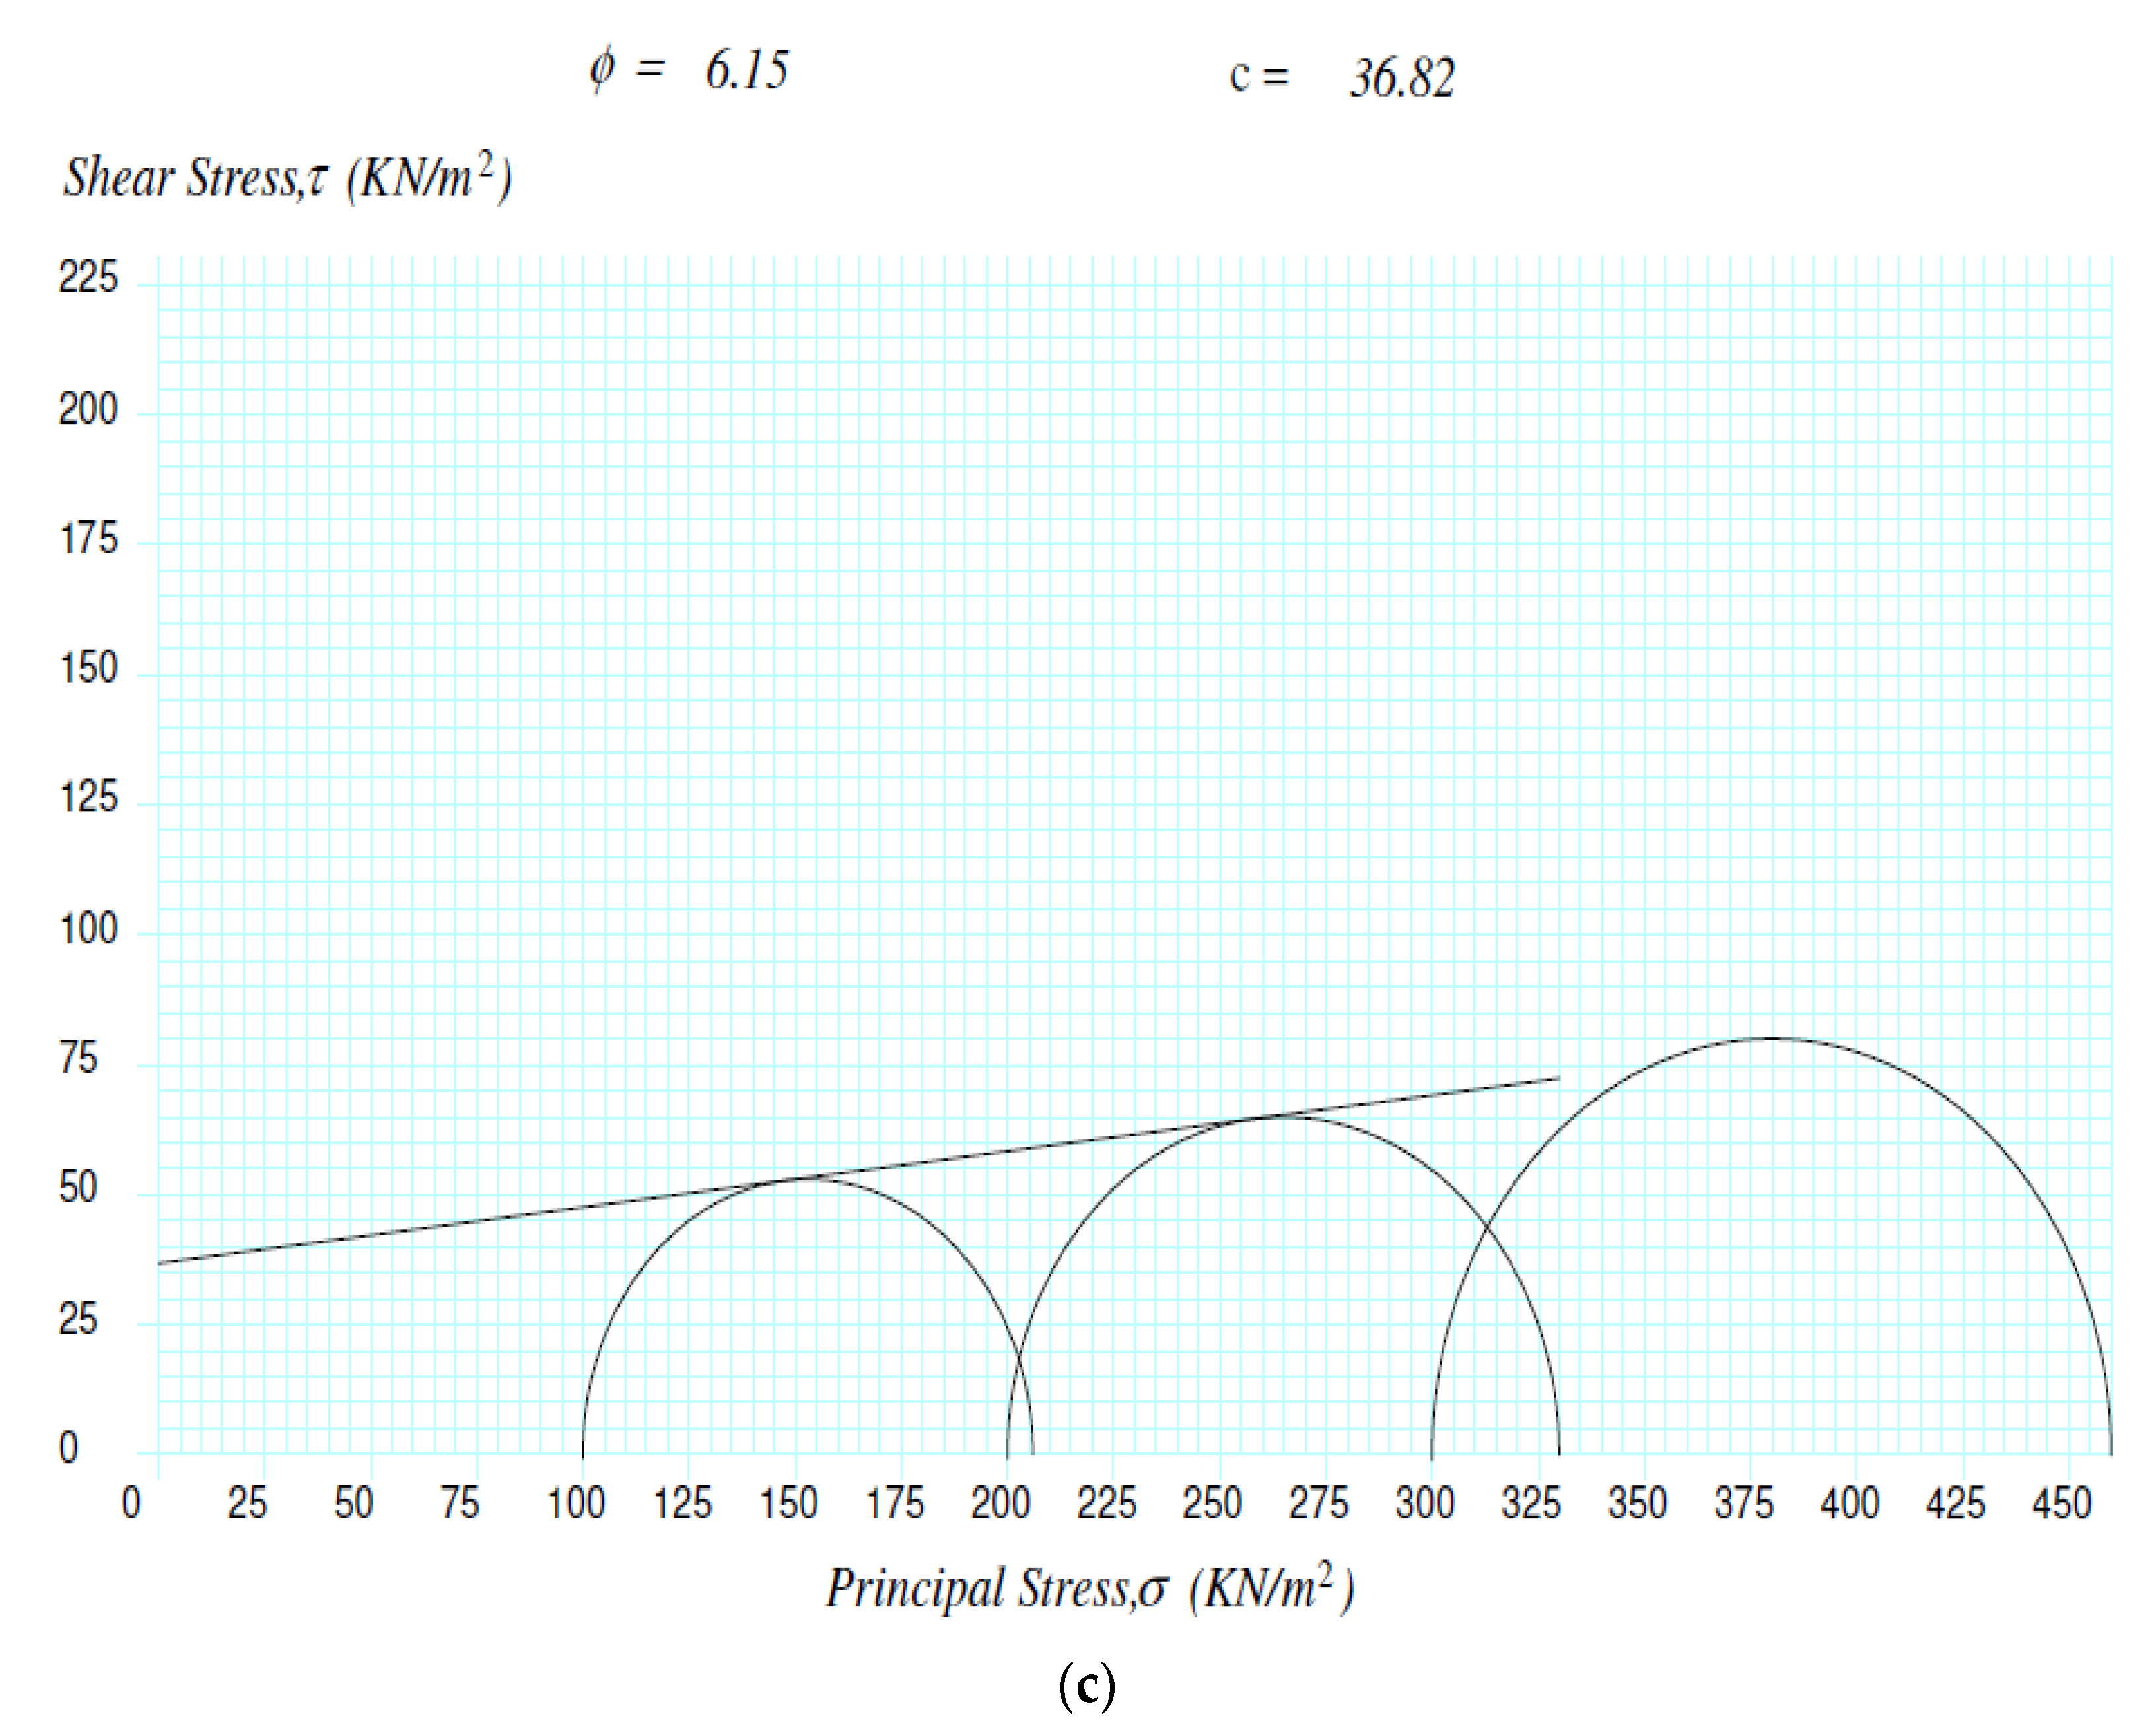
3.2. Undrained Triaxial Compression Test

Undrained triaxial compression tests were carried out on three undisturbed cylindrical soil samples with a diameter of 38 mm and a height of 76 mm. The samples were subjected to triaxial test cell pressures of 100, 200 and 300 kN/m2, respectively.
The result of the UTC test for Trial pits 1, 2, and 3 are shown in Figure 1a–c and the shear strength parameters are tabulated in Table 2. All these soil samples are C − Φ soils with high cohesion and minimal angle of internal friction. These characteristics justify the use of the soils for plate load testing using the innovative plate load testing equipment. Figure 1a–c shows that the angle of internal friction (ϕ) of the three soil samples were found to be 13°, 8° and 6° for the samples from Trial pits 1, 2 and 3, respectively.
These parameters were used to compute the bearing capacities for the soils from Trial pits 1, 2 and 3. The cohesion recorded for the soil samples were 28, 29 and 37 kN/m2 for soil samples from Trial pits 1, 2 and 3, respectively. The higher cohesion in the sample from Trial pit 3 agreed with the higher fines recorded in this sample.
The parameters obtained from these tests were also employed in the numerical evaluation of the load-settlement characteristics graph developed using PLAXIS.
Table 2 presents the summary of shear strength parameters along with the principal stresses used in the test.

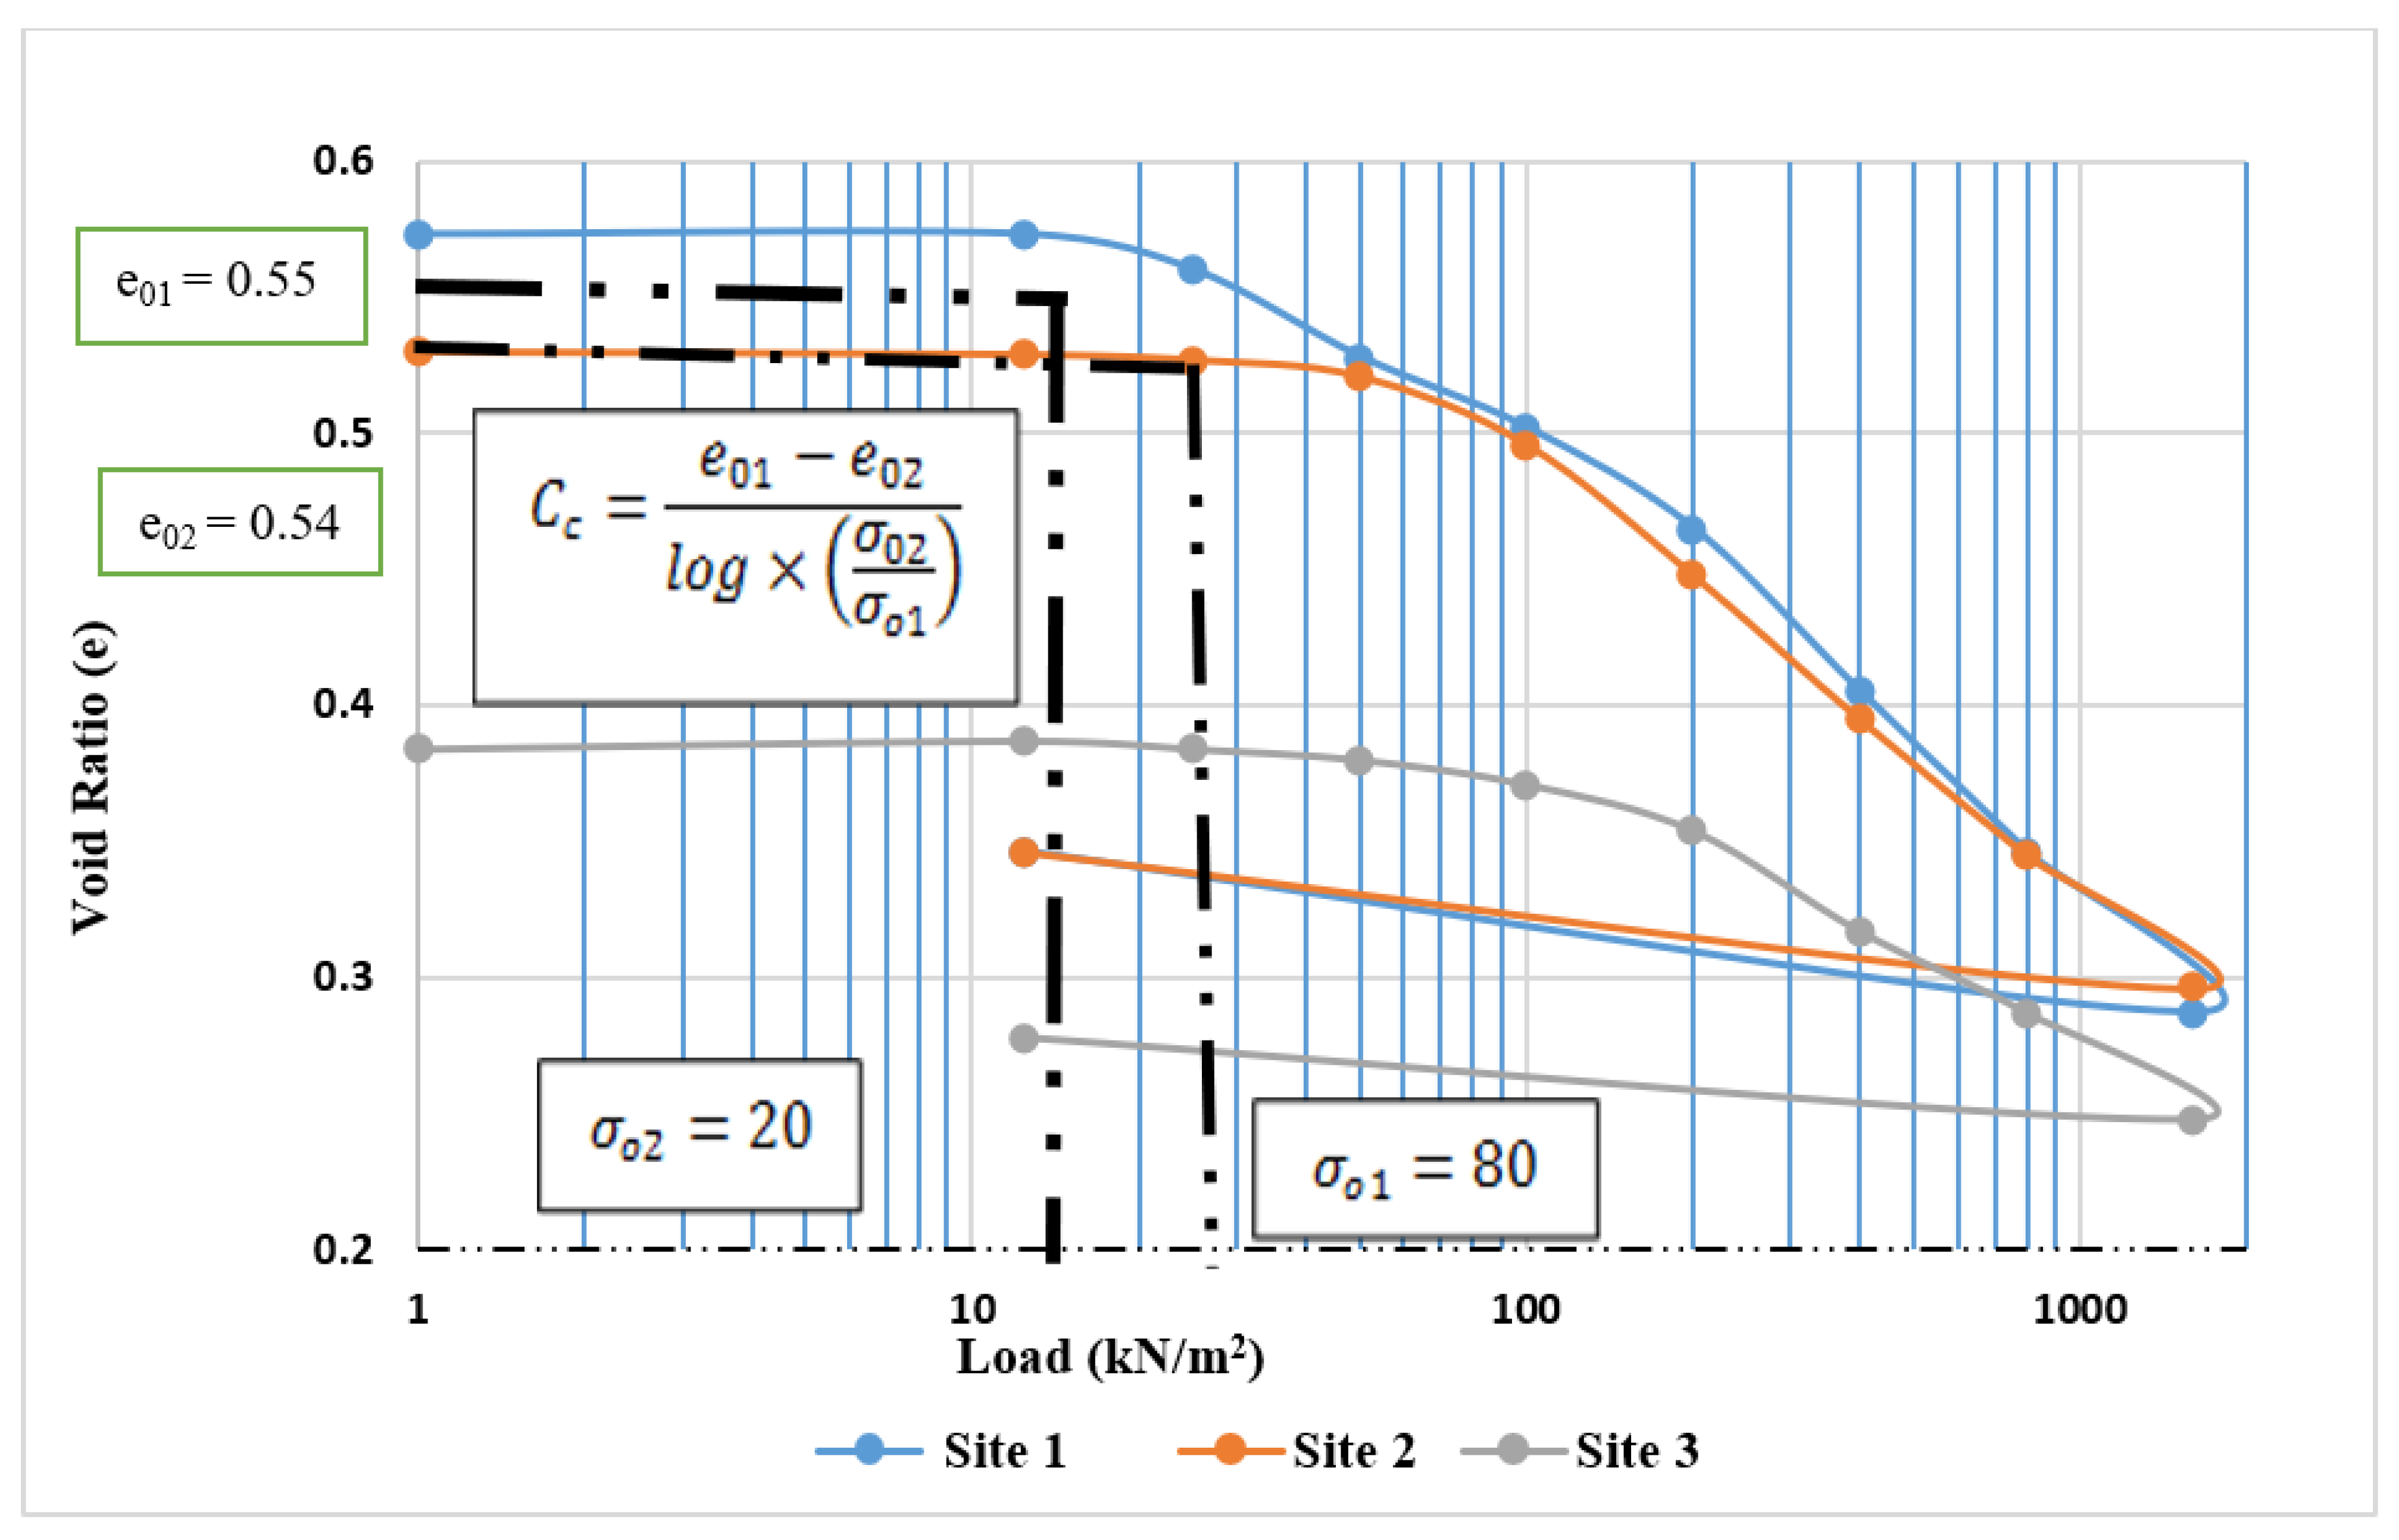
3.3. Laboratory Consolidation Test

The laboratory consolidation test was conducted on the undisturbed soil sample from the three trial pits, as shown in Figure 2, to determine the magnitude of the settlement of the soils in the laboratory. The compression index, Cc, of the soil samples were 0.124, 0.166 and 0.111 for soils from Trial pits 1, 2 and 3, respectively, while the magnitude of the settlements were 28 mm, 39 mm, and 29 mm for soils from Trial pits 1, 2 and 3, respectively.
Table 2 shows the summary of shear strength parameters and the magnitude of settlements. The magnitude of settlements is relatively high due to sustained saturation of the soil samples during consolidation testing as recommended by the standard. The laboratory oedometer test results in Table 3 yielded a higher settlement, which could be attributed to sample collections, sample preparations and other environmental factors, such as stress distributions, pore water and degree of saturation when compared with the in-situ methods.

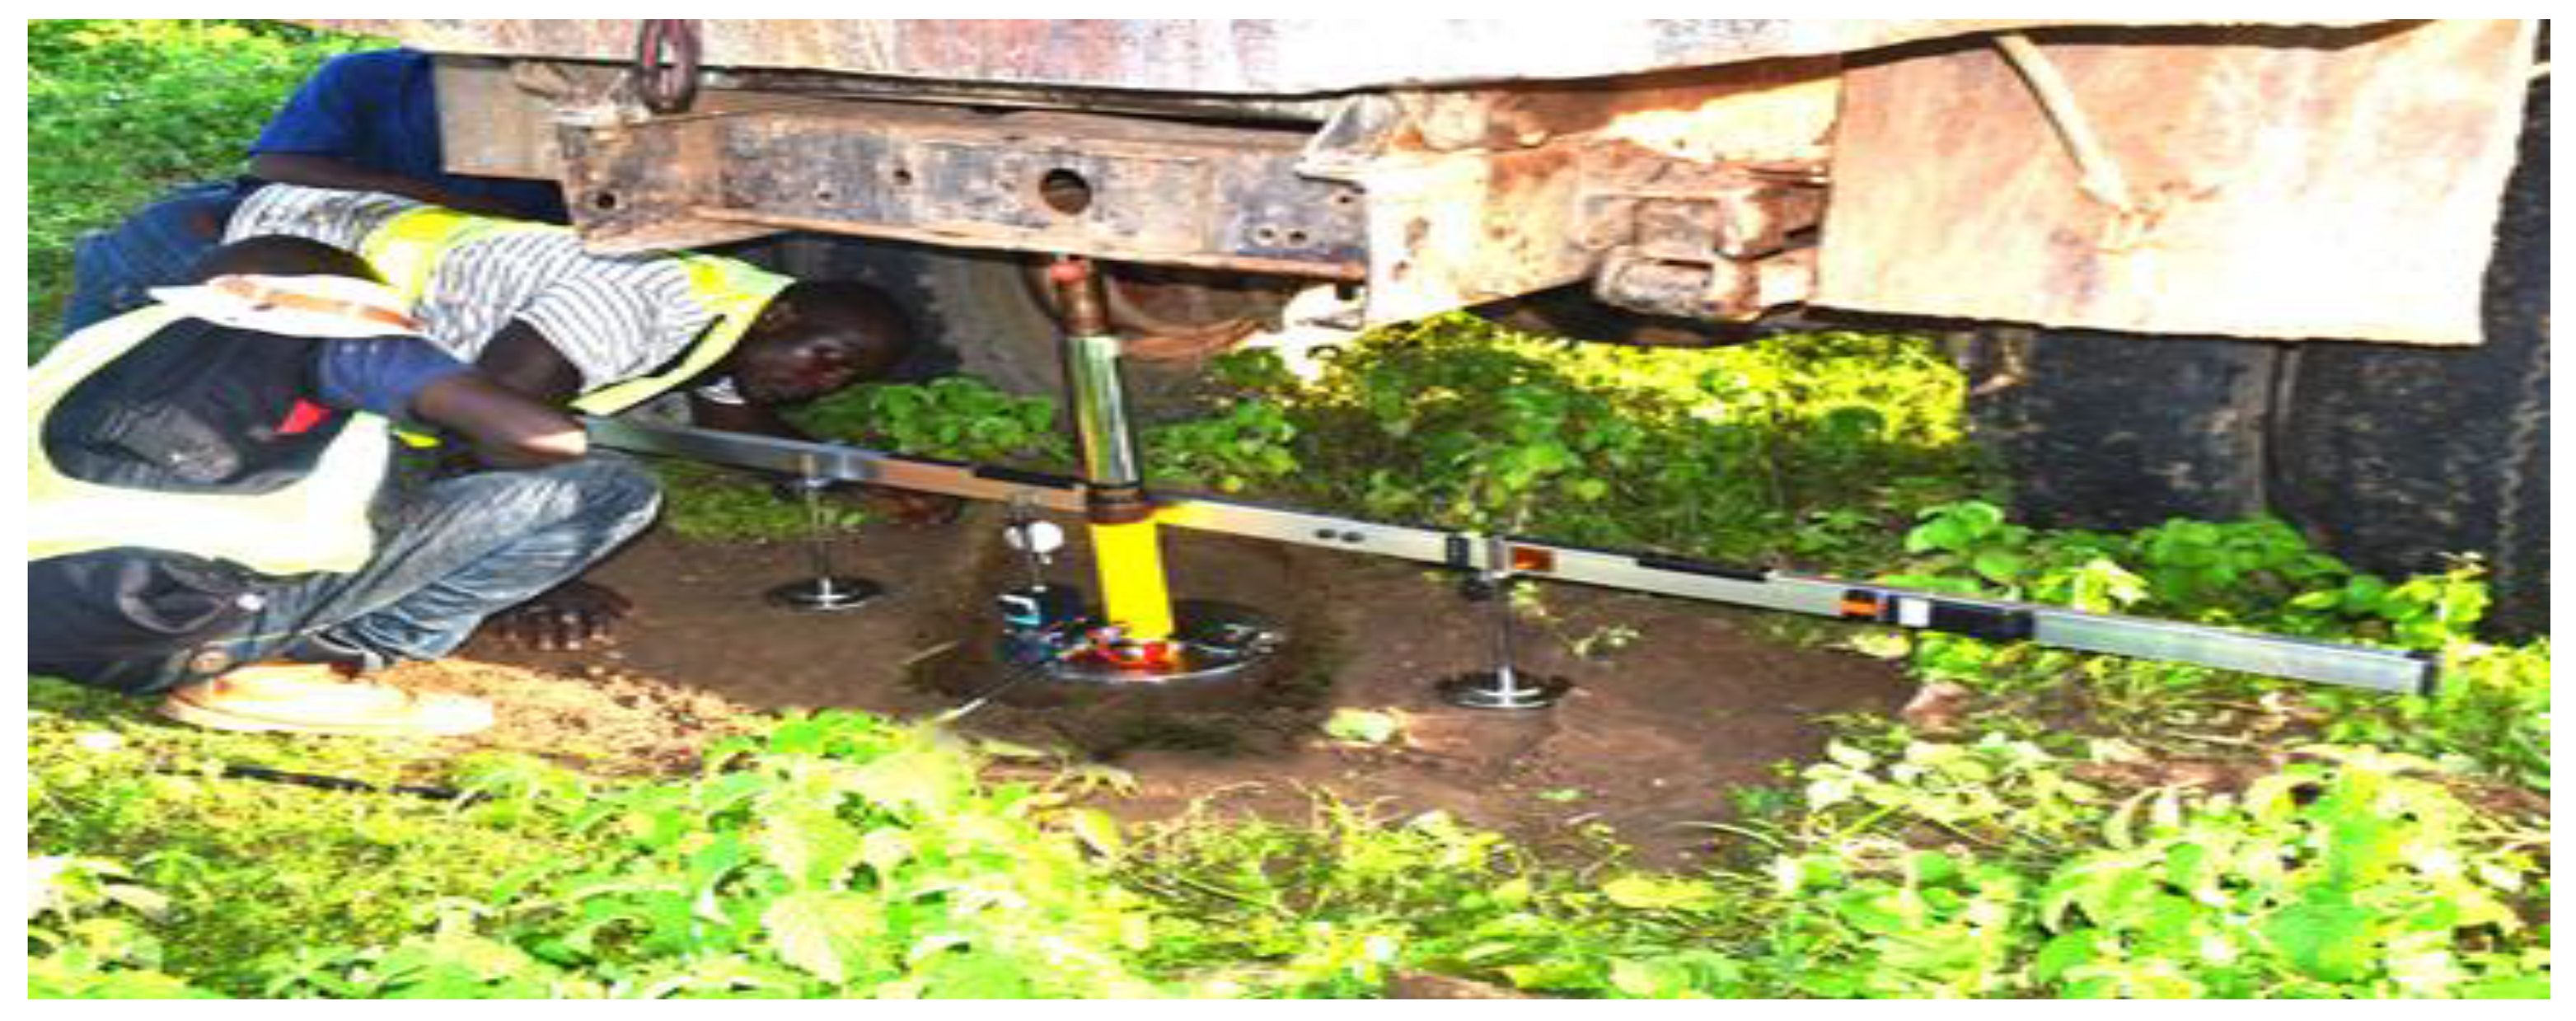
3.4. Field Plate Load Testing Apparatus and Experimental Procedures

3.4.1. Conventional Plate Load Test

The conventional plate load test (CFPLT) was conducted on the three trial pits. There was no disturbance on the surface within a distance of 3.5 times size of test plate from its center. The test plate of 300 mm diameter and 25 mm thick placed at depth of 0.5 m was used for the test [15]. The plate was placed in the center using a plumb bob from the beam center to check the level using a spirit level. A truck load was used as a reaction weight to keep the base plate on the ground after the application of the load through an industrial jack. The vehicle wheel was maintained such that there was no wheel contact close to the range of the testing area. The vertical steel supporting members were arranged on both sides of the marking at an equal distance. A hydraulic jack was placed on the plate and surcharge place above the jack piston up to the steel beam level. The jack was lifted until the steel beam touched the bottom of the loaded truck. Two supports for the reference beam were arranged for the fixing of dial gauges resting at the diametrically opposite ends of the plate, as shown in Figure 3. The readings of deformation on the dial gauge were taken after 15 min or when deformation was less than or equal to 0.002 mm/min.
The test was conducted according to [31]. The deformation curve obtained from the field data shows a gradual movement of the curve from zero to the maximum load, producing a higher bearing capacity when the tangential method of obtaining bearing capacity is used and gives rise to a corresponding lower settlement value. The values are presented in this study. The reason behind the higher value of bearing capacity for Trial pits 1, 2 and 3 soils is that ML and CL soil are semi pervious soils, which do not allow for movement of pore water when conducting a short duration test to dissipate or expulse pore water. That gave rise to higher values of bearing capacity and lower settlement because the stress is carried by pore water instead of the soil skeleton, as seen in Figure 4.
The load-settlement characteristic curves shown in Figure 4 represent the result of the soils from Trial pits 1, 2 and 3. All three curves showed a yield load at 350 kN/m2. These values are close to the ultimate bearing capacities computed from the laboratory results. However, the settlement values were observed to be low due to short time loading from the loading jack.

3.4.2. Innovative Field Plate Load Test

The proposed innovative plate load testing equipment emanated from a structural analysis and design of all the component steel members. This allowed for evolving the appropriate member sizes and shapes that can withstand the anticipated loadings. The base plate is made of a 30 cm × 30 cm square steel plate of 25 mm thickness. This plate is structurally designed to withstand loading without any form of bending. The anchored legs use an H-steel member with a flat steel plate attached to the end of the supporting legs, which sufficiently anchor the leg into the ground to 2 m depth. The equipment consists of a straight lever mechanism to magnify the weight of the load applied at the tip of the lever arm. The device is loaded incrementally through the loading hanger, known as effort, and maintains distance, L, from the fulcrum, F, and balance/canter load, W, at the opposite end with distance X from fulcrum F to produce equilibrium at the fulcrum. The load transfer Column C transfers the loads from the lever to the square base plate at the foundation level [11]. This is because dissipation of pore water from clay soils is gradual and requires a long duration and incremental loadings from smaller to higher loads. Each load placed on the lever arm is maintained for the period of 24 h before the next incremental loadings.
The fabrication of the proposed innovative Field Plate Load Test (IFPLT) equipment was carried out in a mechanical engineering workshop at Federal University of Technology, Minna, Nigeria, using the appropriate design data. Although the analysis and design of the IFPLT is not included in this paper, the materials used for the fabrication were obtained from the Panteka market in Kaduna, Kaduna State, Nigeria. The equipment (see Figure 5) was fabricated to allow for dismantling and movement from one position to the other. The fabrication is so simplified and portable that two people can setup the equipment on the field, load the equipment and take readings. It can also be moved from one point to another with ease when compared with conventional methods that require many personnel and heavy trucks to set up [17].
The test using the proposed innovative plate load test was carried out on a 1.5 by 1.5 m square pit with a 0.5 m depth using a square plate of 300 mm and 25 mm thickness with a load hanger attached to the lever arm, as shown in Figure 6. The stand legs were installed in the soil up to a 2 m depth using lean concrete to prevent pullout and sinking of the entire mechanism when the setup is loaded to the maximum. Incremental loads of 5, 10, 20, 40, 80, 160 kg and 320 kg were conducted with each loading maintained for 24 h before the next incremental loading. The dial reading of the dial gauge was taken at 5 s, 10 s, 15 s, 30 s, 1 min, 2 min, 4 min, 8 min, 15 min, 30 min, 1 h, 2 h, 4 h, 8 h, 12 h and 24 h. The deformation was recorded at each interval. The test was conducted on three trial pits; Trial pit 1 was sited directly behind the Civil Engineering laboratory, Trial pit 2 directly in front of the Center for Distance e-learning and Trial pit 3 was sited close to the National Information Technology Development Agency (NITDA) at Federal University of Technology, Minna. These trial pits are located at Latitude 9.535154 N, Longitude 6.452758 E, Latitude 9.532421 N and Longitude 6.451625 E, and Latitude 9.534101 N, Longitude 6.451475 E for Trial pits 1, 2 and 3, respectively.
The load-deformation characteristics observed on the silt of low plasticity (ML) soil from trial pit 1 using the proposed Innovative field plate load testing equipment shows that, at the beginning of the smaller loadings for an interval of twenty-four (24) hours each, the pore water of the soil carried the applied pressure exacted by the applied load. When the applied pressure reached the fourth loading, it yielded minimal deformations due to pore water dissipation. The application of the fifth and sixth higher loads caused a sharp downward movement of the curve, indicating settlement due to further dissipation of the pore water from the soil skeleton and rearrangement of soil particles to fill the void spaces [7].
The results of soils from Trial pits 2 and 3 depicted in Figure 7 follow the same pattern as Trial pit 1. However, for Trial pits 2 and 3 soils, the magnitude of deformation was higher for same load applications, which signifies a more porous soil structure compared to soils from Trial pit 1. This is probably due to the class of the soil that is classified as clay of low plasticity (CL). The deformation was minimal at lower loads and gradually became higher with higher loadings. The results of the bearing capacities and settlements are presented in this study. The bearing capacity (qu) was determined using Equation (1) developed for the clayey soils by [32].
q u F = q u P  
where qu(F) is the ultimate bearing capacity of a proposed foundation and qu(P) is the ultimate bearing capacity of the test plate.
The settlement of soil for the foundation can also be determined from Equation (2).
S f = S p × B b p
where
S f Permissible settlement of foundation (mm),
S p Settlement of plate (mm).
While B is Size of foundation (m),
b p is Size of plate (m).

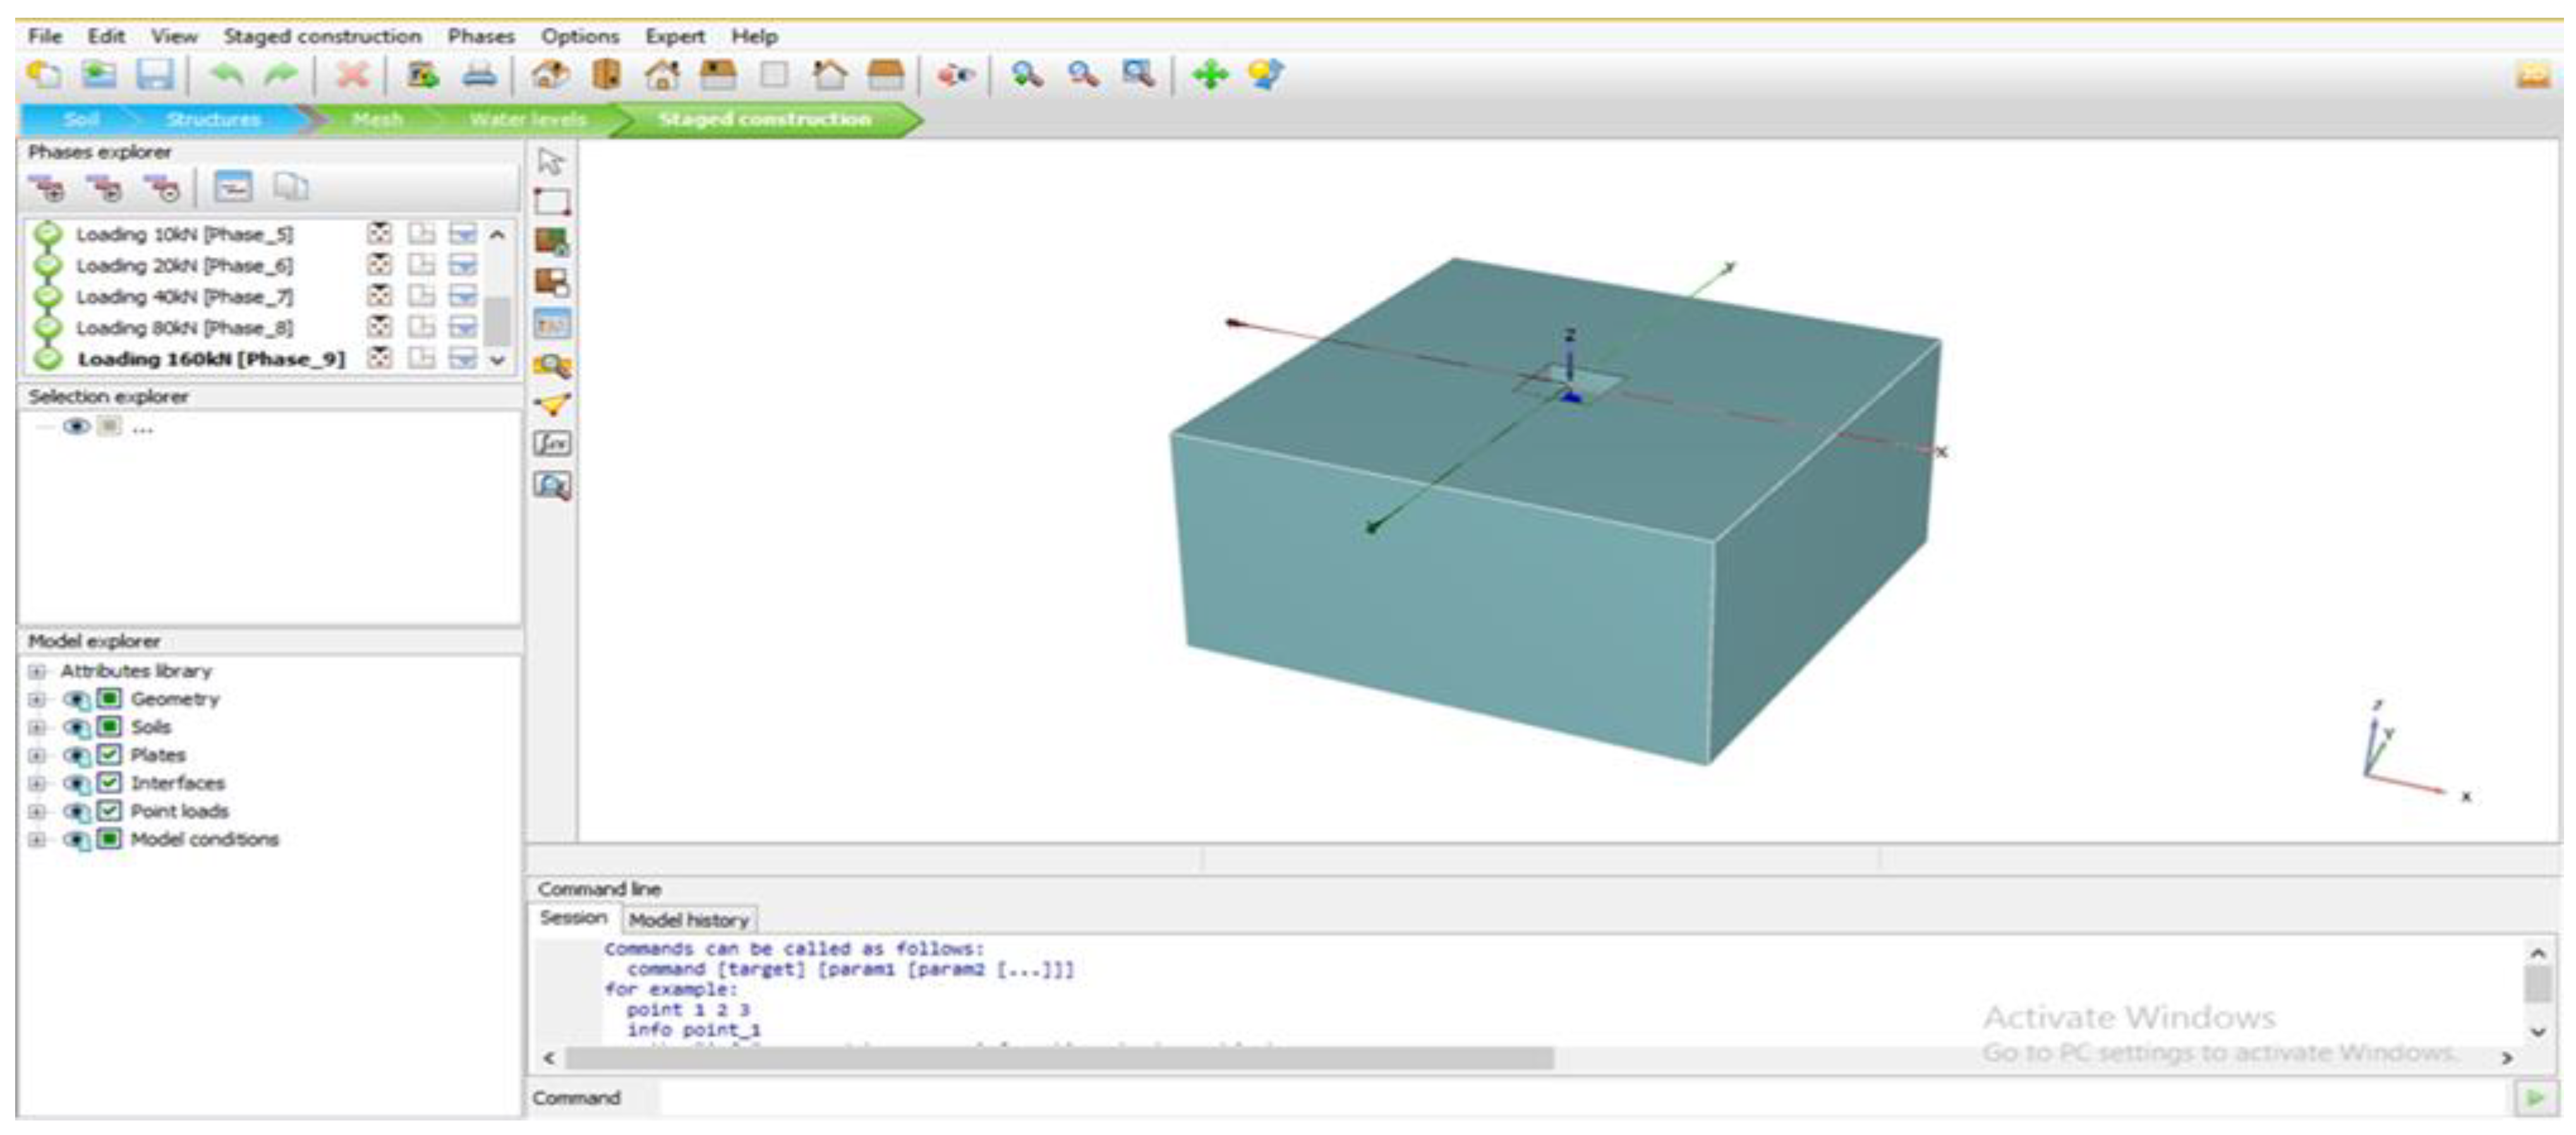
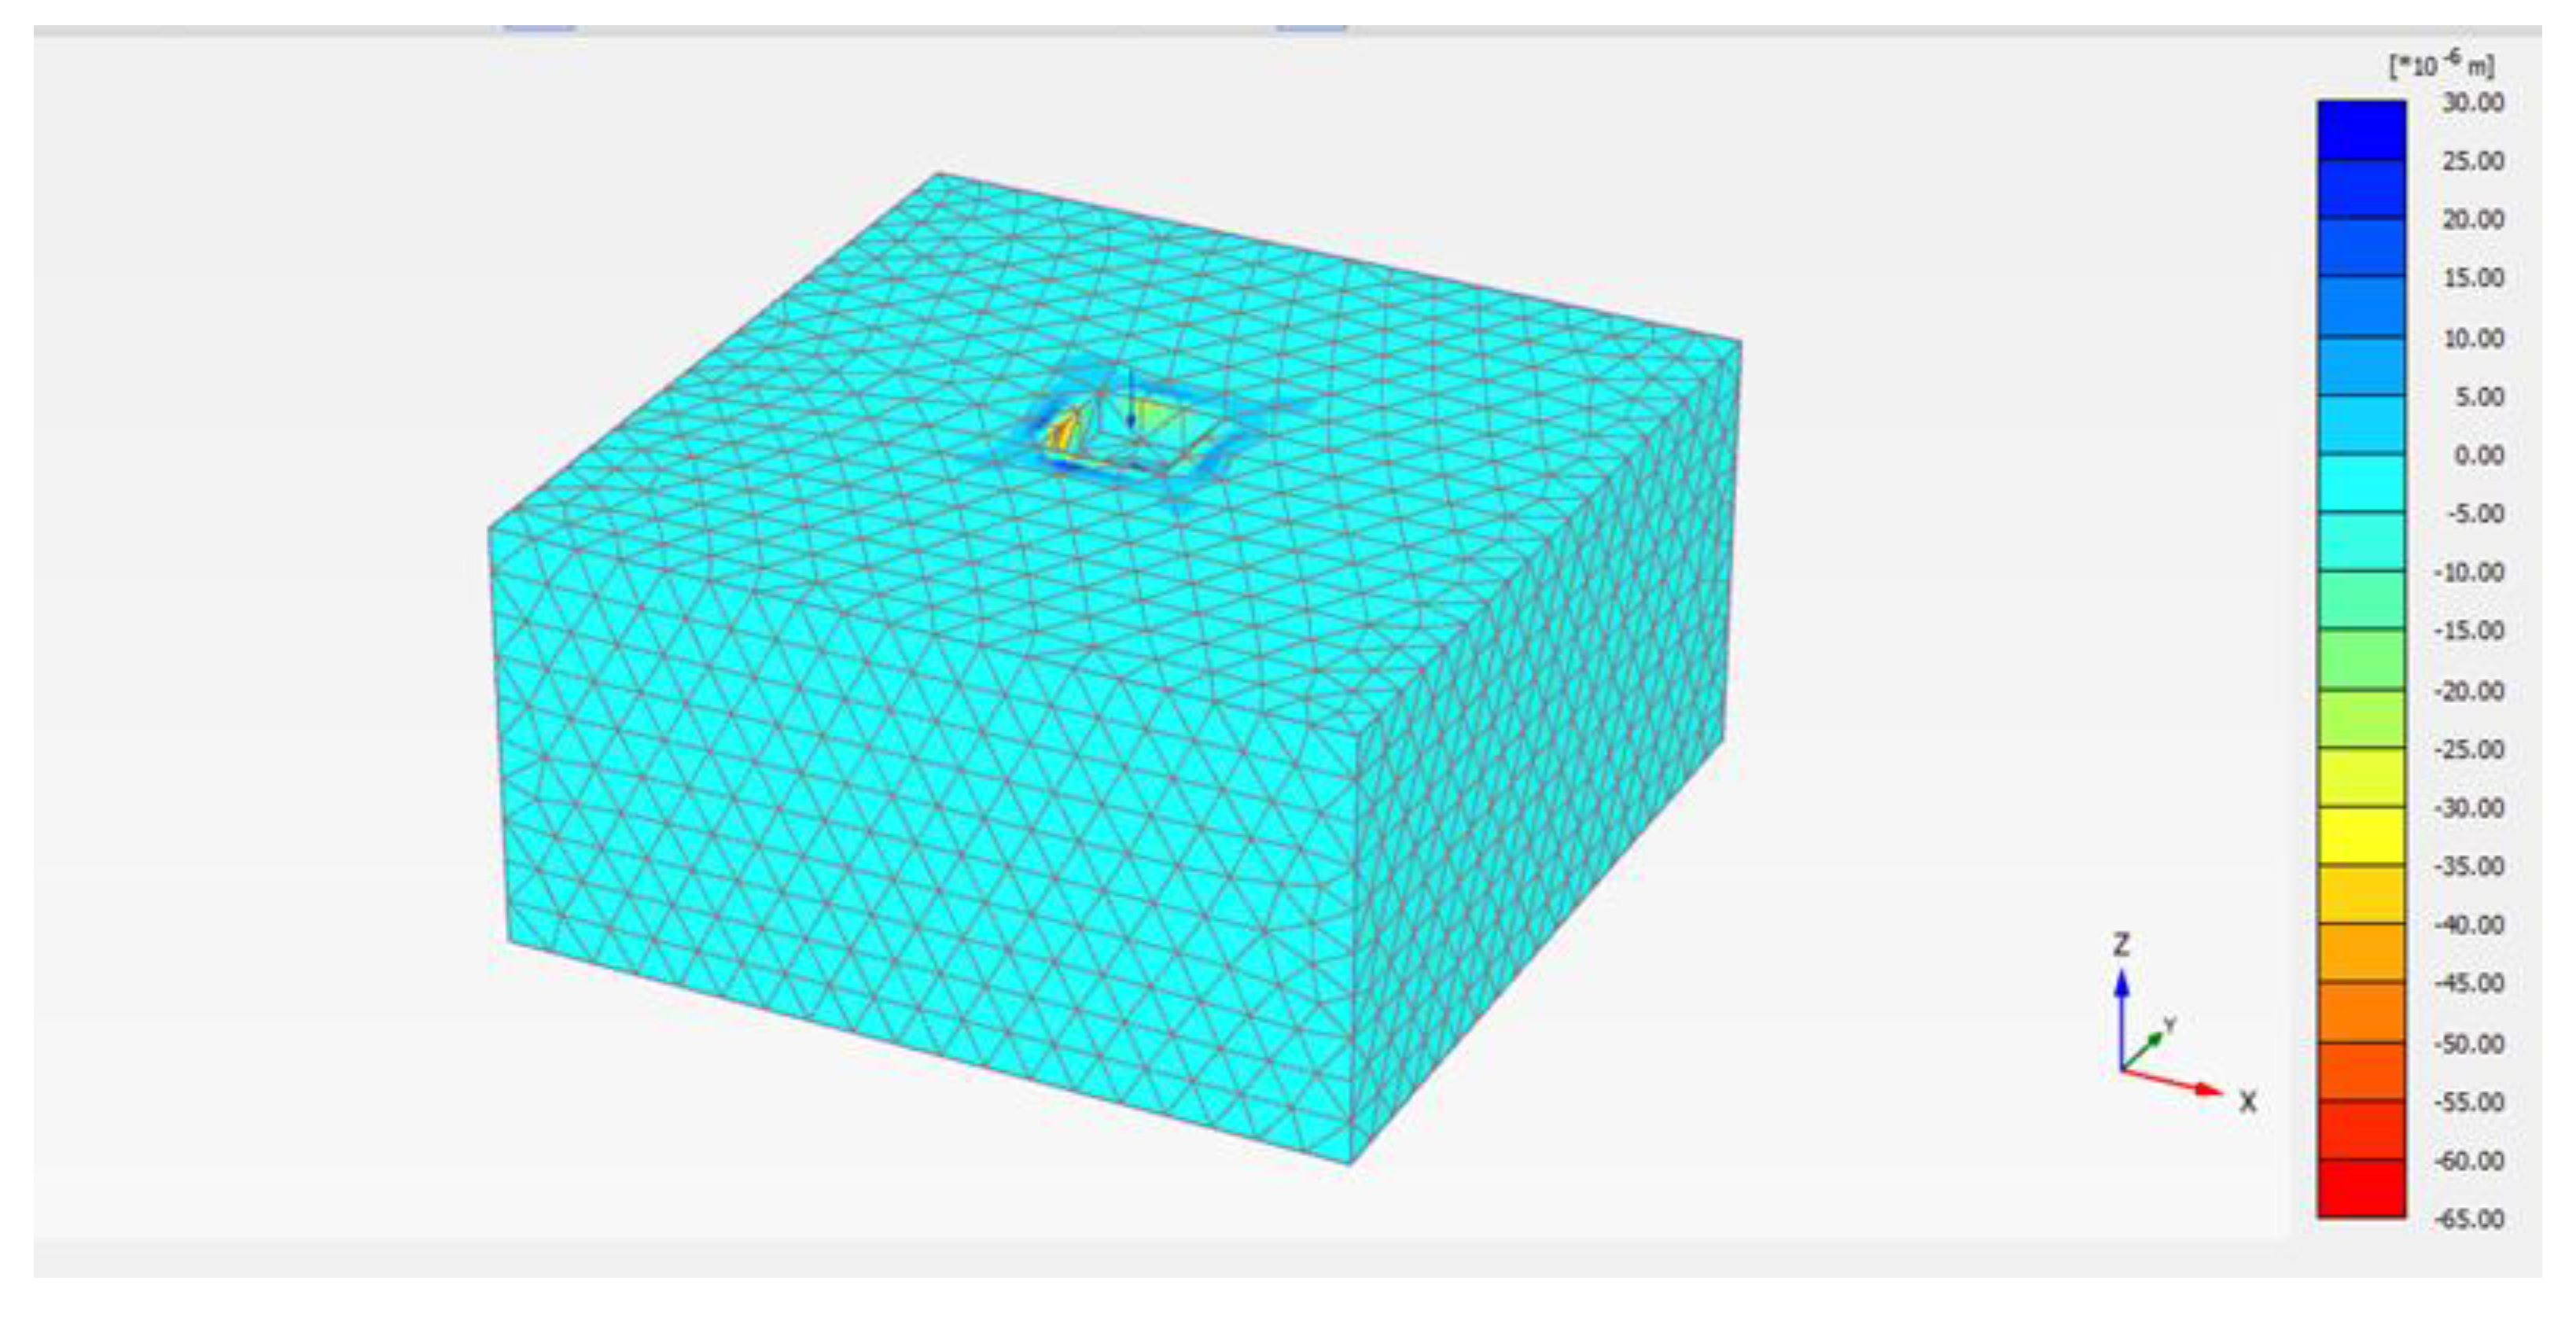
3.4.3. Numerical Plate Load Test Using PLAXIS Software

PLAXIS 3-D is a finite element software package known as the numerical Plate Load Test (NPLT) and is widely used for geotechnical engineering. It provides a 3-D model capability that can be applied for various geotechnical engineering analyses. The 3-D Mohr–Coulomb model was used because the 2-D axisymmetric model was not sufficient to represent the geometry because the bearing plate reached a considerable punch depth to create the finite strains. The soil geometry of the boundary condition of 5 m by 5 m and pit dimensions of 1.5 × 1.5 m and a depth of 0.5 m was excavated. The dimension of the pit is five times the diameter of the plate size. The PLAXIS 3-D software model uses soil skeleton of the subgrade layer, which provides soil behavior under different loading conditions. This program develops a 3-D subgrade model for the load-deformation curve for the plate load test to find the subgrade reaction modulus, settlement and bearing capacity. The software requires soil properties that include shear strength parameters, Poisson’s ratio and the unit weight of soil, as seen in Table 4.
The properties of the steel material were 300 mm in diameter, a density of 7850 kg/m3 and a 25 mm thickness. The PLAXIS software is demonstrated in Figure 8.
The PLAXIS model analysis has been conducted by considering the axisymmetric loading geometry and using a fine mesh for the domain, as shown in Figure 9. Then, the results are checked for the displacement of vertical loading [33].
The results of the PLAXIS 3-D model of the Numerical plate load test for bearing capacity and settlement of soils from the three sites are presented in this study, while the stress settlement curve is presented in Figure 10.

4. Discussion of Results

4.1. Laboratory Experiment

According to the results of the laboratory tests (oedometer and triaxial tests), Figure 11 and Figure 12 site 2 show a high settlement of 45.77 mm, followed closely by Site 3 with a settlement value of 43.86 mm, while Site 1 soil has the lowest settlement value of 31.5 mm. For the allowable bearing capacity, Site 1 has an allowable bearing capacity of 105.38 kN/m2, which is closely followed by Site 3, with an allowable bearing capacity of 90.06 kN/m2. Site 2 has the least allowable bearing capacity of 77.56 kN/m2, and these results are related to those reported by [34].

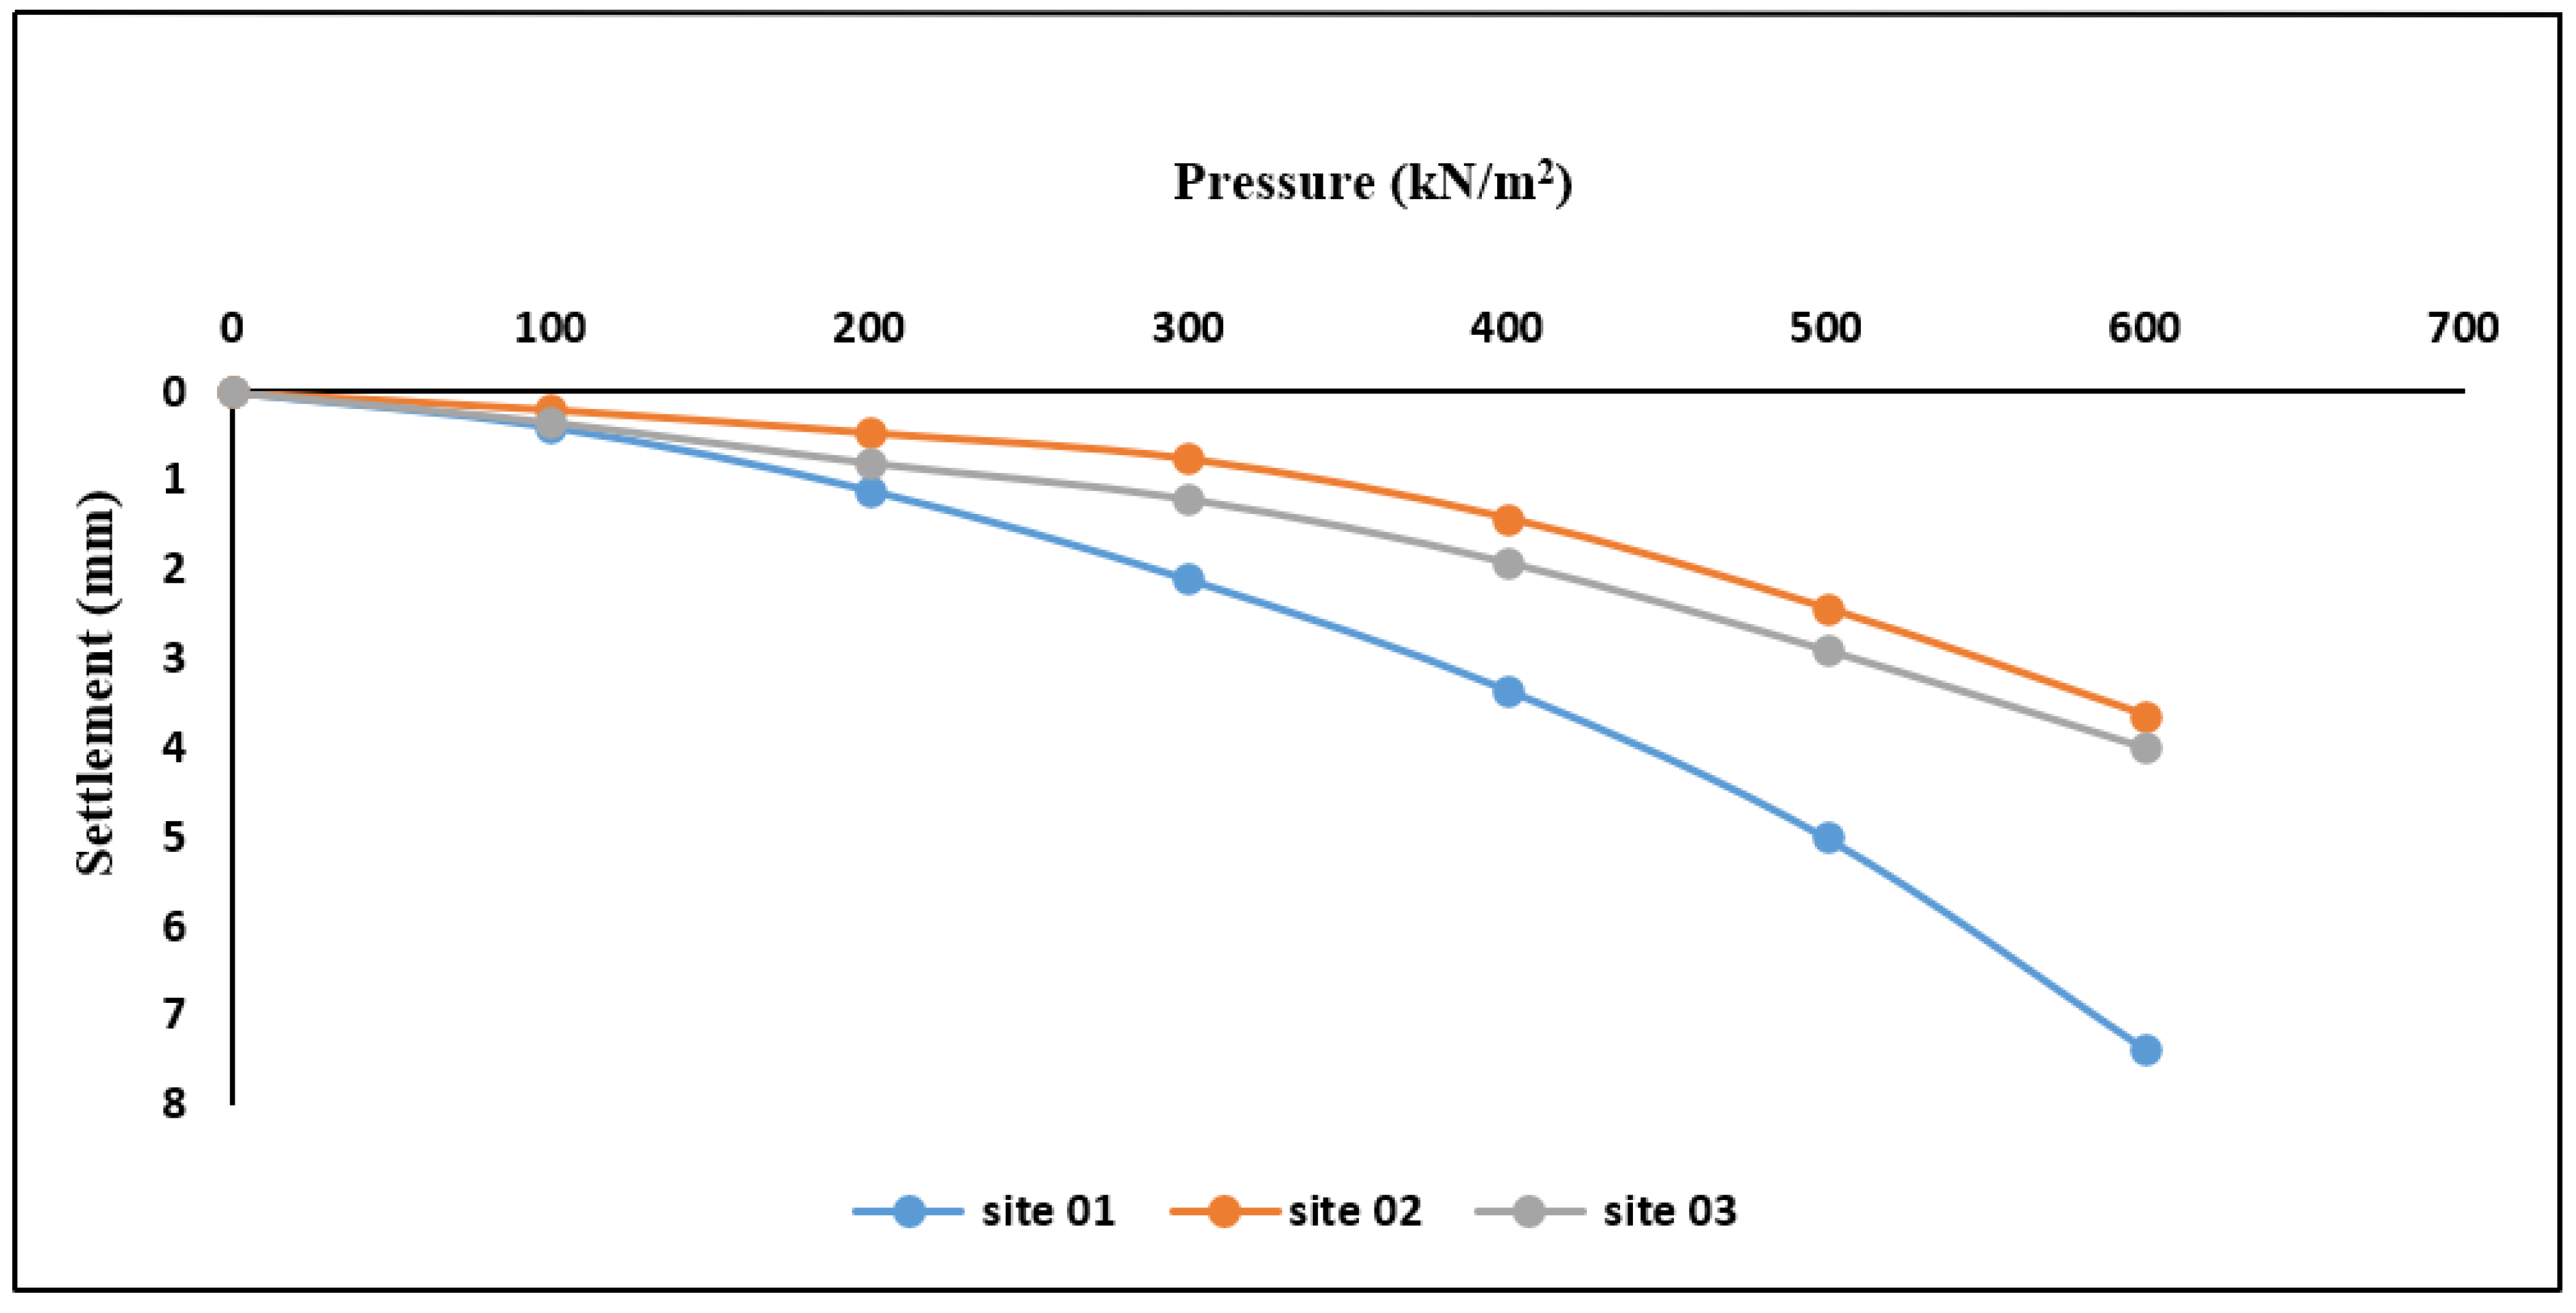
4.2. Conventional Plate Load Test

However, the results from the graph of the conventional plate loads test (CPLT), as seen in Figure 3, show that Site 3 has a settlement value of 9 mm, follow by Site 2 with a settlement of 6 mm and Site 1 with a settlement value of 2.5 mm. The corresponding allowable bearing capacity indicates that Site 2 has an allowable bearing capacity value of 92 kN/m2, closely followed by Site 1, which has an allowable bearing capacity of 91.25 kN/m2. Lastly, Site 3 with an allowable bearing capacity of 90 kN/m2 [35], is presented in Table 5.

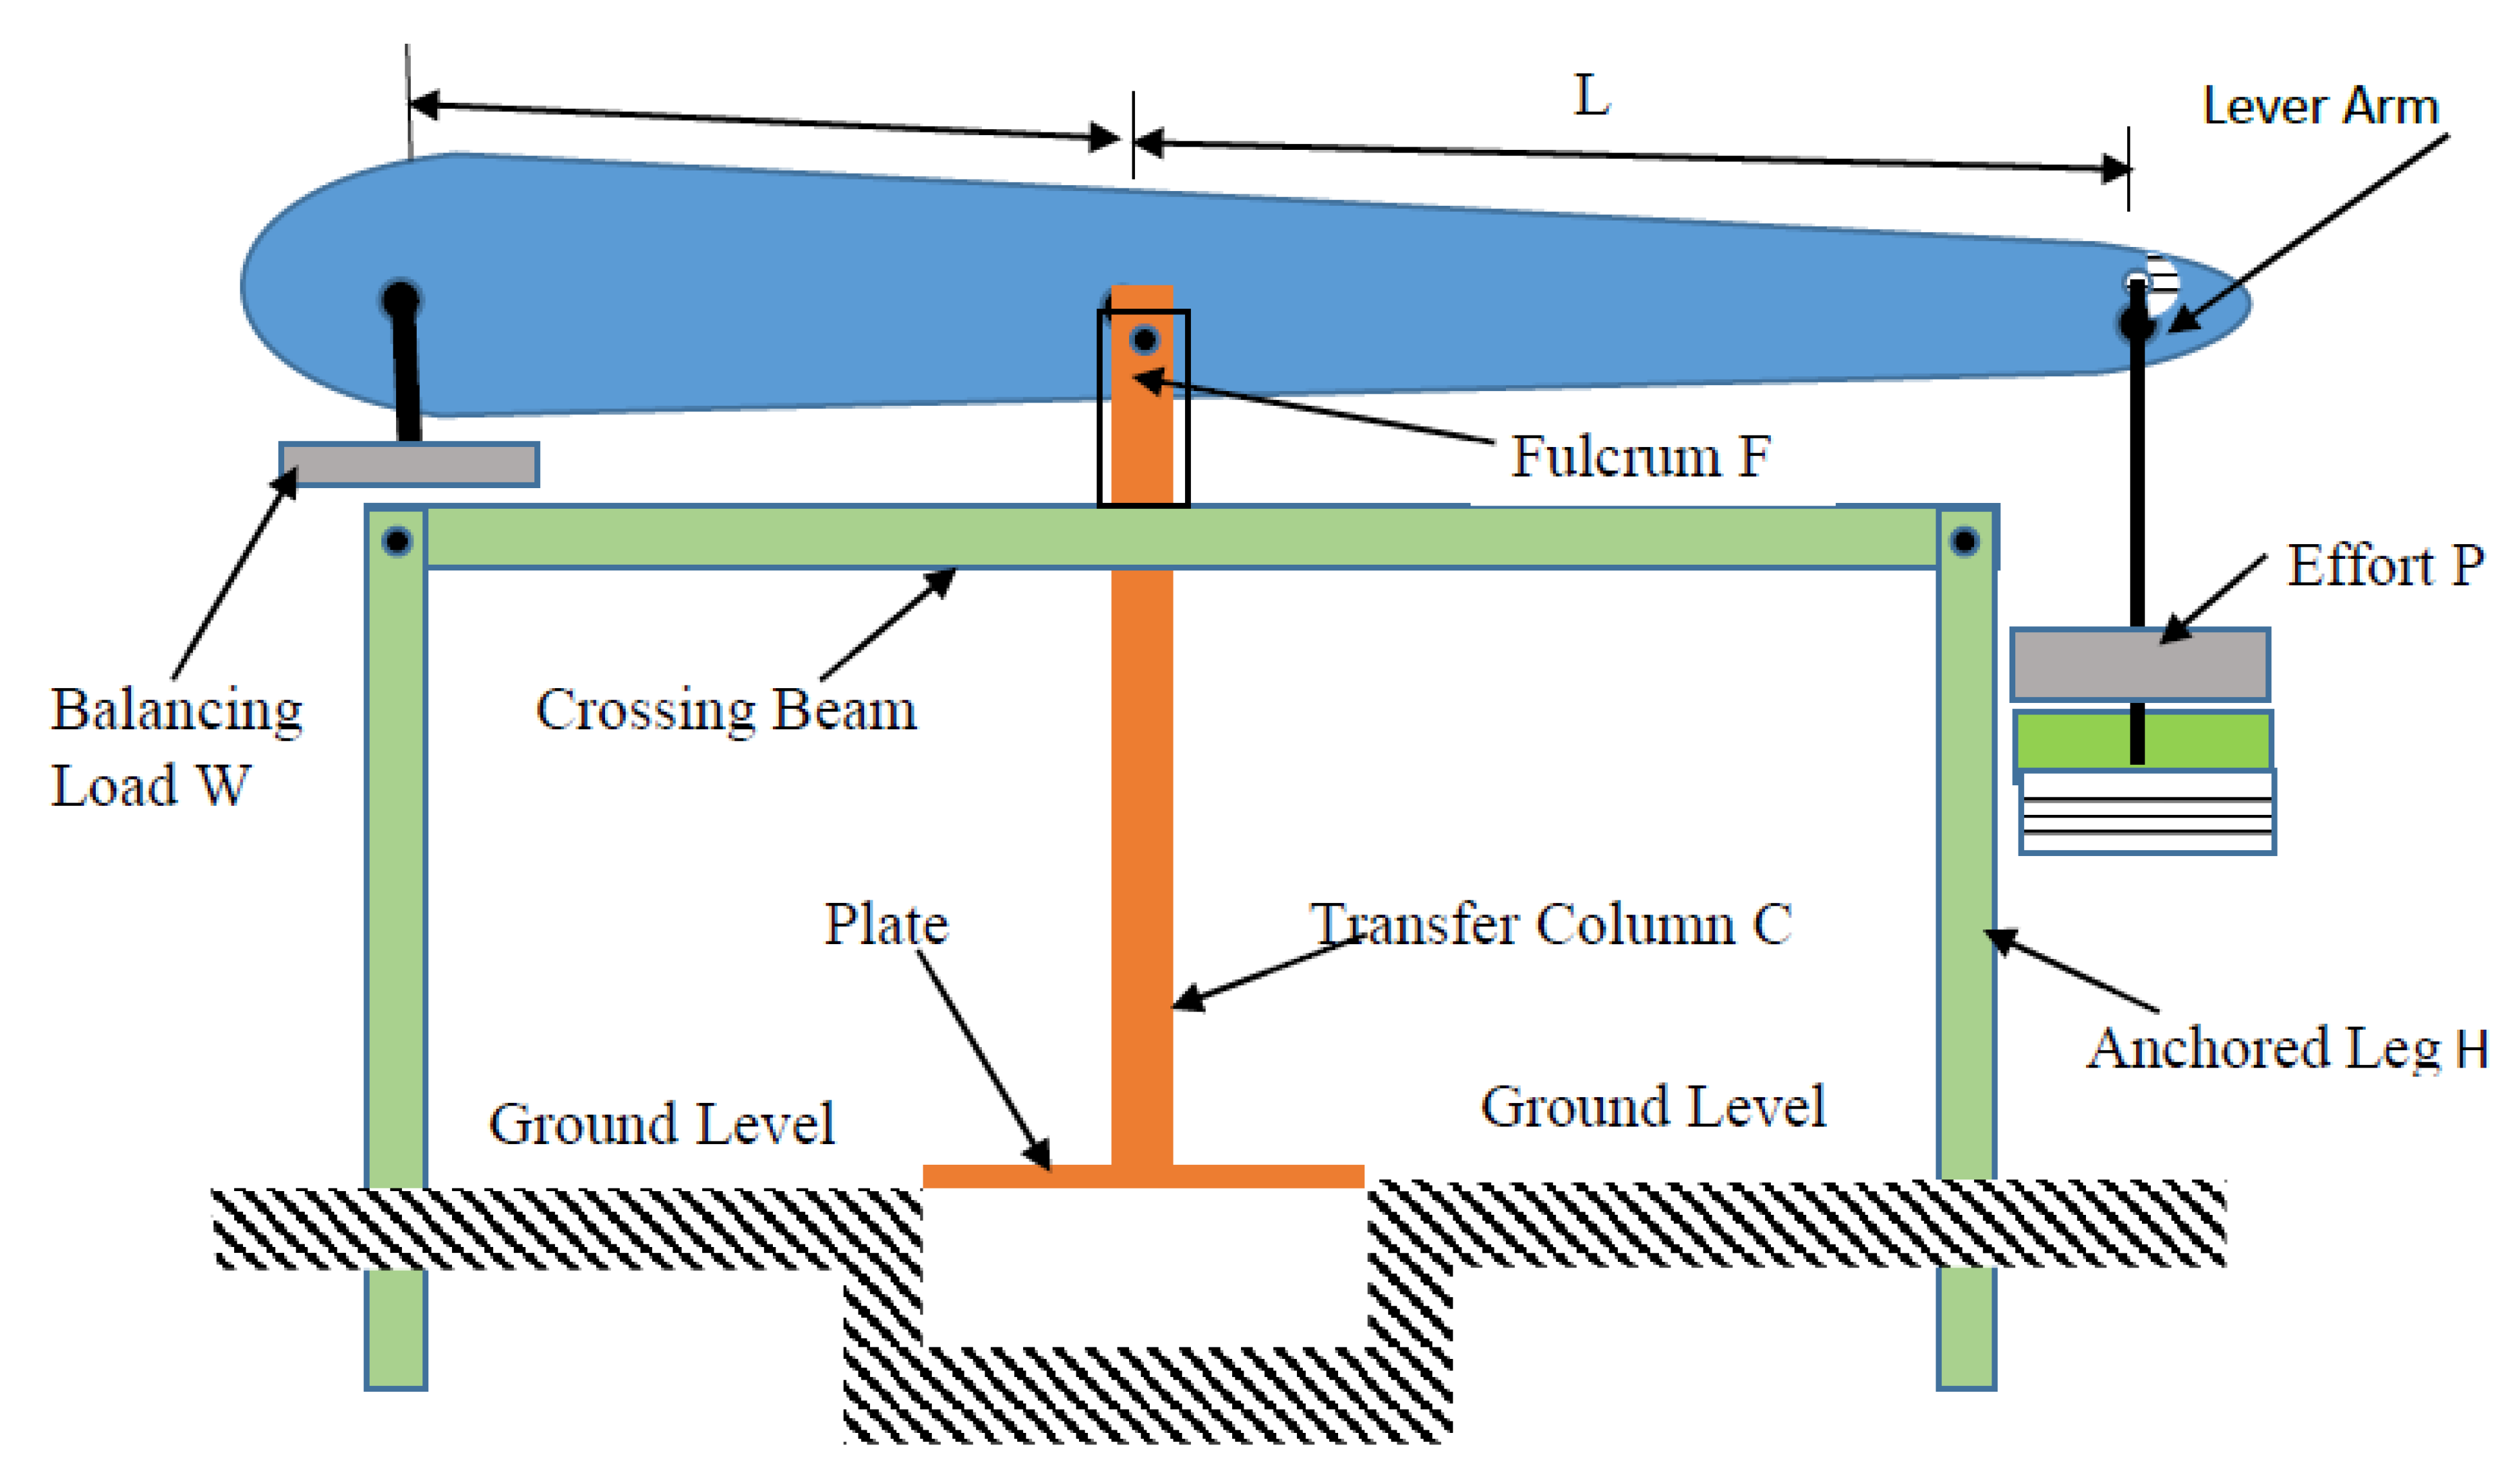
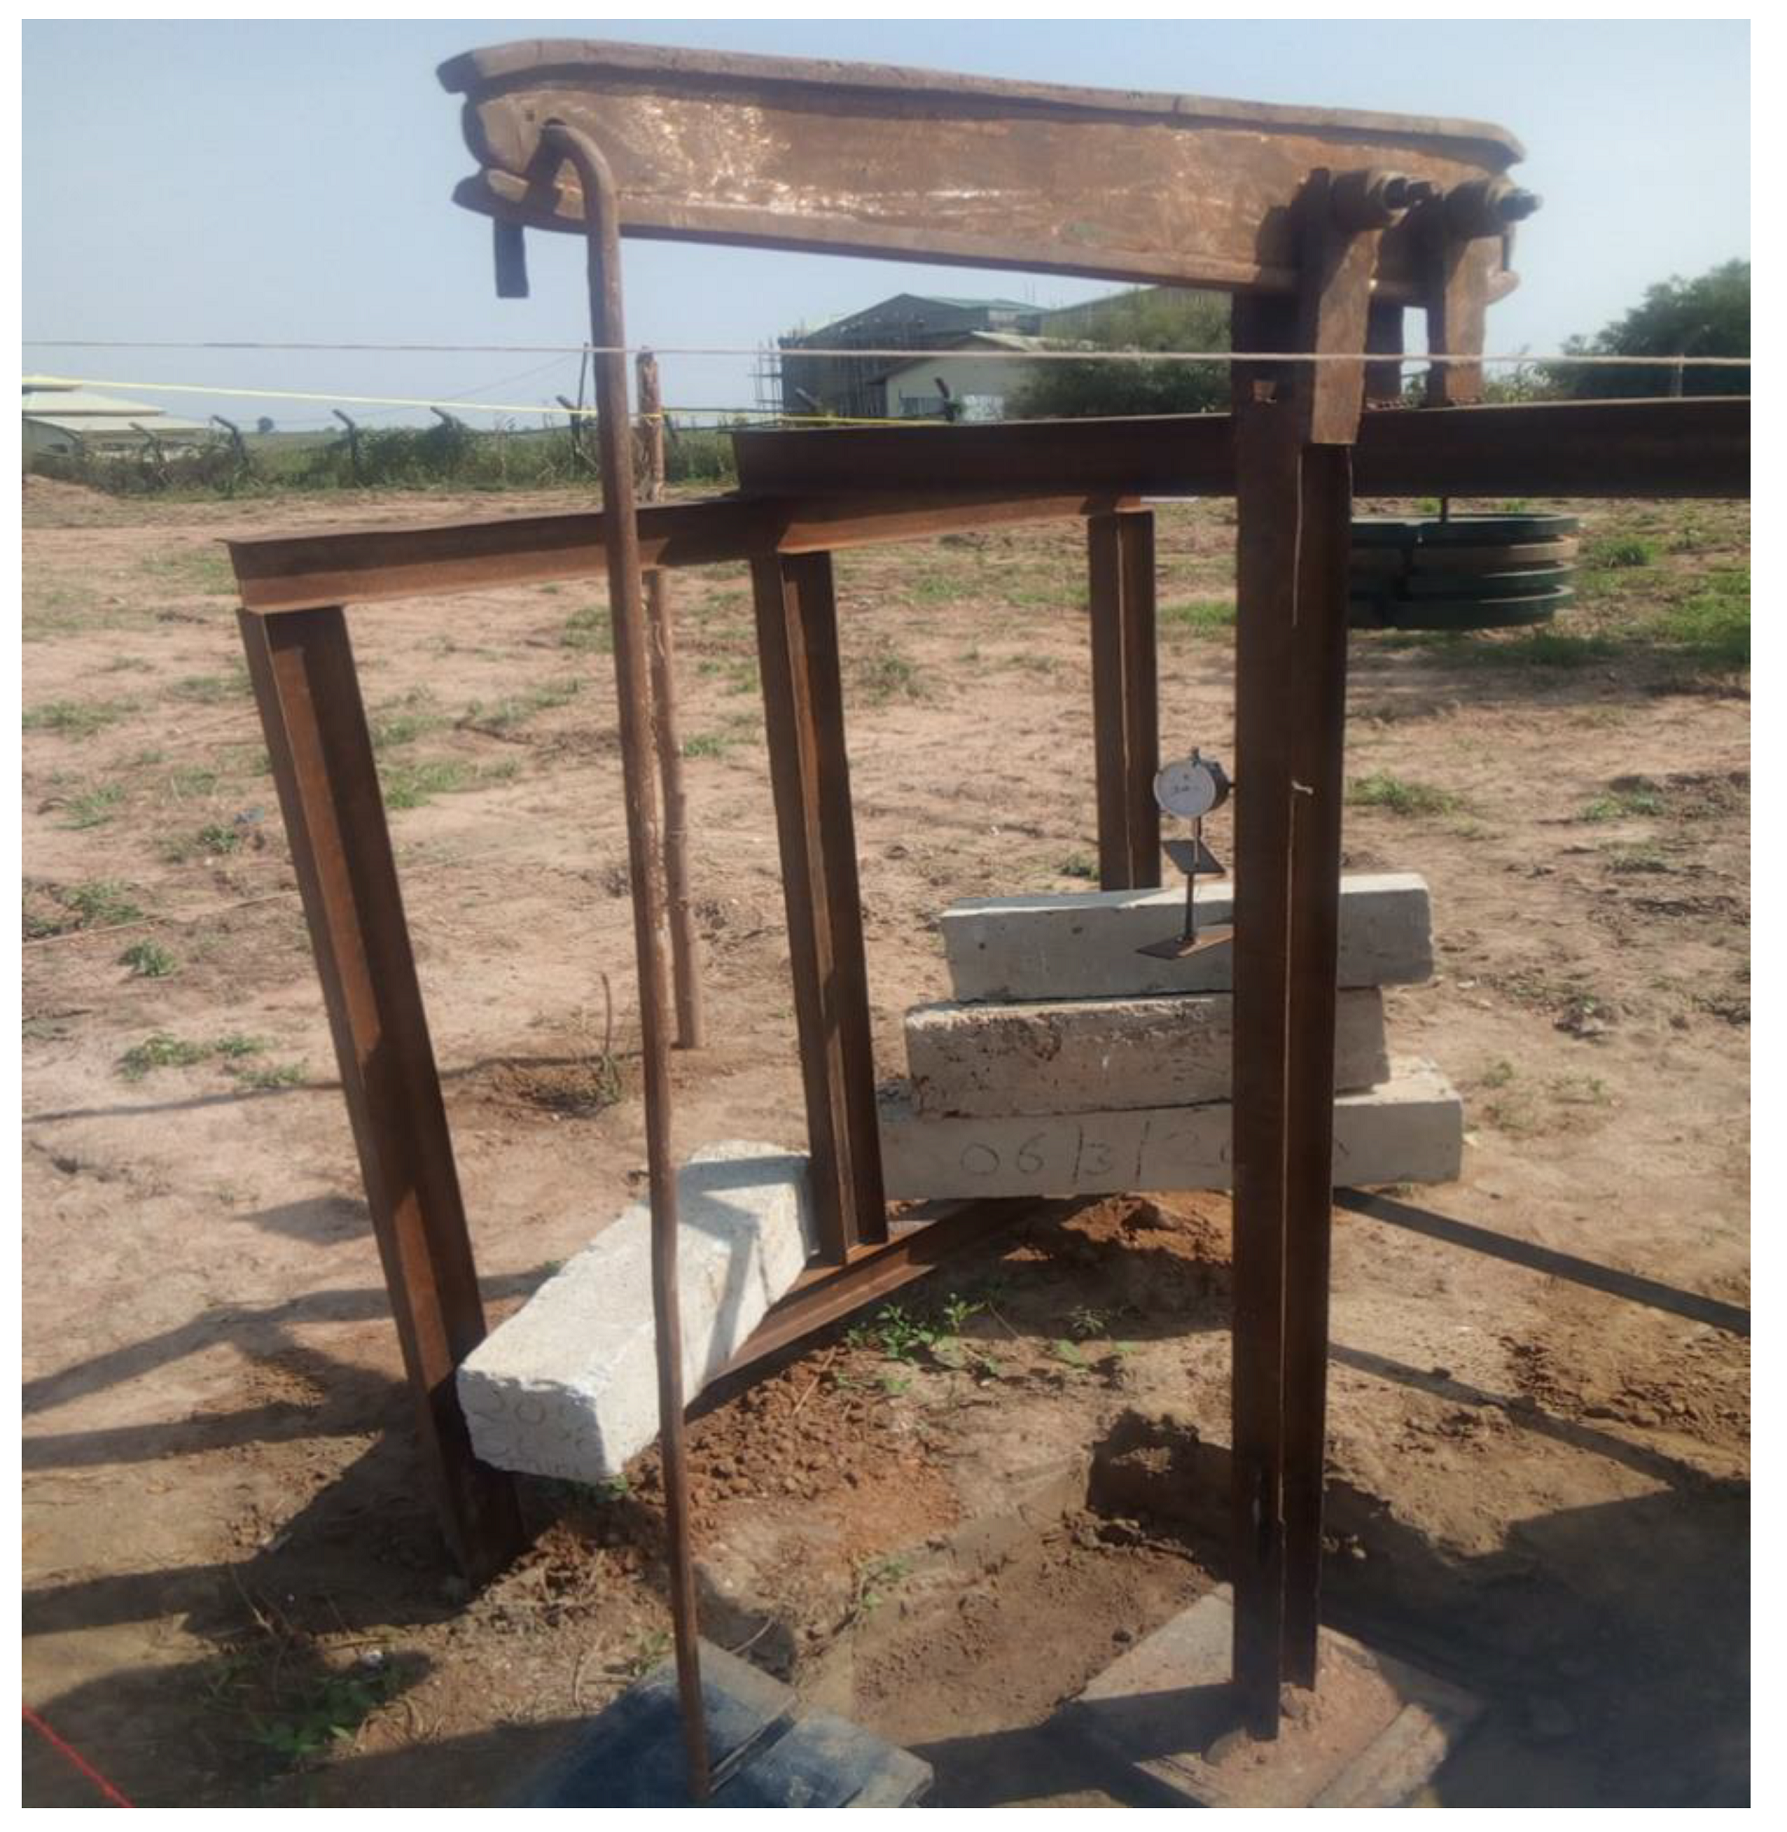
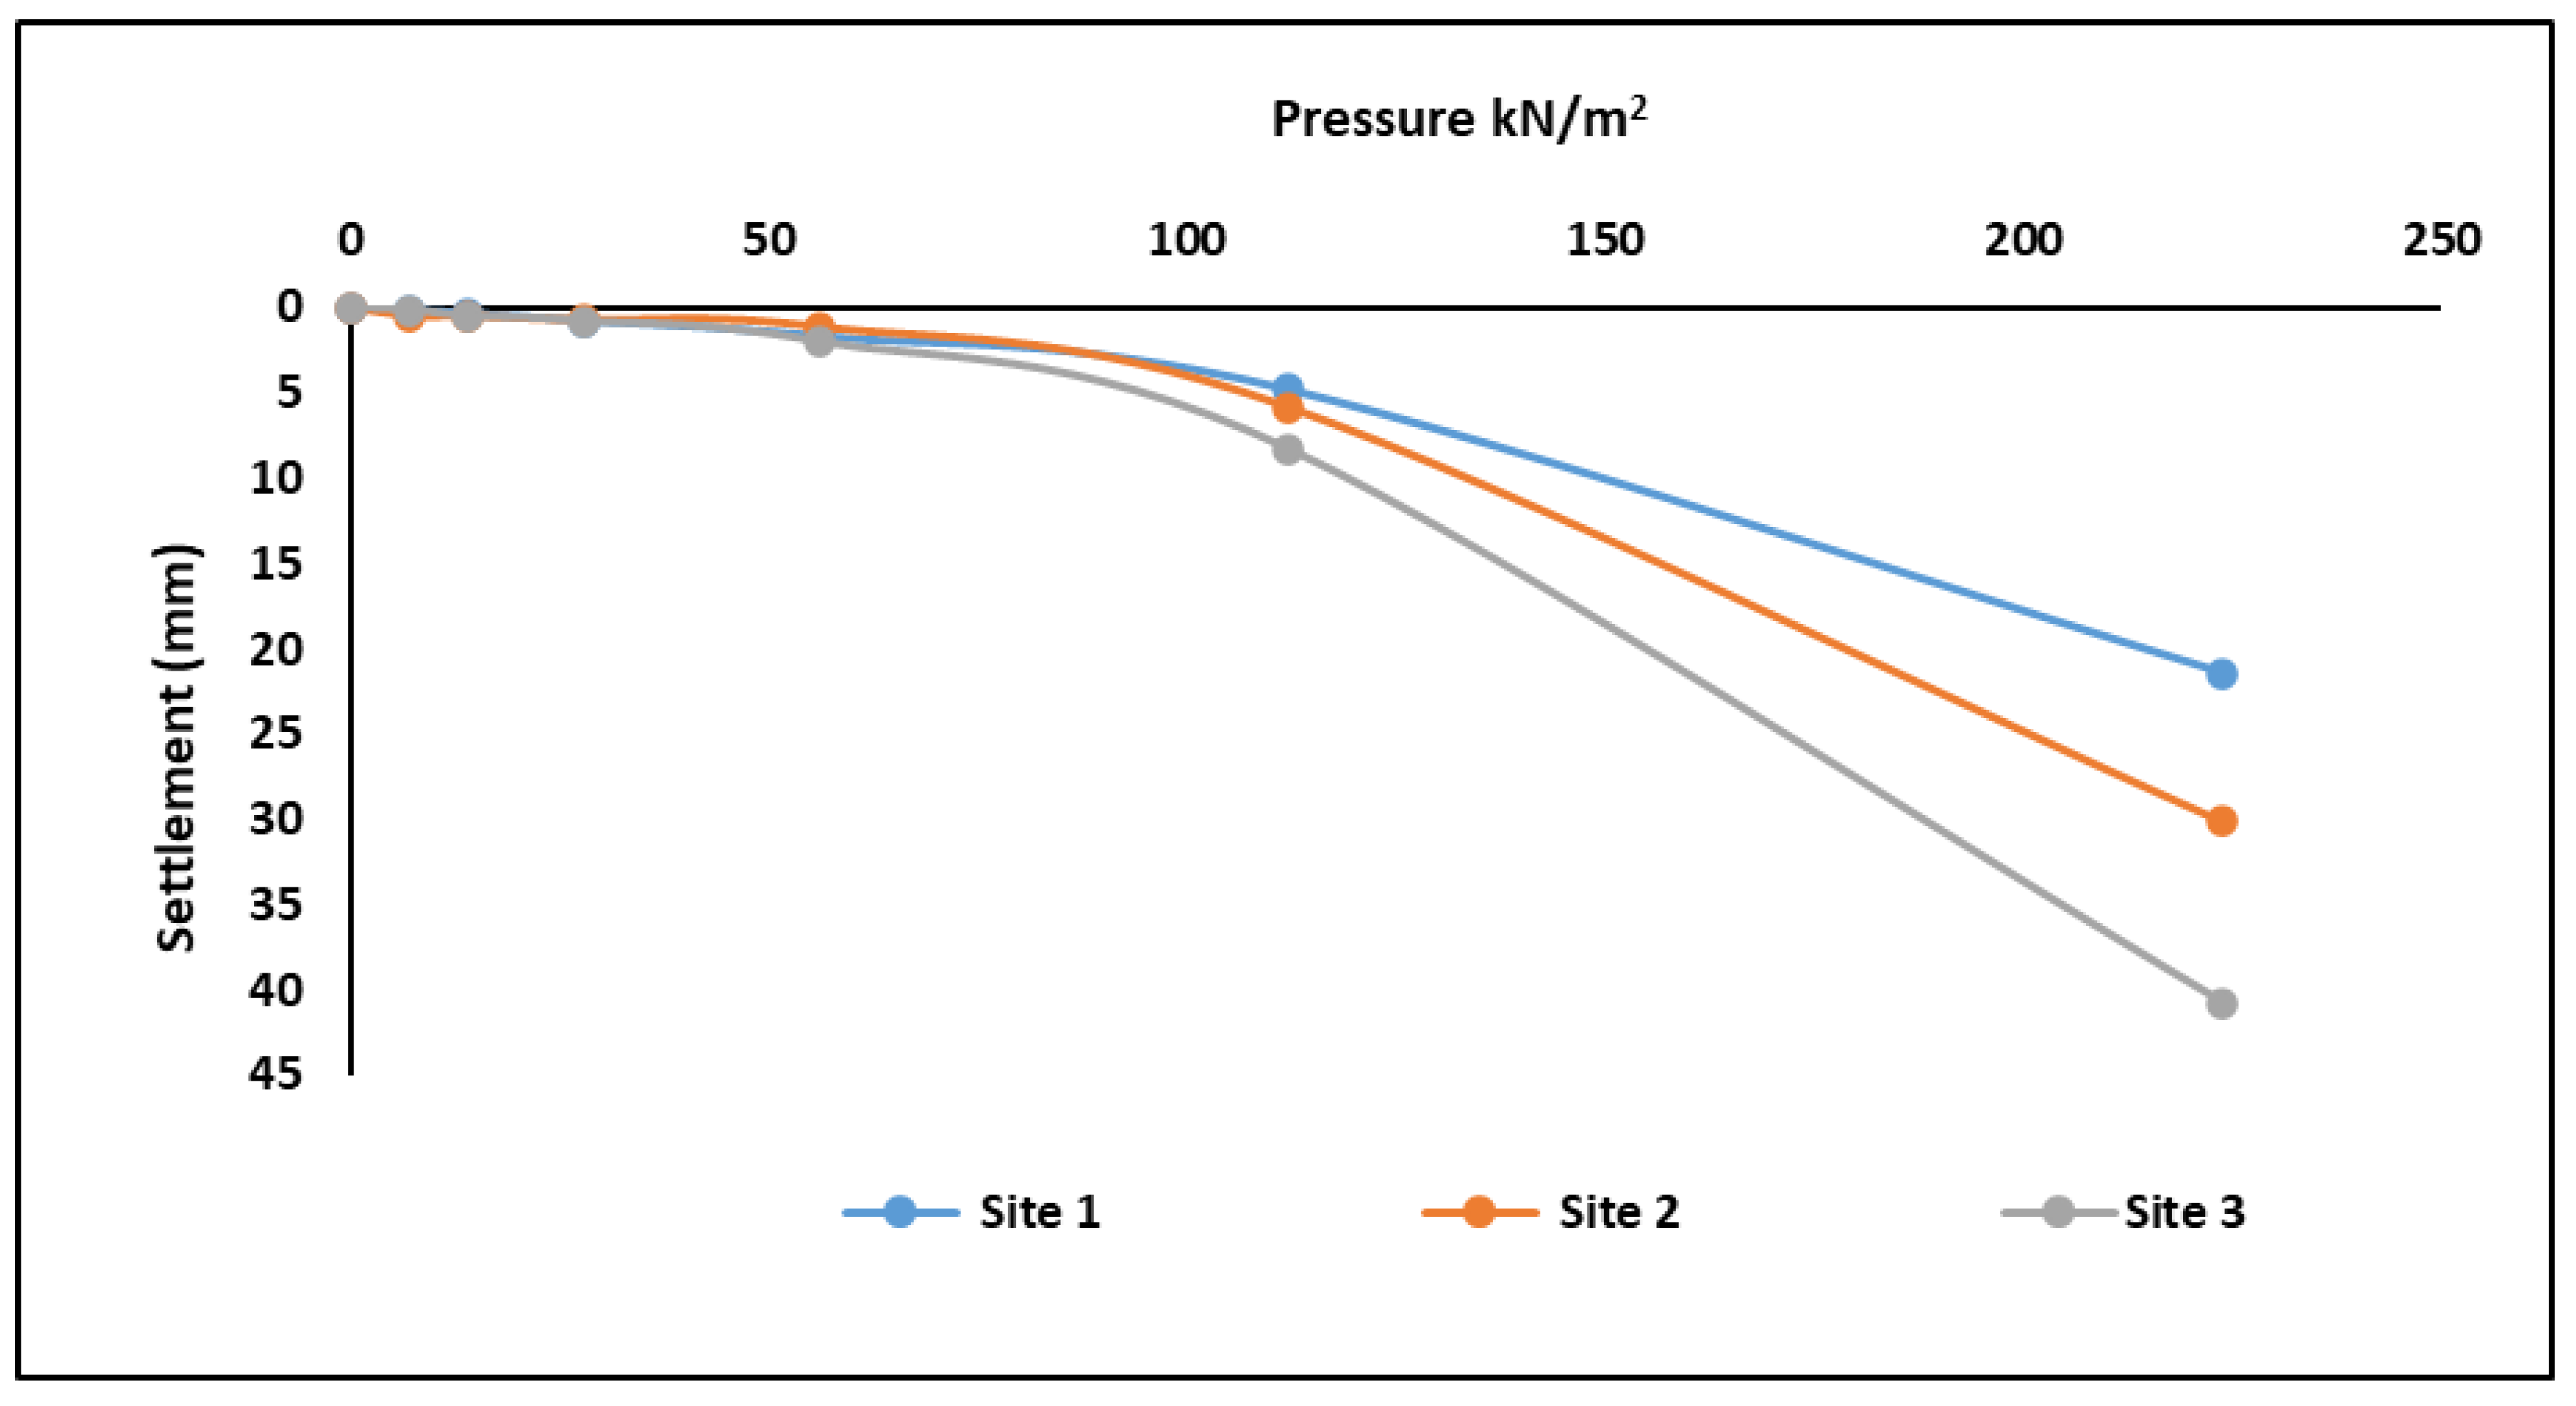
4.3. Innovative Field Plate Load Test

The results from the graph from the innovative field plate load test (IPLT) shows that Site 2 yields a settlement of 10 mm, followed by Site 3, with a settlement of 17.5 mm. Site 1 yields a settlement of 12. 5 mm, as seen in Figure 9. The results of the innovative test are in agreement with the results obtained by [36]. The corresponding allowable bearing capacity shows that Site 2 has an allowable bearing capacity of 24.5 kN/m2, Site 1 has an allowable bearing capacity of 22.5 kN/m2 and Site 3 has the lowest allowable bearing capacity of 21.75 kN/m2 [10,37], as presented in Table 6.

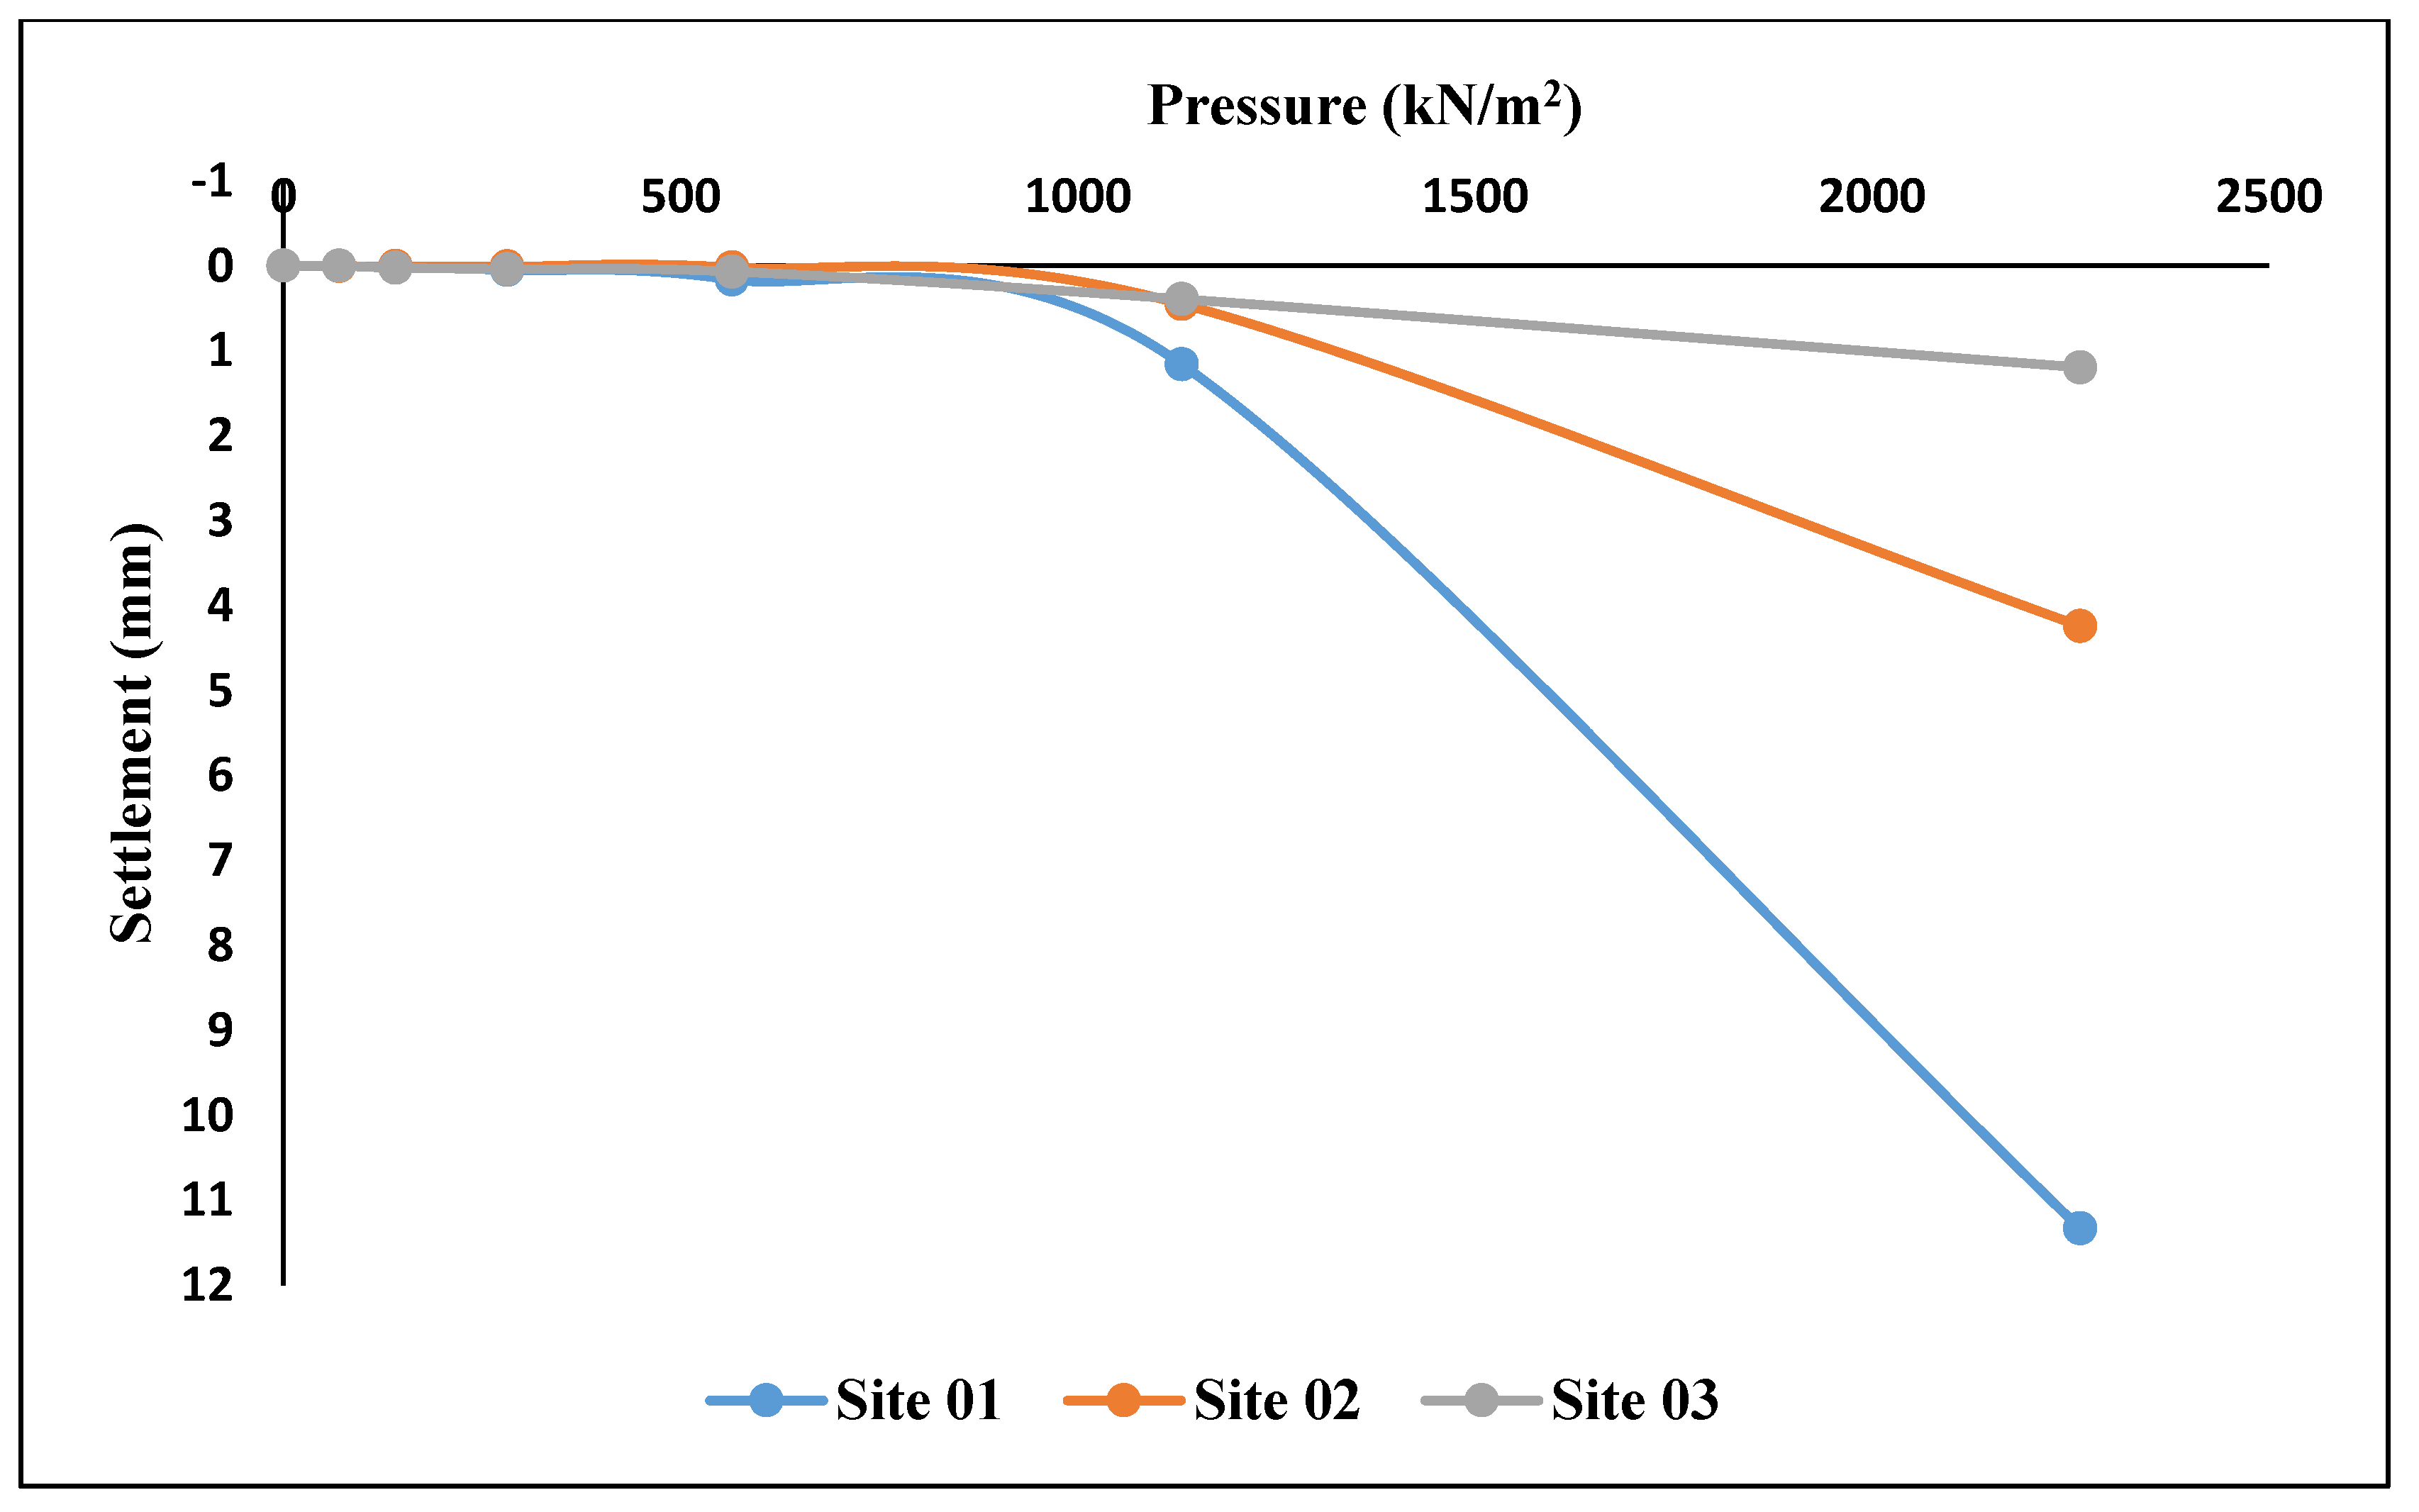
4.4. PLAXIS Software

The allowable bearing capacities of the soil from Site 01 using the PLAXIS model (Numerical Plate Load Test NPLT) was 275 kN/m2 and the corresponding settlement was 2.0 mm. The graph is shown in Figure 10, as reported by [38]. The settlement is below the 25 mm minimum as recommended for building structures in [36]. Furthermore, Site 02 soil gives an allowable bearing capacity of 300 kN/m2 and the corresponding settlement 0.75 mm, using Equation 1 and Equation 2, respectively. The graph is presented in Figure 10, and the findings are in agreement with [29,39]. The settlement is far below the 25 mm minimum as recommended for building structures in [36]. However, allowable bearing capacity and settlement using numerical analysis (PLAXIS 3D) was 163 kN/m2 and 0.3 mm, respectively. The graph presented in Figure 7 is in line with the findings of [40,41,42,43,44,45]. The results of the bearing capacities for the four different test methods are presented in Figure 8 with Numerical Plate Load Test (NPLT) PLAXIS showing the highest allowable bearing capacity. The results of the corresponding settlements for the four different test methods are presented in Table 7, with the laboratory test method having the highest settlement and the PLAXIS method having the lowest settlement.
The settlement of the conventional method in Table 4 was very small when compared with the innovative plate load test in Table 5, which was due to the intensity and the duration of the test conducted. This is because the duration for the conventional test was short and, hence, resulted in a minimal settlement, while the values of the settlement recorded using innovative plate load equipment was due to the long duration test, which allows for expulsion of pore water in clay soil [46,47,48,49,50,51,52]. Thus, expulsion of pore water from the soil was not part of the scope of the research [53]. However, the conventional method of determining the allowable bearing capacity using the plate load test yielded a higher bearing capacity, which was attributed to a large sudden load applied to the soil through the truck load, which was not maintained for a long time. The innovative plate load test load intensity was not large when compared with the conventional method, but the load was applied to the soil gradually in small to the higher loads, which resulted in lower bearing capacity values and higher settlement, as presented in Table 5.

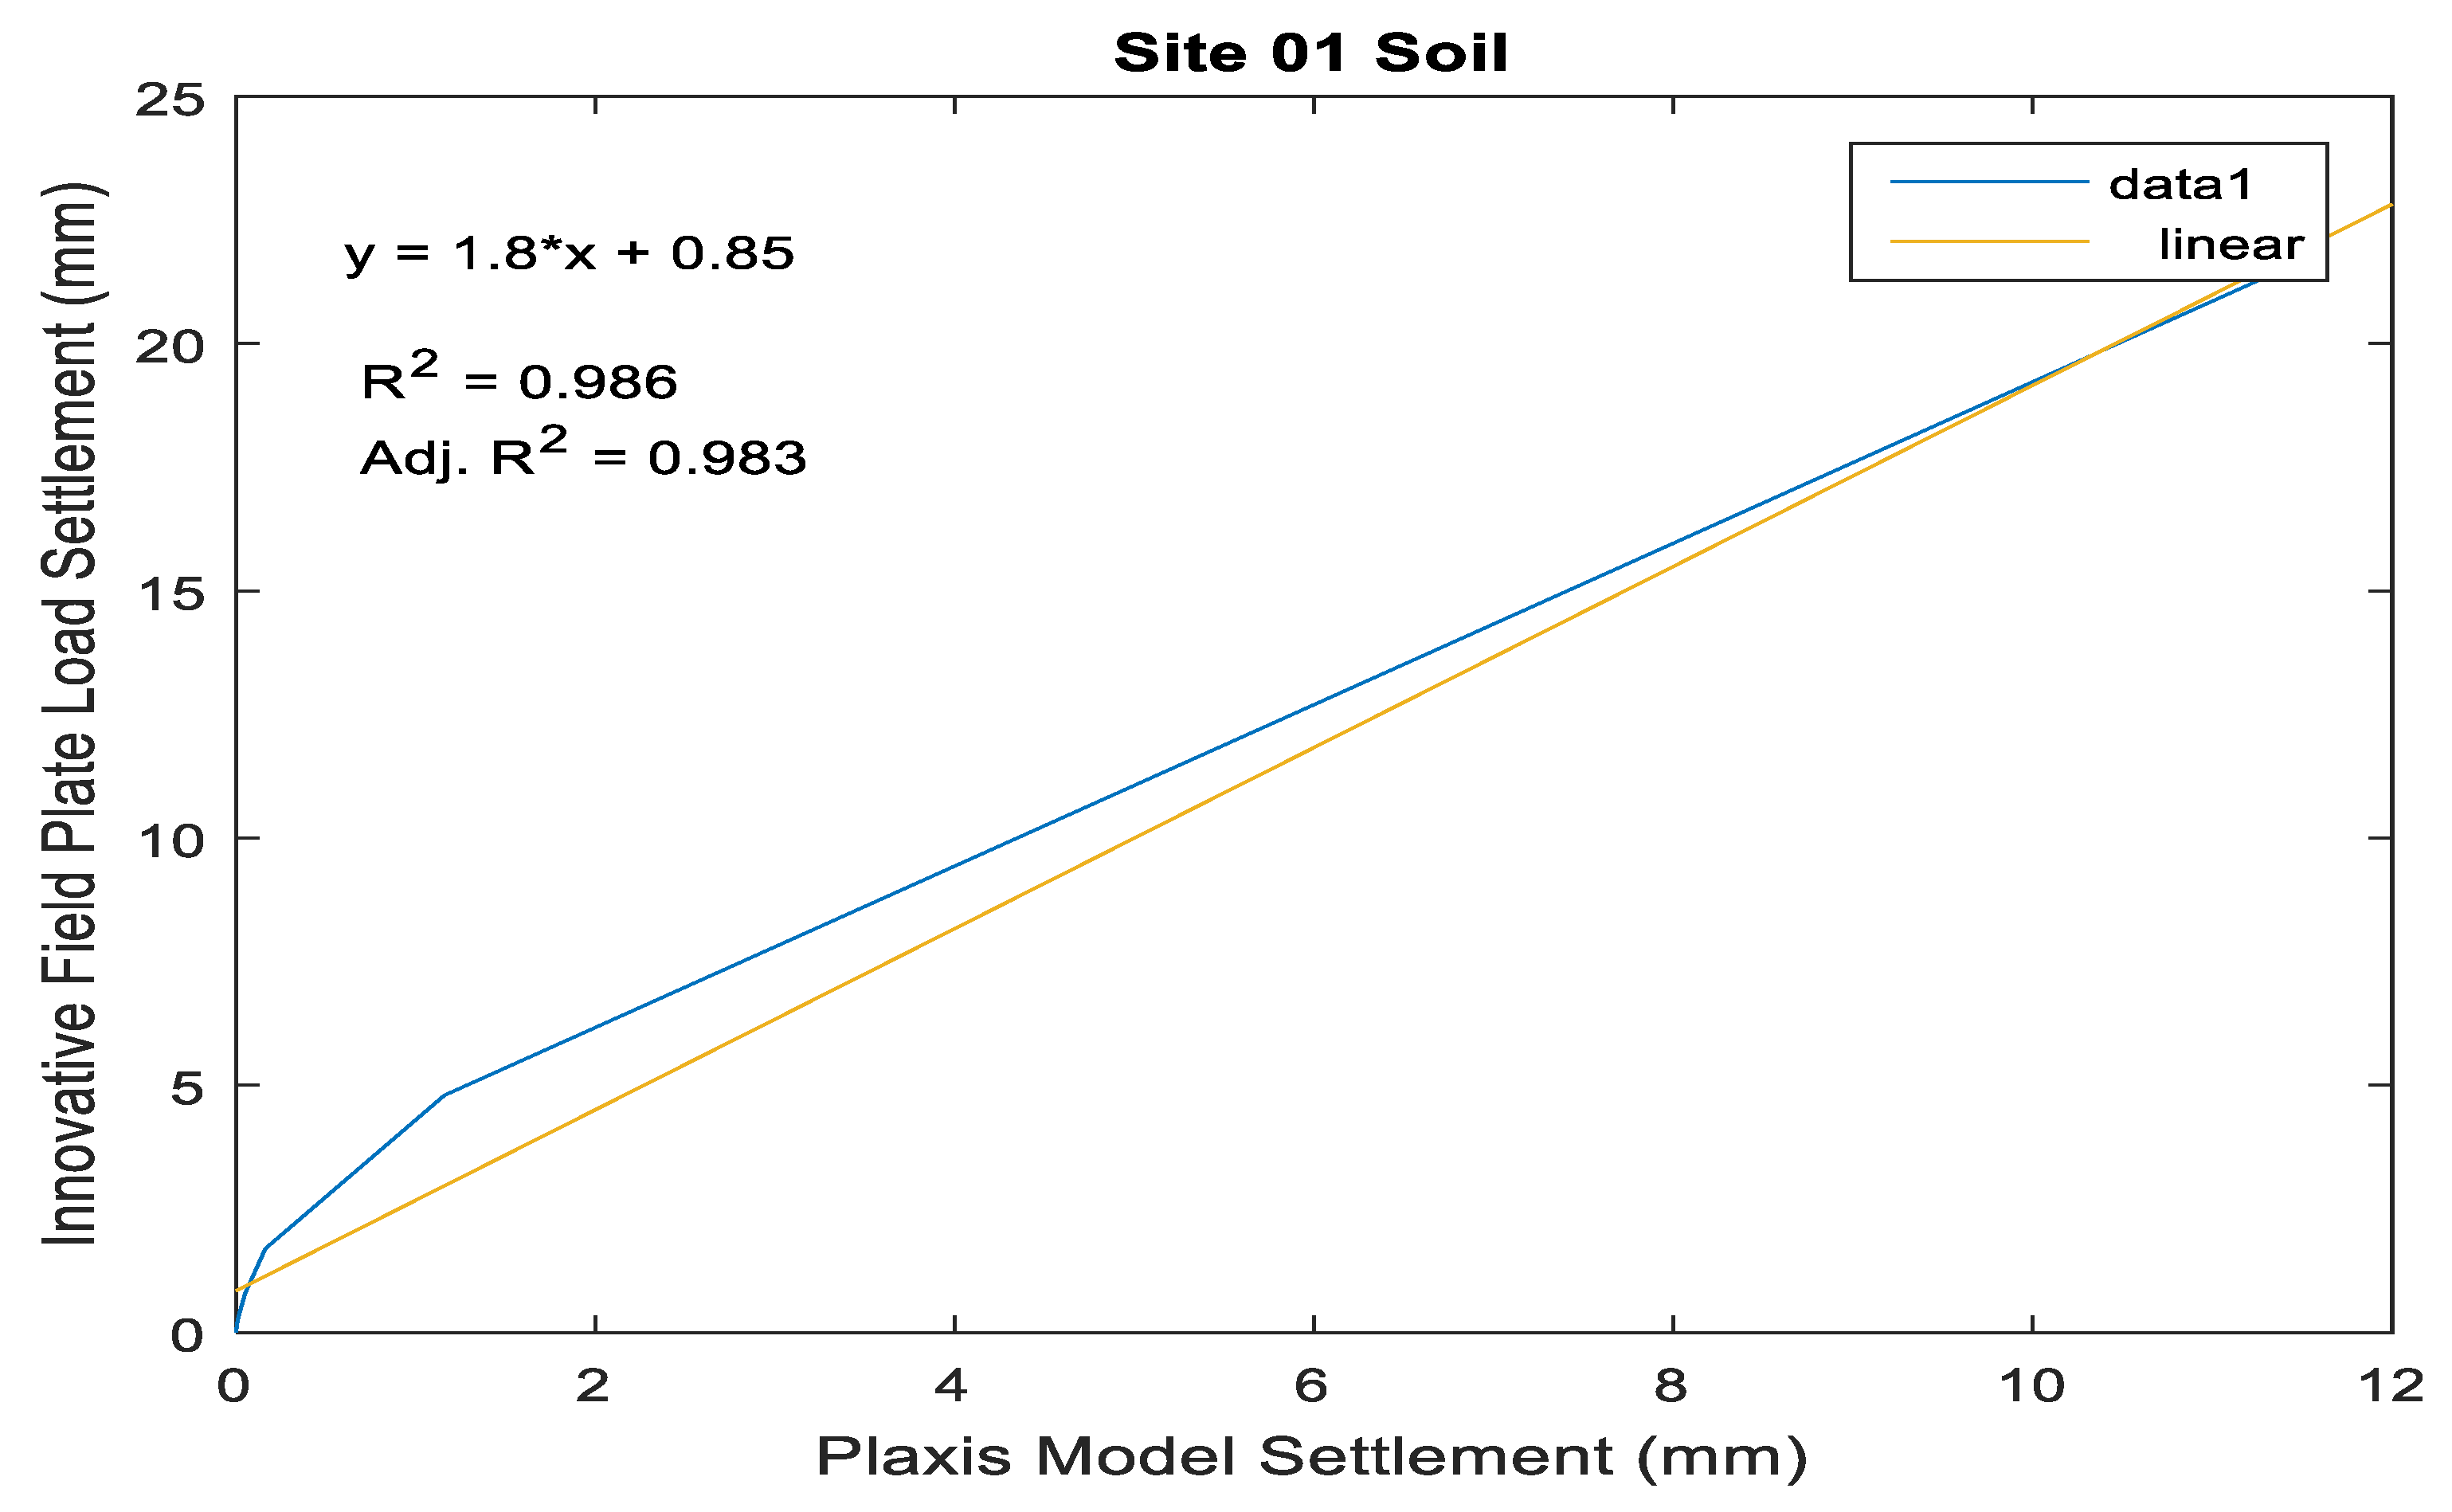
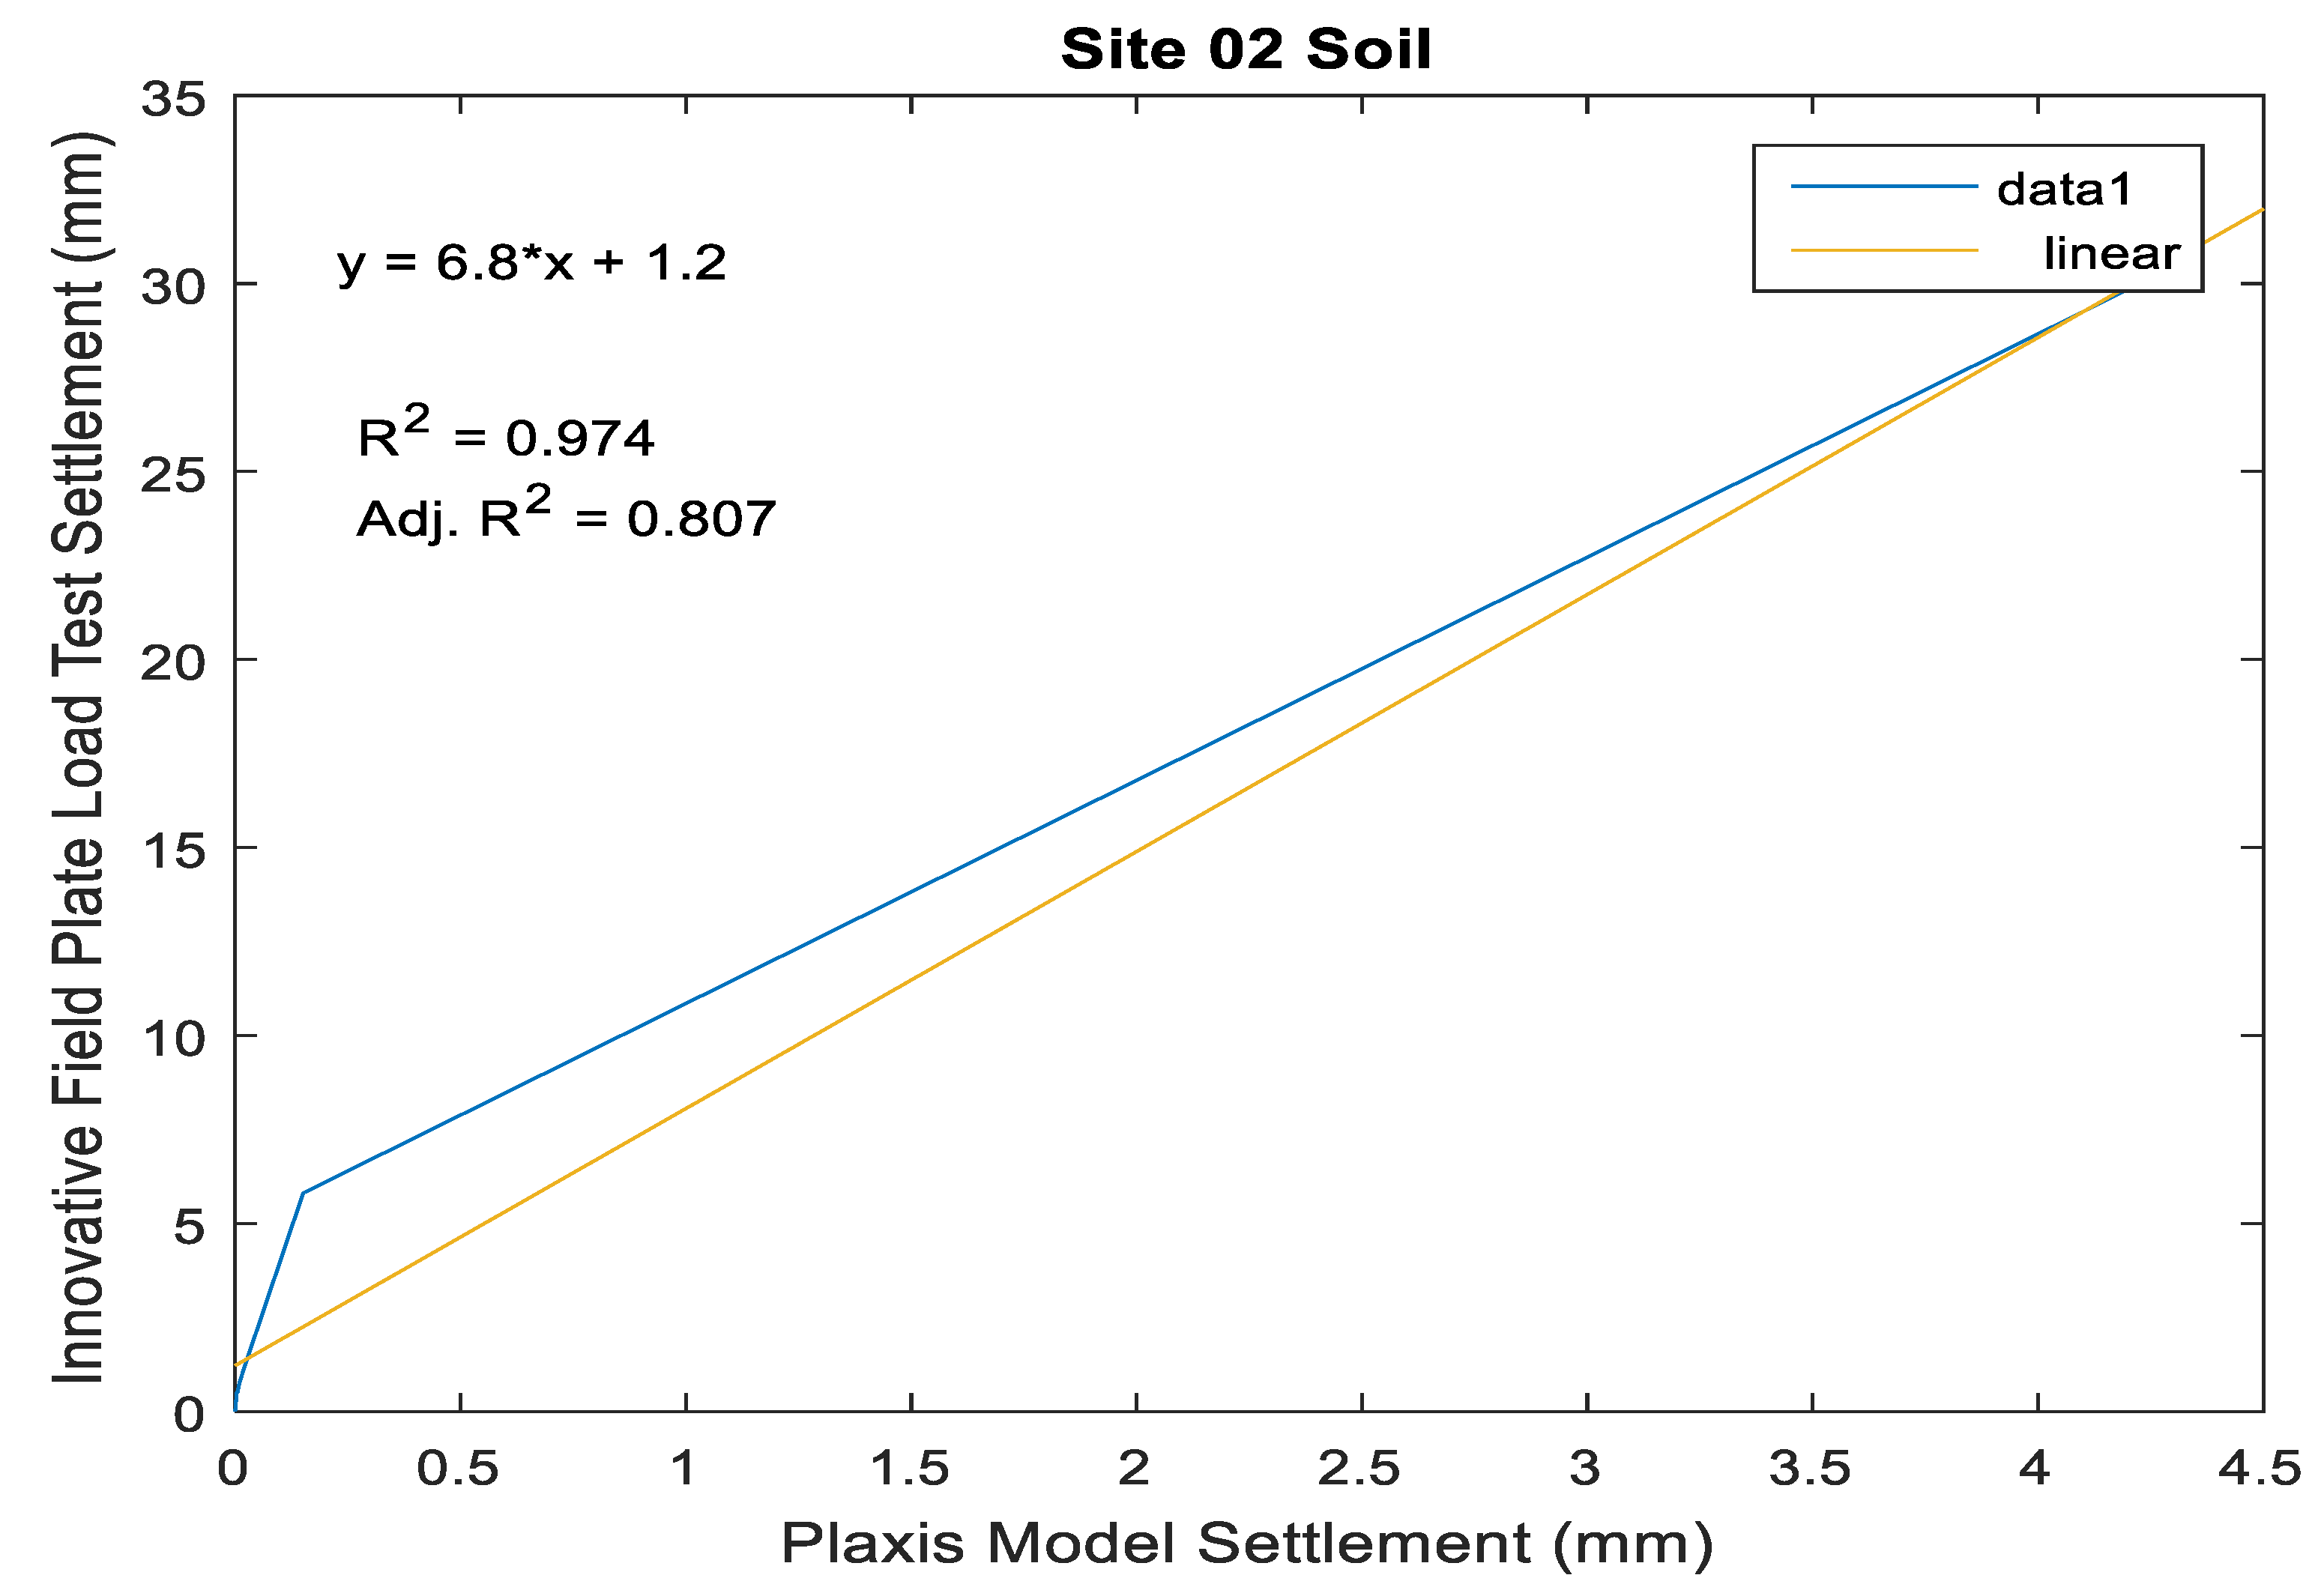
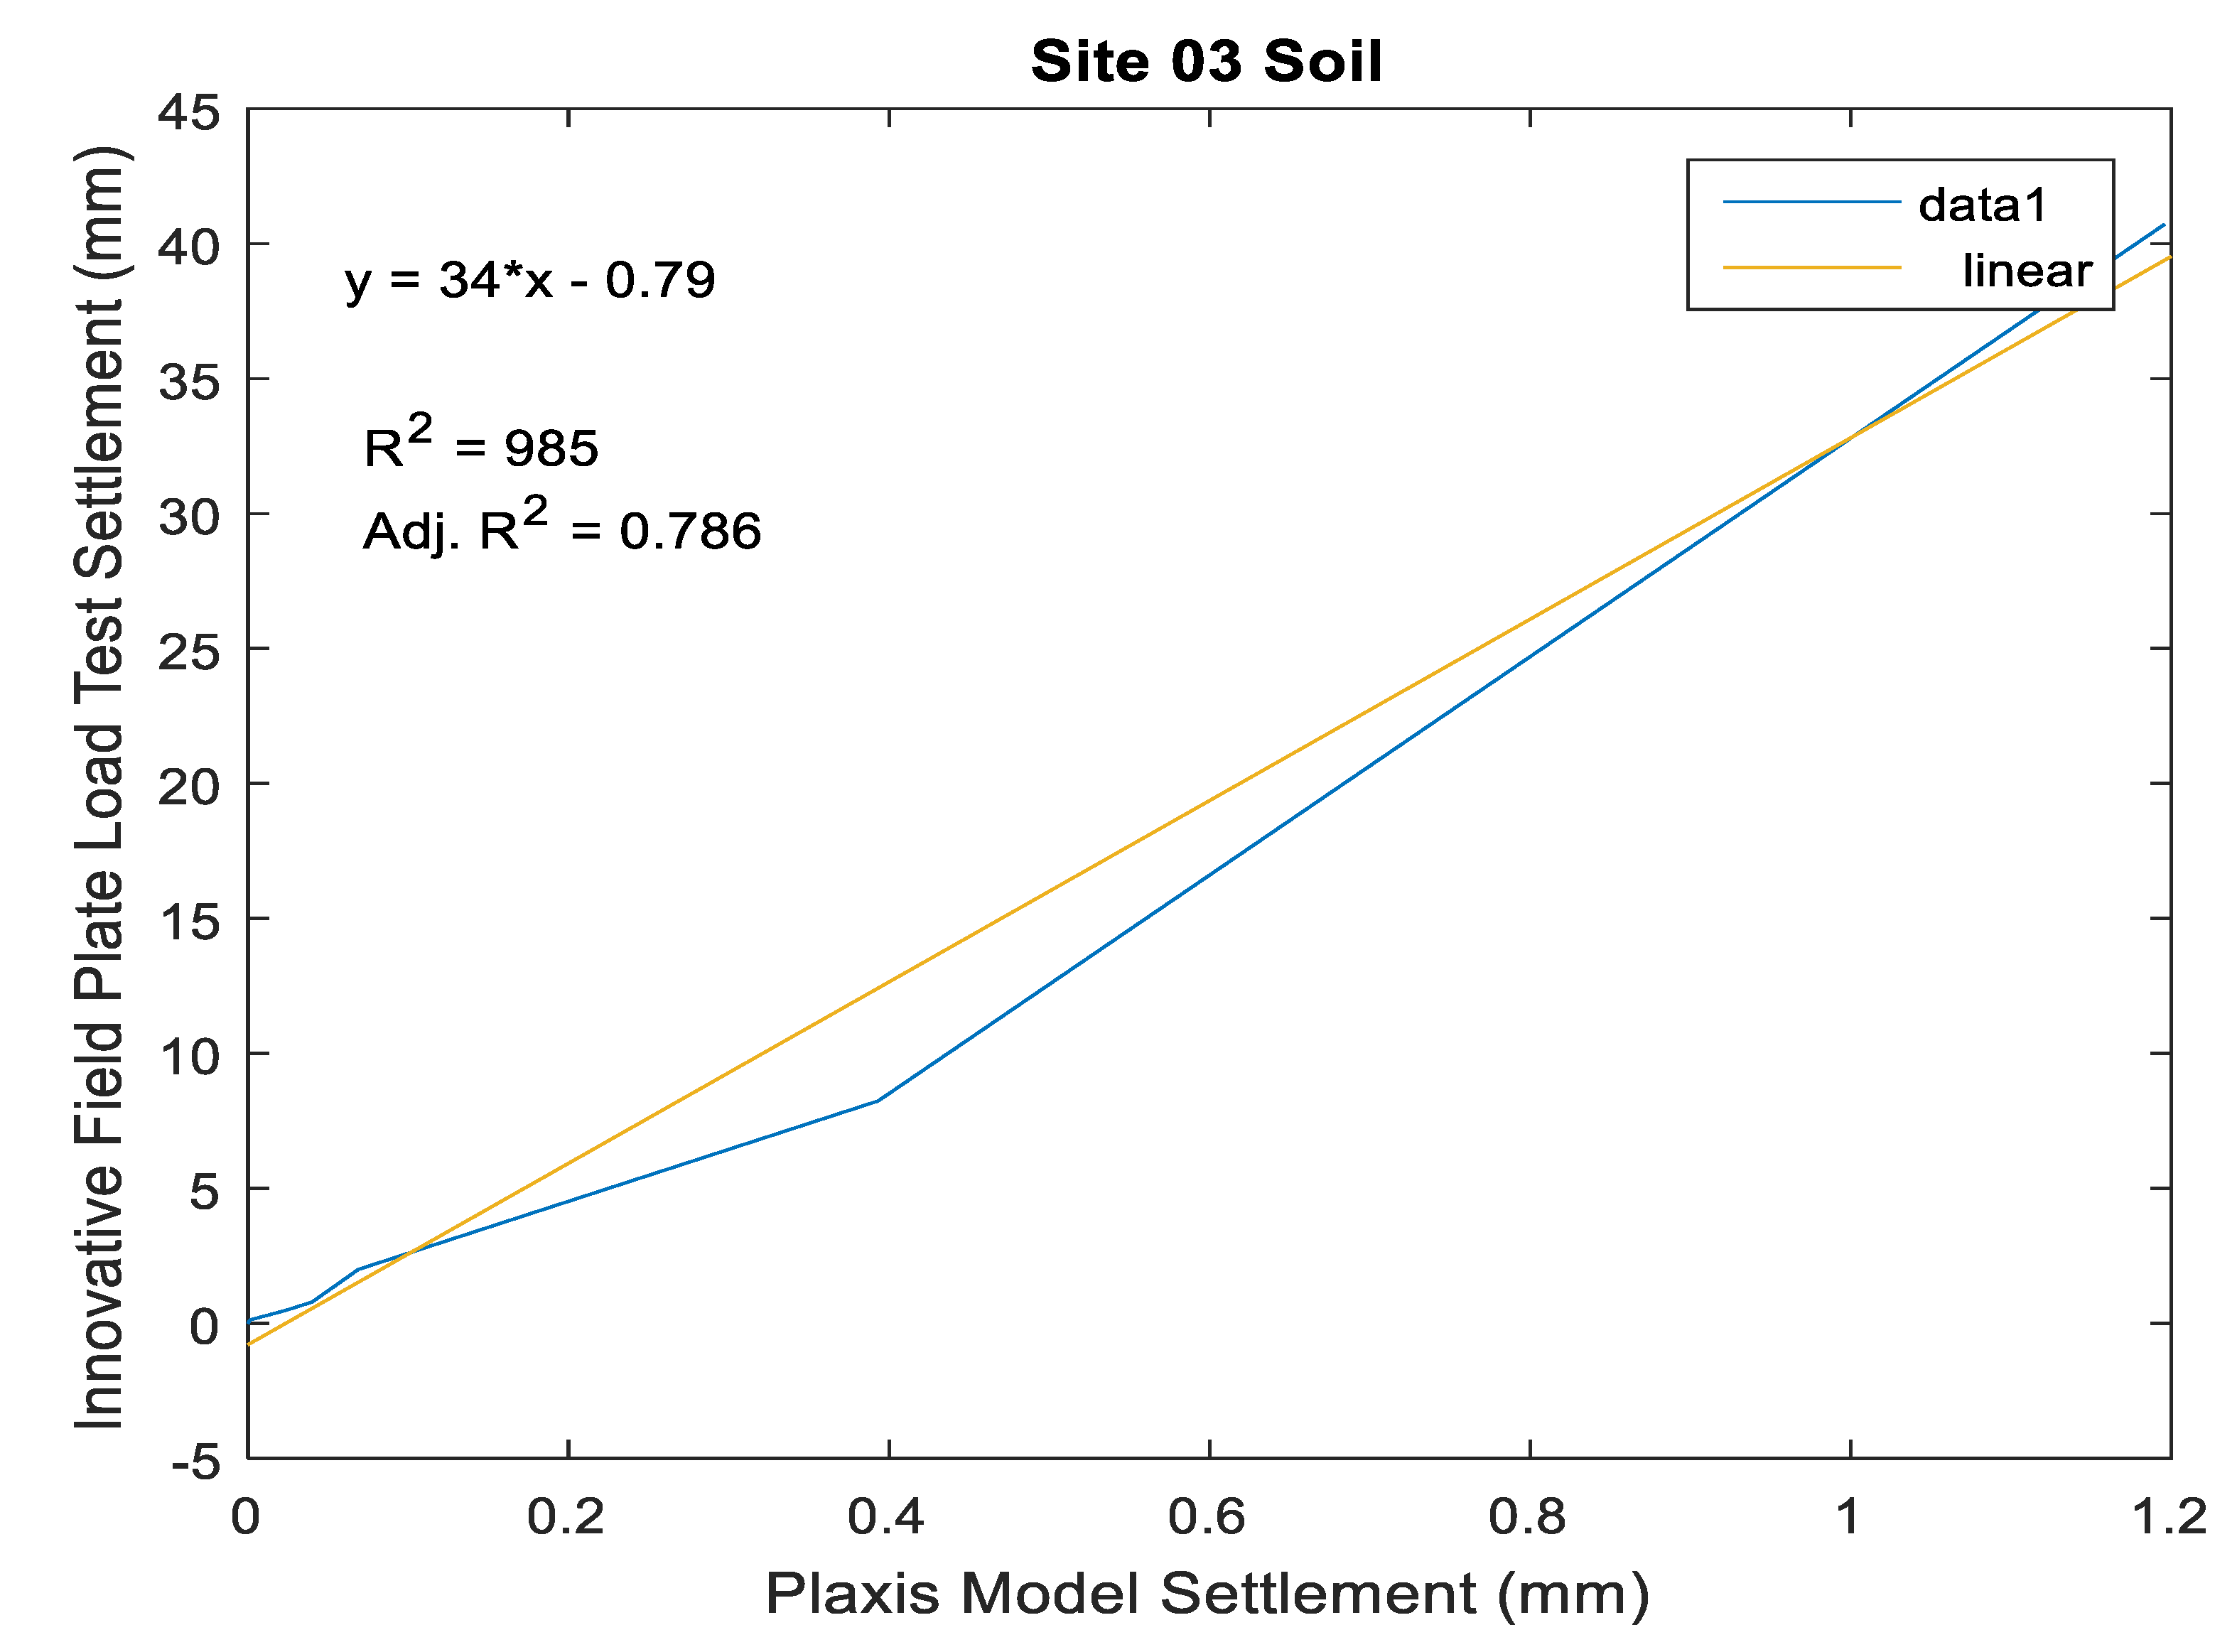
Correlation of Field Plate load Test Device with the PLAXIS Model Numerical Simulation

The PLAXIS models depicted in Figure 13 were compared with the experimental results of the IPLTD to achieve a more effective investigation. The results showed evidence that the consistency between the observed behaviour and that of the predicted one by the PLAXIS 3D (Numerical Plate Load Test) model yields relatively high correlation coefficients of (R2 = 0.986) and a linear equation (Equation (3)) expressing the correlations between the independent variable, X, and the dependent variable, Y. The findings are in agreement with [54,55,56,57].
y = 1.8 x + 0.85
As seen in Figure 14, the PLAXIS models were again compared with the experimental results of the IPLTD. The results showed evidence that the consistency between the observed behaviour and the predicted ones in the Numerical Plate Load Test model yields correlation coefficients (R2 = 0.974) lower than that of Figure 11 and the linear equation expressed in Equation (4) [58].
y = 6.8 x + 1.2
However, comparing the Finite Element Model with the experimental results of IPLTD Figure 15 yielded good correlation coefficients of (R2 = 0.985) when compared with the results from Figure 12 and Figure 13, while the linear expression given in Equation (5) was reported by [59].
y = 34 x 0.79

4.5. Advantages of the Proposed Innovated Field Plate Load Test

The advantages of the proposed innovative field plate load testing equipment are:
i.
The equipment is portable, as it can be dismantled and moved from one position to the other even where access to the site is difficult.
ii.
Few numbers of personnel, i.e., not more than two people, can set-up and operate the equipment.
iii.
It has a great advantage when used on saturated clay deposits as it will allow for maximum deformation after dissipation of pore water pressure for each load application before increment of next loading.
iv.
Multiple plate load testing can be set-up simultaneously in multiple foundation trenches and the readings recorded simultaneously over the required period of time.

4.6. Limitations of the Proposed Innovated Field Plate Load Test

The major limitation in the proposed Innovative Field Plate Loading test is that the equipment is suitable where low bearing capacity not exceeding 250 kN/m2 is required.

5. Conclusions

The following conclusions were drawn:
  • The proposed innovative load bearing testing equipment was designed and fabricated to standard. All the component steel members were observed to resist maximum loading during testing without deformation or failure of any of the steel members.
  • The soils from the three trial pits were classified as silt of low plasticity (ML), clay of low plasticity (CL) and clay of low plasticity (CL) for Trial pits 1, 2 and 3, respectively.
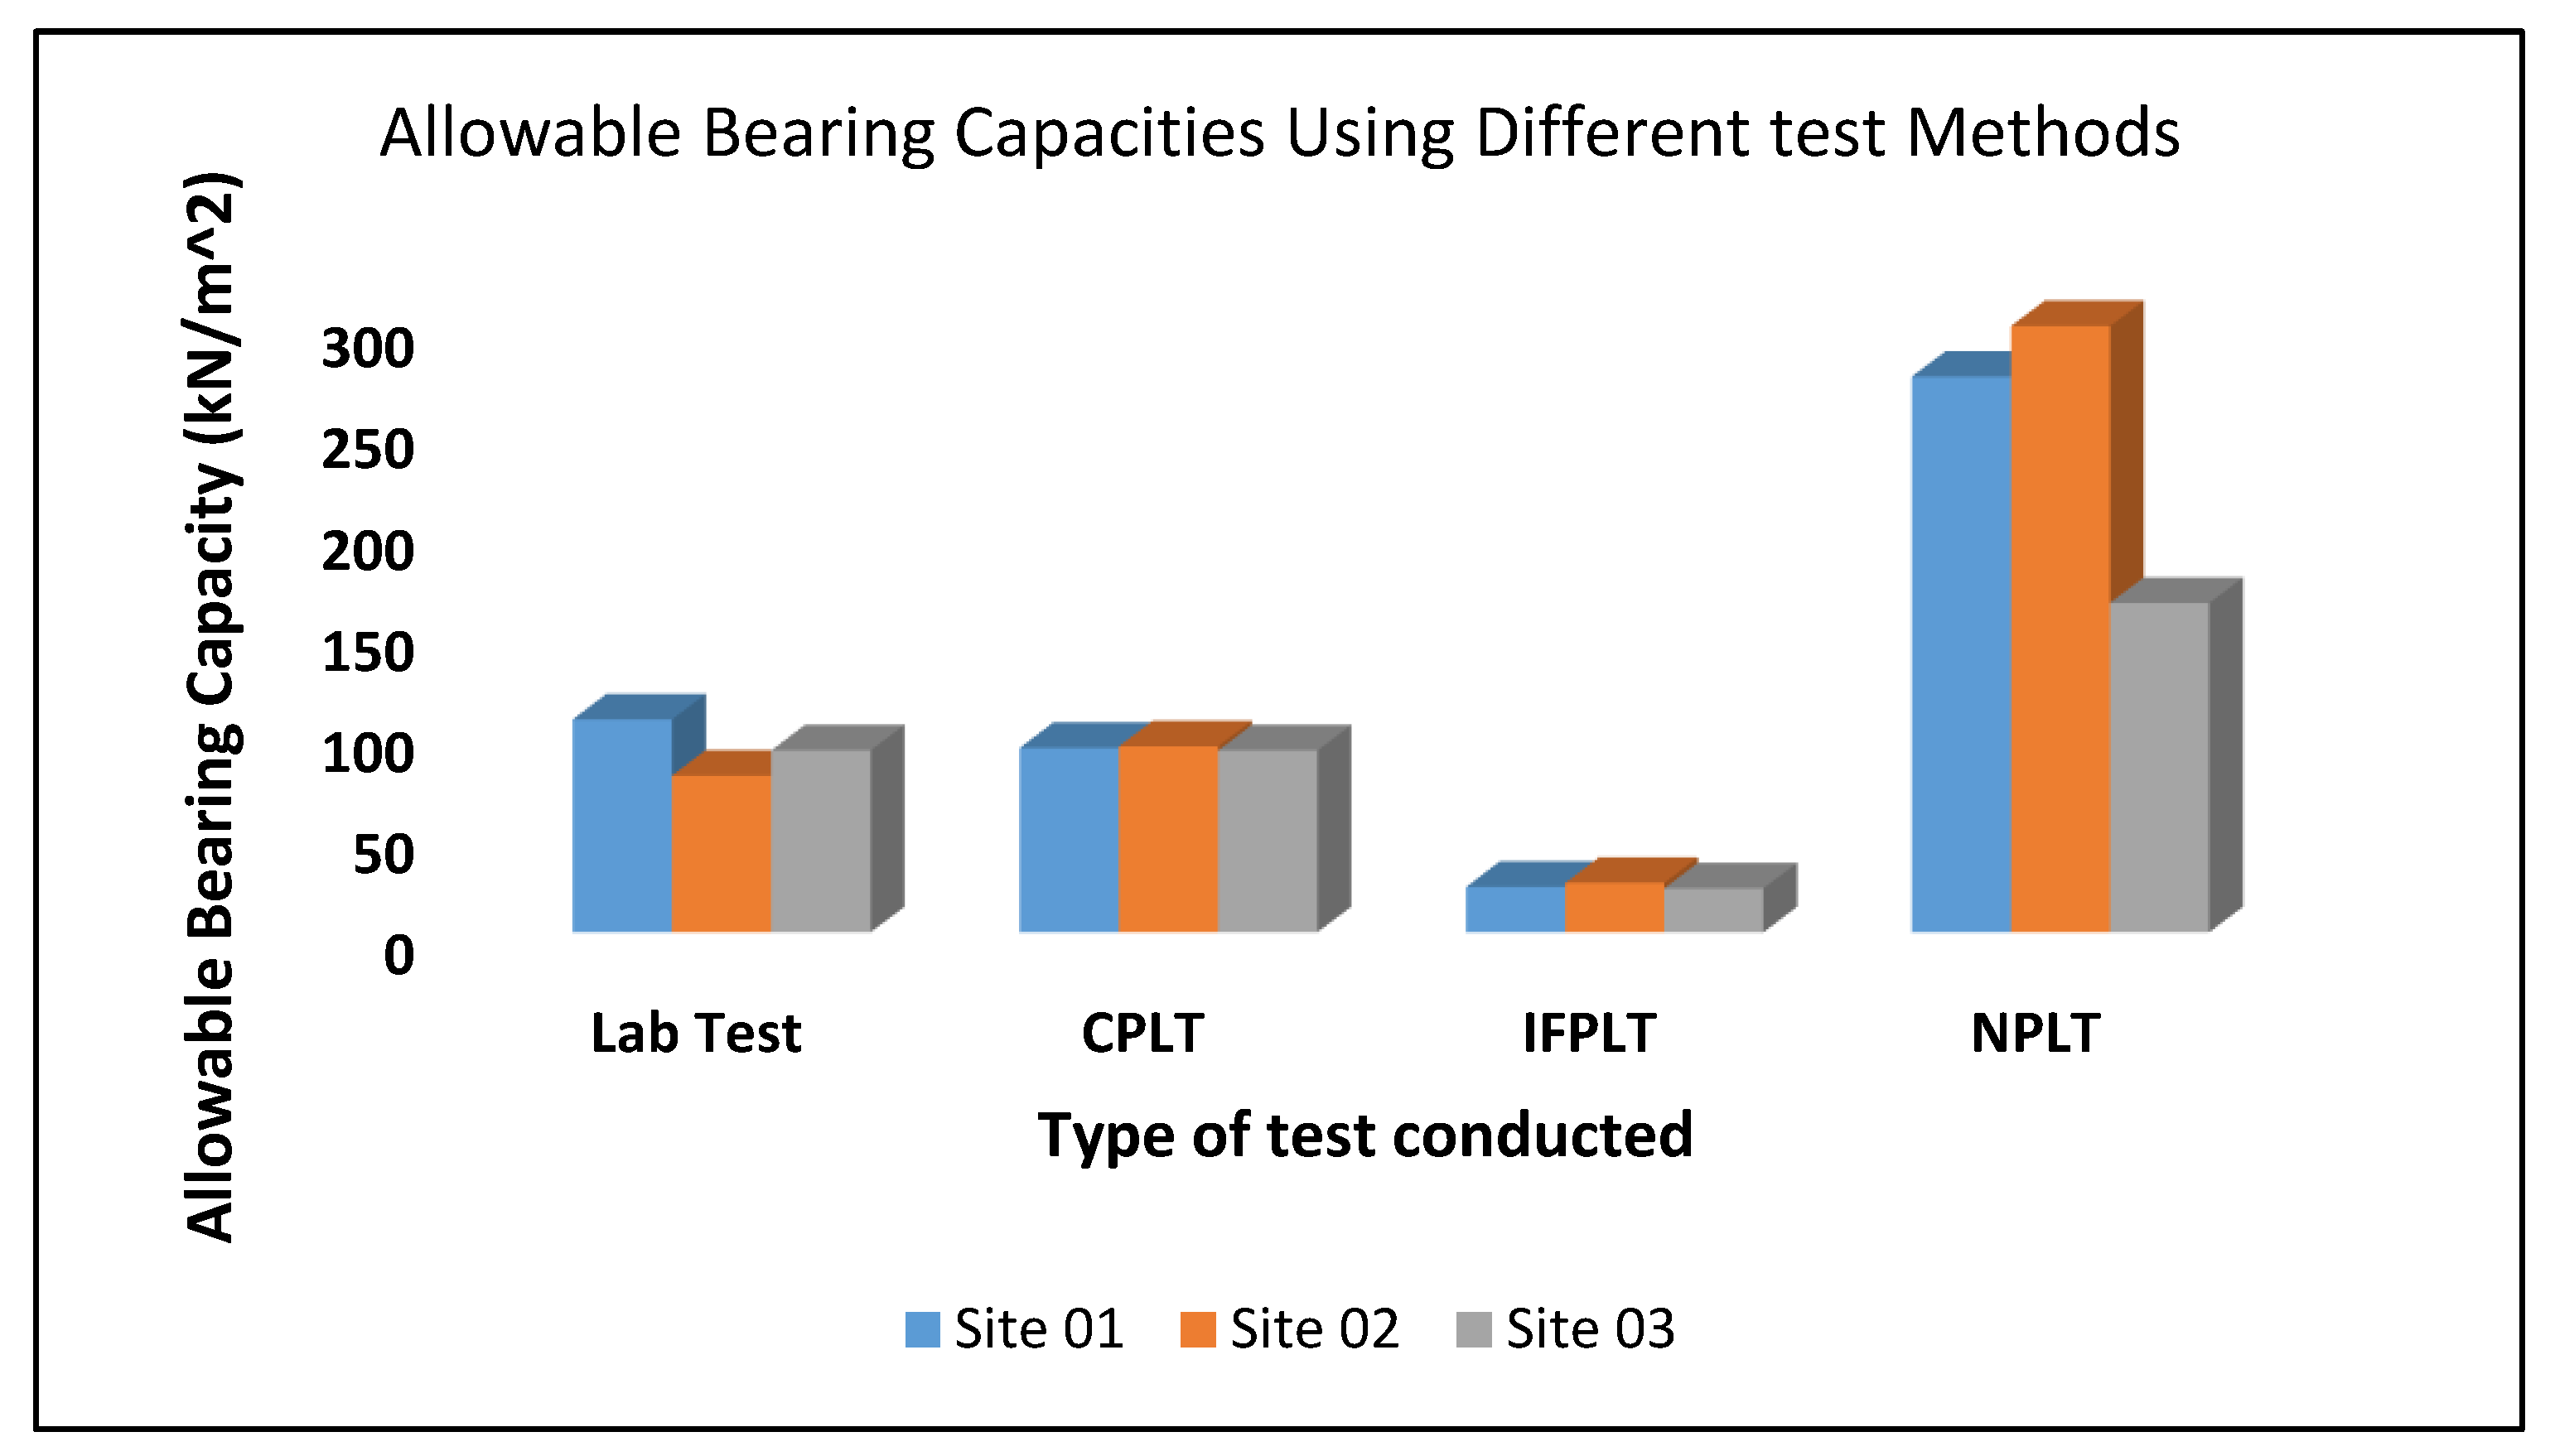
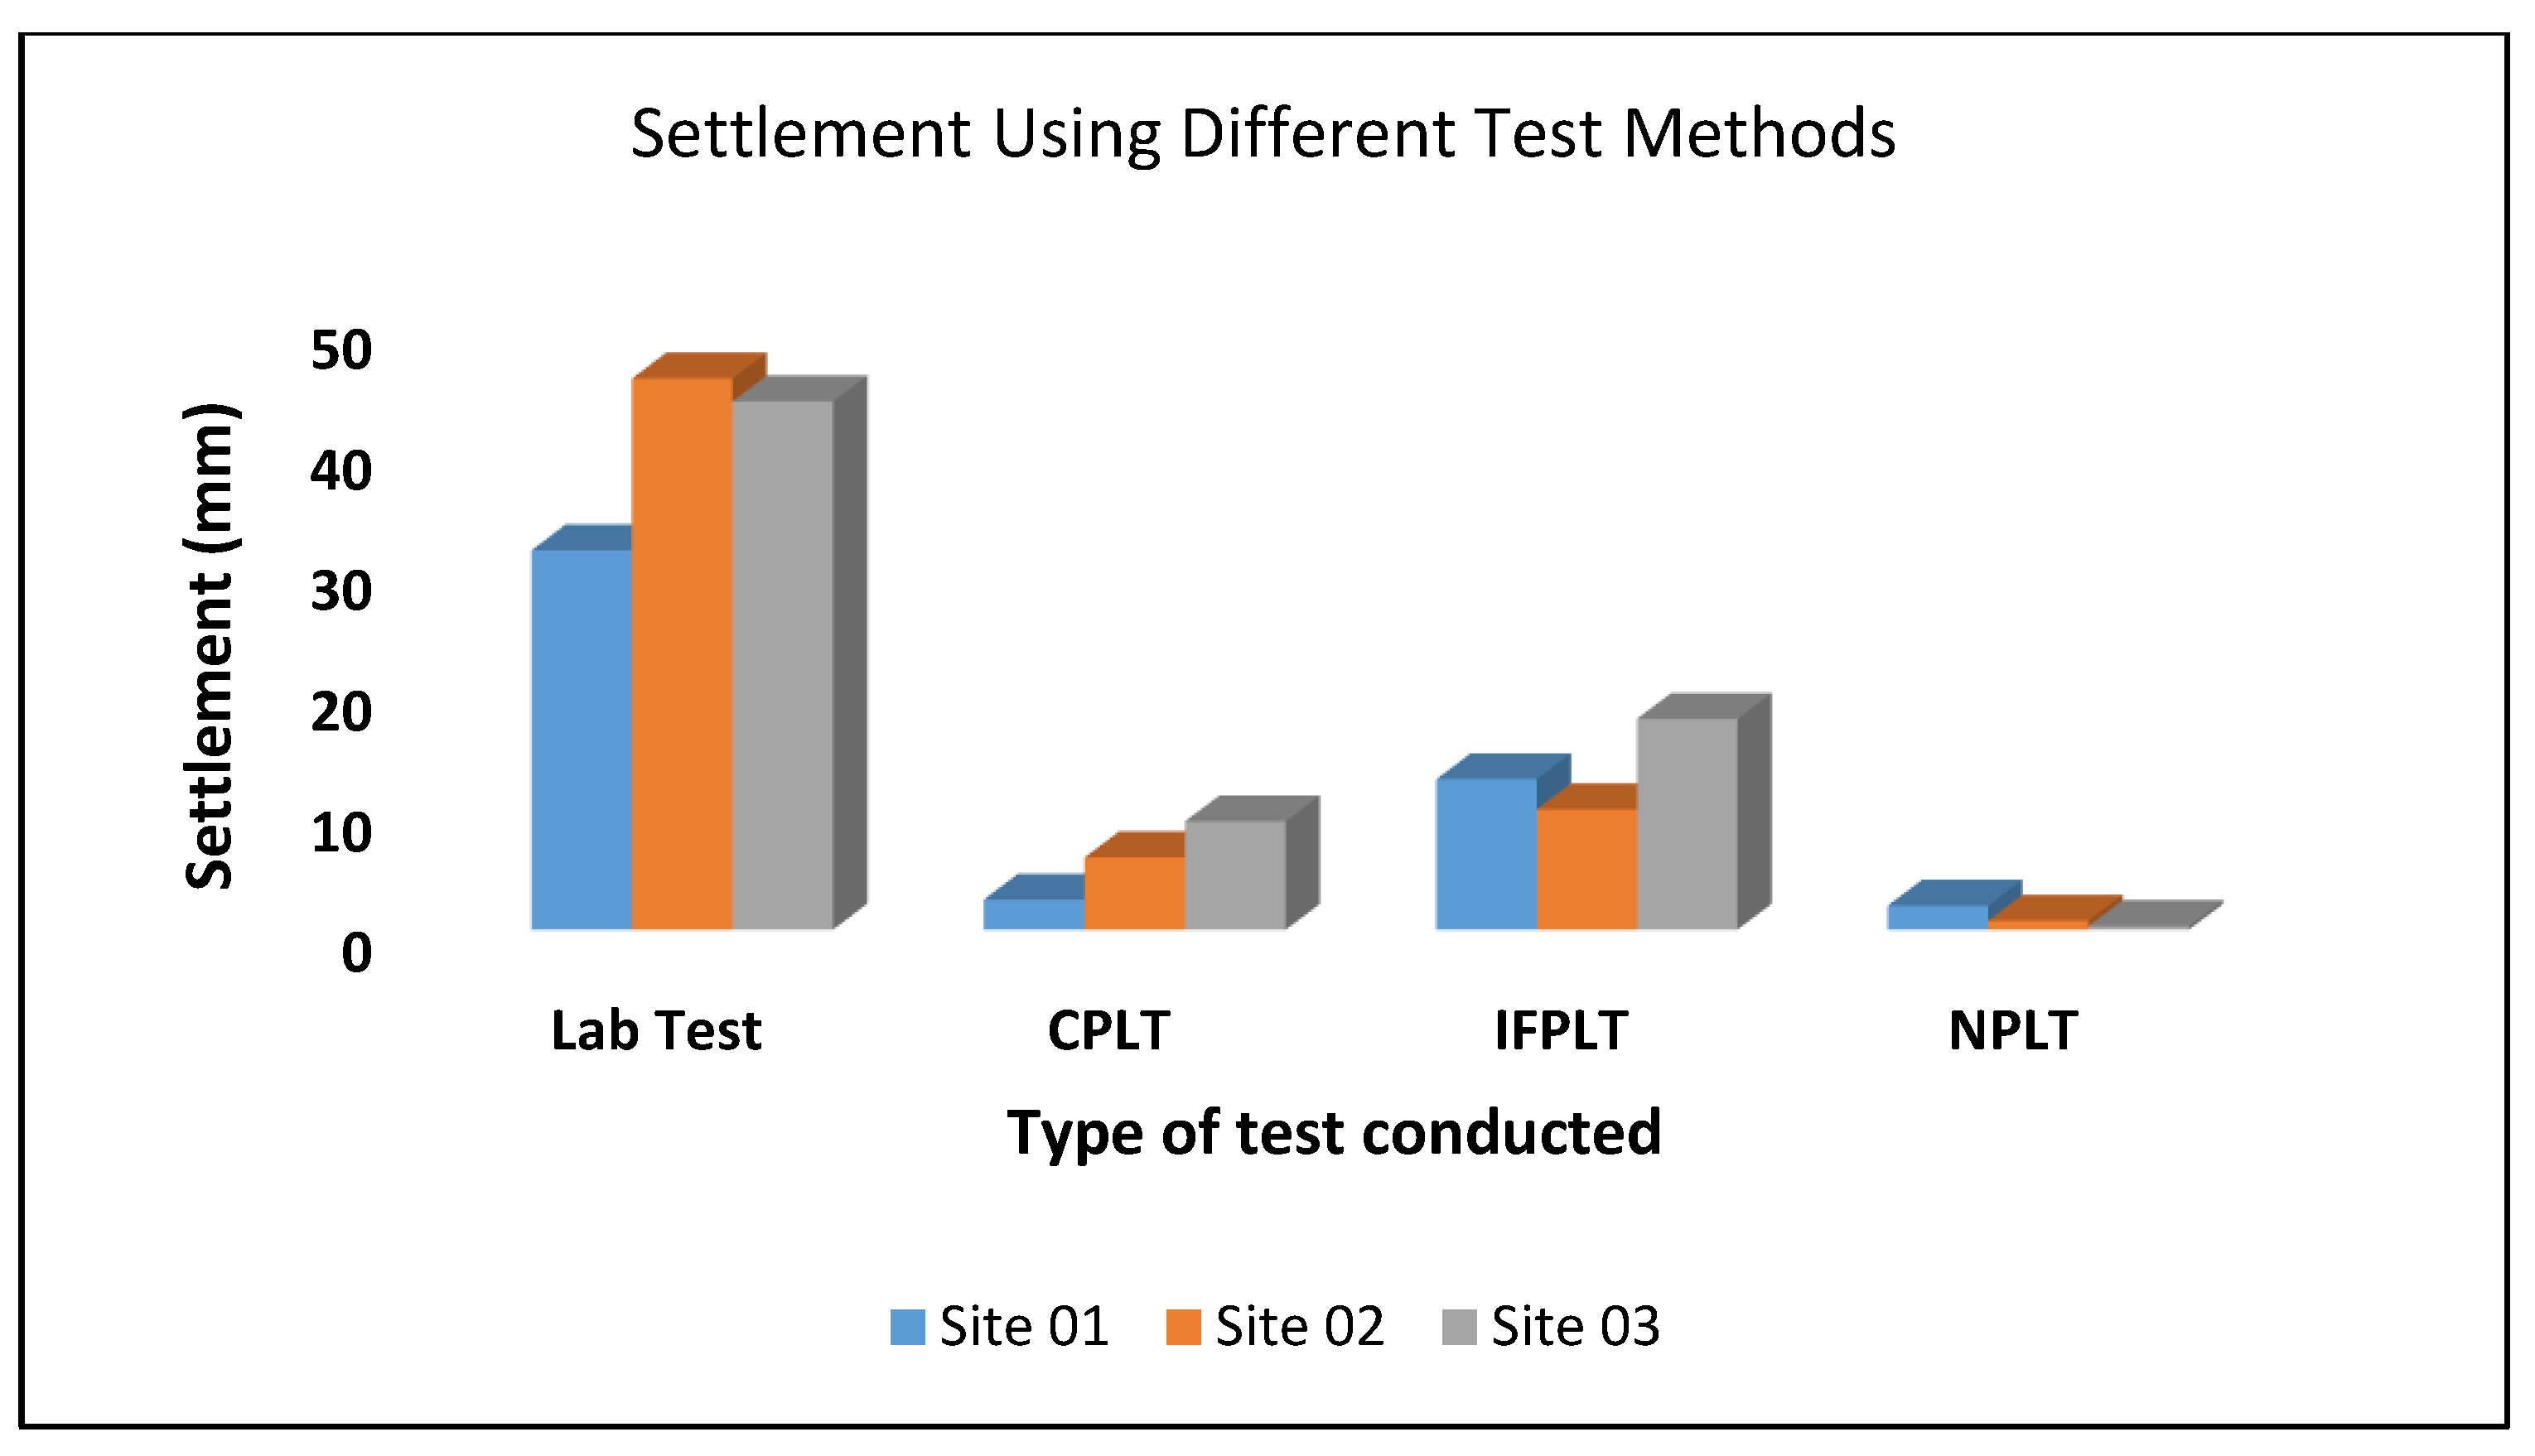
  • The bearing capacities obtained from the CFPLT are close to the ultimate bearing capacities calculated from the laboratory triaxial tests. The bearing capacities from the proposed innovative plate load testing equipment, however, recorded lower bearing capacities. This is probably due to the long period allowed for each load before the next loading.
  • Settlement values recorded for the CFPLT were observed to be lower than those recorded for the IFPLT. The CFPLT does not allow for sufficient time for the dissipation of pore water pressure and, therefore, limits the magnitude of the settlement.

Author Contributions

Conceptualization, I.U., M.M.A. and M.A.; methodology, T.E.A. and I.U.; supervision, M.M.A., B.A. and T.E.A.; project administration, M.M.A. and I.U.; funding acquisition, A.H.J. and A.H.B.; software, M.A.; formal analysis, A.H.J. and. I.U.; resources, M.M.A.; data curation, A.H.B., T.E.A. and M.A.; writing—original draft preparation, I.U.; writing—review and editing, I.U., M.M.A. and B.A.; visualization, A.H.B. and T.E.A.; All authors have read and agreed to the published version of the manuscript.

Funding

This research was funded by Tertiary Education Trust Fund (TETFUND), Nigeria.

Data Availability Statement

The data presented in this study are available from the corresponding authors upon reasonable request.

Acknowledgments

The authors gratefully acknowledge the following: Federal University of Technology, Minna, and Abubakar Tafawa Balewa University, Bauchi for the support. It will not be out place to acknowledge Dadson Engineering Services Minna and Sychronous Logic Engineering Kpakungu, Minna, Niger State, Nigeria for the opportunity they gave me to use their equipments.

Conflicts of Interest

The authors declare no conflict of interest.

References

  1. Lunne, T.; Anderson, K.H.; Strandvik, S.O. Effect of sample Disturbance and Consolidation Procedures on Measured Shear Strength of Soft Marine Norwegian Clays. Can. Geotech. J. 2011, 43, 726–750. [Google Scholar] [CrossRef]
  2. Carrol, R.; Long, M. Sample Disturbance Effects in Silt. J. Geotech. Geoenviron. Eng. 2017, 143, 4017061. [Google Scholar] [CrossRef]
  3. Koutsoftas, D. Discussion of “Effects of Sample Disturbance in Geotechnical Design”. Can. Geotech. J. 2019, 56, 275–289. [Google Scholar] [CrossRef]
  4. Karlsson, M.; Emdal, A.; Dijkstra, J. Consequences of Sample Disturbance for Predicting Long-term Settlements in Soft Clay. Can. Geotech. J. 2016, 53, 1965–1977. [Google Scholar] [CrossRef]
  5. Dasaka, S.M.; Jain, A.; Kolekar, Y.A. Effect of Uncertainties in the Field Load Testing on the Observed Load-Settlement Response. Indian Geotech. J. 2013, 44, 294–304. [Google Scholar] [CrossRef]
  6. Jagaba, A.H.; Shuaibu, A.; Umaru, I.; Musa, S.; Lawal, I.M.; Abubakar, S. Stabilization of Soft Soil by Incinerated Sewage Sludge Ash from Municipal Wastewater Treatment Plant for Engineering Construction. Sustain. Struct. Mater. 2019, 2, 32–44. [Google Scholar]
  7. Smith-Pardo, J.P.; Bobet, A. Behavior of Rigid Footings on Gravel under Axial Load and Moment. J. Geotech. Geoenviron. Eng. 2007, 133, 1203–1215. [Google Scholar] [CrossRef]
  8. Mohite, N.R.; Admane, S. Plate Load Test on Undisturbed Soil Sample. Int. J. Sci. Eng. Technol. Res. 2015, 4, 1042–1045. [Google Scholar]
  9. Jagaba, A.H.; Kutty, S.R.M.; Abubakar, S.; Birniwa, A.H.; Lawal, I.M.; Umaru, I.; Usman, A.K.; Yaro, N.S.A.; Al-Zaqri, N.; Al-Maswari, B.M.; et al. Synthesis, Characterization, and Performance Evaluation of Hybrid Waste Sludge Biochar for COD and Color Removal from Agro-Industrial Effluent. Separations 2022, 9, 258. [Google Scholar] [CrossRef]
  10. Umaru, I.; Babawuya, A.; Alhaji, M.M.; Alhassan, M.; Adejumo, T.W.; Lawal, S.S. Design of In-situ Load Bearing Capacity Mechanism. On Economic Downturn as a Result of COVID-19: The Role of Mechanical Engineers in Recovery. In Proceedings of the 5th International Virtual Conference of Nigerian Institution of Mechanical Engineers, Minna Chapter, Virtual Conference, 19 December 2020; Volume 5, pp. 27–42. [Google Scholar]
  11. Pinheiro, M.; Proskin, S.; Li, B. Laboratory Plate Load Testing of Non-Segregating Tailings. In Proceedings of the 21st International Conference Tailings & Mine Waste, Bannf, AB, Canada, 5–8 November 2017; pp. 1–10. [Google Scholar]
  12. Shalaby, S.I. A comparison between the behavior of laboratory and field plate load tests on collapsing soils. Conf. Pap. Res. Net Publ. 2017, 1–9. [Google Scholar]
  13. Mohammed, A.S. Evaluation of Allowable Bearing Capacity of Soil by Plate Bearing Test. A Case Study in Al-diwaniyah City. Basrah J. Eng. Sci. 2020, 13, 101–111. [Google Scholar]
  14. Albuquerque, P.J.R.; Noguchi, L.T.; Mucheti, A.S. Behavior of Plate Load Test in Sedimentary Soil/Brazil. In From Fundamentals to Application in Geotechnics; IOS Press: Amsterdam, The Netherlands, 2015; p. 285735597. [Google Scholar]
  15. Tuse, B.B.; Path, A.P.; Parche, D.D. Compilation of Plate Bearing Test Data. Int. J. Adv. Sci. Eng. Technol. 2016, 4, 74–77. [Google Scholar]
  16. Barnard, H.F.T.; Heyman, G. The Effect of Bedding Errors on the Accuracy of Plate Load Tests. J. Civ. Eng. 2015, 57, 67–76. [Google Scholar] [CrossRef] [Green Version]
  17. Jagaba, A.; Kutty, S.; Hayder, G.; Baloo, L.; Noor, A.; Yaro, N.; Saeed, A.; Lawal, I.; Birniwa, A.; Usman, A. A Systematic Literature Review on Waste-to-Resource Potential of Palm Oil Clinker for Sustainable Engineering and Environmental Applications. Materials 2021, 14, 4456. [Google Scholar] [CrossRef] [PubMed]
  18. Araujo, D.A.M.; Costa, C.M.L.; Costa, Y.D.J. Dimension Effect on Plate Load Test Results. In Proceedings of the 2nd World Congress on Civil, Structural, and Environmental Engineering, Barcelona, Spain, 2–4 April 2017; Volume 191, pp. 1–6. [Google Scholar]
  19. Kwiecien, S.; Segalini, A. Influence of Load Plates Diameters Shapes of Columns and Columns Spacing on Results of Load Plate Tests of Columns Formed by Dynamic Replacments. Sensors 2021, 21, 4868. [Google Scholar] [CrossRef]
  20. Lehmann, S.; Leppla, S.; Norkus, A. Experimental Study of the Modulus of Deformation Determined by Static and Dynamic Plate Load Tests. Balt. J. Road Bridge Eng. 2020, 15, 109–124. [Google Scholar] [CrossRef]
  21. Ahn, J.; Cote, B.M.; Robinson, B.; Gabr, M.A.; Borden, R.H. Inverse Analysis of Plate Load Tests to Assess Subgrade Resilient Modulus. Transp. Res. Rec. J. Transp. Res. Board 2009, 2101, 110–117. [Google Scholar] [CrossRef]
  22. Tuse, B.B.; Lokande, A.B.; Ghane, V.R.; Parkhe, D.D.; Birajdar, C.A. Investigation of Bearing Capacity by Plate Load Test—A Case Study. Int. Conf. Recent Innov. Sci. Eng. Technol. 2017, 1–4. [Google Scholar]
  23. Ali, N.A. Practical Engineering Behavior of Egyptian Collapsible Soils, Laboratory and In-Situ Experimental Study. Open J. Civ. Eng. 2021, 11, 290–300. [Google Scholar] [CrossRef]
  24. Panigrahi, B.; Pradhan, P.K. Improvement of Bearing Capacity of Soil by using Natural Geotextile. Int. J. Geo Eng. 2019, 10, 1–12. [Google Scholar] [CrossRef] [Green Version]
  25. Jagaba, A.H.; Kutty, S.R.M.; Noor, A.; Isah, A.S.; Lawal, I.M.; Birniwa, A.H.; Usman, A.K.; Abubakar, S. Kinetics of Pulp and Paper Wastewater Treatment by High Sludge Retention Time Activated Sludge Process. J. Hunan Univ. Nat. Sci. 2022, 49, 242–251. [Google Scholar] [CrossRef]
  26. Dasaka, S.M. Risk Analysis of Bearing Capacity of Shallow Foundations. Workshop Emerg. Trends Geotech. Eng. Guwahati 2012, 8, 89–97. [Google Scholar]
  27. Umaru, I.; Alhaji, M.M.; Alhassan, M.; Adejumo TW, E.; Babawuya, A.; Jagaba, A.H.; Lawal, I.M.; Abubakar, S.; Shehu, A. Simulation of Bearing Capacity and Settlement of Soil from Model Plate Load Test. In Proceedings of the 4th Sustainability and Resilience Conference: Design Innovation, Online, 1–2 November 2022. [Google Scholar]
  28. BS 1377; Methods of Testing Soil for Civil Engineering Purposes. British Standards Institute: London, UK, 1990.
  29. Jagaba, A.H.; Kutty, S.R.M.; Baloo, L.; Hayder, G.; Birniwa, A.H.; Taha, A.T.B.; Mnzool, M.; Lawal, I.M. Waste Derived Biocomposite for Simultaneous Biosorption of Organic Matter and Nutrients from Green Straw Biorefinery Effluent in Continuous Mode Activated Sludge Systems. Processes 2022, 10, 2262. [Google Scholar] [CrossRef]
  30. ASTM D1194-94; Standard Test Method for Bearing Capacity of Soil for Static Load and Spread Footings. Annual Book of ASTM Standard. American Society for Testing Materials: Philadelphia, PA, USA, 2003.
  31. Terzaghi, K. Evaluation of coefficients of subgrade reaction. Géotechnique 1955, 5, 297–326. [Google Scholar] [CrossRef]
  32. Kumar, K.S.P.; Anbese, T.W. Mathematical Psychiatry of Field Plate Load Test Using Finite Element Method. Malays. J. Civ. Eng. 2015, 27, 193–203. [Google Scholar]
  33. Nwokediuko, N.M.; Ogirigbo, O.R.; Inerhunwa, I. Load-settlement Characteristics of Tropical Red Soils of Southern Nigeria. Eur. J. Eng. Res. Sci. 2019, 4, 107–113. [Google Scholar] [CrossRef]
  34. Jagaba, A.H.; Kutty, S.R.M.; Lawal, I.M.; Aminu, N.; Noor, A.; Al-Dhawi, B.N.S.; Usman, A.K.; Batari, A.; Abubakar, S.; Birniwa, A.H.; et al. Diverse sustainable materials for the treatment of petroleum sludge and remediation of contaminated sites: A review. Clean. Waste Syst. 2022, 2, 100010. [Google Scholar] [CrossRef]
  35. Warmate, T. Bearing Capacity Determination using Plate Load Test in Calabar, Southeastern Nigeria. Electron. J. Geotech. Eng. 2014, 19, 4577–4588. [Google Scholar]
  36. Jagaba, A.H.; Kutty, S.R.M.; Naushad, M.; Lawal, I.M.; Noor, A.; Affam, A.C.; Birniwa, A.H.; Abubakar, S.; Soja, U.B.; Abioye, K.J.; et al. Removal of nutrients from pulp and paper biorefinery effluent: Operation, kinetic modelling and optimization by response surface methodology. Environ. Res. 2022, 214, 114091. [Google Scholar] [CrossRef]
  37. BS 8004; Code of Practices for Foundations in Civil Engineering Purposes. British Standards Institute: London, UK, 1986.
  38. Cabalar, A.F.; Abdulnafaa, M.D.; Isbuga, V. Plate Loading Tests on Clay with Construction and Demolition Materials. Arab. J. Sci. Eng. 2020, 46, 4307–4317. [Google Scholar] [CrossRef]
  39. Birniwa, A.H.; Mohammad, R.E.A.; Ali, M.; Rehman, M.F.; Abdullahi, S.S.A.; Eldin, S.M.; Mamman, S.; Sadiq, A.C.; Jagaba, A.H. Synthesis of Gum Arabic Magnetic Nanoparticles for Adsorptive Removal of Ciprofloxacin: Equilibrium, Kinetic, Thermodynamics Studies, and Optimization by Response Surface Methodology. Separations 2022, 9, 322. [Google Scholar] [CrossRef]
  40. Birniwa, A.H.; Abdullahi, S.S.; Yakasai, M.Y.; Ismaila, A. Studies on physico-mechanical behaviour of kenaf/glass fiber reinforced epoxy hybrid composites. Bull. Chem. Soc. Ethiop. 2021, 35, 171–184. [Google Scholar] [CrossRef]
  41. Jagaba, A.H.; Kutty, S.R.M.; Baloo, L.; Noor, A.; Abubakar, S.; Lawal, I.M.; Umaru, I.; Usman, A.K.; Kumar, V.; Birniwa, A.H. Effect of Hydraulic Retention Time on the Treatment of Pulp and Paper Industry Wastewater by Extended Aeration Activated Sludge System. In Proceedings of the 2021 Third International Sustainability and Resilience Conference: Climate Change (IEEE 2021), Sakheer, Bahrain, 15–16 November 2021; pp. 221–224. [Google Scholar]
  42. Jagaba, A.H.; Kutty, S.R.M.; Baloo, L.; Birniwa, A.H.; Lawal, I.M.; Aliyu, M.K.; Yaro, N.S.A.; Usman, A.K. Combined treatment of domestic and pulp and paper industry wastewater in a rice straw embedded activated sludge bioreactor to achieve sustainable development goals. Case Stud. Chem. Environ. Eng. 2022, 6, 100261. [Google Scholar] [CrossRef]
  43. Yaro, N.S.A.; Napiah, M.; Sutanto, M.H.; Usman, A.; Mizwar, I.K.; Umar, A.M. Engineering Properties of Palm Oil Clinker Fine-Modified Asphaltic Concrete Mixtures. J. Eng. Technol. Sci. 2022, 54, 220205. [Google Scholar] [CrossRef]
  44. Jagaba, A.H.; Kutty, S.R.M.; Isa, M.H.; Ghaleb, A.A.S.; Lawal, I.M.; Usman, A.K.; Birniwa, A.H.; Noor, A.; Abubakar, S.; Umaru, I.; et al. Toxic Effects of Xenobiotic Compounds on the Microbial Community of Activated Sludge. ChemBioEng Rev. 2022, 9, 497–535. [Google Scholar] [CrossRef]
  45. Abdullahi, S.S.; Musa, H.; Habibu, S.; Birniwa, A.H.; Mohammad, R.E.A. Comparative study and dyeing performance of as-synthesized azo heterocyclic monomeric, polymeric, and commercial disperse dyes. Turk. J. Chem. 2022, 46, 1841–1852. [Google Scholar] [CrossRef]
  46. Jagaba, A.H.; Kutty, S.R.M.; Noor, A.; Affam, A.C.; Ghfar, A.A.; Usman, A.K.; Lawal, I.M.; Birniwa, A.H.; Kankia, M.U.; Afolabi, H.K.; et al. Parametric optimization and kinetic modelling for organic matter removal from agro-waste derived paper packaging biorefinery wastewater. Biomass Convers. Biorefinery 2022, 1–18. [Google Scholar] [CrossRef]
  47. Birniwa, A.H.; Abubakar, A.S.; Mahmud, H.N.M.E.; Kutty, S.R.M.; Jagaba, A.H.; Abdullahi, S.S.A.; Zango, Z.U. Application of Agricultural Wastes for Cationic Dyes Removal from Wastewater. In Textile Wastewater Treatment; Springer: Singapore, 2022; pp. 239–274. [Google Scholar]
  48. Jagaba, A.H.; Kutty, S.R.M.; Isa, M.H.; Affam, A.C.; Aminu, N.; Abubakar, S.; Noor, A.; Lawal, I.M.; Umaru, I.; Hassan, I. Effect of environmental and operational parameters on sequential batch reactor systems in dye degradation. In Dye Biodegradation, Mechanisms and Techniques; Springer: Berlin/Heidelberg, Germany, 2022; pp. 193–225. [Google Scholar]
  49. Yaro, N.S.A.; Sutanto, M.H.; Habib, N.Z.; Napiah, M.; Usman, A.; Al-Sabaeei, A.M.; Rafiq, W. Mixture Design-Based Performance Optimization via Response Surface Methodology and Moisture Durability Study for Palm Oil Clinker Fine Modified Bitumen Asphalt Mixtures. Int. J. Pavement Res. Technol. 2022, 1–28. [Google Scholar] [CrossRef]
  50. Jagaba, A.; Kutty, S.; Lawal, I.; Abubakar, S.; Hassan, I.; Zubairu, I.; Umaru, I.; Abdurrasheed, A.; Adam, A.; Ghaleb, A.; et al. Sequencing batch reactor technology for landfill leachate treatment: A state-of-the-art review. J. Environ. Manag. 2021, 282, 111946. [Google Scholar] [CrossRef]
  51. Abdullahi, S.S.; Musa, H.; Habibu, S.; Birniwa, A.H.; Mohammad, R.E.A. Facile synthesis and dyeing performance of some disperse monomeric and polymeric dyes on nylon and polyester fabrics. Bull. Chem. Soc. Ethiop. 2022, 35, 485–497. [Google Scholar] [CrossRef]
  52. Birniwa, A.H.; Mahmud, H.N.M.E.; Abdullahi, S.S.; Habibu, S.; Jagaba, A.H.; Ibrahim, M.N.M.; Ahmad, A.; Alshammari, M.B.; Parveen, T.; Umar, K. Adsorption Behavior of Methylene Blue Cationic Dye in Aqueous Solution Using Polypyrrole-Polyethylenimine Nano-Adsorbent. Polymers 2022, 14, 3362. [Google Scholar] [CrossRef]
  53. Yaro, N.S.A.; Sutanto, M.H.; Habib, N.Z.; Napiah, M.; Usman, A.; Jagaba, A.H.; Al-Sabaeei, A.M. Application and circular economy prospects of palm oil waste for eco-friendly asphalt pavement industry: A review. J. Road Eng. 2022, 2, 309–331. [Google Scholar] [CrossRef]
  54. Jagaba, A.H.; Kutty, S.R.M.; Lawal, I.M.; Birniwa, A.H.; Affam, A.C.; Yaro, N.S.A.; Usman, A.K.; Umaru, I.; Abubakar, S.; Noor, A. Circular economy potential and contributions of petroleum industry sludge utilization to environmental sustainability through engineered processes—A review. Clean. Circ. Bioecon. 2022, 3, 100029. [Google Scholar] [CrossRef]
  55. Al-dhawi, B.N.S.; Kutty, S.R.M.; Baloo, L.; Almahbashi, N.M.Y.; Ghaleb, A.A.S.; Jagaba, A.H.; Kumar, V.; Saeed, A.A.H. Treatment of synthetic wastewater by using submerged attached growth media in continuous activated sludge reactor system. Int. J. Sustain. Build. Technol. Urban Dev. 2022, 13, 2–10. [Google Scholar]
  56. Birniwa, A.H.; Kehili, S.; Ali, M.; Musa, H.; Ali, U.; Kutty, S.R.M.; Jagaba, A.H.; Abdullahi, S.S.; Tag-Eldin, E.M.; Mahmud, H.N.M.E. Polymer-Based Nano-Adsorbent for the Removal of Lead Ions: Kinetics Studies and Optimization by Response Surface Methodology. Separations 2022, 9, 356. [Google Scholar] [CrossRef]
  57. Yaro, N.S.A.; Napiah, M.; Sutanto, M.H.; Usman, A.; Jagaba, A.H.; Umar, A.M.; Ahmad, A. Geopolymer utilization in the pavement industry-An overview. In IOP Conference Series: Earth and Environmental Science, Proceedings of the 6th International Conference on Civil and Environmental Engineering for Sustainability (IConCEES 2021), Online, 15–16 November 2021; IOP Publishing: Bristol, UK, 2022; p. 012025. [Google Scholar]
  58. Jagaba, A.H.; Kutty, S.R.M.; Noor, A.; Birniwa, A.H.; Affam, A.C.; Lawal, I.M.; Kankia, M.U.; Kilaco, A.U. A systematic literature review of biocarriers: Central elements for biofilm formation, organic and nutrients removal in sequencing batch biofilm reactor. J. Water Process. Eng. 2021, 42, 102178. [Google Scholar] [CrossRef]
  59. Birniwa, A.H.; Abubakar, A.S.; Huq, A.O.; Mahmud, H.N.M.E. Polypyrrole-polyethyleneimine (PPy-PEI) nanocomposite: An effective adsorbent for nickel ion adsorption from aqueous solution. J. Macromol. Sci. Part A Pure Appl. Chem. 2021, 58, 206–217. [Google Scholar] [CrossRef]
Figure 1. Graphs of Triaxial Tests for sites (a) 01, (b) 02 and (c) 03.
Geotechnics 03 00009 g001aGeotechnics 03 00009 g001b
Figure 2. Graph of Laboratory Consolidation Test of Void ratio against Load.
Geotechnics 03 00009 g002
Figure 3. Conventional Plate load test.
Geotechnics 03 00009 g003
Figure 4. Graph of Conventional Plate Load Test.
Geotechnics 03 00009 g004
Figure 5. Line diagram of Innovative plate load test equipment.
Geotechnics 03 00009 g005
Figure 6. Proposed Set-up for Innovative Field Plate Load Test.
Geotechnics 03 00009 g006
Figure 7. Graph of Innovated Field Plate Load Test.
Geotechnics 03 00009 g007
Figure 8. PLAXIS 3D Software application.
Geotechnics 03 00009 g008
Figure 9. PLAXIS 3D Outputs for Applied Vertical Deformed Mesh.
Geotechnics 03 00009 g009
Figure 10. Stress-Settlement behaviors of PLAXIS Model Test.
Geotechnics 03 00009 g010
Figure 11. Allowable Bearing Capacity of the three sites.
Geotechnics 03 00009 g011
Figure 12. Settlement of the three sites.
Geotechnics 03 00009 g012
Figure 13. Relationship between Measured FPLTD and PLAXIS Model settlement values on Site 01 Soil.
Geotechnics 03 00009 g013
Figure 14. Relationship between Measured FPLTD and PLAXIS Model settlement values on Site 02 Soil.
Geotechnics 03 00009 g014
Figure 15. Relationship between Measured FPLTD and PLAXIS Model settlement values on Site 03.
Geotechnics 03 00009 g015
Table 1. Summary of Index Properties Test Results.
SampleDepth (m)Sample Descript.N.M.CSpecific Gravity
(Gs)
% Passing Sieve SizeAtterberg LimitsSoil ClassificationSoil Classification
2.00
mm
0.425
mm
0.075
mm
LLPI(USCS)(AASHTO)
Site 010.5Brown14.52.5179.0156.3043.7537.5013.76A-5ML
Site 020.5Brown14.82.6189.9272.2143.8132.5011.87A-4CL
Site 030.5Dark15.42.5799.4982.7756.5635.5013.02A-6CL
Table 2. Shear strength parameters for sites (a) 01, (b) 02 and (c) 03 soils.
Test No.Cell Pressure
(kN/m2)
Deviator Stress (kN/m2)Major Principal Stress (kN/m2)Cohesion
C (kN/m2)
Angle of Internal Friction
φ (°)
Unit Weight of Soil
γ (kN/m3)
(a)
1100125225281318.86
2200180380
3300240540
(b)
11009819829818.55
2200130330
3300160460
(c)
110010620637618.34
2200130330
3300160460
Table 3. Summary of Strength Properties Test Results.
SampleDepth (m)Bulk Unit wgt (kN/m3)Modulus of Elasticity E (kN/m2)Shear
Strength Parameters
Bearing Capacity
(kN/m2) Settlement
C
(kN/m2)
Φqult.qallow(mm)
Site 010.518.8637142813421.53105.3828.0
Site 020.518.555107298310.2477.5639.0
Site 030.518.347428376360.2590.0629.0
Table 4. Soil Properties used in Carrying out Numerical Analysis.
SiteDepth of
Foundation
(m)
Undrained Cohesion C (kN/m2)Angle of Internal Friction φ (°)Unit Weight of Soil γ (kN/m3)Poisson’s Ratio of Soil µModulus of Elastic of Soil E (kN/m2)
A0.5281318.860.33714
B0.529818.550.35107
C0.537618.340.37428
Table 5. Conventional PLT bearing capacity.
SiteUltimate Bearing Capacity (kN/m2)Allowable Bearing Capacity (kN/m2)Settlements (mm)
0136591.252.5
02368926
03360909
Table 6. Innovated Plate Load Test Bearing Capacities and Settlements.
SiteUltimate Bearing Capacity (kN/m2)Allowable Bearing Capacity (kN/m2)Settlements (mm)
019022.512.5
029824.510
038721.7517.5
Table 7. PLAXIS model Numerical Plate load test.
SiteUltimate Bearing Capacity (kN/m2)Allowable Bearing Capacity (kN/m2)Settlements (mm)
0111002752.0
0212003000.75
036501630.3
Disclaimer/Publisher’s Note: The statements, opinions and data contained in all publications are solely those of the individual author(s) and contributor(s) and not of MDPI and/or the editor(s). MDPI and/or the editor(s) disclaim responsibility for any injury to people or property resulting from any ideas, methods, instructions or products referred to in the content.

