
Burn Severity and Its Impact on Soil Properties: A Study of the 2016 Erskine Fire in the Southern Sierra Nevada, California
1
Department of Geological Sciences, California State University, Bakersfield, CA 93311, USA
2
Geologic Energy Management Division, California Department of Conservation, Sacramento, CA 95814, USA
3
Department of Mathematics, California State University, Bakersfield, CA 93311, USA
*
Author to whom correspondence should be addressed.
Geotechnics 2023, 3(2), 446-464; https://doi.org/10.3390/geotechnics3020025
Submission received: 18 April 2023
/
Revised: 9 May 2023
/
Accepted: 19 May 2023
/
Published: 22 May 2023
Abstract
:Wildfires can cause debris flow events in affected areas due to changes in the physical properties of burned soils, which are linked to burn severity. A study in California’s Sierra Nevada explored the impact of burn severity on soil physical properties using various tests. Results showed that higher burn-severity soils had higher total organic carbon content and liquid limit, and the plastic limit was also higher. The plasticity index was highest among low burn-severity soils, and high burn-severity soils had lower smectite and kaolinite/chlorite abundances compared to lower burn-severity soils. Grain size distribution and shear strength were not significantly impacted by burn severity. The study suggests that total organic carbon content is the most significant factor affecting the physical and mechanical properties of soil. These findings may help assess debris flow hazards in burned areas and highlight the need for further research on the effects of wildfires on soil properties and their contribution to debris flow events.
1. Introduction
Wildfires have long been familiar hazards throughout the western United States. However, in the past few decades, wildfires and their impacts have become more destructive, and the frequency of large wildfires has been increasing [1]. A changing climate and prolonged droughts, coupled with an expanding wildland–urban interface, are exacerbating wildfire effects. Drier conditions are generating larger wildfires and endangering people who have settled in fire-prone regions. Furthermore, wildfire management is often insufficient because the increased destructivity of wildfires is outpacing wildfire management efforts. Soil burn severity is a measure of fire’s effects on soil and is categorized into four burn severities [2,3]: very low or unburned (VLBS), low (LBS), moderate (MBS), and high burn severity (HBS). In VLBS soil, the surface organic layers experience negligible to no damage resulting from the fire. In LBS soil, the surface organic layers and surface soil are slightly charred, but the soil structure is preserved. In MBS soil, a majority of the surface organic layers are consumed, and surface soil is charred from brown to black, with soil structure mostly preserved. In HBS soil, the surface organic layers are completely or predominantly consumed, and HBS soil is covered in a layer of ash, indicating the complete destruction of surface vegetation. Soil structure is often reduced or destroyed in HBS soils.
The impacts of wildfires extend beyond the fire itself. The remaining burn scar, for example, is prone to debris flows [4,5]. Vegetation forms a protective layer that limits erosion, and a loss of vegetation can accelerate erosion and runoff, increasing debris flow probability [6,7]. Debris flows in the immediate aftermath of fire are commonly generated by runoff when the landscape is particularly vulnerable to infiltration—when there is excess overland flow and the resistance of the soil to erosion is reduced [8]. Post-wildfire debris flows may not solely form through this mechanism [9]. Rainfall-induced infiltration can result in excessive subsurface pore water pressures that trigger shallow landslides, which can mobilize into debris flows [10]. The initiation of debris flow is commonly described in terms of slope stability, which can be further analyzed by using limit equilibrium analysis and taking into account the effects of both pore water pressure and pore air pressure [11]:
where k is the critical threshold factor for the initiation of debris flows; a is the basal area of interface; g is the gravity of loose material; τ is the shear stress of the runoff flow; β is the slope; σ is the total normal stress; uw is the pore water pressure; c is the cohesion of loose material; and φ is the internal friction angle. The formula is based on the concept that continuous rainfall input reduces the matrix suction of loose material as water content increases, leading to a decrease in shear strength. When the shear strength drops below the tangential stress produced by flow and gravity, debris flow will occur once the material becomes saturated. In essence, soil shear strength is one of the key mechanical properties influencing the erodibility of the soil, the failure of the soil slope, and the debris flow likelihood.
k = [(σ − uw)tanφ + a∙c]/(τ + g∙sinβ),
Changes in the physical properties of soil due to the wildfire impact may contribute to the occurrence of debris flows [12,13]. Wildfires can alter the mineralogical composition of the soil, thereby further impacting the soil’s physical properties. For example, thermal decomposition of aluminosilicates can result in the cementing of soil particles, which can increase soil aggregate stability [14,15]. Conversely, the destruction of montmorillonite clays at temperatures common in wildfires was shown to decrease the liquid limit (LL) and plastic limit (PL) [16]. The liquid limit and plastic limit of soil, namely the soil Atterberg limits, are the highest and lowest water content in the plastic state, which are of important significance in predicting the influence of surface runoff and rainfall on slope soil erosion. A lower plastic limit normally results in poor soil performance and facilitates water movement and soil erosions. Wildfires can also impact the relative abundance of grain size within the soil, primarily with decreases in clay-size grain content and increases in silt- and sand-size grain content [17]. These changes are often related to fire intensity and soil burn severity [13,15,18]. These changes in grain size consequently influence soil strength. Soils with a high clay-size grain content tend to be cohesive and malleable (high LL and PL) because grain-to-grain interactions influence soil aggregation [6,15,19,20]. Soils with low clay content and relatively higher silt- and sand-size grain contents, however, tend to be less cohesive because fewer inter-grain interactions are contributing to soil aggregation. High temperatures of wildfires are known to fuse grains together, forming larger aggregates and decreasing soil strength [7,15,19,20,21].
In summary, many physical, chemical, mineralogical, and biological soil properties can be affected by wildfires [15]. The effects are chiefly a result of burn severity, which consists of peak temperatures and duration of the fire. The degree of soil burn severity has been found to be closely associated with the extent of these changes [13,15,22]. Generally, higher degrees of burn severity led to greater alterations in the physical and compositional properties of soil. However, the variability found between sites in both soil properties and spectral index values of burn severities seems to indicate the difficulty in establishing overall ranges of variation [23]. This variability can make it difficult to predict the effects of fire on soils and the resulting debris flows. Thus, more data from different ecosystems is required to advance our understanding of the relationships between burn severities and soil properties. This study aimed to report the effect of wildfire on soil physical properties with respect to soil burn severity by conducting various laboratory tests on soil samples collected within the 2016 Erskine fire perimeter in California, U.S. Tests included direct shear strength, liquid limit, plastic limit, and plasticity index (PI) analyses, as well as explorations into total organic carbon (TOC), grain size, and mineralogy.
2. Background
2.1. Wildfire in the Western United States
Wildfire frequency and the affected burn area have increased significantly over much of the western United States since the 1980s [6]. The average length of the fire season has also extended by seventy-eight days since the 1970s, and these observed trends are attributed to a changing climate [6]. Prolonged droughts and higher average temperatures have generated drier forests, and these conditions have allowed wildfires to intensify. Furthermore, the coupling of a changing climate with poor fire management practices of the past has exacerbated the impacts of wildfires [24]. As the wildland–urban interface continues to expand, humans are increasingly putting themselves at risk in fire-prone regions.
In 2017, wildfires in California’s State Responsibility Area burned 2048 km2, which is more than double the 989 km2 burned in 2016 and 2.5 times more acreage than the state’s five-year average. As of 2018, seven of California’s twenty largest wildfires have occurred in the past eight years, and only four of the twenty most destructive wildfires in California have occurred prior to 1990. Increasing burn area trends are similar for the western United States. For example, the combined total acreage burned in all ecoregions of the western U.S. has increased at a rate of ~352 km2 per year from 1984 to 2011 [6].
2.2. 2016 Erskine Fire Burn Area
The Erskine fire burned 194 km2 of the southern Sierra Nevada in eastern Kern County, California [25] (Figure 1). Steep, mountainous terrain dominates the topography, and elevation within the fire perimeter ranges between 762 and 1798 m. The communities of Lake Isabella, Squirrel Mountain Valley, Mountain Mesa, and South Lake lie within the fire perimeter and downstream portions of several watersheds, putting humans and structures at risk of debris flows. The mean annual precipitation in the region ranges between eight to twelve inches. The fire ignited on 23 June 2016 and was contained on 10 July 2016. A faulty power line was found to be the ignition source. In total, 90 km2 of the National Forest Service, 70 km2 of Bureau of Land Management, and 34 km2 of private land were impacted, with 185 km of roads and 95 km of trails affected. Roughly 877 km of stream channels were also affected, with less than 3% of the channels being perennial streams. The 2016 Erskine fire destroyed 285 homes and claimed two fatalities. Suppression costs totaled $23 million [25].
In the Erskine fire area, woodland habitat spanning over 21 km2 was recorded in the pre-fire state [25]. However, after the fire, there was a reduction of more than 13 km2 (equivalent to 64%) in upland woodlands overall. It is important to note that this reduction in acreage was not equally distributed across all habitat types. For instance, although Jeffrey pine (Pinus jeffreyi) was not widely present in the region, its acreage was reduced by 98%. On the other hand, California juniper (Juniperus californica), which had a much broader distribution, experienced a reduction of 72%. Blue oak (Quercus douglasii) and canyon live oak (Q. chrysolepis) were each reduced by 51%, while the more resilient interior live oak (Q. wislizeni) woodlands recorded a 20% reduction in acreage.
Soils of HBS, MBS, LBS, and VLBS comprise 1%, 43%, 45%, and 11% of the burn area, respectively. Shrubland comprised approximately 55% of the burn area, while coniferous vegetation comprised approximately 24% of the burn area. Mixed, herbaceous, and grassland communities comprised the remaining vegetation types within the fire perimeter. According to USDA Soil Surveys, the soils in the region belong to the general soil unit “Soils on Hillslopes and Mountain Slopes of the Southern Sierra Nevada Range” [25]. These soils are derived from weathered granitoid and metasedimentary rocks. The prevalent soil textural class in the uppermost layer is mostly composed of gravelly loam and coarse sand. The burn area is underlain by the Sierra Nevada batholith, metasedimentary, and metavolcanic units of the Mesozoic Era [26,27]. The middle Cretaceous Kings sequence, comprising quartz-mica schist, quartzite, marble lenses, and calc-silicate rocks, lies along the western portion of the burn area, and remnant bedding of the Kings sequence dips steeply N–NW. Quaternary alluvium also lies within the fire perimeter.
3. Materials and Methods
3.1. Sample Collection
The sample locations are situated within the property of the Bureau of Land Management, and a special-use research permit was issued and obtained prior to sample collection. All samples were taken from soils belonging to the Stineway–Kiscove association soil unit [25], which is derived from weathered metasedimentary rock and characterized as very gravelly sandy loam that grades into a gravelly loam. The Stineway–Kiscove association soil profile is approximately 33 cm thick, and the most limiting soil layer’s capacity to transmit water is very low, with a rate of 0.00 to 0.25 cm/h [25]. Very low infiltration rates can facilitate runoff during rainfall events, which can be especially problematic in wildfire-affected areas. Fire-affected soil further reduces infiltration rates, catalyzing erosion and increasing the likelihood of a post-fire debris flow [28].
A total of sixty soil samples were collected approximately fifteen months after the ignition of the Erskine fire, with fifteen samples collected from each burn severity. Samples were taken from soils derived from the Kings sequence, from the surface to a depth visually determined to be unaffected by the fire (approximately 5–8 cm), based on the absence of burned soil, ash, and charred roots. In Southern California, shallow landsliding is a frequent occurrence and may account for about 50% of hillslope erosion [29]. For example, the depth measured at 286 landslide scarps in the field in Southern California ranged from 0.15 to 0.5 m, with an average depth of 0.35 m [30]. Therefore, it is essential to investigate how disturbances such as wildfires can affect their occurrence. Thus, roughly 400 g of soil was collected for each sample from a visually determined depth affected by the wildfire.
Ten samples from each burn severity were analyzed for Atterberg limits, plasticity index, grain size, and total organic carbon Among these samples, three were selected for X-ray diffraction (XRD) analysis, while two were chosen for scanning electron microscopy (SEM) imaging. The XRD analysis was performed using a Panalytical Emprean X-ray diffractometer (Malvern Panalytical, Malvern, UK), and the SEM imaging using a Hitachi S3400N VP SEM (Tokyo, Japan) at California State University Bakersfield (CSUB). Additionally, five samples from each burn severity were reserved exclusively for direct shear tests. The number of samples tested was determined to be the minimum necessary to capture the properties of the soil with respect to each test procedure.
3.2. Soil Physical Property Analyses
3.2.1. Atterberg Limits Analyses
The Atterberg limits and PI were determined following the ASTM Standard D4318 Wet Preparation Method [31]. Ten samples from each burn severity were air-dried overnight and then passed through a #40 sieve to separate soil particles of size 0.425 mm or smaller from the bulk sample. All particles larger than 0.425 mm were discarded, and Atterberg limits were explored on the portion of the sample that passed through the #40 sieve. The one-point method was used to determine the LL [31]. Incrementally, around 25 mL of water was added to roughly 80–100 g of air-dried soil until the soil exhibited liquid-state properties. Then, the LL was tested on a portion of the wetted soil using a Humboldt hand-operated liquid limit device.
A portion of the soil remaining from LL testing was retained for PL testing. The hand-rolled method was employed to determine the PL [31]. For each test, a three- to four-gram sample of soil was hand rolled into a linear thread 3.2 mm in diameter. Once a linear thread 3.2 mm in diameter was achieved, the thread was remolded into an ellipsoidal mass and then rerolled. This process continued until the sample’s water content had decreased such that a linear thread could no longer be formed. This testing procedure was repeated twice per sample.
After performing LL and PL test procedures, the water content of each sample was determined as specified in ASTM Test Method D2216 [32]. The samples were oven-dried for twenty-four hours at 95 °C. The oven temperature was then lowered to 40 °C, and the samples were cooled at this temperature for one hour prior to being removed. The samples were weighed, yielding the mass of the container and the oven-dried soil. Then the water content, liquid limit, plastic limit, and plastic index were calculated.
3.2.2. Direct Shear Strength Test
Shear strength analysis was performed using the Gilson Direct Shear Testing instrument. Direct shear testing was performed following ASTM Standard D3080 [33]. Five samples from each burn severity were tested. Each sample was sheared under the following normal loads: 48 kPa (0.5 TSF; tons per square foot), 96 kPa (1.0 TSF), and 192 kPa (2.0 TSF). Approximately 100 g of bulk soil sample was used for each shear test. Prior to shearing, to replicate the in situ partial saturation condition due to the water-repellent layers created by the wildfire, the soil in each test was partially saturated with approximately 25 mL of deionized water and consolidated for approximately sixty minutes. A relatively fast shearing rate of 0.13 cm per minute was performed for each test to simulate the in situ undrained conditions. Active shearing was conducted for four minutes, resulting in a total displacement of 0.52 cm. This procedure was repeated on a separate sample aliquot for each test on all samples at different normal loads.
Shear stress versus displacement was manually recorded at 15-second intervals. The mean values for maximum shear stress under the normal loads of 48 kPa, 96 kPa, and 192 kPa were graphed, and a best-fit line was used to connect the data points, whereby the cohesion and maximum angle of internal friction were derived. The y-intercept represents the value of cohesion, and the maximum angle of internal friction was derived from the slope of the line. The shear strength of the soil is expressed with the equation τ = c + σ ∙ tanφ, where τ is the mean maximum shear strength, c is the cohesion, σ is the normal stress, and φ is the maximum angle of internal friction.
3.3. Soil Compositional Characterization
3.3.1. Grain Size Analysis and SEM Imaging Characterization
Grain size analysis was performed on ten samples from each burn severity using a Mastersizer Hydro G 2000 grain size analyzer (Malvern Panalytical, Malvern, UK) at CSUB. Sample aliquots used for grain size analysis consisted of 1.05 g ± 0.1 g selected from sample material previously used to determine Atterberg limits. The samples were saturated in deionized water for at least twenty-four hours, followed by a five-minute soaking in a solution of Calgon (sodium hexametaphosphate) (4 g/1000 mL distilled H2O) to promote de-coagulation of non-cemented and unfused grains. After the deflocculation–Calgon soaking, a five-minute sonicator bath was used to de-coagulate any remaining aggregates. The sample was then diluted to 1/8 of its original concentration with deionized water. Employing the splitter method, the Mastersizer Hydro G 2000 analyzed samples within an obscuration range of 11–20% [34]. Results were processed in a spreadsheet software program.
To further explore potential changes in grain size resulting from wildfire, scanning electron microscopy was used to identify grain fusion, aggregation, and size distribution with respect to burn severity. Bulk soil samples, three from each burn severity, were analyzed using a Hitachi S-3400N scanning electron microscope with an automated stage. Soil samples were mounted on a sample holder, carbon-coated, and then loaded into the SEM vacuum chamber for imaging. The working distance was set at 10 mm, with beam settings at 20 kV and 70 µA.
3.3.2. Total Organic Carbon Measurement
The Heiri loss-on-ignition (LOI) method was employed to explore the TOC content with respect to burning severity [35]. However, the Heiri LOI method does not account for the dehydration of minerals [36]. Nevertheless, based on the soil composition, dehydration is assumed to be negligible, and the change in mass resulting from LOI is assumed to be attributed to TOC. Ten samples from each burn severity were analyzed using the LOI method. Sample aliquots used for TOC analysis were selected from the sample material previously used to determine Atterberg limits. The mass of each crucible was measured, and roughly 2.0 g was obtained for each sample, which was measured to 0.0001 g. All samples were placed in an oven for 48 h at 45 °C to evaporate all moisture. The dry mass of each sample was measured in its respective crucible and recorded. Following dry-mass measurements, all samples were then placed in an oven for one hour at 600 °C. The oven was turned off, and the samples were allowed to cool gradually to 40 °C before measuring and recording the mass of the samples. The TOC content was then calculated based on the mass difference.
3.3.3. X-ray Diffraction Mineralogy Analysis
Sample preparation was conducted using the following processes [37]. Bulk samples were crushed into a fine powder using the SPEX Sample Prep Shatterbox 8530 for two minutes. Bulk samples were then placed into bulk sample holders and analyzed using a Malvern PANalytical X-ray diffractometer. Clay-size fraction samples were soaked in hydrogen peroxide (3% H2O2) for at least twenty-four hours to eliminate any organic matter. Then, a 250 mL solution of Calgon (sodium hexametaphosphate) (4 g/1000 mL distilled H2O) was added to the beakers. Each beaker was then placed into an ultrasonic bath for several minutes to facilitate deflocculation and disaggregation of sample grains. Samples were then placed into a centrifuge for two minutes, isolating grains of 2 µm and smaller. Oriented aggregates on glass slides were prepared using the filter-peel method and 0.45 µm membranes [38]. Each slide was then placed into the XRD instrument for analysis.
X-ray diffraction analysis was performed on three samples from each burn severity, with a 2θ scanning range from 3° to 40° at 45 kV and 40 mA. MacDiff 4.2.6 software was utilized to help identify the minerals in each sample [39]. The relative abundance was indicated by the simple comparison of peak intensities.
3.4. One-Way Analysis of Variance
One-way analysis of variance (ANOVA) was performed to investigate the variation in means between soil burn severity (SBS) groups while accounting for variation within groups. The significance level was set at 0.05 (α = 0.05). ANOVA was conducted on Atterberg limits, TOC, grain size, and shear strength results. ANOVA results were generated using the data analysis tool in Microsoft Excel [40].
This statistical technique helps determine whether significant differences exist in soil properties with respect to burn severity, or whether the observed differences may be attributed to random variation or error. ANOVA was performed based on the assumption of the null hypothesis: all SBS groups had the same mean value for a given soil property. To test for variation in soil properties with respect to SBS, an F-test was conducted, and the resulting p-value was evaluated. A significant p-value indicated that the results were statistically significant and that there was a variation in soil properties with respect to SBS. An F-test computes a p-value using the test statistic:
where MB is the mean square value between groups and MW is the mean square value within groups. The p-value is computed using the probability distribution of F-values, which is dependent on the degrees of freedom between groups and within groups. If the generated p-value is lower than the set significance level (α = 0.05), then the null hypothesis is rejected. The lower the p-value, the stronger the evidence that significant differences exist in soil properties with respect to burn severity.
F-value = MB/MW,
4. Results
4.1. Atterberg Limits and Plasticity Index
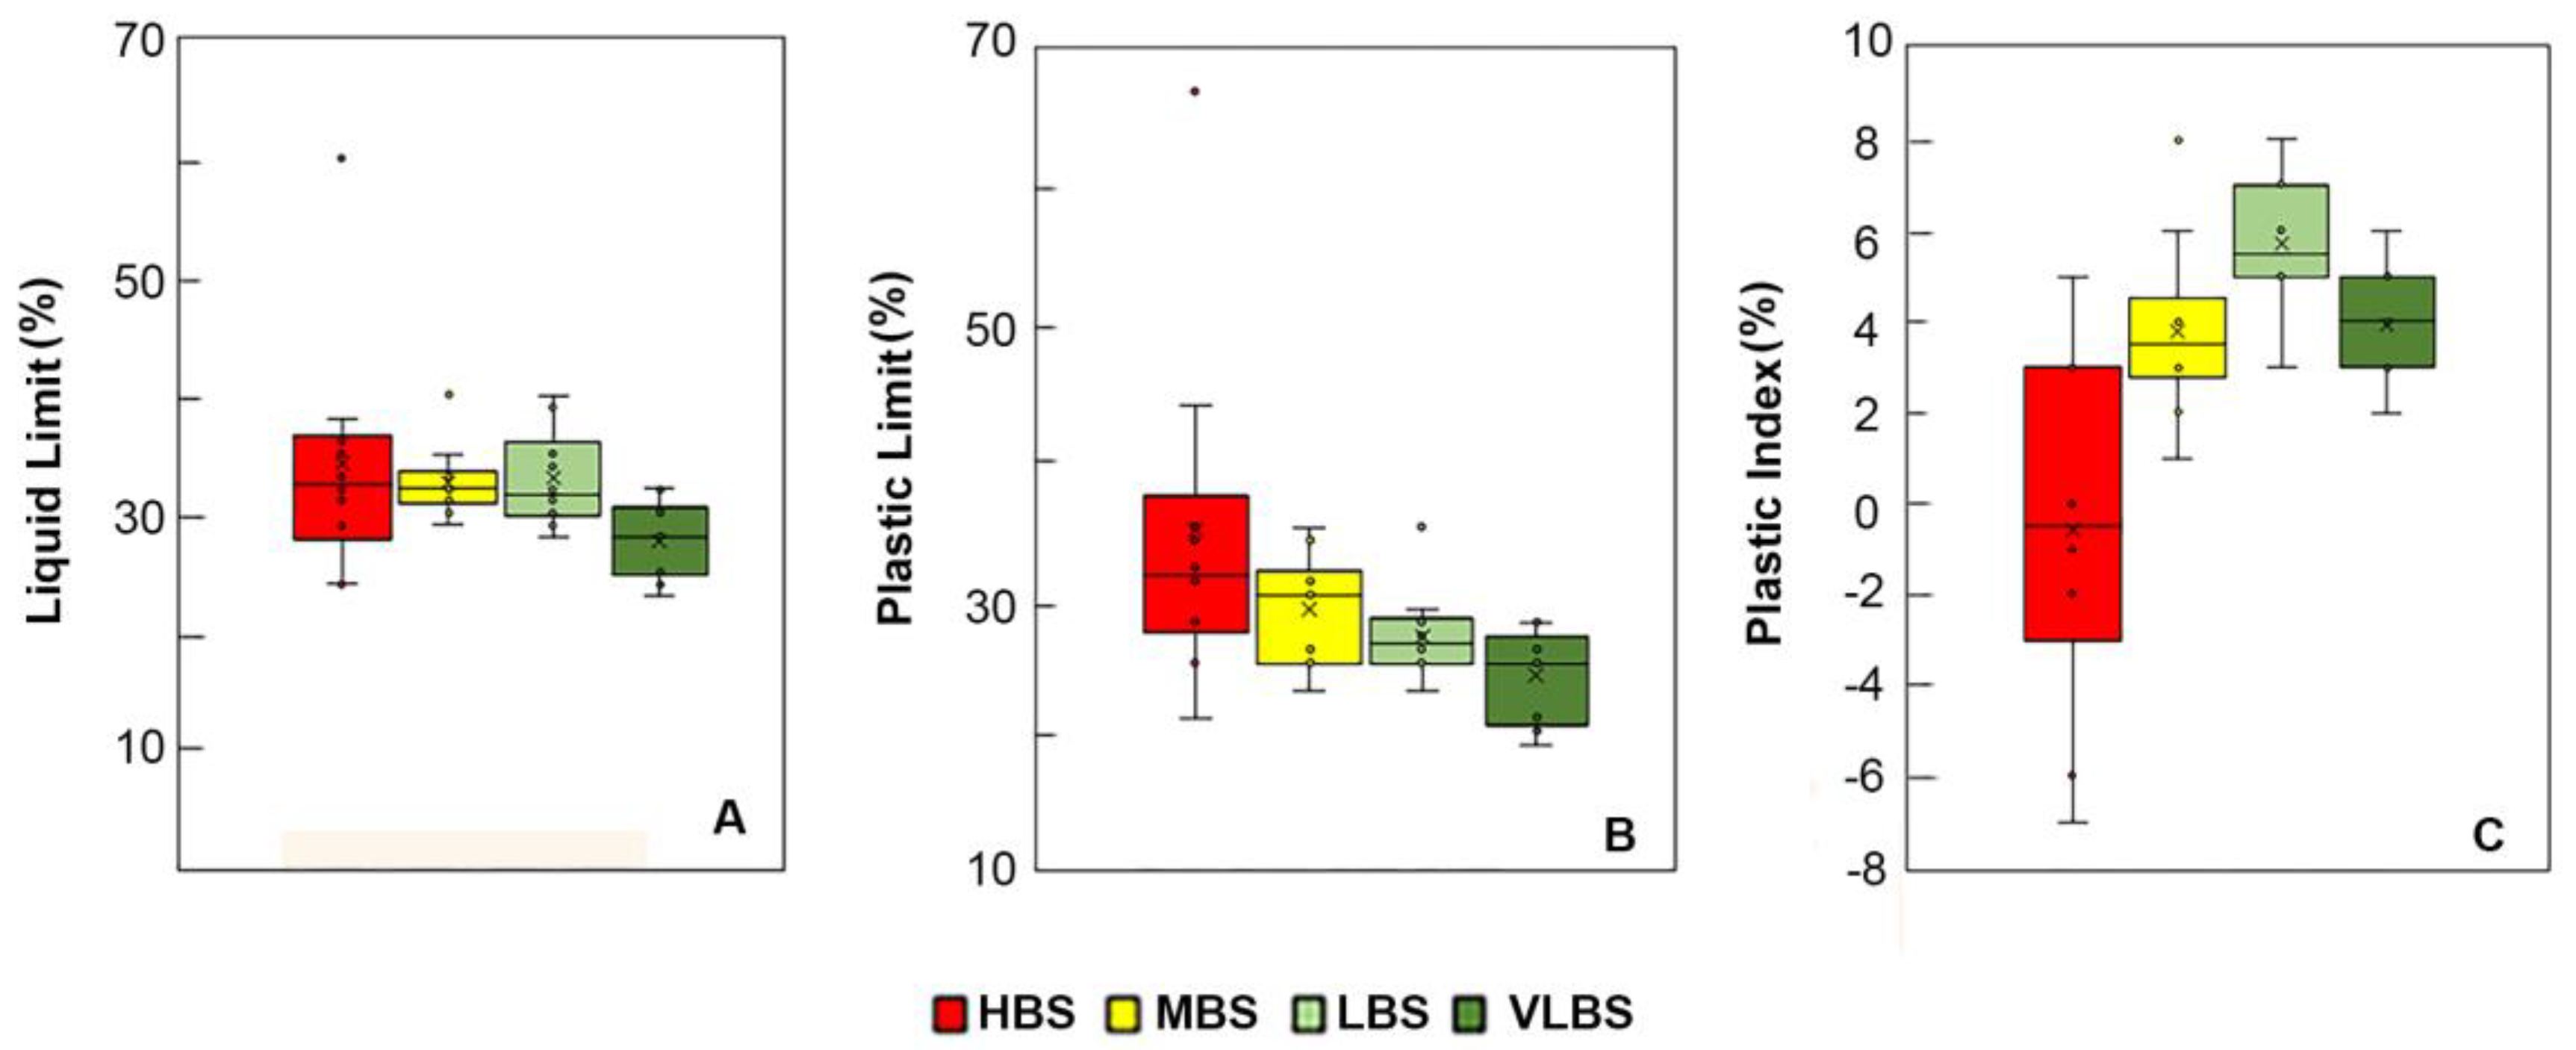
All percentage signs were omitted when reporting LL, PL, and PI. The average LL of HBS soil is 34.2, with a minimum value of 24.0 and a maximum value of 60.0 (Figure 2A). The average LL of MBS soils was 32.6, with a minimum value of 31.0 and a maximum value of 40.0. The average LL of LBS soils was 32.9, with a minimum value of 28.0 and a maximum value of 40.0. The average LL of VLBS soils was 27.5, with a minimum value of 23.0 and a maximum value of 32.0. The variance was highest among HBS soils (Table 1). ANOVA was performed at a significance level of 0.05 (α = 0.05). LL had an F-value of 2.479 and a p-value of 0.077 (Table 1).
The average PL of HBS soils was 34.8, with a minimum value of 21.0 and a maximum value of 67.0 (Figure 2B). The average PL of MBS soils was 29.0, with a minimum value of 23.0 and a maximum value of 34.0. The average PL of LBS soils was 27.0, with a minimum value of 23.0 and a maximum value of 35.0. The average PL of VLBS soils was 23.6, with a minimum value of 19.0 and a maximum value of 28.0. The variance was highest among HBS soils (Table 2). ANOVA was performed at a significance level of 0.05 (α = 0.05). PL had an F-value of 4.291 and a p-value of 0.011 (Table 2).
The average PI for HBS soils was −0.6, with a minimum value of −7.0 and a maximum value of 5.0 (Figure 2C). The average PI for MBS soils was 3.8, with a minimum value of 1.0 and a maximum value of 8.0. The average PI for LBS soils was 5.7, with a minimum value of 3.0 and a maximum value of 8.0. The average PI for VLBS soils was 3.9, with a minimum value of 2.0 and a maximum value of 6.0. The PI in seven out of ten HBS samples was found to be less than or equal to zero. No samples in less severely burned soils were found to have a PI less than or equal to zero.
4.2. Total Organic Carbon
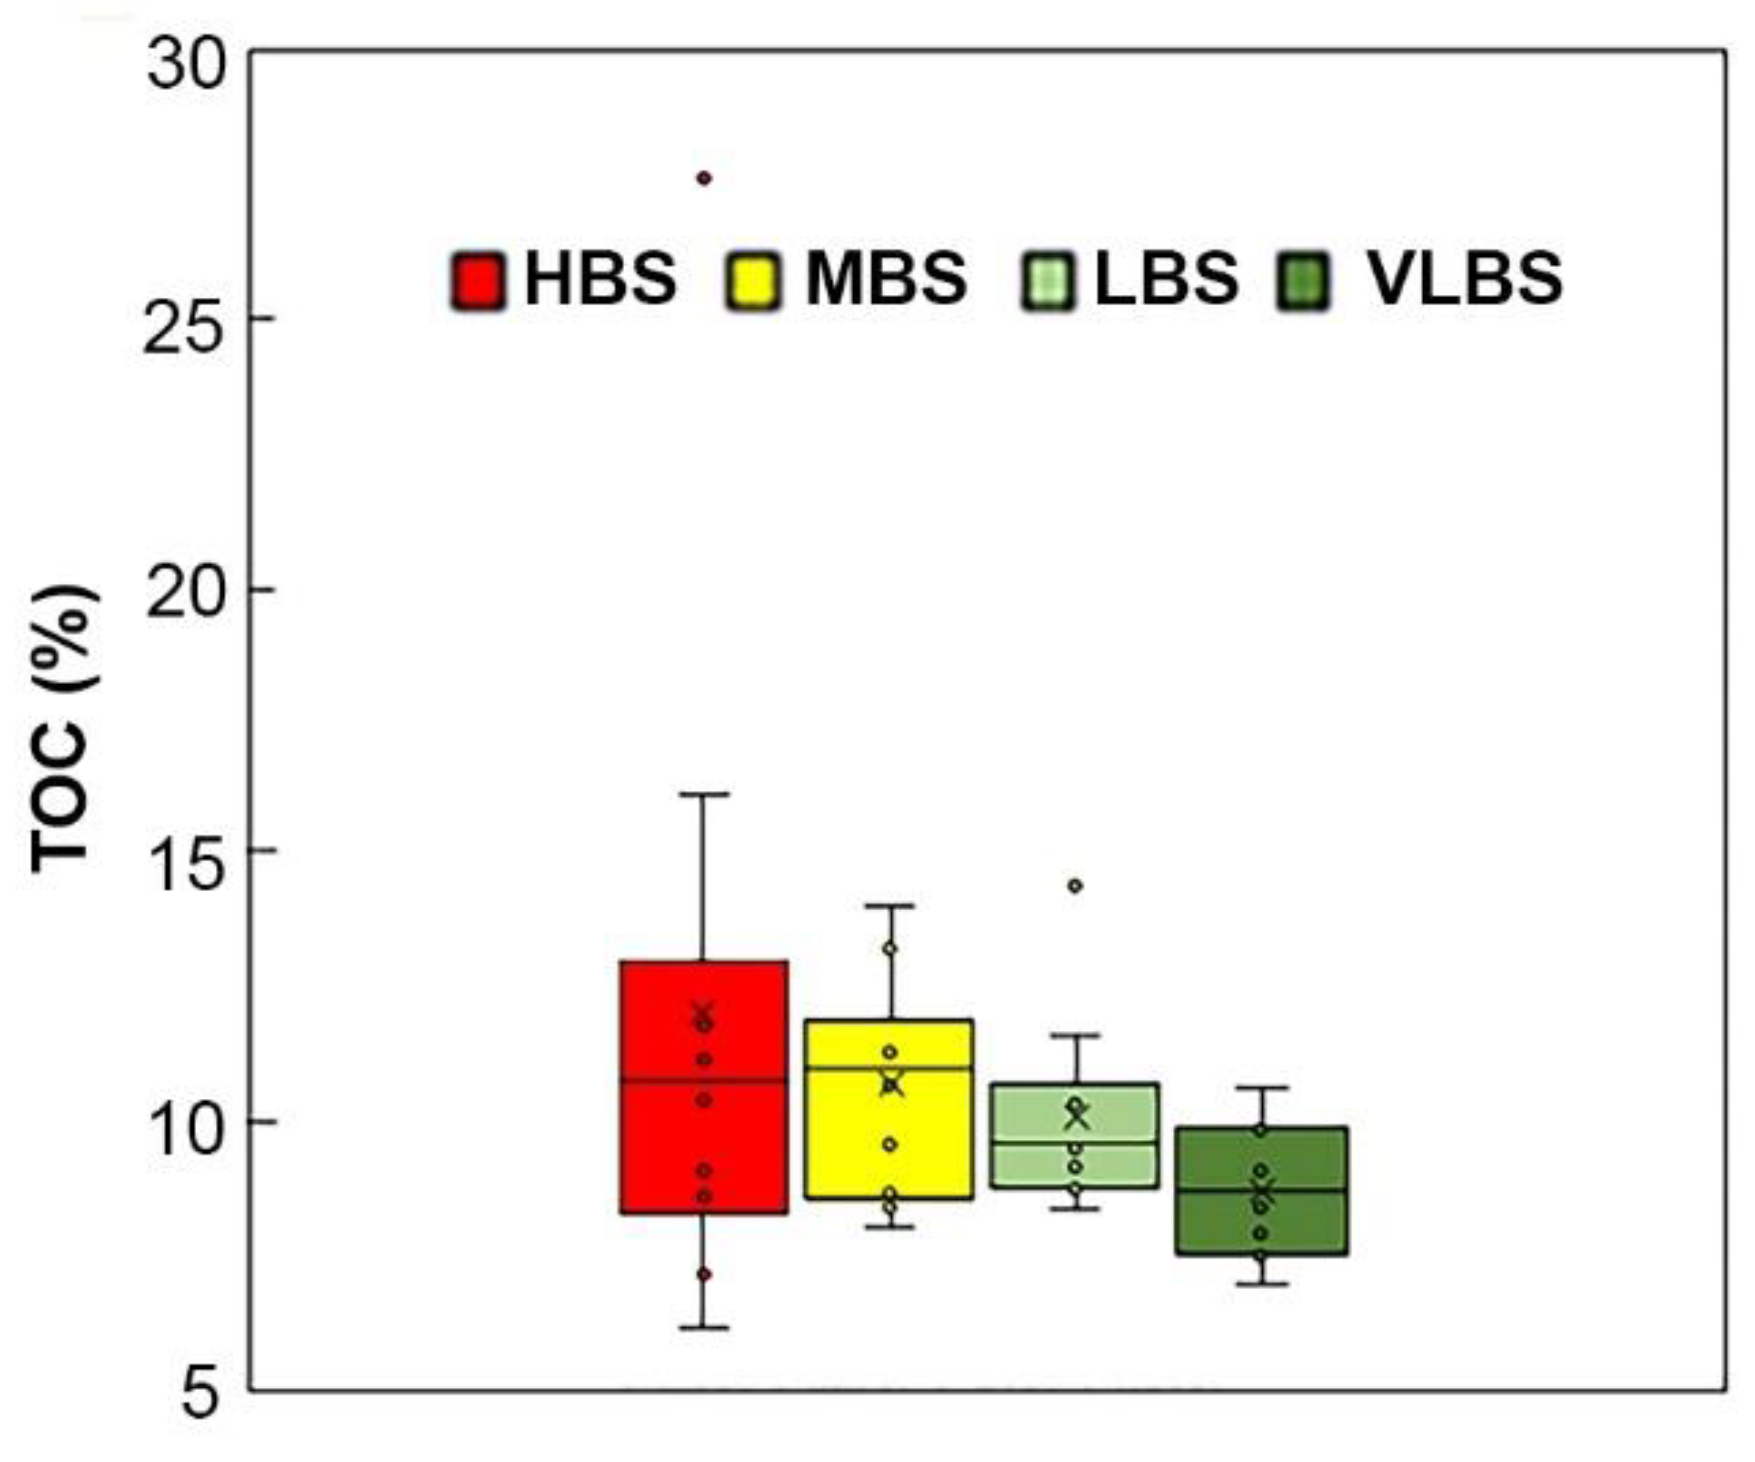
The average TOC content in percent by mass for HBS, MBS, LBS, and VLBS soils were 12.0%, 10.7%, 10.1%, and 8.7%, respectively (Figure 3). A maximum TOC content of 27.7% and a minimum TOC content of 6.1% were found in HBS soils. A maximum TOC content of 14.1% and a minimum content of 8.0% were found in MBS soils. A maximum TOC content of 14.5% and a minimum content of 8.3% were found in LBS soils. A maximum TOC content of 10.6% and a minimum content of 6.9% were found in VLBS soils.
ANOVA was performed on TOC at a significance level of 0.05 (α = 0.05). Variance is highest among HBS soils and lowest among LBS soils, with values of 38.4% and 1.5%, respectively. ANOVA revealed an F-value of 1.608 and a p-value of 0.204 (Table 3).
4.3. Grain Size Analysis and SEM Imaging Characterization
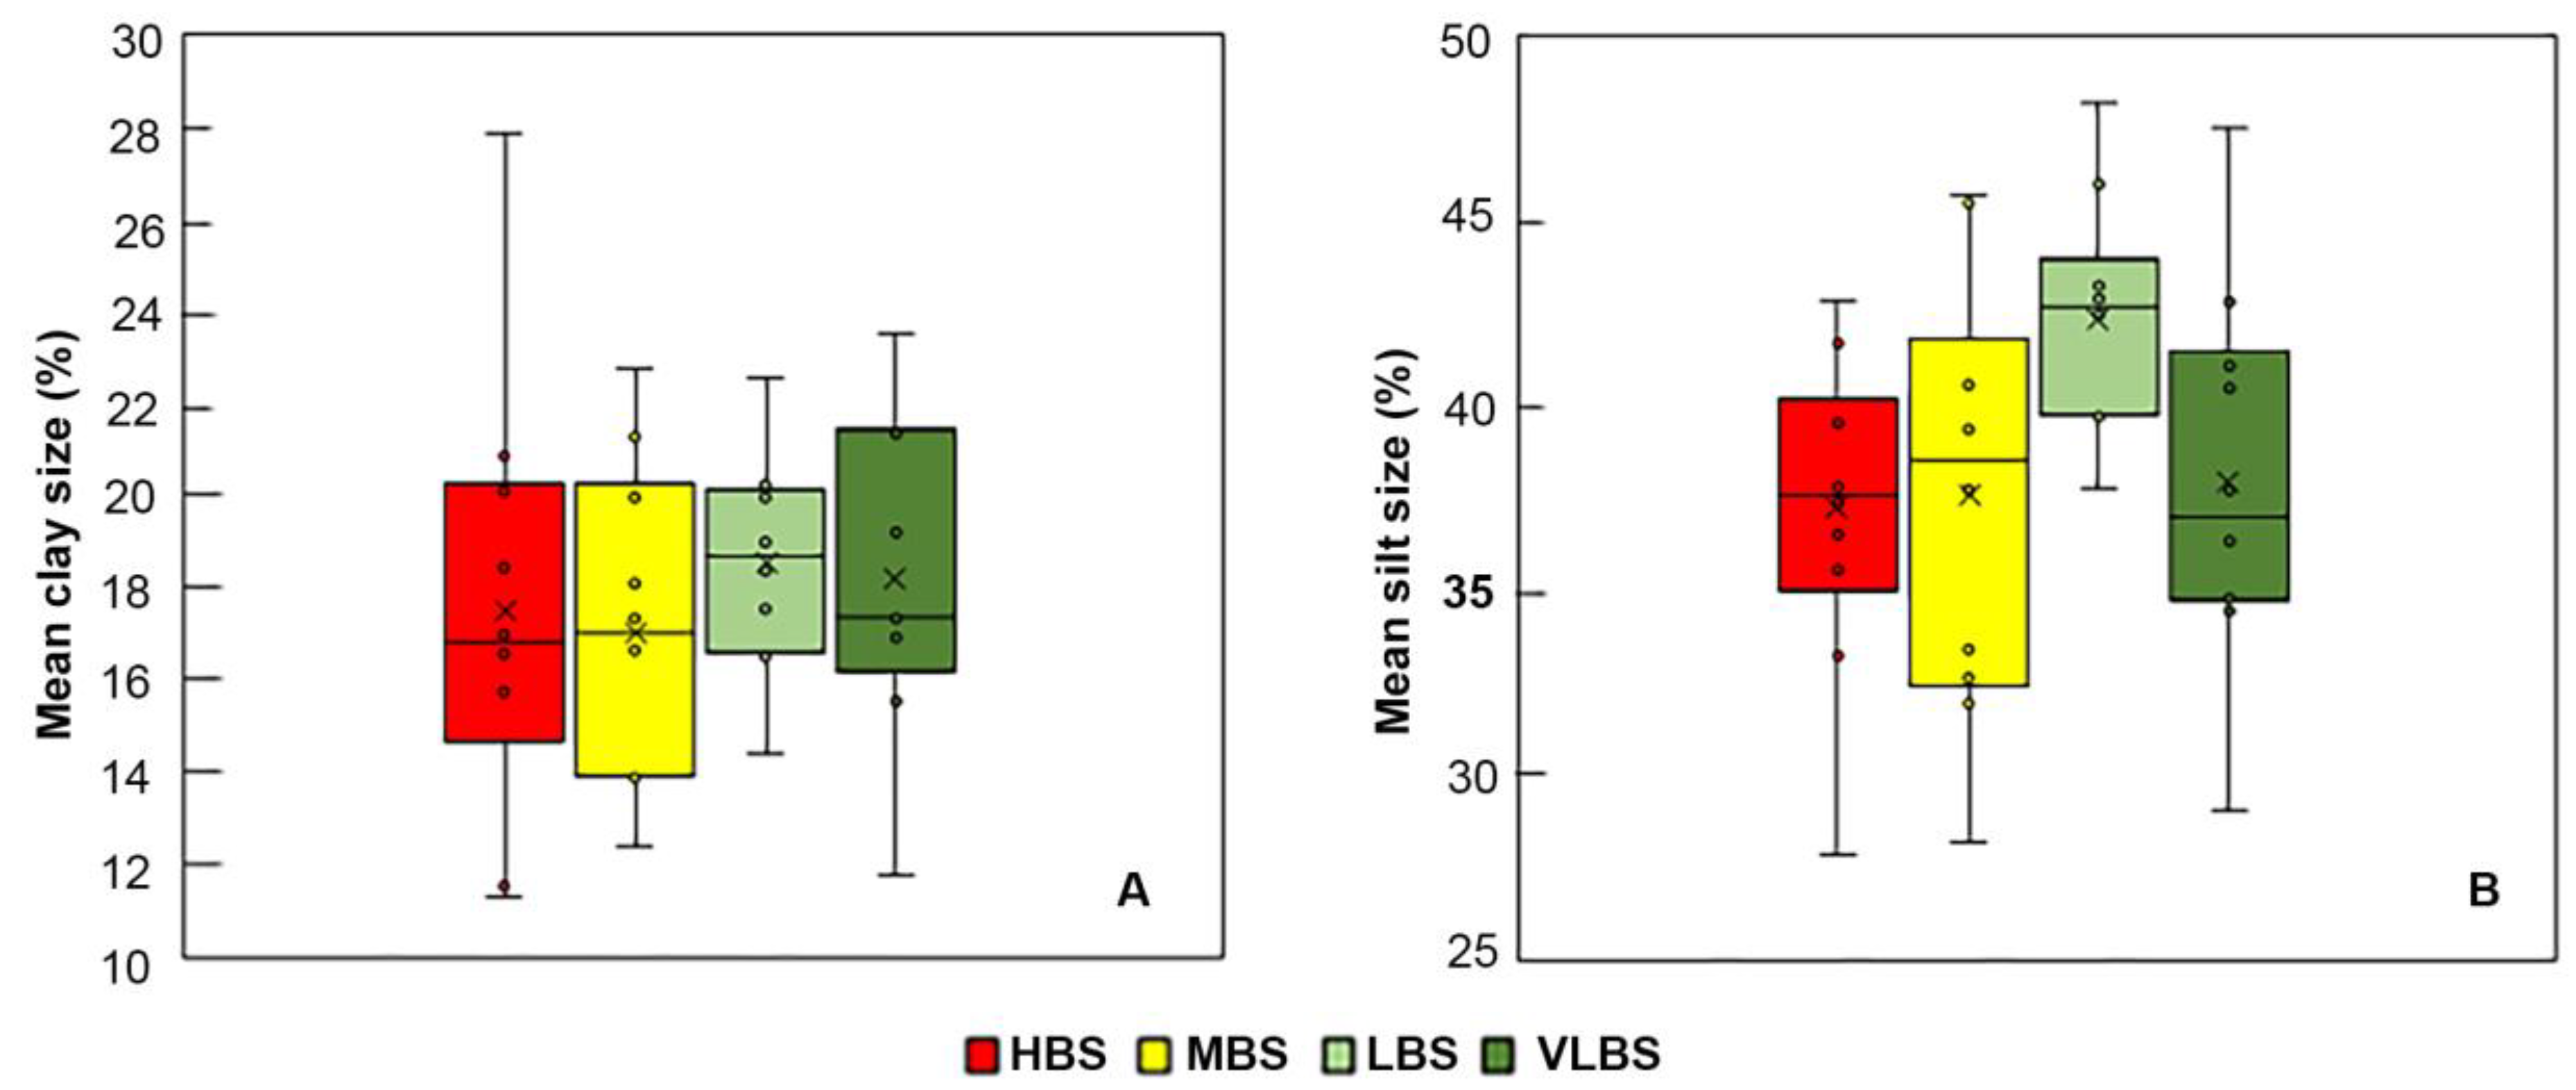
The mean percentage of clay-size particles (≤3.99 µm) in HBS soils was 17.5%, while the mean percentage of clay-size particles in MBS, LBS, and VLBS soils was 17.1%, 18.6%, and 19.1%, respectively (Figure 4A). ANOVA was performed at a significance level of 0.05 (α = 0.05), which revealed that the variance was highest among HBS soil and lowest among LBS soil, with values of 23.4% and 5.6%, respectively. ANOVA further revealed an F-value of 0.566 and a p-value of 0.641 (Table 4).
The mean percentages of silt-size particles (4.00–62.50 µm) for HBS, MBS, LBS, and VLBS soils were 37.2%, 37.6%, 42.4%, and 38.0%, respectively (Figure 4B). ANOVA was performed at a significance level of 0.05 (α = 0.05), which revealed that the variance was highest among MBS soil and lowest among LBS soil, with values of 35.2% and 10.3%, respectively. ANOVA also revealed an F-value of 2.524 and a p-value of 0.073 (Table 5).
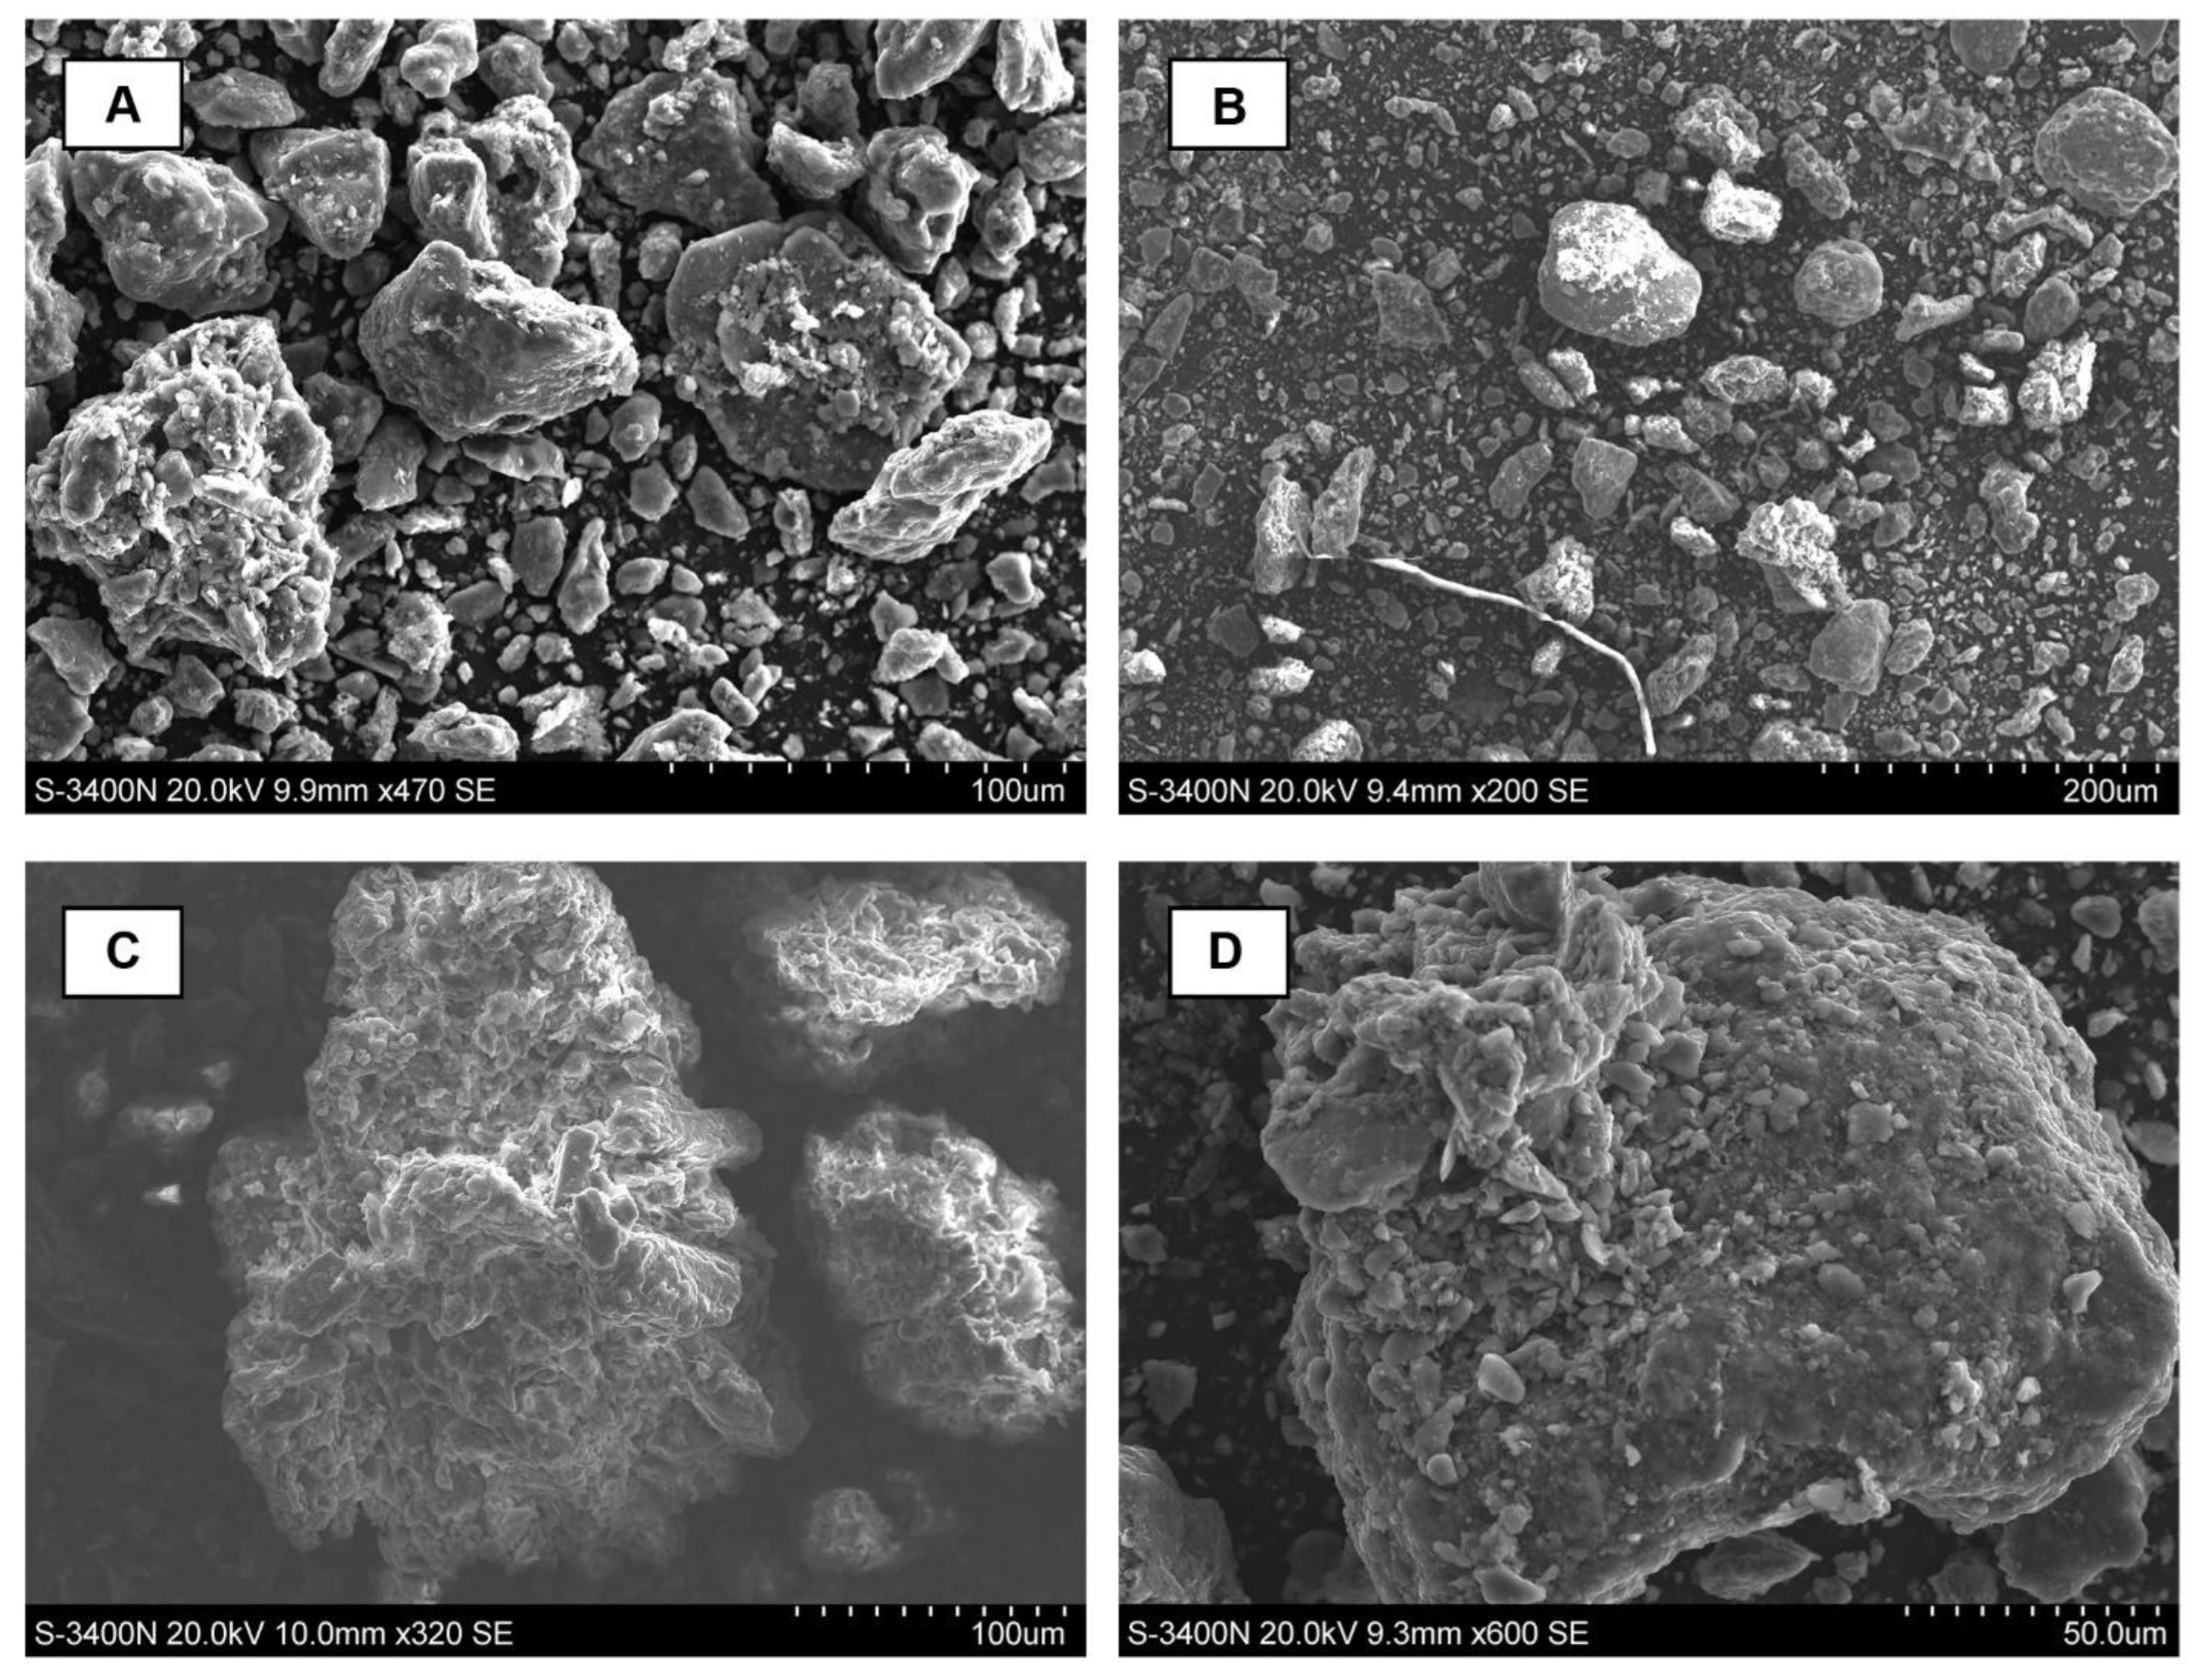
SEM images show that particle size distributions among all samples are consistent with unburned (VLBS) soil. Clay-, silt-, and sand-size particles were observed in all samples (Figure 5). Thus, no significant variance was observed in grain size distribution with respect to burn severity. Evidence of grain fusion and aggregation was not observed in any of the samples.
4.4. Direct Shear Strength
Under a normal load of 48 kPa, the average peak shear stress values for HBS, MBS, LBS, and VLBS soils were 74.5 kPa, 63.4 kPa, 60 kPa, and 60 kPa, respectively (Figure 6). HBS soil had the highest peak shear stress of 116.5 kPa under a normal load of 96 kPa. MBS soil had a peak shear stress of 115.8 kPa under a load of 96 kPa. LBS and VLBS soils had the same peak shear stress value of 102.0 kPa under a normal load of 96 kPa. The peak shear stress values for HBS, MBS, LBS, and VLBS soils under a normal load of 192 kPa were 202.0 kPa, 197.2 kPa, 173.9 kPa, and 175.4 kPa, respectively.
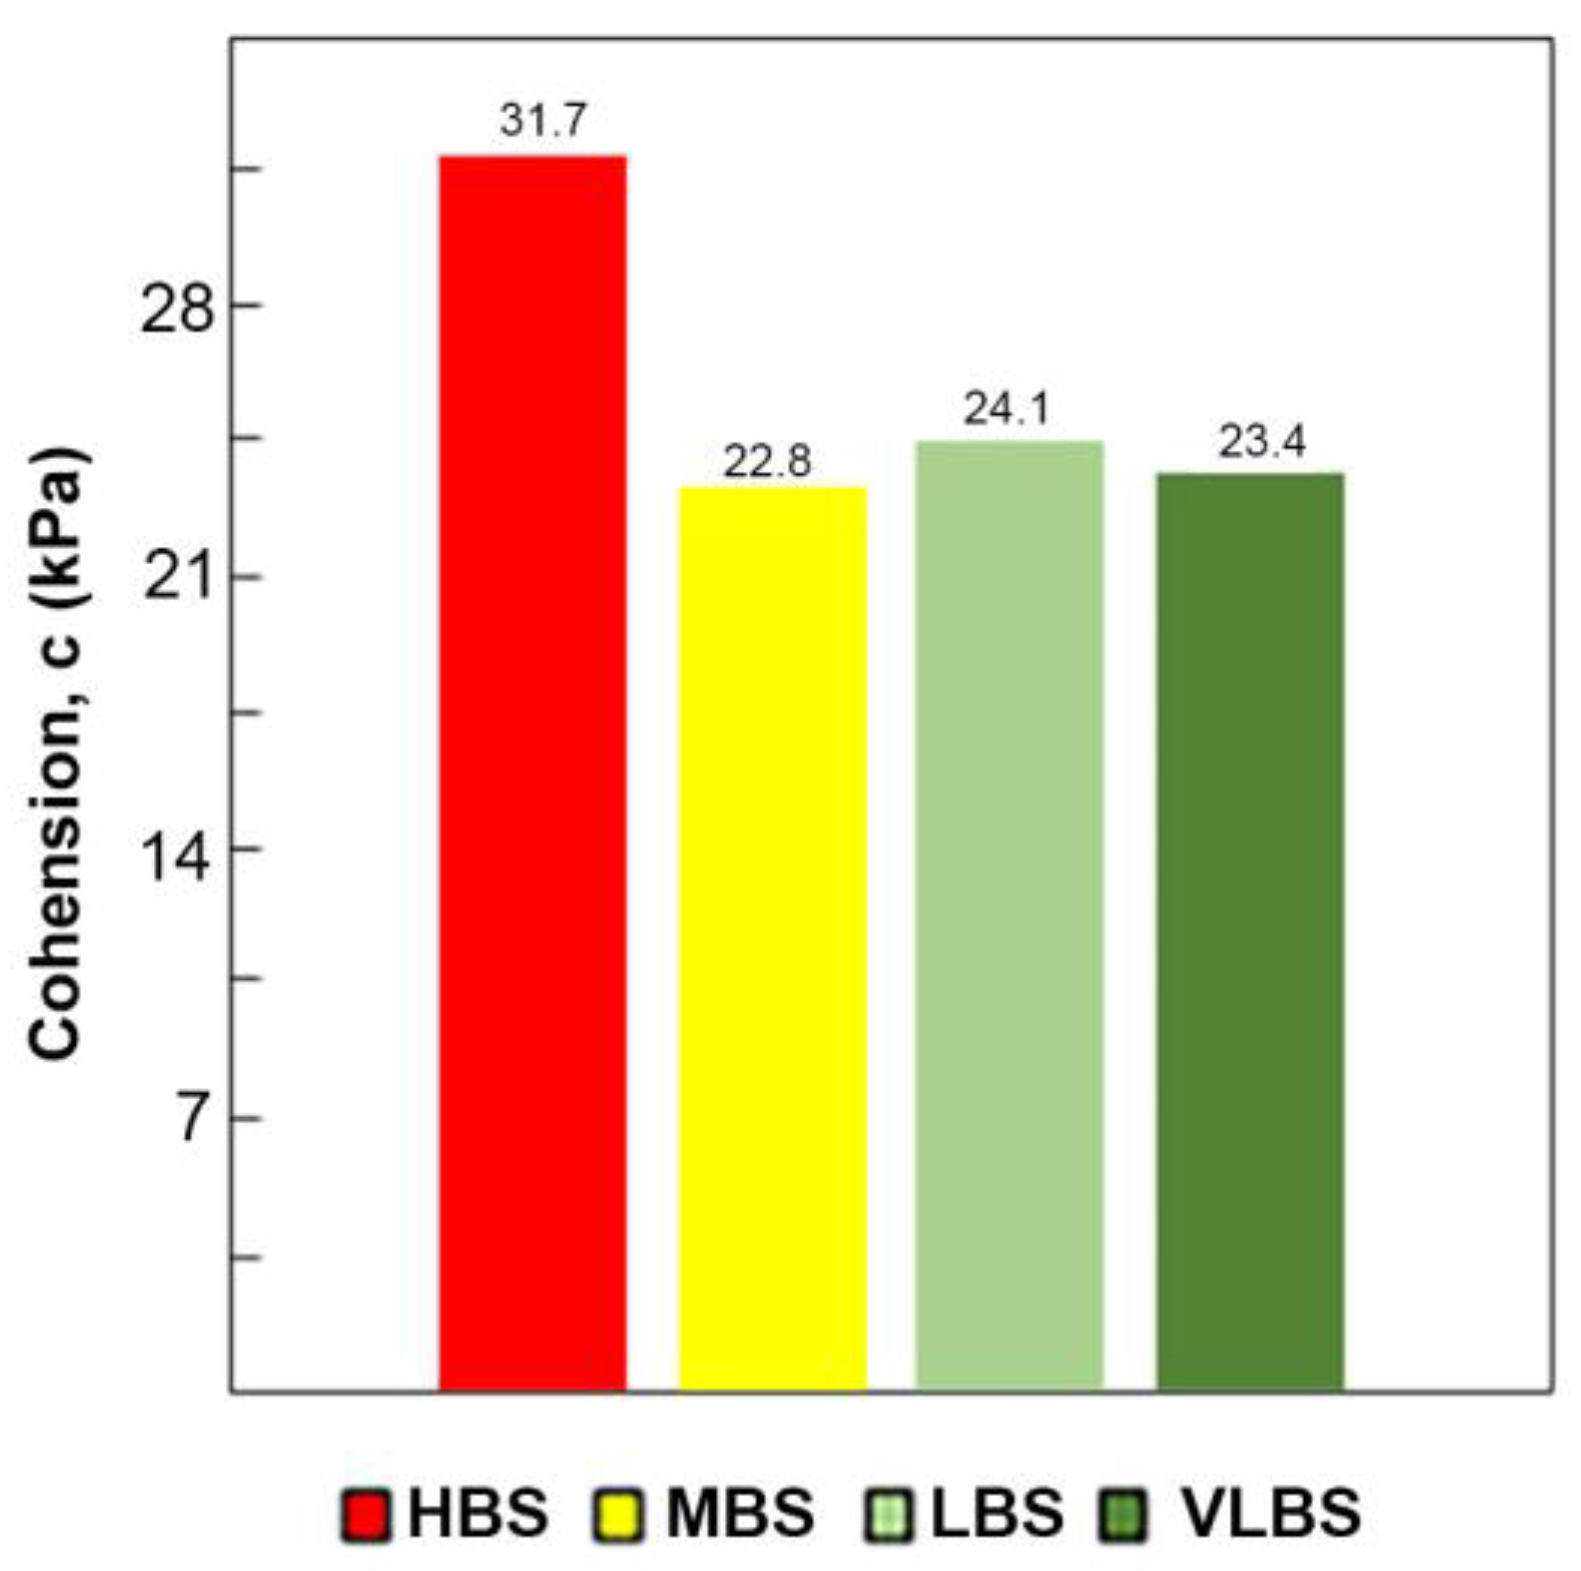
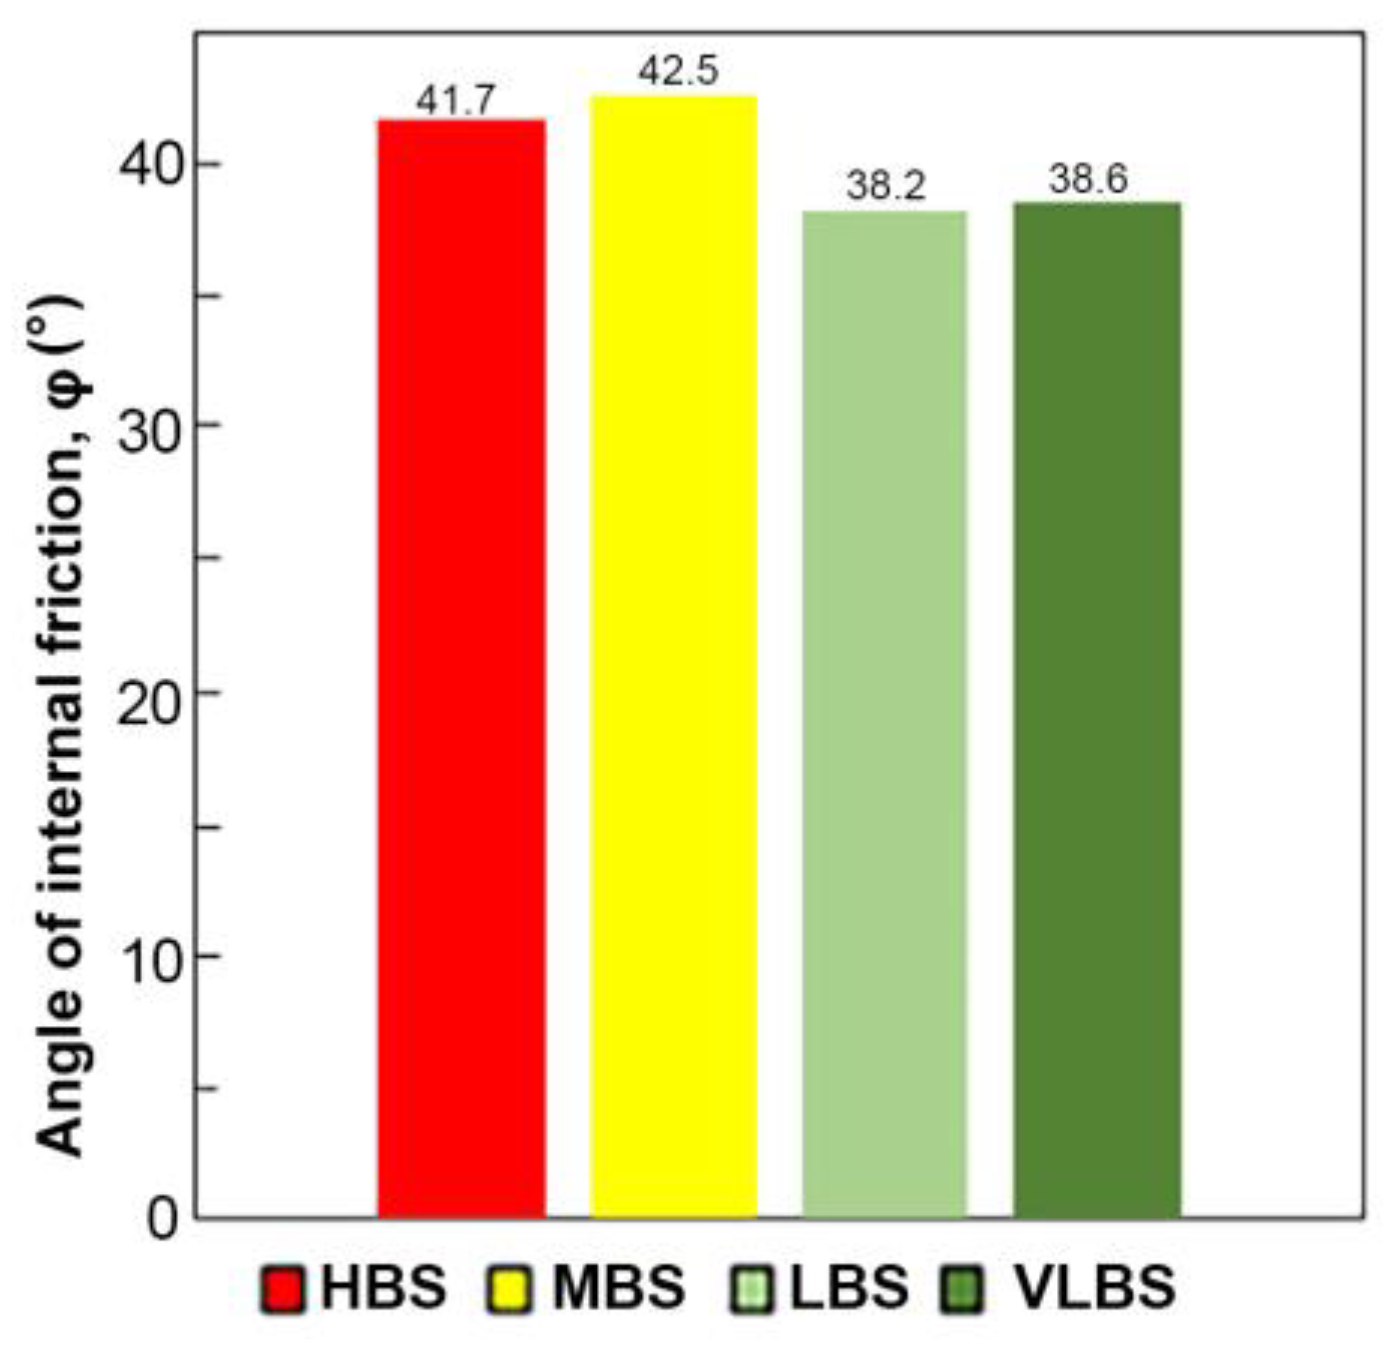
HBS soil had the highest cohesion value of 31.7 kPa (Figure 7). Cohesion values for MBS, LBS, and VLBS soils were 22.8 kPa, 24.1 kPa, and 23.4 kPa, respectively. The MBS soil had the highest angle of internal friction of 42.5° (Figure 8). The angle of internal friction values for HBS, LBS, and VLBS soils were 41.7°, 38.2°, and 38.6°, respectively.
ANOVA was performed at a significance level of 0.05 (α = 0.05). ANOVA results for a normal stress of 48 kPa revealed an F-value of 7.671 and a p-value of 0.002 (Table 6). The variance was highest among MBS soil and lowest among VLBS soil, with values of 1.213 and 0.047, respectively. ANOVA results for a normal stress of 96 kPa revealed an F-value of 6.487 and a p-value of 0.004 (Table 7). The variance was highest among HBS soil and lowest among MBS soil, with values of 2.097 and 0.505, respectively. ANOVA results for normal stress of 192 kPa revealed an F-value of 3.103 and a p-value of 0.056 (Table 8). The variance was highest among VLBS soil and lowest among HBS soil, with values of 16.208 and 2.505, respectively.
4.5. X-ray Diffraction Analysis
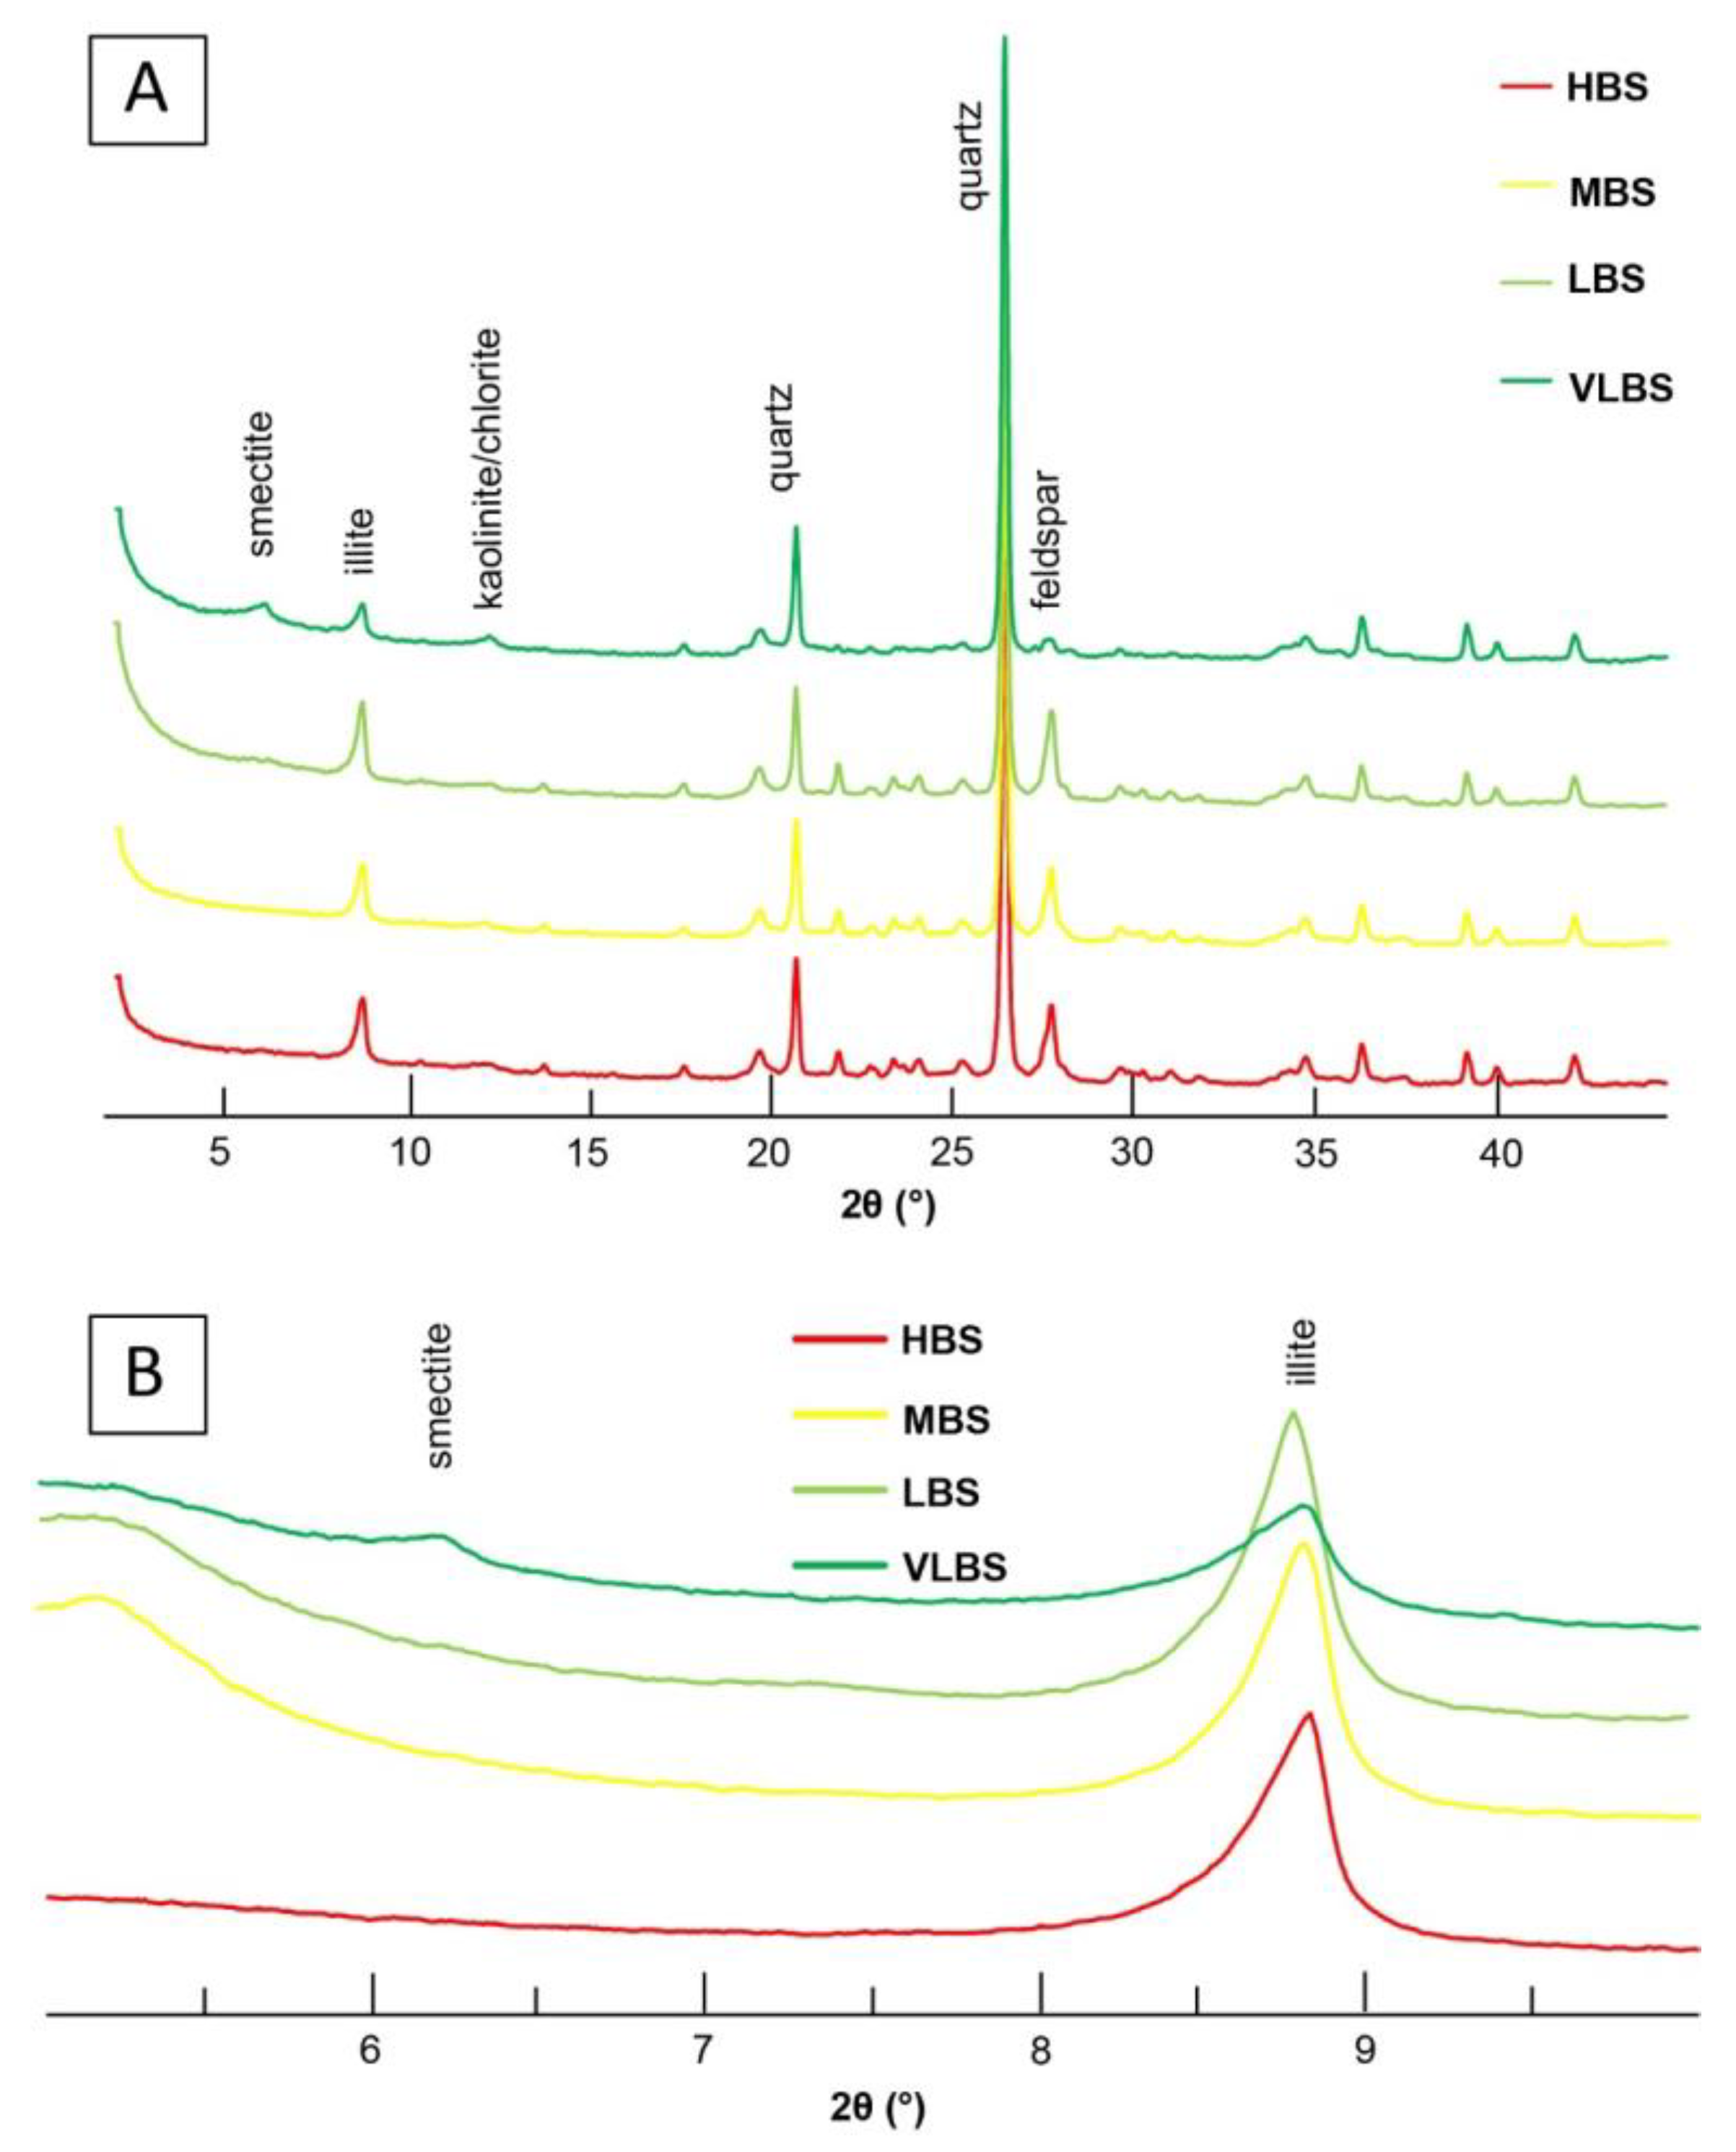
The mineralogical analysis revealed that the abundant minerals included illite, smectite, and kaolinite/chlorite (Figure 9). Based on the simple comparison of peak intensity, it was observed that the abundance of smectite and kaolinite/chlorite was lower in soils with higher burn severities. No other significant trends were observed.
5. Discussion
5.1. Total Organic Carbon
The results of this study show that TOC content is highest in HBS soils, and the trends revealed that the lower the burn severity, the lower the TOC content, as illustrated in Figure 4A. These findings are inconsistent with other studies that found that TOC decreases with increasing burn severity [13,15,41]. Organic material from peripheral lands can be introduced to burned soils, which can increase soil TOC, leaving the possibility of external organic inputs in this study’s sample locations [15]. However, pre-fire satellite imagery (Figure 1B) reveals a variation in vegetative density concerning the sampling locations of each burn severity, with the highest vegetation density within the HBS sampling area. This imagery indicates that TOC contents are likely inherent to the sample location, so the introduction of organic matter from external inputs may not be required to explain the observed TOC values. Although there is variation in TOC among different soil burn severities, ANOVA revealed these results to be statistically insignificant, indicating the need for more analyses to better understand the correlation between changes in TOC content and soil burn severity.
5.2. Soil Particle Size
No trend was observed in the abundance of clay- and silt-sized grains with respect to burn severity (Figure 4A,B). HBS and MBS soils have a lower abundance of clay-sized grains than LBS and VLBS soils. This may be due to greater vegetative denudation within HBS and MBS sample areas, which could have facilitated the erosion of clay-sized grains from the burn scar, leading to lower abundances among these soils [42]. Additionally, scanning electron microscopy was employed to visually detect evidence of grain fusion, but no diagnostic evidence of grain fusion was observed in the samples (Figure 5). This finding is inconsistent with previous studies, which found a coarsening trend with increasing burn severity [7,18]. The absence of a grain-coarsening trend suggests that the temperatures in the Erskine fire were not high enough to cause the fusion of clays [15,18]. ANOVA analysis revealed these results to be statistically insignificant, and they are also supported by the presence of TOC in all samples. Furthermore, since the majority of the Erskine Fire was shrubland, this further supports the assertion that temperatures were not high enough to cause grain fusion.
5.3. Soil Mineralogy
The impact of soil heating on soil stability can vary, as shown in previous research [15]. Soil heating can affect the primary binding agents in soils and their mineral composition. For instance, soils mainly bound by organic material have exhibited decreases in soil aggregate stability after a wildfire, while soils mainly bound by various mineral cements can exhibit increases in soil aggregate stability [13,15]. Products of kaolinite decomposition can act as cementing agents that increase aggregate stability in fire-affected soils, as suggested by previous studies [13,15].
The results of this study indicate that mineral transformations may have occurred only in HBS soil. As shown in Figure 9, kaolinite/chlorite abundance is lower in HBS soil, suggesting that temperatures reached 550 °C, the temperature at which kaolinite is destroyed. However, the presence of TOC in all samples suggests that temperatures did not exceed 450°C unless external inputs contributed to the TOC content. Although minerals can decompose at temperatures lower than 550 °C, no other trends in mineral composition and abundance were observed in this study with respect to burn severity. Thus, it is possible that temperatures required for kaolinite decomposition were limited, which could have allowed TOC to remain in these areas. These findings are consistent with other studies, indicating that a decrease in kaolinite is usually restricted to moderate and severe fire zones [15] and this process of kaolinite decomposition is not a factor to cause the highest strength of HBS soils. Instead, the destruction of clay minerals can make soils more susceptible to erosion [7].
5.4. Soil Atterberg Limits and Plasticity Index
Atterberg limits results revealed a trend of higher LL values as burn severity increased (Figure 2A). PL shared a similar trend with LL (Figure 2B). PL is highest among HBS soils and lowest among unburned soils. ANOVA analysis revealed the results for LL to be statistically insignificant, but the results for PL were found to be statistically significant with a p-value of 0.01. HBS soils have the highest TOC, and there is a trend of decreasing TOC with decreasing burn severity. The correlation between burn severity and Atterberg limits [6], as seen in previous research where the destruction of organic matter resulted in a decrease in Atterberg limits [13], could potentially be accounted for by this particular trend. It appears that TOC content is the factor that most influences the Atterberg limits. The soil’s vulnerability to slaking and dispersion on wetting increased as the organic matter content decreased with decreasing burn severity, indicating that it is very easy for the soils to reach a plastic limit in the case of short-term rainfall, and coupled with looser soil and lower soil shear strength (Figure 6), it is easy for them to be eroded by runoffs.
5.5. Soil Direct Shear Strength
HBS soils exhibited the highest shear strength among all soils and under all normal loads (Figure 6). ANOVA revealed shear strength results to be statistically significant under normal loads of 48 kPa and 96 kPa and statistically insignificant under a normal load of 192 kPa (Table 6, Table 7 and Table 8). A trend of decreasing shear strength with decreasing burn severity was also demonstrated.
Soil shear strength is determined by the cohesive forces between soil particles [43,44]. The strength is directly linked to the soil’s aggregate stability, which, in turn, is affected by intrinsic properties such as clay and organic matter [43]. The texture of the soil also has an impact on its strength. Coarse-textured soils rely on frictional forces, while fine-textured soils depend on cohesive forces. The concentration of organic matter in the soil affects its shear strength by modifying the cohesion between soil particles and structural stability [45]. The impact of soil organic matter on shear strength is somewhat inconsistent according to various studies. For instance, some researchers [45,46] have reported that an increase in soil organic matter concentration leads to a decrease in shear strength. They attributed this to the organic matter’s ability to reduce bulk density [47,48], which results in a weaker soil structure. However, other studies [49,50,51,52,53] have found that increasing soil organic matter concentration enhances shear strength.
Our findings suggest that TOC is the primary factor influencing shear strength and cohesion, as evidenced by the correlation between high TOC content and high shear strength and cohesion in HBS soils (as shown in Figure 3 and Figure 6). This is because soil organic matter enhances the cohesive forces among soil particles (Figure 7), which has a direct effect on soil shear strength [15,54]. Instead, the slight difference in cohesion among the MBS, LBS, and VLBS samples could be due to their comparable particle size and relatively lower TOC content.
6. Conclusions
The findings from the 2016 Erskine Fire sample analysis show that:
- (1)
- LL and PL decrease with lower burn severity.
- (2)
- TOC is less abundant with decreasing burn severity, and XRD analysis reveals lower smectite and kaolinite/chlorite abundances in HBS soils compared to soils with lower burn severities. Mineralogical trends may have been influenced by localized fire temperatures.
- (3)
- No correlation was found between burn severity and the size of clay- or silt-size grains. Direct shear test results indicate higher shear strengths with greater burn severity.
- (4)
- Previous studies on the effects of wildfires on soil properties have produced varied results, with some revealing correlations between burn severity and physical properties, while others did not. The results of this study suggest that multiple factors influence soil physical and mechanical properties, with TOC content being the most significant factor impacting Atterberg limits and shear strength. Other soil properties likely have a lesser impact on soil shear strength, but their influence can be moderated or amplified by other factors.
Author Contributions
Conceptualization, S.H., J.G. and W.K.; software, E.M.; investigation, S.H.; resources, J.G.; writing—original draft, S.H. and J.G.; writing—review and editing, S.H. and J.G.; visualization, S.H. and J.G.; supervision, J.G.; project administration, E.M.; funding acquisition, E.M., W.K. and J.G. All authors have read and agreed to the published version of the manuscript.
Funding
This work was supported by the U.S. National Natural Science Foundation (NSF HRD-1547784).
Data Availability Statement
The authors can provide access to test data upon request.
Acknowledgments
The authors acknowledge the practical support of California State University, Bakersfield, and the U.S. National Science Foundation.
Conflicts of Interest
The authors declare that they have no known competing financial interests or personal relationships that could have appeared to influence the work reported in this paper.
References
- Fernandez-Anez, N.; Krasovskiy, A.; Müller, M. Current Wildland Fire Patterns and Challenges in Europe: A Synthesis of National Perspectives. Air Soil Water Res. 2021, 14, 11786221211028185. [Google Scholar] [CrossRef]
- Dennison, P.E.; Brewer, S.M.; Arnold, J.D.; Moritz, M.A. Large wildfire trends in the western United States, 1984–2011. Geophys. Res. Lett. 2014, 41, 2928–2933. [Google Scholar] [CrossRef]
- Lentile, L.B.; Holden, Z.A.; Smith, A.M.S.; Falkowski, M.J.; Hudak, A.T.; Morgan, P.; Gessler, P.E.; Benson, N.C. Remote sensing techniques to assess active fire and post-fire effects. Int. J. Wildland Fire 2006, 5, 319–345. [Google Scholar] [CrossRef]
- Keeley, J.E. Fire intensity, fire severity and burn severity: A brief review and suggested usage. Int. J. Wildland Fire 2009, 18, 116–126. [Google Scholar] [CrossRef]
- Cannon, S.H.; DeGraff, J. The increasing wildfire and post-fire debris-flow threat in western USA, and implications for consequences of climate change. In Landslides–Disaster Risk Reduction; Springer: Berlin/Heidelberg, Germany, 2009; pp. 177–190. [Google Scholar]
- Staley, D.M.; Tillery, A.C.; Kean, J.W.; McGuire, L.A.; Pauling, H.E.; Renger, F.K.; Smith, J.B. Estimating post-fire debris-flow hazards prior to wildfire using a statistical analysis of historical distributions of fire severity from remote sensing data. Int. J. Wildland Fire 2018, 27, 595–608. [Google Scholar] [CrossRef]
- Deng, Y.; Cai, C.; Xia, D.; Ding, S.; Chen, J.; Wang, T. Soil Atterberg limits of different weathering profiles of the collapsing gullies in the hilly granitic region of southern China. Solid Earth 2017, 8, 499–513. [Google Scholar] [CrossRef]
- Moody, J.A.; Ebel, B.A. Infiltration and runoff generation processes in fire-affected soils. Hydrol. Process. 2014, 28, 3432–3453. [Google Scholar] [CrossRef]
- Parise, M.; Cannon, S.H. Wildfire impacts on the processes that generate debris flows in burned watersheds. Nat. Hazards 2012, 61, 217–227. [Google Scholar] [CrossRef]
- Casadei, M.; Dietrich, W.E.; Miller, N.L. Testing a model for predicting the timing and location of shallow landslide initiation in soil-mantled landscapes. Earth Surf. Process. Landf. 2003, 28, 925–950. [Google Scholar] [CrossRef]
- Qi, G.Q.; Huang, R.Q. Study on formation mechanism of debris flow based on unsaturated soil mechanics theory. Chin. J. Geol. Hazard Control 2003, 14, 12–15. [Google Scholar]
- Mataix-Solera, J.; Arcenegui, V.; Tessler, N.; Zornoza, R.; Wittenberg, L.; Martínez, C.; Caselles, P.; Pérez-Bejarano, A.; Malkinson, D.; Jordán, M.M. Soil properties as key factors controlling water repellency in fire-affected areas: Evidences from burned sites in Spain and Israel. Catena 2013, 108, 6–13. [Google Scholar] [CrossRef]
- Vacchiano, G.; Stanchi, S.; Marinari, G.; Ascoli, D.; Zanini, E.; Motta, R. Fire severity, residuals and soil legacies affect regeneration of Scots pine in the Southern Alps. Sci. Total Environ. 2014, 472, 778–788. [Google Scholar] [CrossRef] [PubMed]
- Cannon, S.H.; Gartner, J.E.; Rupert, M.G.; Michael, J.A.; Rea, A.H.; Parrett, C. Predicting the probability and volume of postwildfire debris flows in the intermountain western United States. GSA Bull. 2010, 122, 127–144. [Google Scholar] [CrossRef]
- Mataix-Solera, J.; Cerdà, A.; Arcenegui, V.; Jordán, A.; Zavala, L.M. Fire effects on soil aggregation: A review. Earth-Sci. Rev. 2011, 109, 44–60. [Google Scholar] [CrossRef]
- Tan, Ö.; Yılmaz, L.; Zaimoğlu, A.S. Variation of some engineering properties of clays with heat treatment. Mater. Lett. 2004, 58, 1176–1179. [Google Scholar] [CrossRef]
- González-Pérez, J.A.; González-Vila, F.J.; Almendros, G.; Knicker, H. The effect of fire on soil organic matter—A review. Environ. Int. 2004, 30, 855–870. [Google Scholar] [CrossRef]
- Neary, D.G.; Klopatek, C.C.; DeBano, L.F.; Ffolliott, P.F. Fire effects on belowground sustainability: A review and synthesis. For. Ecol. Manag. 1999, 122, 51–71. [Google Scholar] [CrossRef]
- Wondzell, S.M.; King, J.G. Postfire erosional processes in the Pacific Northwest and Rocky Mountain regions. For. Ecol. Manag. 2003, 178, 75–87. [Google Scholar] [CrossRef]
- Zavala, L.L.; De Celis, R.; Jordán, A. How wildfires affect soil properties. A brief review. Cuad. Investig. Geogr. 2014, 40, 311–331. [Google Scholar] [CrossRef]
- Certini, G. Effects of fire on properties of forest soils: A review. Oecologia 2005, 143, 1–10. [Google Scholar] [CrossRef]
- Steel, Z.L.; Safford, H.D.; Viers, J.H. The fire frequency-severity relationship and the legacy of fire suppression in California forests. Ecosphere 2015, 6, 1–23. [Google Scholar] [CrossRef]
- Fernández, C.; Fernández-Alonso, J.M.; Vega, J.A.; Fontúrbel, T.; Llorens, R.; Sobrino, J.A. Exploring the use of spectral indices to assess alterations in soil properties in pine stands affected by crown fire in Spain. Fire Ecol. 2021, 17, 2. [Google Scholar] [CrossRef]
- Bureau Land of Management. Erskine Fire Investigation Report. 2017. Available online: https://www.blm.gov/documents/california/foia/records-released-under-foia/erskine-fire-investigation-report (accessed on 16 April 2023).
- USDA. Soil Survey of Kern County, Northeastern Part, and Southeastern Part of Tulare County, California. 2007. Available online: https://www.conservation.ca.gov/dlrp/fmmp/Documents/fmmp/pubs/soils/Kern_gSSURGO.pdf (accessed on 16 April 2023).
- Saleeby, J.B.; Busby, C. Paleogeographic and tectonic setting of axial and western metamorphic framework rocks of the southern Sierra Nevada, California. In Mesozoic Paleogeography of the Western United States II. Pacific Section SEPM. No. 71; Society of Economic Paleontologists and Mineralogists: Los Angeles, CA, USA, 1993; pp. 197–225. [Google Scholar]
- Saleeby, J.B.; Ducea, M.N.; Busby, C.; Nadin, E.; Wetmore, P.H. Chronology of Pluton Emplacement and Regional Deformation in the Southern Sierra Nevada Batholith, California; GSA Special Papers; Geological Society of America: Boulder, CO, USA, 2008; Volume 438, pp. 397–427. [Google Scholar]
- Staley, D.M.; Negri, J.A.; Kean, J.W.; Laber, J.M.; Tillery, A.C.; Youberg, A.M. Updated logistic regression equations for the calculation of post-fire debris-flow likelihood in the western United States. In U.S. Geological Survey Open-File Report; Series No. 2016–1106; US Geological Survey: Washington, DC, USA, 2016. [Google Scholar]
- Lavé, J.; Burbank, D. Denudation processes and rates in the Transverse Ranges, southern California: Erosional response of a transitional landscape to external and anthropogenic forcing. J. Geophys. Res. 2004, 109, 148–227. [Google Scholar] [CrossRef]
- Rengers, F.K.; McGuire, L.A.; Oakley, N.S.; Kean, J.W.; Staley, D.M.; Tang, H. Landslides after wildfire: Initiation, magnitude, and mobility. Landslides 2020, 17, 2631–2641. [Google Scholar] [CrossRef]
- ASTM D4318-05; Standard Test Methods for Liquid Limit, Plastic Limit, and Plasticity Index of Soils. ASTM International: West Conshohocken, PA, USA, 2005. Available online: https://www.astm.org/d4318-05.html (accessed on 16 April 2023).
- ASTM D2216-10; Standard Test Methods for Laboratory Determination of Water (Moisture) Content of Soil and Rock by Mass. ASTM International: West Conshohocken, PA, USA, 2010. Available online: https://www.astm.org/d2216-10.html (accessed on 16 April 2023).
- Sperazza, M.; Moore, J.N.; Hendrix, M.S. High-resolution particle size analysis of naturally occurring very fine-grained sediment through laser diffractometry. J. Sediment. Res. 2004, 74, 736–743. [Google Scholar] [CrossRef]
- Heiri, O.; Lotter, A.F.; Lemcke, G. Loss on ignition as a method for estimating organic and carbonate content in sediments: Reproducibility and comparability of results. J. Paleolimnol. 2001, 25, 101–110. [Google Scholar] [CrossRef]
- Dean, W.E. Determination of carbonate and organic matter in calcareous sediments and sedimentary rocks by loss on ignition; comparison with other methods. J. Sediment. Res. 1974, 44, 242–248. [Google Scholar]
- ASTM D3080-98; Standard Test Method for Direct Shear Test of Soils under Consolidated Drained Conditions. ASTM International: West Conshohocken, PA, USA, 1998. Available online: https://www.astm.org/d3080-98.html (accessed on 16 April 2023).
- Guo, J.; Underwood, M.B. Data report: Clay mineral assemblages from the Nankai Trough accretionary prism and the Kumano Basin, IODP Expeditions 315 and 316, NanTroSEIZE Stage 1. In Proc. IODP, 314/315/316; IODP Management International, Inc.: Washington, DC, USA, 2012. [Google Scholar]
- Moore, D.M.; Reynolds, R.C., Jr. X-ray Diffraction and the Identification and Analysis of Clay Minerals, 2nd ed.; Oxford Univ. Press: Oxford, UK, 1997. [Google Scholar]
- Petschick, R.; Kuhn, G.; Gingele, F. Clay mineral distribution in surface sediments of the South Atlantic: Sources, transport, and relation to oceanography. Mar. Geol. 1996, 130, 203–229. [Google Scholar] [CrossRef]
- Mataix-Solera, J.; Gómez, I.; Navarro-Pedreño, J.; Guerrero, C.; Moral, R. Soil organic matter and aggregates affected by wildfire in a Pinus halepensis forest in a Mediterranean environment. Int. J. Wildland Fire 2002, 11, 107–114. [Google Scholar] [CrossRef]
- Francos, M.; Pereira, P.; Alcañiz, M.; Mataix-Solera, J.; Úbeda, X. Impact of an intense rainfall event on soil properties following a wildfire in a Mediterranean environment (North-East Spain). Sci. Total Environ. 2016, 572, 1353–1362. [Google Scholar] [CrossRef]
- Moody, J.A.; Shakesby, R.A.; Robichaud, P.R.; Cannon, S.H.; Martin, D.A. Current research issues related to post-wildfire runoff and erosion processes. Earth-Sci. Rev. 2013, 122, 10–37. [Google Scholar] [CrossRef]
- Horn, R.; Taubner, H.; Wuttke, M.; Baumgartl, T. Soil physical properties related to soil structure. Soil Tillage Res. 1994, 30, 187–216. [Google Scholar] [CrossRef]
- Knapen, A.; Poesen, J.; Govers, G.; Gyssels, G.; Nachtergaele, J. Resistance of soils to concentrated flow erosion: A review. Earth Sci. Rev. 2007, 80, 75–109. [Google Scholar] [CrossRef]
- Blanco-Canqui, H.; Lal, R.; Owens, L.B.; Post, W.M.; Izaurralde, R.C. Strength properties and organic carbon of soils in the north Appalachian region. Soil Sci. Soc. Am. J. 2005, 69, 663–673. [Google Scholar] [CrossRef]
- Ohu, O.J.; Raghavan, G.S.V.; Mckyes, E.; Mehuys, G. Shear strength prediction of compacted soils with varying added organic matter contents. Trans. ASABE 1986, 29, 351–355. [Google Scholar] [CrossRef]
- Kay, B.D.; da Silva, A.P.; Baldock, J.A. Sensitivity of soil structure to changes in organic carbon content: Predictions using pedotransfer functions. Can. J. Soil Sci. 1997, 77, 655–667. [Google Scholar] [CrossRef]
- Kay, B.D.; Angers, D.A. Soil structure. In Handbook of Soil Science; Sumner, M.E., Ed.; CRC Press: New York, NY, USA, 1999; pp. A-229–A-269. [Google Scholar]
- Davies, P. Influence of organic matter content, moisture status and time after reworking on soil shear strength. J. Soil Sci. 1985, 36, 299–306. [Google Scholar] [CrossRef]
- Gantzer, C.J.; Buyanovsky, G.A.; Alberts, E.E.; Remley, P.A. Effects of soybean and corn residue decomposition on soil strength and splash detachment. Soil Sci. Soc. Am. J. 1987, 51, 202–207. [Google Scholar] [CrossRef]
- Ekwue, E.I. Organic-matter effects on soil strength properties. Soil Tillage Res. 1990, 16, 289–297. [Google Scholar] [CrossRef]
- Cruse, R.M.; Berghoefer, B.E.; Mize, C.W.; Ghaffarzadeh, M. Water drop impact angle and soybean protein amendment effects on soil detachment. Soil Sci. Soc. Am. J. 2000, 64, 1474–1478. [Google Scholar] [CrossRef]
- Rachman, A.; Anderson, S.H.; Gantzer, C.J.; Thompson, A.L. Influence of long-term cropping systems on soil physical properties related to soil erodibility. Soil Sci. Soc. Am. J. 2003, 67, 637–644. [Google Scholar] [CrossRef]
- To, J.; Kay, B.D. Variation in penetrometer resistance with soil properties: The contribution of effective stress and implications for pedotransfer functions. Geoderma 2005, 126, 261–276. [Google Scholar] [CrossRef]
Figure 1.
(A) Map location of the Erskine fire. (B) VLBS, LBS, MBS, and HBS pins identify sampling locations, and pre-fire imagery reveals a variation in vegetation density with respect to the sample locations.
Figure 1.
(A) Map location of the Erskine fire. (B) VLBS, LBS, MBS, and HBS pins identify sampling locations, and pre-fire imagery reveals a variation in vegetation density with respect to the sample locations.

Figure 2.
(A) Liquid limit over a range of burn severities. (B) Plastic limit over a range of burn severities. (C) Plastic index over a range of burn severities. The test results are presented as circles accompanied by a standard deviation box and error bars.
Figure 2.
(A) Liquid limit over a range of burn severities. (B) Plastic limit over a range of burn severities. (C) Plastic index over a range of burn severities. The test results are presented as circles accompanied by a standard deviation box and error bars.

Figure 3.
TOC content over a range of burn severities. The test results are presented as circles accompanied by a standard deviation box and error bars.
Figure 3.
TOC content over a range of burn severities. The test results are presented as circles accompanied by a standard deviation box and error bars.

Figure 4.
(A). Mean clay-size particles over a range of burn severities. (B). Mean silt-size particles over a range of burn severities. The test results are presented as circles accompanied by a standard deviation box and error bars.
Figure 4.
(A). Mean clay-size particles over a range of burn severities. (B). Mean silt-size particles over a range of burn severities. The test results are presented as circles accompanied by a standard deviation box and error bars.

Figure 5.
SEM images show no significant trend in grain coarsening by thermal fusion due to the high temperatures resulting from the wildfire: (A) HBS sample, (B) MBS sample. (C) LBS sample, and (D) VLBS sample.
Figure 5.
SEM images show no significant trend in grain coarsening by thermal fusion due to the high temperatures resulting from the wildfire: (A) HBS sample, (B) MBS sample. (C) LBS sample, and (D) VLBS sample.

Figure 6.
Shear strength results for soils under normal loads of 48, 96, and 192 kPa. The HBS soil had the highest shear strength among all burn severities.
Figure 6.
Shear strength results for soils under normal loads of 48, 96, and 192 kPa. The HBS soil had the highest shear strength among all burn severities.

Figure 7.
The cohesion of soils under normal loads of 48, 96, and 192 kPa. HBS soil has the highest cohesion property among all burn severities.
Figure 7.
The cohesion of soils under normal loads of 48, 96, and 192 kPa. HBS soil has the highest cohesion property among all burn severities.

Figure 8.
The angle of internal friction of soils under normal loads of 48, 96, and 192 kPa. The MBS soil had the highest angle of internal friction among all burn severities.
Figure 8.
The angle of internal friction of soils under normal loads of 48, 96, and 192 kPa. The MBS soil had the highest angle of internal friction among all burn severities.

Figure 9.
(A) Bulk XRD profiles. Smectite abundance was lower in soils with higher burn severities. (B) Clay-size XRD profiles. Lower contents of smectite and kaolinite/chlorite were found in soils with higher burn severities.
Figure 9.
(A) Bulk XRD profiles. Smectite abundance was lower in soils with higher burn severities. (B) Clay-size XRD profiles. Lower contents of smectite and kaolinite/chlorite were found in soils with higher burn severities.


Table 1.
The ANOVA results for liquid limit with the significance level set at 0.05 (α = 0.05). Variation in LL between burn severities was statistically insignificant. SS = sum of squares; df = degrees of freedom; MS = mean squares; F = test statistic; p-value = probability of data value occurring from random error; and F crit (F critical) = value obtained by computing the probability distribution of F-values.
| (a) LL Summary | ||||||
| Groups | - | - | Count | Sum | Average | Variance |
| HBS | - | - | 10 | 342 | 34.200 | 103.956 |
| MBS | - | - | 10 | 326 | 32.600 | 9.600 |
| LBS | - | - | 10 | 329 | 32.900 | 16.544 |
| VLBS | - | - | 10 | 275 | 27.500 | 10.278 |
| (b) ANOVA | ||||||
| Source of Variance | SS | df | MS | F | p-value | F crit |
| Between Groups | 261 | 3 | 87.000 | 2.479 | 0.077 | 2.866 |
| Within Groups | 1263 | 36 | 35.094 | - | - | - |
| Total | 1524 | 39 | - | - | - | - |
Table 2.
The ANOVA results for plastic limit with the significance level set at 0.05 (α = 0.05). PL variation between burn severities was statistically significant. SS = sum of squares; df = degrees of freedom; MS = mean squares; F = test statistic; p-value = probability of data value occurring from random error; and F crit (F critical) = value obtained by computing the probability distribution of F-values.
| (a) PL Summary | ||||||
| Groups | - | - | Count | Sum | Average | Variance |
| HBS | - | - | 10 | 348 | 34.800 | 165.733 |
| MBS | - | - | 10 | 290 | 29.000 | 16.444 |
| LBS | - | - | 10 | 270 | 27.000 | 10.889 |
| VLBS | - | - | 10 | 236 | 23.600 | 12.489 |
| (b) ANOVA | ||||||
| Source of Variance | SS | df | MS | F | p-value | F crit |
| Between Groups | 662 | 3 | 220.533 | 4.291 | 0.011 | 2.866 |
| Within Groups | 1850 | 36 | 51.389 | - | - | - |
| Total | 2512 | 39 | - | - | - | - |
Table 3.
ANOVA results for total organic carbon with the significance level set at 0.05 (α = 0.05). TOC variation between burn severities was statistically insignificant. SS = sum of squares; df = degrees of freedom; MS = mean squares; F = test statistic; p-value = probability of data value occurring from random error; and F crit (F critical) = value obtained by computing the probability distribution of F-values.
| (a) TOC Summary | ||||||
| Groups | - | - | Count | Sum | Average | Variance |
| HBS | - | - | 10 | 120 | 12.007 | 38.377 |
| MBS | - | - | 10 | 107 | 10.684 | 4.171 |
| LBS | - | - | 10 | 101 | 10.091 | 3.287 |
| VLBS | - | - | 10 | 87 | 8.679 | 1.536 |
| (b) ANOVA | ||||||
| Source of Variance | SS | df | MS | F | p-value | F crit |
| Between Groups | 57 | 3 | 19.047 | 1.608 | 0.204 | 2.866 |
| Within Groups | 426 | 36 | 11.843 | - | - | - |
| Total | 483 | 39 | - | - | - | - |
Table 4.
ANOVA results for clay-size particles with the significance level set at 0.05 (α = 0.05). Clay-size particle variation between burn severities was statistically insignificant. SS = sum of squares; df = degrees of freedom; MS = mean squares; F = test statistic; p-value = probability of data value occurring from random error; and F crit (F critical) = value obtained by computing the probability distribution of F-values.
| (a) Clay-size particle Summary | ||||||
| Groups | - | - | Count | Sum | Average | Variance |
| HBS | - | - | 10 | 175 | 17.544 | 23.429 |
| MBS | - | - | 10 | 171 | 17.053 | 12.407 |
| LBS | - | - | 10 | 186 | 18.559 | 5.628 |
| VLBS | - | - | 10 | 191 | 19.062 | 18.201 |
| (b) ANOVA | ||||||
| Source of Variance | SS | df | MS | F | p-value | F crit |
| Between Groups | 25 | 3 | 8.447 | 0.566 | 0.641 | 2.866 |
| Within Groups | 537 | 36 | 14.916 | - | - | - |
| Total | 562 | 39 | - | - | - | - |
Table 5.
ANOVA results for silt-size particles with the significance level set at 0.05 (α = 0.05). Silt-size particle variation between burn severities was statistically insignificant; SS = sum of squares; df = degrees of freedom; MS = mean squares; F = test statistic; p-value = probability of data value occurring from random error; and F crit (F critical) = value obtained by computing the probability distribution of F-values.
| (a) Silt-size particle Summary | ||||||
| Groups | - | - | Count | Sum | Average | Variance |
| HBS | - | - | 10 | 372 | 37.226 | 19.340 |
| MBS | - | - | 10 | 376 | 37.578 | 35.181 |
| LBS | - | - | 10 | 424 | 42.376 | 10.323 |
| VLBS | - | - | 10 | 379 | 37.938 | 27.587 |
| (b) ANOVA | ||||||
| Source of Variance | SS | df | MS | F | p-value | F crit |
| Between Groups | 175 | 3 | 58.327 | 2.524 | 0.073 | 2.866 |
| Within Groups | 832 | 36 | 23.107 | - | - | - |
| Total | 1007 | 39 | - | - | - | - |
Table 6.
ANOVA results for shear strength testing under a normal load of 48 kPa (0.5 TSF) with the significance level set at 0.05 (α = 0.05). Shear strength variation between burn severities was statistically significant. SS = sum of squares; df = degrees of freedom; MS = mean squares; F = test statistic; p-value = probability of data value occurring from random error; and F crit (F critical) = value obtained by computing the probability distribution of F-values.
| (a) 48 kPa Summary | ||||||
| Groups | - | - | Count | Sum | Average | Variance |
| HBS | - | - | 10 | 54 | 10.760 | 0.908 |
| MBS | - | - | 10 | 46 | 9.240 | 1.213 |
| LBS | - | - | 10 | 44 | 8.740 | 0.238 |
| VLBS | - | - | 10 | 44 | 8.720 | 0.047 |
| (b) ANOVA | ||||||
| Source of Variance | SS | df | MS | F | p-value | F crit |
| Between Groups | 14 | 3 | 4.614 | 7.671 | 0.002 | 3.239 |
| Within Groups | 10 | 16 | 0.602 | - | - | - |
| Total | 23 | 19 | - | - | - | - |
Table 7.
ANOVA results for shear strength testing under a normal load of 96 kPa (1.0 TSF) with the significance level set at 0.05 (α = 0.05). Shear strength variation between burn severities was statistically significant. SS = sum of squares; df = degrees of freedom; MS = mean squares; F = test statistic; p-value = probability of data value occurring from random error; and F crit (F critical) = value obtained by computing the probability distribution of F-values.
| (a) 96 kPa Summary | ||||||
| Groups | - | - | Count | Sum | Average | Variance |
| HBS | - | - | 10 | 85 | 16.920 | 2.097 |
| MBS | - | - | 10 | 84 | 16.800 | 0.505 |
| LBS | - | - | 10 | 74 | 14.760 | 0.893 |
| VLBS | - | - | 10 | 74 | 14.780 | 1.002 |
| (b) ANOVA | ||||||
| Source of Variance | SS | df | MS | F | p-value | F crit |
| Between Groups | 22 | 3 | 7.293 | 6.487 | 0.004 | 3.239 |
| Within Groups | 18 | 16 | 1.124 | - | - | - |
| Total | 40 | 19 | - | - | - | - |
Table 8.
ANOVA results for shear strength testing under a normal load of 192 kPa (2.0 TSF) with the significance level set at 0.05 (α = 0.05). Shear strength variation between burn severities was statistically insignificant. SS = sum of squares; df = degrees of freedom; MS = mean squares; F = test statistic; p-value = probability of data value occurring from random error; and F crit (F critical) = value obtained by computing probability distribution of F-values.
| (a) 192 kPa Summary | ||||||
| Groups | - | - | Count | Sum | Average | Variance |
| HBS | - | - | 10 | 147 | 29.300 | 2.505 |
| MBS | - | - | 10 | 143 | 28.600 | 6.265 |
| LBS | - | - | 10 | 126 | 25.220 | 3.757 |
| VLBS | - | - | 10 | 127 | 25.440 | 16.208 |
| (b) ANOVA | ||||||
| Source of Variance | SS | df | MS | F | p-value | F crit |
| Between Groups | 67 | 3 | 22.289 | 3.103 | 0.056 | 3.239 |
| Within Groups | 115 | 16 | 7.184 | - | - | - |
| Total | 182 | 19 | - | - | - | - |
Disclaimer/Publisher’s Note: The statements, opinions and data contained in all publications are solely those of the individual author(s) and contributor(s) and not of MDPI and/or the editor(s). MDPI and/or the editor(s) disclaim responsibility for any injury to people or property resulting from any ideas, methods, instructions or products referred to in the content. |
© 2023 by the authors. Licensee MDPI, Basel, Switzerland. This article is an open access article distributed under the terms and conditions of the Creative Commons Attribution (CC BY) license (https://creativecommons.org/licenses/by/4.0/).
Share and Cite
MDPI and ACS Style
Haake, S.; Krugh, W.; Montoya, E.; Guo, J. Burn Severity and Its Impact on Soil Properties: A Study of the 2016 Erskine Fire in the Southern Sierra Nevada, California. Geotechnics 2023, 3, 446-464. https://doi.org/10.3390/geotechnics3020025
AMA Style
Haake S, Krugh W, Montoya E, Guo J. Burn Severity and Its Impact on Soil Properties: A Study of the 2016 Erskine Fire in the Southern Sierra Nevada, California. Geotechnics. 2023; 3(2):446-464. https://doi.org/10.3390/geotechnics3020025
Chicago/Turabian StyleHaake, Sade, William Krugh, Eduardo Montoya, and Junhua Guo. 2023. "Burn Severity and Its Impact on Soil Properties: A Study of the 2016 Erskine Fire in the Southern Sierra Nevada, California" Geotechnics 3, no. 2: 446-464. https://doi.org/10.3390/geotechnics3020025