


Dynamic Properties of a Compacted Residual Soil from the West Indies
by
 , , , , and
Lila Mouali
1,
Guillaume Veylon
2,
Daniel Dias
1,*,
Laurent Peyras
2,
Claudio Carvajal
2 ,
,
Jérôme Duriez
2 and
Eric Antoinet
1 1
Antea Group, 92160 Antony, France
2
RECOVER, INRAE, Aix Marseille University, 13100 Aix-en-Provence, France
*
Author to whom correspondence should be addressed.
Geotechnics 2023, 3(2), 254-277; https://doi.org/10.3390/geotechnics3020015
Submission received: 3 April 2023
/
Revised: 19 April 2023
/
Accepted: 25 April 2023
/
Published: 28 April 2023
(This article belongs to the Special Issue Recent Advances in Geotechnical Engineering)
Abstract
:This paper presents a laboratory investigation of the strain-dependent cyclic properties of a compacted tropical residual soil as measured in a resonant column and cyclic triaxial testing program. The mechanical properties were evaluated with respect to cyclic shear strain amplitude, initial void ratio, and confining pressure. It was shown that the existing models for the prediction of shear modulus reduction and damping ratio curves were not pertinent in the case of the compacted residual soil studied. Empirical equations were developed for the small-strain shear modulus and the normalized shear modulus, damping ratio, and pore water pressure ratio curves for void ratios between e = 1.00 and e = 1.50 and mean effective pressures of = 50−300 kPa. The comparison of the models to the measured values suggest that the uncertainties associated with each of these models are lower than 20% of the predicted values. The results were established as part of a project for the construction of an embankment dam in the West Indies. However, the methodology as well as the model formulation framework presented in the article can be generalized to other residual soils and applied in all fields of geotechnical engineering.
1. Introduction
In recent years, there has been a global boom in dam construction [1]. The need for water and renewable energy have increased in many countries, primarily in countries with emerging economies. Many of these countries are located in tropical areas where residual soils constitute a large part of the soils encountered [2]. Therefore, the use of residual soils as backfill material for the construction of earth dams is an important issue.
Residual soils are the products of the intensive in situ physical and chemical weathering of igneous, sedimentary, or metamorphic rocks. As opposed to transported (and sedimented) soils, residual soils are formed in place. They include a group of iron-rich materials usually described as laterites or lateritic soils. Tropical regions provide the right conditions of humidity and temperature to transform rocks into residual soils faster than they can be washed away by erosion. The environmental factors that control the degree of weathering (climate, topography, and drainage conditions) have been the subject of extensive studies [3,4]. The hydro-mechanical properties of residual soils depend on their degree of weathering. Several authors showed that their mechanical behavior differs from that of sedimentary soils in terms of hydraulic conductivity, compressibility, and shear strength [5,6,7,8,9,10].
Dam projects in tropical regions are often subject to seismic risk. Most of the time, poor quality foundation soils are purged. Therefore, the dynamic behavior of an earth dam mainly depends on the dynamic properties of the earth fill consisting of compacted residual soils, saturated during reservoir filling. Assessing the seismic safety of a dam relies on accurately predicting the degradation of the shear modulus and material damping due to the increased material damage and pore pressure that occurs during seismic loading [11,12]. It is, therefore, of great importance to have reliable formulas to evaluate the small strain shear modulus () and the evolution curves of the normalized shear modulus (), the damping ratio (D), and the pore water pressure ratio () with respect to the cyclic shear strain amplitude . These curves are used as input data for simplified constitutive models [13,14] or for the calibration of more complex constitutive models [15,16,17].
For conventional soils, extensive experimental studies have proposed empirical equations for clays [18,19,20,21,22,23,24,25,26,27,28,29,30,31,32,33,34,35], sands [18,22,36,37,38], and gravels [33,39,40].
Undisturbed residual soils have been the subject of several research works which have established predictive equations for [41,42] and for vs. and D vs. curves [41,43,44]. Several authors have demonstrated the influence of fabric inherited from parent rock and cementation due to sesquioxides in the singularities of the mechanical behavior observed [42].
Certain works focused on the behavior of compacted unsaturated soils under monotonic loading [45,46,47]. Few scientific works have studied the dynamic properties of saturated compacted residual soils. Some authors have proposed predictive equations for [43,48,49,50,51,52] and for curves vs. in the domain of small [43,53] and large strains [49]. However, none of them established general equations capable of predicting the dynamic properties of compacted and saturated tropical residual soils from small to large shear strains. However, compacted residual soils are expected to have mechanical properties that differ from those of natural residual soils as they may keep, at least partially, their original fabric and cementation, even after remolding.
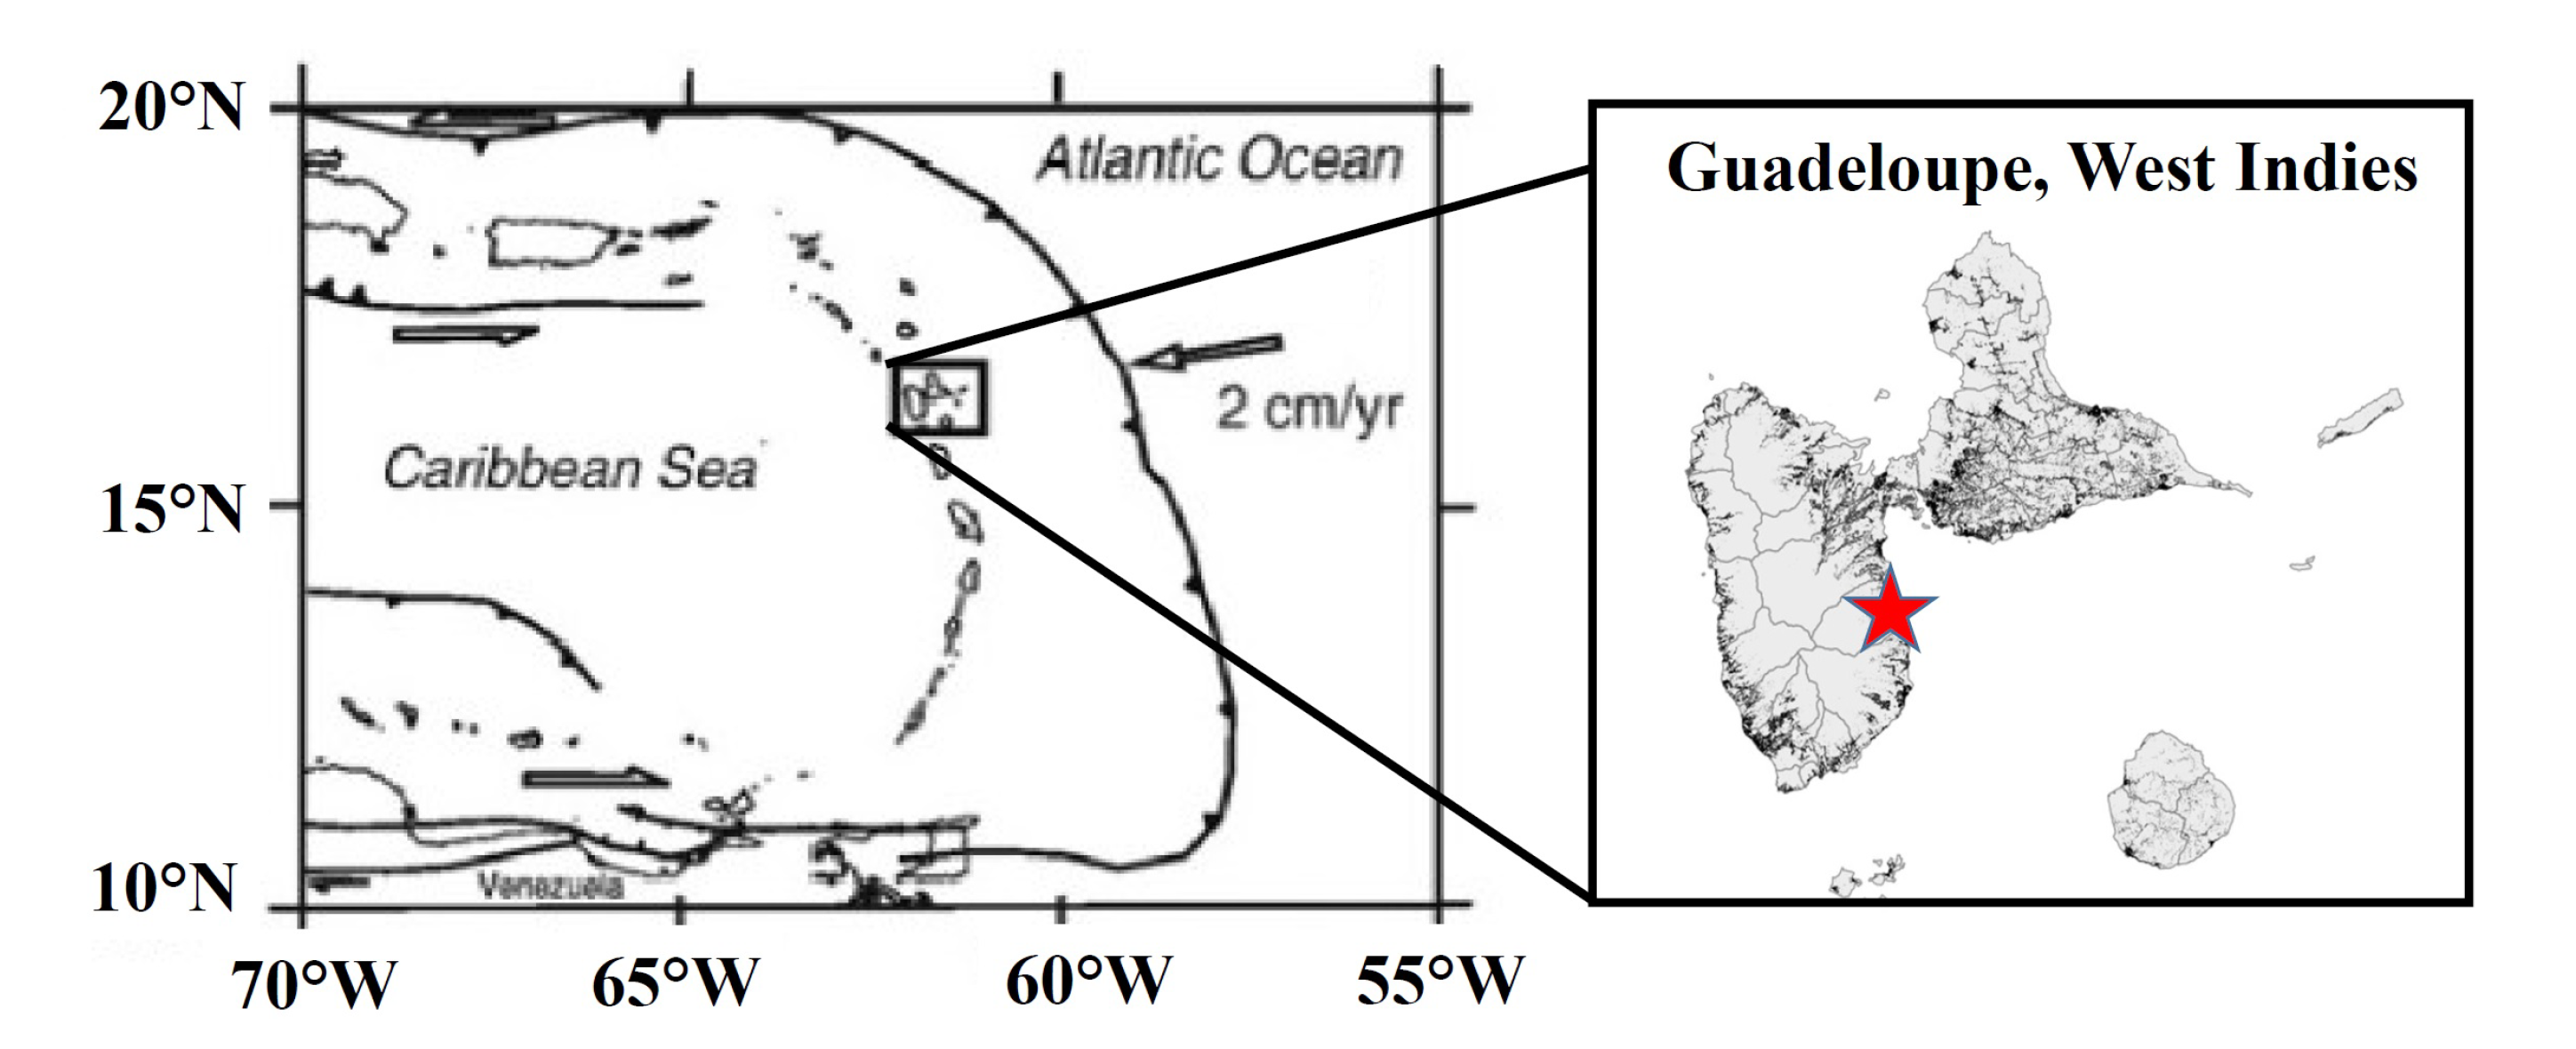
In this article, we propose experimentally determining the values, the curves vs. , D vs. , and vs. curves for a tropical residual soil used for the construction of a 20 m high dam in the French West Indies in a region of high seismicity (Figure 1). This work is part of a project of studies with the aim of establishing a reliable assessment of the seismic behavior of the dam in construction.
Several laboratory techniques have been used to investigate the dynamic soil properties. The resonant column (RC), which continues to be one of the most popular and efficient laboratory methods [50], was used to evaluate the dynamic behavior of soils in the small- to mid-amplitude cyclic shear strains (0.0001–0.1%). In the larger strain domain (>0.1%), undrained cyclic triaxial tests (CyTXs) are perfectly suited for analyzing the undrained cyclic behavior of the materials tested. The use of these two complementary tests provides a description of the dynamic behavior of the soils over the whole range of strain amplitudes generated by an earthquake loading.
2. Materials and Methods
2.1. Sampling
The sampling area is situated on the east side of the island of Basse-Terre, Guadeloupe (Caribbean Sea), where a humid tropical climate prevails, at an altitude of approximately 250 m above mean sea level. The residual soils originate from the weathering of an andesitic pyroclastic rock dating from the formation of the axial chain of the La Souffrière volcano between −1 and −0.435 Ma.
Four hundred kilograms of materials were removed by a mechanical shovel and placed in hermetically sealed bags. It is well known that residual soils are extremely heterogeneous, since they result from a quite random weathering process. Thus, a specific sampling procedure was used. The material was mixed with a manual shovel and screened with a 20 mm sieve. Quartering was carried out to homogenize and improve the reproducibility of the laboratory test results. Seven units weighing around sixty kilograms each were thus prepared in order to perform the testing program.
2.2. Specimen Preparation
First, the samples were dried in an oven at 50 C. The samples were weighed after 48 h and 72 h. If the mass did not change, the sample was considered dry, otherwise drying was pursued. The mass of water corresponding to the target water content was then added, the material was mixed for 5 min, placed in a plastic bag, and left for 48 h in a humid chamber.
Three different modes of specimen preparation were tested: coring method, direct compaction method, and progressive driving method. In the coring method, the wet material was placed in three layers in the Proctor mold. Each layer was compacted at the Proctor energy. Between each layer, the material was scarified at a depth of 5 mm. The cutting kit was driven directly through the specimen and the sample was extracted using a pusher. The direct compaction method consists of kneading the material in a cylinder with a diameter corresponding to the specimen tested at the target water content and then delicately placing the material in four layers using a small spoon and a funnel. Each layer is then statically compacted in order to reach the target void ratio. In the progressive driving method, the mold is dismantled after compaction in three layers at the proctor energy, and the cutting kit is progressively driven through the sample while the sides are trimmed with a wire saw in order to avoid damage to the sample by the generation of stresses and pore pressure. Preliminary analyses showed that the direct coring method resulted in significantly deteriorated mechanical properties. This was attributed to the generation of pore pressure and the development of microcracks within the sample during the coring phase. The progressive driving method was very time consuming and led to irregular side faces due to the existence of indured aggregates. In addition, no significant difference was observed between direct compaction and progressive driving methods regarding the experimental results. Therefore, the direct compaction method was selected for the present study.
Two proctor tests were performed beforehand. The optimum dry density was found to be 1.24–1.29 g/cm for an optimum water content (OWC) equal to 35.5–36.6%, which corresponds to a void ratio e = 1.05−1.14. Using static compaction, we were able to widen the range of tested densities around the optimum proctor density. The target void ratios were chosen equal to 1.00, 1.10 (corresponding to the average value of the optimum dry density), and 1.50 (corresponding to the maximum void ratio allowing the tests to be carried out). The preparation of the looser sample did not require compaction. The other two densities were obtained by applying a compaction stress of 400 kPa with water contents equal to 96% and 104% of the OWC. The compaction energy applied was, therefore, between 160 and 200 kJ/m.
2.3. Resonant Column Tests
The torsional resonant column test (RC) is based on the propagation theory of torsional elastic waves in a cylindrical sample. The resonant column apparatus used for the present work was the Stokoe apparatus [54] in a fixed-free configuration. The lower end of the specimen is fixed to a stainless steel, rough-surfaced pedestal, and the upper end is subjected to torsional excitation via a driver mechanism. The aim of the test was to evaluate the shear modulus and the damping of the material from the measurement of the resonance frequency () and the peak amplitude of vibration once the fundamental mode of the vibration of the soil column iss obtained [55].
The samples tested were 100 mm high and 50 mm in diameter. After preparation of the sample and application of a confining pressure, a sinusoidal torsional vibration at a variable frequency and amplitude was applied using a rotary excitation device mounted at the top of the sample. For each distortion amplitude applied at the top of the specimen, the loading frequency was gradually increased and the response amplitude at the base of the sample was measured. The shear modulus was determined from the equation [56], where is the resonance frequency, h is the height of the specimen, and is a parameter verifying , where I is the mass polar moment of inertia of the sample and is the mass moment of inertia of calibration (corresponding to the moment of inertia of the components mounted on the top of the specimen). The shear strain amplitude, or distortion amplitude, () is calculated from the output voltage of the accelerometer [57]. The resonance curve representing the distortion amplitude at the top of the specimen as a function of the loading frequency is characterized by a maximum amplitude () and a bandwidth defined by frequencies corresponding to response amplitudes equal to . The damping ratio was calculated using the procedures found in Pineda et al. [42].
First, the RC tests were used to determine the small strain shear modulus () for void ratios between 0.97 and 1.49 and confining pressures between 50 and 300 kPa. In order to account for the influence of the loading history, the maximum past mean effective stress () was determined for each test. was determined using the coefficient of earth pressure approximated by the formula (considering that the difference caused by the assumption can be ignored), where is the vertical preconsolidation stress measured from the oedometric tests. In normally consolidated specimens, . In most cases, the compaction gives rise to pre-consolidation pressures larger than the confinement pressures applied during the tests and .
Secondly, the RC tests were used to construct the degradation curves of the shear modulus vs. in the small to medium deformation range ( to %). To analyze the role of the mean effective pressure, the shear modulus and the damping values were measured at three different confining pressures. The experimental procedure used by Fedrizzi et al. [58] was implemented. The column resonance tests were conducted successively on the same specimen under 100 and 200 kPa until the shear strain amplitude reached = 0.03%. This shear strain amplitude corresponding to a shear modulus reduction factor of was assumed to be lower than the elastic-plastic strain threshold above which irreversible strain and pore pressure may develop. The third test, performed for a confining pressure equal to 300 kPa, was conducted until the upper limit of the driving device was reached (Table 1).
2.4. Cyclic Triaxial Tests
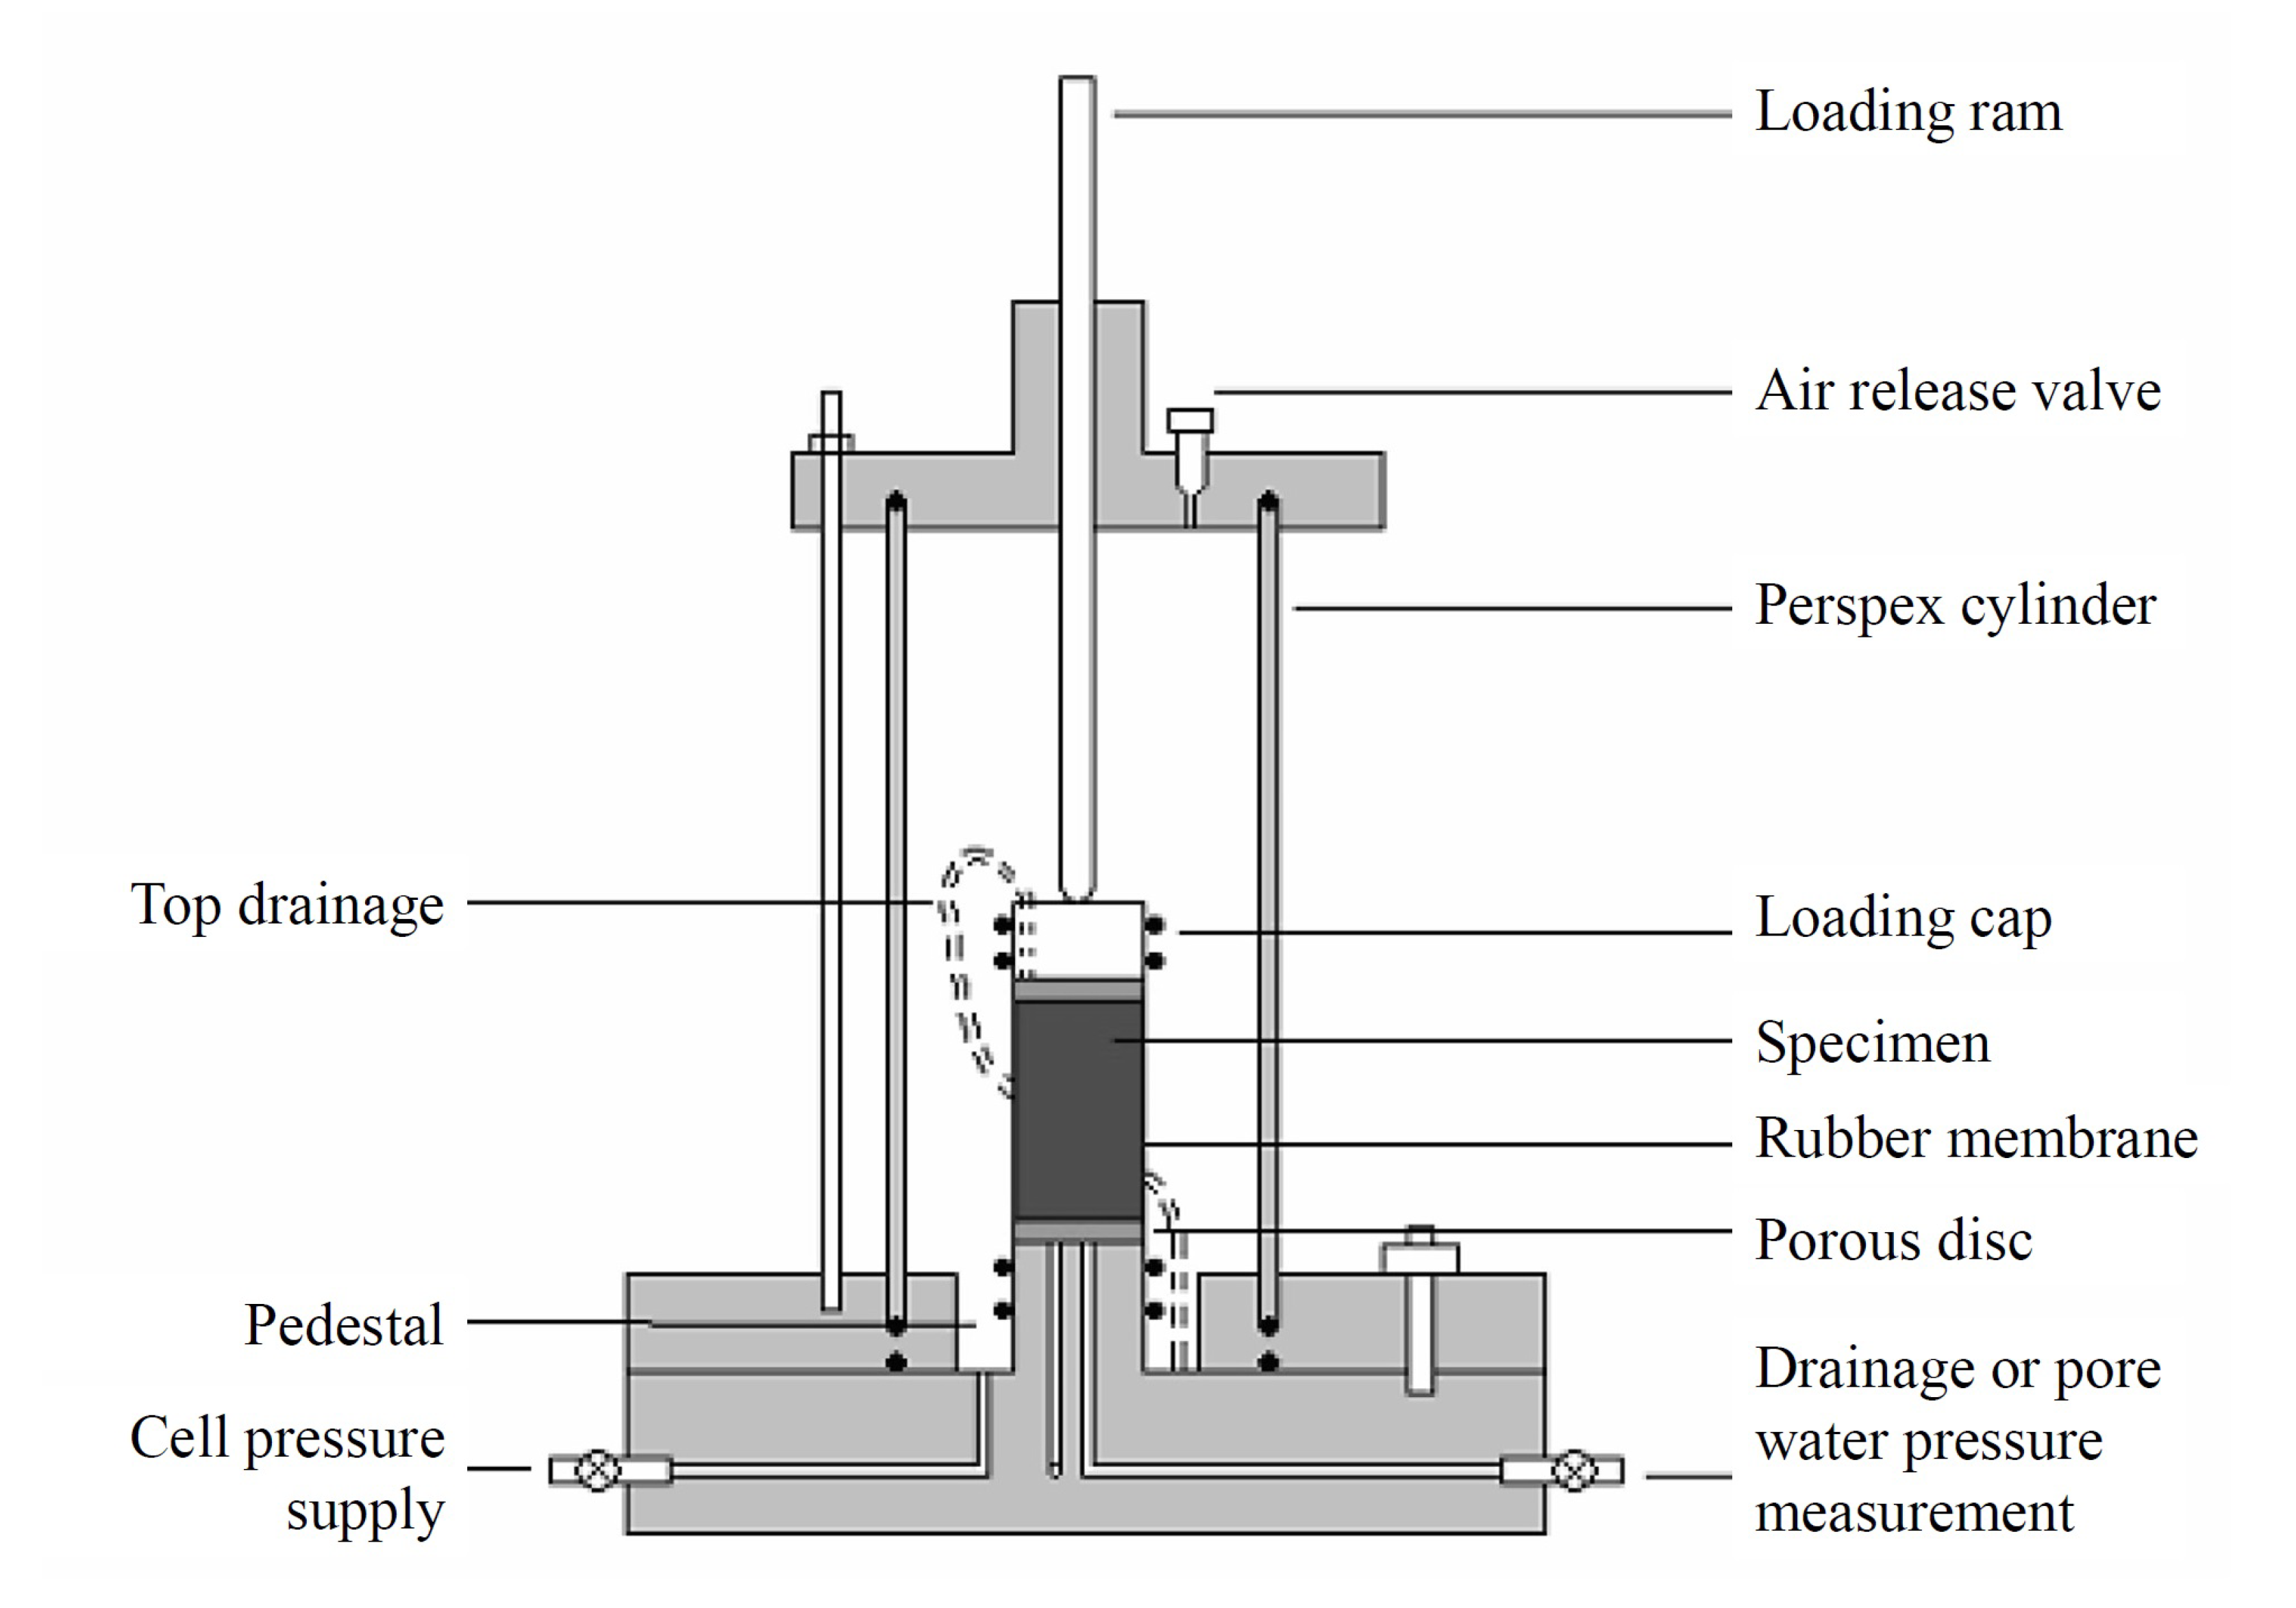
Undrained cyclic triaxial tests (CyTXs) were performed to determine the vs. the curve in the range of medium to large deformations ( to 1%). The tests were performed using a cyclic triaxial testing device developed by Wykeham Farrance (Figure 2).
The dimensions of the specimens were 50 mm in diameter and 100 mm in height. Six specimens were tested for initial void ratios varying from 0.99 to 1.10 and effective isotropic pressures () ranging from 100 to 300 kPa (Table 1). The saturation and consolidation procedures can be separated into the following steps, following the ASTM [59] standards. The saturation phase with deaerated water was performed with a counter pressure applied at a constant rate of 50 kPa every 12 h until the maximum value = 400 kPa was reached. The specimen was then consolidated at the target confining pressure. The drainage was closed and the saturation was evaluated by increasing the axial and radial total stresses to the target confining pressure while recording excess pore pressure and axial displacement. The Skempton coefficient B was maintained at higher than 0.95 at all steps. Then, a sinusoidal axial strain rate was applied at a frequency of f = 0.25 Hz. For each imposed axial strain amplitude 0.2%, 0.4%, 0.6%, 0.8%, and 1%, 50 cycles were applied. When the increased in the pore pressure measured at the end of the cyclic loading was significant (more than 5 kPa), a reconsolidation phase was performed before continuing to the next loading sequence.
The deviatoric stress was recorded. As the tests are performed in an undrained condition, the shear strain was evaluated directly from the axial strain . The secant shear modulus was calculated as . The damping ratio was determined for a given cycle from the curve using the equation , where is the surface of the hysteresis loop corresponding to the energy dissipation and is the triangular area corresponding to the maximum stored energy [23].
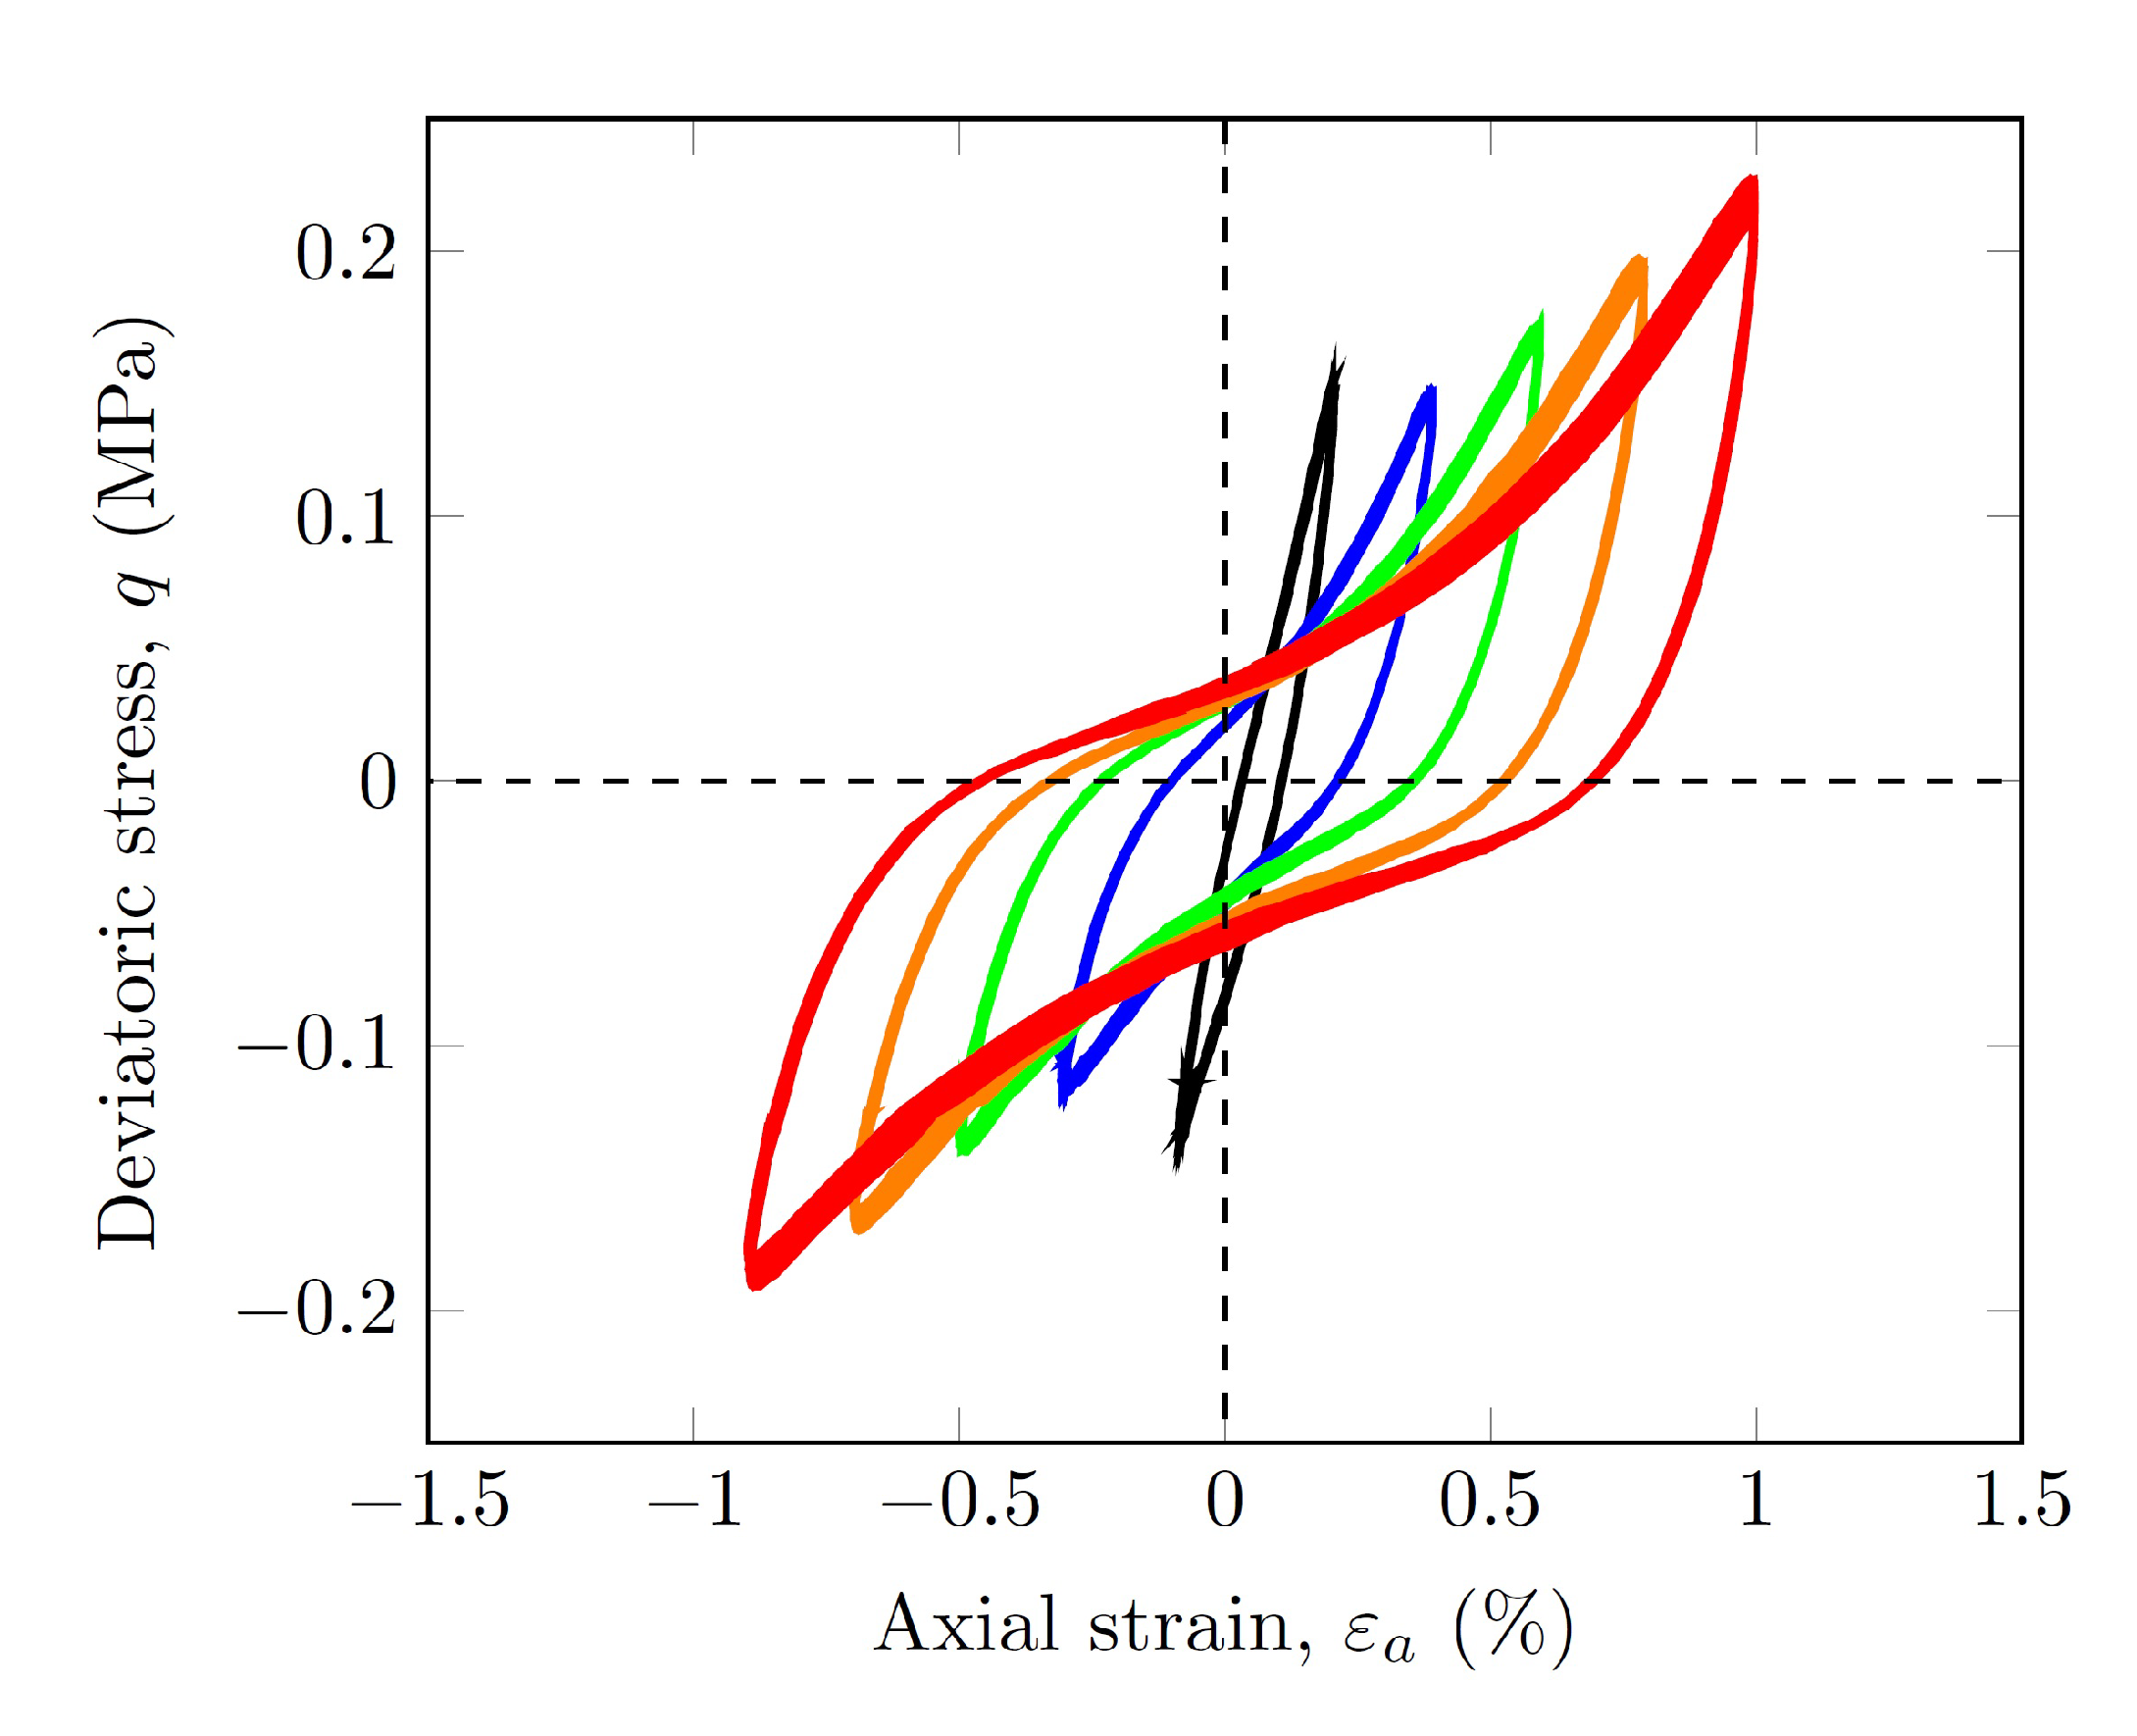
In total, 6 sequences of 50 cycles were applied for axial strain amplitudes equal to 0.2%, 0.4%, 0.6%, 0.8%, and 1%, respectively. When the increase in the pore pressure exceeded 5 kPa at the end of the sequence, a reconsolidation phase was carried out before passing to the next sequence. Parameters G and D were calculated over the last twenty cycles of each of the sequences, when the amplitude of the deviatoric stress and pore pressure were stabilized. Typical stress-strain curves for the last twenty cycles are shown in Figure 3. It can be seen that the shear modulus decreased significantly from one sequence to another. In the same way, the energy dissipated in each cycle increased with the amplitude of the imposed axial strains. Only the loops of the first sequence cycles appeared like a hysteretic response. For cyclic axial strains greater than 0.4%, the loops took the shape of increasingly degraded backbone curves generally observed when the pore pressure increases significantly [60].
3. Results and Discussion
3.1. Identification
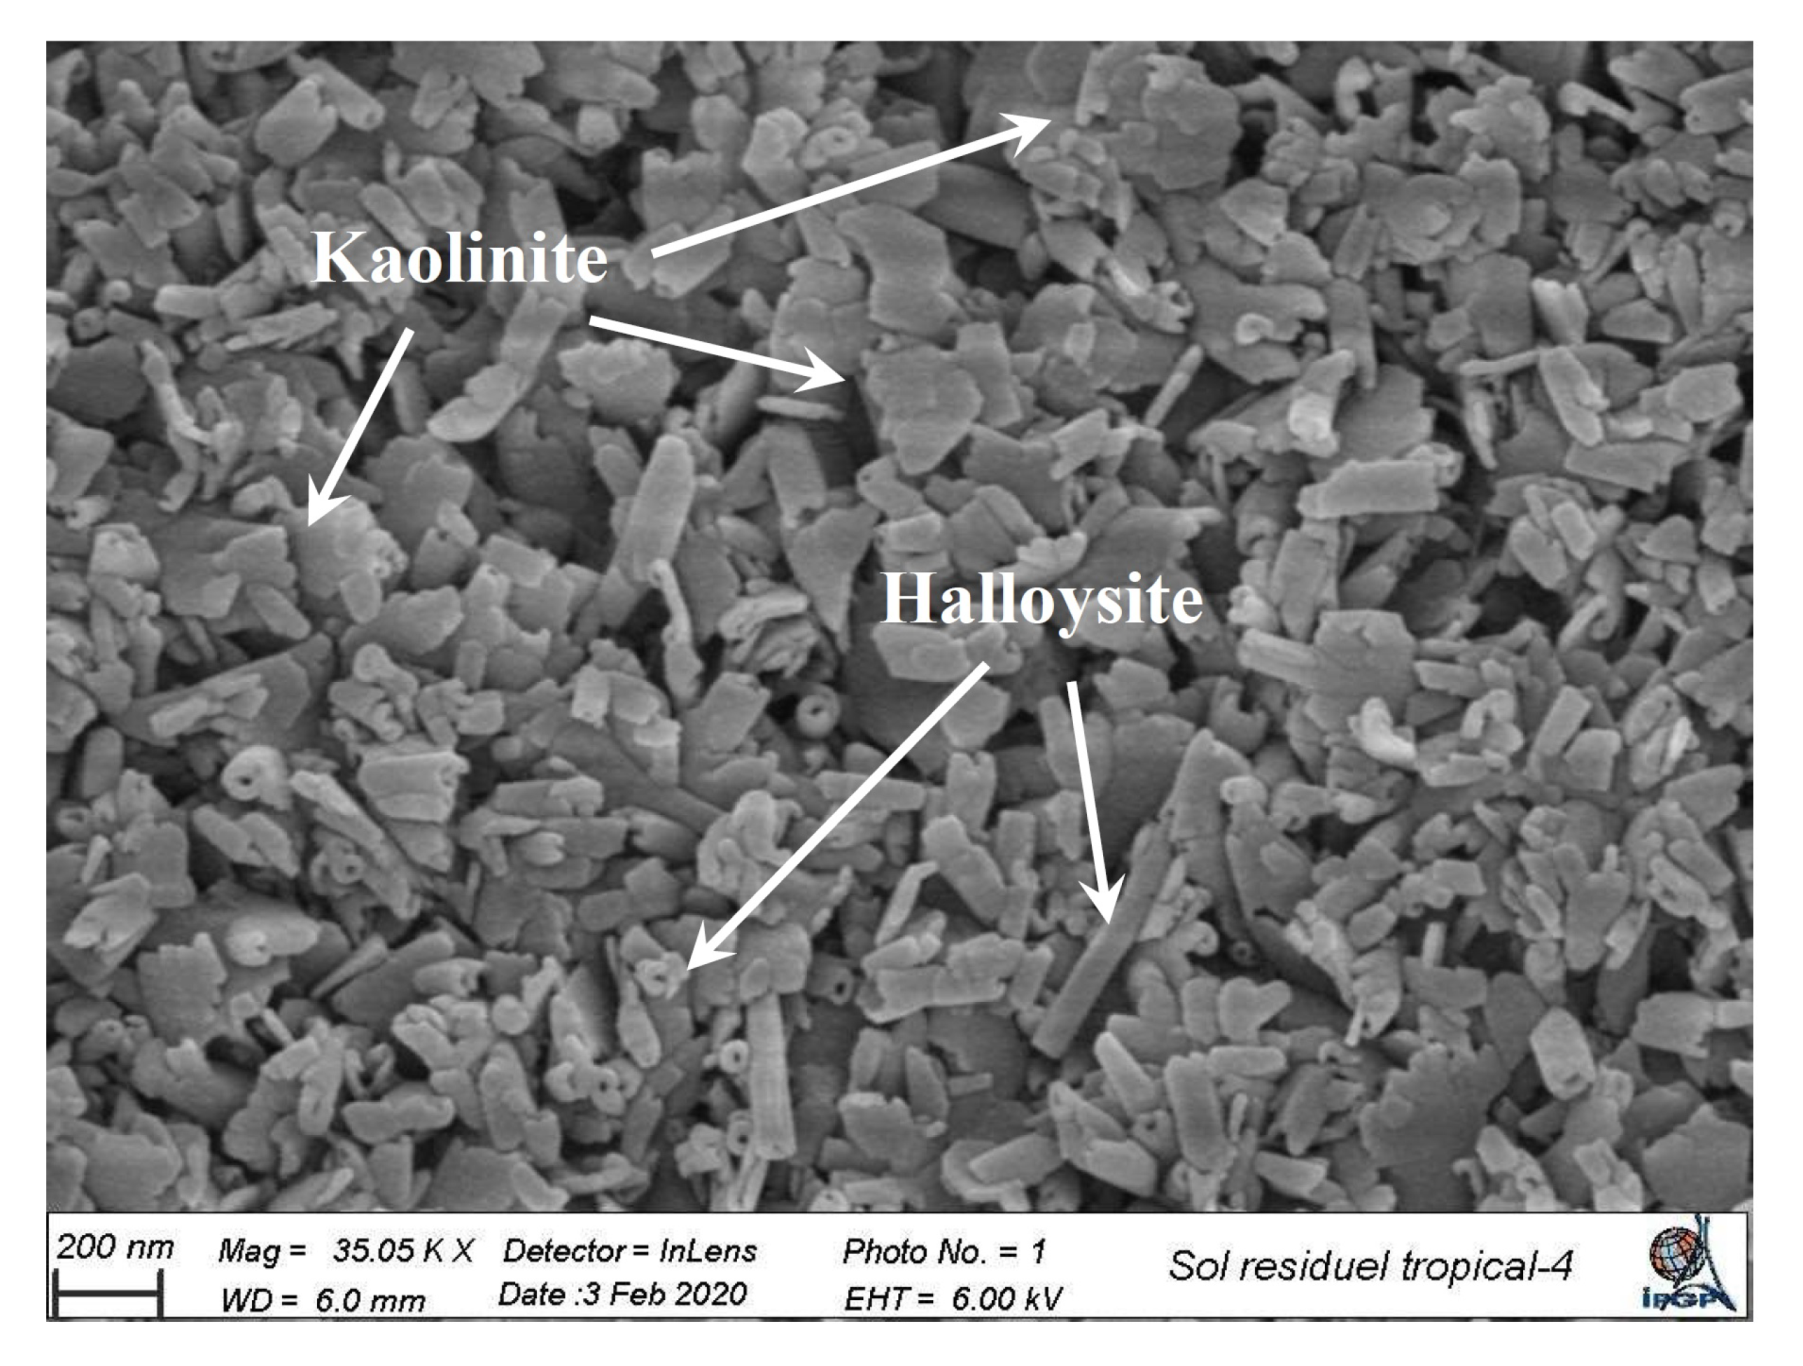
The long duration of the genesis and the climatic conditions induced a considerable in situ alteration of the materials, which favored the formation of iron oxyhydroxides and clays, mainly halloysite [61]. This lateritic soil is characterized by a reddish color and the presence of iron sesquioxides, aluminum, quartz, and kaolinite. In order to observe the mineral and chemical compositions of these soils, clay fractions of two samples were analyzed by X-ray diffraction and by Inductively Coupled Plasma (ICP). The results are shown in Table 2. The quantitative analysis of the different phases was carried out by calibration on the basis of the Rietveld method. X-ray diffraction analyses showed that the most abundant phase was constituted by kaolinite (approximately 44%), which is produced by the chemical transformation of feldspars present in the parent material. Goethite and gibbsite, which are hydrated iron and aluminum oxides, represented about 20 and 10% of the weight, respectively. It is worth noting that the mineralogy analyses closely matched those obtained by other authors for comparable residual soils [42]. The coexistence of kaolinite and goethite within the same horizon is typical of residual soils derived from intermediate igneous rocks in the early lateritic stages. The results of ICP analyses showed that the oxidized constituents represented around 45% of the clay fraction. This suggests a moderate level of soil weathering.
The particle size distribution of the residual soil was determined according to sieving [62] and sedimentation [63]. Seven sampling units were tested and are represented in Figure 4. It can be seen that the material tested is very fine. The median particle size is less than 2 m. The fine content varies between 90 and 96% and the proportion of clay particles ranges between 50 and 60%. The in situ soil water content is between 50% and 60% (Figure 4). The residual soil tested is classified as inactive, medium plastic, inorganic clay [64]. The physico-chemical properties of the samples correspond to tropical red clays [65]. The characteristics measured are in the range of those measured by [43,66], in particular for the residual soils resulting from the degradation of diabase and basalt.
3.2. Scanning Electron Microscopy
The morphology of the soil particles was observed using a high resolution scanning electron microscope. Two types of clods were observed. The first analysis was carried out on a slightly oxidized clod of light brown color. The second analysis was carried out on a more oxidized clod characterized by a reddish-color. Figure 5 shows the surface of the slightly oxidized clod. Two types of clay particles can be observed. The platelets correspond to kaolinite. They constitute the main part of the clay particles, which confirms the pertinence of the interpretation models used for the mineral and chemical analyses. Their dimension in the plane is between 50 and 200 nm and their thickness is in the order of 20 nm. The tubular particles correspond to halloysite. The length of the tubes varies between 300 and 400 nm. The outer diameter of the tubes is between 50 and 80 nm while the inner diameter is only a few nanometers. The assembly is fairly homogeneous. The particles are randomly oriented and well distributed in space.
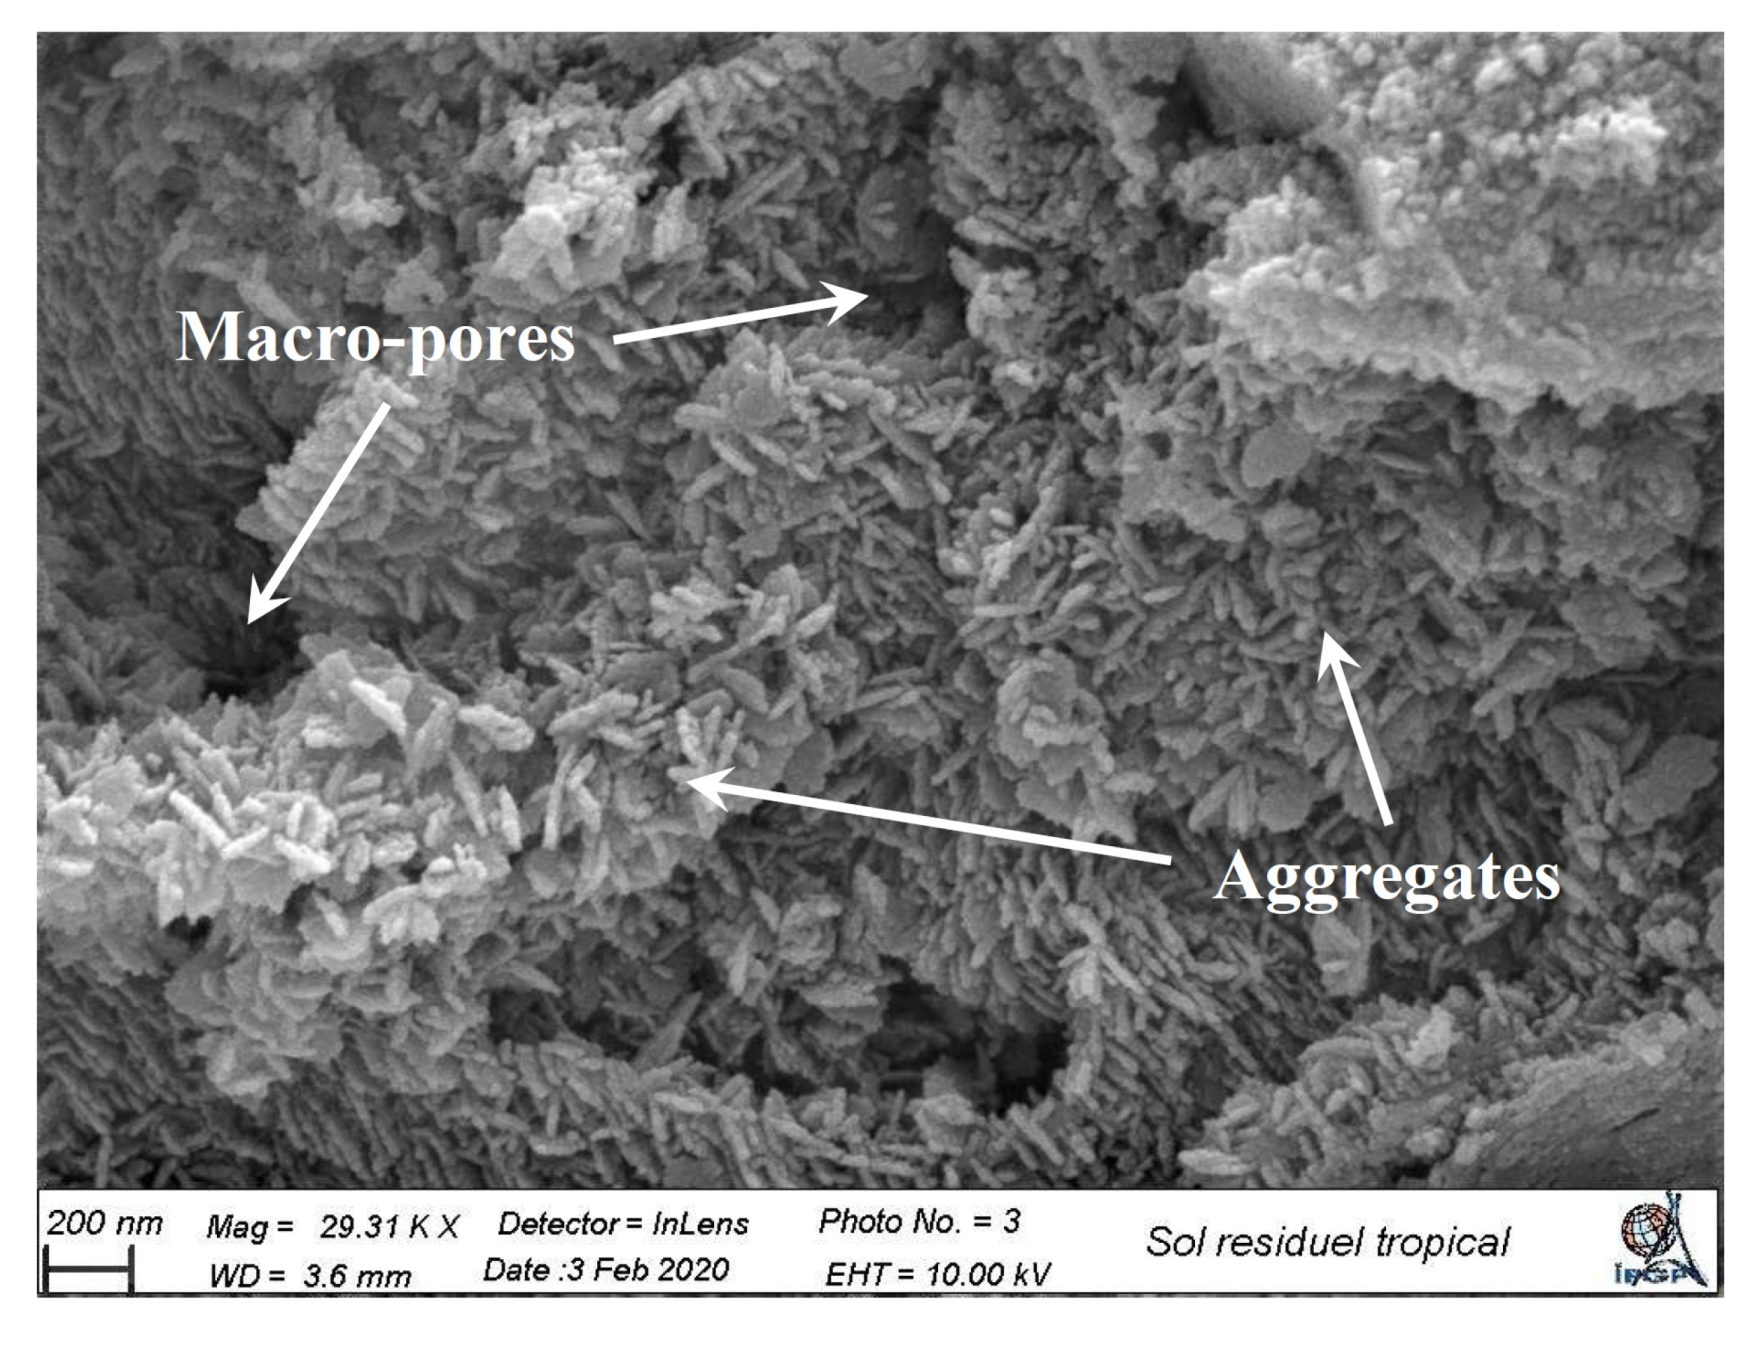
Figure 6 shows the surface of the strongly oxidized clod. The particles are essentially made up of kaolinite platelets of the same size as those of the slightly oxidized clod. A few rare halloysite particles are also observed. The structure of the assembly shows a very different distribution from the slightly oxidized clod. The platelets appear to be oriented preferentially in two orthogonal directions. The interparticle voids seem smaller, but a network of macro-pores of a few microns can be observed.
3.3. Energy Dispersive Spectrometry
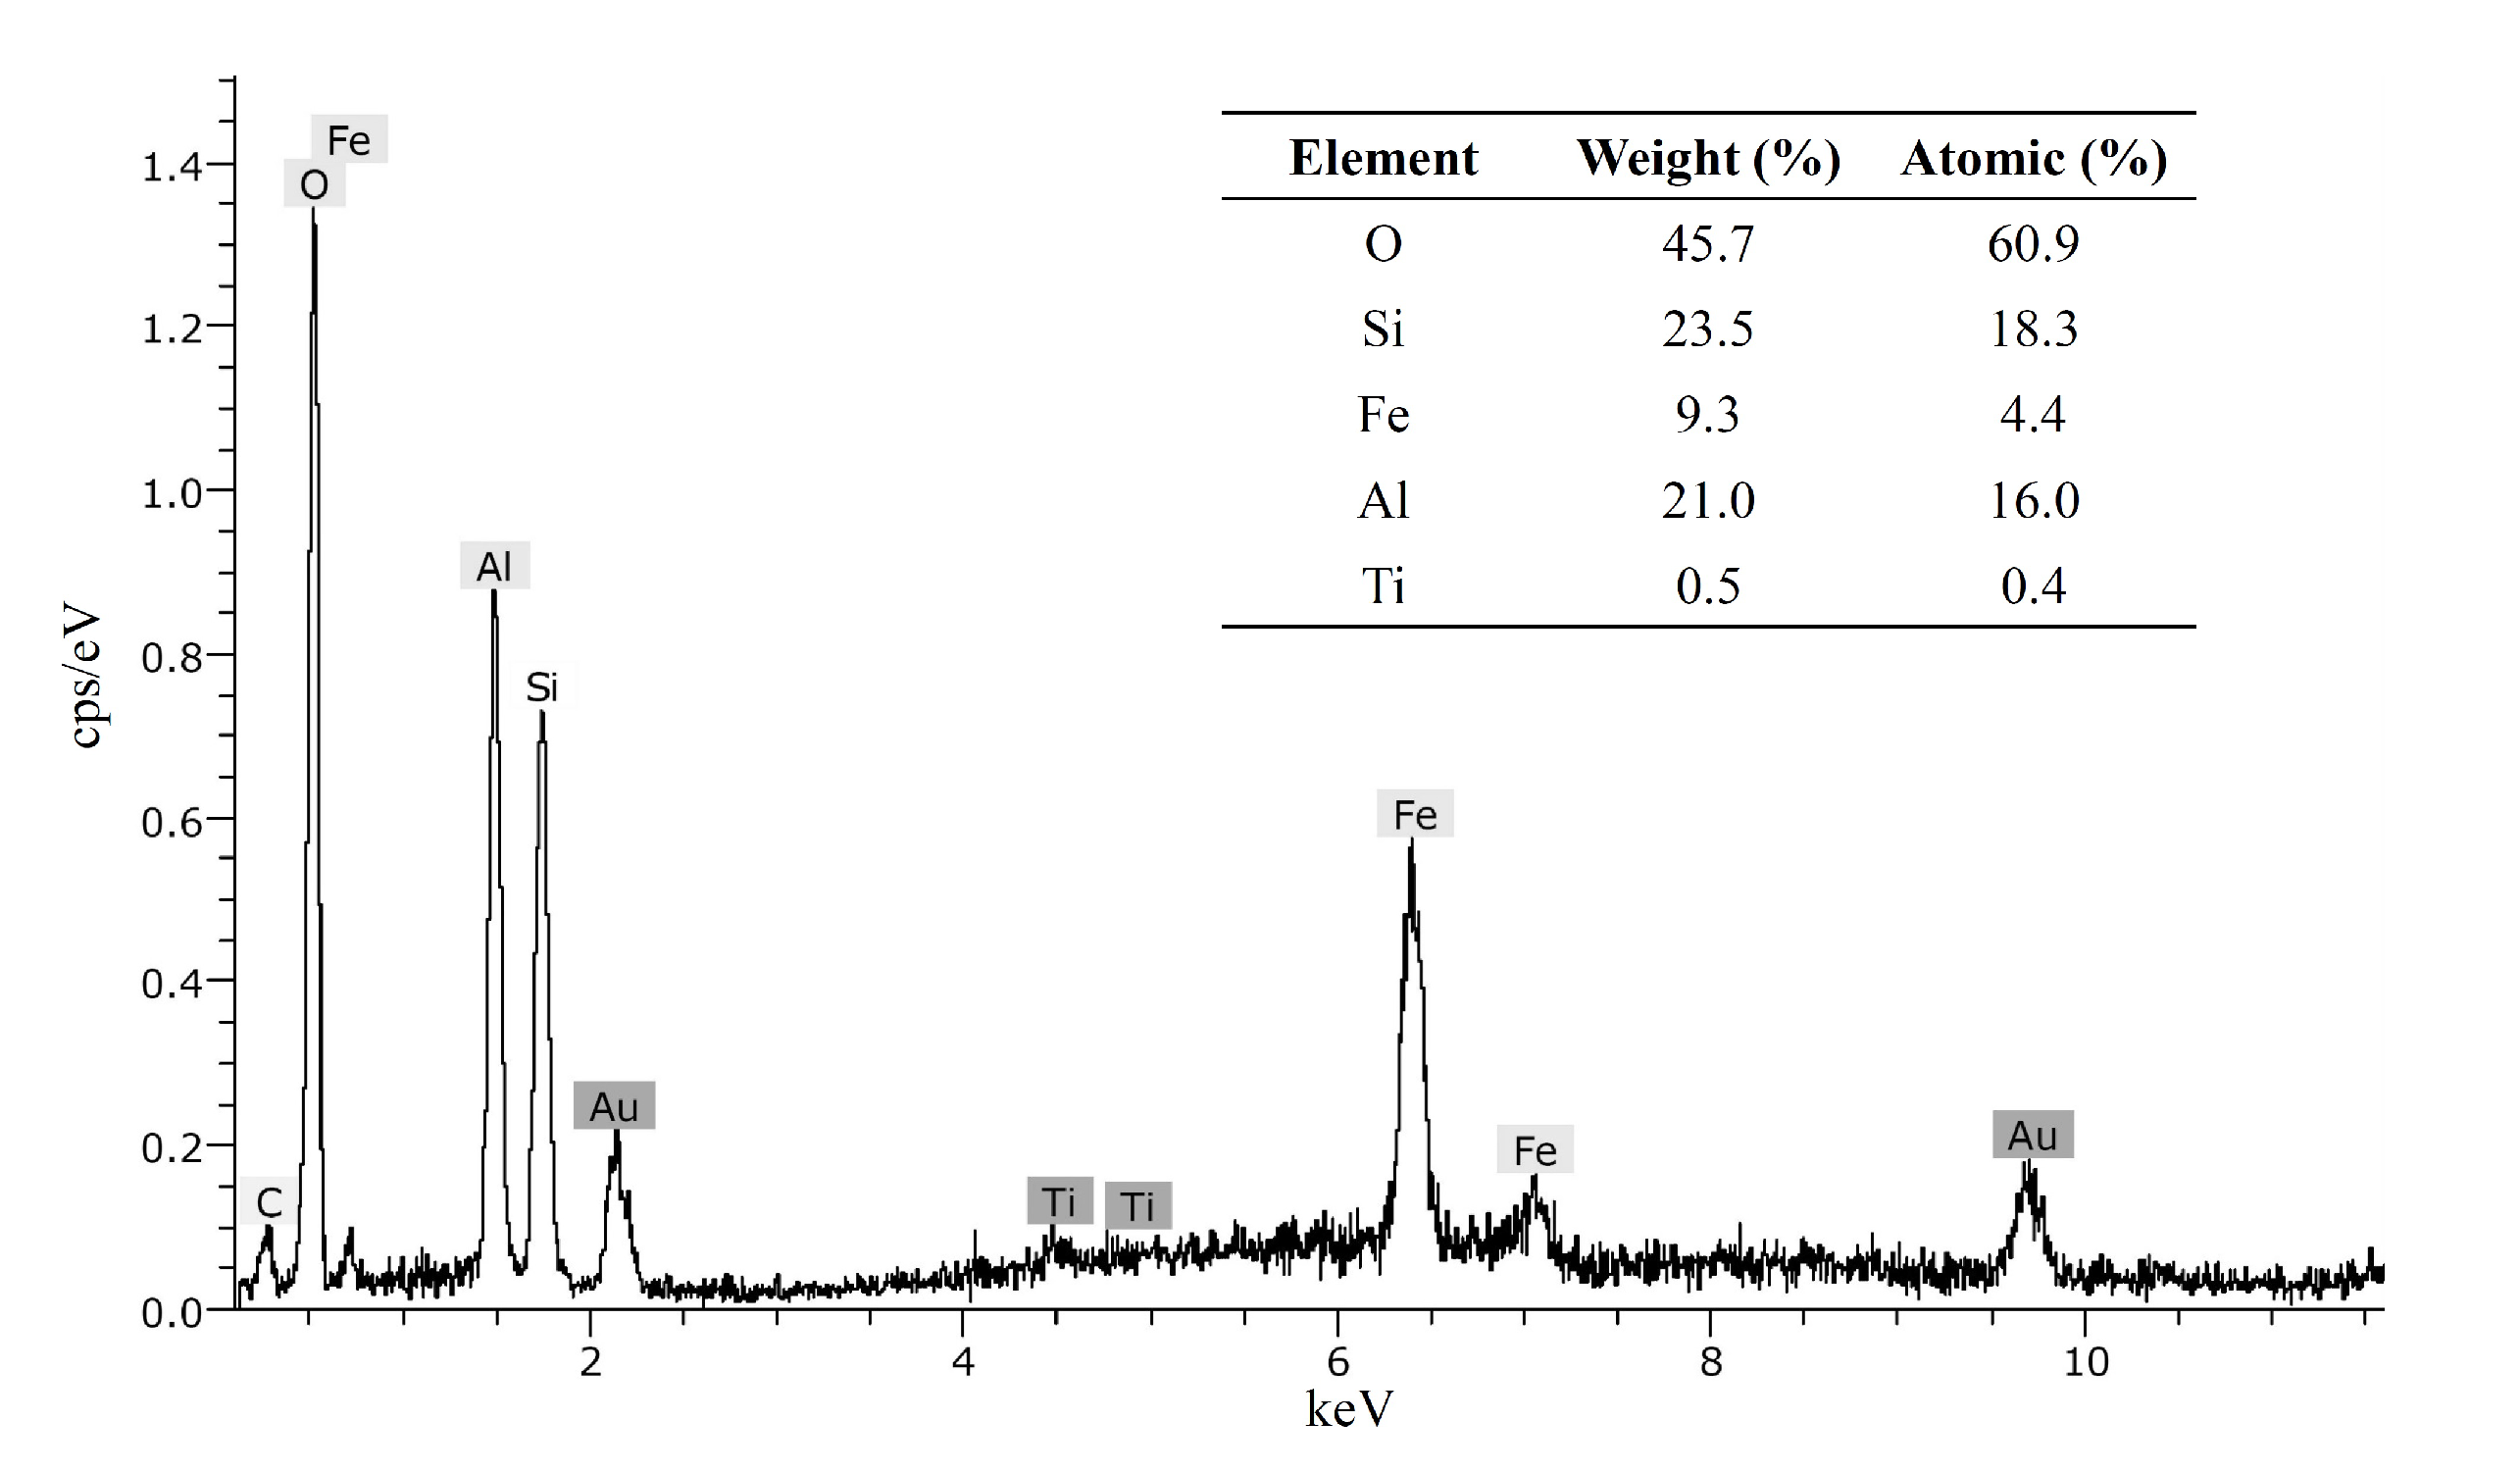
Five EDS analyses were performed of different samples of residual soils. Figure 7 shows a representative example which was performed on the location corresponding to a slightly oxidized clod (Figure 5). The results show that the main chemical elements are: Aluminum (Al), Silicon (Si), and Oxygen (O). The presence of other elements is also noted, in particular: Iron (Fe) and Titanium (Ti). The presence of iron oxides is clearly identified by the peaks of Fe. The percentages shown in the table correspond to the average values calculated over all of the EDS analyses carried out. They are consistent with the results of the ICP analyses described above.
3.4. Mercury Porosimetry
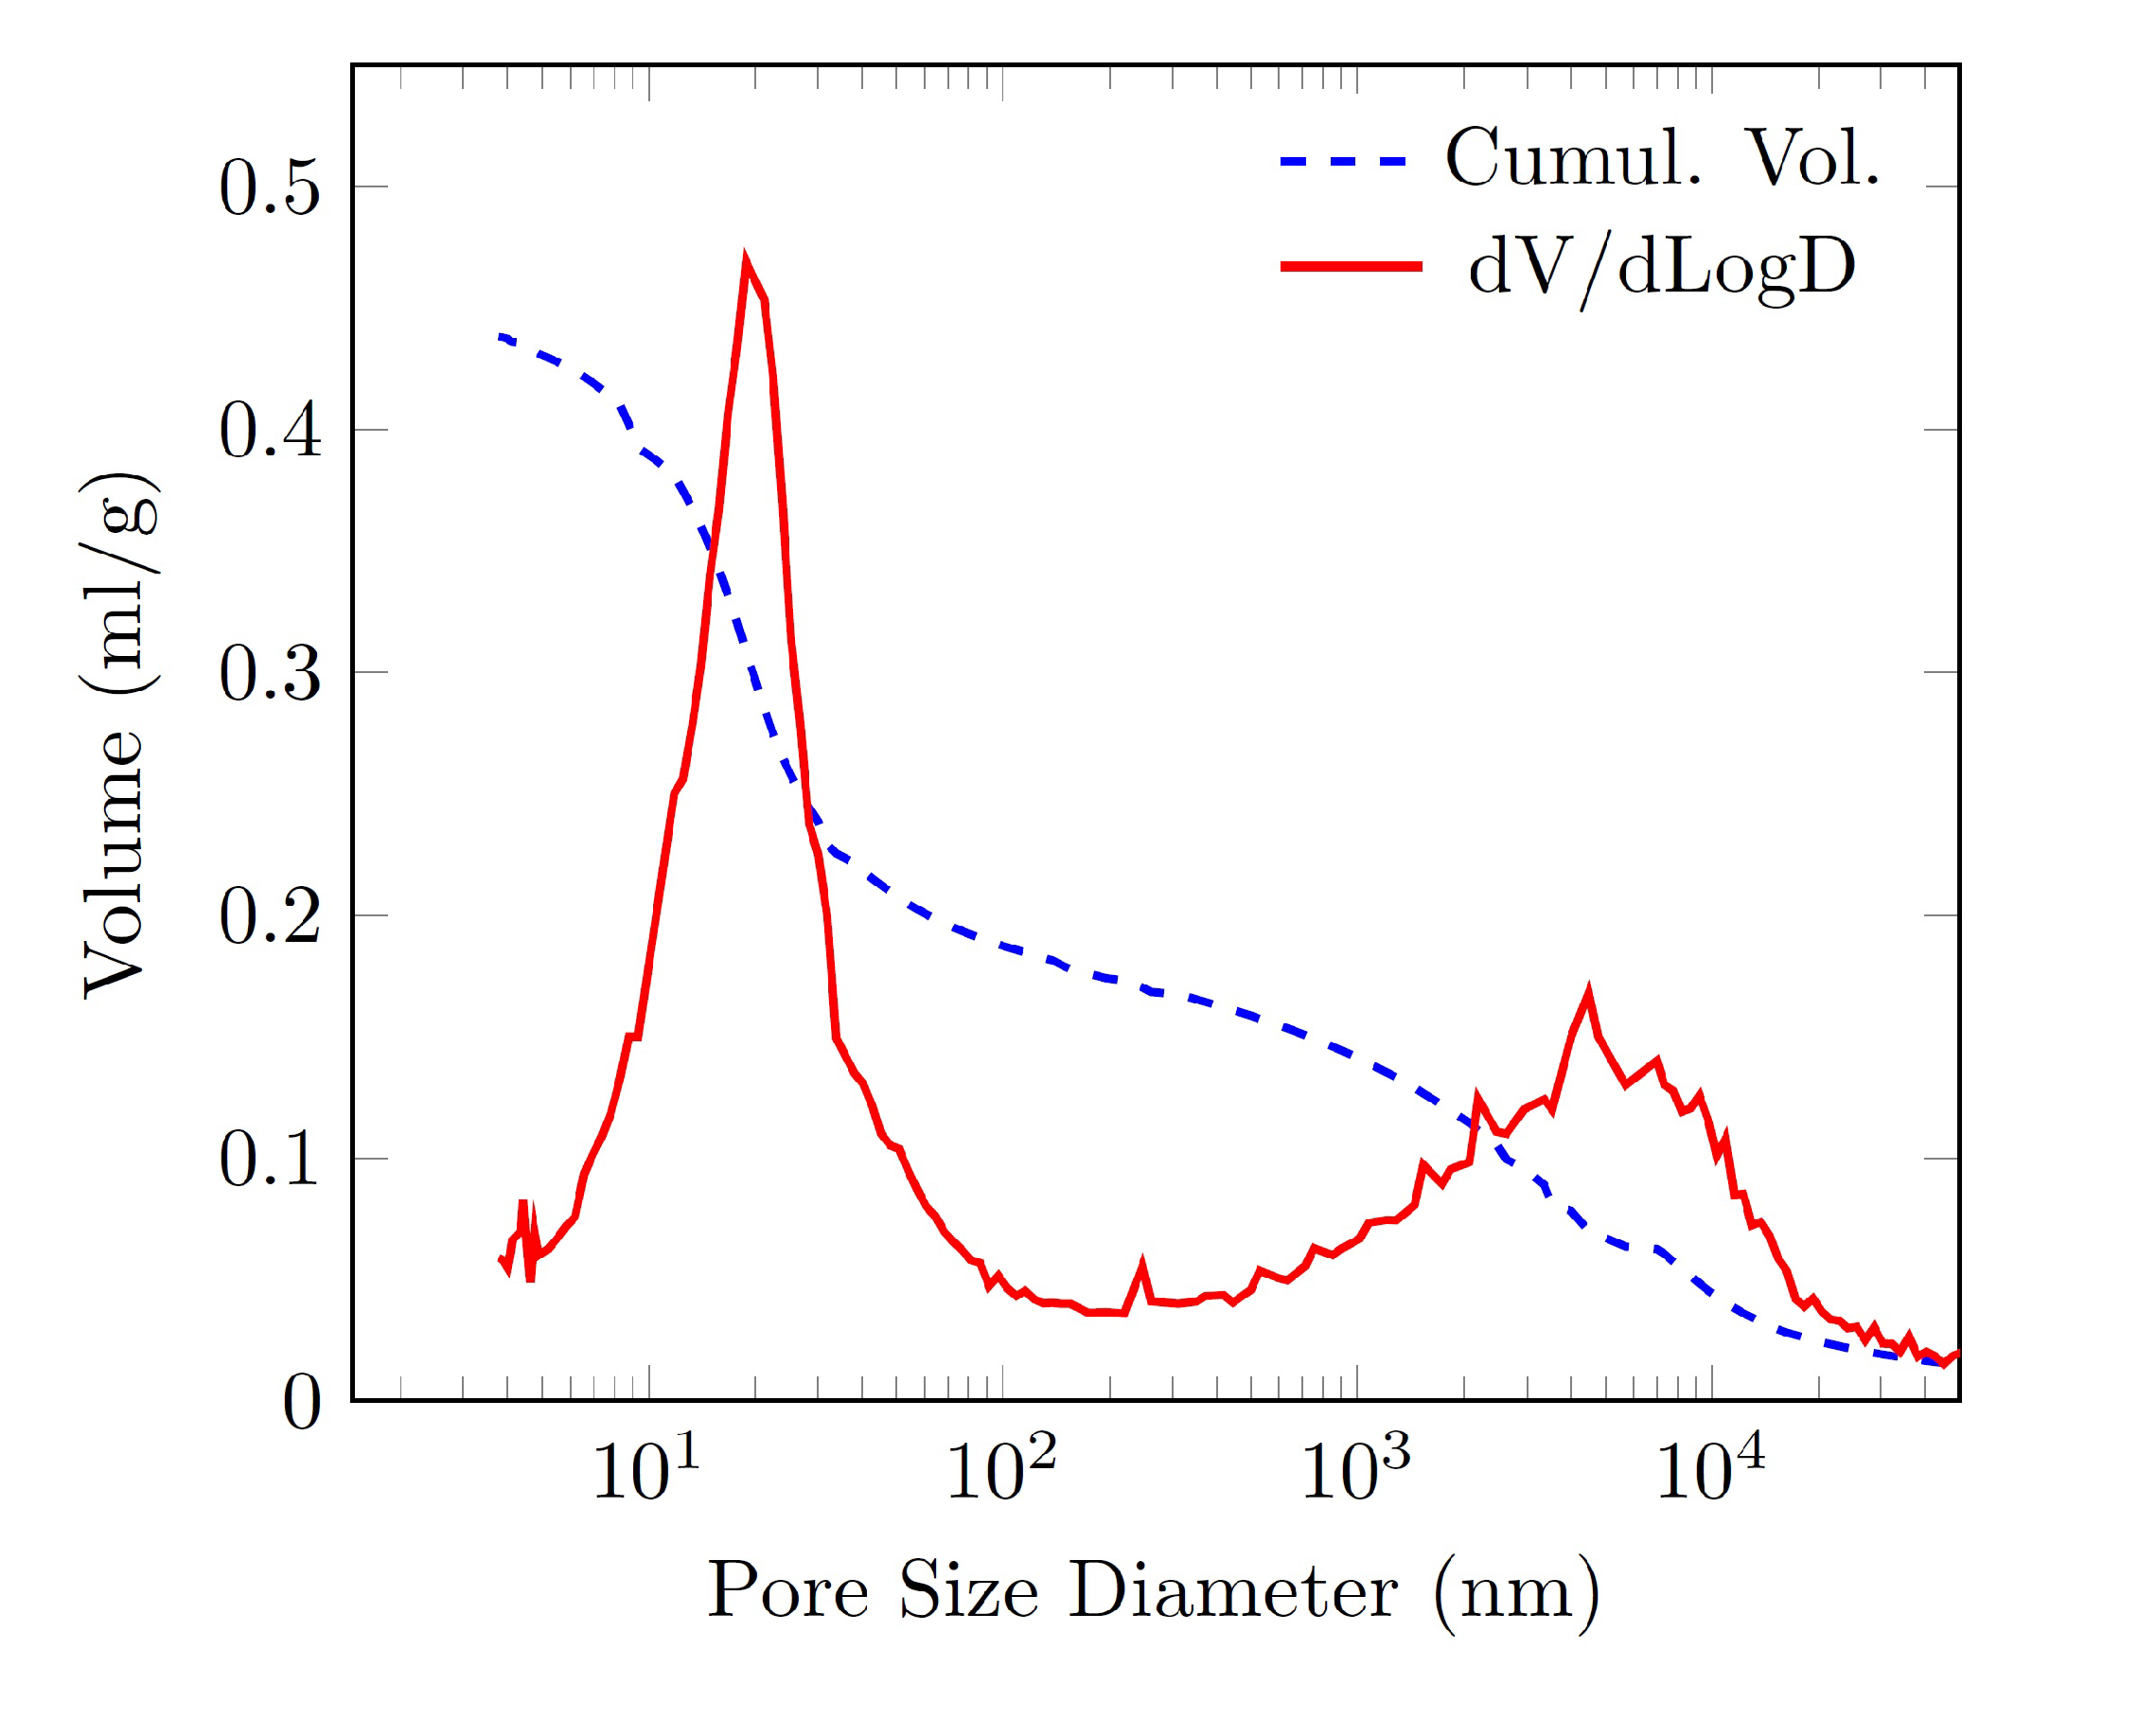
The pore size distribution of the remolded specimens was determined using an automated Mercury Intrusion Porosimeter (MIP). The MIP used can determine a pore size distribution from 3 nm to 360 m. The injection pressure applied varied from 3.5 kPa to 413 MPa. The sample tested had a porosity of 51.9%. The pore size analysis (Figure 8) shows a bimodal distribution of voids. The curve shows a fairly marked first peak for an equivalent diameter equal to 19 nm, then a second less pronounced peak at 4.5 m. The results observed on the SEM image of the strongly oxidized clod are consistent with what was found quantitatively. It is worth noting that the bimodal character of the void distribution and the pore sizes corresponding to the two peaks are comparable to other results recently obtained on compacted laterites [67] and andesitic volcanic soil from the Andean mountains [10].
3.5. Small Strain Shear Modulus
Numerous empirical equations were developed to predict the value of for isotropic fine-grained soils [20,21,23,31,32,68,69,70]. Most of the formulas can be written in the following generic form:
where A is a constant depending on the nature of the soil, is a function of the void ratio e, is the mean effective stress, m generally ranges from equal to 1/2 and 2/3, n can be taken between 1/2 (for smooth spherical contacts) and 1/3 (for conical asperities) [69,71], a reference pressure generally taken equal to 1 kPa. The expressions found in the literature are summarized in Table 3. The overconsolidation ratio, , is defined in the context of unidimensional consolidation as the ratio between the vertical consolidation stress and the current vertical stress. As the material is assumed to behave isotopically, Viggiani and Atkinson [69] proposed using a different definition , where is the maximum effective stress undergone by the soil. Several equations were proposed for (Table 3). Some authors obtained empirical equations based on purely statistical regressions [20,72]. Other authors, on the basis of theoretical considerations, proposed power functions of the void ratio [43,73,74] or the specific volume [32,70].
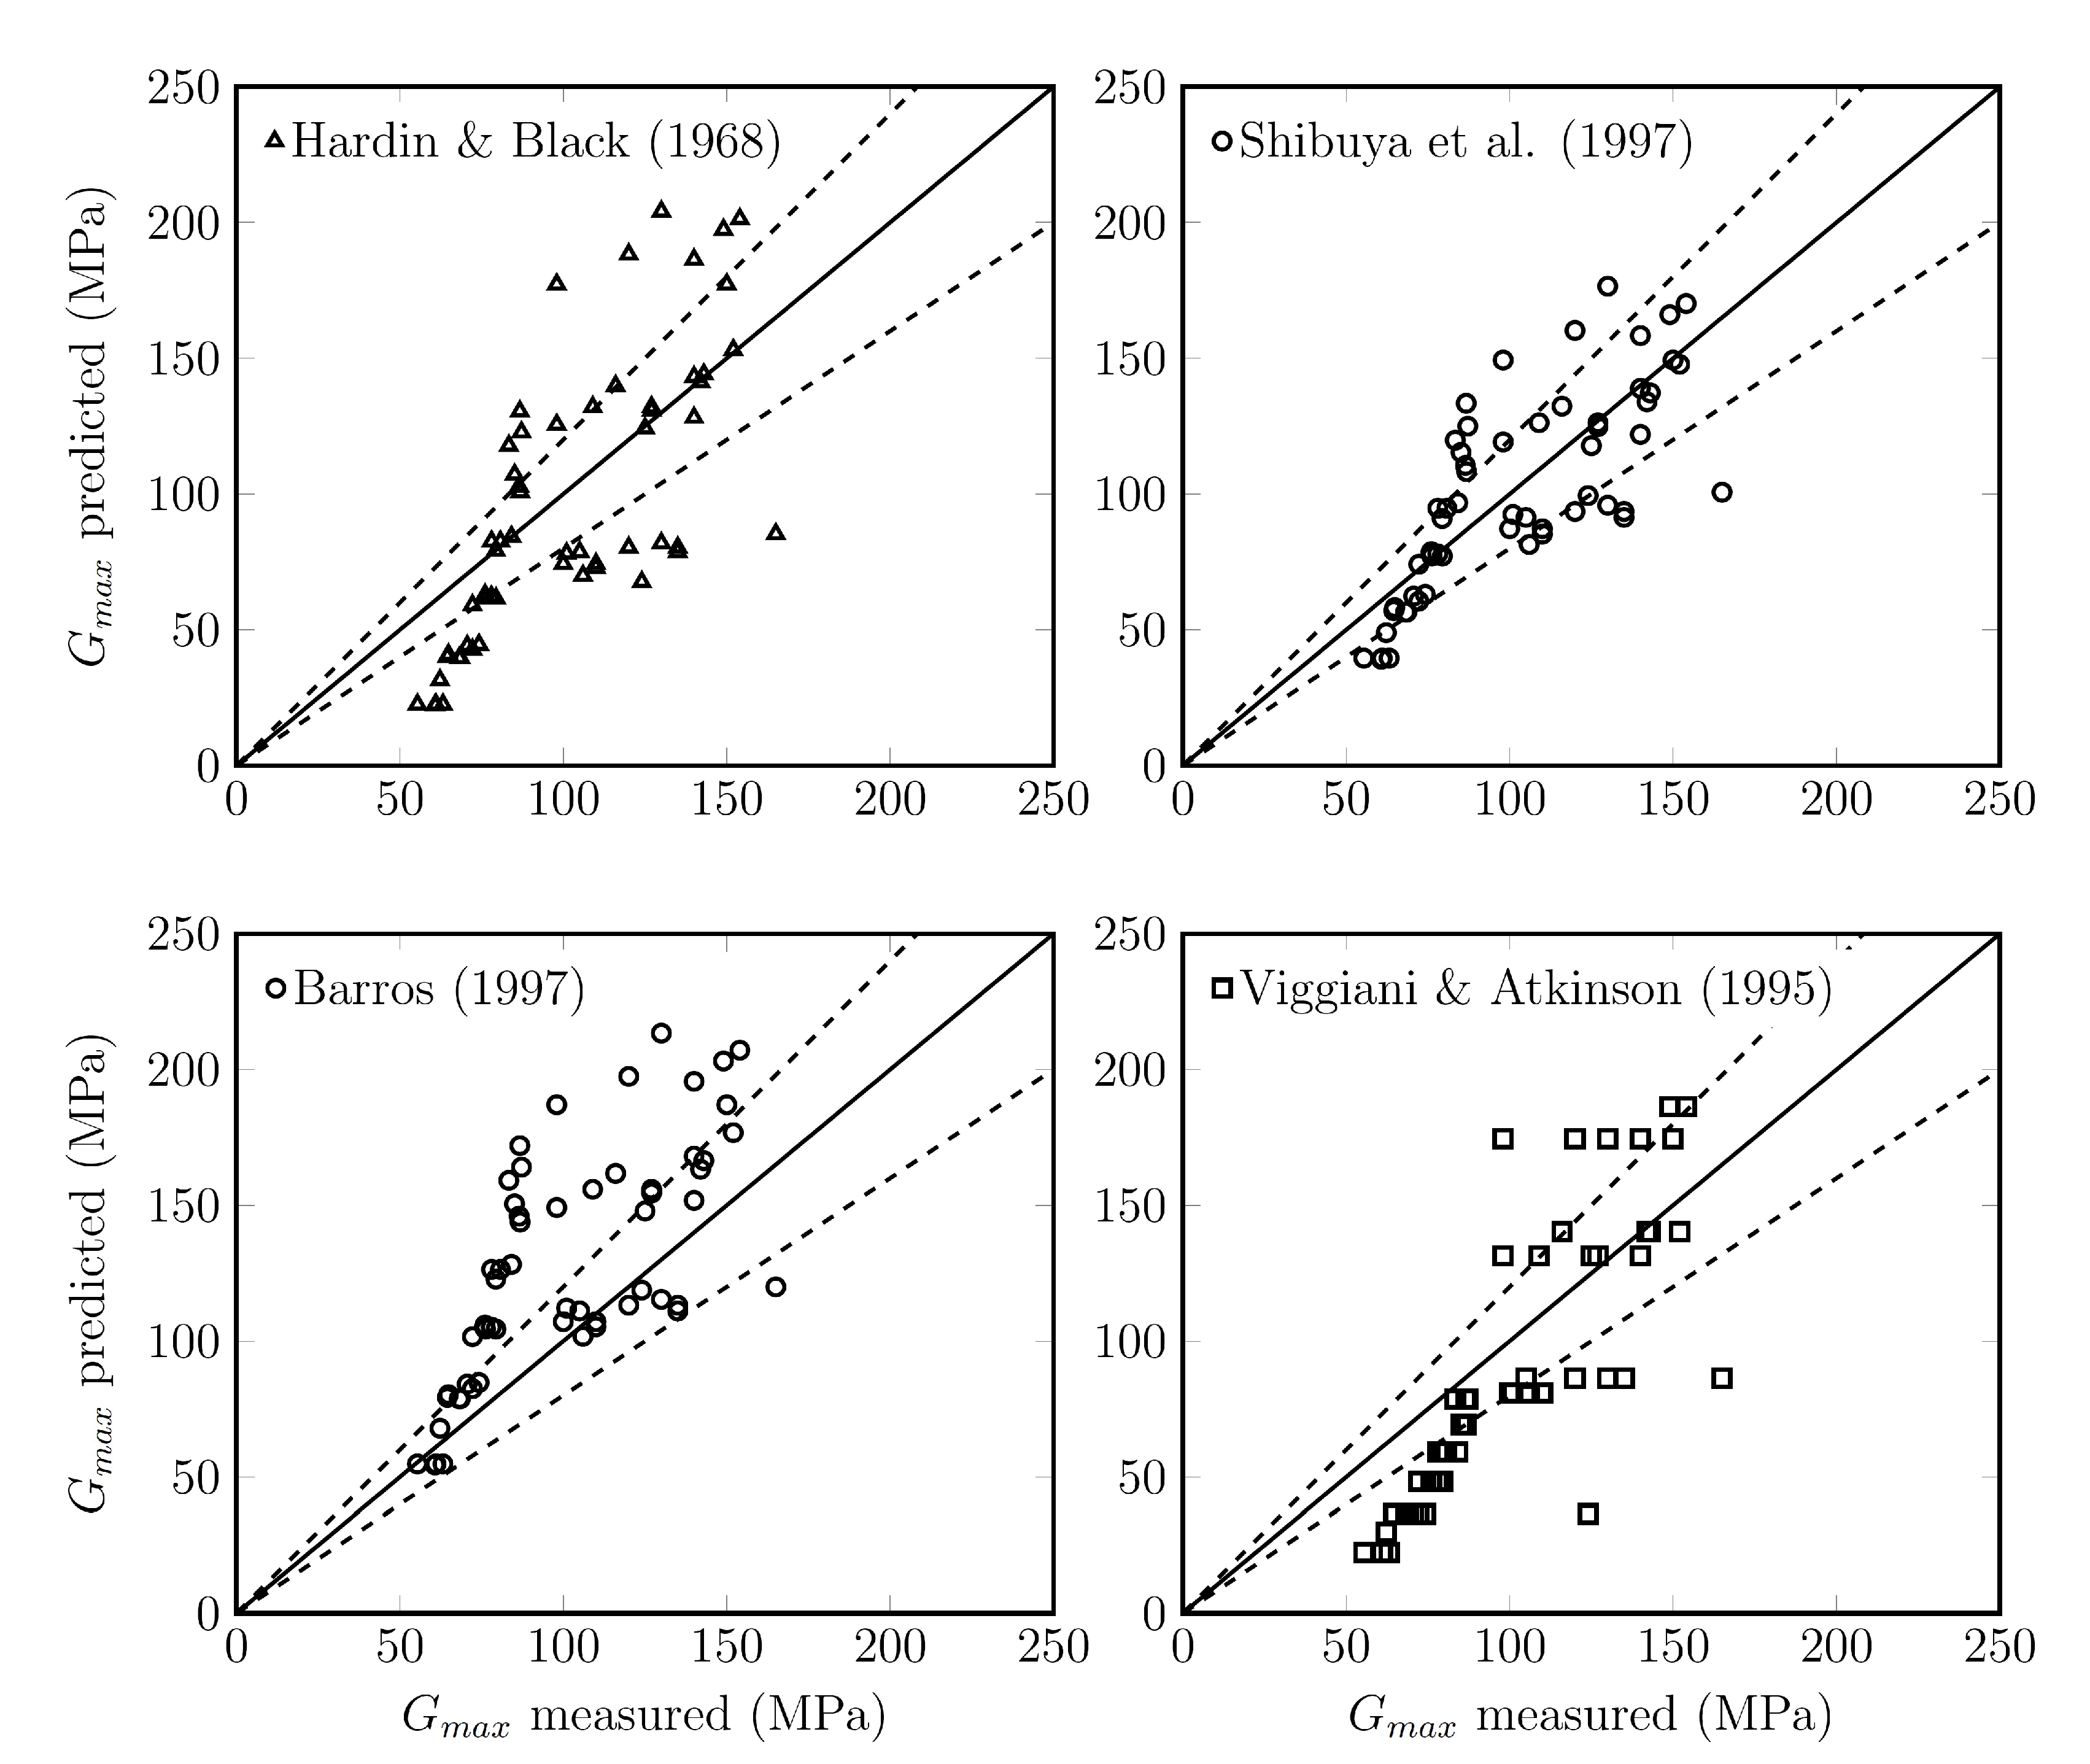
In this work, the maximum shear modulus was calculated for each of the samples according to several existing empirical relationships, which are cited above. Figure 9 shows a comparison between the maximum shear modulus obtained by the empirical equations and those measured by the RC tests. For lower than 100 MPa, these models tend to underestimate . For larger values of , there is no clear tendency, but the dispersion of is of the order of 50% around the measured value. The values of calculated by the empirical formula of Viggiani and Atkinson [69] were originally determined for a distortion of %. As a result, it was expected that the shear modulus measured by the resonant column would be larger than those found by this empirical formula. It is worth mentioning that most of these empirical formulas were established for sedimentary soils found in temperate zones. The only known equation for developed for compacted lateritic soils from Brazil was proposed by Barros [43]. However, this equation also tends to overestimate the value of . It can be concluded that, as yet, no published equation is able to predict for the residual soil considered in this study. The reason is probably because of its specificities in terms of weathering grade, clay mineralogy, particle size distribution, and cementation. It is, therefore, necessary to develop a new specific equation for the prediction of for the residual soil studied.
Under isotropic stress conditions, it was shown that of the three variables e, , and appearing in Equation (1), one is redundant [76]. In practice, is not straightforward to estimate and is affected by a high level of uncertainty. Furthermore, the use of a void ratio function was shown to be superior to the use of the function [32]. This is why an empirical equation depending only on e and is proposed. The equations proposed by Hardin and Black [68] and Shibata and Soelarno [72] can lead to a very sharp reduction and even the annulment of the small-strain shear modulus for higher void ratios. The equation proposed by Kagawa [21] does not permit varying the decreasing rate of the shear modulus with the void ratio. Functions and lead to very close approximations. Although the first expression may be justified using the simple theory of Hertzian contacts for perfect spheres [77], the latter expression was chosen because it is based on a sounder physical parameter that is equivalent to dry density. Following Vardanega and Bolton [32], a predictive equation for was sought in the following form:
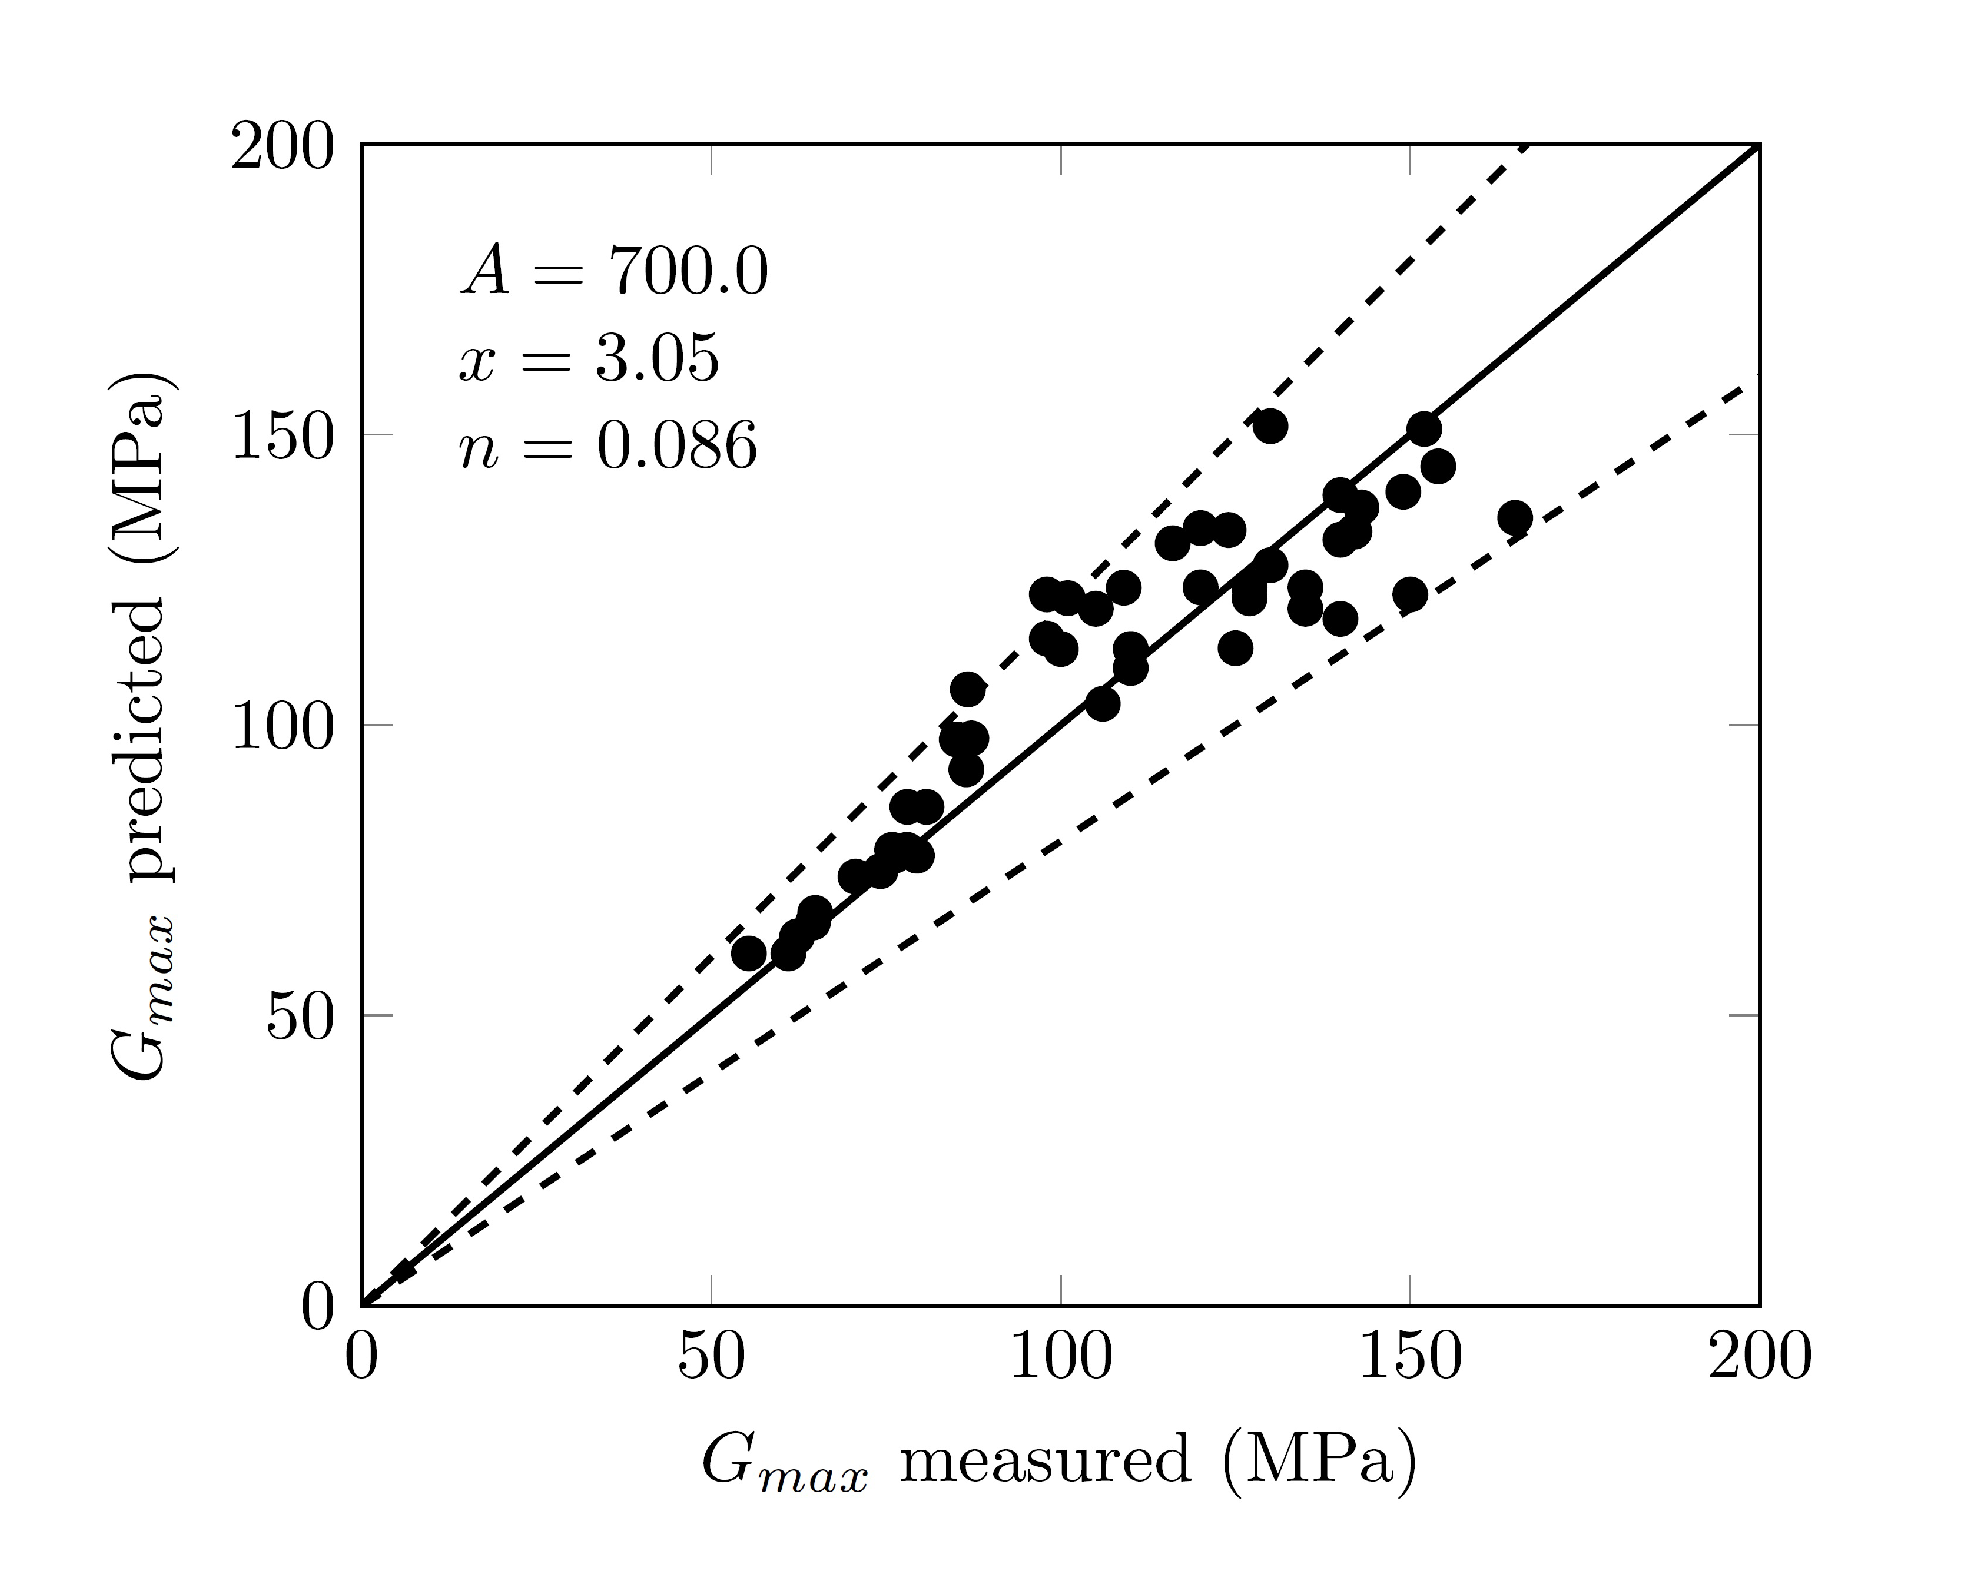
where A, x, and n are determined by a multiple log-linear regression on and . The optimal values were found to be equal to , , and (). As can be seen in Figure 10, the observed difference between measured and predicted values is lower than 20%, which is satisfactory from a practical point of view and lies in the range of uncertainties obtained in other published studies. For example, Viggiani and Atkinson [69] obtained a maximum error close to 15%, [73] between 12 and 22%, and [32] around 25%.
Some of the tests were carried out on normally consolidated samples (). In this case, a bijective relationship between the specific volume and the mean effective pressure exists and can be considered as log-linear. It is, therefore, possible to remove one of the two variables from Equation (2). Thus, the expression of can be written as a simple function of :
The values B and n are determined so as to have a good linear correlation between the experimental results and the empirical results. The optimal values were found to be and (). Figure 11 presents the measured values of for the normally consolidated specimen as a function of . The solid line corresponds to the regression curve giving the higher determination coefficient. It is, however, in the range of the values found by Francisca and Bogado [52] for a basaltic residual soil from Argentina and by Torres and Colmenares [51] for lateritic residual soils from Colombia. The results obtained are also in agreement with the conclusions of other authors according to whom n decreases with the increasing cementation degree [78]. However, the value of n determined here is lower than the value obtained experimentally for conventional granular soils. This can be explained by the fact that the grains constituting the material are heterogeneous aggregates of clay platelets and that it was demonstrated that compaction tends to decrease the value of n [79]. It is, therefore, not surprising that the Hertzian theory of elastic contact does not seem to apply to our case study.
3.6. Normalized Shear Modulus
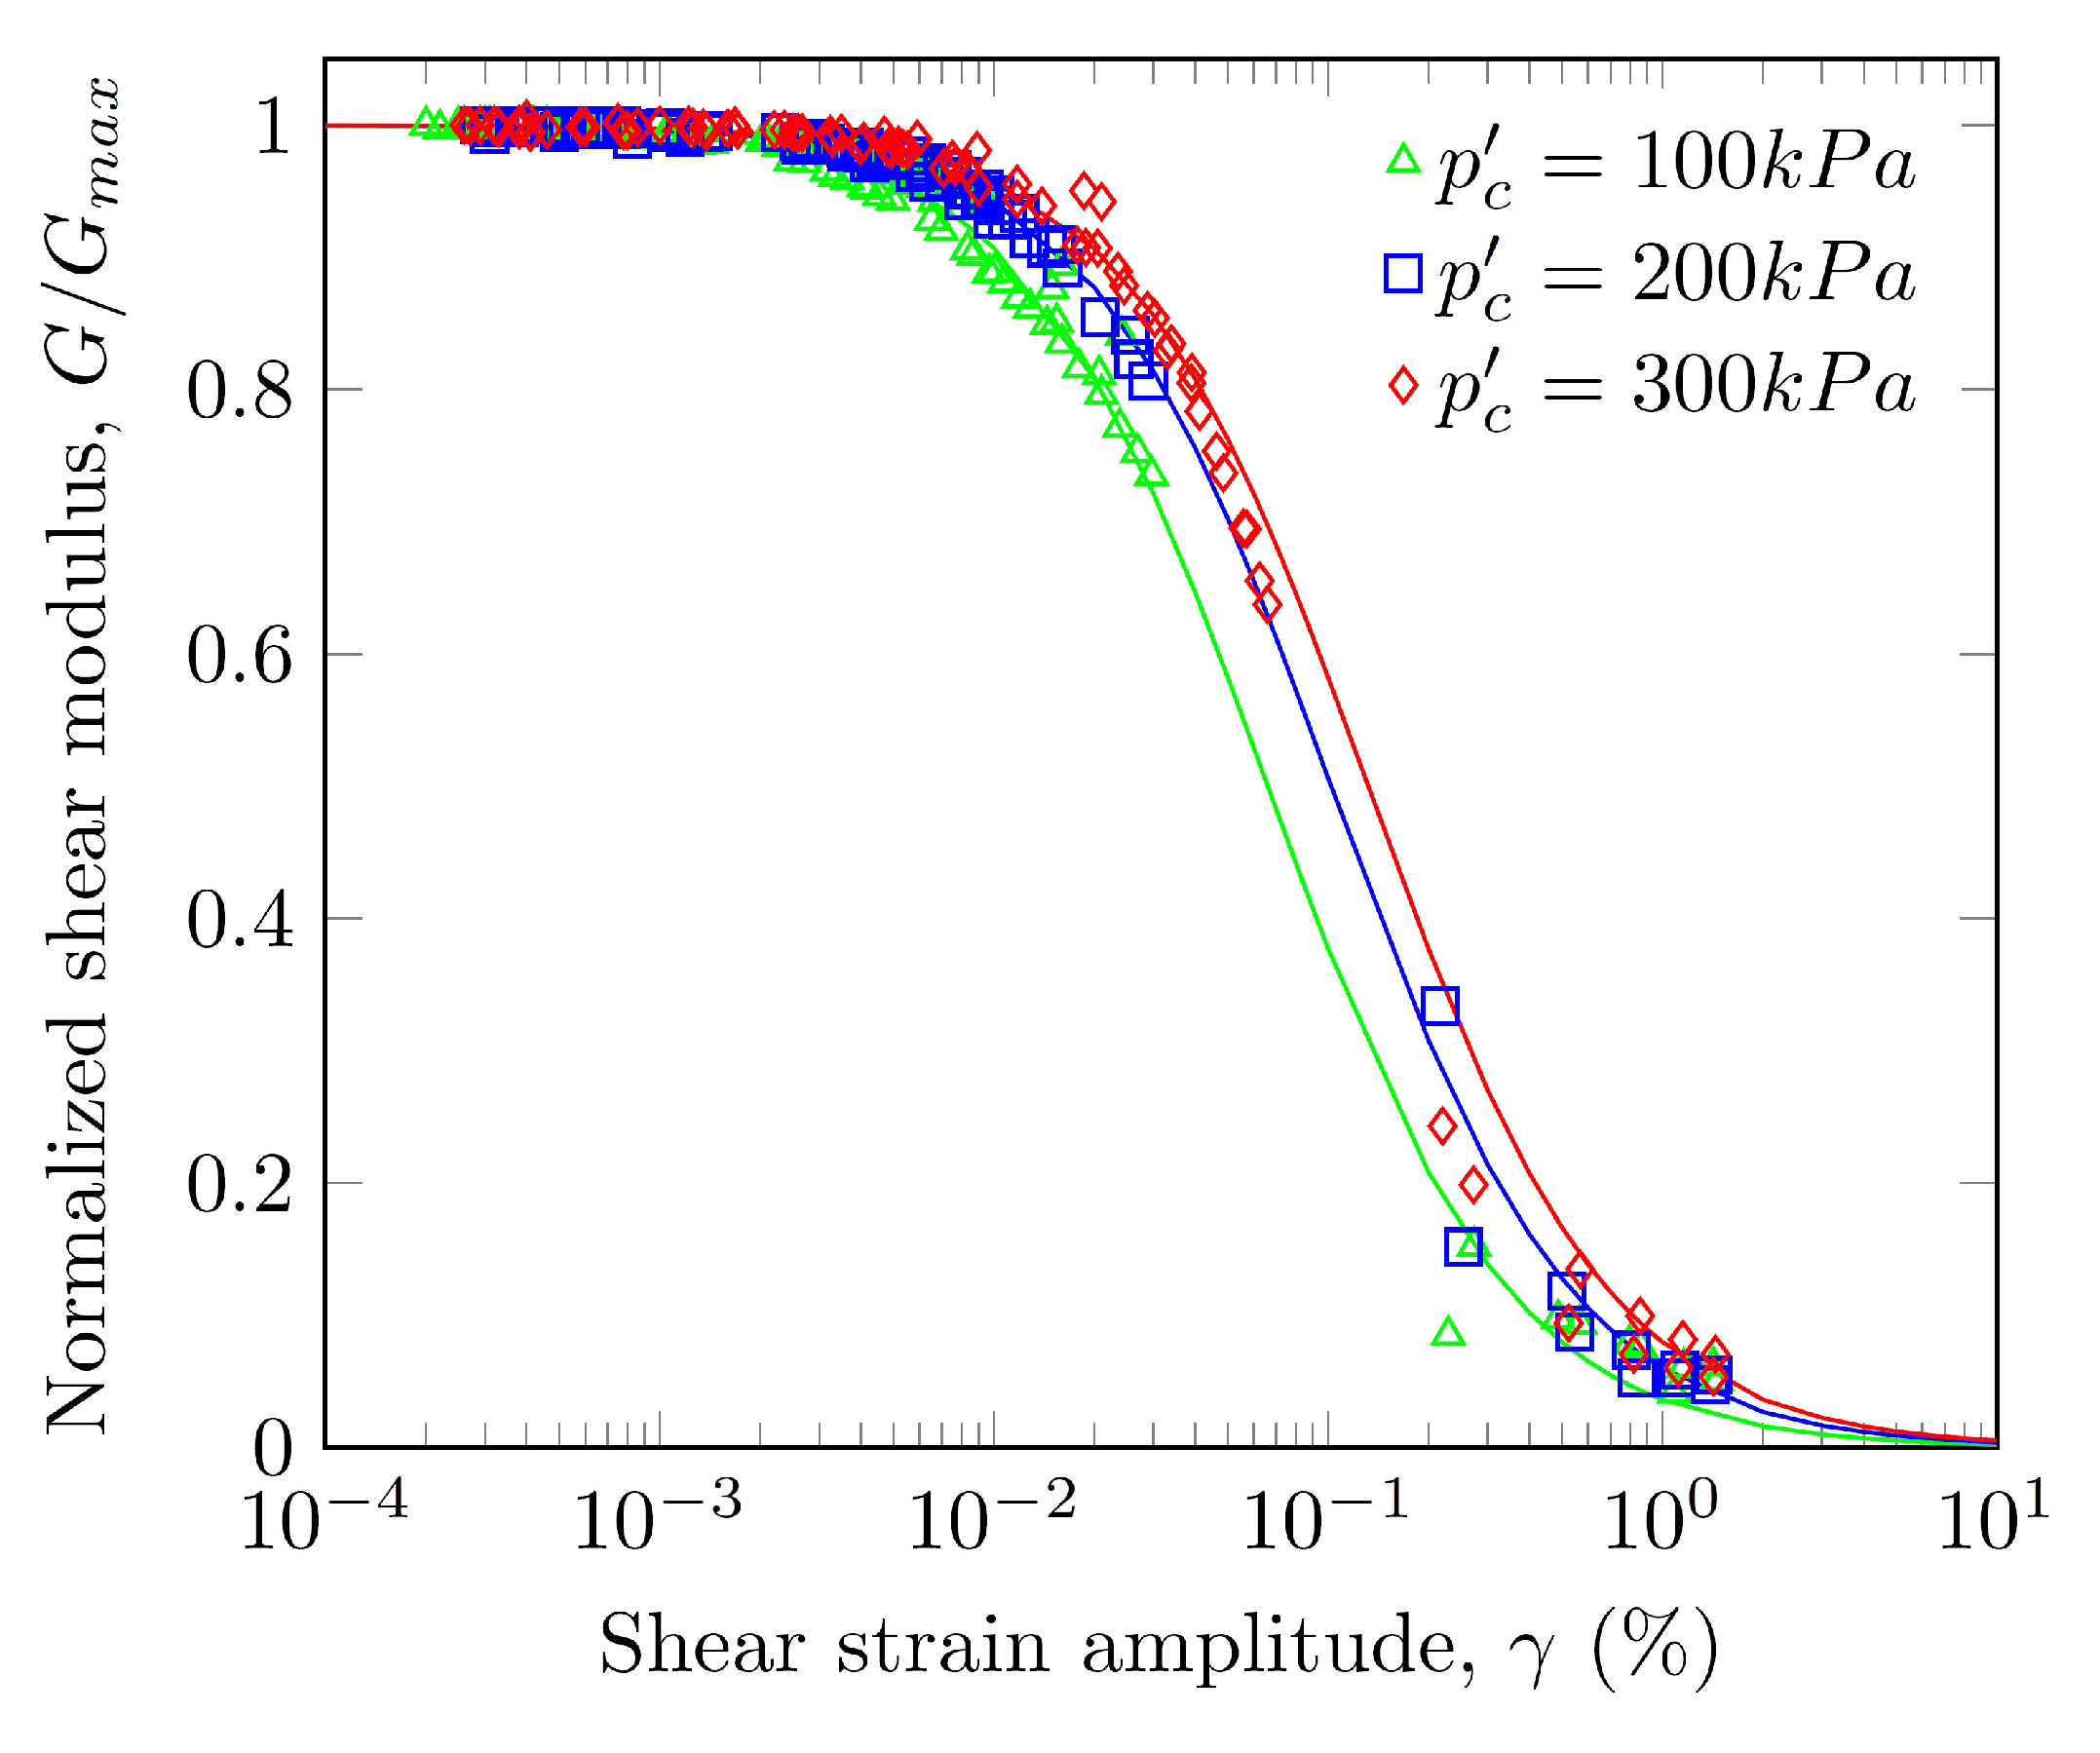
The resonant column and cyclic triaxial tests were performed under undrained conditions [55,80]. In the resonant column tests, the increase of the pore pressure during the cyclic loading remained negligible as it did not exceed a few Pascals. In the triaxial tests, the pore pressure build-up during the cyclic loading led to a decrease in the mean effective stress. The triaxial cyclic tests were, therefore, not carried out at a constant mean effective stress, i.e., the mean effective stress could not be controlled. The influence of the stress state on the soil response was, therefore, assessed via the mean confinement pressure . Figure 12 shows all experimental data obtained from the resonant columns and triaxial tests.
The beginning of the vs. curves () was established using the results of the RC tests and the end of the curves () using the results of the cyclic triaxial tests. It is worth noting that the continuity of the shear modulus degradation and damping ratio curves obtained from the resonant column and triaxial cyclic tests is observed. It is also clear that the shear modulus reduction curve is influenced by . For a given , increases as increases, especially in the small strain range. The curvature of the reduction curve in the range =0.01–0.1% increases as increases.
Based on a compilation of numerous laboratory tests published in the literature concerning clays and silts, Darendeli et al. [28], Zhang et al. [44], and Vardanega et al. [32] proposed empirical equations for vs. curves. Most of the existing equations can be expressed under the general form:
where is a reference shear strain corresponding to the strain amplitude when the shear modulus is reduced to one half of , and is a calibration parameter influencing the curvature of the shear modulus reduction curve.
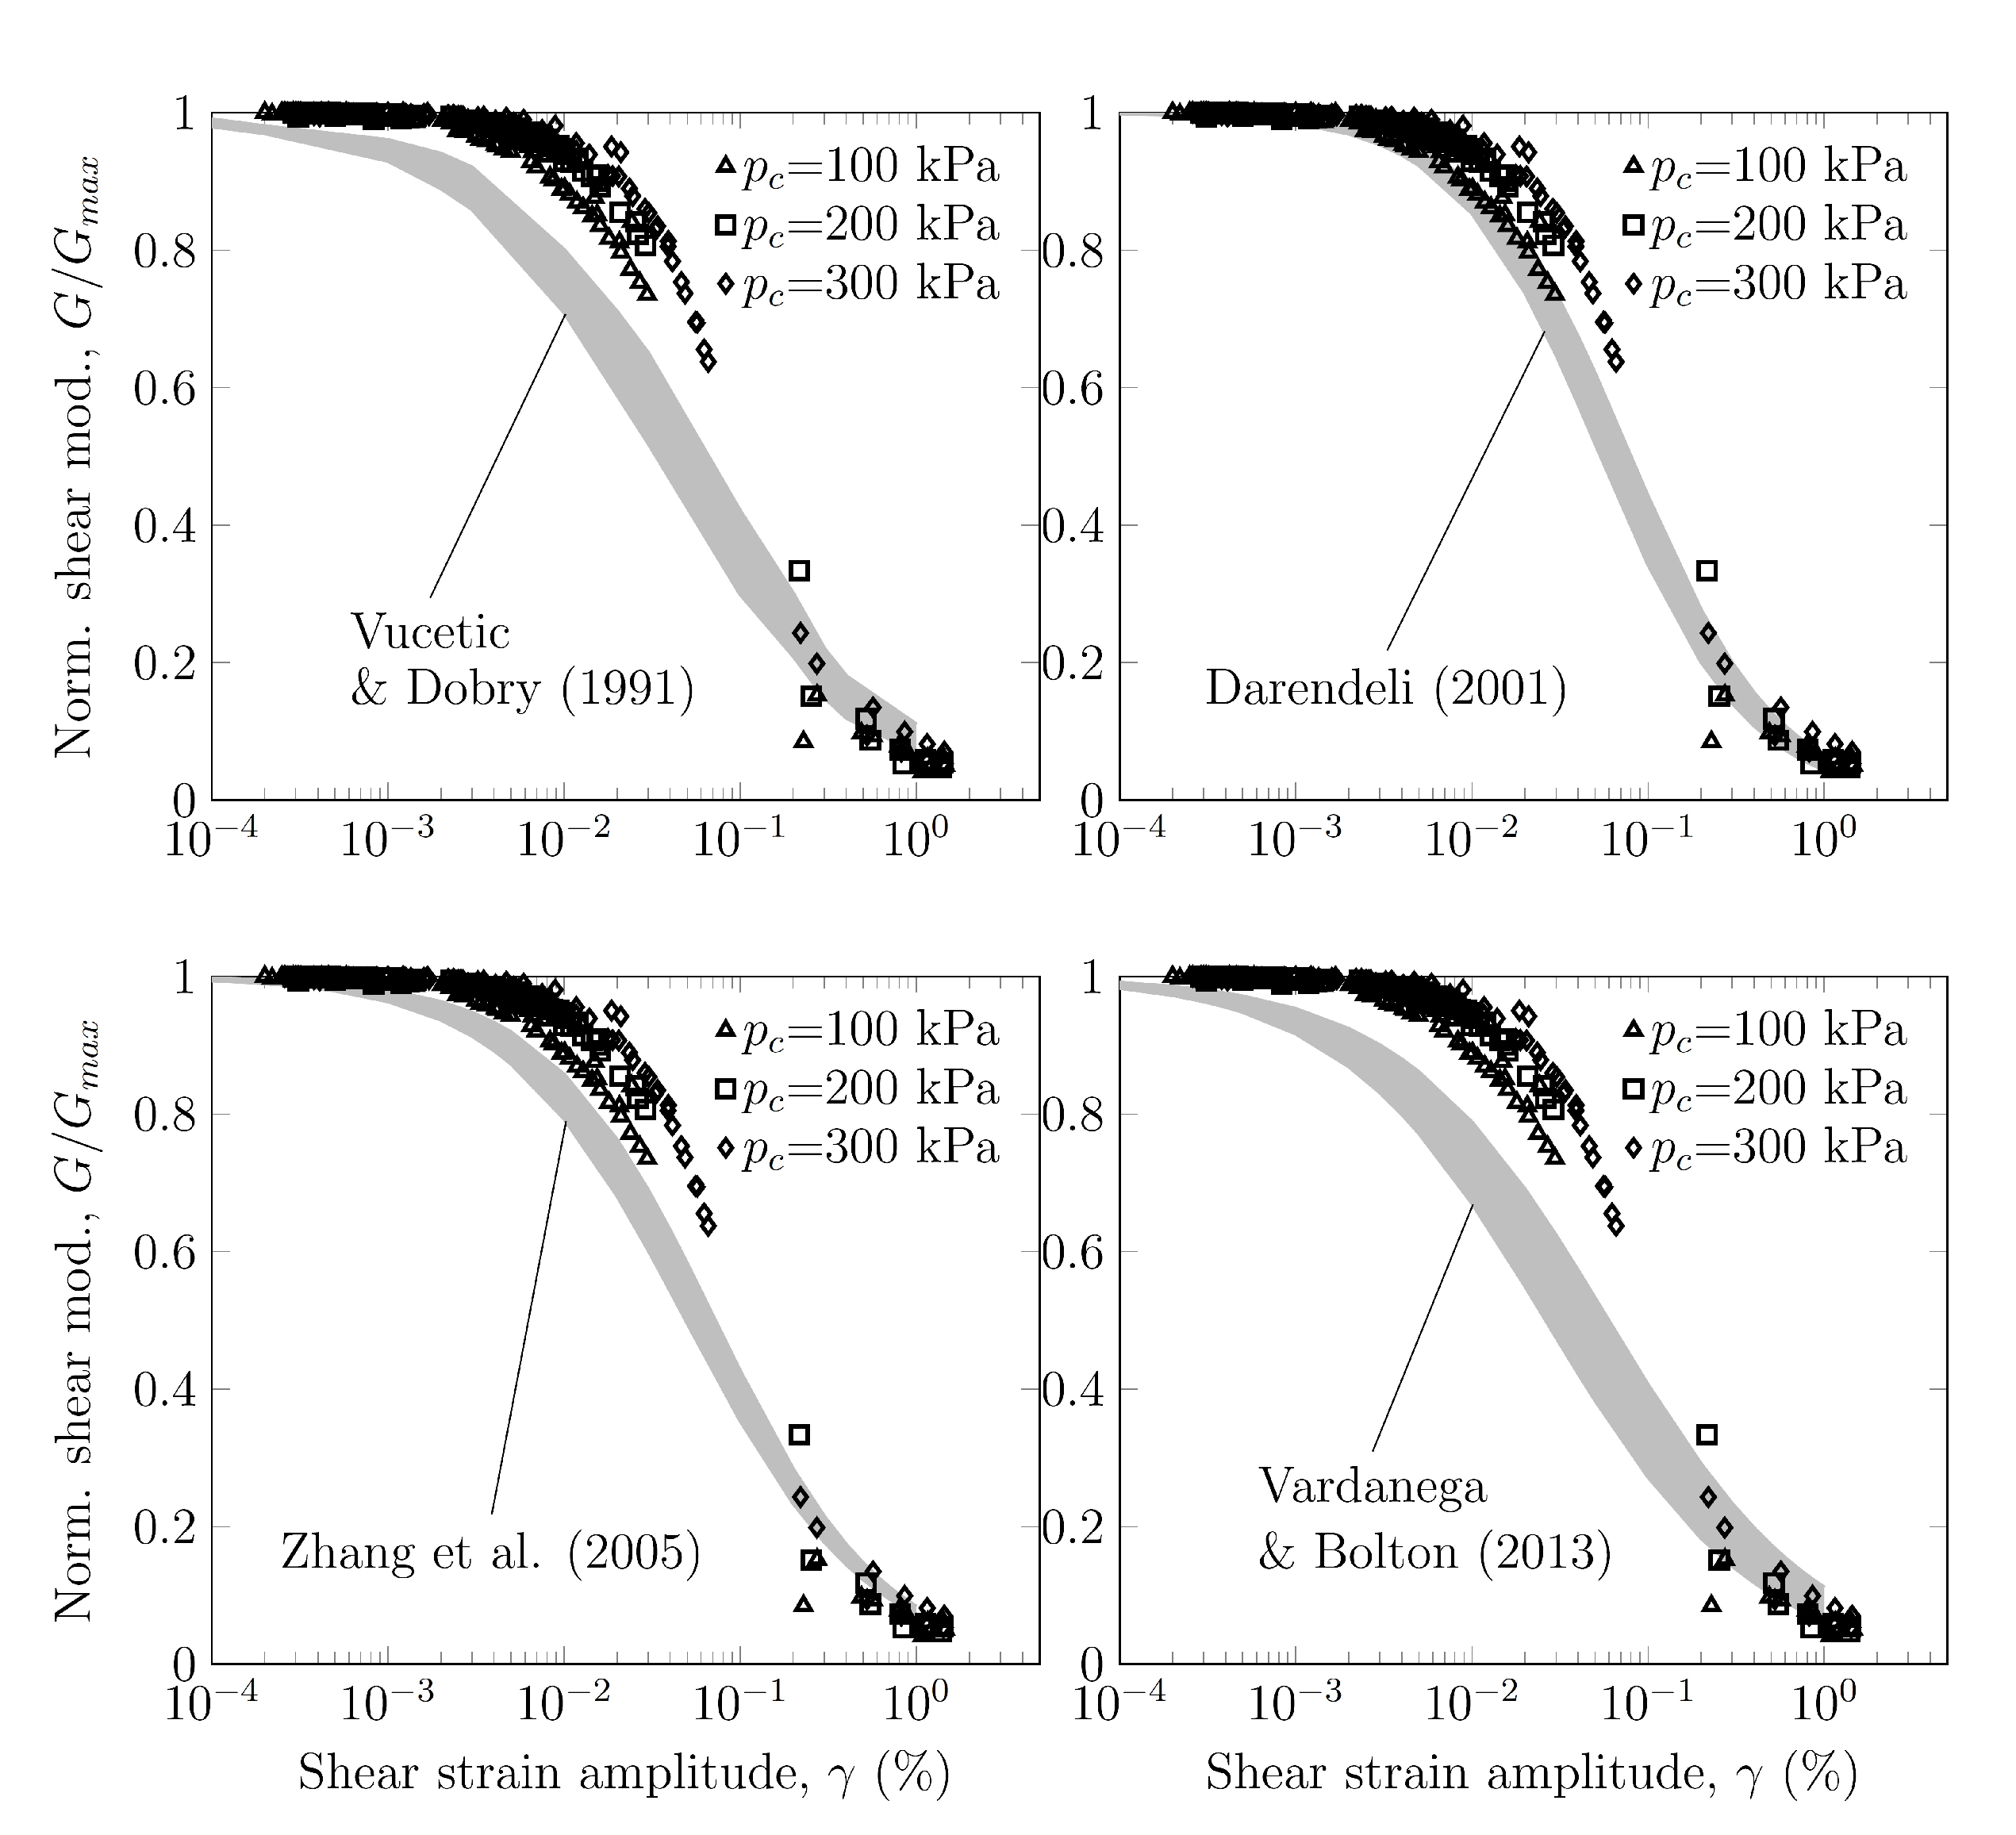
Several authors proposed expressing as a function of the plasticity index [22,24,28,32,35], overconsolidation ratio [28], or the mean effective stress [28,44]. Figure 13 shows that the equations proposed previously tend to underestimate in the small to medium strain range. For the large deformation domain, the existing models match quite satisfactorily with the experimental results. The models proposed by Vucetic and Dobry [35] and Vardanega and Bolton [32], which only account for the influence of the plasticity index, give poor results in the small strain range. They underestimate by up to 30-35% in the medium strain domain . The models proposed by Darendeli [28] and Zhang et al. [44], which integrate the influence of the plasticity index, the mean effective stress, and the overconsolidation ratio, give better approximations but remain below the experimental results by around 15–20% for and the influence of the confining pressure seems to be underestimated. It can, therefore, be considered that the existing models do not allow for the prediction of the soil response with a sufficient accuracy, in particular in the transition zone between small and medium strains. It is, therefore, necessary to develop a specific model to predict vs. .
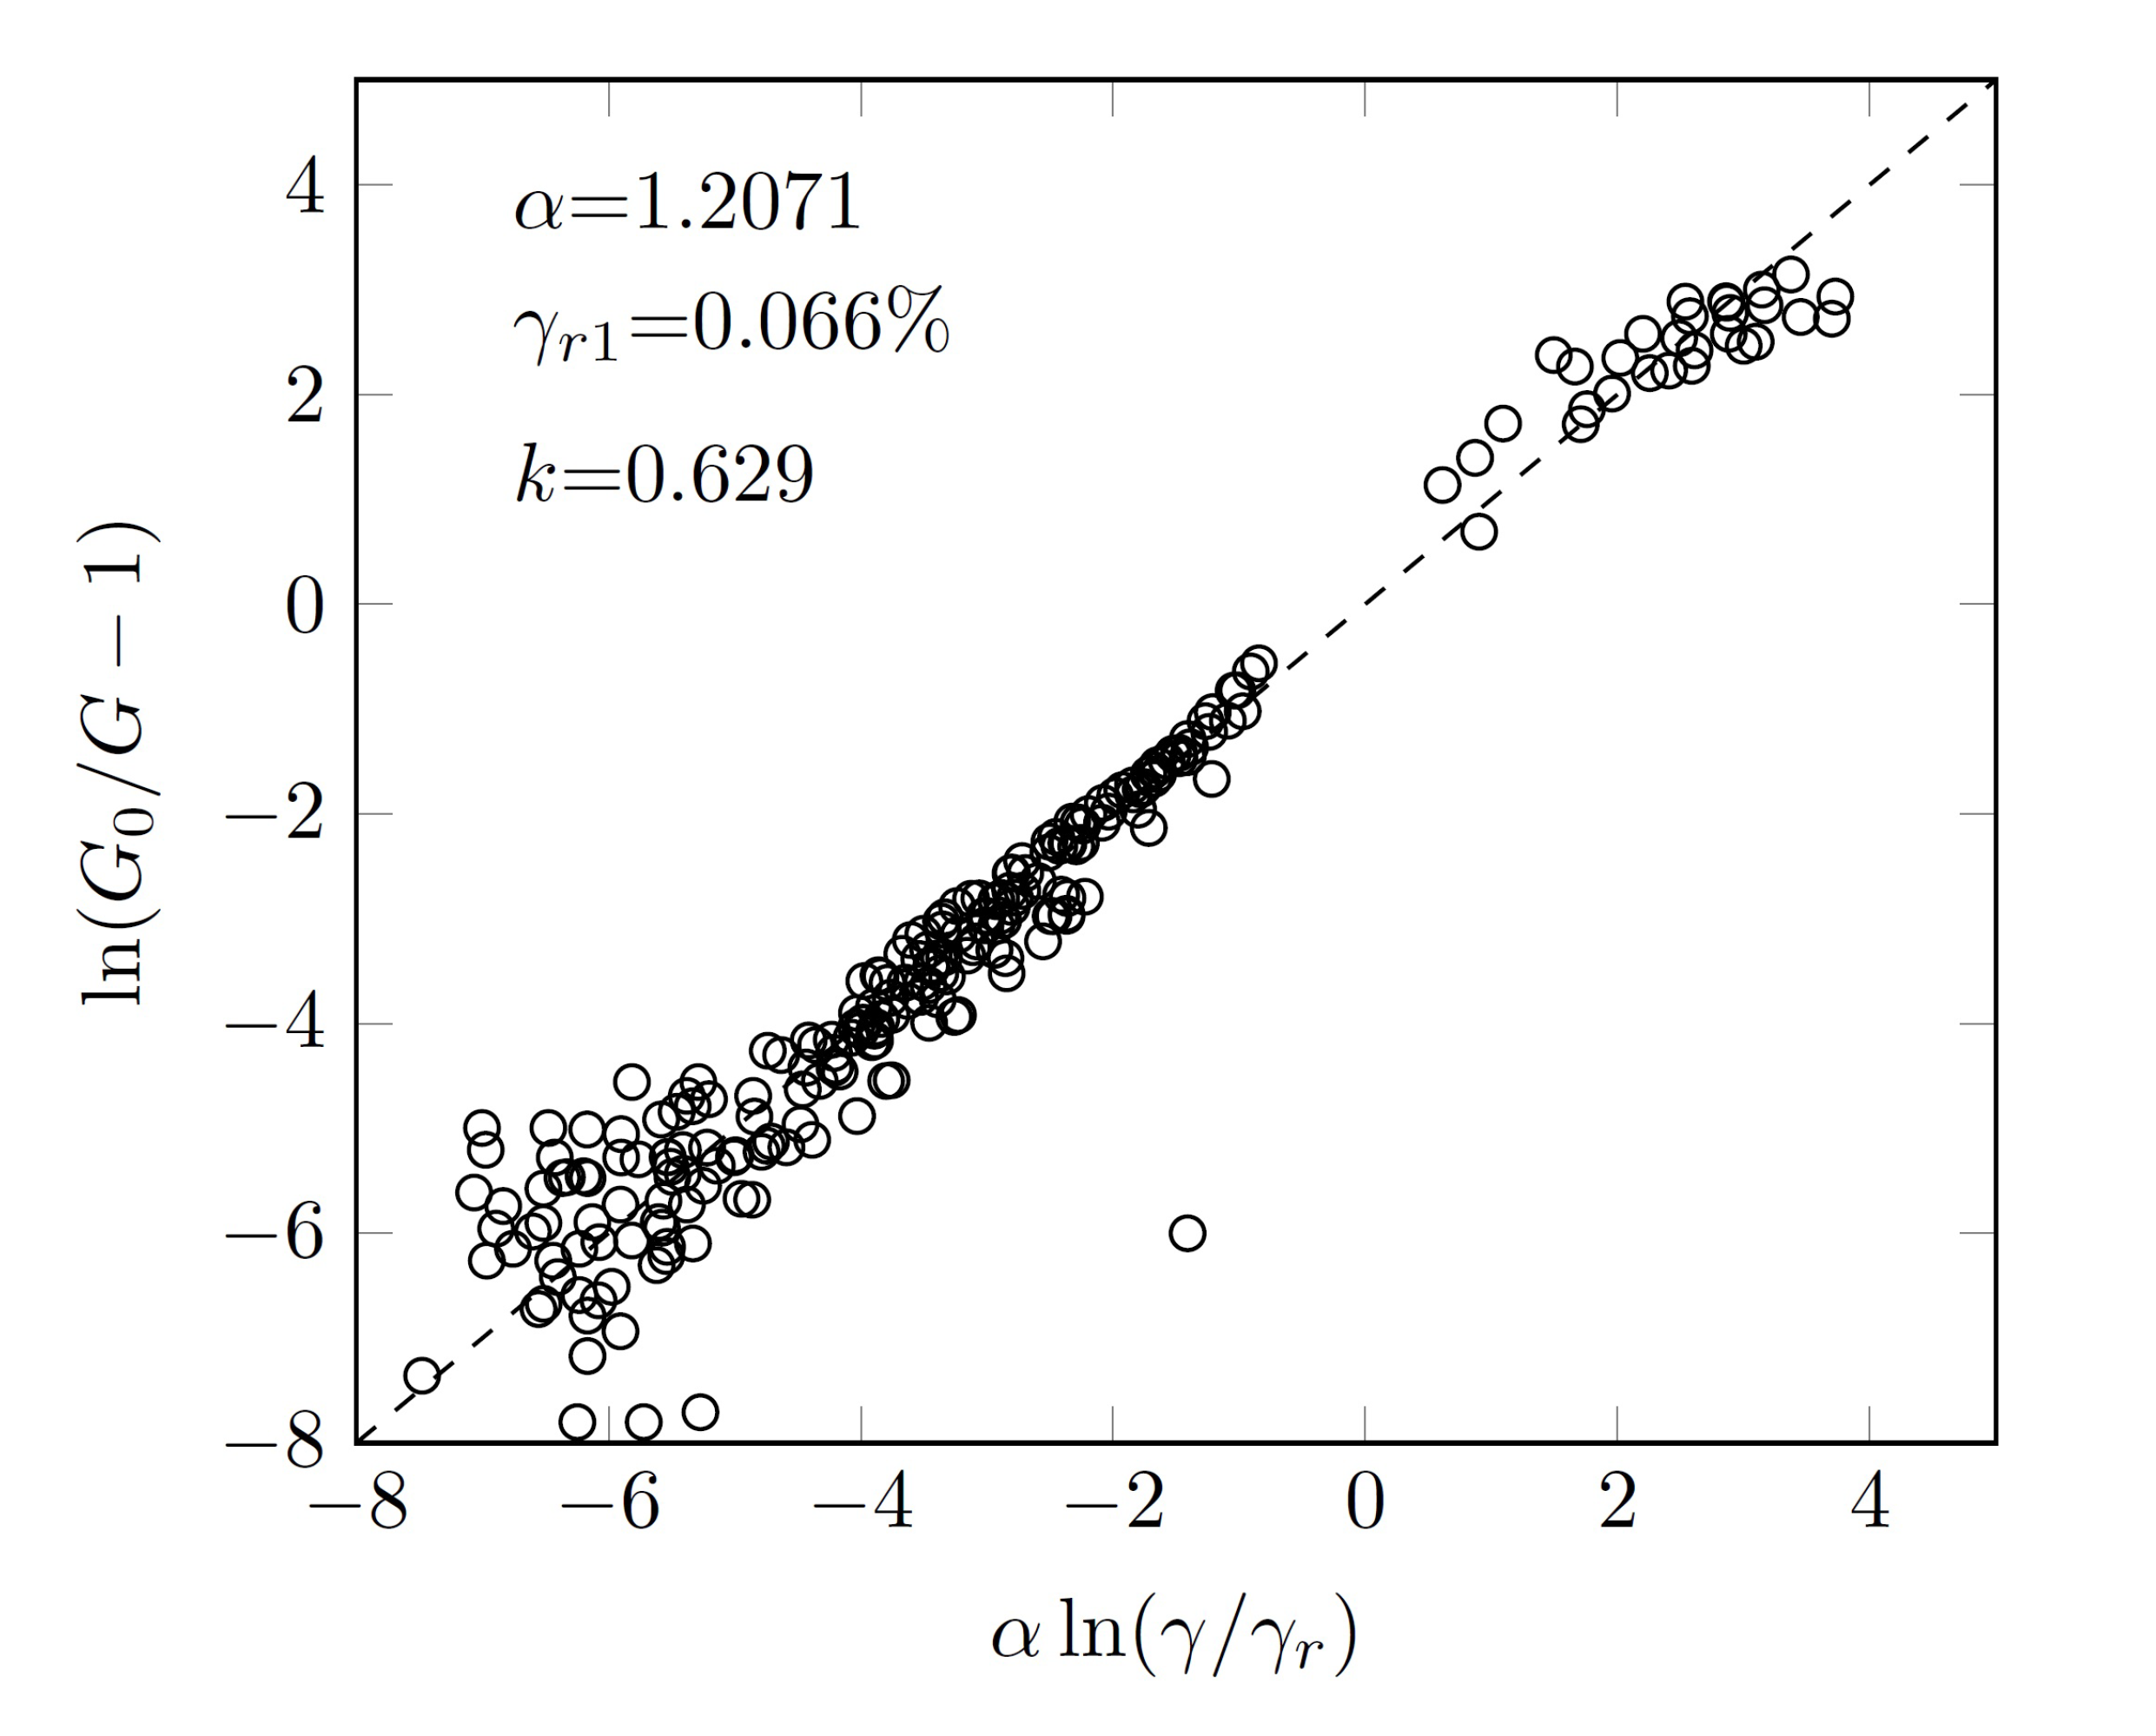
As only one type of soil is concerned in the present study, it is not relevant to express the calibration parameters as a function of the parameter . Moreover, considering that the is affected by a high level of uncertainty, the calibration parameters were estimated as functions of the mean effective pressure and void ratio e. Zhang et al. [44] proposed the following form equation:
where is the reference shear strain at the atmospheric pressure and k is an exponent which expresses the slope of the relation between and on a logarithmic scale. No significant correlation could be found between e and or . Therefore, these parameters were considered as constant. By introducing Equation (5) into Equation (4), it is possible to express as a function of , and the parameters and . The hyperbolic model was fitted to the dataset using a multilinear logarithmic regression (Figure 14). The quality of the statistic regression is good () and is comparable to those obtained by other authors [32,44]. Moreover, it is interesting to note that the value of obtained is of the same order of the gradation of Zhang et al. [44] for a residual/saprolite soil with PI between 15 and 30 ( = 0.53 and 0.67 %, respectively). The values of k and are significantly higher, which suggests a greater dependency of the parameter on the mean effective pressure and greater fragility of the material with regard to the amplitude of the cyclic shear strain.
The particular soil behavior for seems characteristic of structural and cementation effects commonly observed in undisturbed soil samples [53]. In the present case, the soils were remolded and tested immediately after their compaction and saturation. The soil structure at the sample scale was destroyed and the aggregates did not have time to cement together. It was, therefore, thought that the particular behavior of the soil resulted from structural and cementation effects at the aggregate scale. For small shear strain amplitudes, the soil exhibited a high rigidity due to the internal structural resistance of the aggregates. Once a threshold shear strain was reached, crushing of the aggregates led to a sudden loss of stiffness. It is expected that this mechanism has a counterpart in terms of the damping ratio and pore pressure generation.
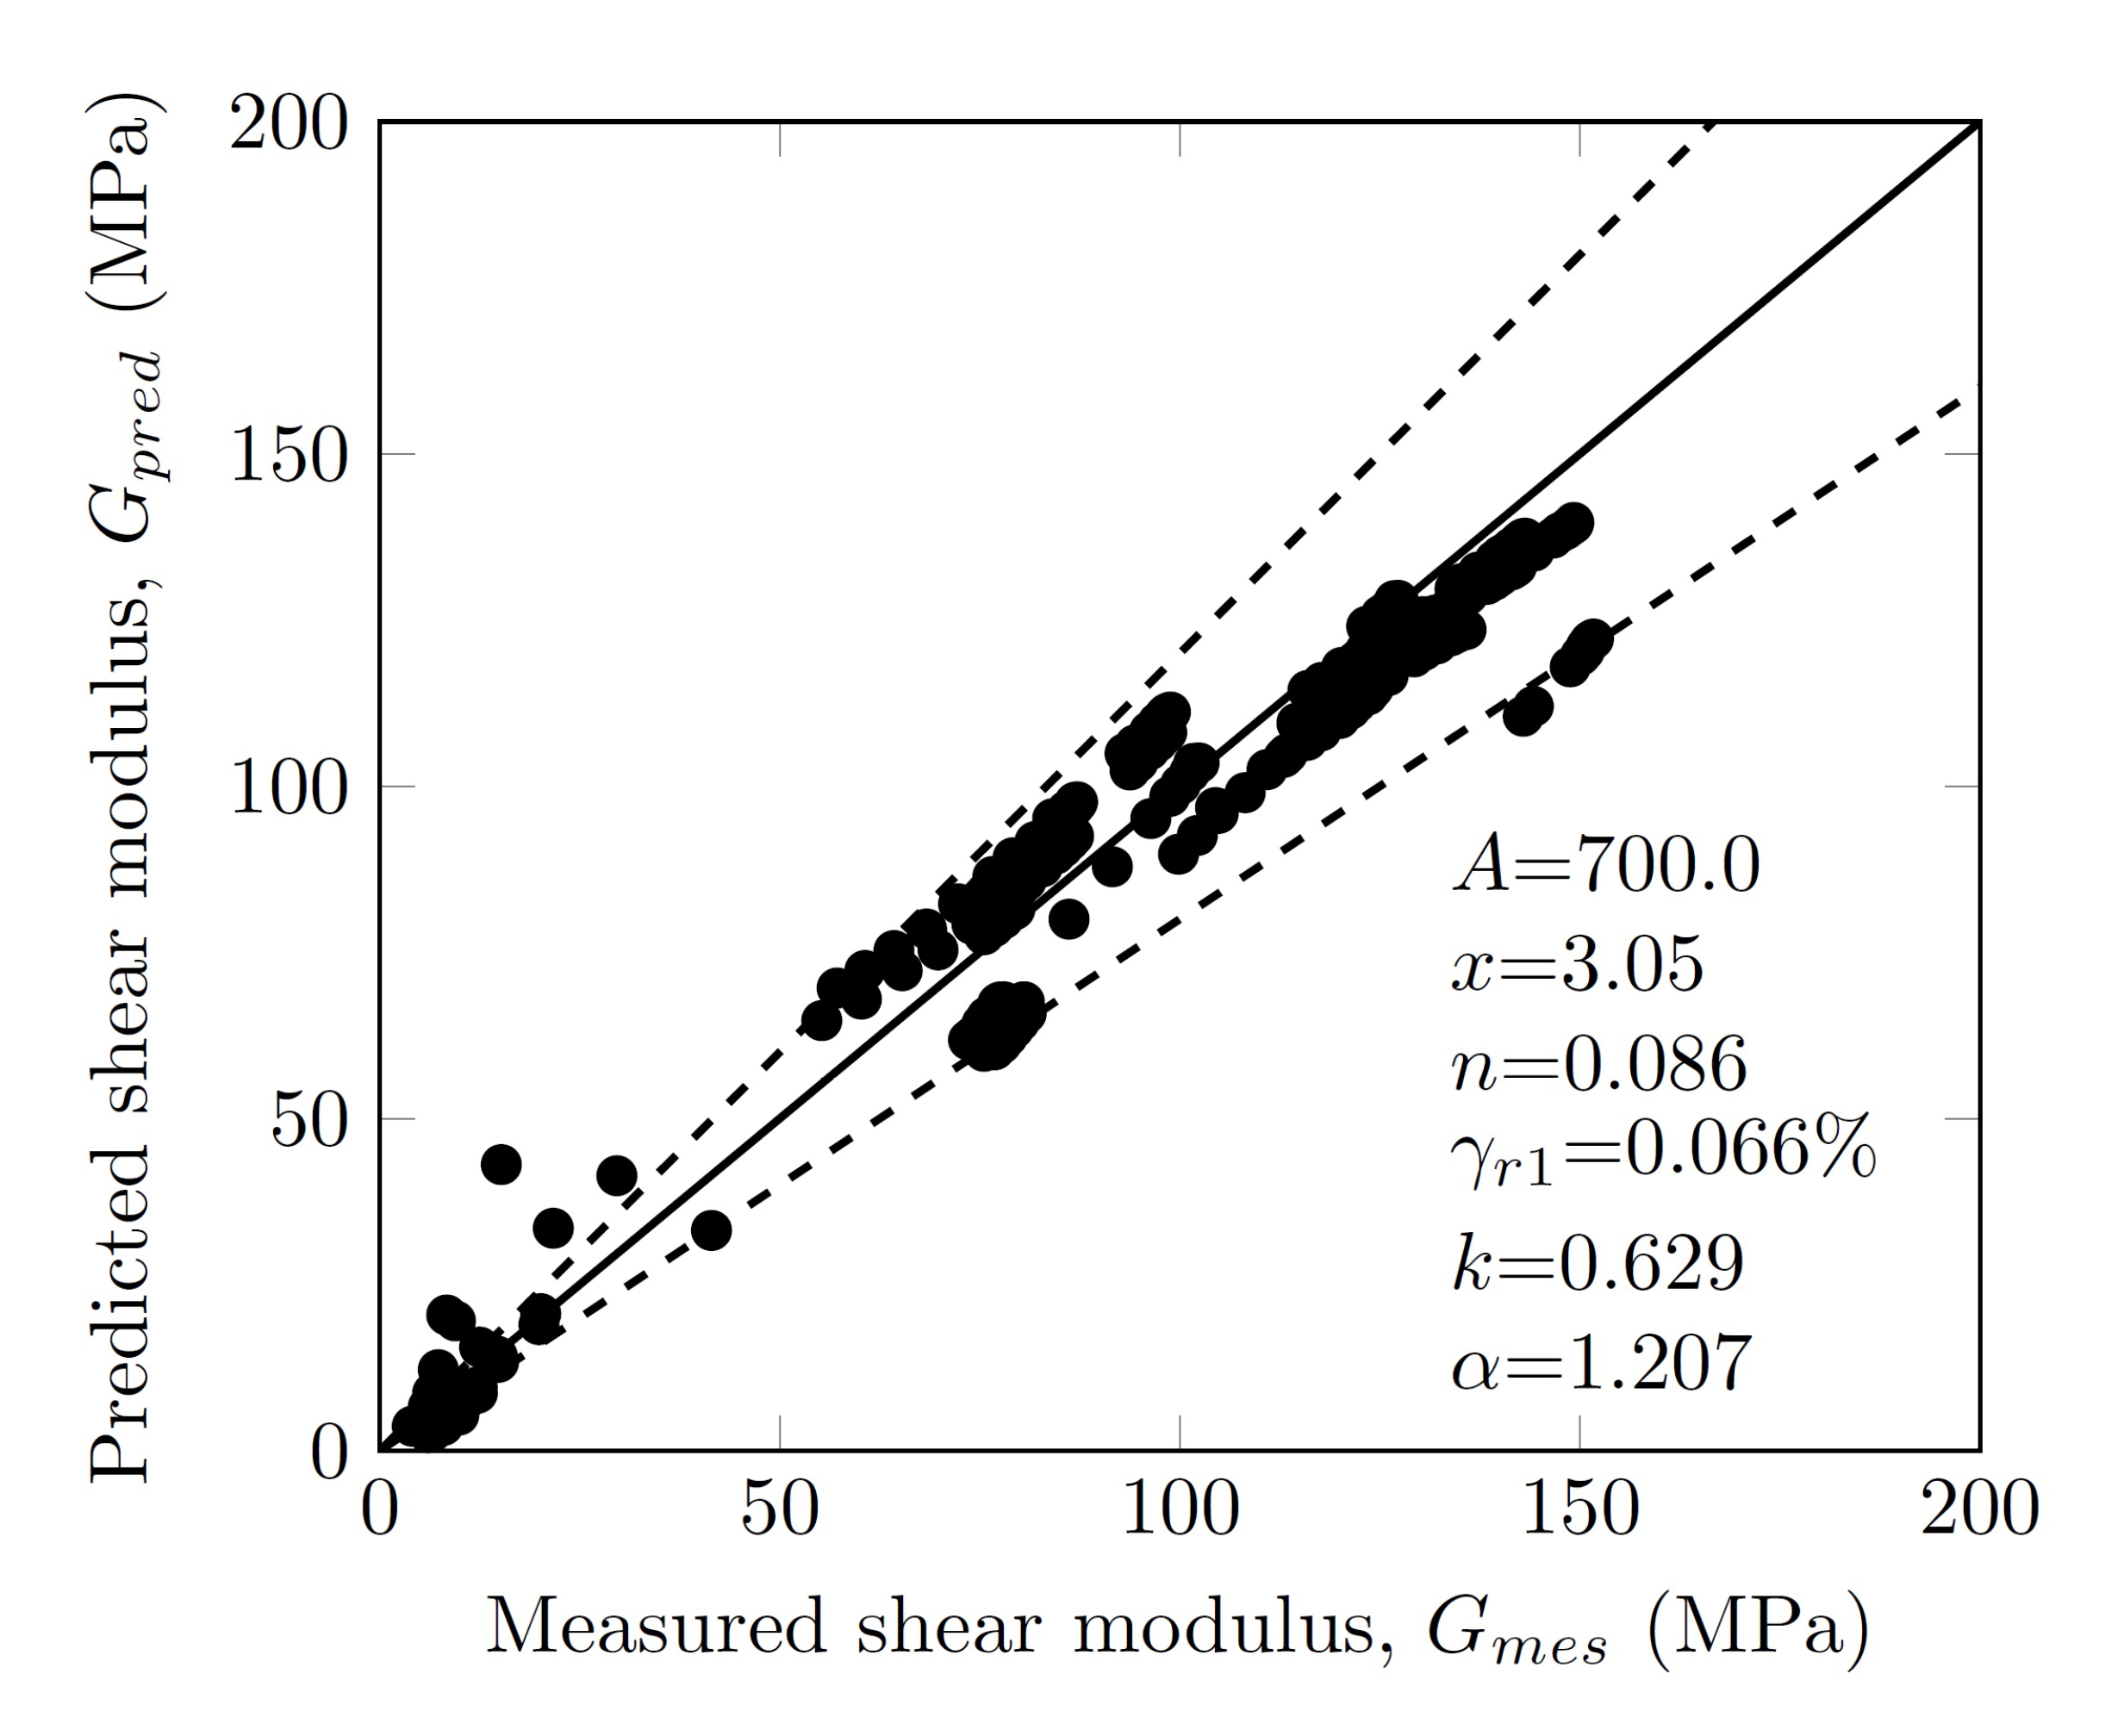
As can be seen in Figure 15, the deviations between the measured and the predicted values of G remain within a reasonable range. The standard deviation of the prediction error is equal to 9.65 MPa. The vast majority of points remain in the uncertainty interval. Most of the uncertainty on G comes from the predictive model of . The points corresponding to the largest relative errors correspond to the small values of G (large shear strains). In absolute value, however, the errors do not exceed 10 MPa.
3.7. Damping Ratio
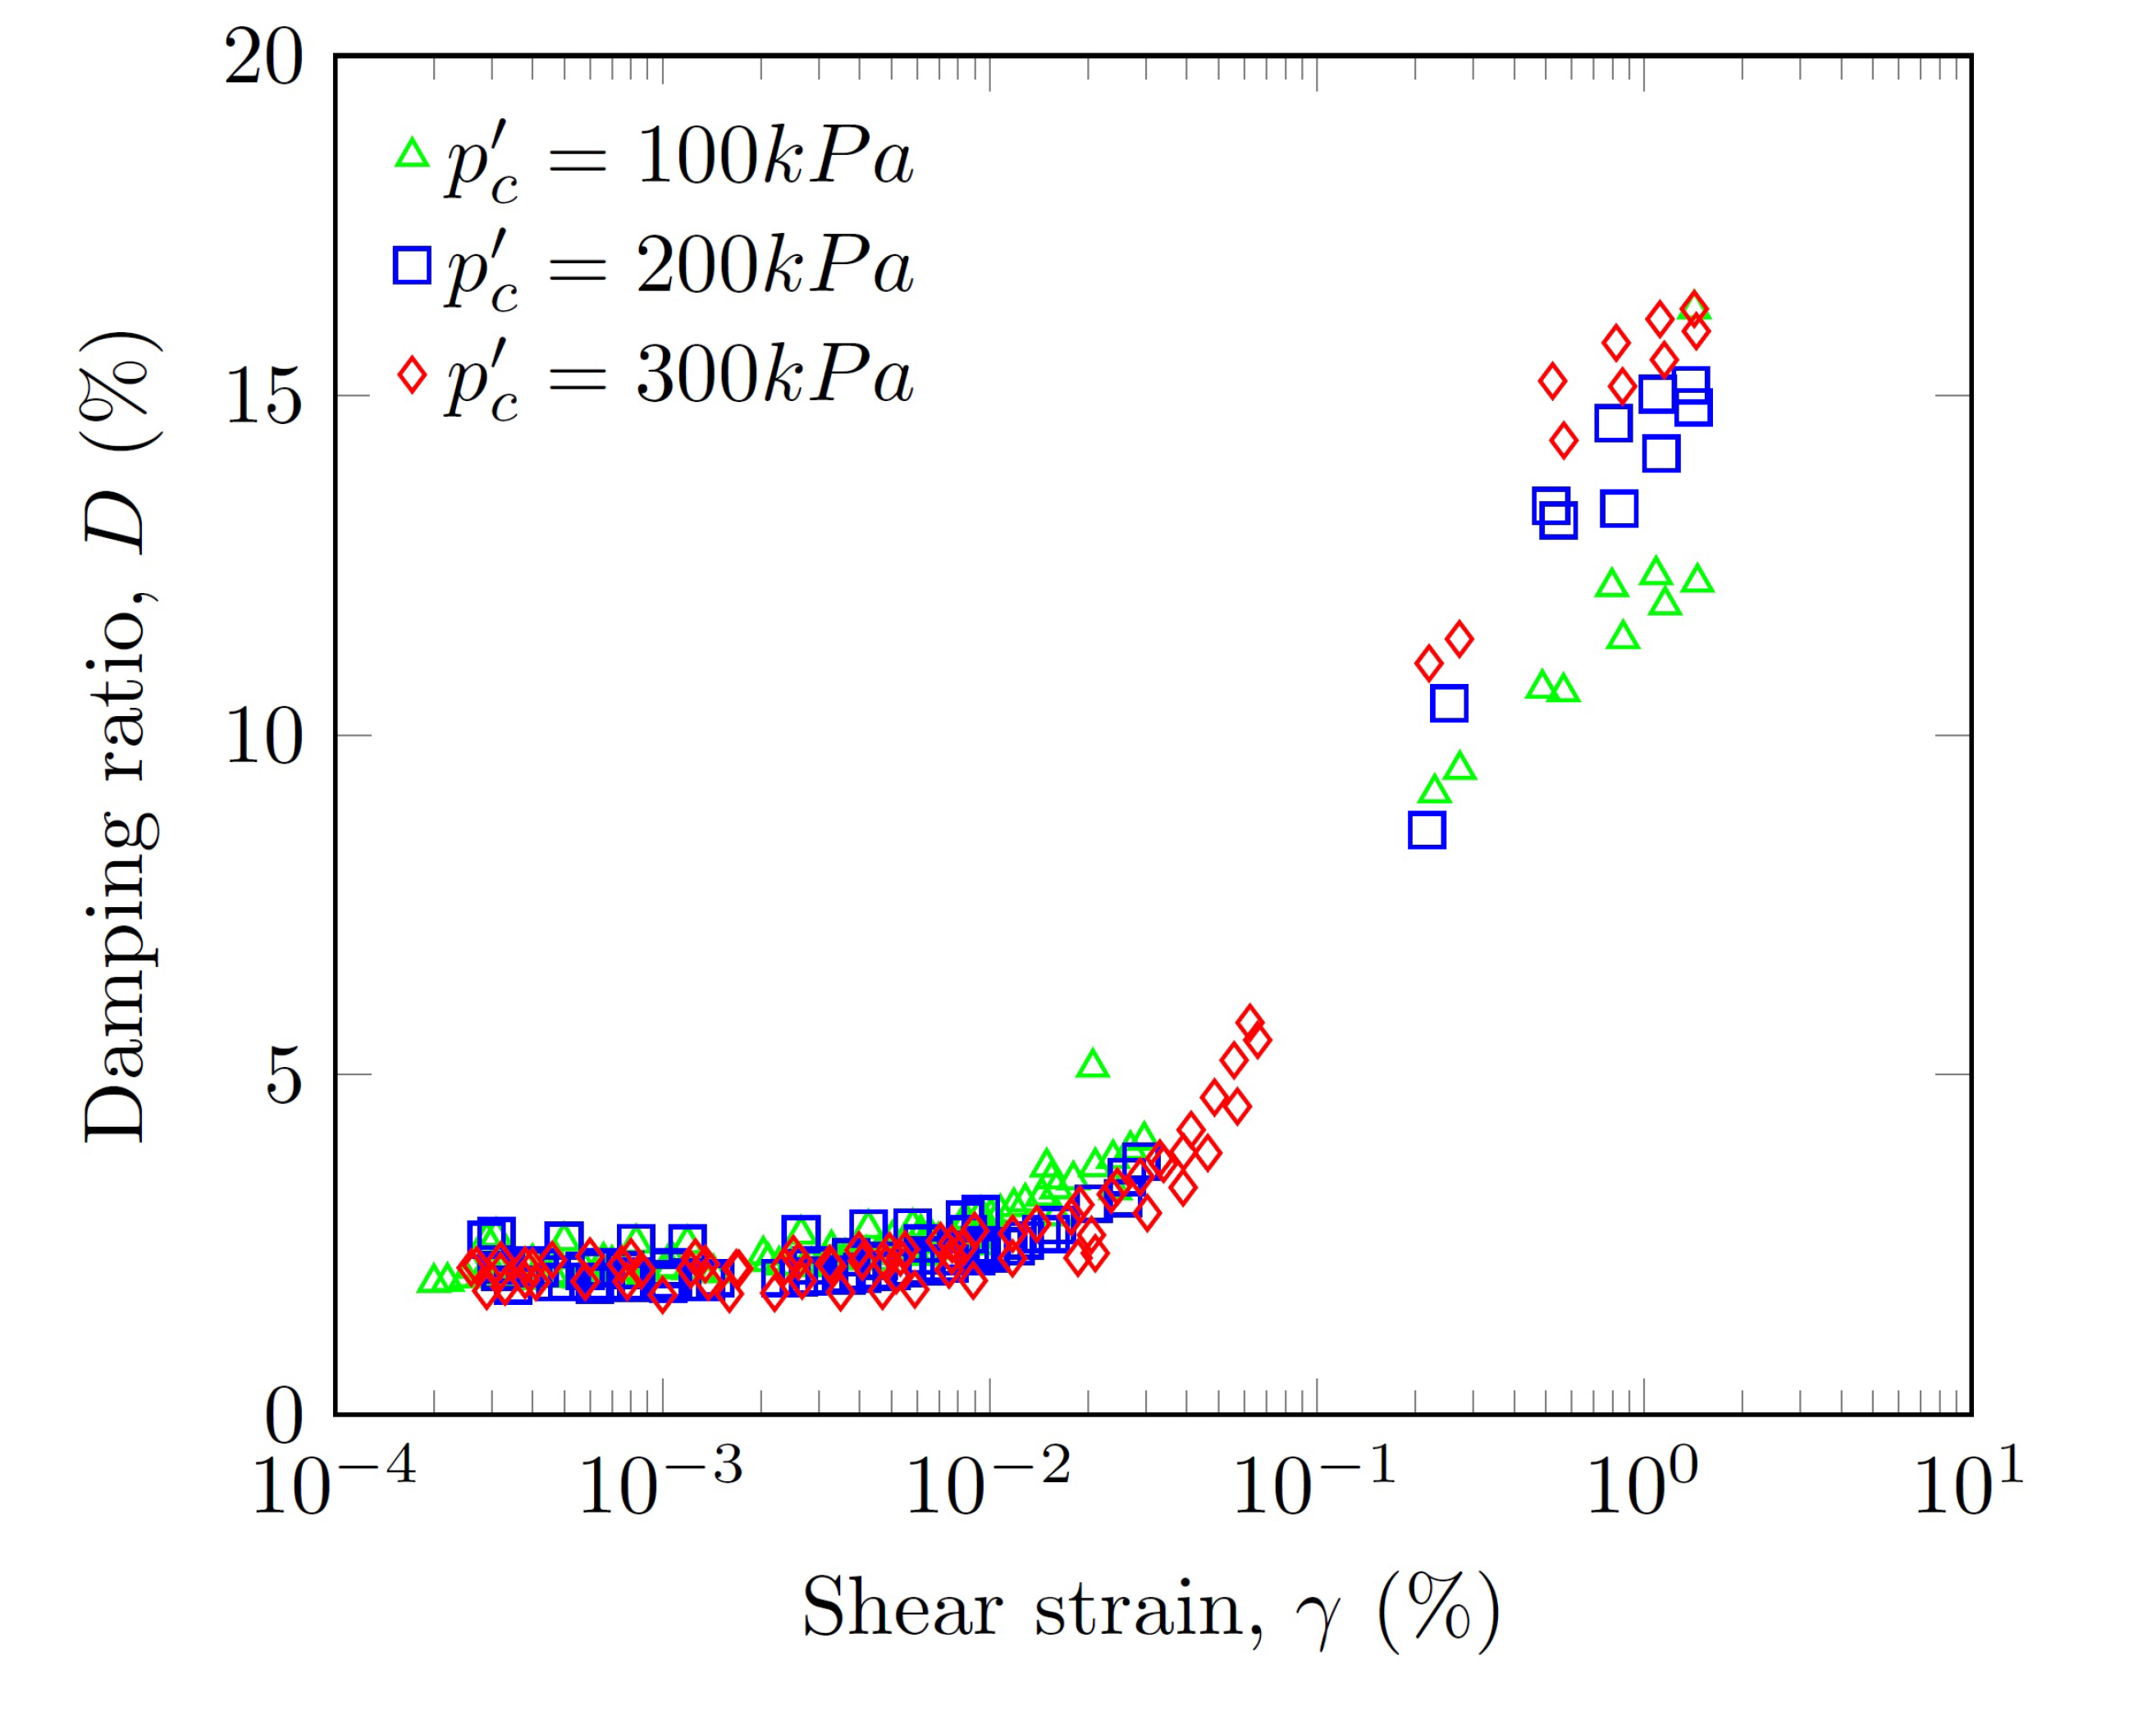
Figure 16 presents the set of experimental points constituting the D vs. curves. For all of the tests, the initial damping ratio is between 2 and 3%. For 0.1 %, the damping ratio increases progressively without showing any influence of the mean effective stress. Beyond 0.1%, the damping ratio highly increases and then stabilizes around = 1%. The influence of the mean confinement stress is clearly observed on the interval = 0.1−1.0%.
For 0.1%, the damping ratio slightly decreases as the confinement pressure increases. This tendency is generally observed and well documented [35]. For 0.1%, the damping ratio increases as the confinement pressure increases.
Early works established an expression for material damping and led to empirical expressions involving the shear strain amplitude, the mean effective stress, and the void ratio [81,82]. These equations were difficult to calibrate due to the high degree of uncertainty in the experimental measurement of the material damping. Other authors modeled hysteretic damping, assuming a Masing behavior and adjusted a function to fit the Masing damping to the experimental data [28,38,39]. The shape of the hysteresis loops led us to consider that the Masing model was not valid. A simple and robust approach consisted of determining the curve D vs. from the relationship between D and . Hardin and Drnevich [23] proposed a linear equation, but other authors proposed second-order polynomial [22,41,44,83], power [53], or exponential [84] expressions.
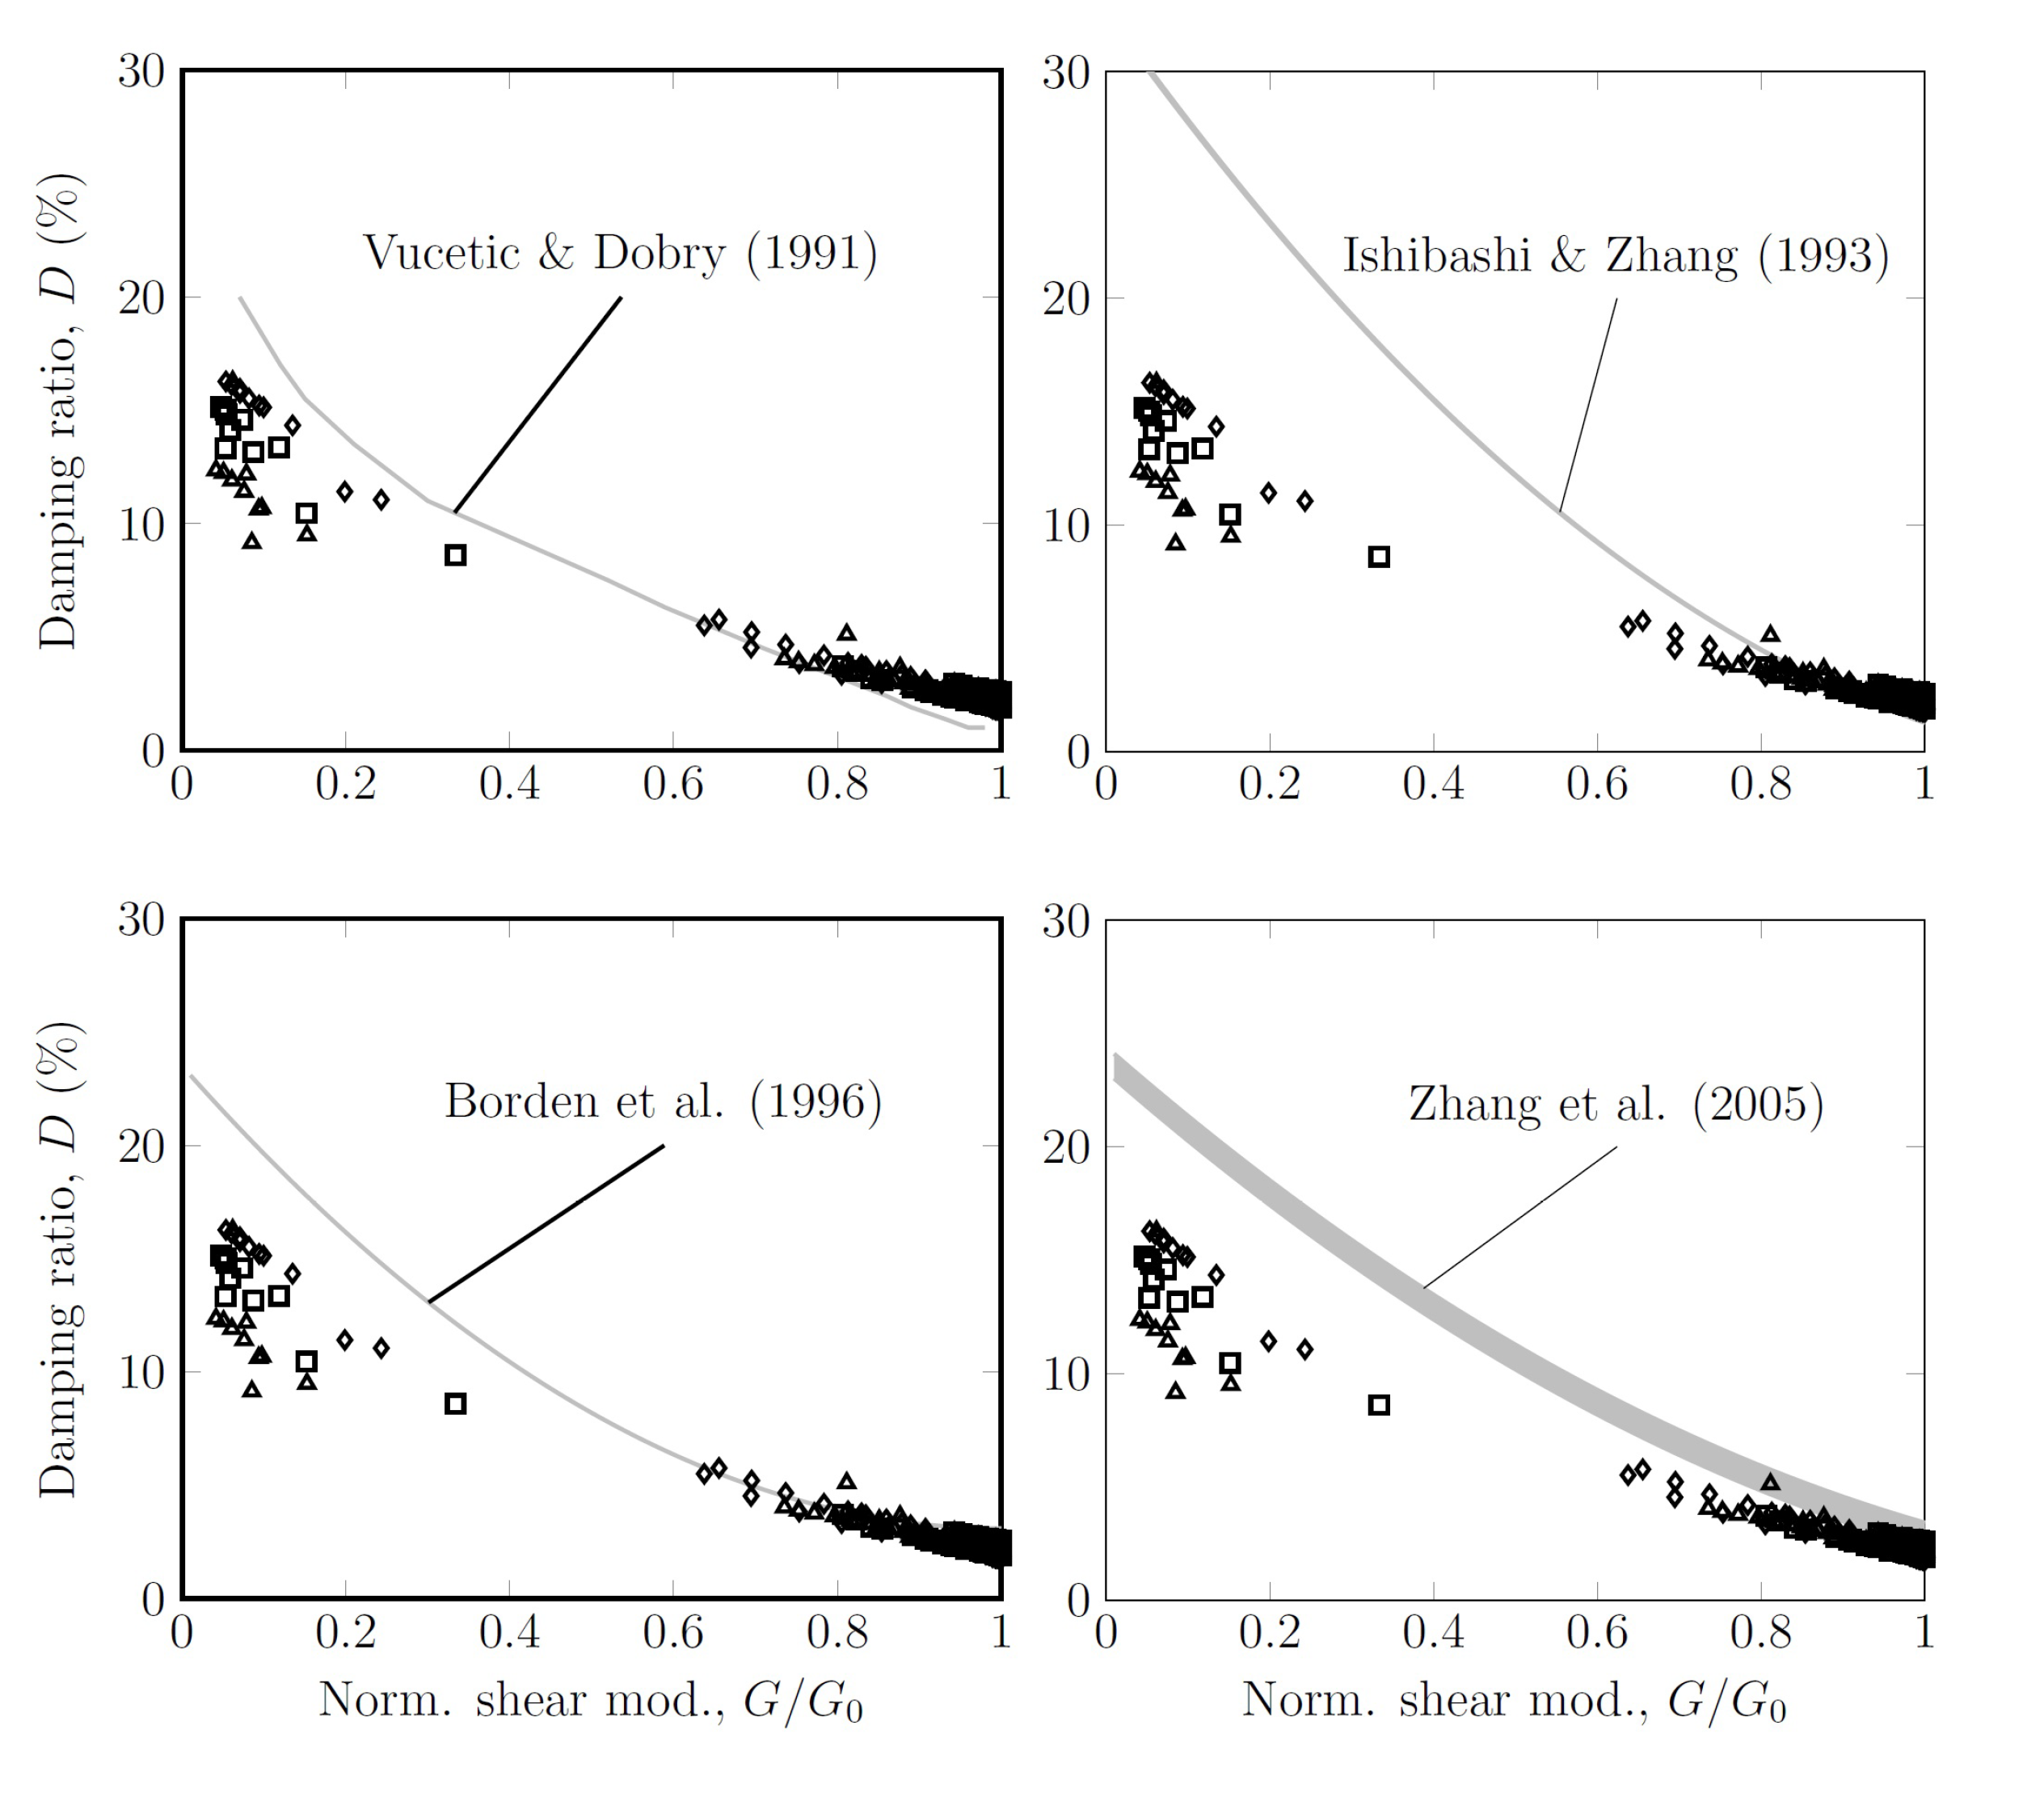
A comparison between the experimental results and existing predictive models for D was carried out (Figure 17). It can be seen that the existing models expressing D as a function of tend to overestimate the damping ratio, especially for the small values (high D values). For large D values, the predictions are quite accurate for all of the models. All of the models predict higher maximum damping ratios by 20%, whereas experimental tests give values lower than 15%. Regarding the damping ratio, the specificity of the residual soils studied lies in its dynamic behavior for the large deformation domain. Therefore, as with the normalized shear modulus curve, a specific damping ratio curve should be developed.
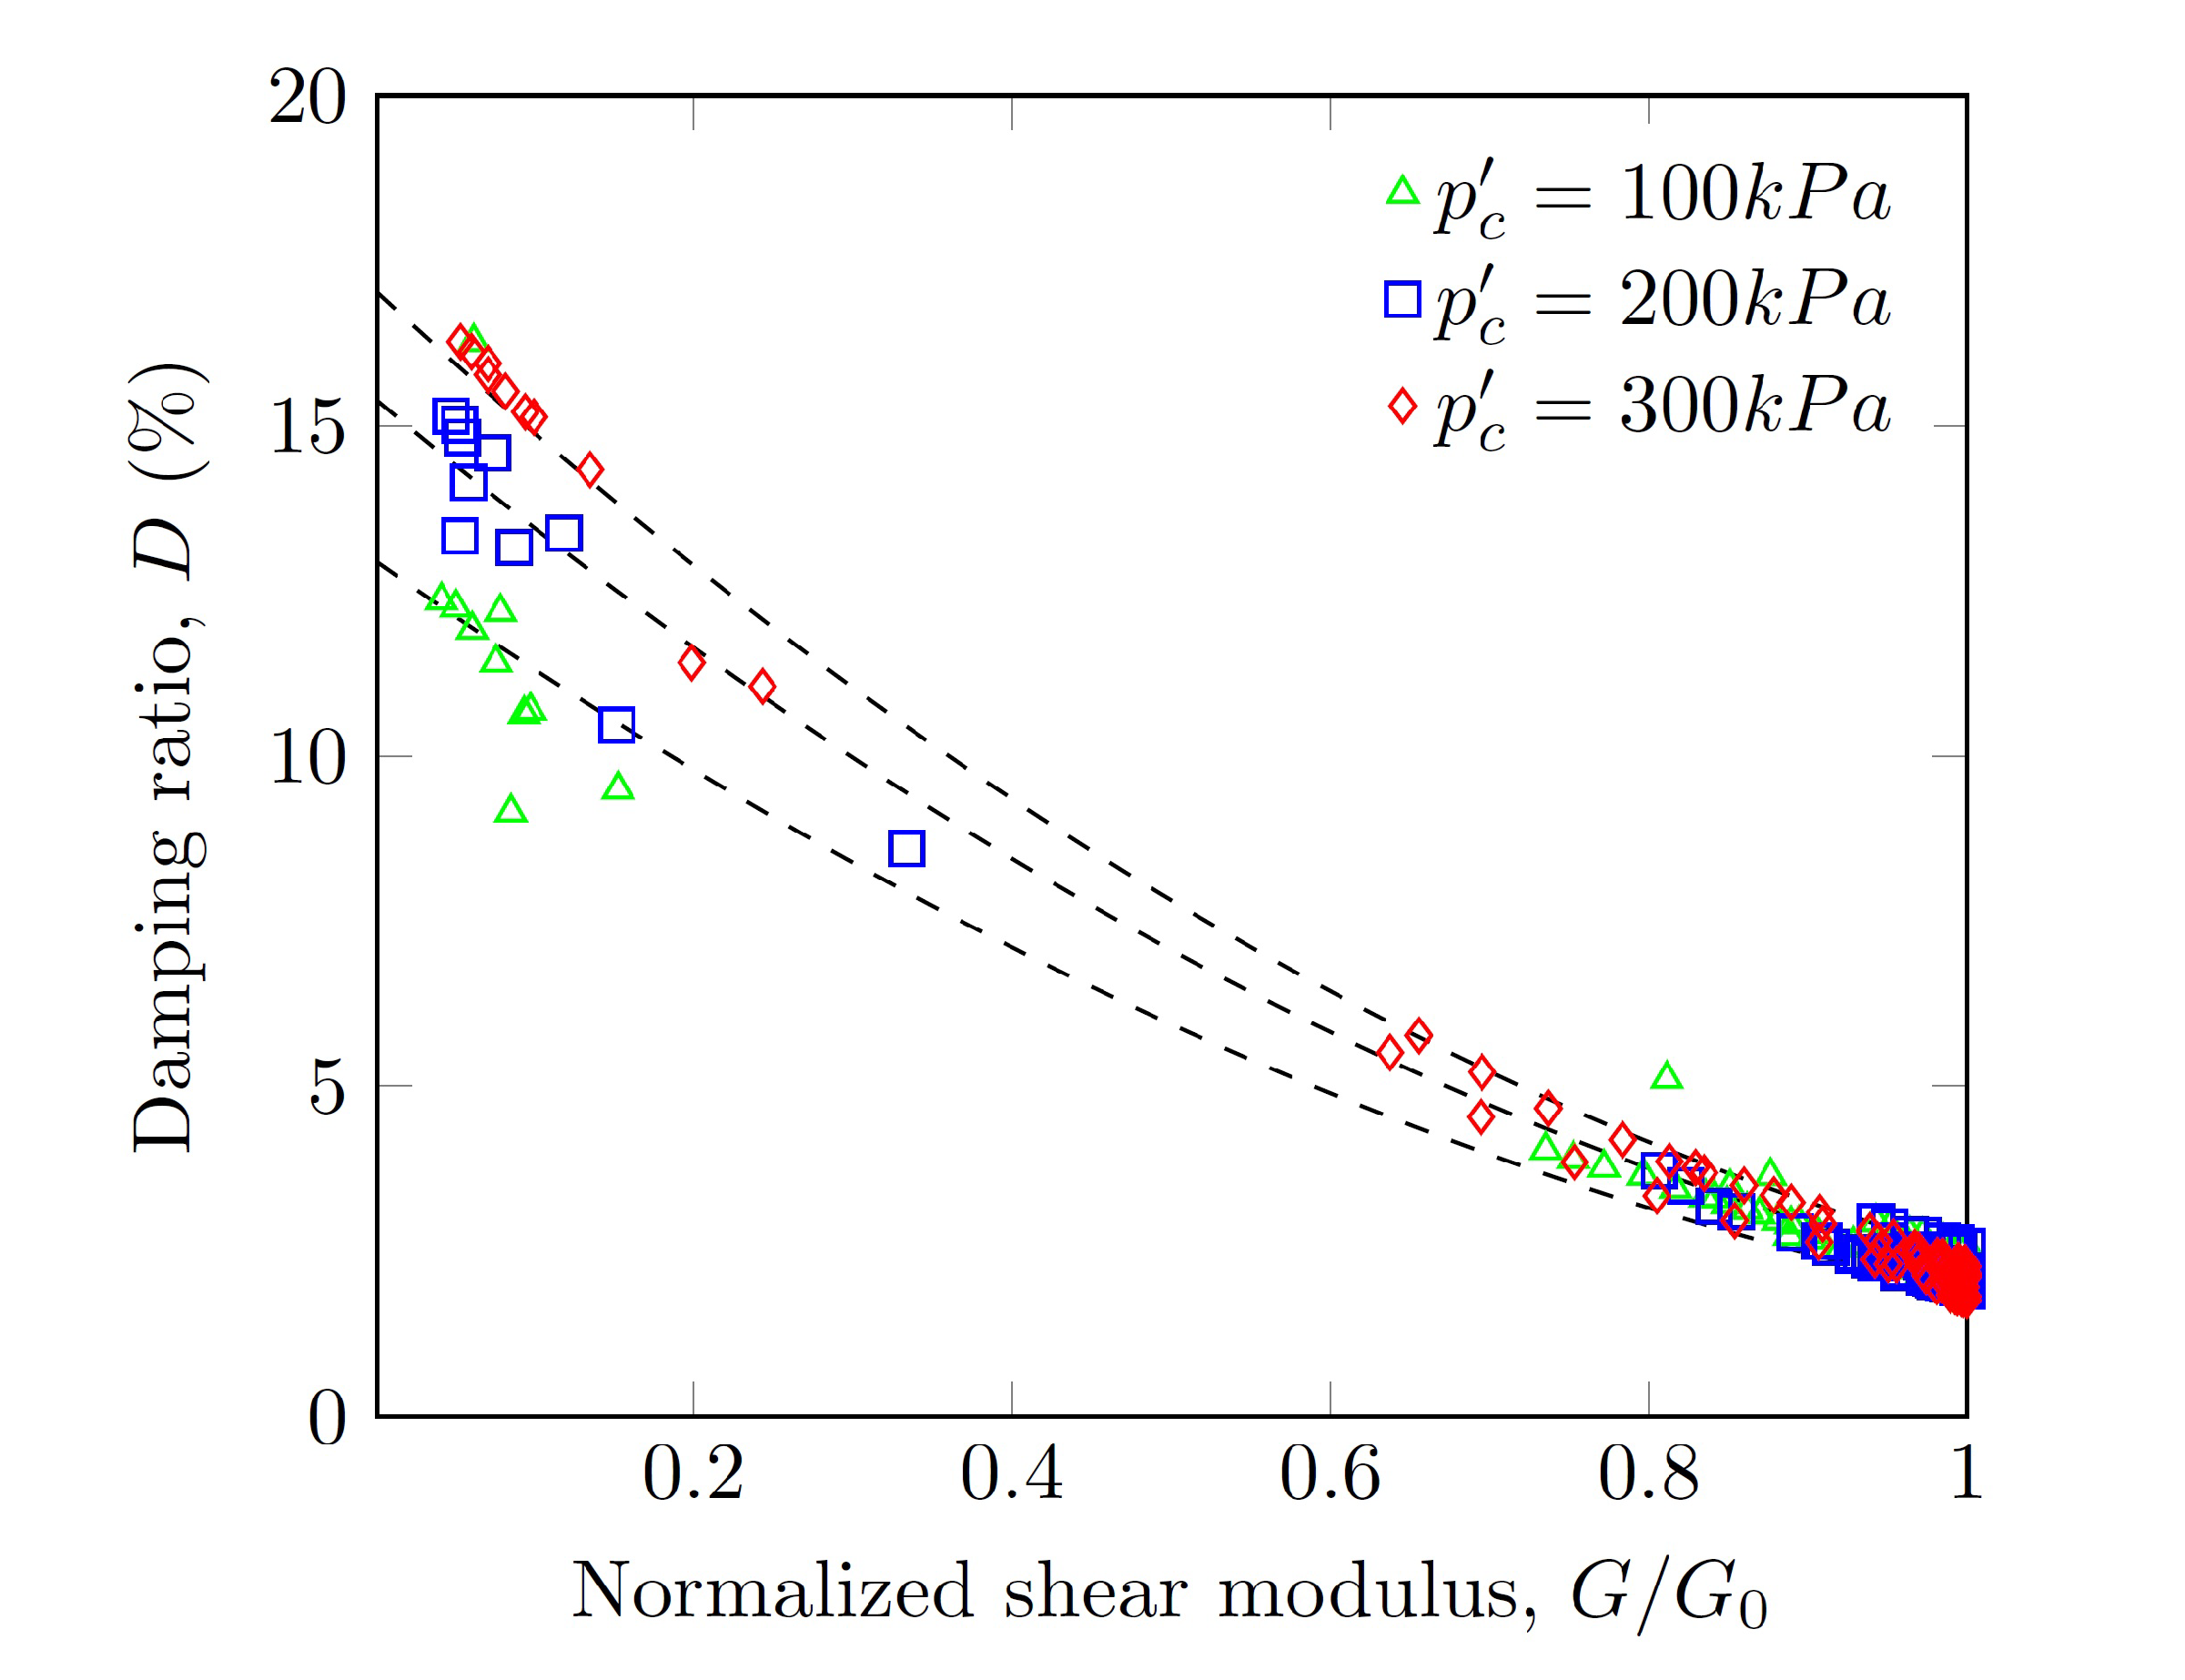
Different fitting functions were tested. For simplicity and in order to minimize the number of model parameters, the second order polynomial form was chosen. For , the damping ratio was close to 2.5% but depended to a small extent on the confining pressure. This result is in agreement with Macari and Hoyos [48], who found in the range of 2–4% for remolded samples. For small values of , the experimental data showed a clear dependence between the curve and the mean effective stress (Figure 18). A power law equation for the confining pressure dependency and the fitting model giving the material damping as a function of can be approximated with reasonable accuracy () with the following equation:
Besides its simplicity, the advantage of this equation lies in the explicit consideration of the confining pressure.
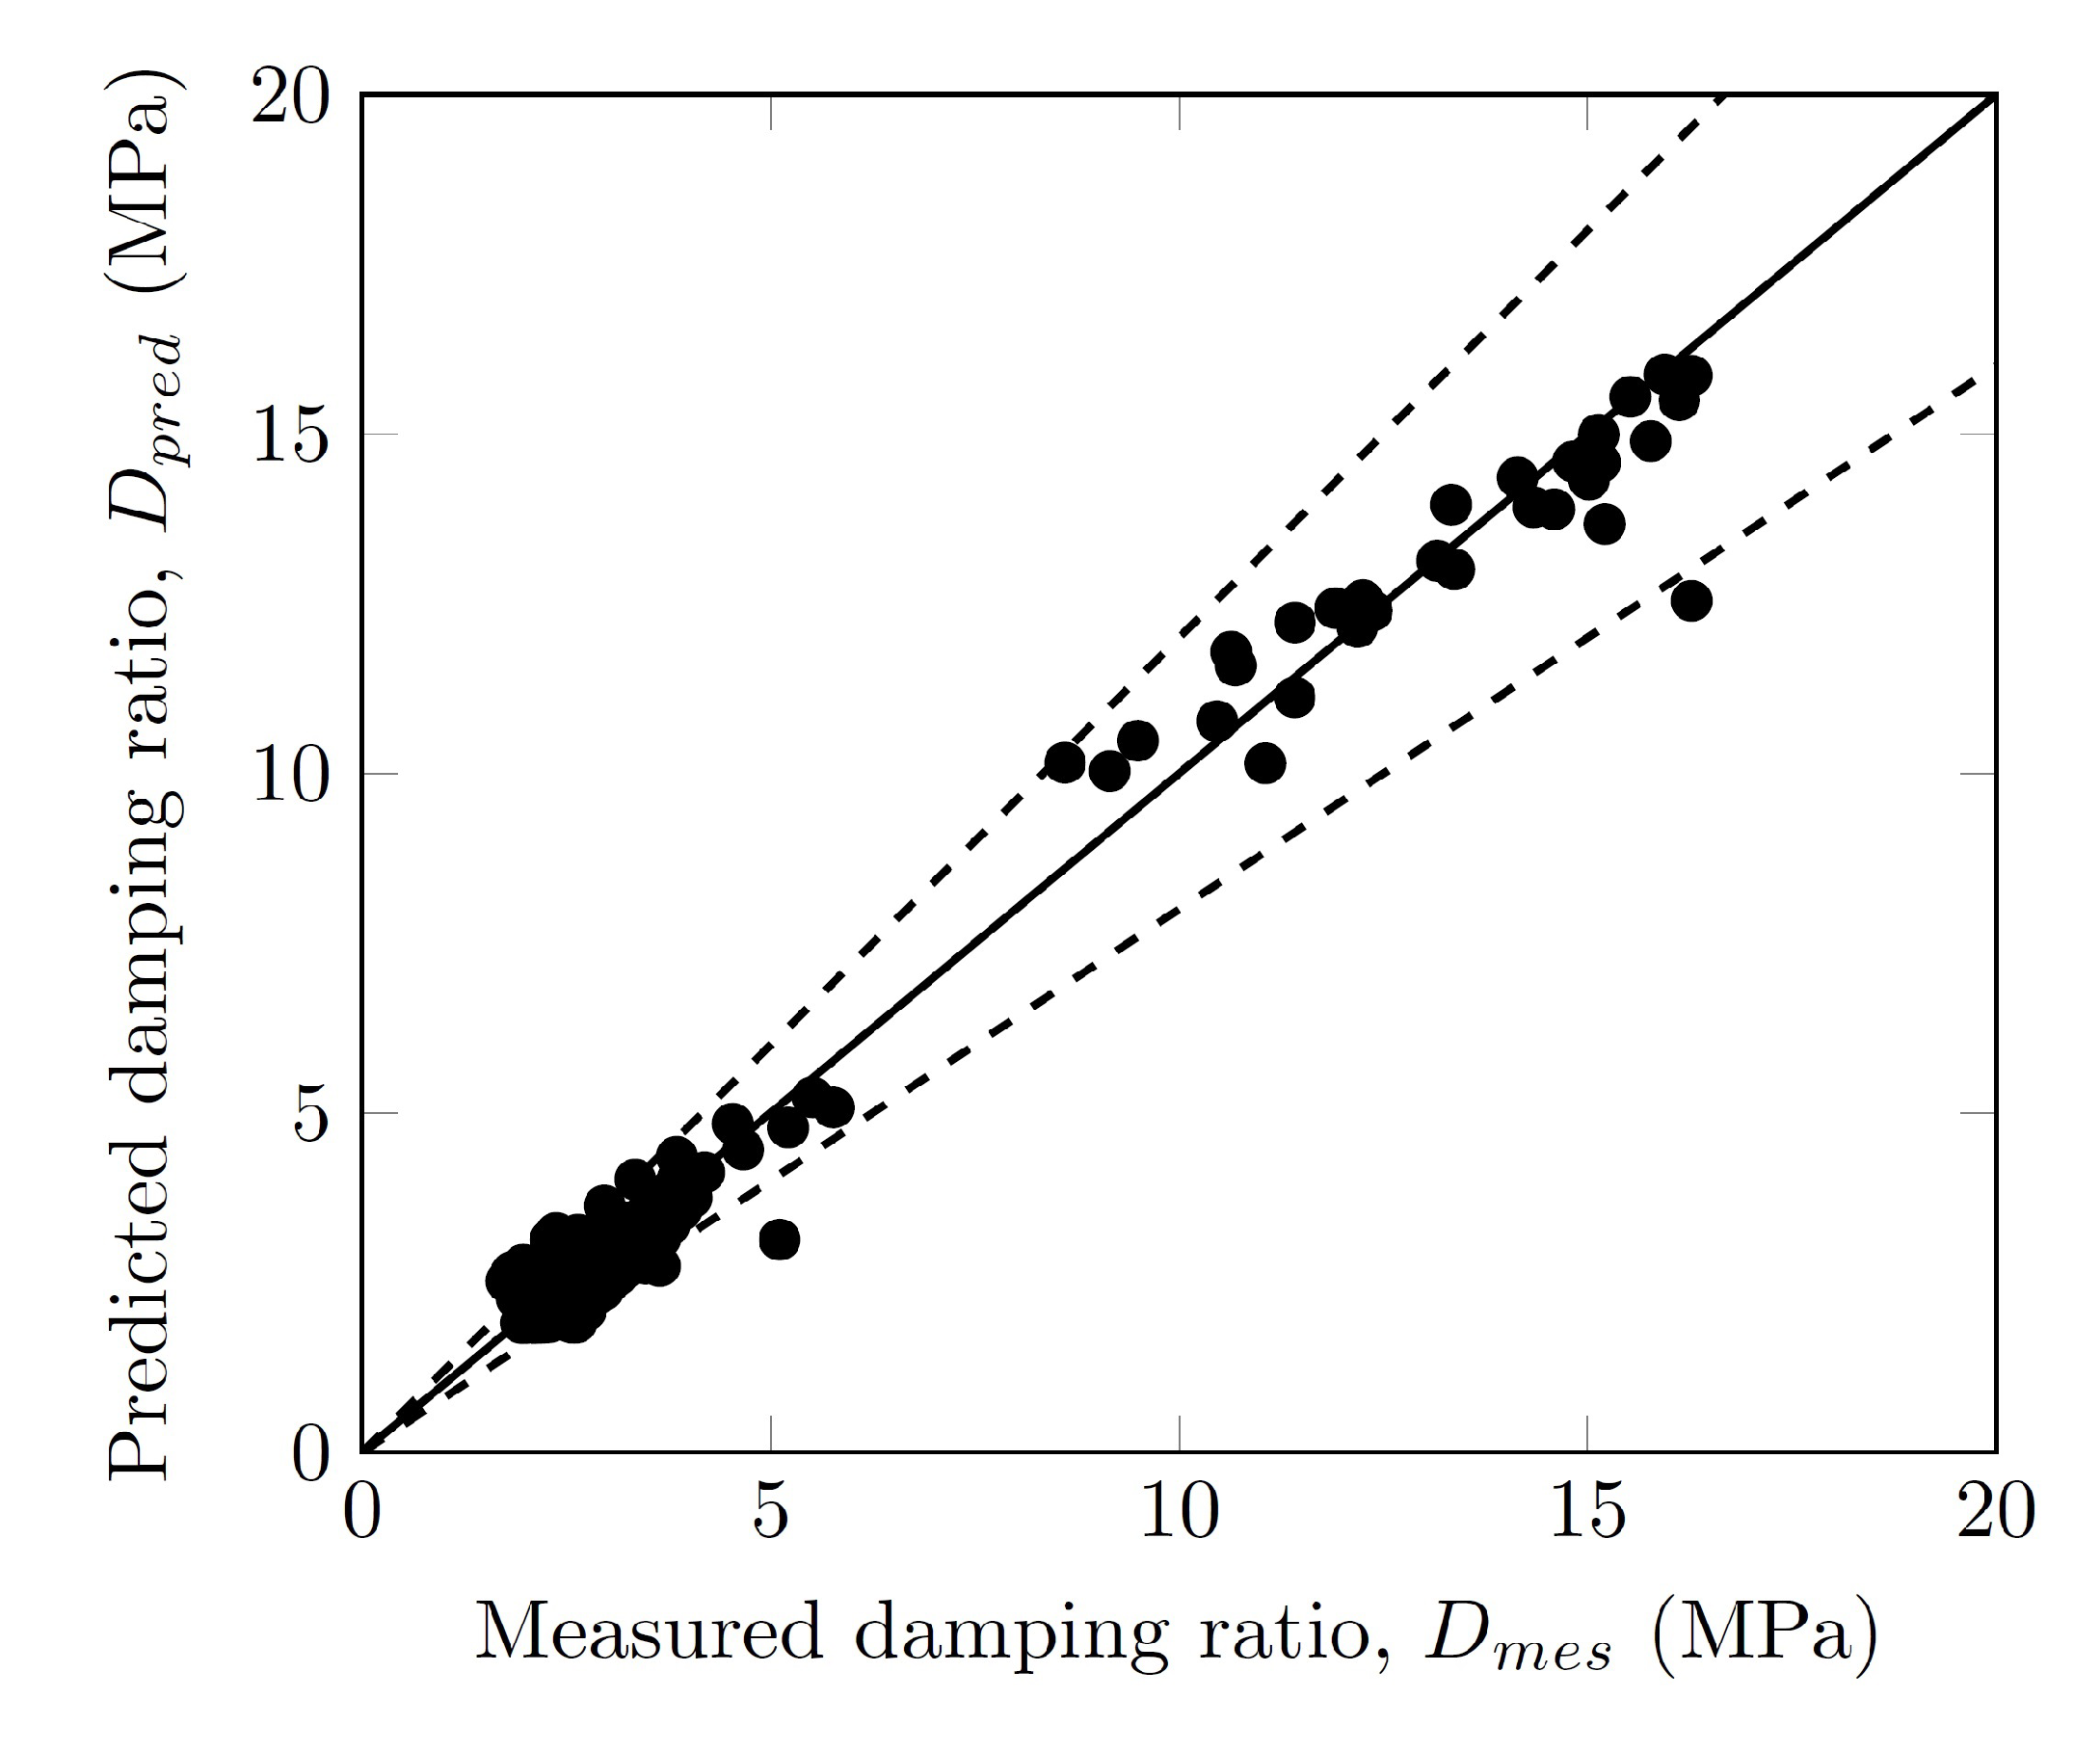
As can be seen in Figure 19, the deviations between the measured and the predicted values of D remain within a reasonable range. The standard deviation of the prediction error is equal to 0.8%. The vast majority of points remain in the uncertainty interval. Regarding the prediction of D, the error on the damping ratio does not exceed 3%. The greatest uncertainties are noted for the large damping ratios (large shear strains).
3.8. Pore Water Pressure Ratio
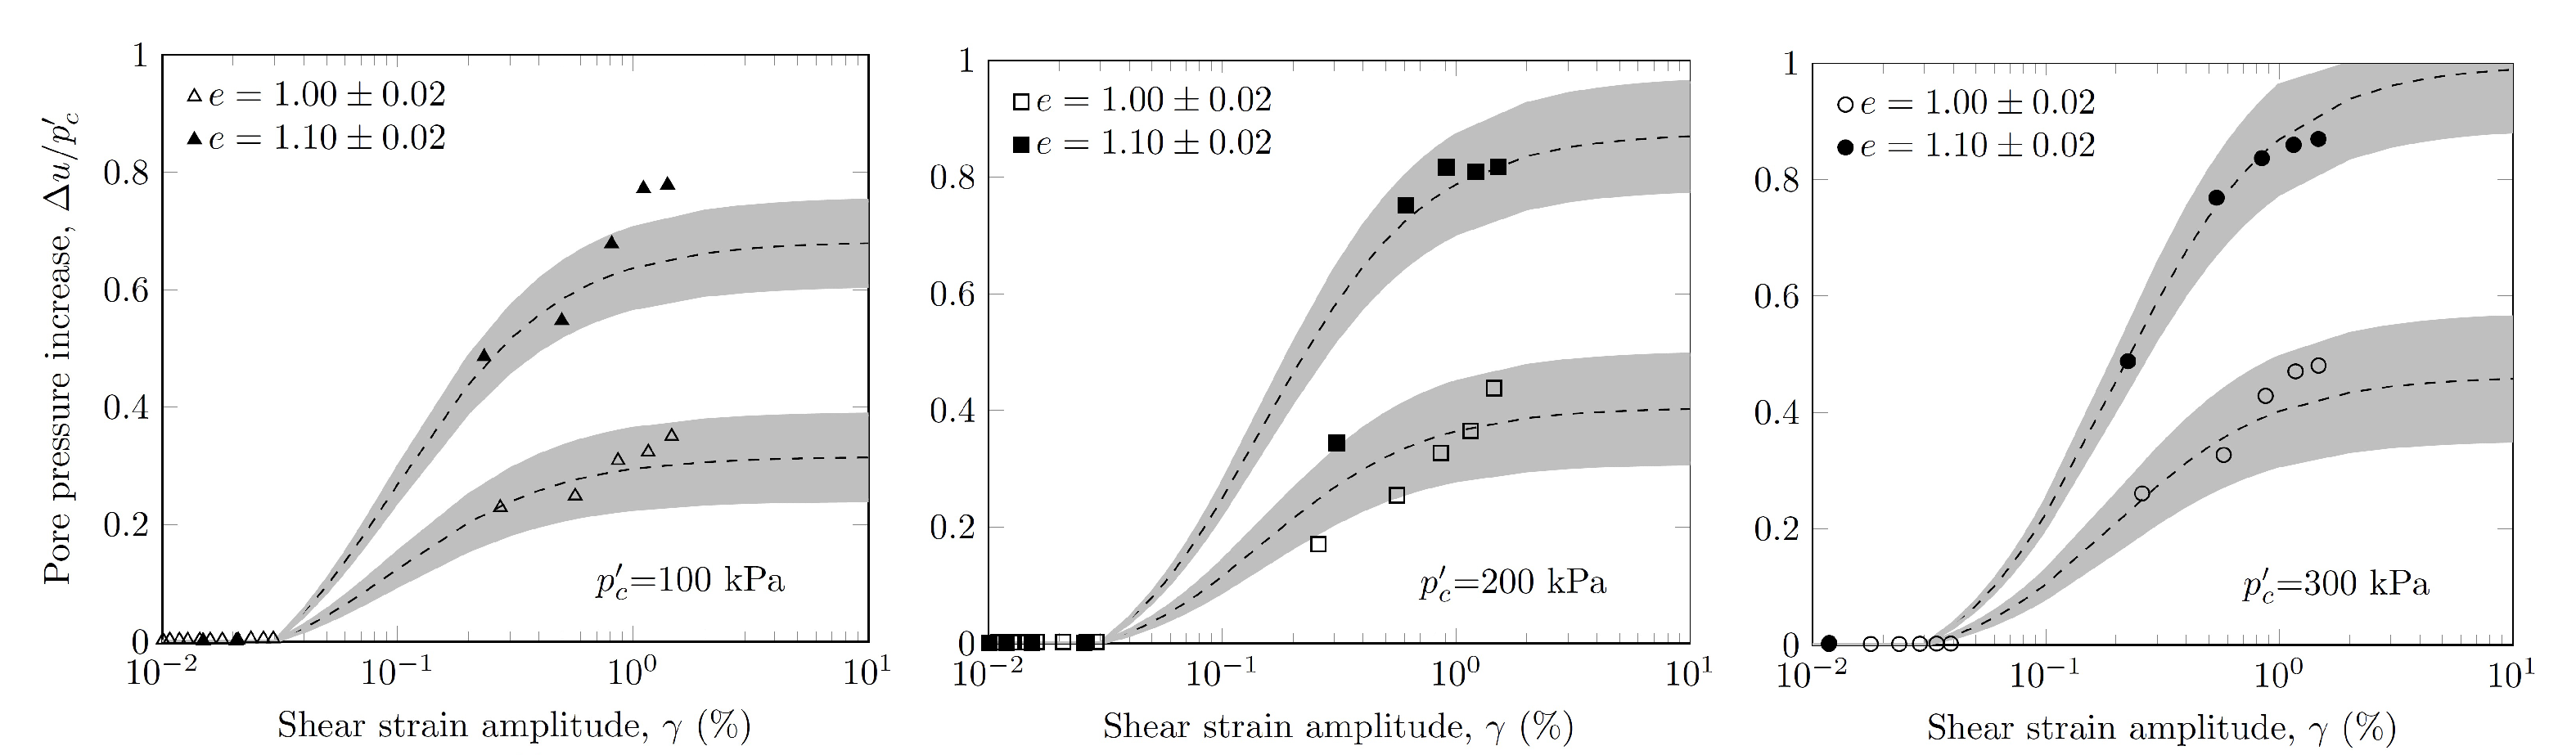
As expected, the decrease in the normalized shear modulus as the cyclic shear strain amplitude increased had direct consequences on the generation of the pore water pressure ratio . This resulted in a concomitant increase in the damping ratio with the increase in the pore water pressure ratio (Figure 20). The influence of the void ratio on the pore water pressure curve was decisive. For the samples with void ratios e = 1.00, the maximum relative pore water pressure generation was of the order of 0.45 (0.40–0.50), whereas it reached 0.80 (0.60–0.85) for the samples with void ratios e = 1.10. By integrating these two observations, it seems reasonable to postulate that: (i) for shear strains greater than a threshold value (), the damping is mainly due to the development of plastic volumetric strains inducing the increase in the pore water pressure; and (ii) the maximum pore water pressure depends on the current void ratio of the material. After testing several expressions, it was found that the pore water pressure ratio can be reasonably approximated by the following equation:
where is a scalar parameter and is the void ratio for which no pore water pressure would be generated under undrained cyclic shearing. is the damping ratio for where corresponds to the shear strain beyond which the pore water pressure starts to increase. In Equation (7), the values of are truncated outside the admissible range of values between 0 and 1. This simple expression captures all of the key parameters , , and e affecting the excess pore-water pressure generation response of the material and used in the existing models [85].
In the present case, the experiments suggest that the threshold shear strain can be taken as equal to 0.03%. This value is in agreement with the results found in the literature for PIs between 12 and 27 [86,87]. The optimal values of the calibration parameters, determined to obtain the best fit, were equal to = 0.403 and = 0.91.
As can be seen in Figure 20, the expression proposed gives a reasonable approximation of the experimental pore-water pressure generation curves. Most of the experimental results lie in the range of values estimated from the model, considering a variability of ±2% on the void ratio. The sensitivity analysis on the void ratio is justified by the fact that the measurement of the void ratio is affected by great uncertainty from an operational point of view. It provides an estimation of the confidence interval of the proposed equation. Even if the model shows good predictive capacities, the model is highly sensitive to the variability of the void ratio. A variation of ±2% on e leads to a variation of the pore pressure, which can reach ±10 % in the large strains domain. According to the results of the oedometric tests (Figure 3), the value is attainable for confinement pressures of the order of 1 MPa. Therefore, the risk of an increase in pore water pressure during a strong earthquake cannot be excluded a priori over the entire height of the projected dam.
4. Conclusions
Resonant column tests and undrained cyclic triaxial tests were performed on compacted residual soil samples from the French West Indies to determine the evolution of the shear modulus, damping ratio, and pore water pressure ratio as a function of cyclic shear strain amplitude. The main conclusions of the experimental work are as follows:
- The small-strain shear modulus mainly depended on the void ratio and to a lesser extent on the confinement pressure.
- The curvature of the curve vs. and the reference shear strain , corresponding to , increased with the confinement pressure. When , the normalized shear modulus increased significantly with confinement pressure while the influence of confinement pressure became negligible for .
- Unlike the normalized shear modulus, the damping ratio was influenced only by the confinement pressure when . The maximum damping ratio depended on the confinement pressure and varied between 12% and 16%.
- The pore water pressure developed when the shear strain amplitude reached a threshold shear strain evaluated at 0.03%. It increased linearly with the damping ratio and the void ratio.
- The specificity of the mechanical behavior of this compacted, saturated residual soil could be attributed to the crushing of the cemented aggregates constituting the material when the threshold shear strain was exceeded.
The experimental results were compared with existing models for , vs. and D vs. curves. It was shown that the existing models were not adapted to the soil considered and that specific curves should be developed. Empirical models were, therefore, established using a statistical approach from small to large cyclic shear strains (0.0001–2.0%). The comparison of the models to the measured values suggested that the uncertainties associated with each of these models were lower than 20% of the predicted values of G and D and lower than 10% for the predicted values of .
It can be concluded that the predictive model established within the framework of this study make it possible to obtain reasonable predictions of the shear modulus, damping ratio, and pore pressure generation curves. This model enables us to account for the main mechanisms occurring during the dynamic loading of a saturated soil, namely the damage to the material and the pore water pressure increase, taking into account the specificity of the compacted residual soils. As part of the project study for the dam under construction, we have empirical equations allowing us to calibrate constitutive models for seismic analyses and liquefaction risk assessments. The methodology we have developed and the general framework we have presented for the model formulation can be generalized for other residual soils and used in all fields of geotechnical engineering.
Author Contributions
Conceptualization, L.M. and G.V.; methodology, L.M.; validation, G.V.; formal analysis, L.M. and G.V.; investigation, L.M.; writing—original draft preparation, L.M. and G.V.; writing—review and editing, L.P., D.D., C.C., J.D. and E.A.; supervision, L.P. and D.D.; project administration, L.P. and E.A.; funding acquisition, E.A. All authors have read and agreed to the published version of the manuscript.
Funding
This work is part of a PhD thesis supported by a CIFRE convention of the National Association of Research and Technology (ANRT), the French National Research Institute for Agriculture, Food and Environment (INRAE), and the ANTEA Group. The triaxial equipment and resonant column were financed by the ARD PIVOTS program supported by the Centre-Val de Loire Regional Council and by the European Regional Development Fund.
Data Availability Statement
All data, models, and code generated or used during the study appear in the submitted article.
Acknowledgments
The authors thank the Antea Group geotechnical laboratory team for their assistance in the preparation and execution of the tests.
Conflicts of Interest
The authors declare no conflict of interest.
References
- Zarfl, C.; Lumsdon, A.; Berlekamp, J.; Tydecks, L.; Tockner, K. A global boom in hydropower dam construction. Aquat. Sci. 2015, 77, 161–170. [Google Scholar] [CrossRef]
- Marulanda, A.; Radchenko, V.E.A. Bulletin 151—Tropical Residual Soils as Dam Foundation and Fill Material; Technical Report; ICOLD: Paris, France, 2017. [Google Scholar]
- Fookes, P. Tropical Residual Soils; A Geological Society Engineering Group Working Party Revised Report; Geological Society: London, UK, 1997. [Google Scholar]
- Wesley, L. Geotechnical Engineering in Residual Soils; John Wiley & Sons: Hoboken, NJ, USA, 2010. [Google Scholar]
- Jacquet, D. Sensitivity to remoulding of some volcanic ash soils in New Zealand. Eng. Geol. 1990, 28, 1–25. [Google Scholar] [CrossRef]
- Wang, C.E.; Borden, R.H. Deformation Characteristics of Piedmont Residual Soils. J. Geotech. Eng. 1996, 122, 822–830. [Google Scholar] [CrossRef]
- Samingan, A.S.; Leong, E.C.; Rahardjo, H. A flexible wall permeameter for measurements of water and air coefficients of permeability of residual soils. Can. Geotech. J. 2003, 40, 559–574. [Google Scholar] [CrossRef]
- Futai, M.M.; Almeida, M.S.S.; Lacerda, W.A. Yield, Strength, and Critical State Behavior of a Tropical Saturated Soil. J. Geotech. Geoenviron. Eng. 2004, 130, 1169–1179. [Google Scholar] [CrossRef]
- Futai, M.M.; Almeida, M.S.S. An experimental investigation of the mechanical behaviour of an unsaturated gneiss residual soil. Géotechnique 2005, 55, 201–213. [Google Scholar] [CrossRef]
- Hernandez, O.; Cordão Neto, M.P.; Caicedo, B. Structural features and hydro-mechanical behaviour of a compacted andesitic volcanic soil. Géotechnique Lett. 2018, 8, 195–200. [Google Scholar] [CrossRef]
- Seed, H.B.; Idriss, I.M.; Lee, K.L.; Makdisi, F.I. Dynamic Analysis of the Slide in the Lower San Fernando Dam during the Earthquake of February 9, 1971. J. Geotech. Eng. Div. 1975, 101, 889–911. [Google Scholar] [CrossRef]
- Ohmachi, T.; Tahara, T. Nonlinear Earthquake Response Characteristics of a Central Clay Core Rockfill Dam. Soils Found. 2011, 51, 227–238. [Google Scholar] [CrossRef]
- Cascone, E.; Rampello, S. Decoupled seismic analysis of an earth dam. Soil Dyn. Earthq. Eng. 2003, 23, 349–365. [Google Scholar] [CrossRef]
- Veylon, G.; Luu, L.H.; Mercklé, S.; Bard, P.Y.; Delvallée, A.; Carvajal, C.; Frigo, B. A simplified method for estimating Newmark displacements of mountain reservoirs. Soil Dyn. Earthq. Eng. 2017, 100, 518–528. [Google Scholar] [CrossRef]
- Sica, S.; Pagano, L. Performance-Based Analysis of Earth Dams: Procedures and Application to a Sample Case. Soils Found. 2009, 49, 921–939. [Google Scholar] [CrossRef]
- Rampello, S.; Cascone, E.; Grosso, N. Evaluation of the seismic response of a homogeneous earth dam. Soil Dyn. Earthq. Eng. 2009, 29, 782–798. [Google Scholar] [CrossRef]
- Pelecanos, L.; Kontoe, S.; Zdravković, L. A case study on the seismic performance of earth dams. Géotechnique 2015, 65, 923–935. [Google Scholar] [CrossRef]
- Amir-Faryar, B.; Aggour, M.S.; McCuen, R.H. Universal model forms for predicting the shear modulus and material damping of soils. Geomech. Geoengin. 2017, 12, 60–71. [Google Scholar] [CrossRef]
- Stokoe, H.; Darendeli, M.; Andrus, R.; Brown, L. Dynamic soil properties: Laboratory, field and correlation studies. Conf. Earthq. Geotech. Eng. 1999, 3, 811–845. [Google Scholar]
- Hardin, B.; Black, W. Closure to: Vibration Modulus of Normally Consolidated Clays. J. Soil Mech. Found. Div. 1969, 95, 1531–1537. [Google Scholar] [CrossRef]
- Kagawa, T. Moduli and Damping Factors of Soft Marine Clays. J. Geotech. Eng. 1992, 118, 1360–1375. [Google Scholar] [CrossRef]
- Ishibashi, I.; Zhang, X. Unified Dynamic Shear Moduli and Damping Ratios of Sand and Clay. Soils Found. 1993, 33, 182–191. [Google Scholar] [CrossRef]
- Hardin, B.; Drnevich, V. Shear Modulus and Damping in Soils: Design Equations and Curves. J. Soil Mech. Found. Div. 1972, 98, 667–692. [Google Scholar] [CrossRef]
- Sun, J.; Golesorkhi, R.; Seed, H. Dynamic Moduli and Damping Ratios for Cohesive Soils; Technical Report UCB/EERC-88/15; University of California: Berkeley, CA, USA, 1988. [Google Scholar]
- Kokusho, T.; Yoshida, Y.; Esashi, Y. Dynamic properties of soft clay for wide strain range. Soils Found. 1982, 22, 1–18. [Google Scholar] [CrossRef] [PubMed]
- Lo Presti, D.C.F.; Jamiolkowski, M.; Pallara, O.; Cavallaro, A.; Pedroni, S. Shear modulus and damping of soils. Géotechnique 1997, 47, 603–617. [Google Scholar] [CrossRef]
- Rampello, S.; Viggiani, G.M.B.; Amorosi, A. Small-strain stiffness of reconstituted clay compressed along constant triaxial effective stress ratio paths. Géotechnique 1997, 47, 475–489. [Google Scholar] [CrossRef]
- Darendeli, M.B. Developement pf a New Family of Normalized Modulus Reduction and Material Damping Curves. Ph.D. Thesis, University of Texas at Austin, Austin, TX, USA, 2001. [Google Scholar]
- Stokoe, K.; Darendeli, M.; Gilbert, R.; Menq, F.Y.; Choi, W.K. Development of a New Family of Normalized Modulus Reduction and Material Damping Curves; Technical Report; University of California: Berkeley, CA, USA, 2004. [Google Scholar]
- Okur, D.; Ansal, A. Stiffness degradation of natural fine grained soils during cyclic loading. Soil Dyn. Earthq. Eng. 2007, 27, 843–854. [Google Scholar] [CrossRef]
- Kawaguchi, T.; Tanaka, H. Formulation of Gmax from Reconstituted Clayey Soils and its Application to Gmax Measured in the Field. Soils Found. 2008, 48, 821–831. [Google Scholar] [CrossRef]
- Vardanega, P.; Bolton, M. Stiffness of Clays and Silts: Normalizing Shear Modulus and Shear Strain. J. Geotech. Geoenviron. Eng. 2013, 139, 1575–1589. [Google Scholar] [CrossRef]
- Seed, H.B.I.I. Soil moduli and damping factors for dynamic response analysis. Earthq. Eng. Res. Cent. 1970, 70, 1–15. [Google Scholar]
- Shibuya, S.; Tanaka, H. Estimate of Elastic Shear Modulus In Holocene Soil Deposits. Soils Found. 1996, 36, 45–55. [Google Scholar] [CrossRef]
- Vucetic, M.; Dobry, R. Effect of soil plasticity o cyclic response. J. Geotech. Eng. 1991, 117, 89–107. [Google Scholar] [CrossRef]
- Iwasaki, T.; Tatsuoka, F.; Takagi, Y. Shear modulus of sands under cyclic torsional shear loading. Soils Found. 1978, 18, 39–56. [Google Scholar] [CrossRef]
- Keshavarz, A.; Mehramiri, M. New Gene Expression Programming models for normalized shear modulus and damping ratio of sands. Eng. Appl. Artif. Intell. 2015, 45, 464–472. [Google Scholar] [CrossRef]
- Senetakis, K.; Anastasiadis, A.; Pitilakis, K. Normalized shear modulus reduction and damping ratio curves of quartz sand and rhyolitic crushed rock. Soils Found. 2013, 53, 879–893. [Google Scholar] [CrossRef]
- Menq, F. Dynamic Properties of Sandy and Gravelly Soils. Ph.D. Thesis, University of Texas at Austin, Austin, TX, USA, 2003. [Google Scholar]
- Rollins, K.M.; Evans, M.D.; Diehl, N.B.; Daily, W.D., III. Shear Modulus and Damping Relationships for Gravels. J. Geotech. Geoenviron. Eng. 1998, 124, 396–405. [Google Scholar] [CrossRef]
- Borden, R.H.; Shao, L.; Gupta, A. Dynamic Properties of Piedmont Residual Soils. J. Geotech. Eng. 1996, 122, 813–821. [Google Scholar] [CrossRef]
- Pineda, J.; Colmenares, J.; Hoyos, L. Effect of Fabric and Weathering Intensity on Dynamic Properties of Residual and Saprolitic Soils via Resonant Column Testing. Geotech. Test. J. 2014, 37, 800–816. [Google Scholar] [CrossRef]
- Barros, J. Dynamic Shear Modulus of Tropical Soils. Ph.D. Thesis, Universidade de Sao Paulo, Sao Polo, Brazil, 1997. [Google Scholar]
- Zhang, J.; Andrus, R.D.; Juang, C.H. Normalized Shear Modulus and Material Damping Ratio Relationships. J. Geotech. Geoenviron. Eng. 2005, 131, 453–464. [Google Scholar] [CrossRef]
- Melinda, F.; Rahardjo, H.; Han, K.K.; Leong, E.C. Shear Strength of Compacted Soil under Infiltration Condition. J. Geotech. Geoenviron. Eng. 2004, 130, 807–817. [Google Scholar] [CrossRef]
- Rahardjo, H.; Heng, O.B.; Choon, L.E. Shear strength of a compacted residual soil from consolidated drained and constant water content triaxial tests. Can. Geotech. J. 2004, 41, 421–436. [Google Scholar] [CrossRef]
- Rahardjo, H.; Melinda, F.; Leong, E.; Rezaur, R. Stiffness of a compacted residual soil. Eng. Geol. 2011, 120, 60–67. [Google Scholar] [CrossRef]
- Macari, E.J.; Hoyos, L. Effect of Degree of Weathering on Dynamic Properties of Residual Soils. J. Geotech. Eng. 1996, 122, 988–997. [Google Scholar] [CrossRef]
- Leong, E.C.; Cahyadi, J.; Rahardjo, H. Stiffness of a Compacted Residual Soil. In Proceedings of the Fourth International Conference on Unsaturated Soils, Carefree, AZ, USA, 2–6 April 2006; pp. 1169–1180. [Google Scholar] [CrossRef]
- Pineda, J.A.; Hoyos, L.R.; Colmenares, J.E. Stiffness Response of Residual and Saprolitic Soils Using Resonant Column and Bender Element Testing Techniques. In GeoFlorida 2010; American Society of Civil Engineers: Reston, VA, USA, 2010; pp. 783–792. [Google Scholar] [CrossRef]
- Torres, C.E.; Colmenares, J.E. Influence of Confining Stress on the Small Strain Stiffness of a Residual Soil under K0 Conditions. In PanAm Unsaturated Soils 2017; American Society of Civil Engineers: Reston, VA, USA, 2018; pp. 408–419. [Google Scholar] [CrossRef]
- Francisca, F.; Bogado, G. Weathering effect on the small strains elastic properties of a residual soil. Geotech. Geol. Eng. 2019, 37, 4031–4041. [Google Scholar] [CrossRef]
- Liu, X.; Zhang, X.; Kong, L.; Li, X.; Wang, G. Effect of cementation on the small-strain stiffness of granite residual soil. Soils Found. 2021, 61, 520–532. [Google Scholar] [CrossRef]
- Stokoe, K.; Isenhower, W.M.; Hsu, J. Dynamic Properties of Offshore Silty Samples. In Proceedings of the Offshore Technology Conference, Houston, TX, USA, 5–8 May 1980. [Google Scholar]
- ASTM. D4015-07; Standard Test Methods for Modulus and Damping of Soils by Resonant-Column Method. ASTM International: West Conshohocken, PA, USA, 2013.
- Richart, F. Some effects of dynamic soil properties on soil structure interaction. J. Geotech. Eng. Div. 1975, 101, 21–24. [Google Scholar] [CrossRef]
- Ni, S. Dynamic Properties of Sand under True Triaxial Stress States from Resonant Column-Torsional Shear Tests. Ph.D. Thesis, University of Texas, Austin, TX, USA, 1987. [Google Scholar]
- Fedrizzi, F.; Raviolo, P.; Vigano, A. Resonant column and cyclic torsional shear experiments on soils of the Trentino valleys (NE Italy). In Proceedings of the 16th ECSMGE Geotechnical Engineering for Infrastructure and Development, Edinburgh, UK, 13–17 September 2015; pp. 3437–3442. [Google Scholar]
- ASTM. D5311; Standard Test Method for Load Controlled Cyclic Triaxial Strength of Soil. Technical Report. ASTM International: West Conshohocken, PA, USA, 2013.
- Matasović, N.; Vucetic, M. Cyclic Characterization of Liquefiable Sands. J. Geotech. Eng. 1993, 119, 1805–1822. [Google Scholar] [CrossRef]
- Cabidoche, Y.; Maurizot, P.; Théveniaut, H. Sols tropicaux des Outre-mer français tropicaux: Une diversité ordonnée par la géochimie de l’altération des roches. Géosciences 2011, 14, 22–31. [Google Scholar]
- AFNOR. XP P94-041-Sols; Reconnaissance et Essais. Identification granulométrique. Méthode de tamisage par voie humide. Groupe AFNOR: La Plaine Saint-Denis, France, 1995.
- AFNOR. NF P94-057-Sols; Reconnaissance et Essais—Analyse Granulométrique des Sols—Méthode par sédimentation. Groupe AFNOR: La Plaine Saint-Denis, France, 1992.
- Casagrande, A. Research on the Atterberg limits of soils. Public Roads 1932, 13. [Google Scholar]
- Wesley, L.D. Classification and characterisation of tropical residual soils. In Proceedings of the XIV Congreso Colombiano de Geotecnia, Bogotá, Colombia, 15–18 October 2014; pp. 1–15. [Google Scholar]
- Giacheti, H. Experimental study of dynamical properties of some tropical soils in Sao Polo state. Ph.D. Thesis, Universidade de Sao Paulo, Sao Paulo, Brazil, 1991. [Google Scholar]
- Otálvaro, I.F.; Neto, M.P.C.; Caicedo, B. Compressibility and microstructure of compacted laterites. Transp. Geotech. 2015, 5, 20–34. [Google Scholar] [CrossRef]
- Hardin, B.; Black, W. Vibration Modulus of Normally Consolidated Clays. J. Soil Mech. Found. Div. 1968, 94, 353–369. [Google Scholar] [CrossRef]
- Viggiani, G.; Atkinson, J. Stiffness of fine grained soil at very small strains. Géotechnique 1995, 45, 249–265. [Google Scholar] [CrossRef]
- Shibuya, S.; Hwang, S.; Mitachi, T. Elastic shear modulus of soft clays from shear wave velocity measurement. Géotechnique 1997, 47, 593–601. [Google Scholar] [CrossRef]
- Richart, F.; Hall, J.; Woods, R. Vibration of Soils and Foundations; Technical Report; Prentice Hall: London, UK, 1970. [Google Scholar]
- Shibata, T.; Soelarno, D. Stress-strain characteristics of clays under cyclic loading. J. JSCE 1978, 276, 101–110. [Google Scholar] [CrossRef] [PubMed]
- Jamiolkowski, M.; Lancellotta, R.; Lo Presti, D.C.F. Remarks on the stiffness at small strains of six Italian clays. In Prefailure Behavior of Geomaterials; S. Shibuya, T.M., Miura, S., Eds.; Balkema: Rotterdam, The Netherlands, 1994; Volume 2, pp. 817–854. [Google Scholar]
- Santagata, M.; Germaine, J.T.; Ladd, C.C. Factors Affecting the Initial Stiffness of Cohesive Soils. J. Geotech. Geoenviron. Eng. 2005, 131, 430–441. [Google Scholar] [CrossRef]
- Hoyos, L.; Macari, E. Influence of In Situ Factors on Dynamic Response of Piedmont Residual Soils. J. Geotech. Geoenviron. Eng. 1999, 125, 271–279. [Google Scholar] [CrossRef]
- Houlsby, G.; Wroth, C. The Variation of Shear Modulus of a Clay with Pressure and Overconsolidation Ratio. Soils Found. 1991, 31, 138–143. [Google Scholar] [CrossRef]
- Santos, J.; Correia, A. Shear Modulus of Soils under Cyclic Loading at Small and Medium Strain Level. In Proceedings of the 12th World Conference on Earthquake Engineering, Auckland, New Zealand, 30 January–4 February 2000; Volume 530. [Google Scholar]
- Cha, M.; Santamarina, J.C.; Kim, H.S.; Cho, G.C. Small-Strain Stiffness, Shear-Wave Velocity, and Soil Compressibility. J. Geotech. Geoenviron. Eng. 2014, 140, 06014011. [Google Scholar] [CrossRef]
- Goddard, J.D. Nonlinear elasticity and pressure-dependent wave speeds in granular media. Proc. R. Soc. A 1990, 37, 430105–430131. [Google Scholar] [CrossRef]
- ASTM D3999; Standard Test Methods for the Determination of the Modulus and Damping Properties of Soils Using the Cyclic Triaxial Apparatus. ASTM International: West Conshohocken, PA, USA, 2012.
- Hardin, B. The nature of damping in sands. J. Soil Mech. Found. Div. 1965, 91, 63–97. [Google Scholar] [CrossRef]
- Sheriff, M.; Gaddah, A.; Ishibashi, I. Damping ratio for dry sands. J. Soil Mech. Found. Div. 1977, 103, 743–756. [Google Scholar] [CrossRef]
- Uchida, K.; Sawada, T.; Hasegawa, T. Dynamic Properties of Sand Subjected to Initial Shear Stress. In Proceedings of the International Symposium on Soils under Cyclic and Transient Loading, Swansea, UK, 7–11 January 2013; pp. 121–133. [Google Scholar]
- Zhang, X. Effect of coupled motions on the dynamic properties of sands. PhD Thesis, University of Texas, College Park, TX, USA, 1994. [Google Scholar]
- Cetin, K.O.; Bilge, H.T. Cyclic Large Strain and Induced Pore Pressure Models for Saturated Clean Sands. J. Geotech. Geoenviron. Eng. 2012, 138, 309–323. [Google Scholar] [CrossRef]
- Hsu, C.C.; Vucetic, M. Threshold Shear Strain for Cyclic Pore-Water Pressure in Cohesive Soils. J. Geotech. Geoenviron. Eng. 2006, 132, 1325–1335. [Google Scholar] [CrossRef]
- Ichii, K.; Mikami, T. Cyclic threshold shear strain in pore water pressure generation in clay in situ samples. Soils Found. 2018, 58, 756–765. [Google Scholar] [CrossRef]
Figure 1.
Seismotectonic context of the Caribbean zone and geographical location of the dam site (red start).
Figure 1.
Seismotectonic context of the Caribbean zone and geographical location of the dam site (red start).

Figure 2.
A schematic illustration of the Wykeham Farrance triaxial apparatus.

Figure 3.
Results of the undrained cyclic triaxial tests performed on specimen TX-1. The deviatoric stress is represented as a function of axial deformation for the 30th to the 50th cycles. The axial strain amplitudes are equal to 0.2, 0.4, 0.6, 0.8, and 1.0%.
Figure 3.
Results of the undrained cyclic triaxial tests performed on specimen TX-1. The deviatoric stress is represented as a function of axial deformation for the 30th to the 50th cycles. The axial strain amplitudes are equal to 0.2, 0.4, 0.6, 0.8, and 1.0%.

Figure 4.
Representation of the identification results of the seven sampling units: plasticity chart and range of particle size distributions [41,65].

Figure 5.
High resolution SEM view of a slightly oxidized clod.

Figure 6.
High resolution SEM view of a strongly oxidized clod.

Figure 7.
Energy Dispersive Spectrometry (EDS) representative of the material.

Figure 8.
Pore size distribution of the residual soil studied.

Figure 9.
Comparison of measured and calculated values of for the equations proposed in the literature [43,68,69,70].

Figure 10.
Comparison between measured and predicted values of for all RC tests. The dashed lines correspond to the of uncertainty.
Figure 10.
Comparison between measured and predicted values of for all RC tests. The dashed lines correspond to the of uncertainty.

Figure 11.
Variation of with the mean effective stress for normally consolidated specimens of the residual soil studied.
Figure 11.
Variation of with the mean effective stress for normally consolidated specimens of the residual soil studied.

Figure 12.
Normalized shear modulus versus shear strain amplitude for all of the shear tests performed.
Figure 12.
Normalized shear modulus versus shear strain amplitude for all of the shear tests performed.

Figure 13.
Comparison between the normalized shear moduli obtained from resonant column and triaxial tests and the existing predictive equations [28,32,35,44]. The grey area represents the results for the same range of values for , , and .

Figure 14.
Statistically adjusted test data ().

Figure 15.
Comparison between measured and predicted shear moduli for all of the data (). The dashed lines correspond to uncertainty.
Figure 15.
Comparison between measured and predicted shear moduli for all of the data (). The dashed lines correspond to uncertainty.

Figure 16.
Damping ratio D versus shear strain amplitude for all of the shear tests performed.

Figure 17.
Comparison between the damping ratios obtained from resonant column and triaxial tests and the existing predictive equations [22,35,41,44].

Figure 18.
Evolution of material damping D as a function of the normalized shear modulus .

Figure 19.
Comparison between measured and damping ratio for all of the data (). The dashed lines correspond to uncertainty.
Figure 19.
Comparison between measured and damping ratio for all of the data (). The dashed lines correspond to uncertainty.

Figure 20.
Relative pore water pressure build-up versus shear strain for different confinement pressures. The spindle corresponds to the predictive equation considering an uncertainty on the void ratio equal to ± 0.02.
Figure 20.
Relative pore water pressure build-up versus shear strain for different confinement pressures. The spindle corresponds to the predictive equation considering an uncertainty on the void ratio equal to ± 0.02.


Table 1.
Experimental program.
| Specimen ID | Type of Test | Tested | |
|---|---|---|---|
| (−) | (kPa) | ||
| RC-1 | RC | 1.01 | 100, 200, 300 |
| RC-2 | RC | 1.09 | 100, 200, 300 |
| RC-3 | RC | 1.00 | 100, 200 |
| RC-4 | RC | 1.10 | 100, 200, 300 |
| RC-5 | RC | 1.08 | 100, 200 |
| RC-6 | RC | 1.13 | 100 |
| RC-7 | RC | 1.45 | 100, 200, 300 |
| RC-8 | RC | 1.47 | 100, 200, 300 |
| RC-9 | RC | 1.48 | 100, 200 |
| TX-1 | CyTX | 1.01 | 100 |
| TX-2 | CyTX | 1.00 | 200 |
| TX-3 | CyTX | 0.99 | 300 |
| TX-4 | CyTX | 1.08 | 100 |
| TX-5 | CyTX | 1.10 | 200 |
| TX-6 | CyTX | 1.08 | 300 |
RC = torsional resonant column test; CyTX = undrained cyclic triaxial test.
Table 2.
Mineral and chemical compositions of the residual soil considered in this study.
| Mineral Species from X-ray Diffraction Analyses | Weight (%) |
|---|---|
| Kaolinite | 44.1–44.2 |
| Goethite | 21.8–22.5 |
| Gibbsite | 9.1–10.9 |
| Quartz | 5.0–5.4 |
| Halloysite | 3.1–11.6 |
| Anatase | 2.6–3.3 |
| Nacrite | 0.0–12.1 |
| Chemical elements from ICP analyses | |
| 30.5–30.6 | |
| 30.6–30.8 | |
| 16.3–16.3 | |
| 0.04 | |
| 0.2 | |
| 0.2 | |
| 0.2 | |
| 1.4 | |
| 19.8 |
Table 3.
Expressions and parameter values for the different equations of for fine-grained soils found in the literature.
Table 3.
Expressions and parameter values for the different equations of for fine-grained soils found in the literature.
| Reference | Type of Clay | x | m | n | |
|---|---|---|---|---|---|
| Hardin et al. [68] | Edgar plastic kaolin (R) | - | - | 0.5 | |
| Shibata et al. [72] | 3 Japanese clays (U) | - | - | 0.5 | |
| Kagawa et al. [21] | Soft marine clays (R) | - | - | 1.0 | |
| Viggiani and Atkinson [69] | Speswhite kaolin (R) | - | - | 0.653 | 0.195 |
| London clay (R) | - | - | 0.51 | 0.25 | |
| Shibuya et al. [34] | 5 types of clays (R) | 1.5 | - | 0.5 | |
| Shibuya et al. [70] | 8 Japanese clays (U) | 2.4 | 0.64–0.94 | 0.40–0.68 | |
| Jamiolkowski et al. [73] | 8 Italian clays (U) | 1.11–1.52 | - | 0.40–0.58 | |
| Barros [43] | 8 Brazilian residual soils (R) | 0.95 | 0.485 | 0.515 | |
| Borden et al. [41] | 4 Piedmont residual soils (U) | - | - | - | 0.34–0.41 |
| Hoyos and Macari [75] | 6 Piedmont residual soils (U) | - | - | - | 0.80–1.15 |
| Pineda et al. [42] | 4 Colombian residual soils (U) | - | - | - | 0.37–0.48 |
| Santagata et al. [74] | Boston Blue clay (R) | - | - | 0.15 | 0.80 |
| Boston Blue clay (R) | 2.44 | - | 0.44 | ||
| Vardanega and Bolton [32] | 10 types of clays (R) | 2.4 | - | 0.50 | |
| Francisca and Bogado [52] | Basaltic residual soils (R) | - | - | - | 0.12–0.24 |
| Liu et al. [53] | Granitic residual soils (R) | 1.3 | - | 0.48 | |
| Torres and Colmenares [51] | Lateritic residual soils (R) | - | - | - | 0.28 |
U = Undisturbed samples, R = Remolded samples.
Disclaimer/Publisher’s Note: The statements, opinions and data contained in all publications are solely those of the individual author(s) and contributor(s) and not of MDPI and/or the editor(s). MDPI and/or the editor(s) disclaim responsibility for any injury to people or property resulting from any ideas, methods, instructions or products referred to in the content. |
© 2023 by the authors. Licensee MDPI, Basel, Switzerland. This article is an open access article distributed under the terms and conditions of the Creative Commons Attribution (CC BY) license (https://creativecommons.org/licenses/by/4.0/).
Share and Cite
MDPI and ACS Style
Mouali, L.; Veylon, G.; Dias, D.; Peyras, L.; Carvajal, C.; Duriez, J.; Antoinet, E. Dynamic Properties of a Compacted Residual Soil from the West Indies. Geotechnics 2023, 3, 254-277. https://doi.org/10.3390/geotechnics3020015
AMA Style
Mouali L, Veylon G, Dias D, Peyras L, Carvajal C, Duriez J, Antoinet E. Dynamic Properties of a Compacted Residual Soil from the West Indies. Geotechnics. 2023; 3(2):254-277. https://doi.org/10.3390/geotechnics3020015
Chicago/Turabian StyleMouali, Lila, Guillaume Veylon, Daniel Dias, Laurent Peyras, Claudio Carvajal, Jérôme Duriez, and Eric Antoinet. 2023. "Dynamic Properties of a Compacted Residual Soil from the West Indies" Geotechnics 3, no. 2: 254-277. https://doi.org/10.3390/geotechnics3020015