Article

Simultaneous Biocementation and Compaction of a Soil to Avoid the Breakage of Cementitious Structures during the Execution of Earthwork Constructions

by
Laura Morales Hernández
1,
Eduardo Garzón Garzón
1,*,
Pedro J. Sánchez-Soto
2 and
Enrique Romero Morales
3
1
Department of Engineering, University of Almeria, La Cañada de San Urbano, 04120 Almería, Spain
2
Institute of Materials Science of Sevilla (ICMS), Joint Center of the Spanish National Research Council (CSIC), University of Sevilla, Americo Vespucio 49, 41092 Sevilla, Spain
3
Department of Geotechnical Engineering and Geosciences, Universitat Politècnica de Catatalunya, c/Jordi Girona 1-3, Campus Nord UPC, Edificio D-2, 08034 Barcelona, Spain
*
Author to whom correspondence should be addressed.
Geotechnics 2023, 3(2), 224-253; https://doi.org/10.3390/geotechnics3020014
Submission received: 23 February 2023 / Revised: 3 April 2023 / Accepted: 19 April 2023 / Published: 23 April 2023
(This article belongs to the Special Issue Recent Advances in Geotechnical Engineering)

Abstract

:
This research focuses on the potential for microbial treatment to stabilize compacted soils, which are often utilized in earthwork projects. A silt–clay sand was used to describe a particular kind of soil. The suggested remedy makes use of the soil’s naturally occurring urea and Ca2+, as well as microorganisms introduced to the compaction water. Two alternative initial water-content types were examined: those on the dry side and those close to the ideal Proctor conditions. Bacillaceae microorganisms were used to induce microbial CaCO3 precipitation and improve the hydraulic and mechanical properties of the compacted soil. The samples were biotreated and immediately compacted, so that the precipitation of calcium carbonate during the curing process took place in the contact areas between the particles (biocementation) and in the pore space (bioclogging). A set of techniques were used to study the ageing effects, such as the water-retention curve by dew-points psychrometer, mercury porosimetry intrusion, permeability, ultrasonic pulse velocity, resonant column, and unconfined and tensile-compression tests. During the ageing, it was observed that the bacterial activity consumed water for the hydrolysis of urea and other intermediate reactions to precipitate CaCO3. This process resulted in a retraction of the microstructure and a change in the macrostructure. The bioclogging phenomenon was more evident in the soil microstructure, while the biocementation process was easier to observe in the macrostructure. The suction’s effects on the soil stiffness were studied in detail, and a significant increase was detected. Despite these water-content losses, which caused soil stiffening by increasing the suction, it was still feasible to identify the gradual rise in small-strain stiffness throughout incubation. The unconfined and tensile-compression tests showed a similar progressive increase in terms of peak compressive and peak splitting strength during the incubation. These results are of interest when microbiological treatments are applied in soils to produce cementitious materials, with the present investigation demonstrating a complete study of their geotechnical behaviour.

1. Introduction

Calcite, one of the most common cementation products in nature, which can lead to a wide variation in geo-material behaviour, is used in different branches of engineering. According to Seagren and Aydilek [1] many biomediated processes, including mineral precipitation, biofilm development, the utilization of biopolymers, mineral transformation, and biogenic gas production, have been studied for their effects on geomechanical characteristics. Microbes from soils and aqueous media have regularly been shown to cause the precipitation of calcium-carbonate-mineral phases in both natural and laboratory environments, as reported by Lian et al. [2]. As a result, microbial activity has a significant impact on how carbonate sediments and soil-carbonate deposits are formed.
Carbonate precipitation in nature may theoretically occur following several known processes [3]: (a) heterotrophic bacterial mediation; (b) fungal mediation; (c) abiotic chemical precipitation from saturated solutions by evaporation, temperature increases, and/or pressure decreases; (d) external or internal skeleton production by eukaryotes; and (e) the lowering of CO2 pressure under the effect of autotrophic processes (such as photosynthesis or methanogenesis).
The process of passive precipitation, also known as passive carbonatogenesis, results in the precipitation of calcium carbonate by creating carbonate and bicarbonate ions in aqueous media, which cause numerous chemical changes. The nitrogen cycle and the sulfur cycle are two metabolic cycles that may be involved. This process is called microbially induced carbonate precipitation (MICP). Since the kind of mineral generated by bacteria is primarily reliant on the environment [4,5,6,7], it is widely accepted that the creation of calcium carbonate by bacteria is “induced” [8].
By activating calcium and/or magnesium ionic pumps or channels during ionic exchanges via the cell membrane, carbonate particles are formed, probably in tandem with the generation of carbonate ions (carbonatogenesis). These activities may be carried out by a number of bacterial species. This process is known as “biologically controlled mineralization”. The organism exerts strong control over the process, which includes the nucleation and development of the mineral particles. Regardless of the surroundings, the organism creates minerals in a way that is exclusive to its species [3]. For this reason, sands cemented by natural processes are widely distributed. Calcite (CaCO3)-cement precipitation is largely responsible for the generation of sandstones, in this specific case. One of the most common elements on Earth, calcite comprises 4 wt.% of the Earth’s crust by mass [9].
Despite previous research, the role played by microorganisms in the precipitation of calcium carbonate is not yet clear, and remains a matter of debate. The majority of bacteria, according to Boquet et al. [10], are capable of precipitating CaCO3. Knorre and Krumbein [11] reached the conclusion that typical processes, such as urea hydrolysis, sulphate reduction, and photosynthesis, all result in microbial calcium-carbonate precipitation (MCP) as a consequence of microbial metabolism. These metabolic processes allow the precipitation of CaCO3 by making the environment more alkaline (raising pH and dissolving inorganic carbon content). Other authors, however, believe that it is a distinct process with ecological advantages for the organisms that precipitate CaCO3 [12], or that it may depend on particular bacteria with specific characteristics that influence and foster CaCO3 precipitation.
The simple chemical process of calcium-carbonate precipitation is primarily controlled by four variables: (i) the calcium concentration, (ii) the carbonate concentration, (iii) the pH, and (iv) the presence of nucleation sites [13]. Numerous studies have established that calcite precipitates on bacterial cell surfaces, demonstrating that bacteria serve as excellent nucleation sites for growing minerals during the formation of rocks. Since bacterial cultures have an abundance of nucleation sites, the first three parameters—calcium concentration, carbonate concentration, and pH—are crucial for MCP [14].
According to Ivanov and Chu [15], carbonate precipitation can be generated by a bioclogging or biocementation process. They observed that the use of microorganisms in geotechnical engineering has two notable applications, bioclogging and biocementation. In this study, bioclogging is defined as the microbial generation of pore-filling materials with the purpose of reducing soil porosity and hydraulic conductivity. It is a technique used to lower the hydraulic conductivity of porous rocks and soil as a result of microbial activity or products. It might be used to prevent earth dams and dikes from internally eroding, lessen drain channel erosion, or create grout curtains to slow the movement of heavy metals and organic contaminants. Conversely, researchers [15] describe biocementation as the in situ microbial production of particle-binding compounds with the purpose of enhancing soil shear strength. By boosting the strength and stiffness qualities of soils and rocks via microbiological activity or products, biocementation has shown tremendous promise for enhancing soil strength, preventing particle breakage, and reducing soil erosion [2,3,4,5,6,7,8,9,10]. It might be used to stop soil avalanches, lessen clayey soil’s tendency to swell, decrease sand’s propensity to liquefy, and compress soil on reclaimed land locations.
Recently, Xiao et al. [16] studied the fracture of interparticle MICP bonds under compression. They developed a set of tools to create MICP bonds between spherical beds of quartz and calcareous material after taking into account element and model tests. They examined how the interparticle MICP bonds behaved under microscopic compression and compared this behavior with that of Portland cement bonding. The Portland cement bonds showed a homogenous dense microstructure, while the MICP bonds exhibited gravity-related inhomogeneity.
However, it is also important to mention the pollution effects of the treatment. The main problem inflicted by MICP treatments is ammonia production. The hydrolysis of urea relies on ammonia for the alkalinization of the medium. These ammonia molecules are subsequently equilibrated in water with their protonated and deprotonated forms. Therefore, of the remainder of the ammonium-containing solution must be eliminated in order to avoid negative environmental effects. Due to the growing recognition of atmospheric ammonia as a contaminant, the use of such treatments in situ may pose some environmental concerns. It is known that atmospheric ammonia contributes to a number of environmental issues, such as direct toxic effects on vegetation and atmospheric nitrogen deposition, which leads to the eutrophication and acidification of sensitive ecosystems, as well as the formation of secondary particulate matter in the atmosphere, with an impact on human health, atmospheric visibility, and the global radiative balance [17].
On the other hand, the presence of ammonium generated as a byproduct might also present some risks. In this case, ammonium molecules take more oxidized forms, nitrates, which have a negative impact on the environment when they are in high concentrations. The oxidation of ammonium should be avoided, since it is an acidifying process and can also redissolve precipitated calcium carbonate [18,19]. For situations in which higher concentrations of ammonium need to be produced, some authors proposed the use of a paste [20,21].
Another important aspect is the stability of the carbonates produced by the treatment over time. The calcium carbonate precipitated by microorganisms can be redissolved as a result of various environmental factors. Authors such as Van Paassen [18], De Muynck [20], Carretero et al. [21], Rubio and Escudero [22], and DeJong et al. [23] have studied the decarbonation or degrading process. Mechanical stress (caused by an earthquake), as well as chemical (such as the process of dissolution by carbon-dioxide-rich waters), or biochemical activities that might alter the speed with which chemical processes take place, are all potential sources for this deterioration. With this technology, using observational approaches could be suitable, meaning that a biological treatment may be administered once more if required [24].
Valuable precedents for biocementation, such as the case of slope-soil stabilization against surface erosion, should be noted [25]. Following a series of injections of cementation solutions, native ureolytic bacteria were enhanced under the best environmental conditions and injected to percolate through the slope surface. Although the unconfined compression stress decreased with the slope depth, the cementation caused a 90% reduction in the hydraulic conductivity of the slope soil.
It is interesting to emphasize several review articles concerning MICP. For instance, Zhang et al. [26] published a review on influencing factors and applications of MICP. They discussed the effects of bacterial species, bacterial concentration, temperature, and pH value. The prospects and limitations of the MICP technology were outlined. Iqbal et al. [27] published a review on bio-cementation in construction materials. After analyzing the papers critically, they came to the conclusion that microorganisms have a significant impact on the bio-cementation of building materials, such as concrete, bricks, and mortar. Indeed, as research has advanced, the possibility of making use of bio-cementation in building materials has begun to appear promising.
In particular, concerning soils, Yu et al. [28] reported a review on the engineering properties of MICP-treated soils, considering MICP as a sustainable and effective soil-improvement method in recent years. In that review, the previous results of researchers were selected, presented, analyzed, and summarized in order to be used as references for future studies. An interesting study was reported by Valencia-Galindo et al. [29] on the evolution of the effectiveness of soil treatment using CaCO3 precipitation from cultivated and lyophilized bacteria in soil-compaction water. The study investigated soils containing expansive clays and sandy silts.
Finally, a review on ground improvement using chemical methods [30], including MICP, cement, and lime should be mentioned. In both current and future geotechnical approaches to the construction of the structures in poor soil, ground improvement is crucial. The absence of a significant quantity of data was found to be a key reason for the less widespread usage of these technologies in industry.
In a very recent study, Wu et al. [31] considered a novel 3D DEM (discrete element model) of biocemented sand with fines as cementing agents. In order to replicate the diverse patterns of precipitation in sand treated by MICP, a quantitative investigation was conducted to examine the microstructural properties and how they changed in response to external loading.
Previous results indicated that, in general, microbiological treatments tend to aggregate soil, thus generating lumps. This process is heavily influenced by the curing protocol. It was also observed that some of the cementitious material generated by the microbiological treatment broke during the compaction of the sample; this material happened to be the filling material of the pore spaces in the range of 3–50 µm (the compaction broke the coarser aggregates and destroyed the initial binding/biocementation effect) [32]. This investigation focuses on the influence of the aging process on the stiffness of treated soil, using non-destructive techniques. The results of the main geotechnical properties are reported, since they are of interest in the execution of earthwork constructions.

2. Material and Methods

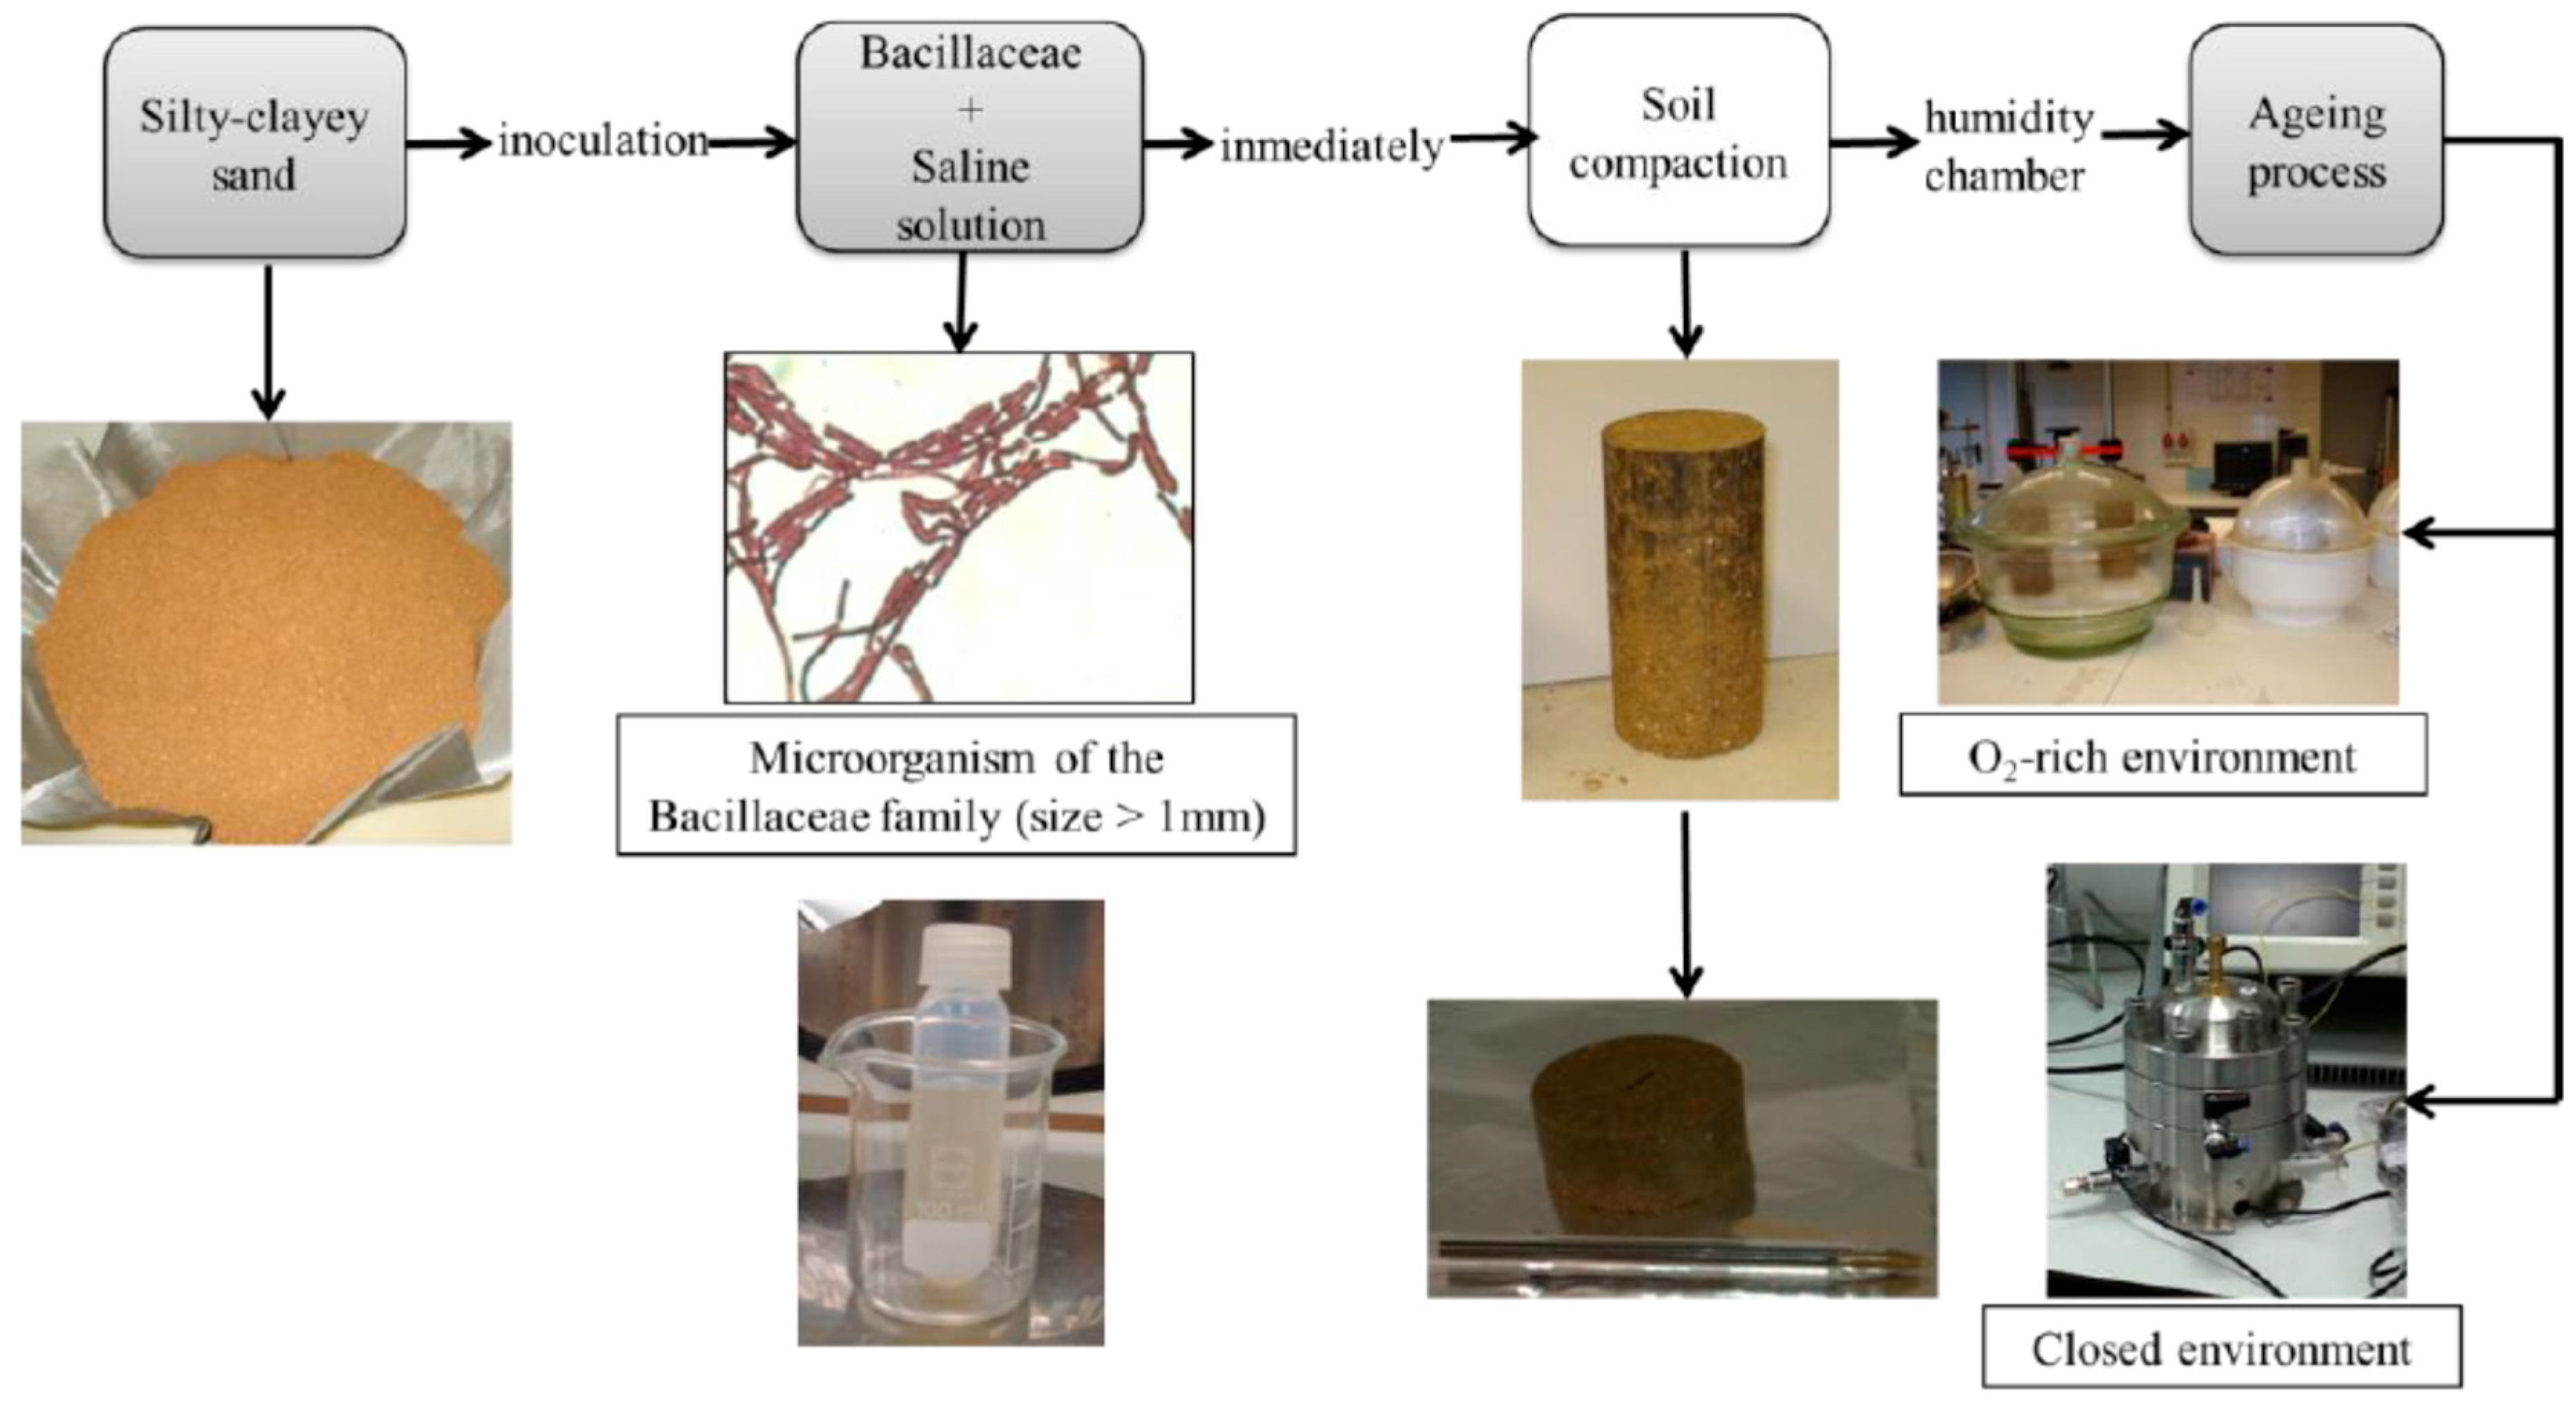
2.1. Material and Biotreatment

The silt–clay sand used in this study was taken from an earthwork in development. As previously reported by Morales et al. [33], a microbe belonging to the Bacillaceae family was employed to precipitate carbonated minerals in the soil, which were examined for natural urea content.
The primary soil characteristics are shown in Table 1. The untreated soil investigated had a liquid limit (WL) of 48% and a plasticity index (PI) of 30%, which is typical of soils containing clays with moderate plasticity. The calcium-carbonate content of the soil before the microbiological treatment represented 4.5% of dry mass. On the other hand, the particle-size distribution featured 50% of fine grains with particle diameters <75 µm, of which 46 wt.% were clays not exceeding 2 µm. Table 1 also displays the soil’s specific surface, as calculated by nitrogen adsorption using the BET and Langmuir techniques. It did not change with the microbiological treatment.
The sample preparation followed protocol B (Figure 1): a known concentration of bacteria, previously isolated under laboratory conditions, is added to the natural soil—which is not sterilized before inoculation—together with a saline solution at a rate equivalent to the optimum humidity percentage used in the compaction process. The soil is inoculated with bacteria prior to compaction in order to match subsequent field conditions. No further nutrients are included, since a natural availability of urea and Ca2+ is assumed.
When comparing the effectiveness of the treated soil (referred to as treated_NT) to that of the natural soil, many options were considered. Table 2 summarizes the results obtained for different energy levels and compaction process. The results show the values obtained for the maximum dry density (ρd), water content (w), degree of saturation (Sr), and compaction energy for the untreated soil. The solid density (ρs) is also presented.
Despite the fact that the samples were statically compacted, the same target void ratio (e = 0.473) was employed in this instance for the untreated (natural) and treated_NT soils, since it corresponded to the ideal dry density under standard Proctor energy (d = 1.85 Mg/m3). Untreated (natural) and treated soils were tested. Two different initial water contents were used to perform the assays: (i) w = 15% (ψ = 1 MPa), which corresponded to the optimum water content; and (ii) w = 7% (ψ = 26 MPa), which was used only in some assays.
After compaction, samples were left to age up to at least seven days. The aging process can follow two paths. In the first (1), the compacted soil is placed inside of sealed desiccators, with a constant relative humidity maintained using the vapor-equilibrium technique. This is called “O2-rich environment” ageing process. In the second (2), the compacted soil is left inside the edometer, within which are embedded the bender elements. It is called “closed environment” ageing process. In order to encourage the development of microorganisms in the soil (the incubation process), desiccators and edometer equipment are placed in an oven set at 30 °C. The various biological treatment methods that were applied before compaction are summarized in Figure 1. Since untreated samples passed through the same curing procedure as treated_NT samples, differences between the two were noted. It is important to mention that evaporation caused a slight decrease in water content throughout this operation. Since the samples were weighed before the tests were run, this was observed systematically. Due of the increased suction caused by this gradual evaporation, there was a slightly increased stiffening effect, which is thought to have exerted an identical impact on treated and untreated samples. The soil was inoculated with bacterial cells prior to compaction, i.e., the soil aging was followed by compaction (Figure 1).

2.2. Mineralogical Characterization

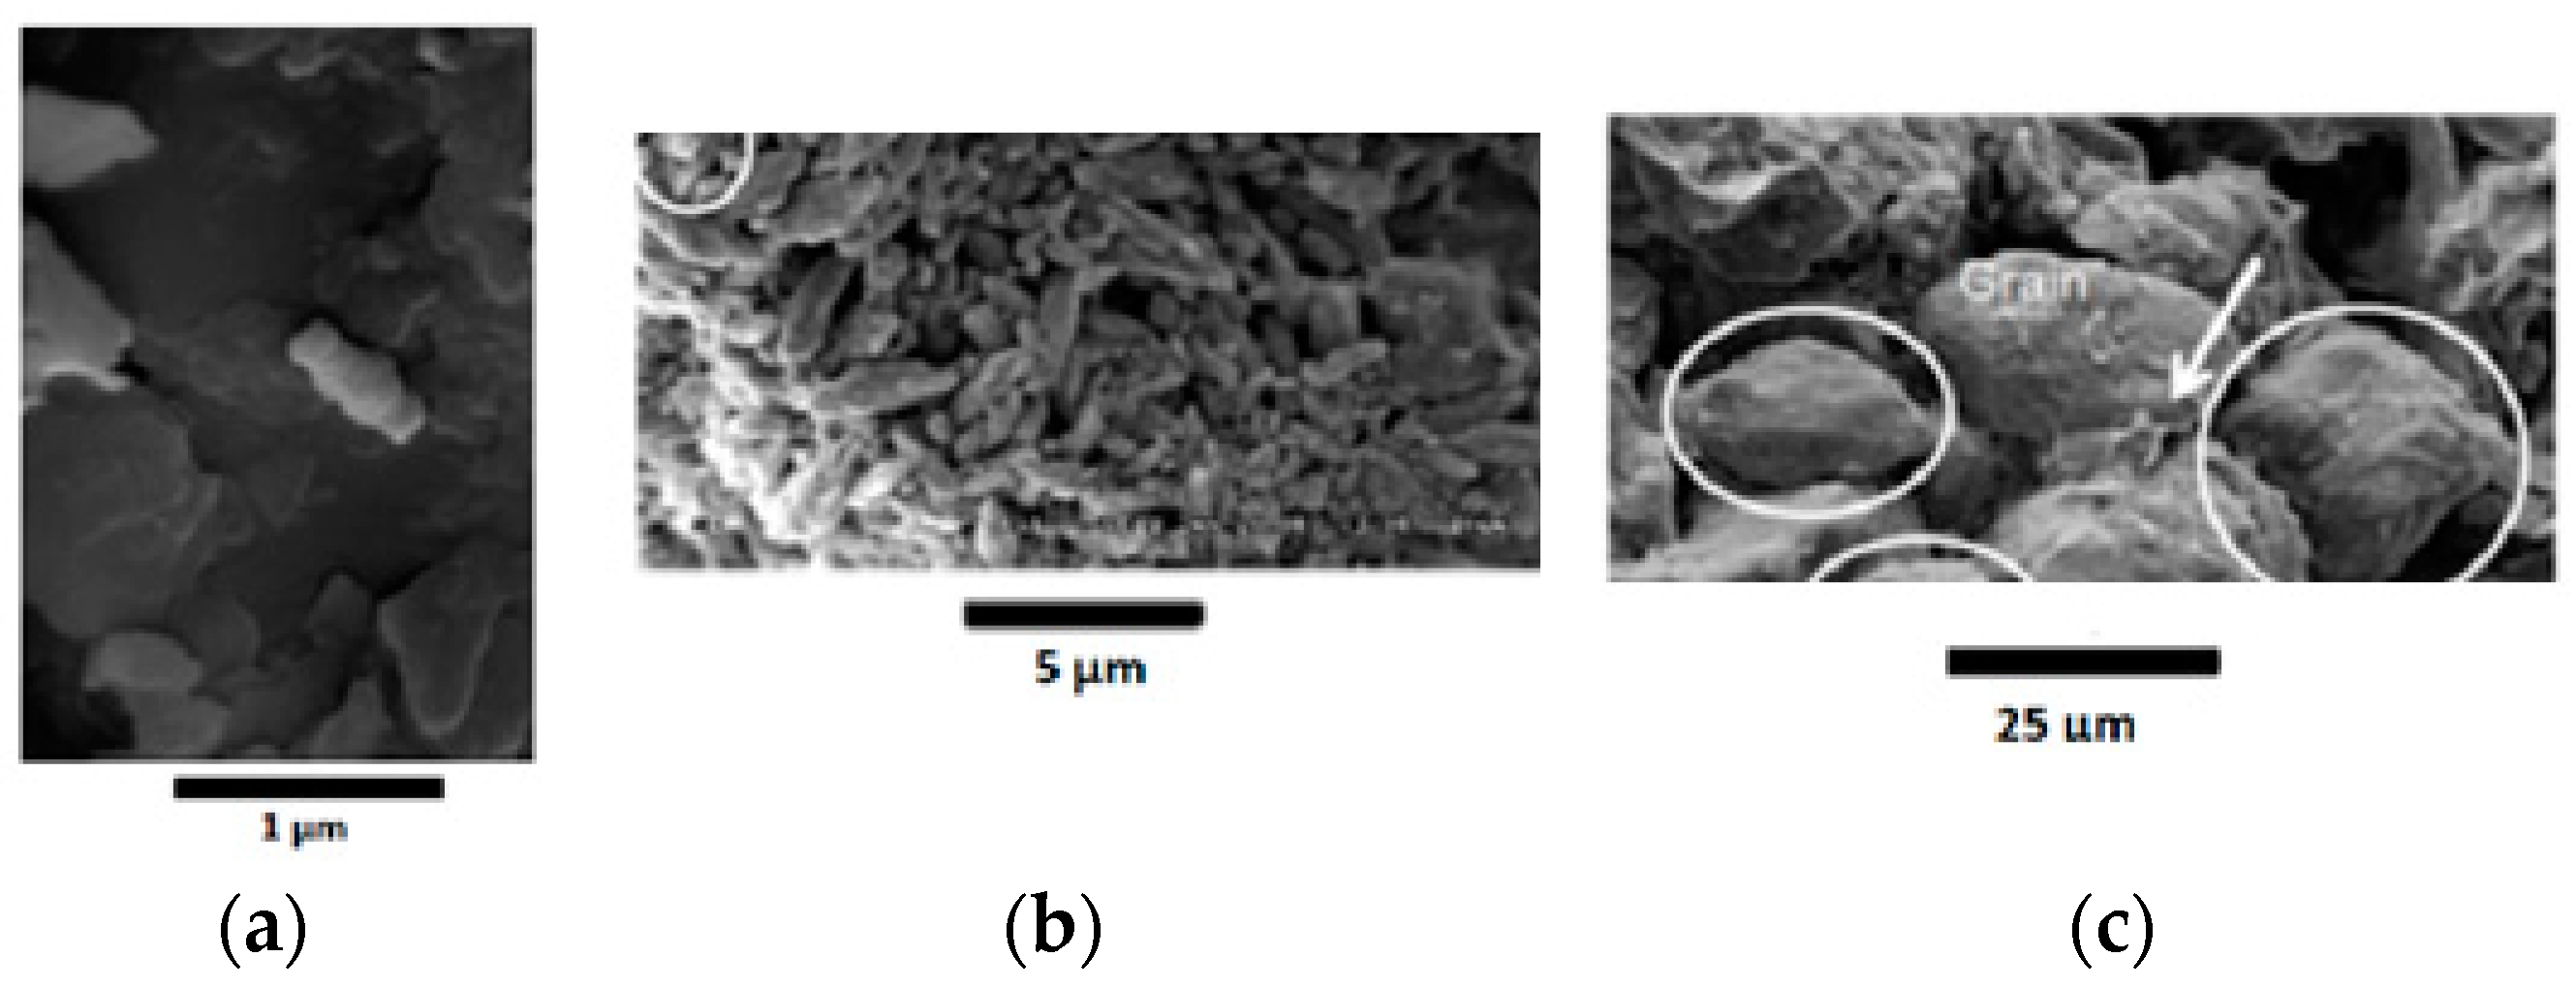
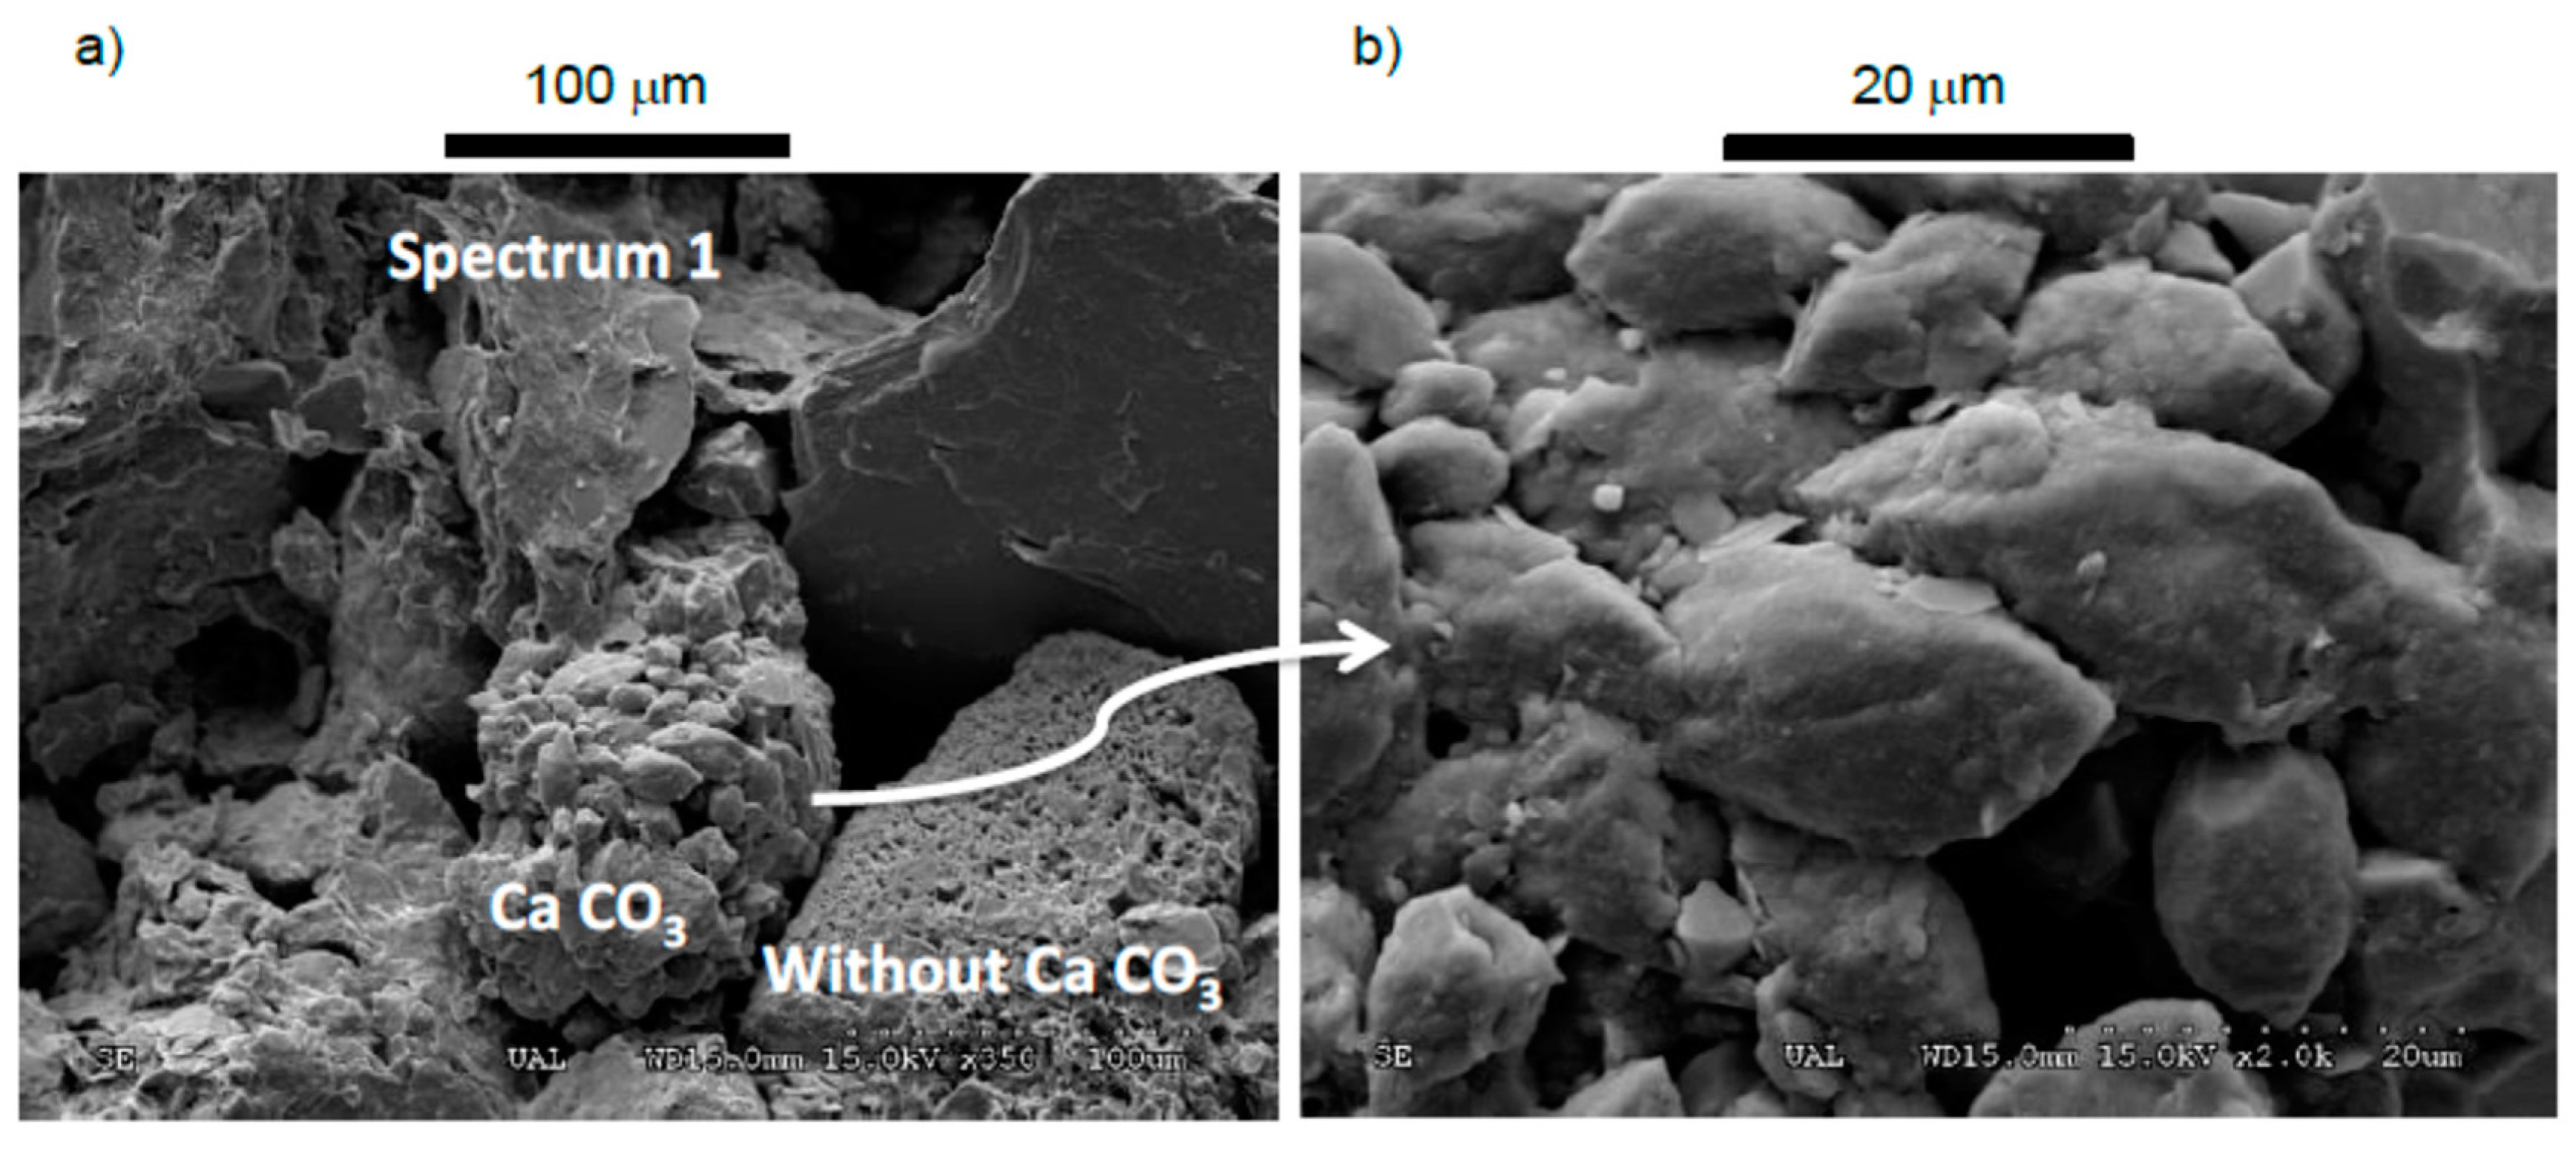
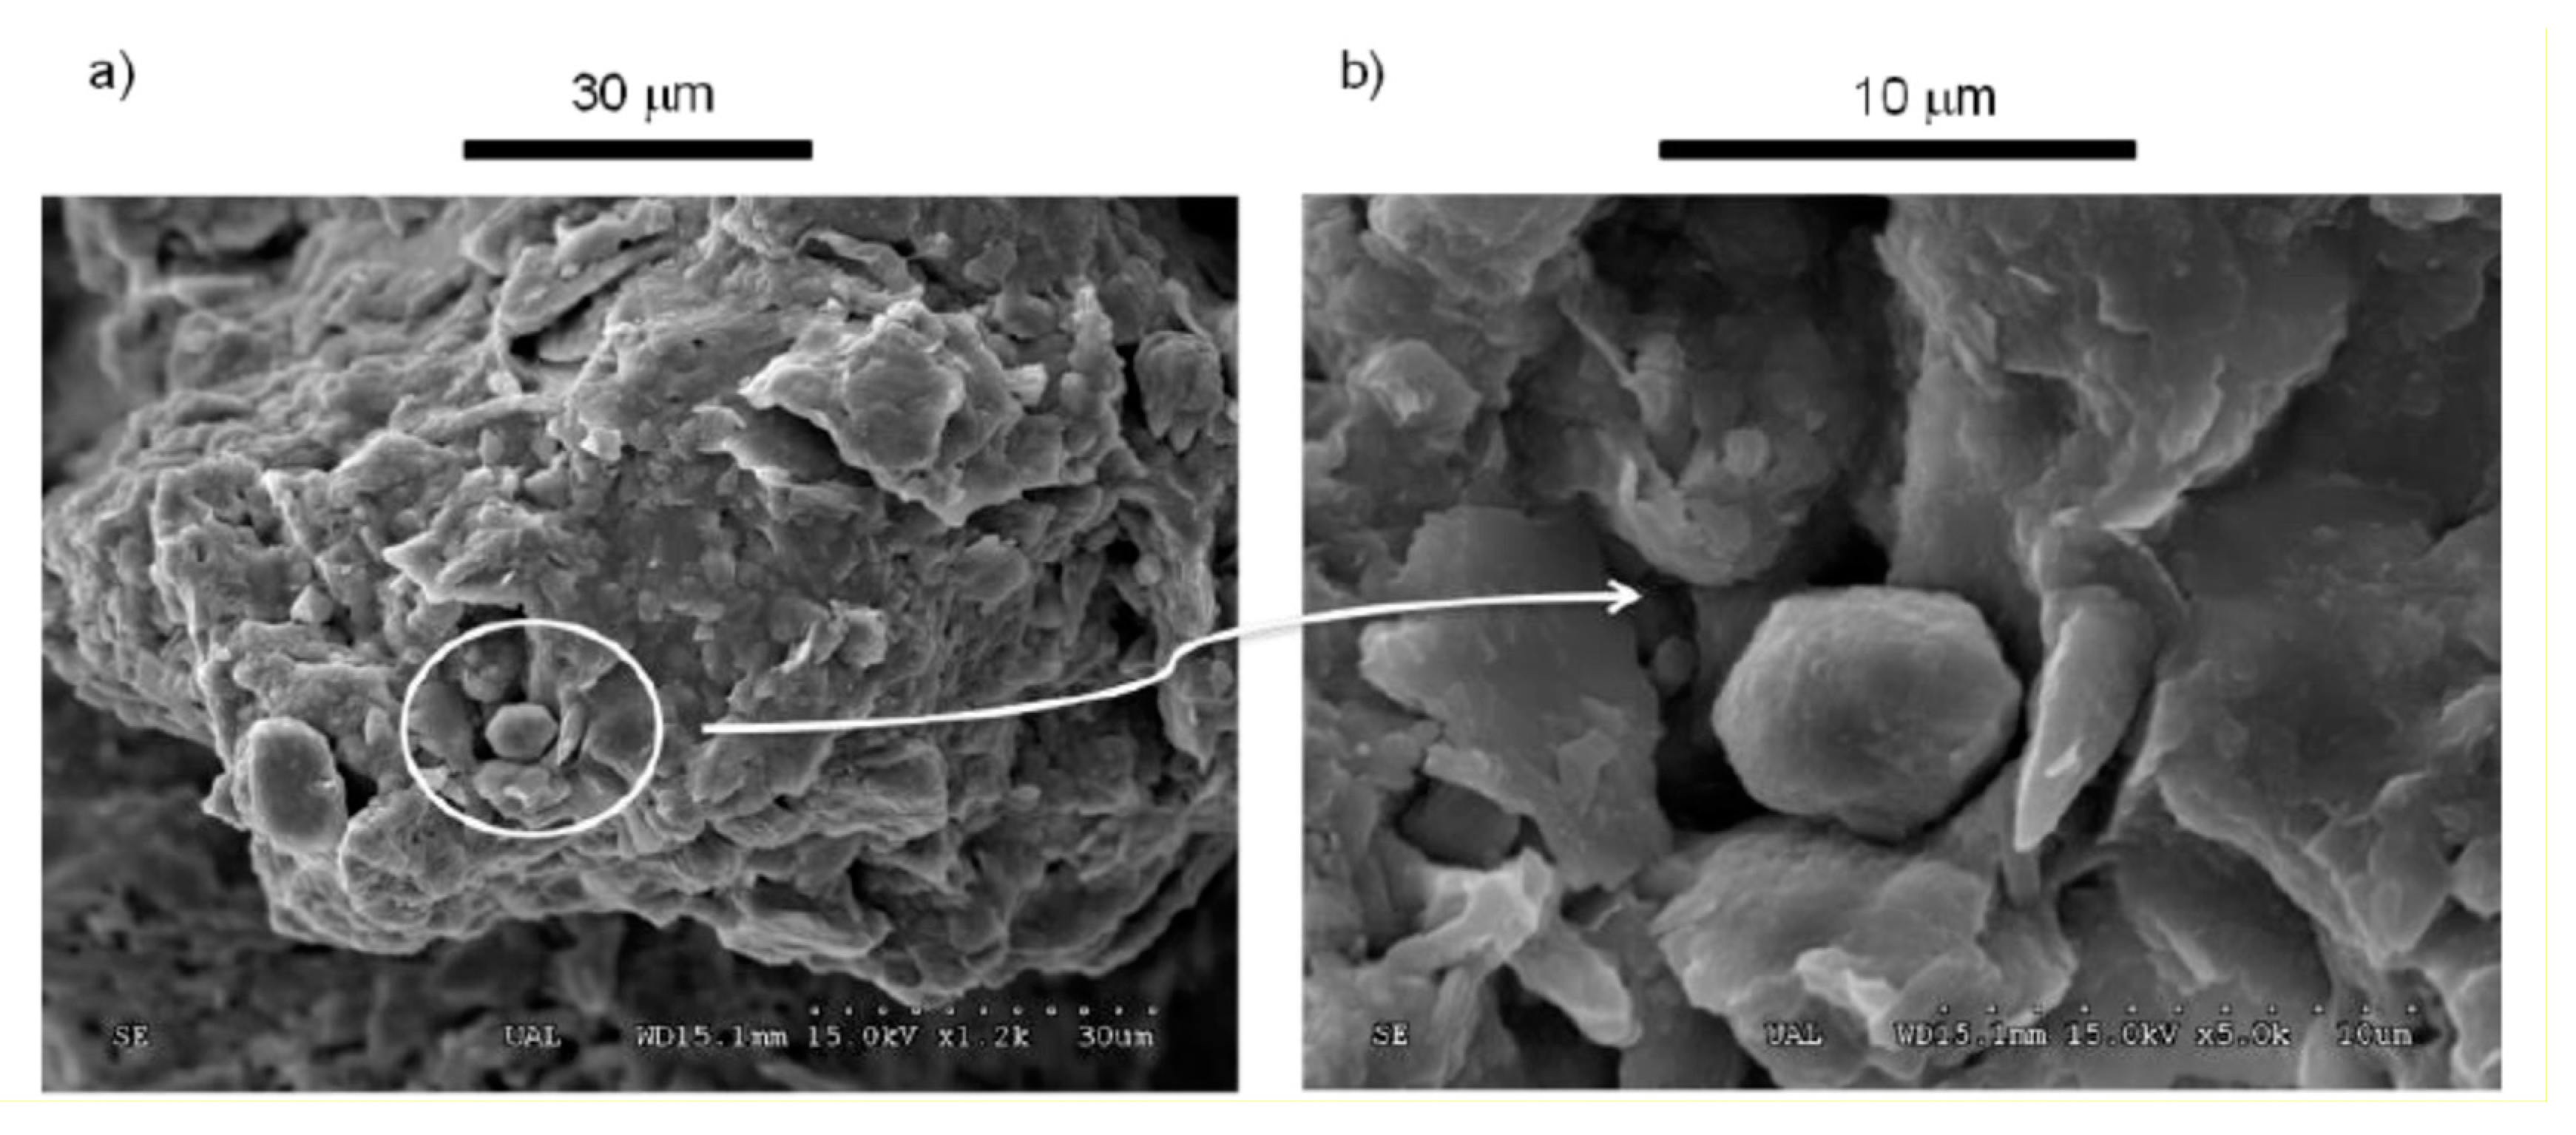
2.2.1. Scanning-Electron Microscopy (SEM)

Along with energy-dispersive X-ray spectroscopy (EDS), SEM at various magnifications was performed using the Hitachi S-3500 N X-ray microprobe model INCA X-Sights; Oxford, Engliand and by metallization using sputtering Bal-Tec SCD 005 equipment, Shalksmühle, Germany. The microstructure features of the treated NT sample were studied by SEM with chemical characterization by EDS.

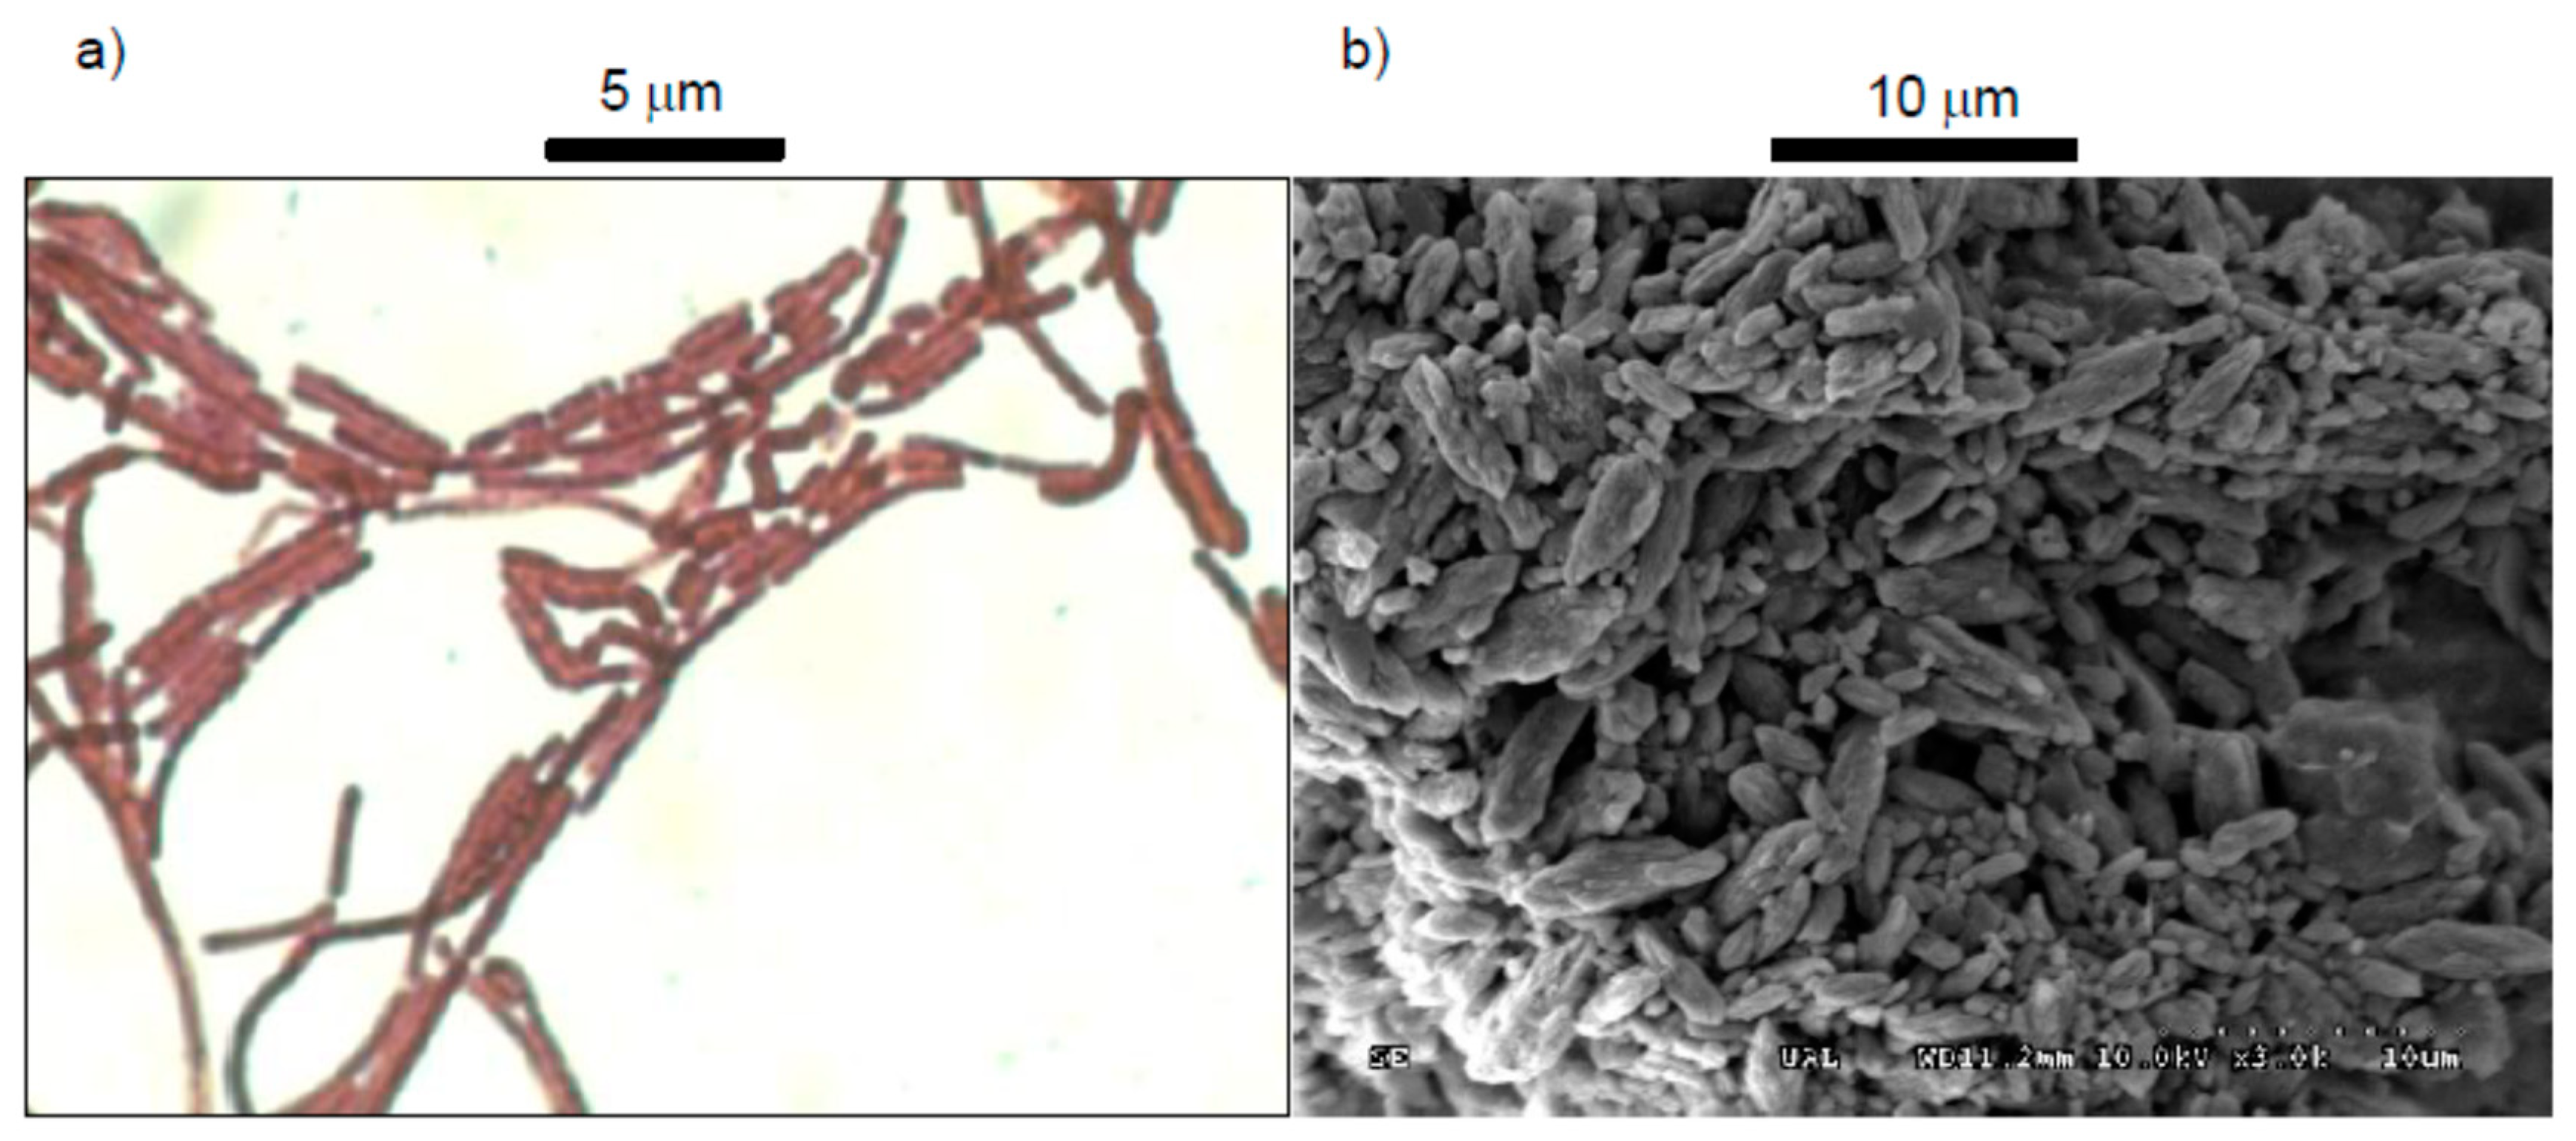
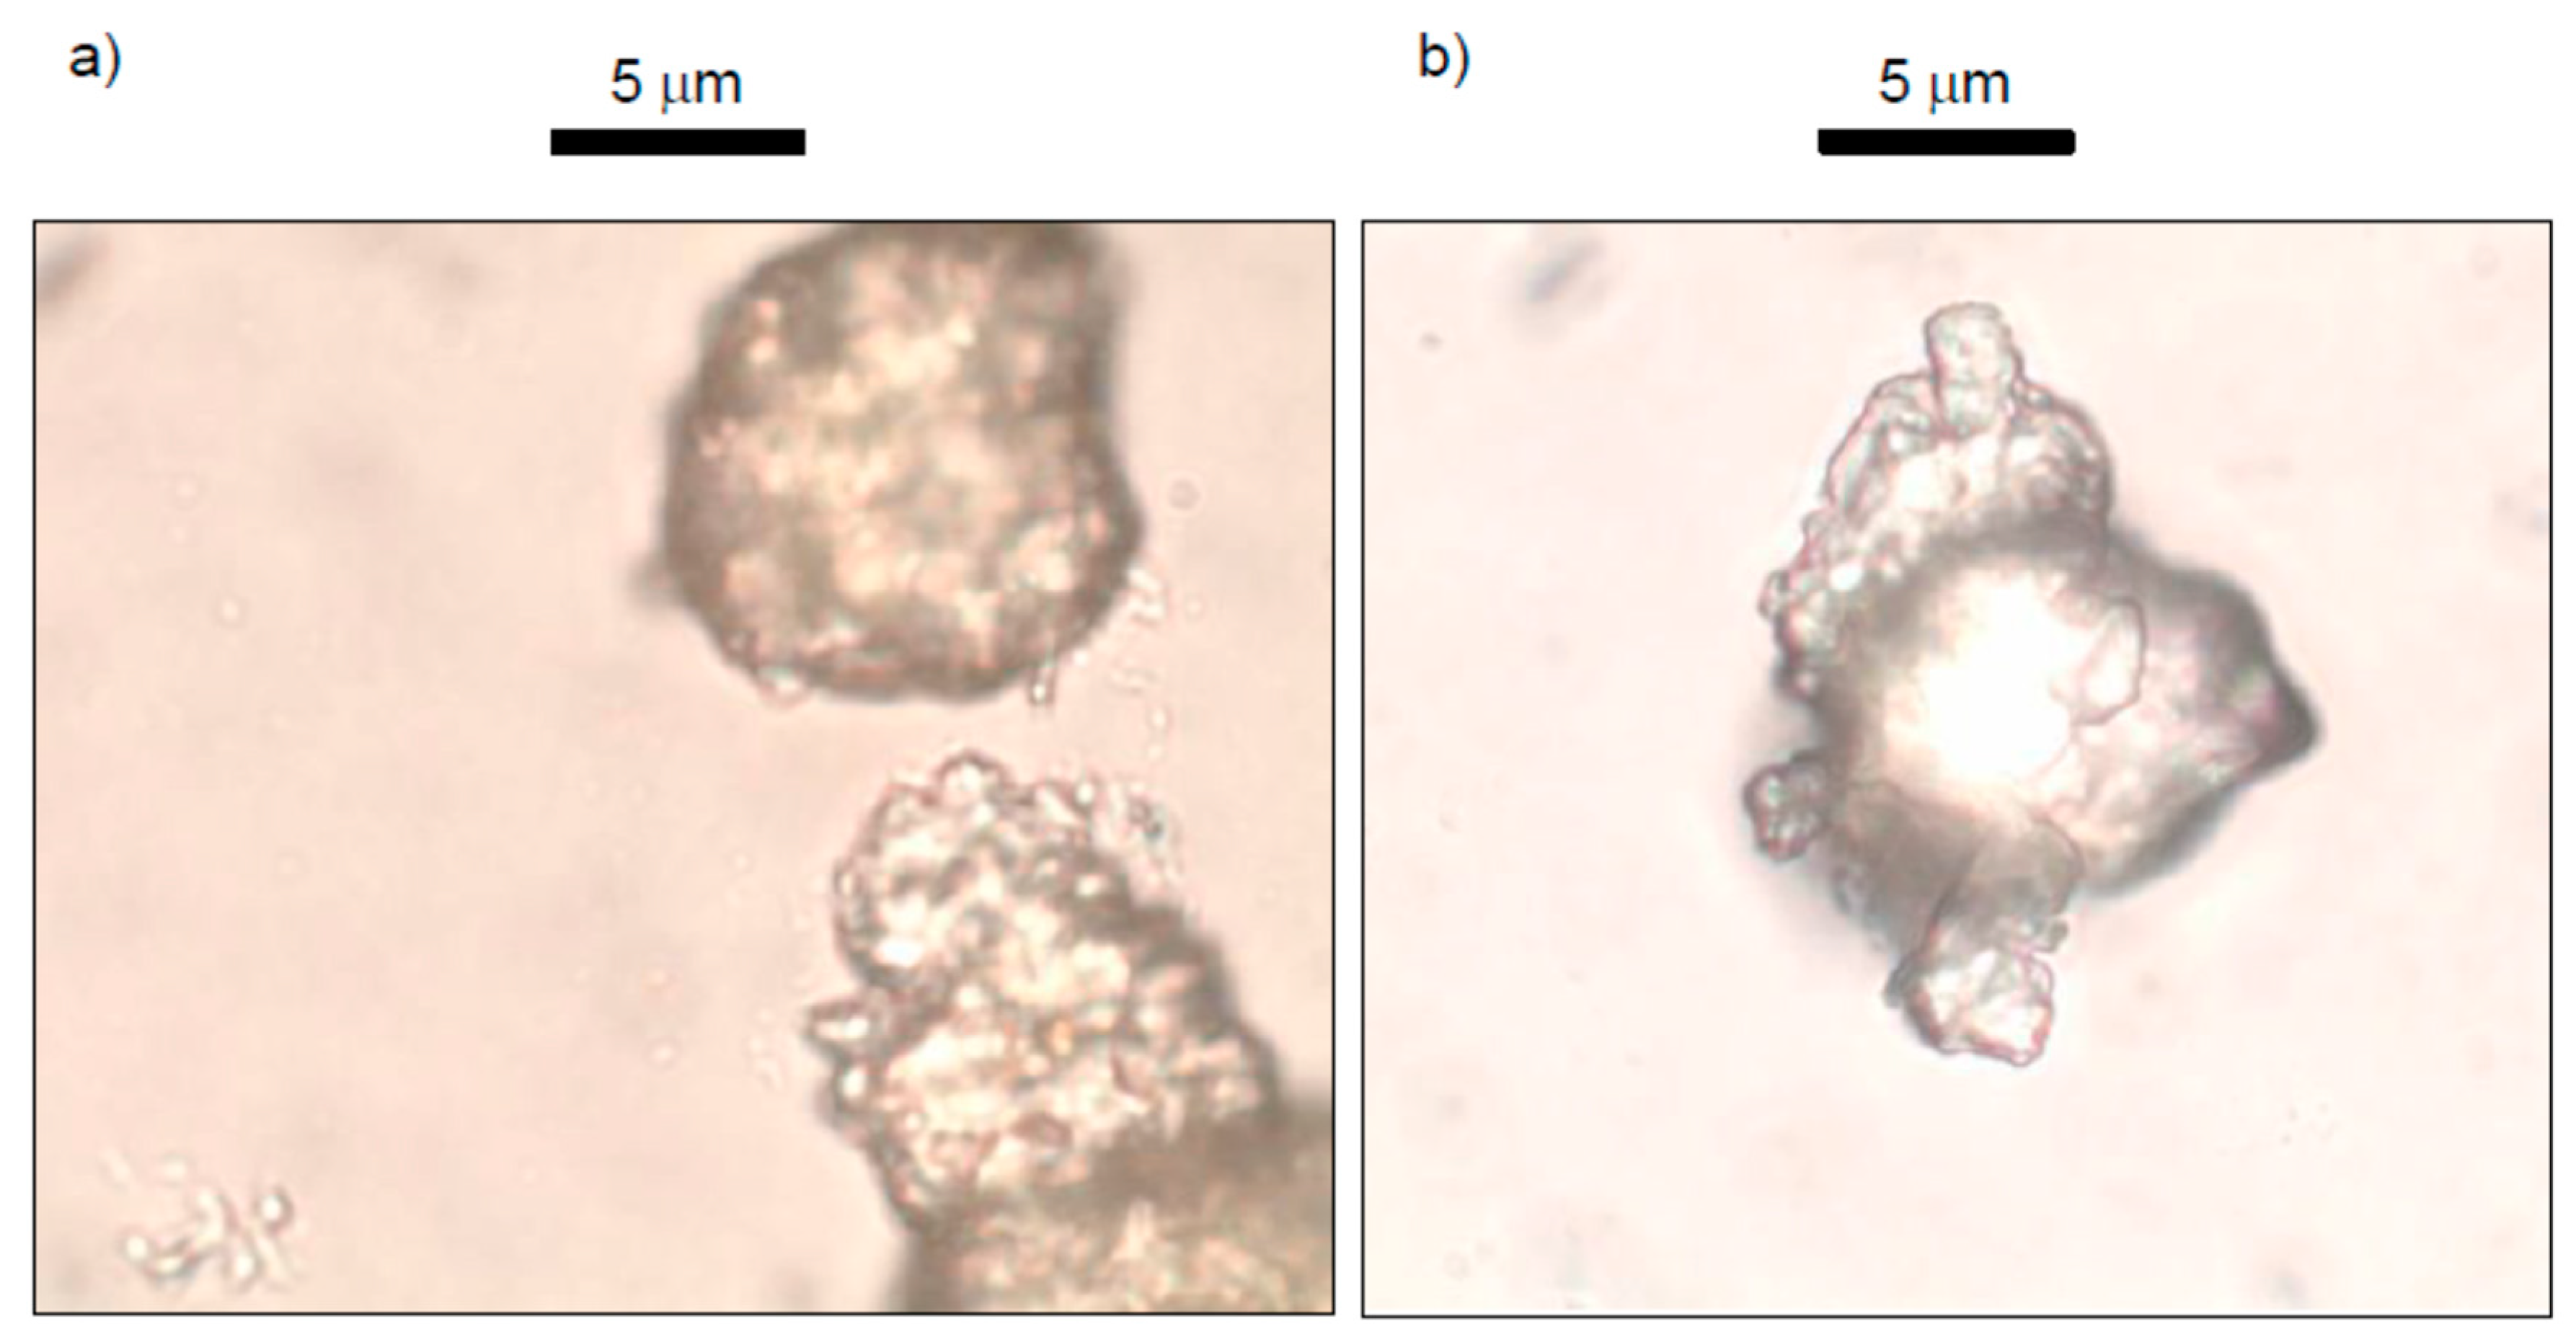
2.2.2. Optical Microscope

Both to study the microstructure and for the visualization of the new crystals that formed during treatment, an optical microscope was used. The optical microscope used was an Olympus Europe, Barcelona, Spain. The primary augmentation used by the objective lens is ×100. This image is transmitted to the ocular lens, which performs the final magnification ×10. Therefore, the total magnification is ×1000.

2.3. Techniques Used to Study Aging Effects

The effect of the microbiological treatment on soil stiffness was evaluated by means of non-destructive tests using bender-element transducers, ultrasonic pulse transducers, and resonant column. The results obtained with these tests were reinforced with other data from water-retention curve (WRC), mercury-intrusion porosimetry (MIP), and a series of additional assays, including unconfined compression and Brazilian test.

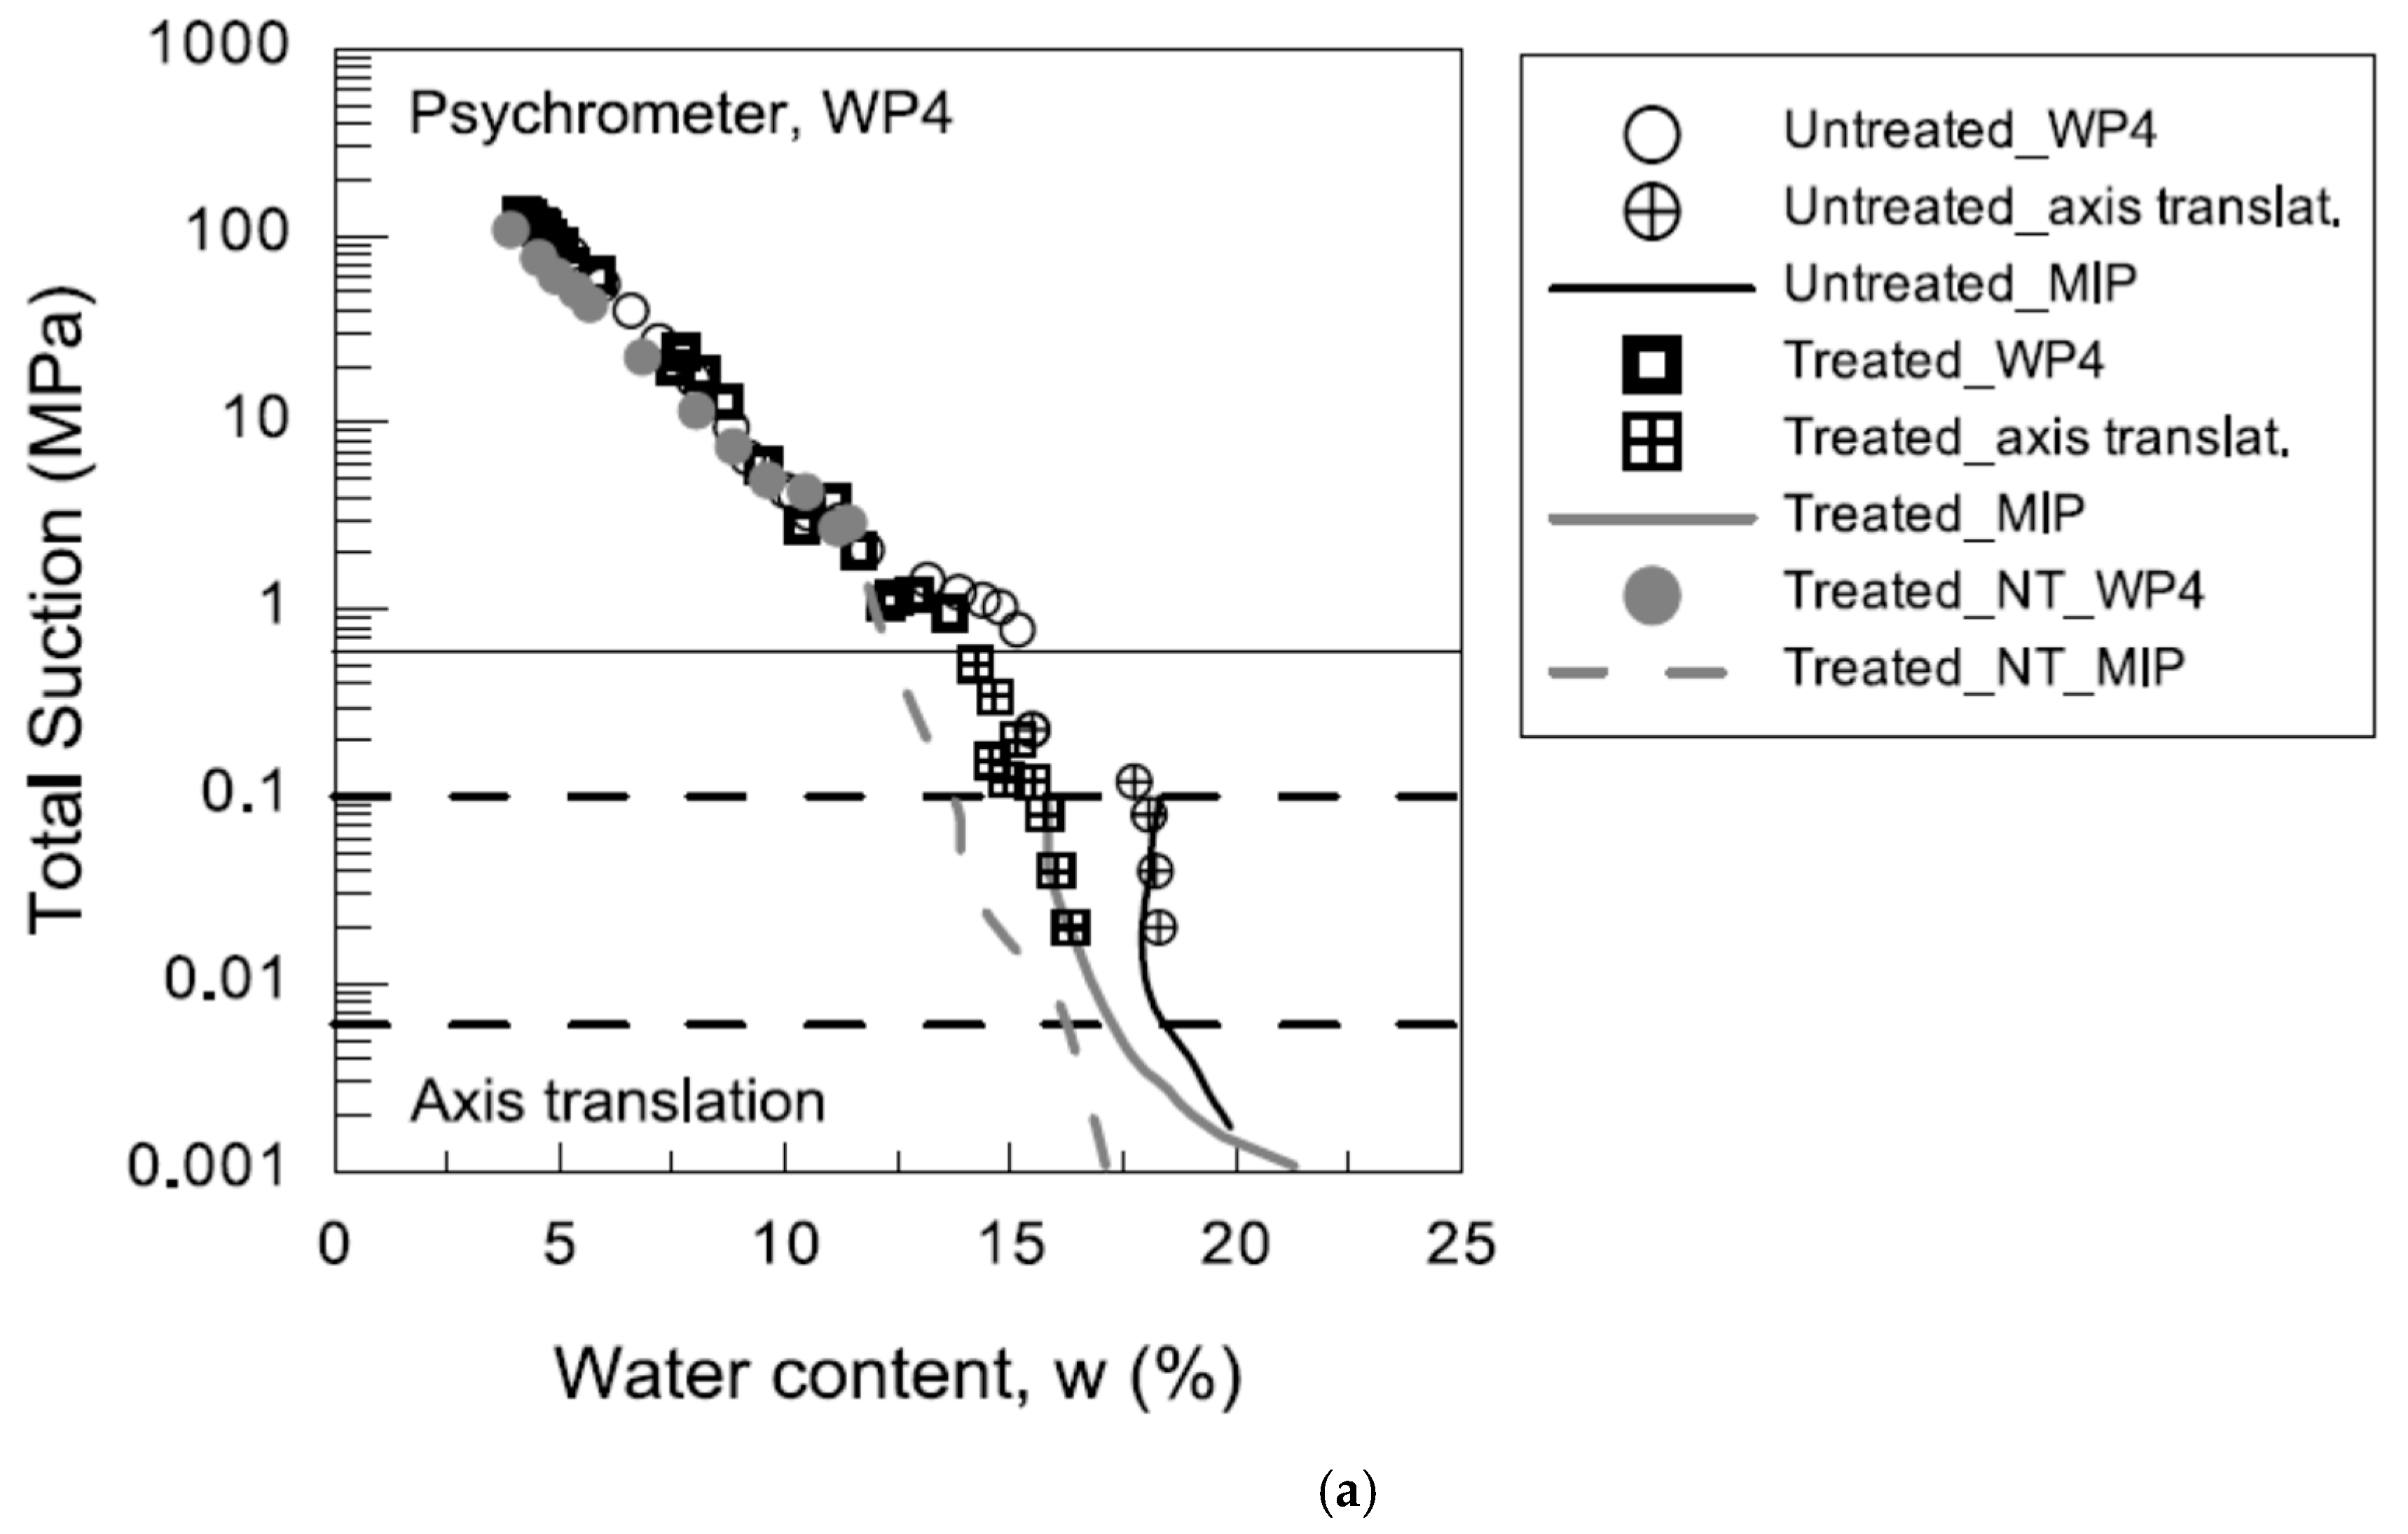
2.3.1. Water-Retention Curve

Water retention curve (WRC) was created by determination on drying by dew-point-psychrometer readings, starting from as-compacted conditions with water contents lower than 15%. Both treated and untreated samples were progressively air-dried, from an initial total suction around 1 MPa up to a maximum total suction of 100 MPa. The treated samples were compacted after microbiological treatment. The water-retention properties of two distinct samples were determined as part of the treated materials’ reported data. On the one hand, the WRC obtained from compacted sample was aged for 7 days (compaction before aging, Treated_NT). On the other hand, the WRC was obtained from the same soil after treatment with a different specimen-preparation protocol.
The WRC also included the suction obtained by axis-translation method for the untreated and treated soils. The matrix suction was calculated using the axis-translation technique along a drying path and under edometer conditions. Subject to a continuous vertical net tension of 50 kPa, compressed samples were wetted to a matrix suction of 20 kPa. Samples were gradually dried in phases up to a matrix suction of 200 kPa for the untreated material and up to 500 kPa for treated material after suction equalization.
To estimate the water-retention behavior during drying at extremely low suctions, mercury-porosimetry intrusion (MIP) data were also determined. The pore-size distribution of the frozen samples with their as-compacted water content was linked to these assimilation curves. Since the silt–clay sand did not significantly shrink as suction increased (void ratios were maintained between 0.45 and 0.50), these drying curves matched circumstances with more or less constant void ratios.

2.3.2. Mercury-Intrusion Permeability

Mercury-intrusion porosimetry (MIP) studies on freeze-dried samples were used to examine the microstructure characteristics of the treated and untreated NT soils in order to maintain the pore network. The cumulative and density-based pore-size distributions for the untreated sample identified as treated_NT-d0 immediately after preparation and for the treated_NT samples were estimated at different aging periods, while those for treated_NT-d2, treated_NT-d4, and treated_NT-d7 for two, four, and seven days’ aging, respectively, were derived from MIP data.

2.3.3. Bender Elements

Utilizing bender elements under no stress, the influence of the microbiological treatment on small-strain shear stiffness was assessed.
By measuring the shear-wave velocity, VS, the bender-elements test enabled continuous monitoring of the small-strain shear modulus G (in the vertical direction). The formula for calculating the small-strain shear modulus is G = tVs2, where t is the total density and Vs = leff/ts. The distance between the transducer tips was used to calculate the wave-travel distance (leff) [34]. By checking for the first substantial amplitude excursion in the received trace, the arrival time (ts) was obtained. In terms of the experimental setup, input signals were produced and transmitted using an Agilent (33220a 20 MHz) programmable function/arbitrary waveform generator, and both input and output signals were captured using an Agilent (DSO3062A) digital oscilloscope. Measurements of the bending elements were performed on cylindrical samples 50 mm in diameter and 20 mm high once every 24 h throughout the aging process.

2.3.4. Ultrasonic-Pulse-Velocity Test (Pundit)

The measurement of ultrasonic pulse velocity is a further non-destructive testing method, which is used to determine the ultrasonic pulse velocity through soil samples (ASTM D2845-08 standard). This is made possible by measuring the time required for an ultrasonic pulse to transit over a predetermined distance in a soil sample [35]. The information provided by the ultrasonic-pulse apparatus on the travel time of a longitudinal wave moving through a soil sample is of use when determining its Young’s modulus under unloading conditions with low strain. The James Instruments, Inc. ’V-Meter-II’ was the instrument employed. At each end of the soil sample, transducers were placed, and the travel time (tp) of a high-frequency (54 kHz) and high-voltage compression wave travelling parallel to the sample axis was calculated. Using this information, together with the compression wave’s travel length (l, sample height), it was possible to calculate the longitudinal wave velocity (VL), which was then used to estimate the unconfined Young’s modulus (E) using the following equations, where ρ is the total density [36,37].
V L = l t p
E = ρ · V L
The following formula was used to calculate the ultrasonic pulse velocity using the through-transmission technique:
P u l s e   v e l o c i t y   =   P a t h   l e n g t h T r a n s m i s s i o n   t i m e
In the through-transmission method, the path length is the distance in thickness of the soil sample between the transmitting and receiving transducers. The ultrasonic-pulse technique was used for studying the hardening rate of treated soil during aging process. The velocity of propagation of a pulse through the sample was measured and its increase as the soil aged indicated the hardening that occurred. Ultrasonic pulse velocity was used in treated samples with constant dry density and constant void ratio, but compacted with different humidity contents (7% and 15%).

2.3.5. Unconfined Compression Test

Bender-elements tests were complemented with unconfined compression tests (ASTM D2126) to evaluate the influence of the previous treatment on the evolution of the unconfined compression strength. For this reason, unconfined compression test was conducted on soil specimens according to rules in force, using samples with 38-mm diameters and 76-mm heights with water contents of w = 7% and w = 15%. They were subjected to compression after 0, 2, 4, and 7 days of aging. The compressive stress under which an unconfined cylindrical specimen of soil fails in a straightforward compression test is known as unconfined compressive strength (qu). The highest load achieved per unit area or the load per unit area at 15% axial strain, whichever occurs first during the execution of a test, is considered as the unconfined compressive strength in this test procedure. In this study, the values obtained were compared with those of the untreated samples.

2.3.6. Brazilian Test

The Brazilian test (Standard ASTM C496) is used to evaluate tensile strength. According to the standard, the nominal stress of rupture coincides with the tensile strength. The dimensions of the untreated and treated_NT samples were diameter of 50 mm and height of 20 mm. The test was carried out on samples with water contents of 7% and 15%.

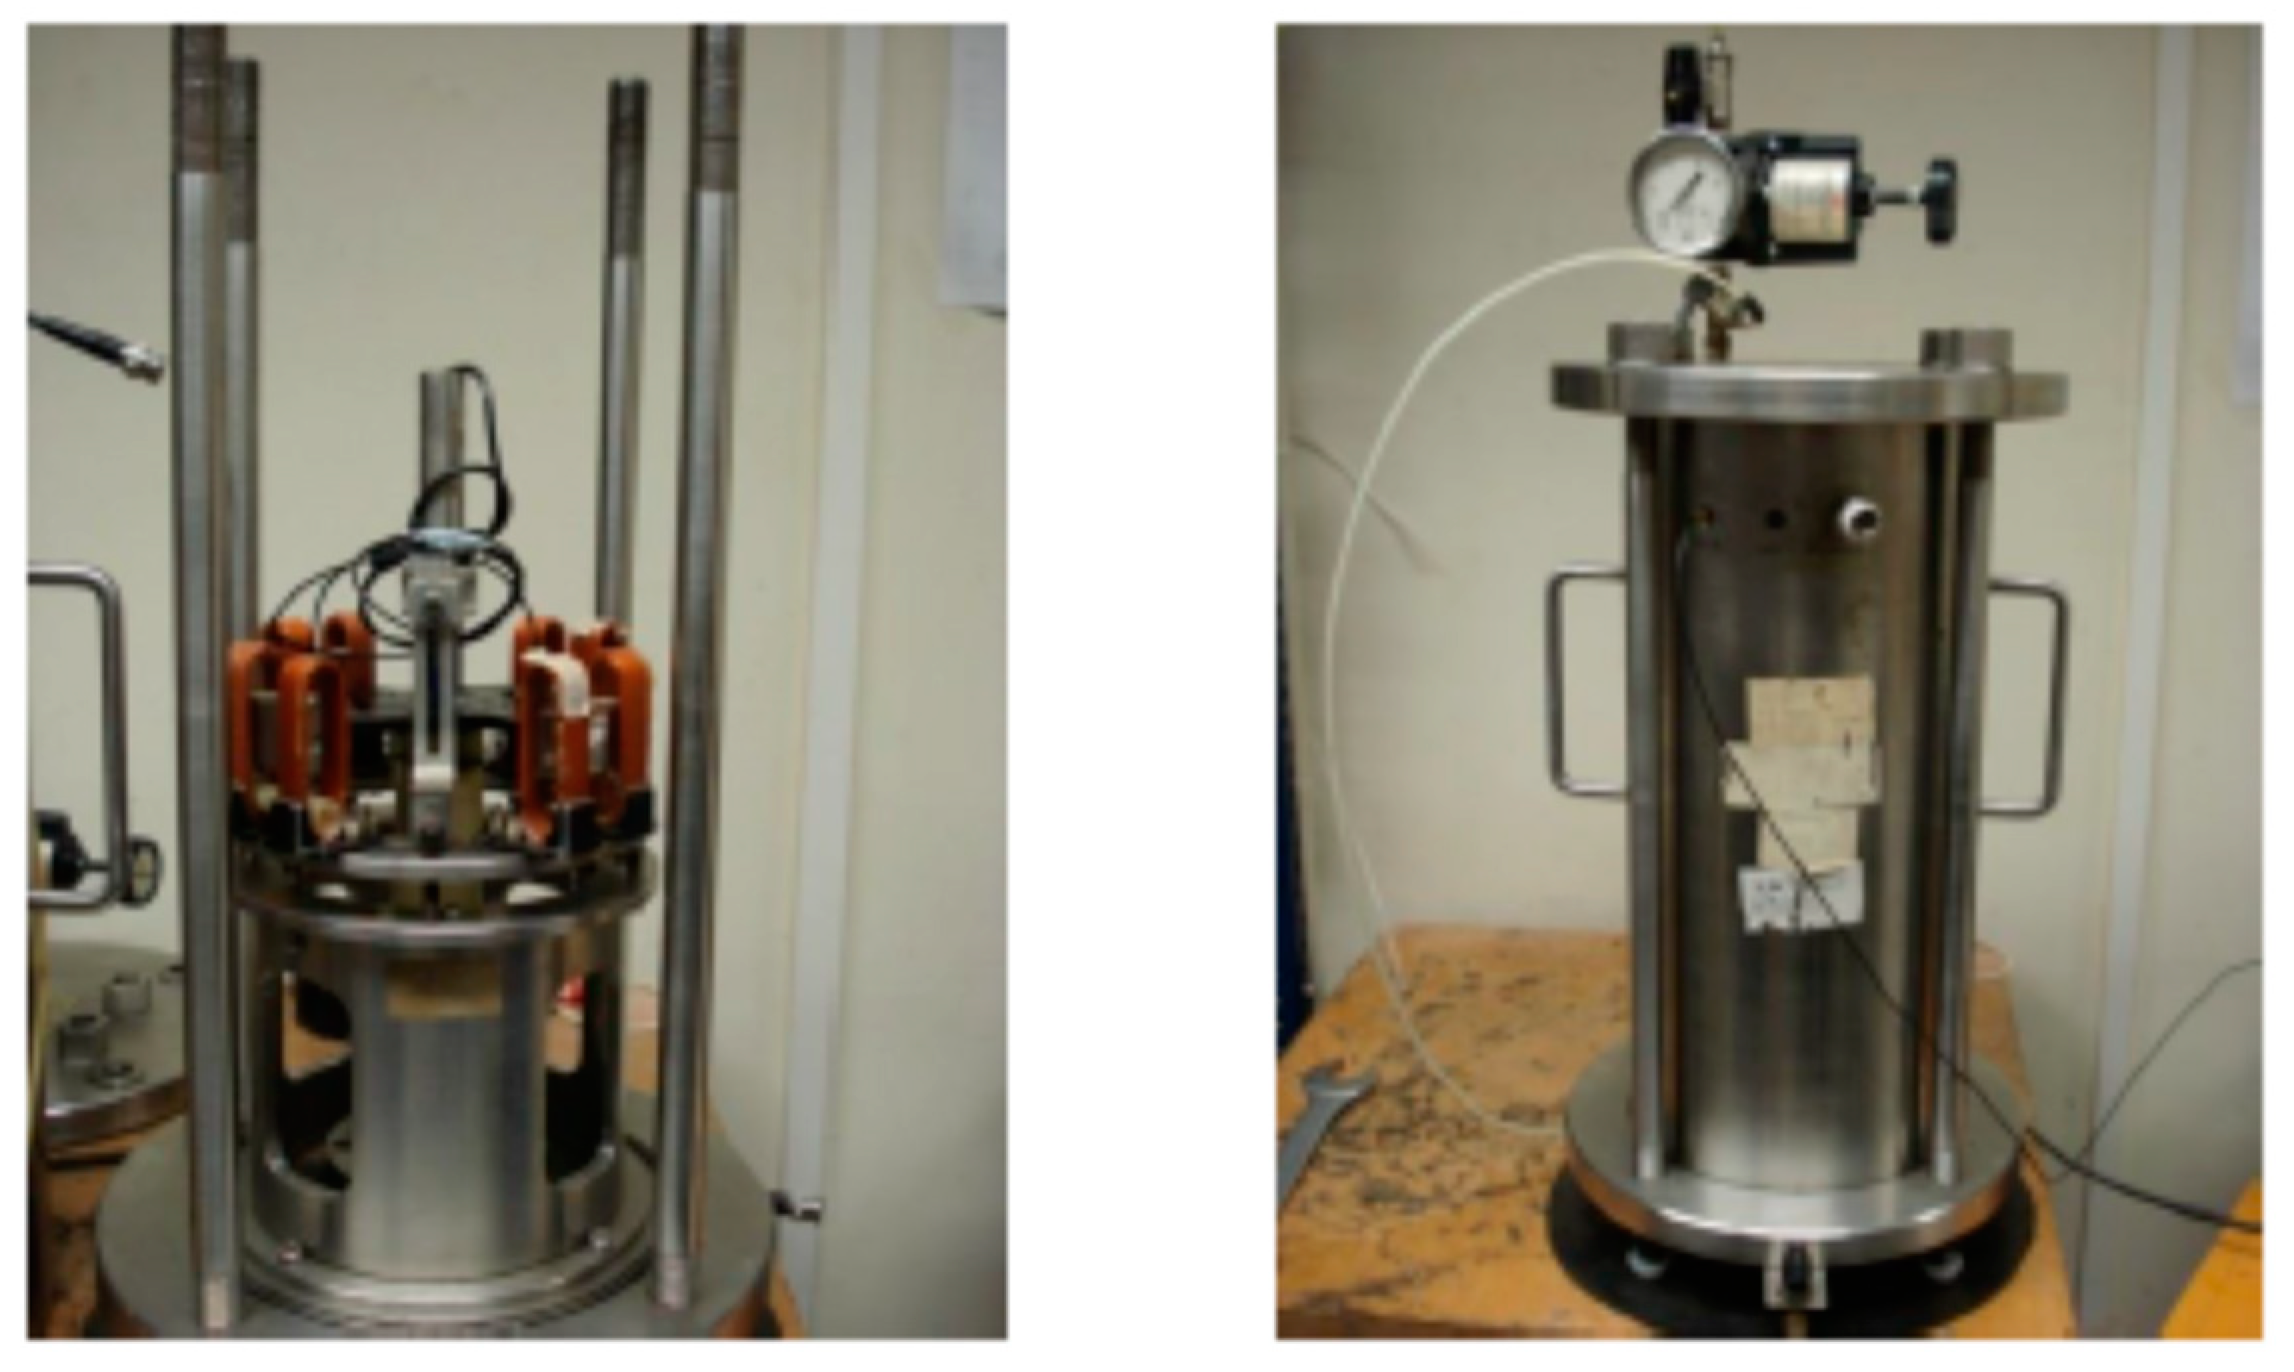
2.3.7. Resonant Column (RC)

The resonant-column test was carried out on untreated and treated samples. This experiment provides data on soils’ shear elastic moduli and damping characteristics at low strains, i.e., it is used to determine the shear modulus, G, and damping, λ, at required deformations, γ. The transmission’s shear-wave velocity through the soil, as given by Anderson and Stokoe [38], forms the basis of the resonant column. The equipment has three sensors: one for displacement, which measures the axial displacement of a sample during the test; a pressure sensor, to record the stress that is applied to the specimen in the stages prior to the test (confining pressure) and to determine the pore pressure generated in the test phase; and an accelerometer, which measures the acceleration of the moving system (Figure 2). In this study, the assay was performed in a cylindrical specimen 36 mm in diameter and 78 mm in height. The top cap and the torsional drive plate were both firmly fastened to the top of the specimen, while the bottom of the specimen sat on a rough, rigidly fixed surface. The driving plate was able to spin freely during RC testing in order to provide torsional excitation at the top end of the soil specimen.
Both samples were subjected to multistage experiments under various confining stresses, in accordance with the ASTM D4015-07 procedure. As soon as the electric driving mechanism was connected and the external chamber was sealed (Figure 2), the sample was loaded isotropically under a total stress of 0.1 MPa, and the frequency of excitation was varied up to the point of resonance. The total stress was then increased to 0.3 MPa to conduct the second set of resonant-column measurements.
Using the following equation [39], the low-strain shear modulus (G) can be calculated from the resonant frequency (fn):
G = 4 · π 2 · L 2 · ρ · f n 2 α 2
where L is the length of the soil sample, ρ is the soil’s density, and α is a dimensionless frequency factor. Further information is described by Suriol [40].

3. Results and Discussion

3.1. Mineralogical Characterization, Scanning-Electron Microscopy (SEM), and Optical Microscopy

In this investigation, SEM with chemical analysis by EDS was carried out along with MIP tests on freeze-dried samples to preserve the pore network to examine the microstructural characteristics of untreated and treated soils. The EDS analyses of the unaltered soil revealed that silicon and aluminum dominated the quartz, albite, and microcline mineral phases. Calcium was also detected in the treated soil, where it was associated with CaCO3 polymorphs (primarily amorphous structures and calcite crystals detected via the SEM technique).
In the photomicrograph provided by the SEM (Figure 3a), crystalline growth in the area located around the microorganism (the cell membrane) was observed as a result of the supersaturation of the carbonate and the alkalinization of the medium. The nucleation points for the subsequent carbonate precipitation were calcified microorganisms.
The samples were examined using qualitative EDS analyses of the SEM images (Figure 3b,c), which showed the presence of carbon, oxygen, and calcium at significant levels, confirming the emergence of CaCO3 crystals in the microbiologically treated soil. Different precipitated structures were identified (such as the calcite crystal encircled by a white circle in Figure 3b). Their distribution between the soil grains and their filling of large inter-grain pores are shown by the white arrow in Figure 3c. These micrographs were taken on the treated material, which was not compacted.
Figure 4 also illustrates how the CaCO3 formed precipitates in the pore space, as revealed by the SEM. In Figure 4a the CaCO3 aggregate located on the sample can be observed. Figure 4b shows in detail the aggregate, composed of different carbonated structures. The corresponding EDS analyses confirmed the formation of CaCO3. A detailed SEM study was previously reported [41].
Figure 5 shows a crystal of calcium carbonate with a rhombohedral shape on the soil grain. Figure 5a shows the crystal at a magnification of 350×, and Figure 5b also presents the identified crystal at a magnification of 2000×.
The used bacteria are presented in Figure 6. Figure 6a shows an image obtained with the optical microscope, in which it is possible to identify the microorganisms and their distribution. This aids in the interpretation of the photomicrograph obtained by SEM, in Figure 6b, which shows the microorganisms distributed on the surface of the soil particle. The carbonates grew on the bacteria membranes, which were located in the pore spaces or on the grain surfaces.
Figure 7 shows structures of calcium carbonate detected with optical microscopy. Figure 7a is a micrograph of a soil grain with CaCO3 crystals and Figure 7b shows one of these structures.
Figure 8 shows a carbonated structure identified by two techniques. Figure 8a shows the micrograph obtained by the SEM and Figure 8b shows the image obtained by the optical microscopy.
It should be noted that optical microscopy was applied very scarcely in previous studies concerning MICP [25,26,27,28,29,30]. Thus, the present study shows that this technique can be complementary to SEM (Figure 6, Figure 7 and Figure 8).
In contrast, Verma et al. [30] reported that a diversity of microorganisms are utilized in the MICP process, such as Proteus vulgaris, Sporosarcina pasteurii, Helicobacter pylori, and more. Similarly, Iqbal et al. [27] reviewed the effects of bacterial treatment on MICP. In the present study, a microorganism of the Bacillaceae family (Figure 6) under natural urea content was selected, following a previous investigation concerning how compacted soils stabilize their microstructures and hydro-mechanical behaviours [33]. It should be noted that MICP occurs at the site of bacterial-cell nucleation or calcium-carbonate precipitation, which is associated with an increase in alkalinity originated by ureolysis, as reviewed by several authors [26,27,28,30].
In a very recent study, Wu et al. [31] considered a novel 3D DEM (discrete element model) of biocemented sand with fines as cementing agents. Thus, it was a quantitative study designed to reproduce the different precipitation patterns in sand treated by MICP through an analysis of the microstructural characteristics and how they changed under external loading. In the present study, the main microstructural features were revealed by SEM (Figure 3, Figure 4 and Figure 5), showing different morphologies of precipitated structures produced under specific experimental conditions, which influence the geotechnical properties. However, the deep analysis of this subject is a matter for future studies.

3.2. Study of Aging Effects

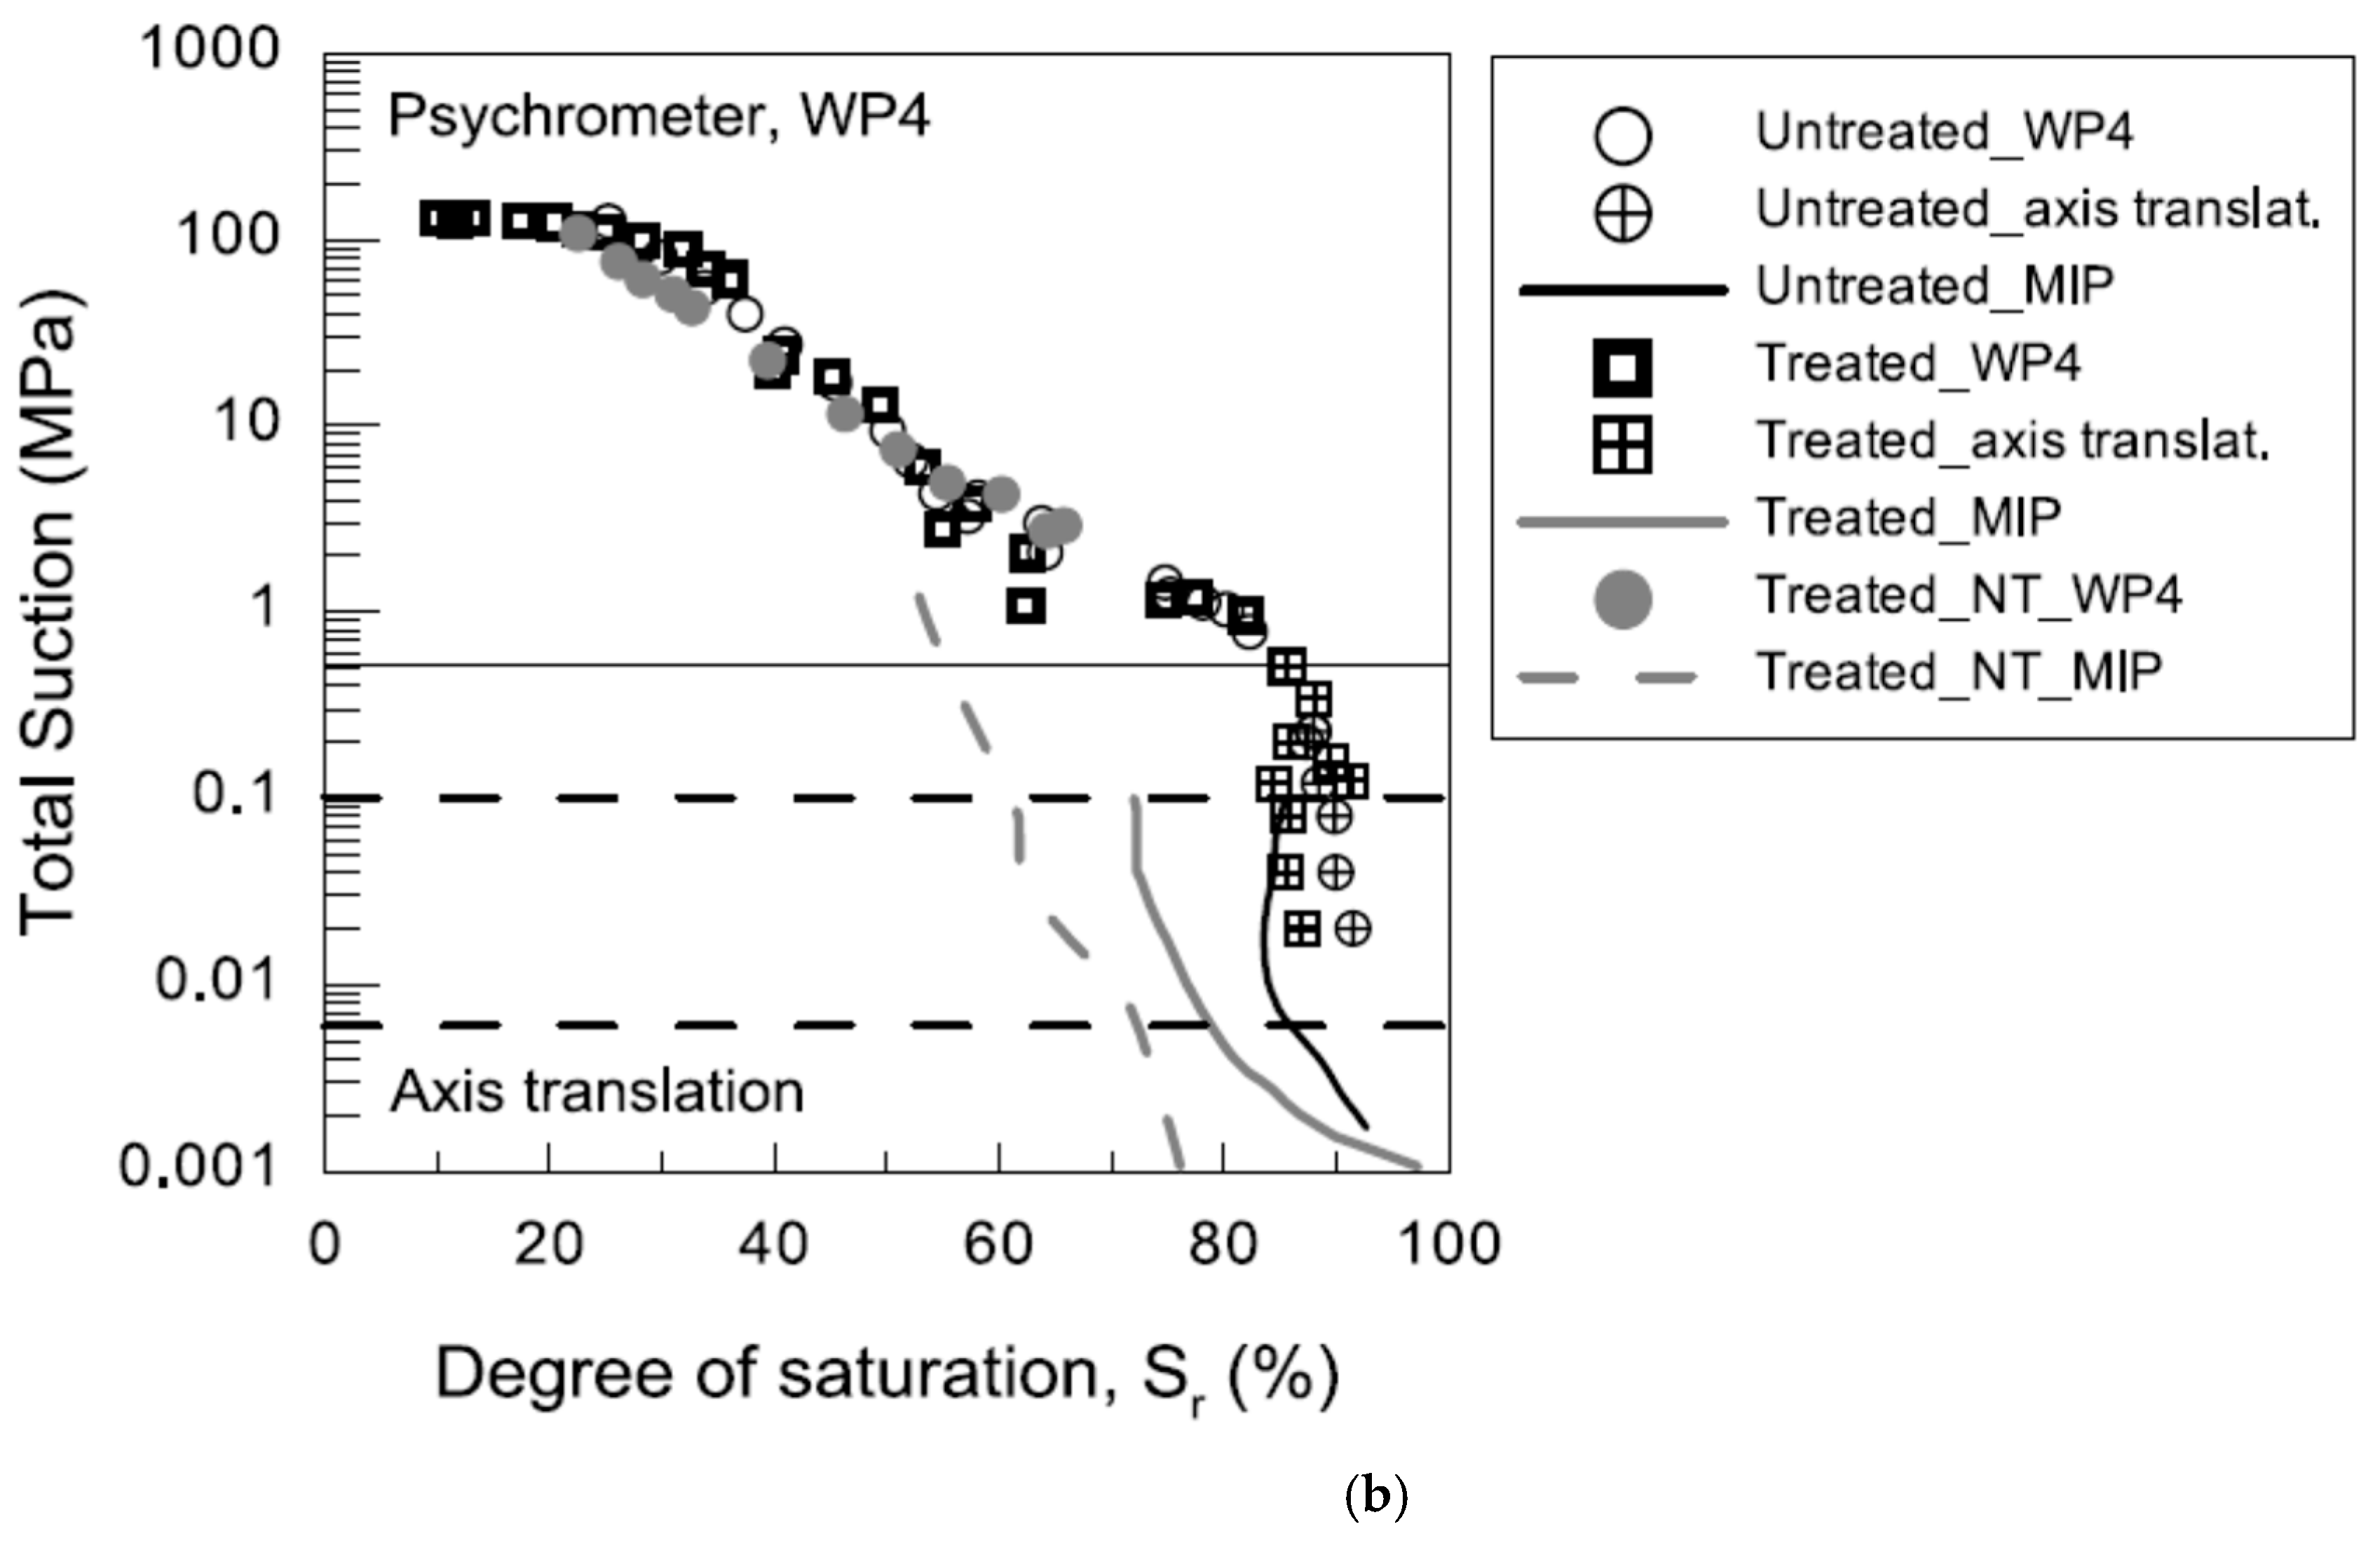
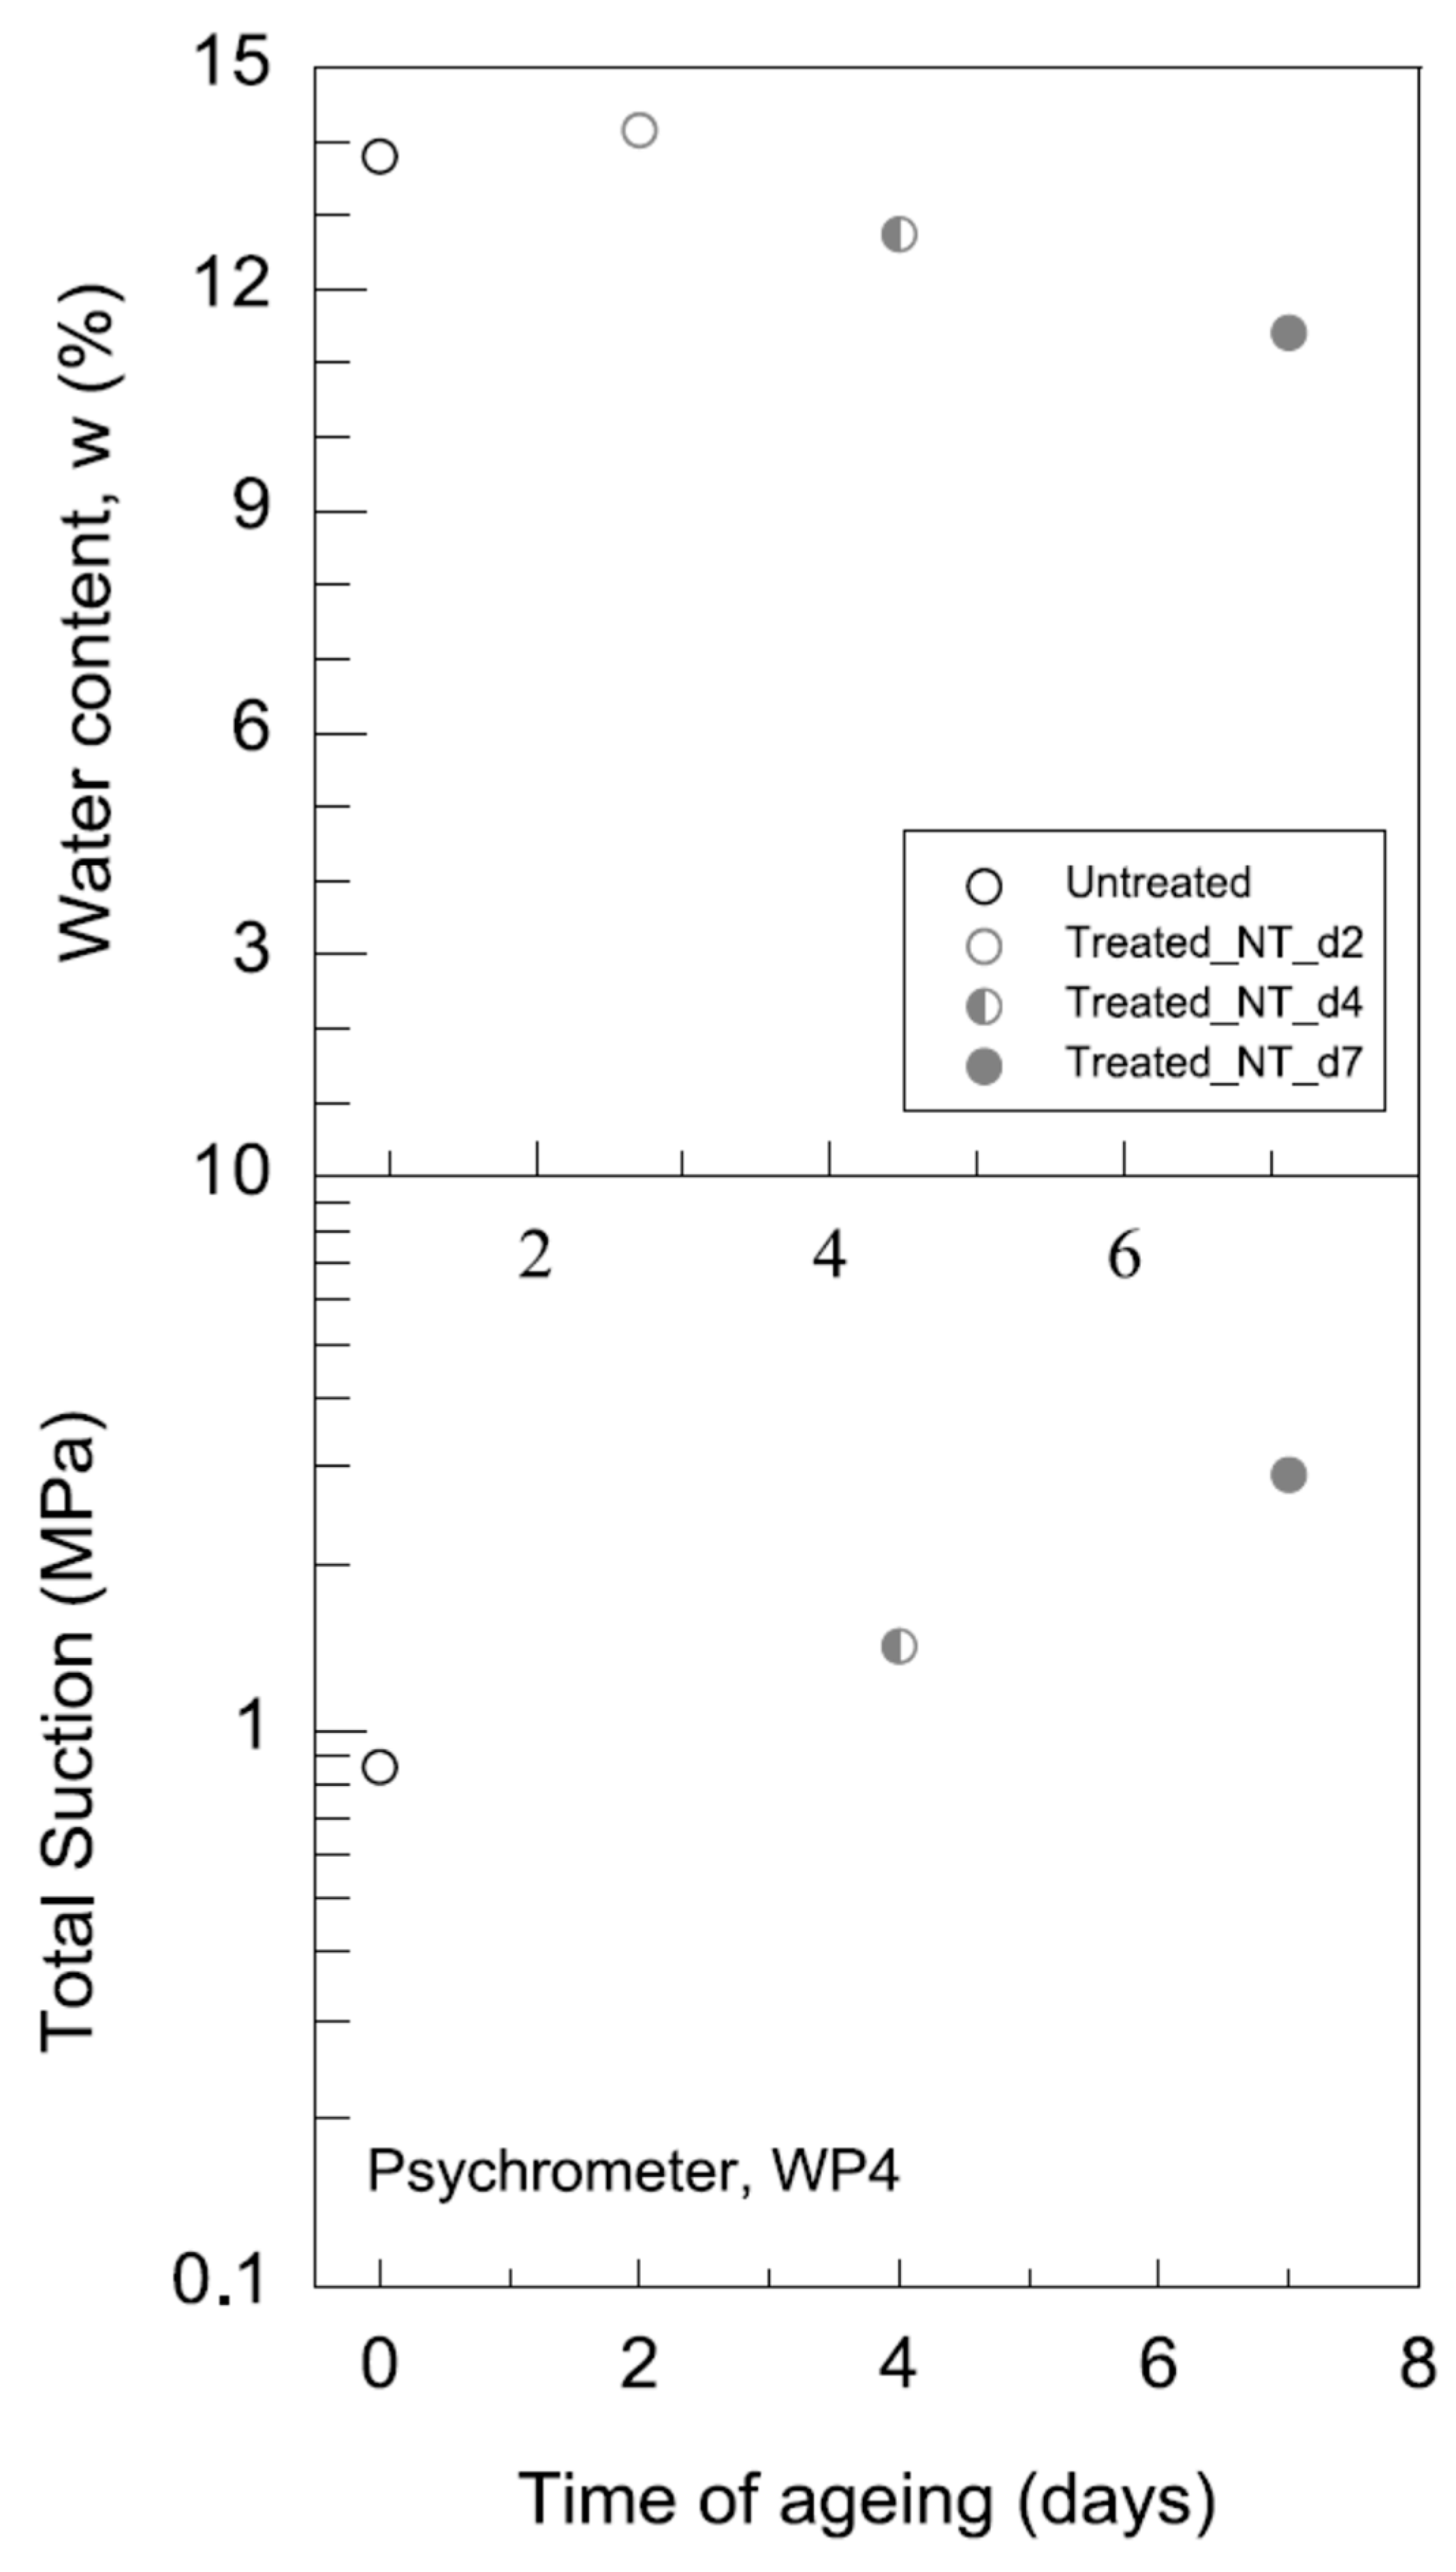
3.2.1. Water-Retention Curve (WRC)

Figure 9 shows the WRC for the untreated, treated, and treated_NT specimens. In Figure 9a, the total suction vs. the water content for the different studied soils is plotted. The specimens tended to coincide in the high suction range. This high suction range was mainly dominated by the adsorption mechanism inside the aggregations and was associated with the particular specific surface area of the material, as proposed by Romero et al. [42]. The microbiological treatment did not reflect a significant change in the specific surface (Table 1), and the coincidence of three water-retention curves is consistent with this fact.
The overall comparison in the low-matrix-suction range, obtained using the axis-translation technique, indicates that the water-retention domain of the untreated and treated soils differed primarily in the suction range of 0.006 to 0.1 MPa—as shown by the horizontal dashed lines in the figure—with the treated soil exhibiting a lower water-retention capacity in this suction range due to bioclogging effects.
The MIP data are also included in Figure 10 to provide an estimation of the water-retention behaviour under drying at very low suction levels. The treated and treated_NT samples underwent significant water-content reduction under very low matrix-suction levels (below 6 kPa) as a consequence of the desaturation of the dominant pore volume, at an entrance-pore size of around 200 µm. This trend can be seen best in Figure 10, which shows the total suction vs. the degree of saturation.
The total suction for different days of curing (0, 4, and 7) in Figure 10 is related to its water-content variation during the aging process. Some water-content reduction was observed in the untreated and treated_NT samples, and it was induced by evaporation when the aging process was followed. Therefore, as the water content decreased, the suction effect increased.
Due to this water-content loss, the changes to the suction induced an increase in the soil stiffness. This fact suggests that the effects of the microbiological treatment in the soil stiffness were masked. Additional details were reported by Morales et al. [43].
Gallipoli et al. [44] illustrated how suction has a dual impact on the mechanical characteristics of unsaturated soil. Firstly, it alters the stress of the skeleton by modifying the average fluid pressure that operates in the soil pores. Secondly, it generates an additional bonding force on the particle contacts, which is frequently linked to the capillary phenomena that occur in the water menisci.
The impact of suction on the two mechanisms is contingent upon the saturation level of the soil. The extent to which water and air pressures exert their influence is directly proportional to the degree of saturation, which is defined as the percentage of pore voids that are filled with water. However, this same parameter also affects the quantity and strength of capillary-induced inter-particle forces. This fact explains why some of the essays presented in this paper were performed on samples compacted with different water contents and, hence, different degrees of saturation. Therefore, if the impact of suction on the stiffness of untreated soil is accurately determined, the changes that occur in treated soils are direct results of the microbiological treatment minus the effect of the suction.

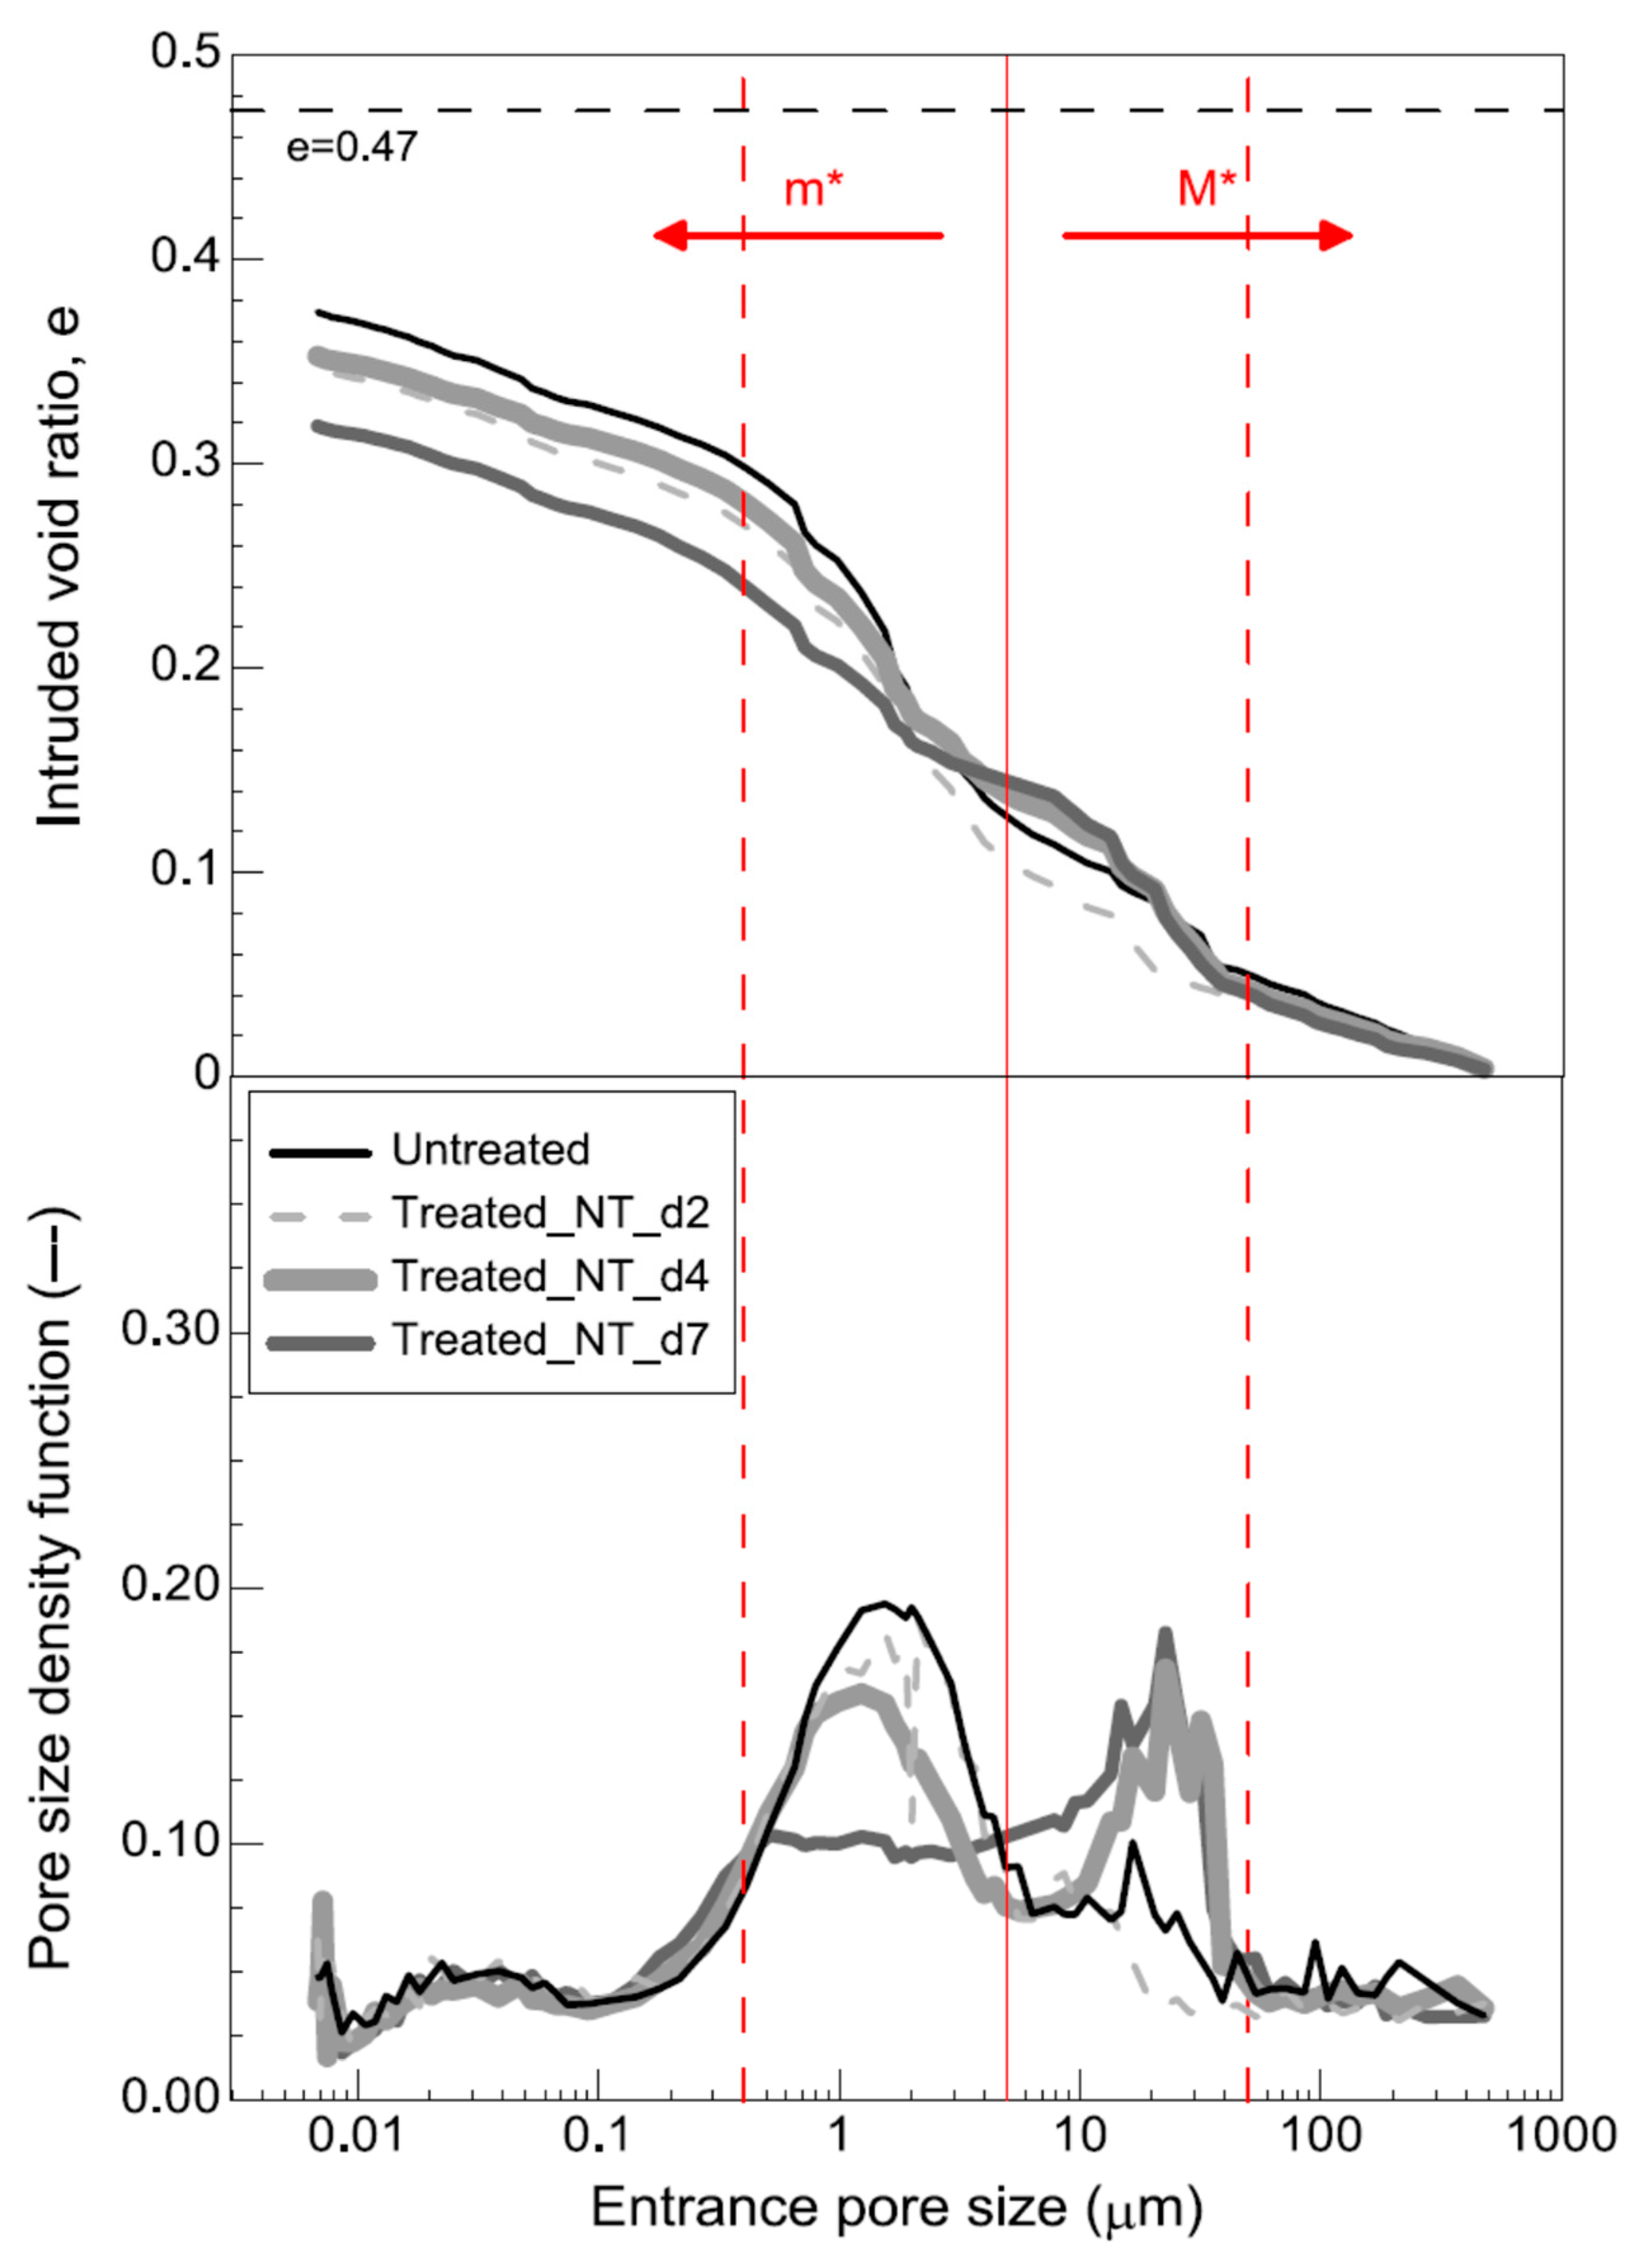
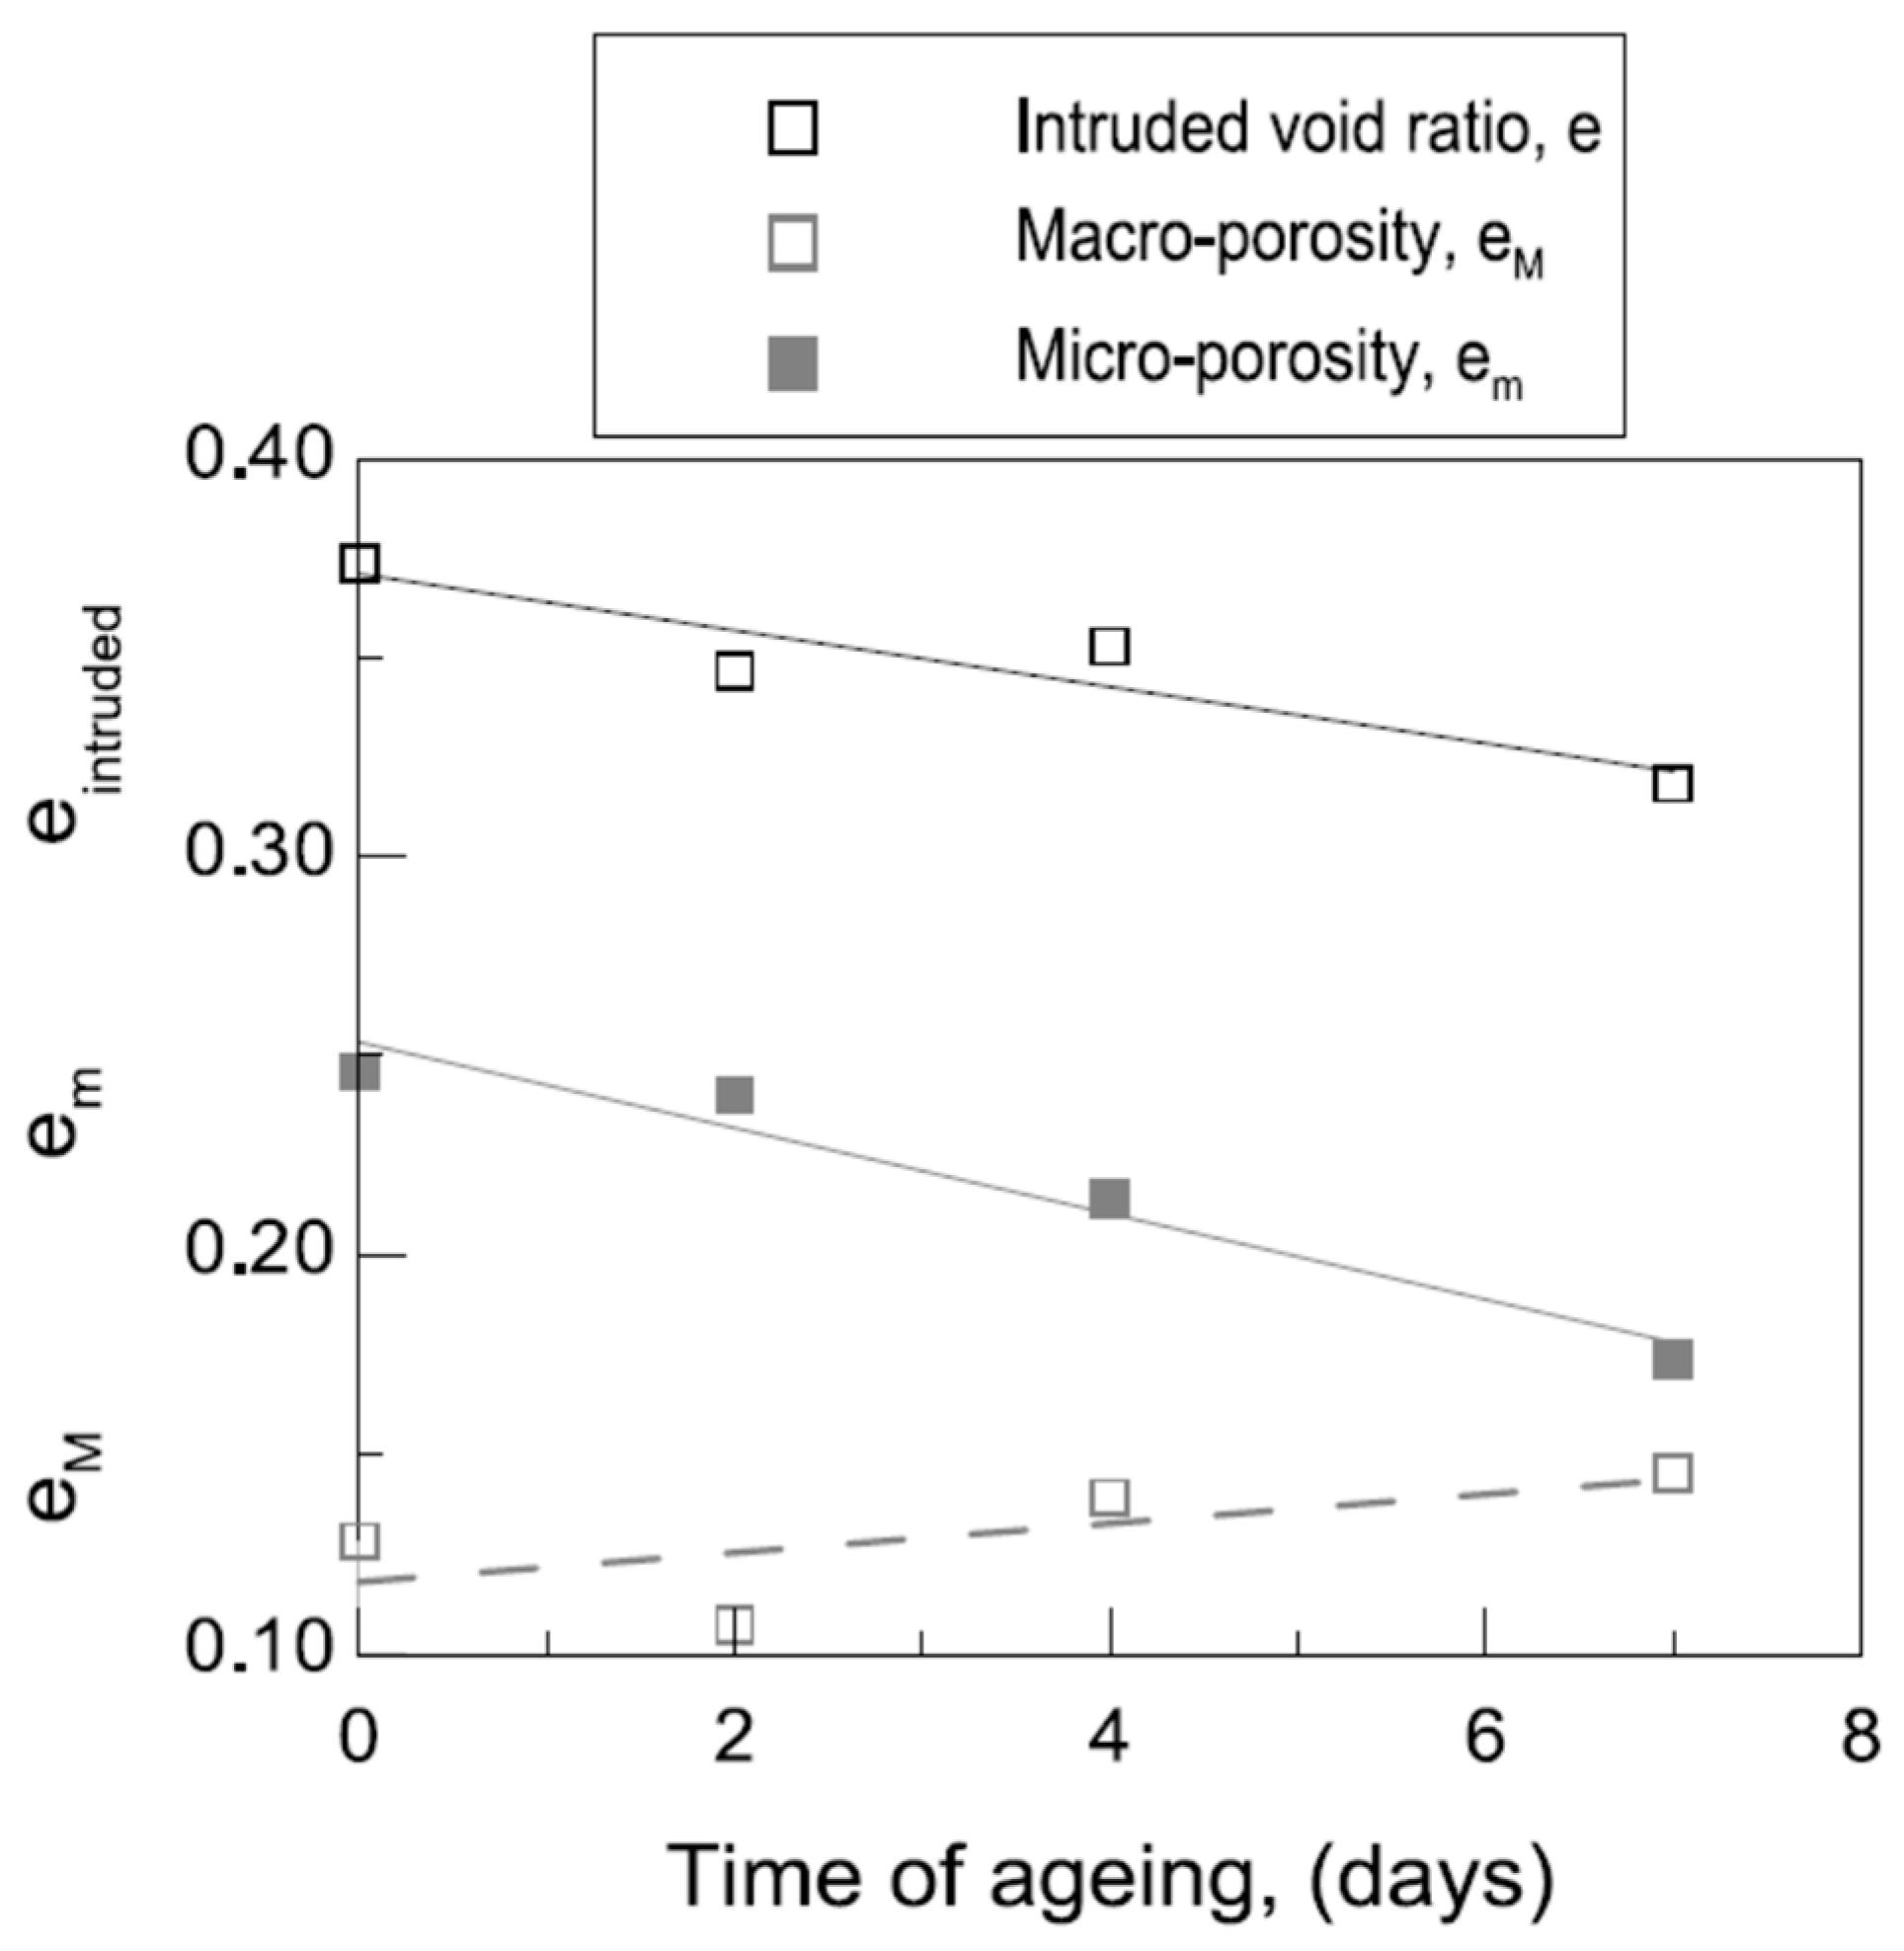
3.2.2. Mercury-Intrusion Permeability

The cumulative and density-pore-size distributions for the different samples are reported in Figure 11. The function of pore-size density establishes a correlation between the log differential-intrusion curve and the corresponding pore size, thereby facilitating the identification of the prevailing pore modes through visual means. The topmost section of Figure 11 depicts the cumulative distributions of the intruded void ratio plotted against entrance-pore size, solely incorporating the mercury-intrusion branch. The method utilized in this study yielded maximum void ratios that were marginally lower than the void ratio of the untreated material when compacted (e = 0.47, as denoted by the dashed horizontal line). Differences manifested as a result of the absence of intrusive porosity for the pores with dimensions of less than 3 nm and the absence of detectable porosity for the pores with dimensions greater than 400 µm.
The plot is divided into two parts by a vertical solid line that indicates the established limit between the micro- (m*) and macro-structures (M*), located at 5 µm. According to the MIP curves, it can be observed that there were two invariable regions, ranging from 0.003 to 0.4 µm and from 50 to 400 µm. The area corresponding to the microstructure ranging from 0.4 to 5 µm, indicated by the vertical dashed line, shows considerable volume reductions during the soil aging. By contrast, the area ranging from 5 to 50 µm increased in a systematic way during the curing process.
This variation in the pore-size distribution can be explained by the fact that two processes took place. The first aligns with the notion that calcified bacteria, which measure approximately 1–3 µm in size, necessitate a crucial space. During the soil aging, bacteria were distributed throughout the sample and grew to occupy the pore spaces—clogging them—and, also in addition, the bacteria acted as cement materials, cementing the soil particles. The bacterial activity consumed the water in the hydrolysis of the urea and in other intermediate reactions in order to precipitate the calcium carbonate. This fact resulted in a retraction of the microstructure. There was a zone in the microstructure in which the pore-filling effect—clogging—was observed with greater clarity, which corresponded approximately to the size of the bacteria and/or the living space they required. Therefore, in this region, the entrance-pore size had a higher reduction as a consequence of the bacterium growth, calcium-carbonate precipitation, and microstructure retraction. This microstructure retraction caused a displacement in the rest of the structure, but the macropores had difficulty in changing volume because the particles were sealed by the action of the microorganisms. Therefore, in this area, it was easier to determine the cementing effect of the microorganisms.
The size of the pore space in soils has been a topic of recent discussion regarding its significance and its constraining role in MICP [30]. The pore space between particles must be adequate to facilitate unrestricted microbial mobility. Thus, the techniques used in this study are appropriate for soil and sand with large particle sizes (and, potentially, for solidification through the employment of a sand column). In the context of clays, the utilization of precipitating agents serves to mitigate soil dispersibility by reducing the thickness of the double layer, thereby diminishing the soil’s susceptibility to erosion. For instance, Valencia-Galindo et al. [29] used calcium chloride as a precipitating agent in their study of MICP in a soil containing expansive clays and sandy silts.
Figure 12 shows the micro-, em, and macro-porosity, eM, evolution during the aging process, with respect to the intruded void ratio, e. The data presented are those obtained at different aging times, specifically for days 0, 2, 4, and 7. In general, a reduction in the intruded pore volume during the curing of the sample was observed, probably as a result of the calcium-carbonate precipitation. Similarly, the pore volume of the micro- decreased because of the three processes described above. This trend was reversed in the macro- because it could not be retracted due to the effect of the precipitation of the calcium carbonate in the area of contact between the particles and therefore, the volume increased.
Verma et al. (2017) noted that “bio-clogging” refers to the filling of pore spaces through the formation of calcium carbonate, whereas “bio-cementation” involves the reinforcement of soil strength by augmenting the bond strength between soil particles through preferential calcite precipitation upon particle–particle contact. These observations are consistent with the SEM results presented in Figure 3, Figure 4 and Figure 5. The precipitation of the calcium-carbonate took place in the contact area between the particles (biocementation) and in the pore spaces (bioclogging).
On the other hand, Iqbal et al. [27] reported that it is possible to produce “bio-bricks” from materials including clay, fibers, and sand using multiple MICP treatments. Using a SEM study, they found spherulitic and rhomboedral crystals [27]. Next, the presence of two polymorphs of calcium carbonate (mineral crystalline phases, known as vaterite and calcite) was evidenced, and was confirmed by a phase analysis using X-ray diffraction. Yu et al. [28] emphasized that microscopic images (e.g., SEM; see Section 3.1) contribute to the visualization of the microstructures of MICP-treated soils. Thus, two factors are important to explain the differences in macroscopic engineering properties: (a) the distribution of calcium-carbonate crystals, and (b) their characteristics.

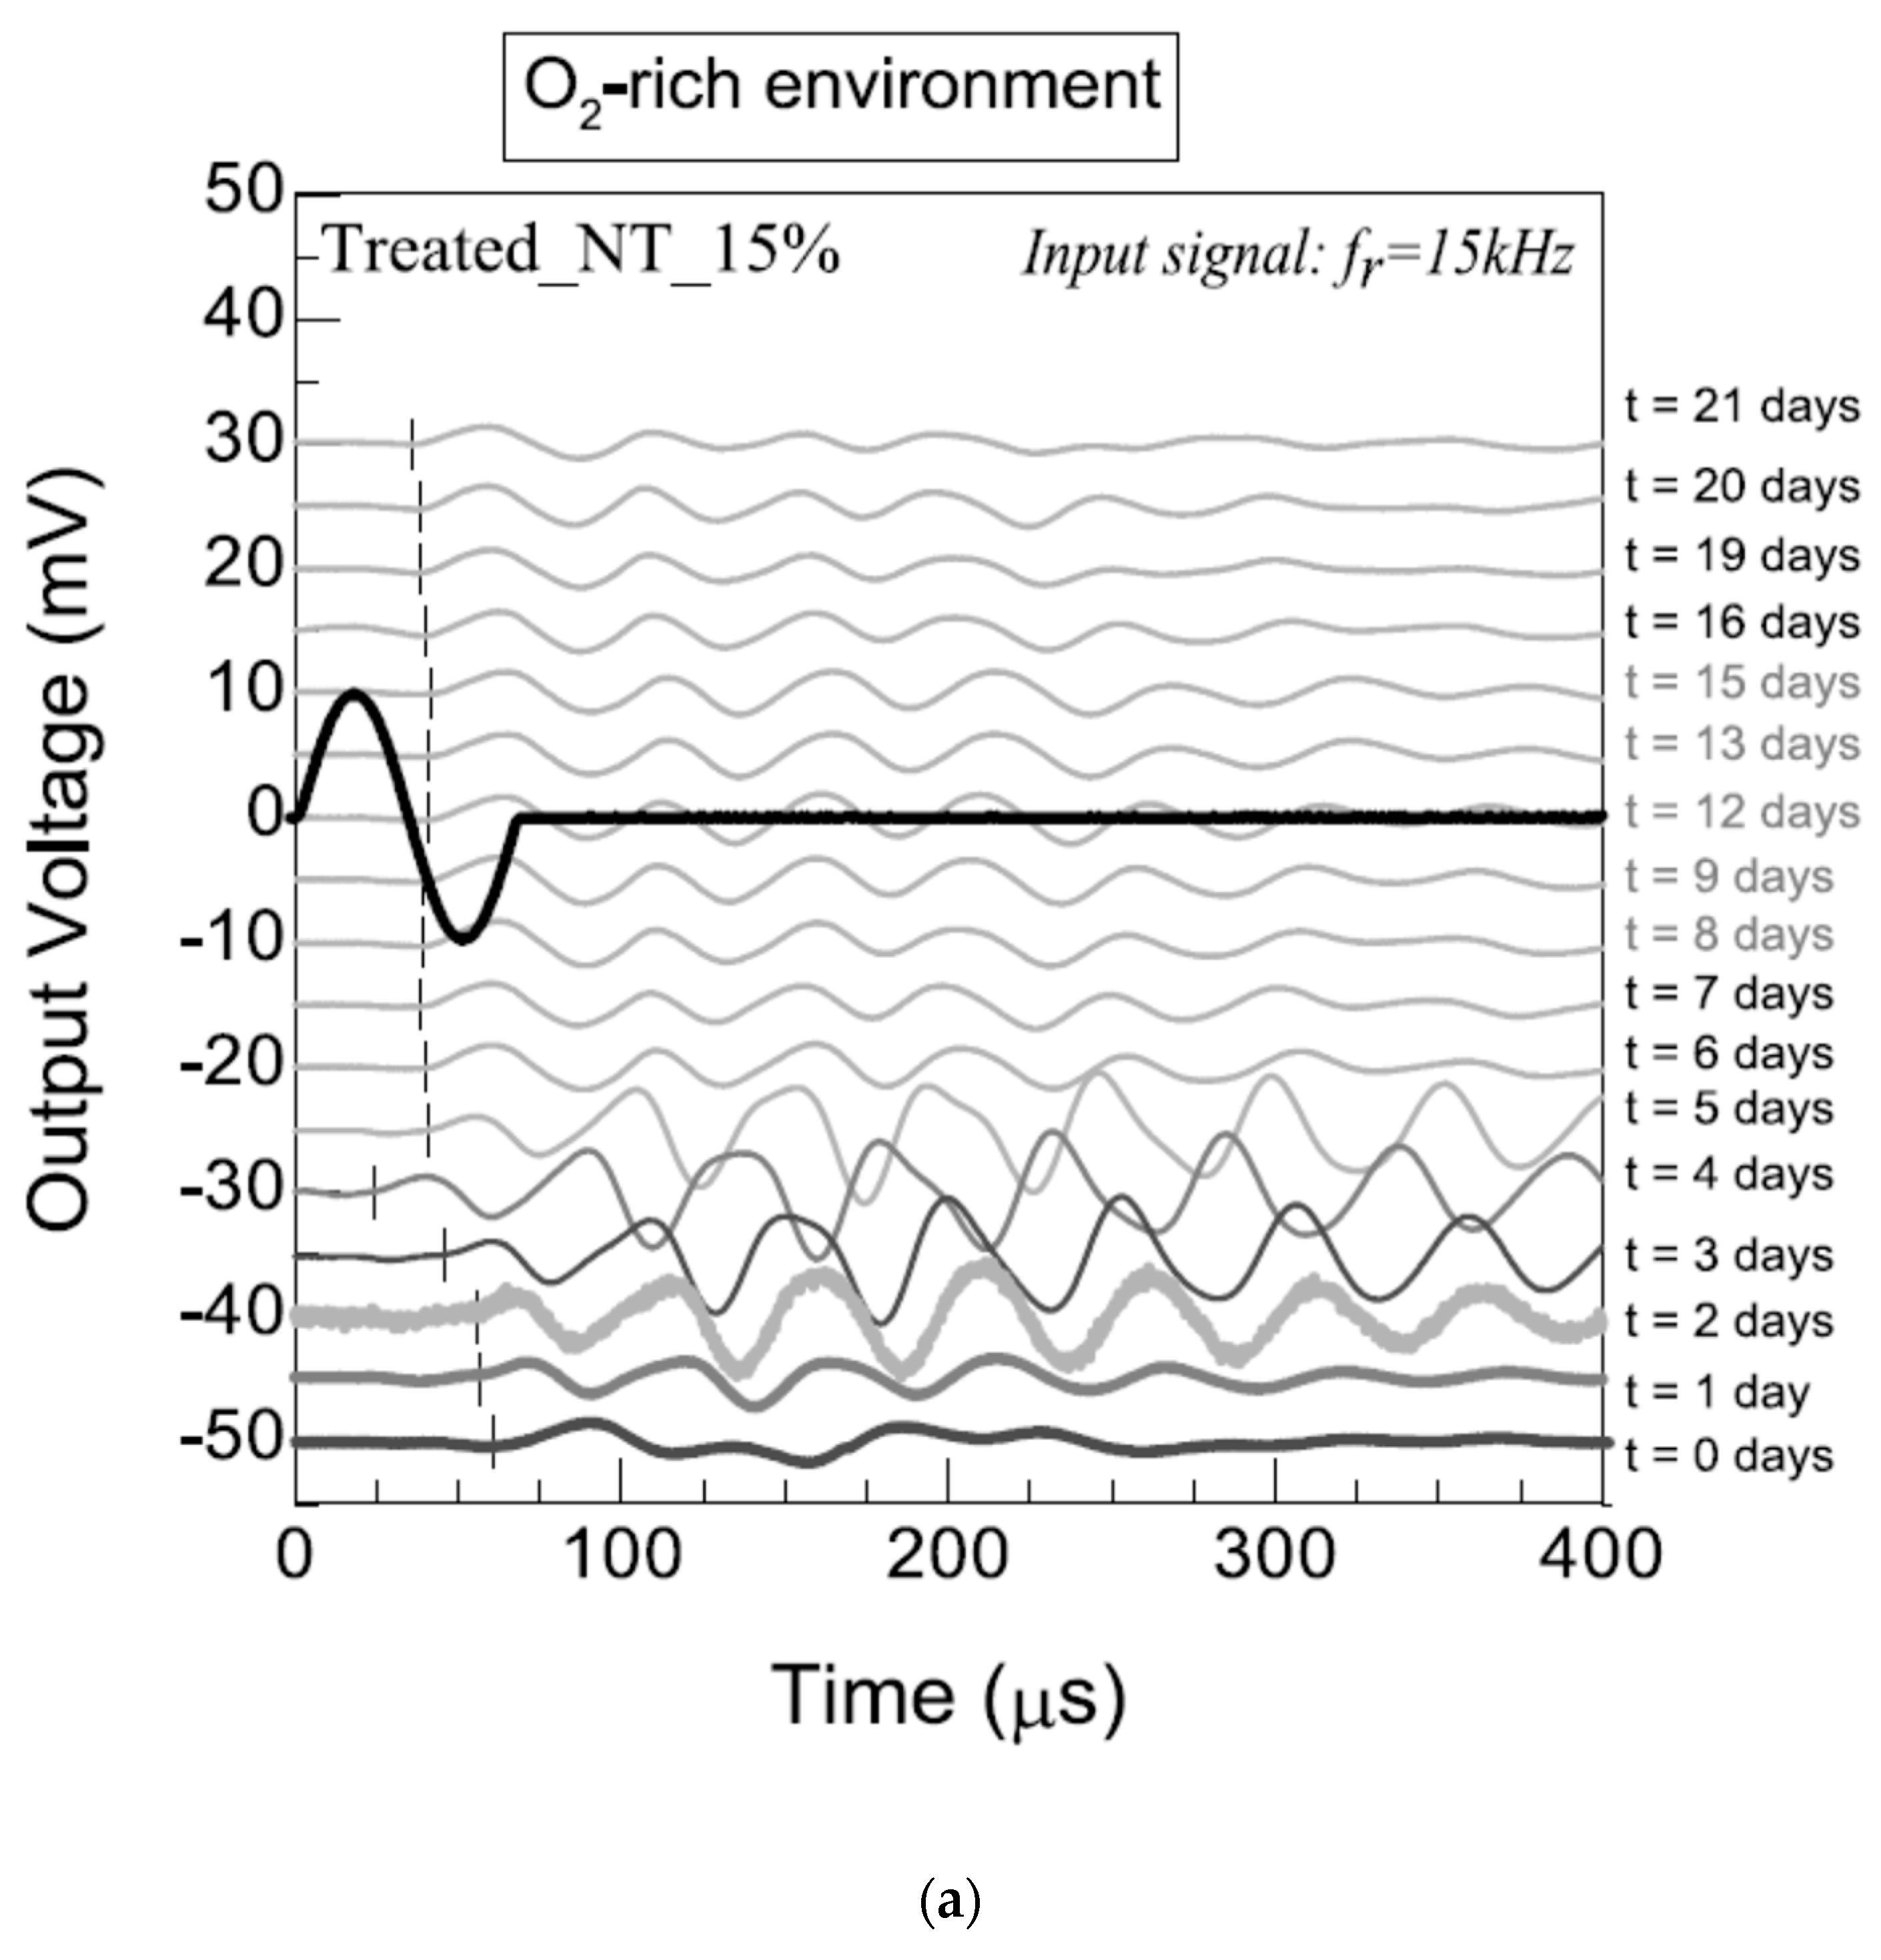
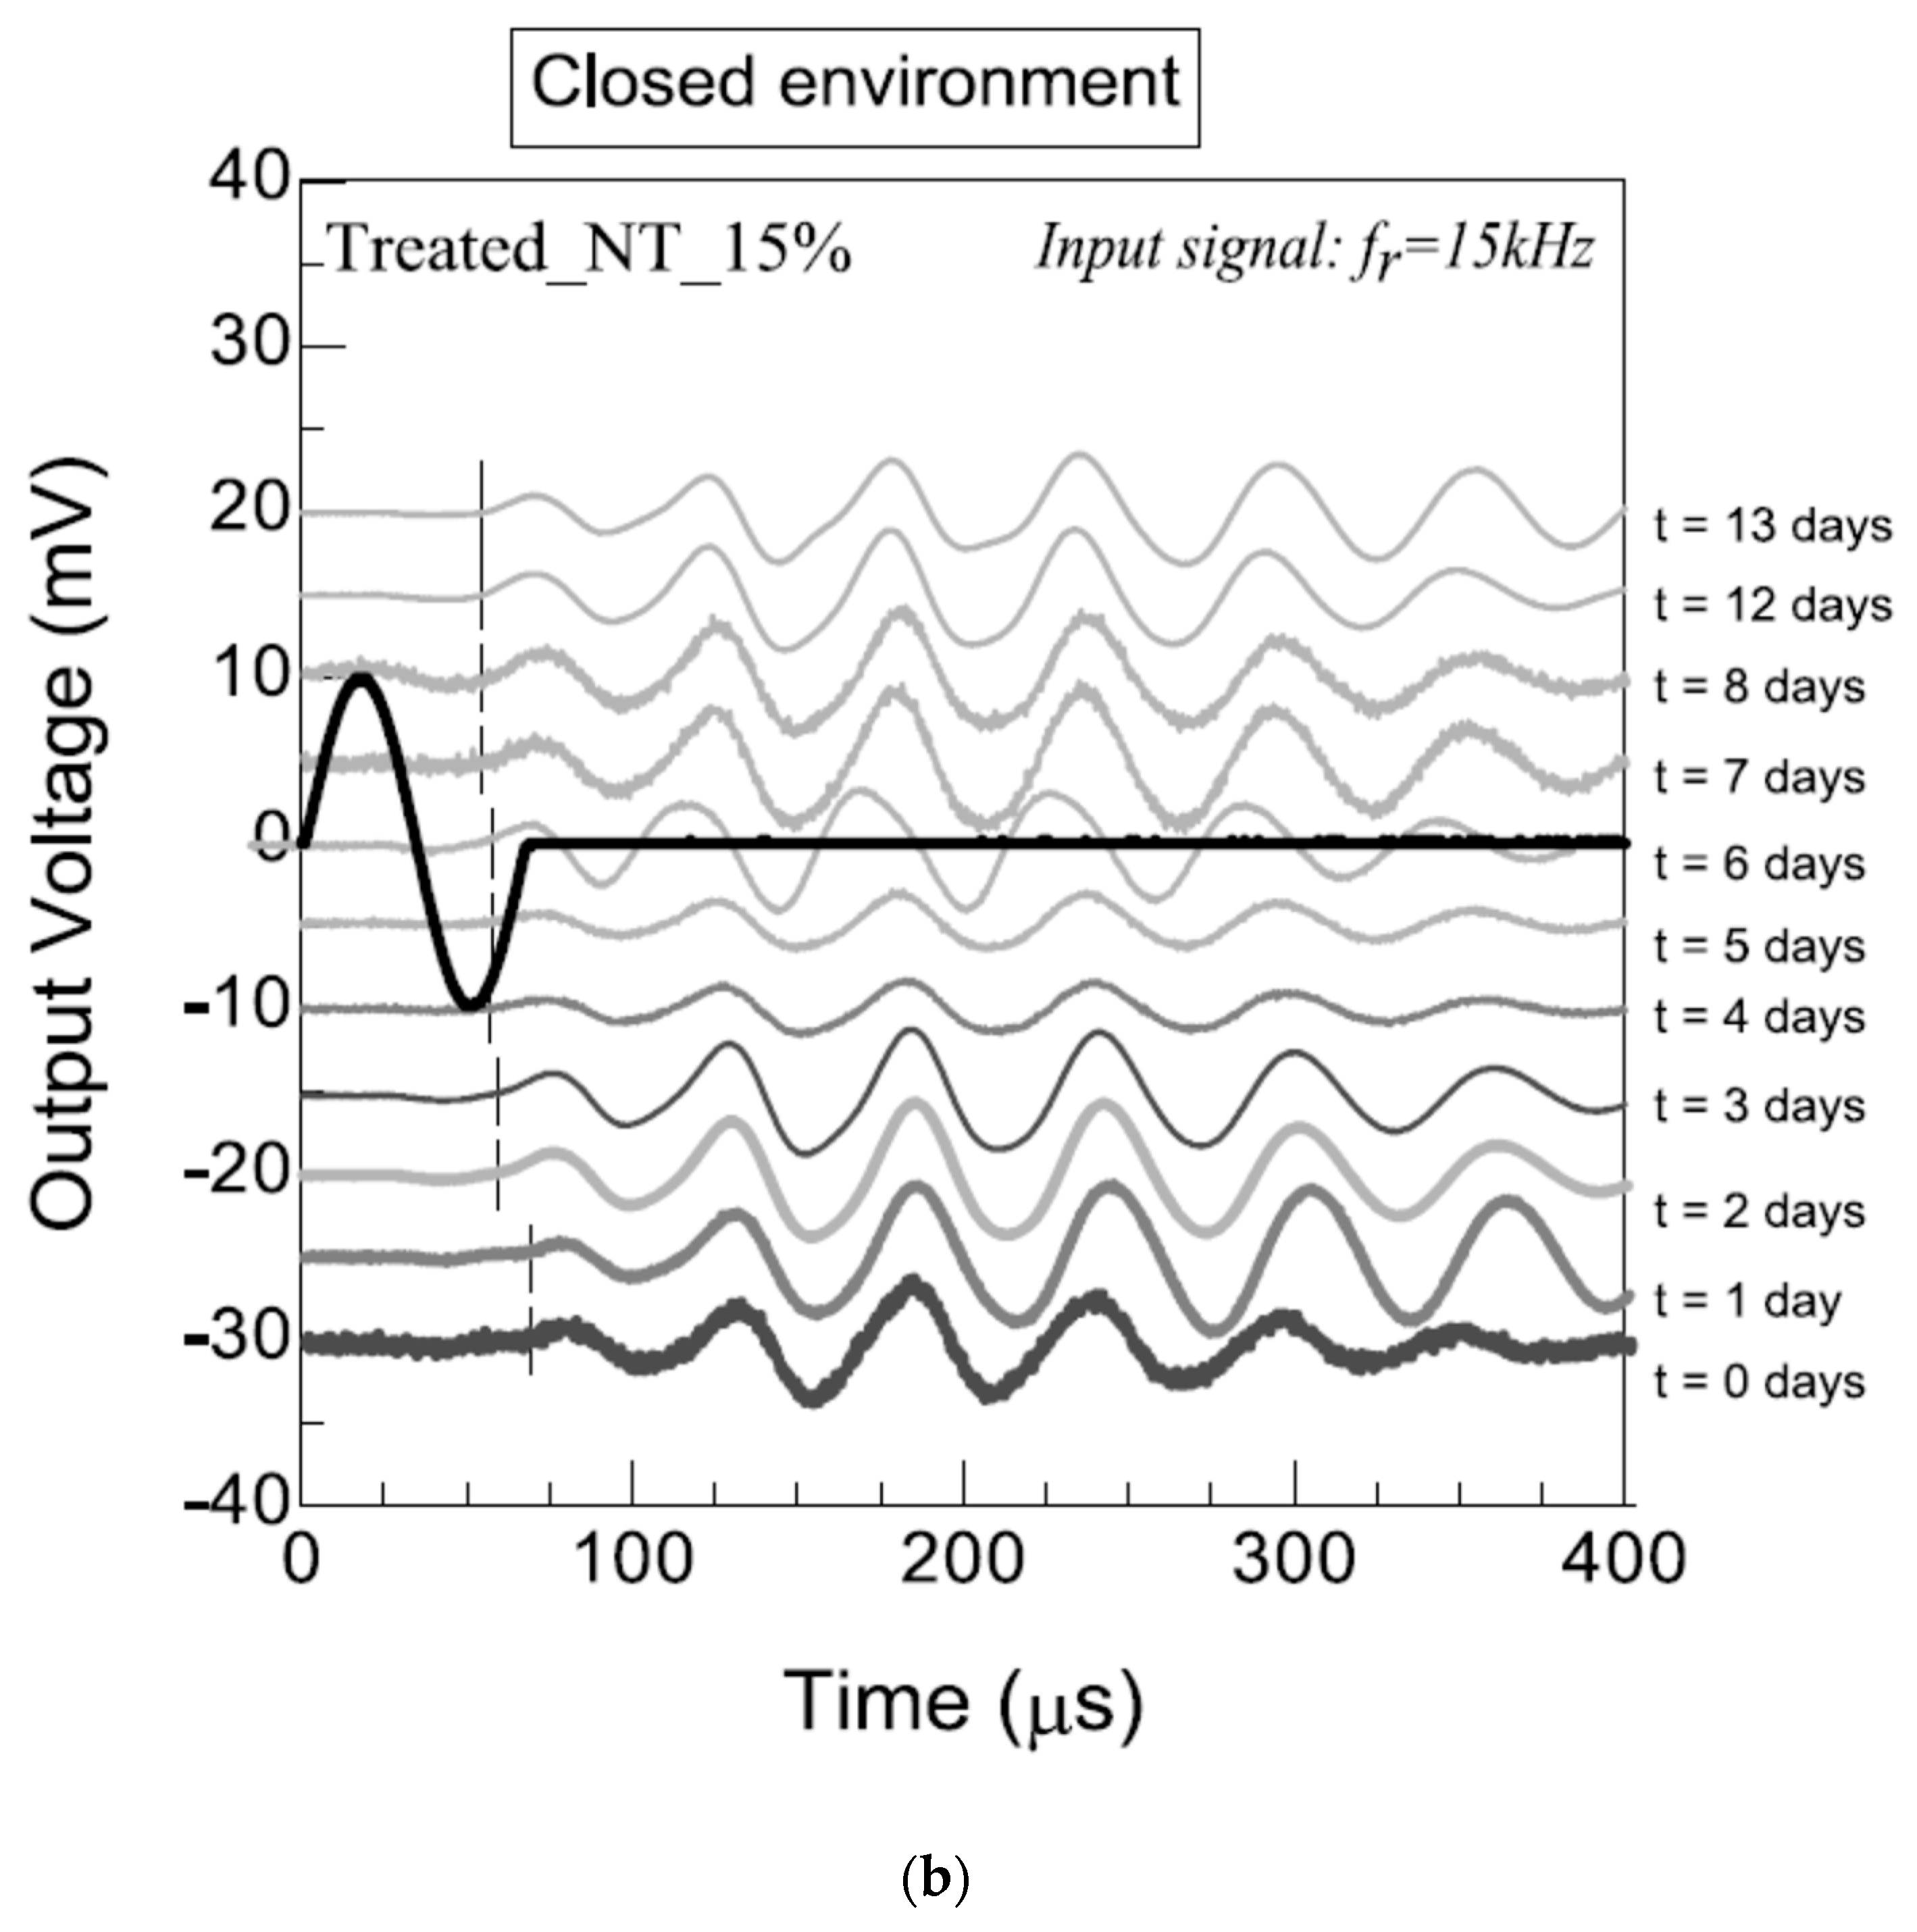
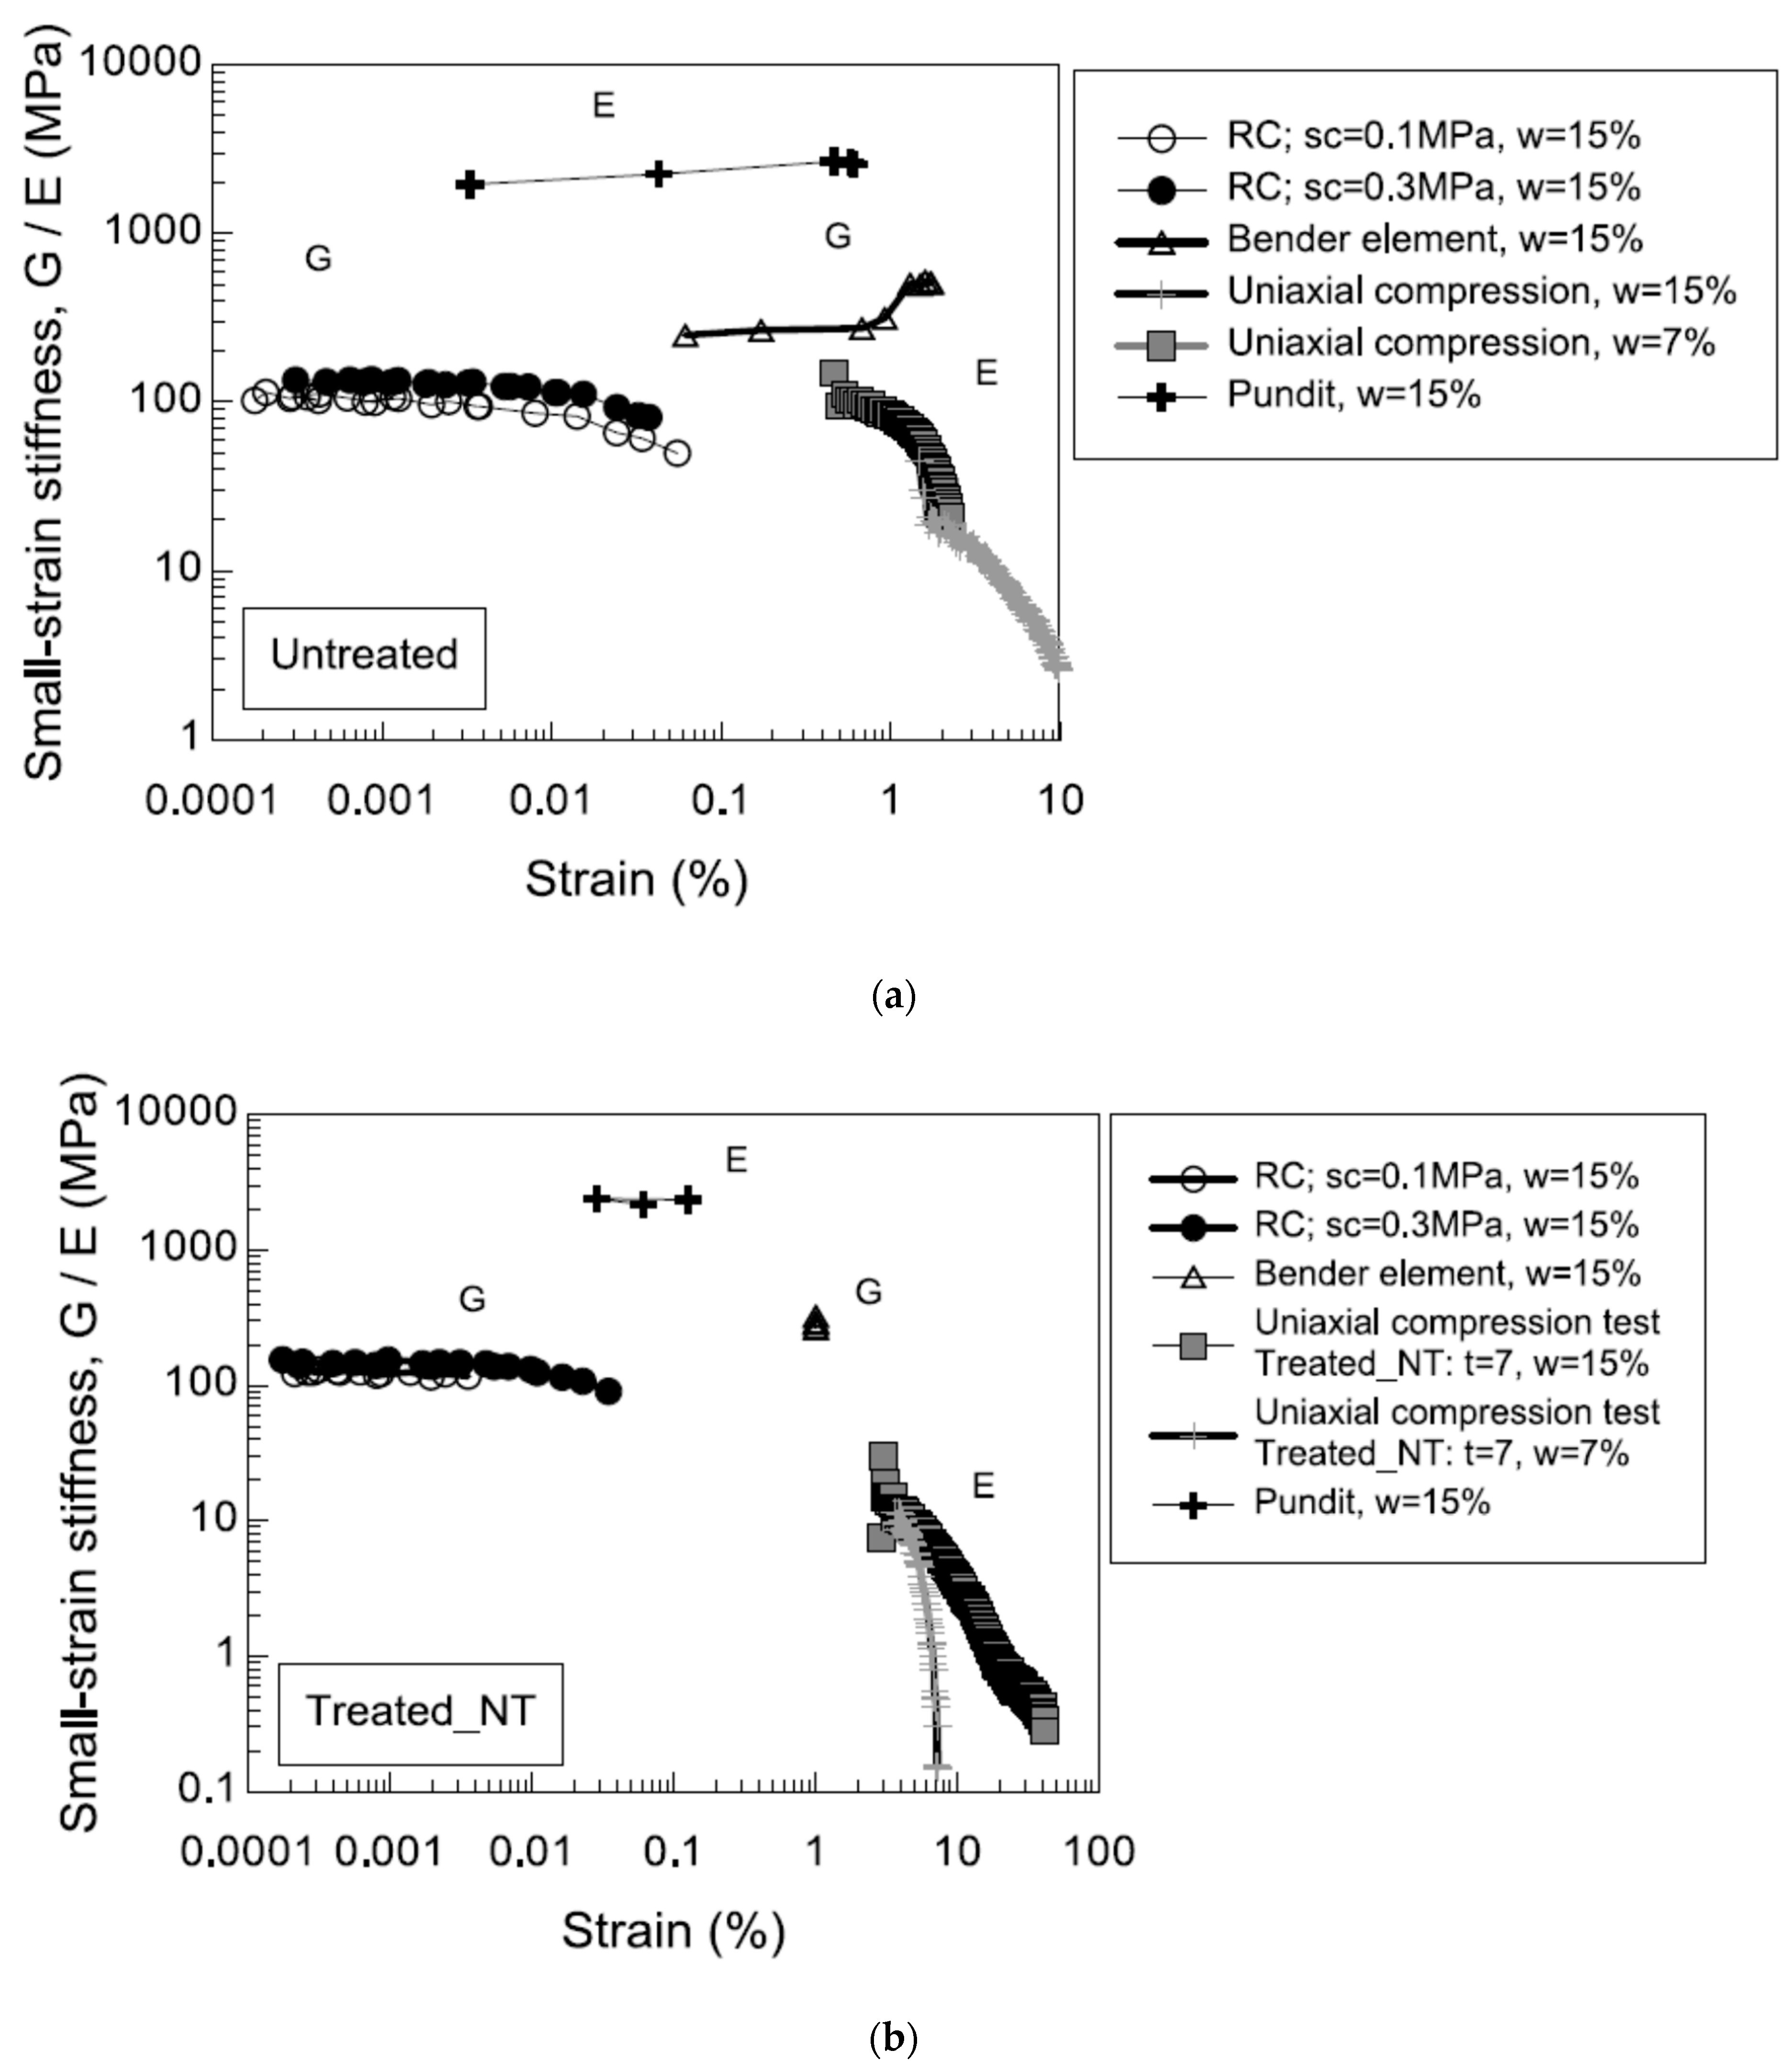
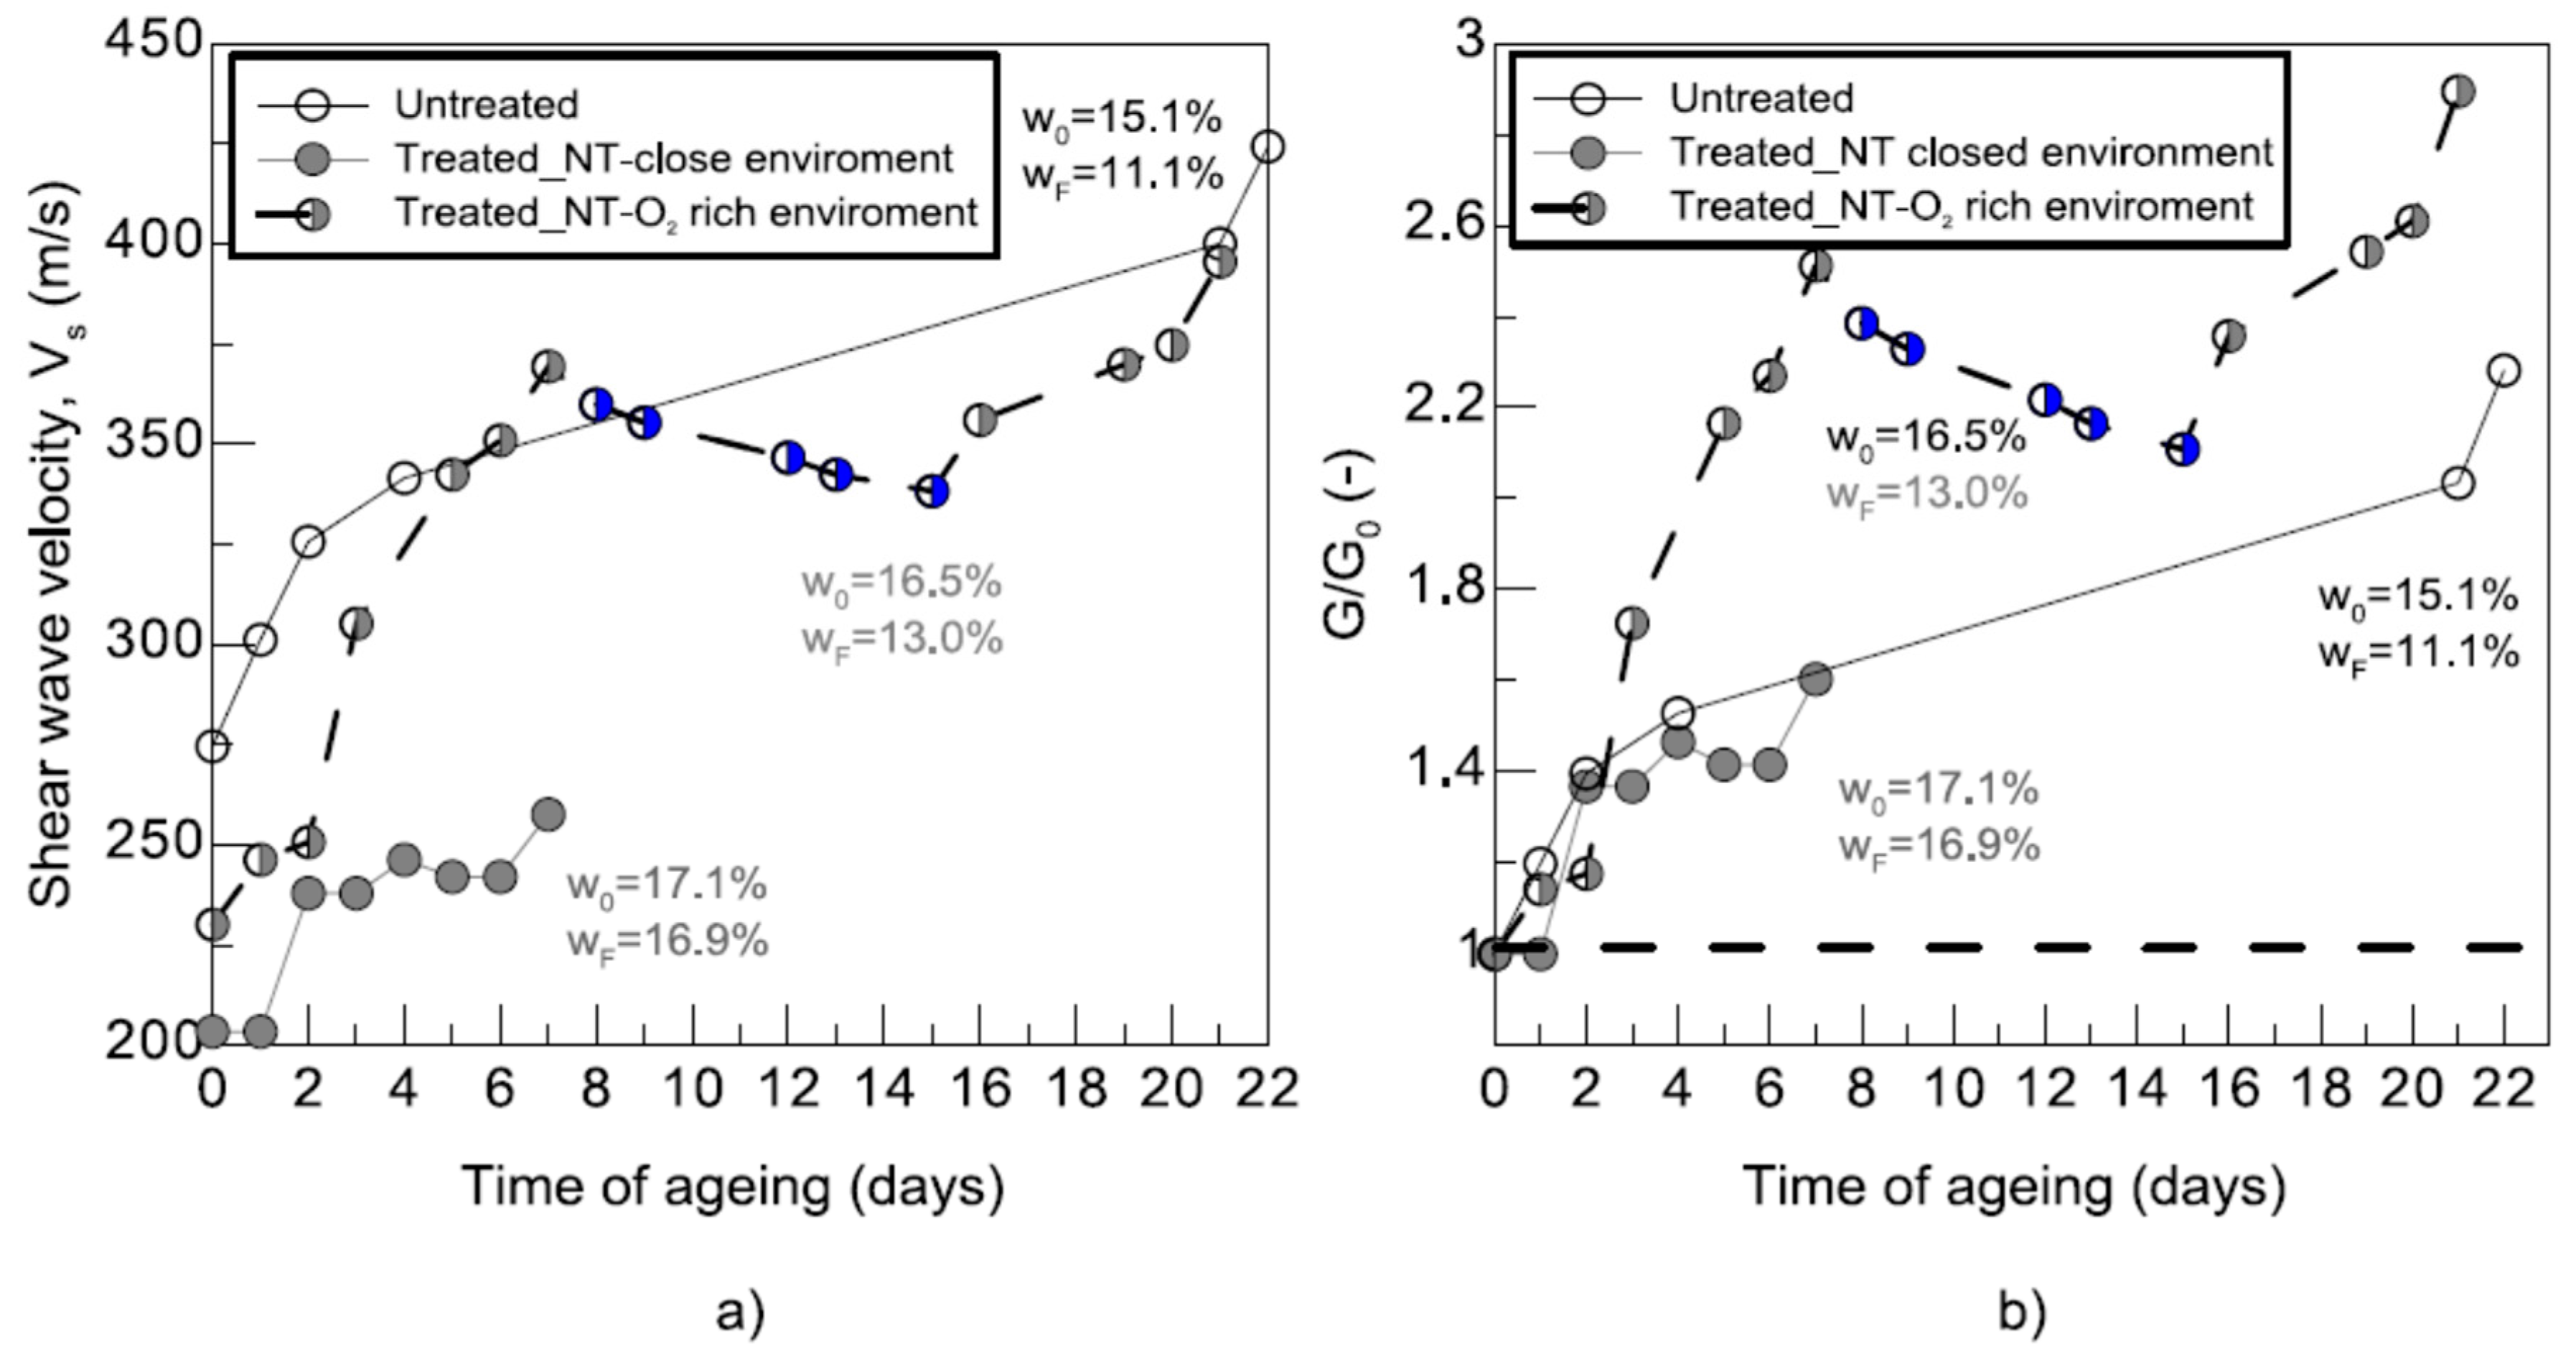
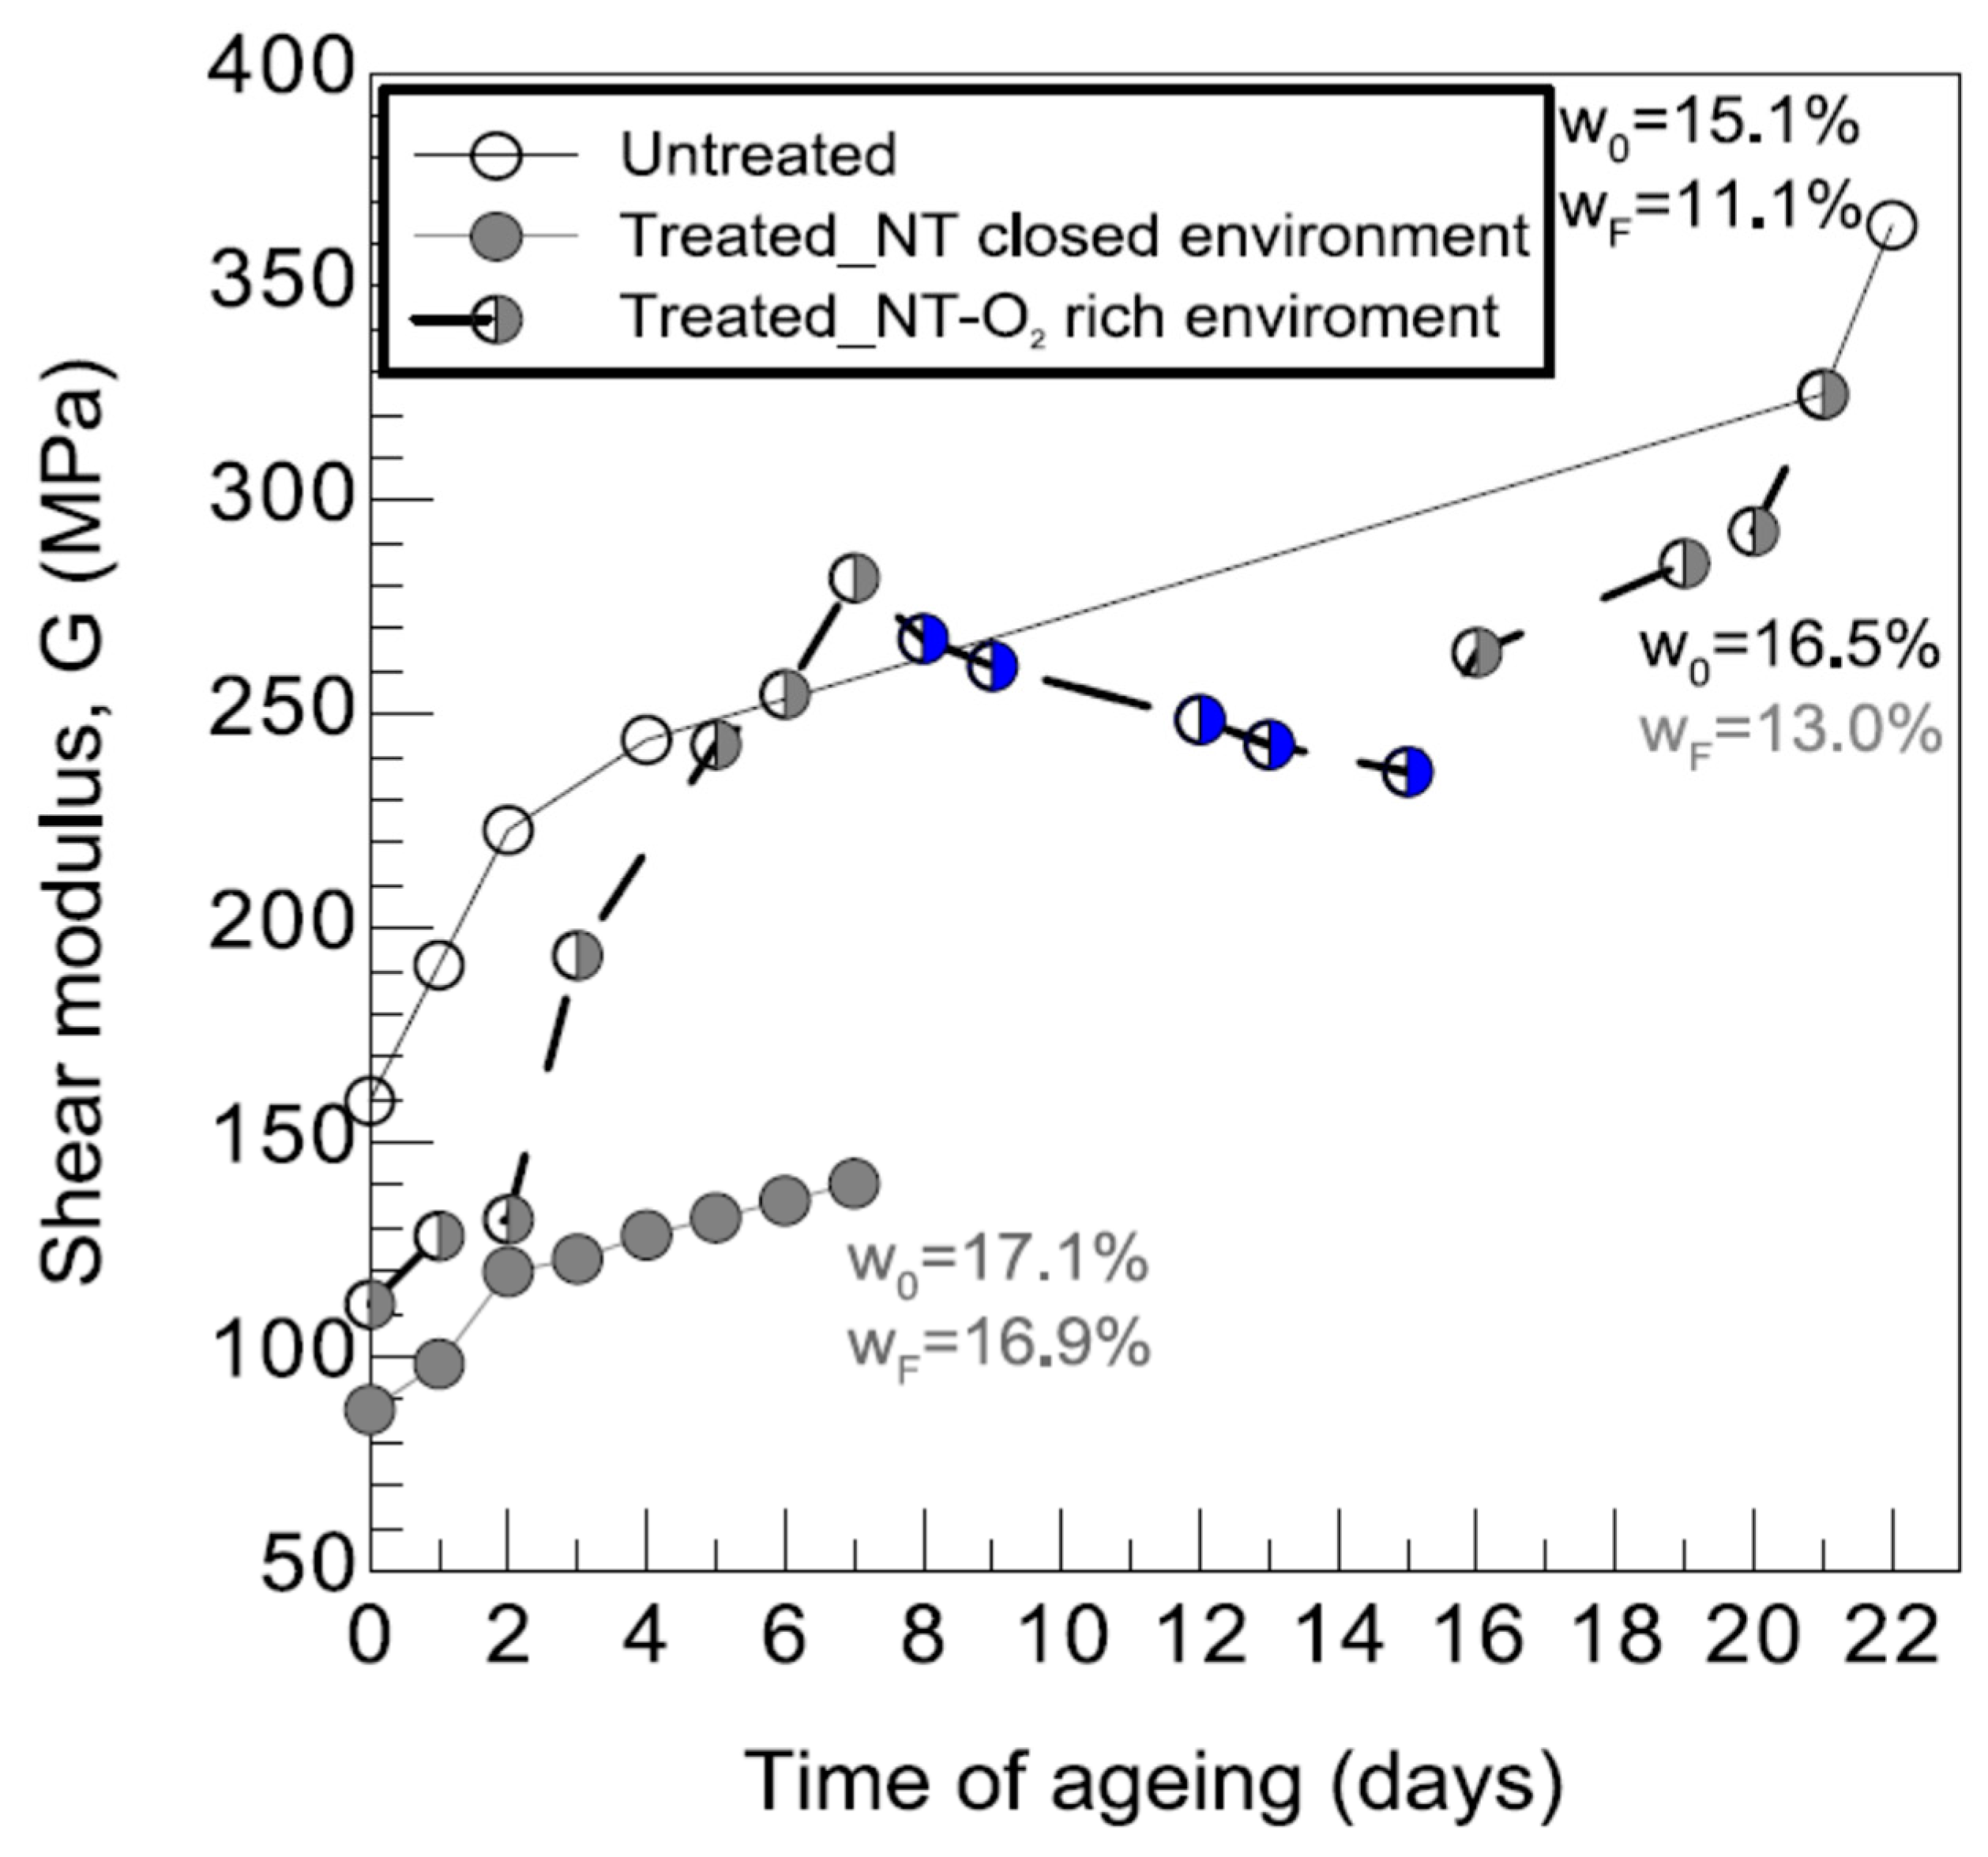
3.2.3. Bender Elements and Ultrasonic-Pulse-Velocity Test (Pundit)

Figure 13 shows the input and output signals obtained by the bender-elements test, for treated_NT samples in the O2-rich environment and the closed environments. Traces were measured at different times of the soil-curing process, with the day of each measurement indicated on the right of the graph. The estimated travel time is indicated by a vertical solid line on each output trace, which aids in the visual detection of the wave arrival. Therefore, it can be seen more easily, since the arrival time reduced as the curing period increased.
Figure 13a shows the results obtained for the treated_NT aged sample in the O2-rich environment. The sample humidity varied from an initial value w0 = 16.5% to wF = 13.02%, which means a variation in the suction values from ψ = 0.003 to ψ = 0.22 MPa.
The results obtained for the treated_NT aged sample in the closed environment are presented in Figure 13b. In this case, the variation of the water contention the sample was almost negligible, ranging from w0 = 17.1% to wF = 16.9%. This suggests that there was no change in the suction, which was maintained at a constant value of 0.001 MPa. The increase in the travel speed of the wave was associated with the precipitation of calcium carbonate in the areas of particle–particle contact. Moreover, the suction exerted an effect because water removal from the meniscus leads to an additional bonding force at the points of particle contact [37]. Therefore, suction can mask the effects of microbiological treatments on soils.
Accordingly, the microbiological treatment caused the same process in the two situations. Furthermore, is the suction created an isolated effect in the O2-rich environment. The wave velocity (V in mm/s) was directly related to the stiffness, as indicated in Table 3:
Figure 14 shows the data obtained from a set of tests, which help to reinforce the results obtained with the bender-elements tests. Represented tests were obtained from the resonant-column, ultrasonic-pulse-velocity, bender-elements, and uniaxial-compression tests.
Variations in the small-strain shear modulus under the two confining net mean stresses (0.1 and 0.3 MPa) for both the untreated and the treated_NT materials were observed. The results indicate that the small-strain shear stiffness was consistently higher in the treated samples across the range of shear strains examined. This stiffness enhancement supported the aim of improving the microorganisms’ soil properties. Additional details are provided by Morales et al. [43].
Figure 15 shows the variation in the normalized Young’s modulus and the normalized shear modulus in untreated the samples (a) regarding the water content and (b) in terms of the level of saturation. Figure 15a shows the normalized stiffness curve, G/G0, for different water contents in untreated soil, starting at humidity values of w0 = 16% to wF = 6%. Furthermore, it also shows the E/E0 curve obtained for lower humidity values, from 15% to 13%. Therefore, the suction effect (w0 = 16%, ψ = 0.2 MPa and wF = 6% ψ = 60 MPa) increased the soil stiffness to about 201% higher than the initial value. These results were in accordance with the proposal by Cho and Santamarina [45].
Figure 15b shows that the stiffness of the untreated soil remained almost constant (about 1.67) at saturation degrees ranging between 65% and 85%. these values corresponded with the flattening of the degree of saturation (Sr) vs. the total suction curve (about ψ = 0.2–2 MPa).
Figure 16 shows variation of the normalized Young’s modulus and the normalized shear modulus in the treated_NT samples (a) regarding the water content and (b) in terms of the level of saturation.
The plots in Figure 16a show the normalized stiffness curve, G/G0, for different water contents in the treated_NT soil, with humidity values ranging from w0 = 17% to wF = 13%. The plots also show the E/E0 curve obtained for the lower humidity values, ranging from w0 = 14% to wF = 12%. Therefore, the suction effect, combined with microbiological effect (w0 = 17%, ψ = 0.003 MPa and wF = 13%, ψ = 0.22 MPa), increased the soil stiffness to about 190% higher than the initial value. This increase took place in the area of the curve representing the untreated material, corresponding with an almost constant stiffness and a suction level that was practically negligible. A simple interpretation of this phenomenon is achieved by plotting the results obtained for the stiffness, the bender elements, the different degrees of saturation, and with the WRC (Figure 17).
Figure 18 shows how the suction affected the soil stiffness for the untreated, treated_NT_closed environment, and the treated_NT_O2 rich environment. It can be observed that at the same value of suction, the treated samples had greater normalized shear moduli.
Figure 19 shows: (a) evolution of the normalized Young’s moduli during the aging process, at w0 = 7% and w0 = 15%; and (b) the evolution of the normalized shear moduli during the aging process, at w0 = 15%.
The evolution of the shear-wave velocity Vs for various aging periods, as well as the initial and final water contents, is depicted in Figure 20. Following the static compaction, the Vs varied from 275 m/s for the untreated samples to 200–230 m/s for the treated_NT samples, when the samples were prepared at an optimal water content of approximately w0 = 15%. The elevated starting value observed in the untreated samples can be attributed to the stiffening impact of the suction. The results indicate that with the progression of the aging in the treated soils, there was an observed increase in Vs, as demonstrated by the time-evolution plots presented in Figure 20a, while Vs values of 143 m/s and 396 m/s were attained at 7 days and 21 days, respectively, in the closed and O2-rich environments. When comparing the untreated samples to the treated_NT in the O2-rich environment, it was observed that the former experienced a more significant reduction in water content during the aging process. This reduction also led to a greater increase in Vs compared to the treated samples. The observed reductions primarily arose from the desiccation (evaporation) of the specimens within the hermetically sealed receptacle. However, it should be noted that the decrease in water content observed in the treated_NT samples can be attributed, in part, to the microbiological treatment process, which necessitates water absorption due to the affinity of microorganisms for water in order to precipitate CaCO3 minerals. This phenomenon is not entirely offset by the regulation of the relative humidity.
Regarding the small-strain stiffness, it can be observed in Figure 20b that the microbiological treatment resulted in a significant rise in the normalized shear modulus G/G0, which represents the ratio between the current and starting values. The stiffness rose by approximately 45% for the treated_NT sample in the O2-rich environment, after 21 days of incubation, compared with the untreated sample, despite the fact that the former had a lower humidity loss. The observed elevation in shear stiffness of the treated specimens aligned with the anticipated microbiological responses of the bacteria and the formation of CaCO3 minerals. This increase became significant after a period of three to four days of maturation.
The primary cause of the observed increase in stiffness is likely to have been linked predominantly to bioclogging and biocementation [25,26,27,28,33]. The decrease in stiffness, demonstrated in Figure 20b, between the 8th and 15th days detected in the treated_NT sample in the O2-rich environment appears to have been a consequence of wetting effects.
Figure 21 shows the shear-modulus evolution studied in the untreated samples (blank test) and in the treated_NT samples, in both the O2-rich environment and in the closed environment. The shear modulus of the untreated soil started from an initial humidity of around 1.4–2% lower than that of the treated samples. Based on this premise, the effect of the suction on the soil stiffness was higher, especially in the last reading, which was taken when the sample degree of saturation was less than 63%. However, the treated_NT in the O2-rich environment showed a further increase in stiffness, albeit with a higher humidity content and, therefore, a lower suction effect. This sample had a process of wetting that lasted from day 8 to day 15. The closed-environment sample showed almost no variation in its water content (w = 17%). Therefore, the effect of the suction on the stiffness was almost constant, indicating that the increase observed in the sample was due to the effects of the microbiological treatment.
The untreated and treated soil samples were expected to have the same value of G at the time at which they were prepared (day 0). Therefore, the curves of the treated samples were corrected considering that the suction affected the treated soil in the same way as the untreated soil.

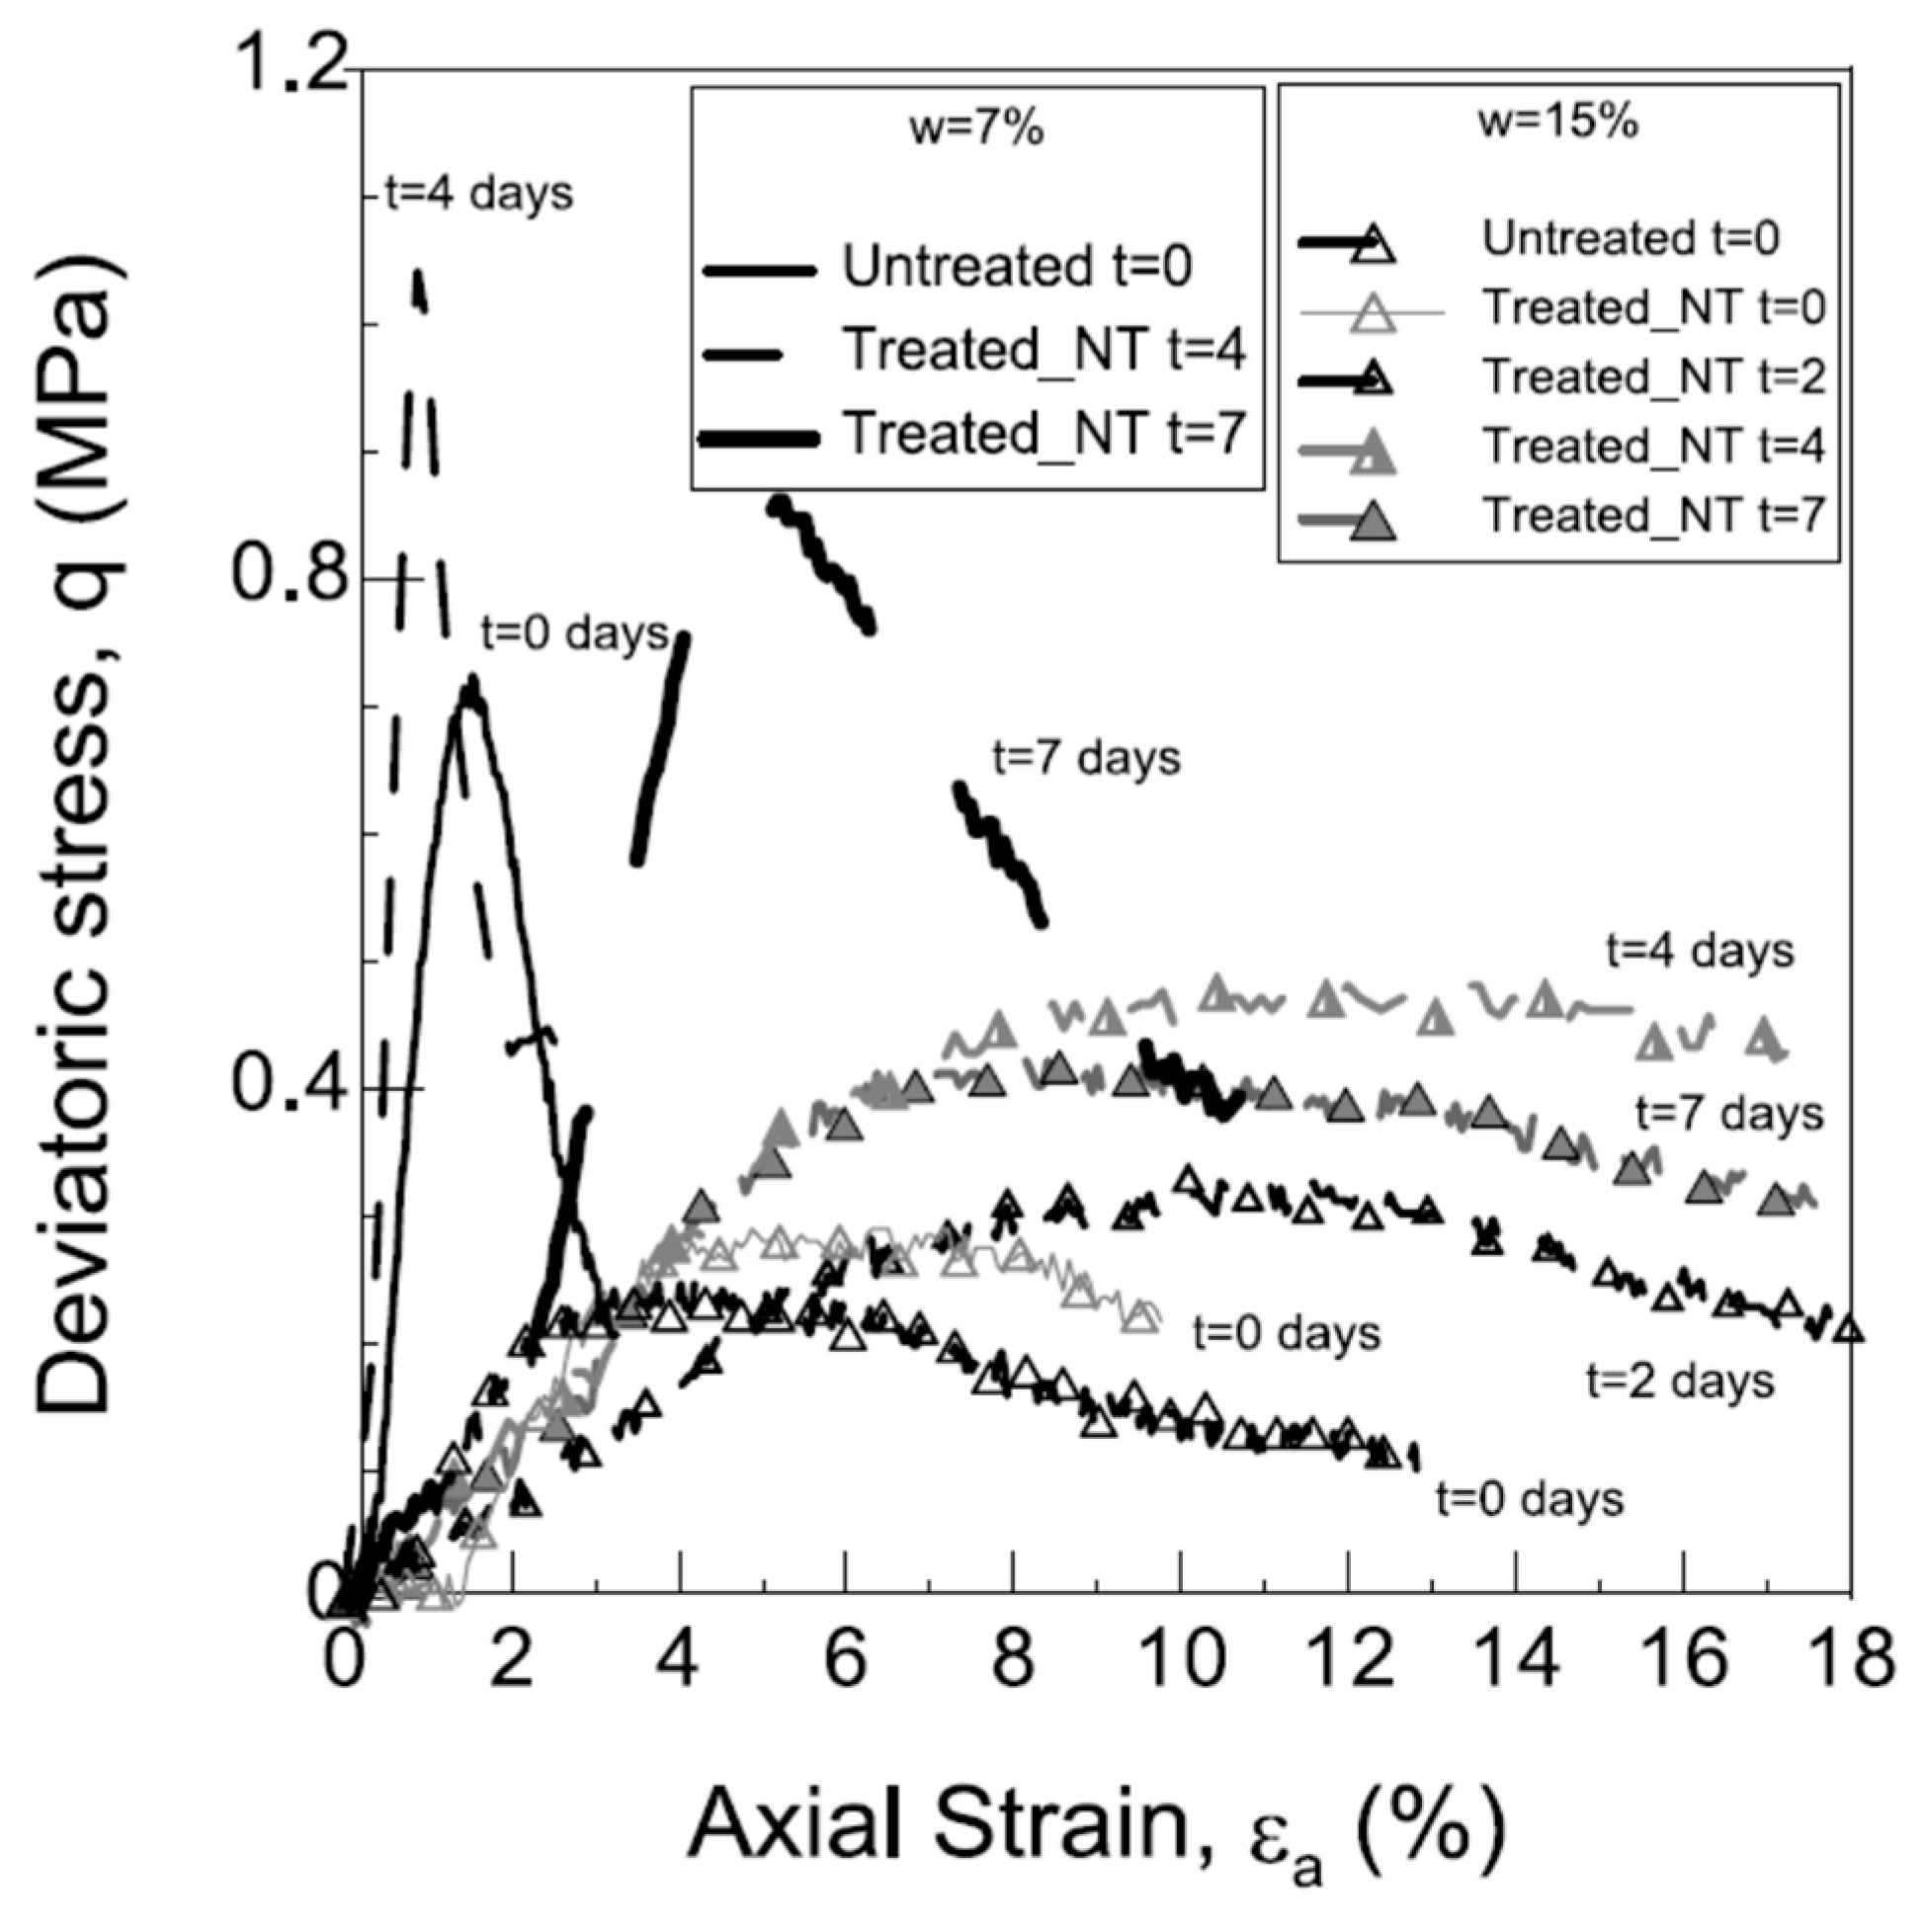
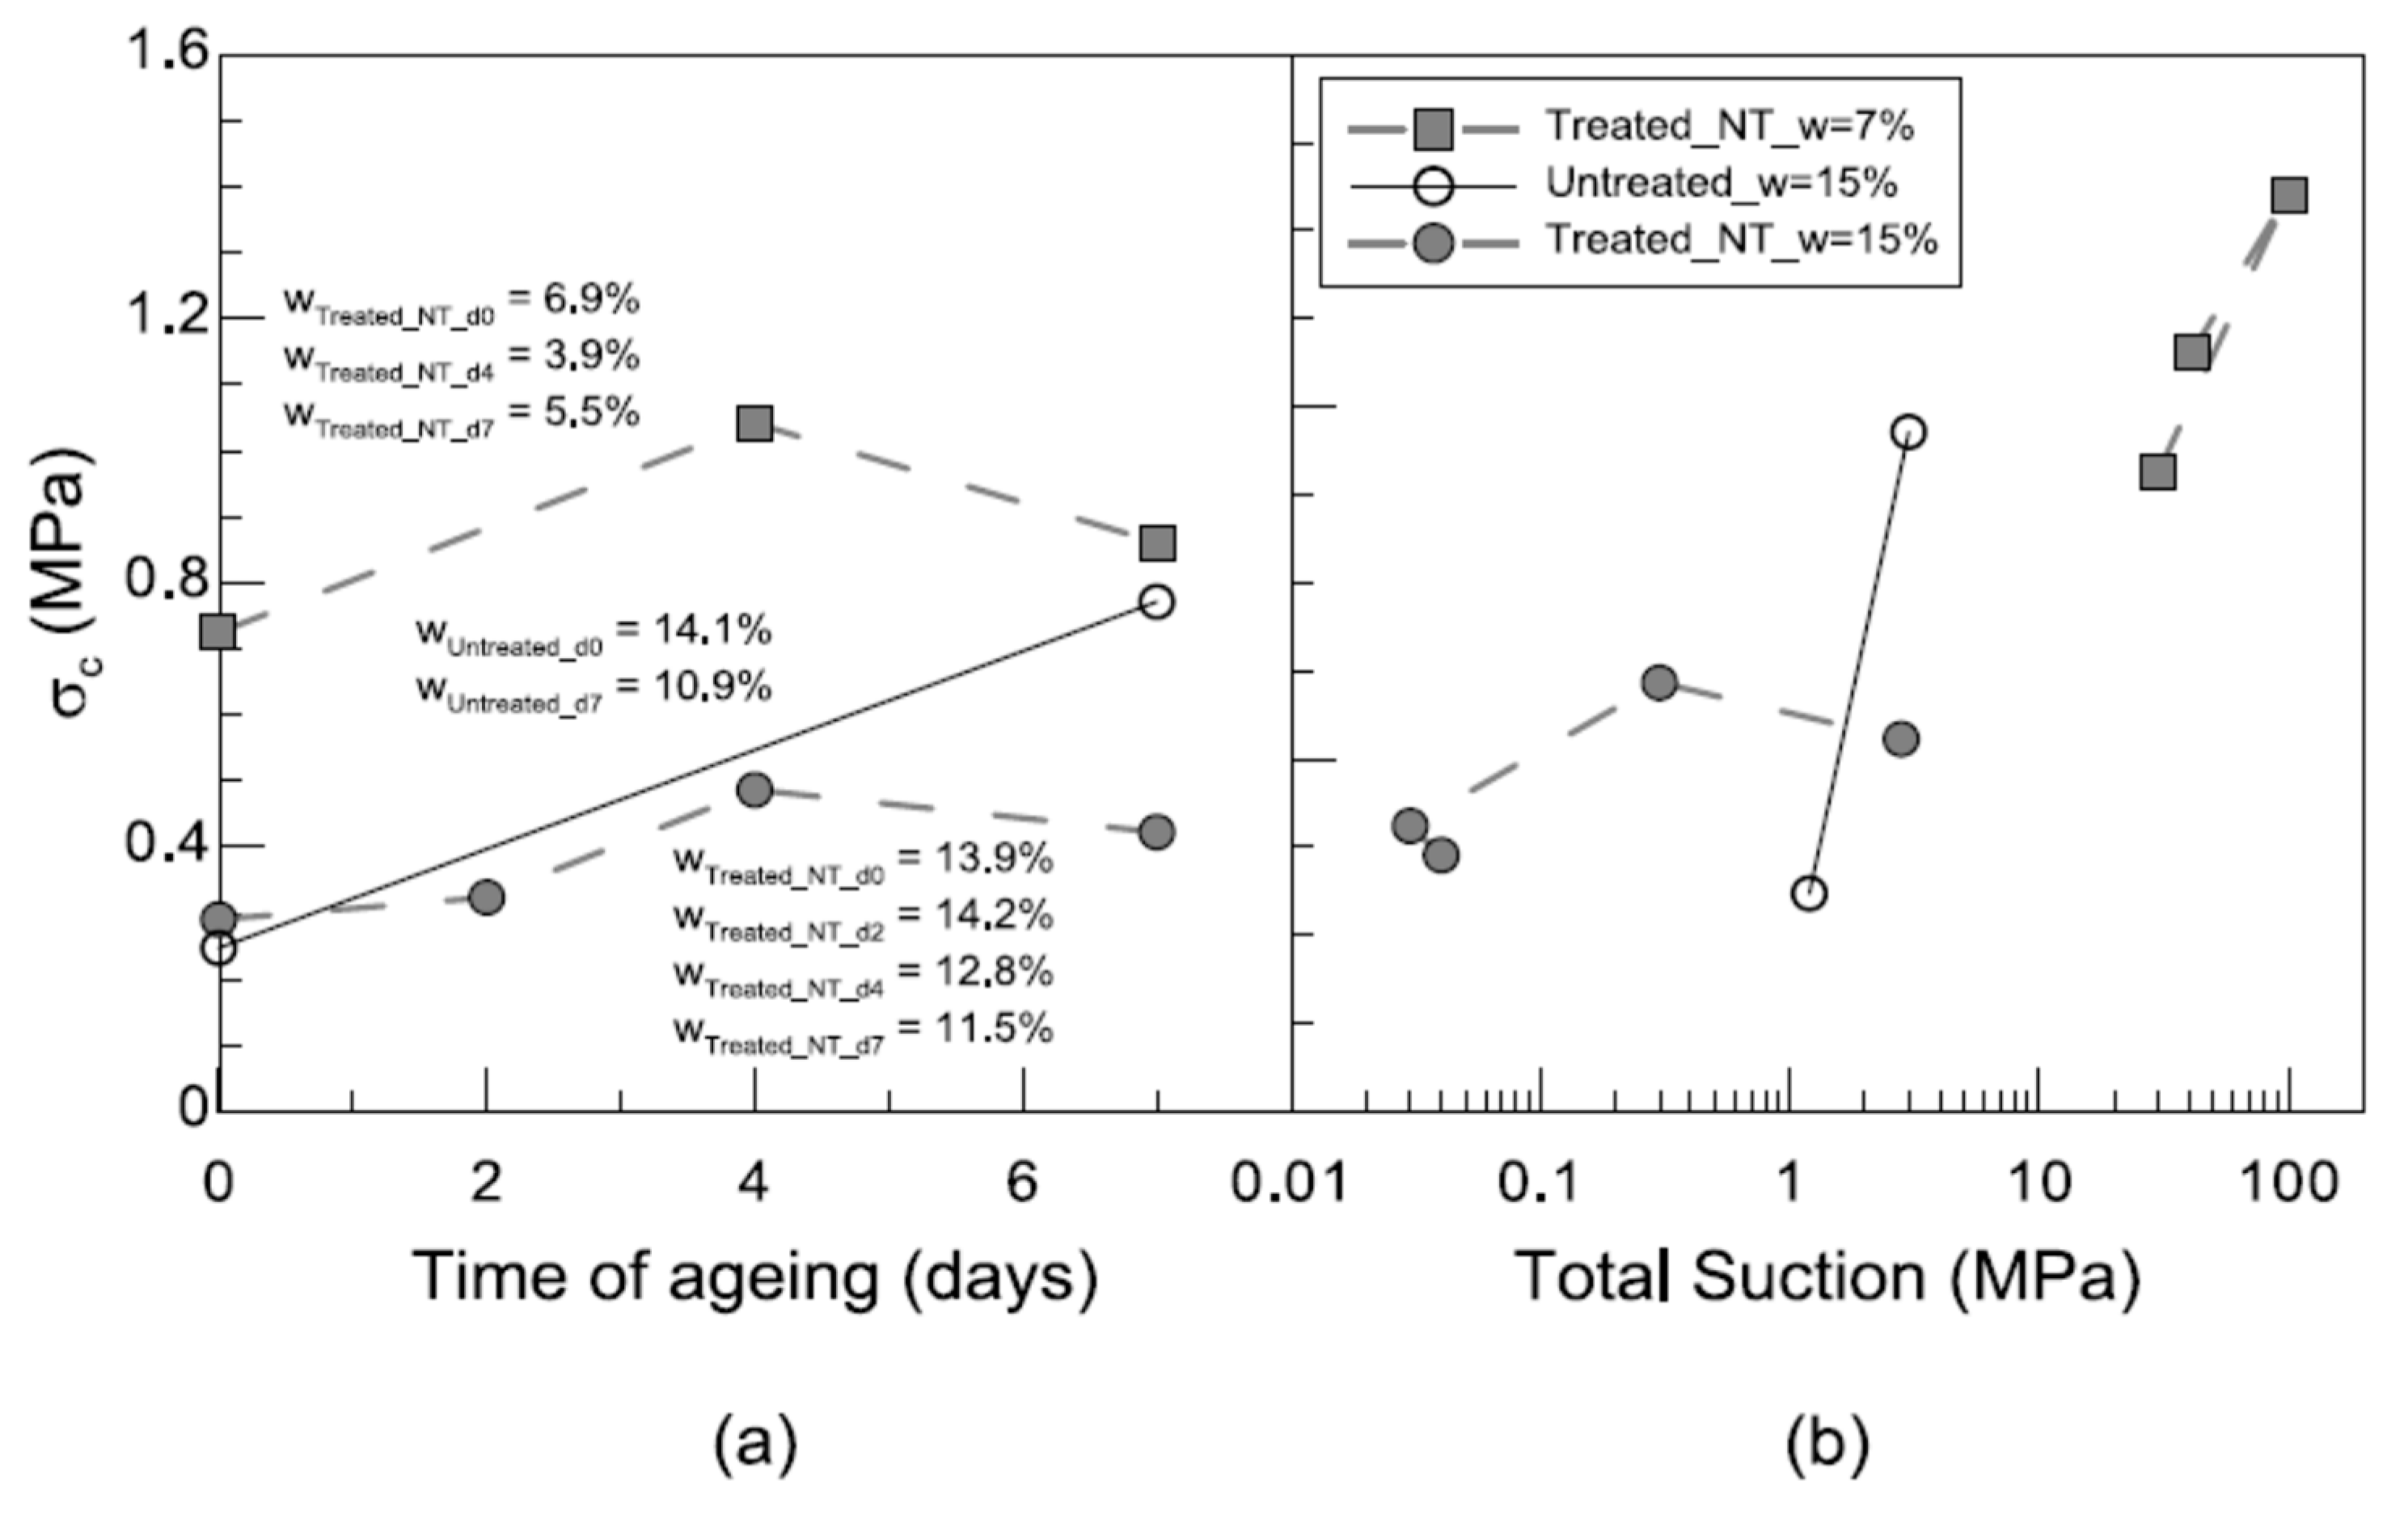
3.2.4. Unconfined Compression Test

The stress–strain curves obtained from the unconfined compression tests conducted on the untreated and treated_NT samples under dry (w0 = 7%) and wet (w0 = 15%) conditions are depicted in Figure 22. The drier sample, the treated_NT at w = 7%, displayed larger peak-deviatoric stress, which was consistent with its higher initial suction.
Furthermore, it is evident that the incubation process resulted in an amplification of the strength due to the effects of the aging, as depicted in the time-evolution graph illustrated in Figure 23a. However, it is possible that the suction effects depicted in Figure 23b obscured the impact of the microbiological-treatment-induced aging effect. The treated_NT samples exhibited a notable increase in peak stress following a four-day curing period, which can be attributed to the material undergoing some degree of drying. This increase effectively concealed the effects of the aging incubation and intensified the peak value. Following a period of 7 days and under conditions of extreme dryness, the peak stress demonstrated a reduction due to the augmentation of the water content.
It should be noted that Valencia-Galindo et al. [29] used a biotechnological product (developed by a company) to assess the effects of a soil-treatment method, which involves the precipitation of CaCO3 from bacteria that have been cultivated and lyophilized, on the compaction of water in soil. The researchers used a sandy silt and a soil containing expansive clays. They concluded that a network of cemented contacts was not developed. In their study, the enhancement of the stiffness and strength became more apparent following multiple days of treatment, as was found in the present investigation.

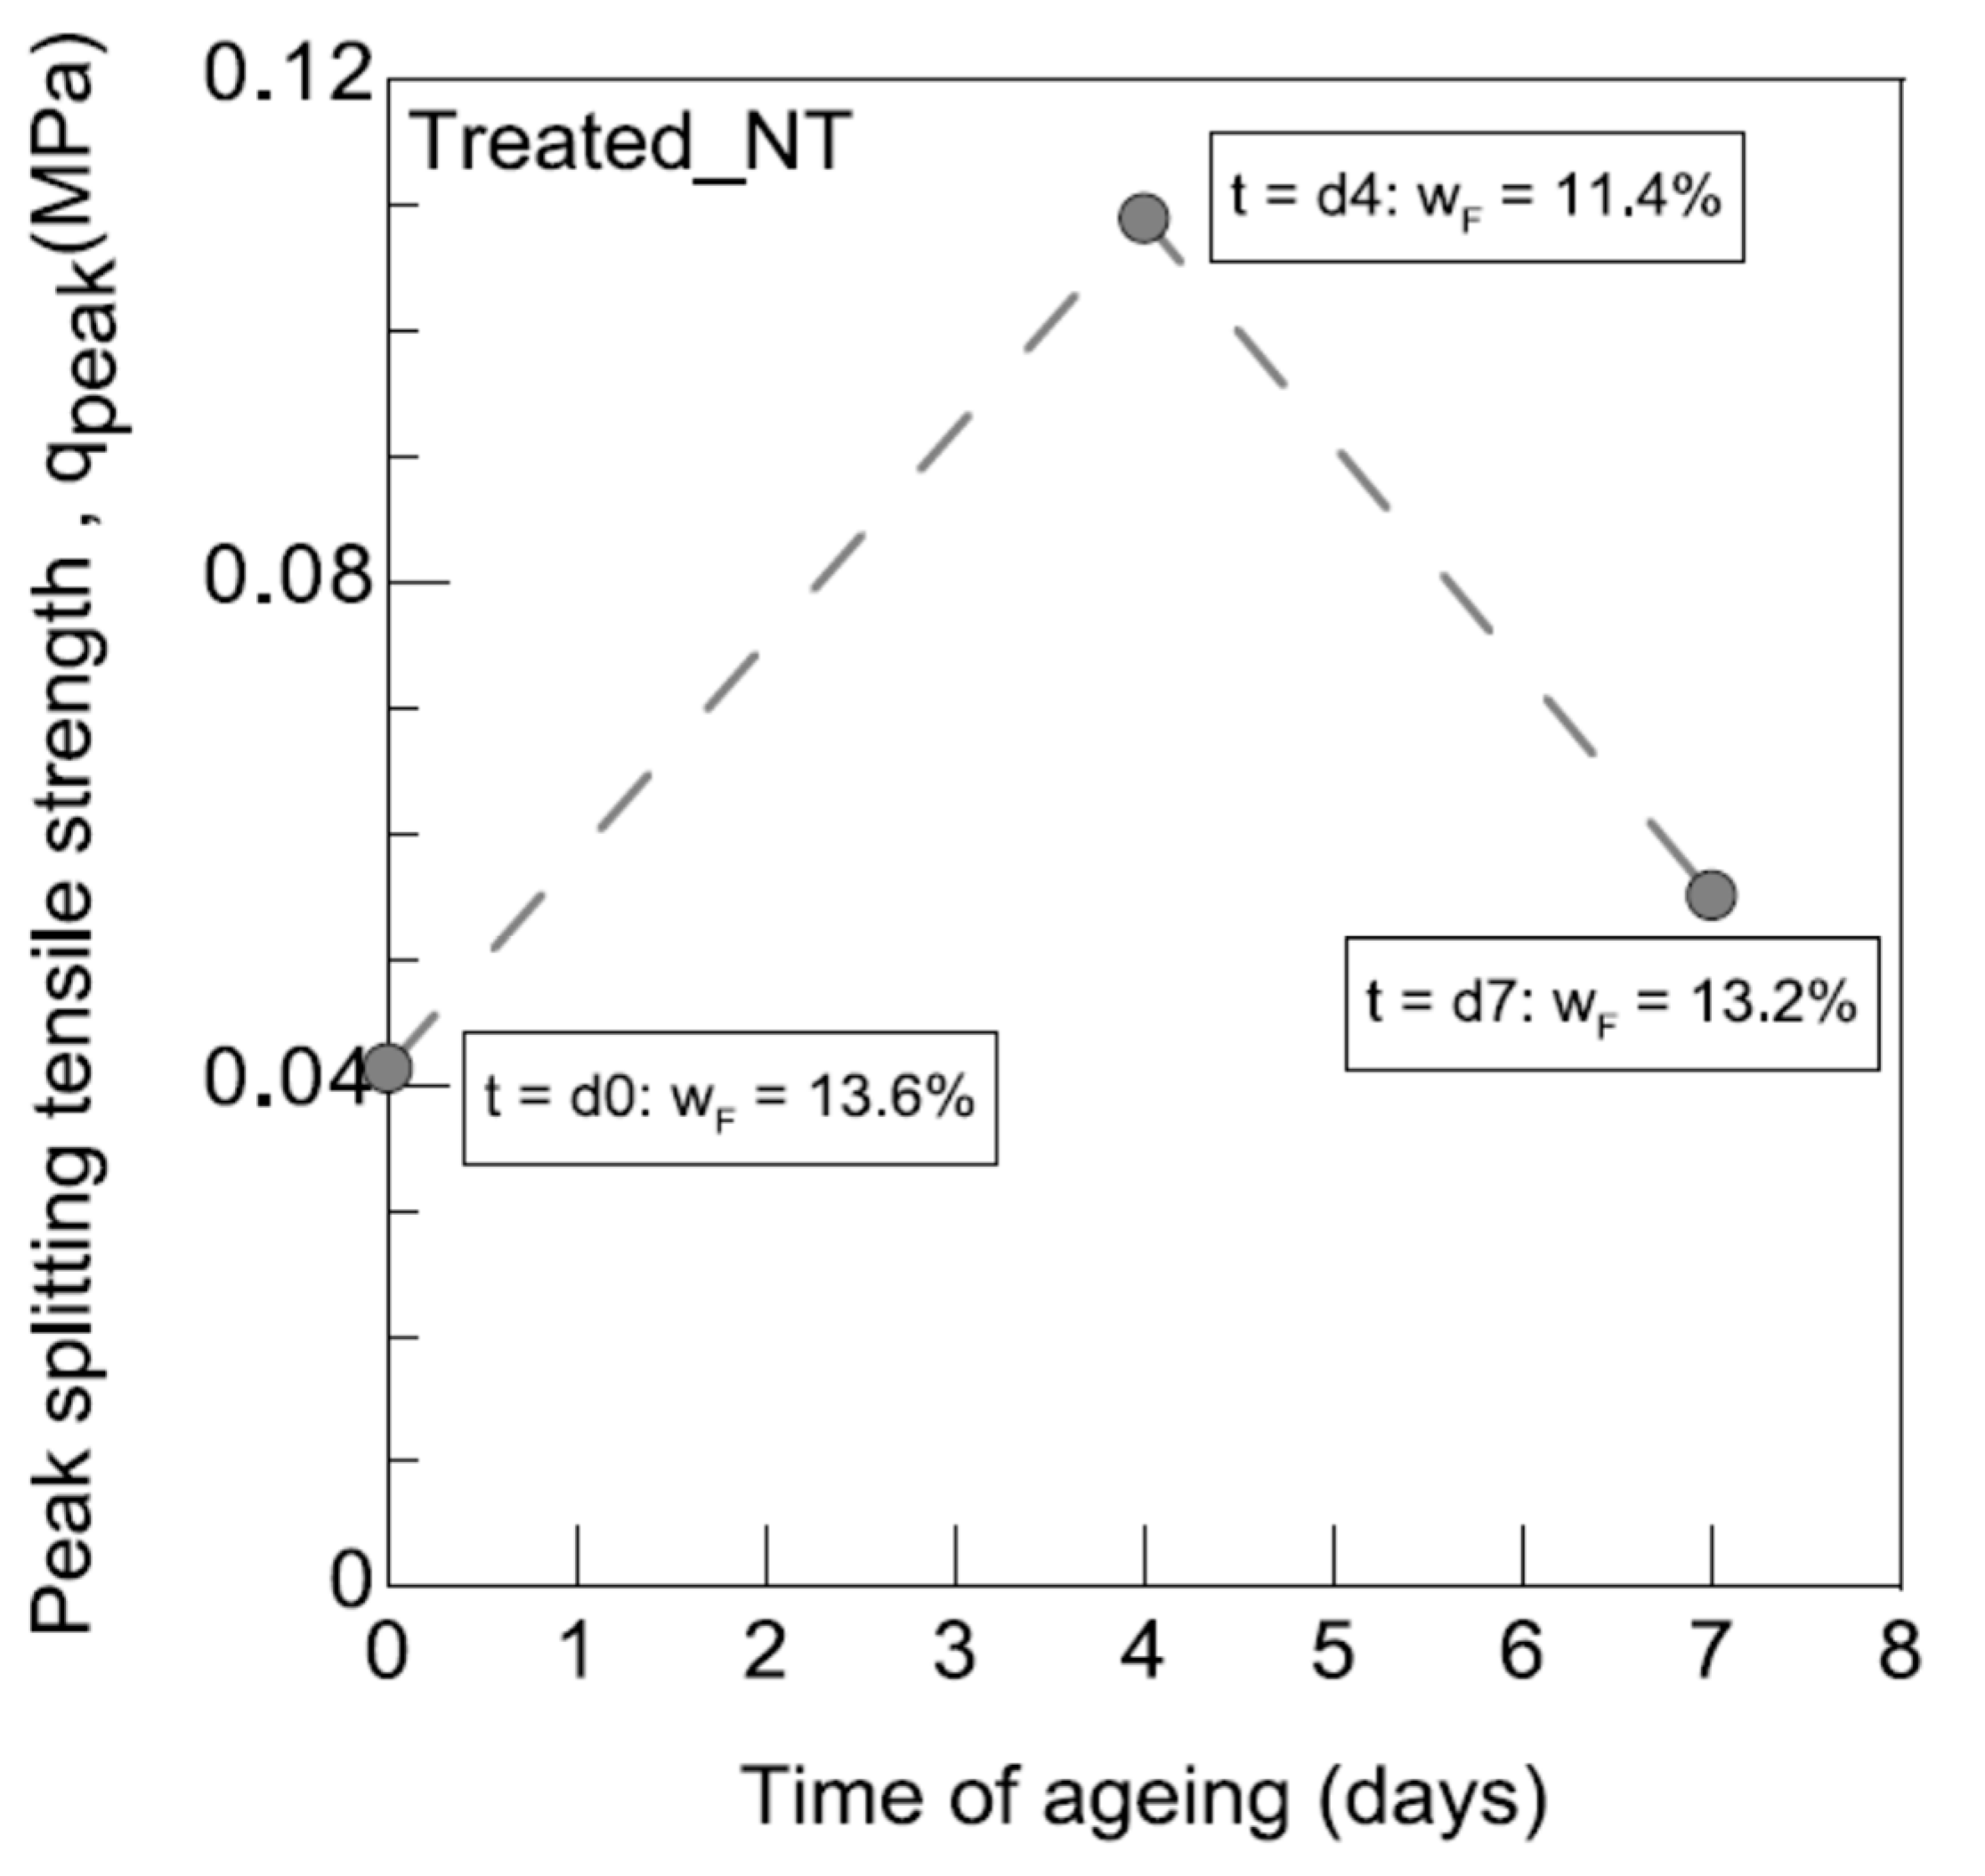
3.2.5. Brazilian Test (Splitting Tensile Strength)

The data obtained by using the Brazilian test are summarized in Figure 24. The results are presented only for the treated_NT sample when it was compacted with a water content of w = 15%. The trend was similar to that observed in the compression, i.e., there was a significant increase in stress until the 4th day of aging, which was caused by a suction effect and by the treatment. On the 7th day, the peak stress decreased as the water content of the sample increased because the effect of the suction on the sample’s stiffness is weaker.
The impact of various chemical stabilizers on the enhancement of the overall soil strength through chemical means was described previously [30]. Different microorganisms have been used as “chemical stabilizers.” These include Bacillus subtilis, Rhizopus oligosporus, B. Megaterium, and ureolytic bacteria. In the present investigation, the microorganisms were bacteria belonging to the Bacillaceae family (Figure 6). As shown in research [30], suggesting a particular stabilization technique for a specific soil type is a challenging task. The literature features discussions of various soil types that are either advantageous or detrimental for different types of stabilization [30]. It is considered that changes in UCS (kPa) can be important. For instance, values of overall strength from 850 kPa to 2067 kPa using Ureolytic bacteria have been reported [30]. Nevertheless, although the deviatoric-stress–axial-strain curves pertaining to treated soils under varying initial water contents and aging periods were not documented, these results are evidenced in the present study (Figure 22 and Figure 23).

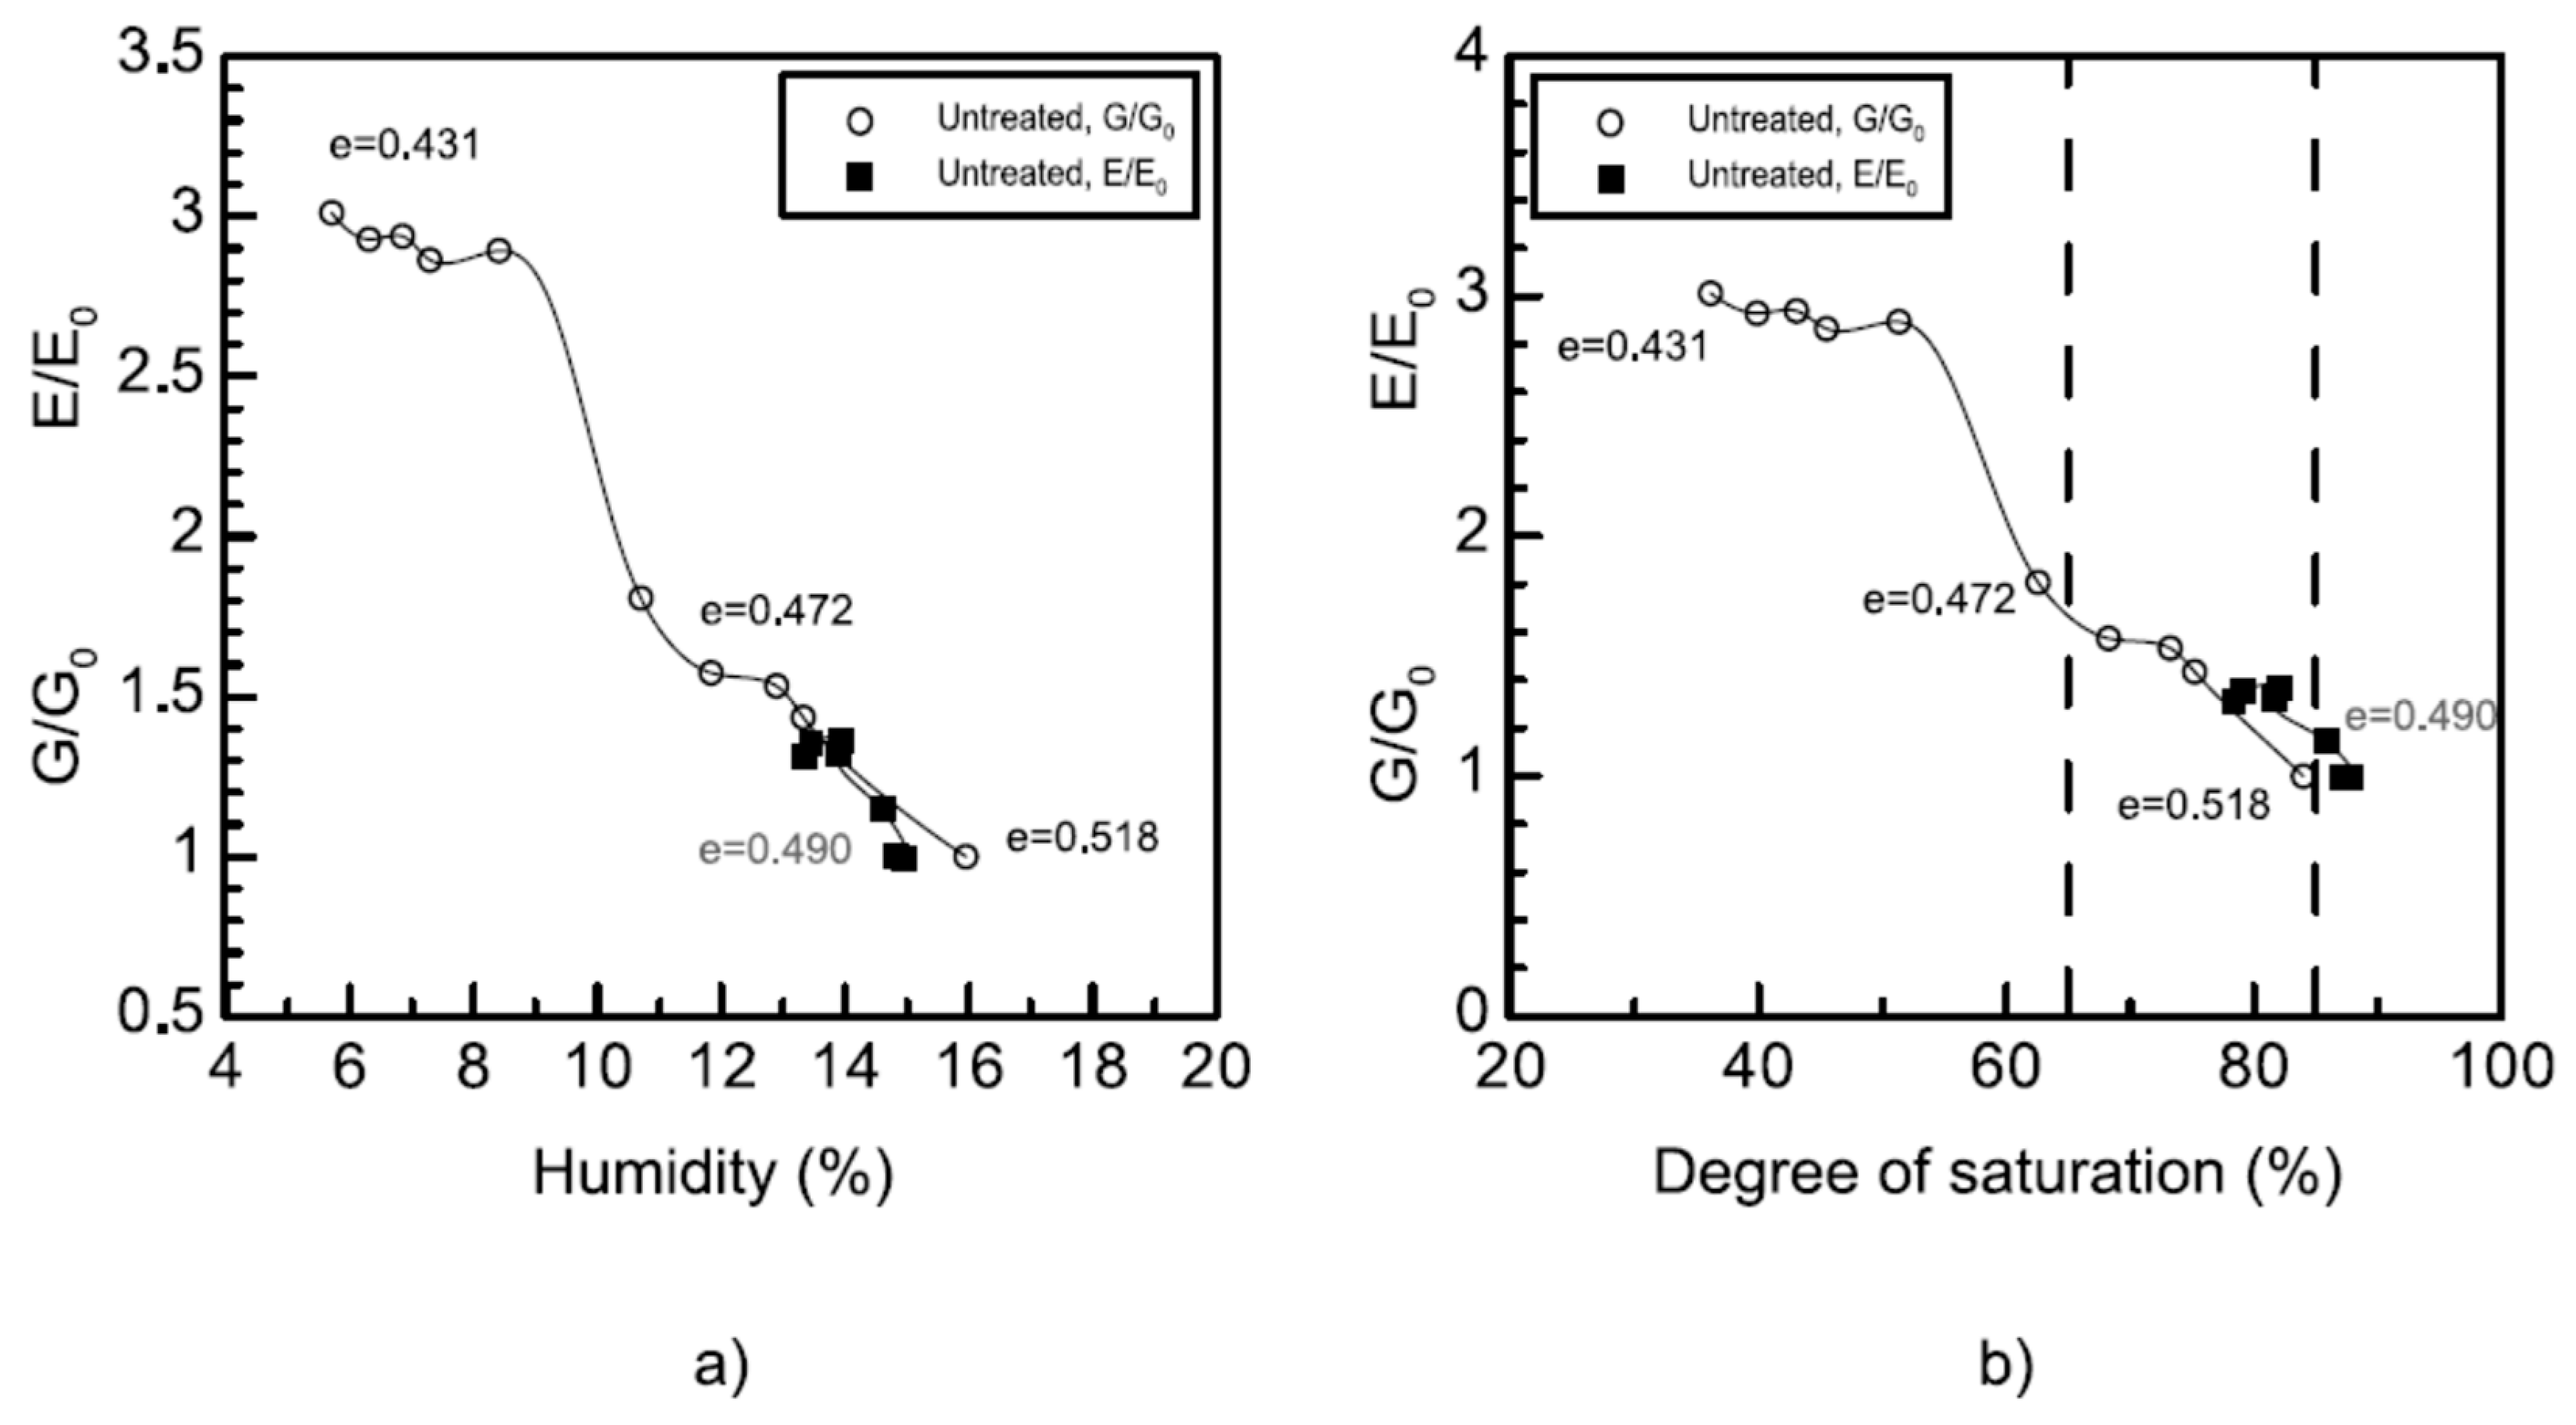
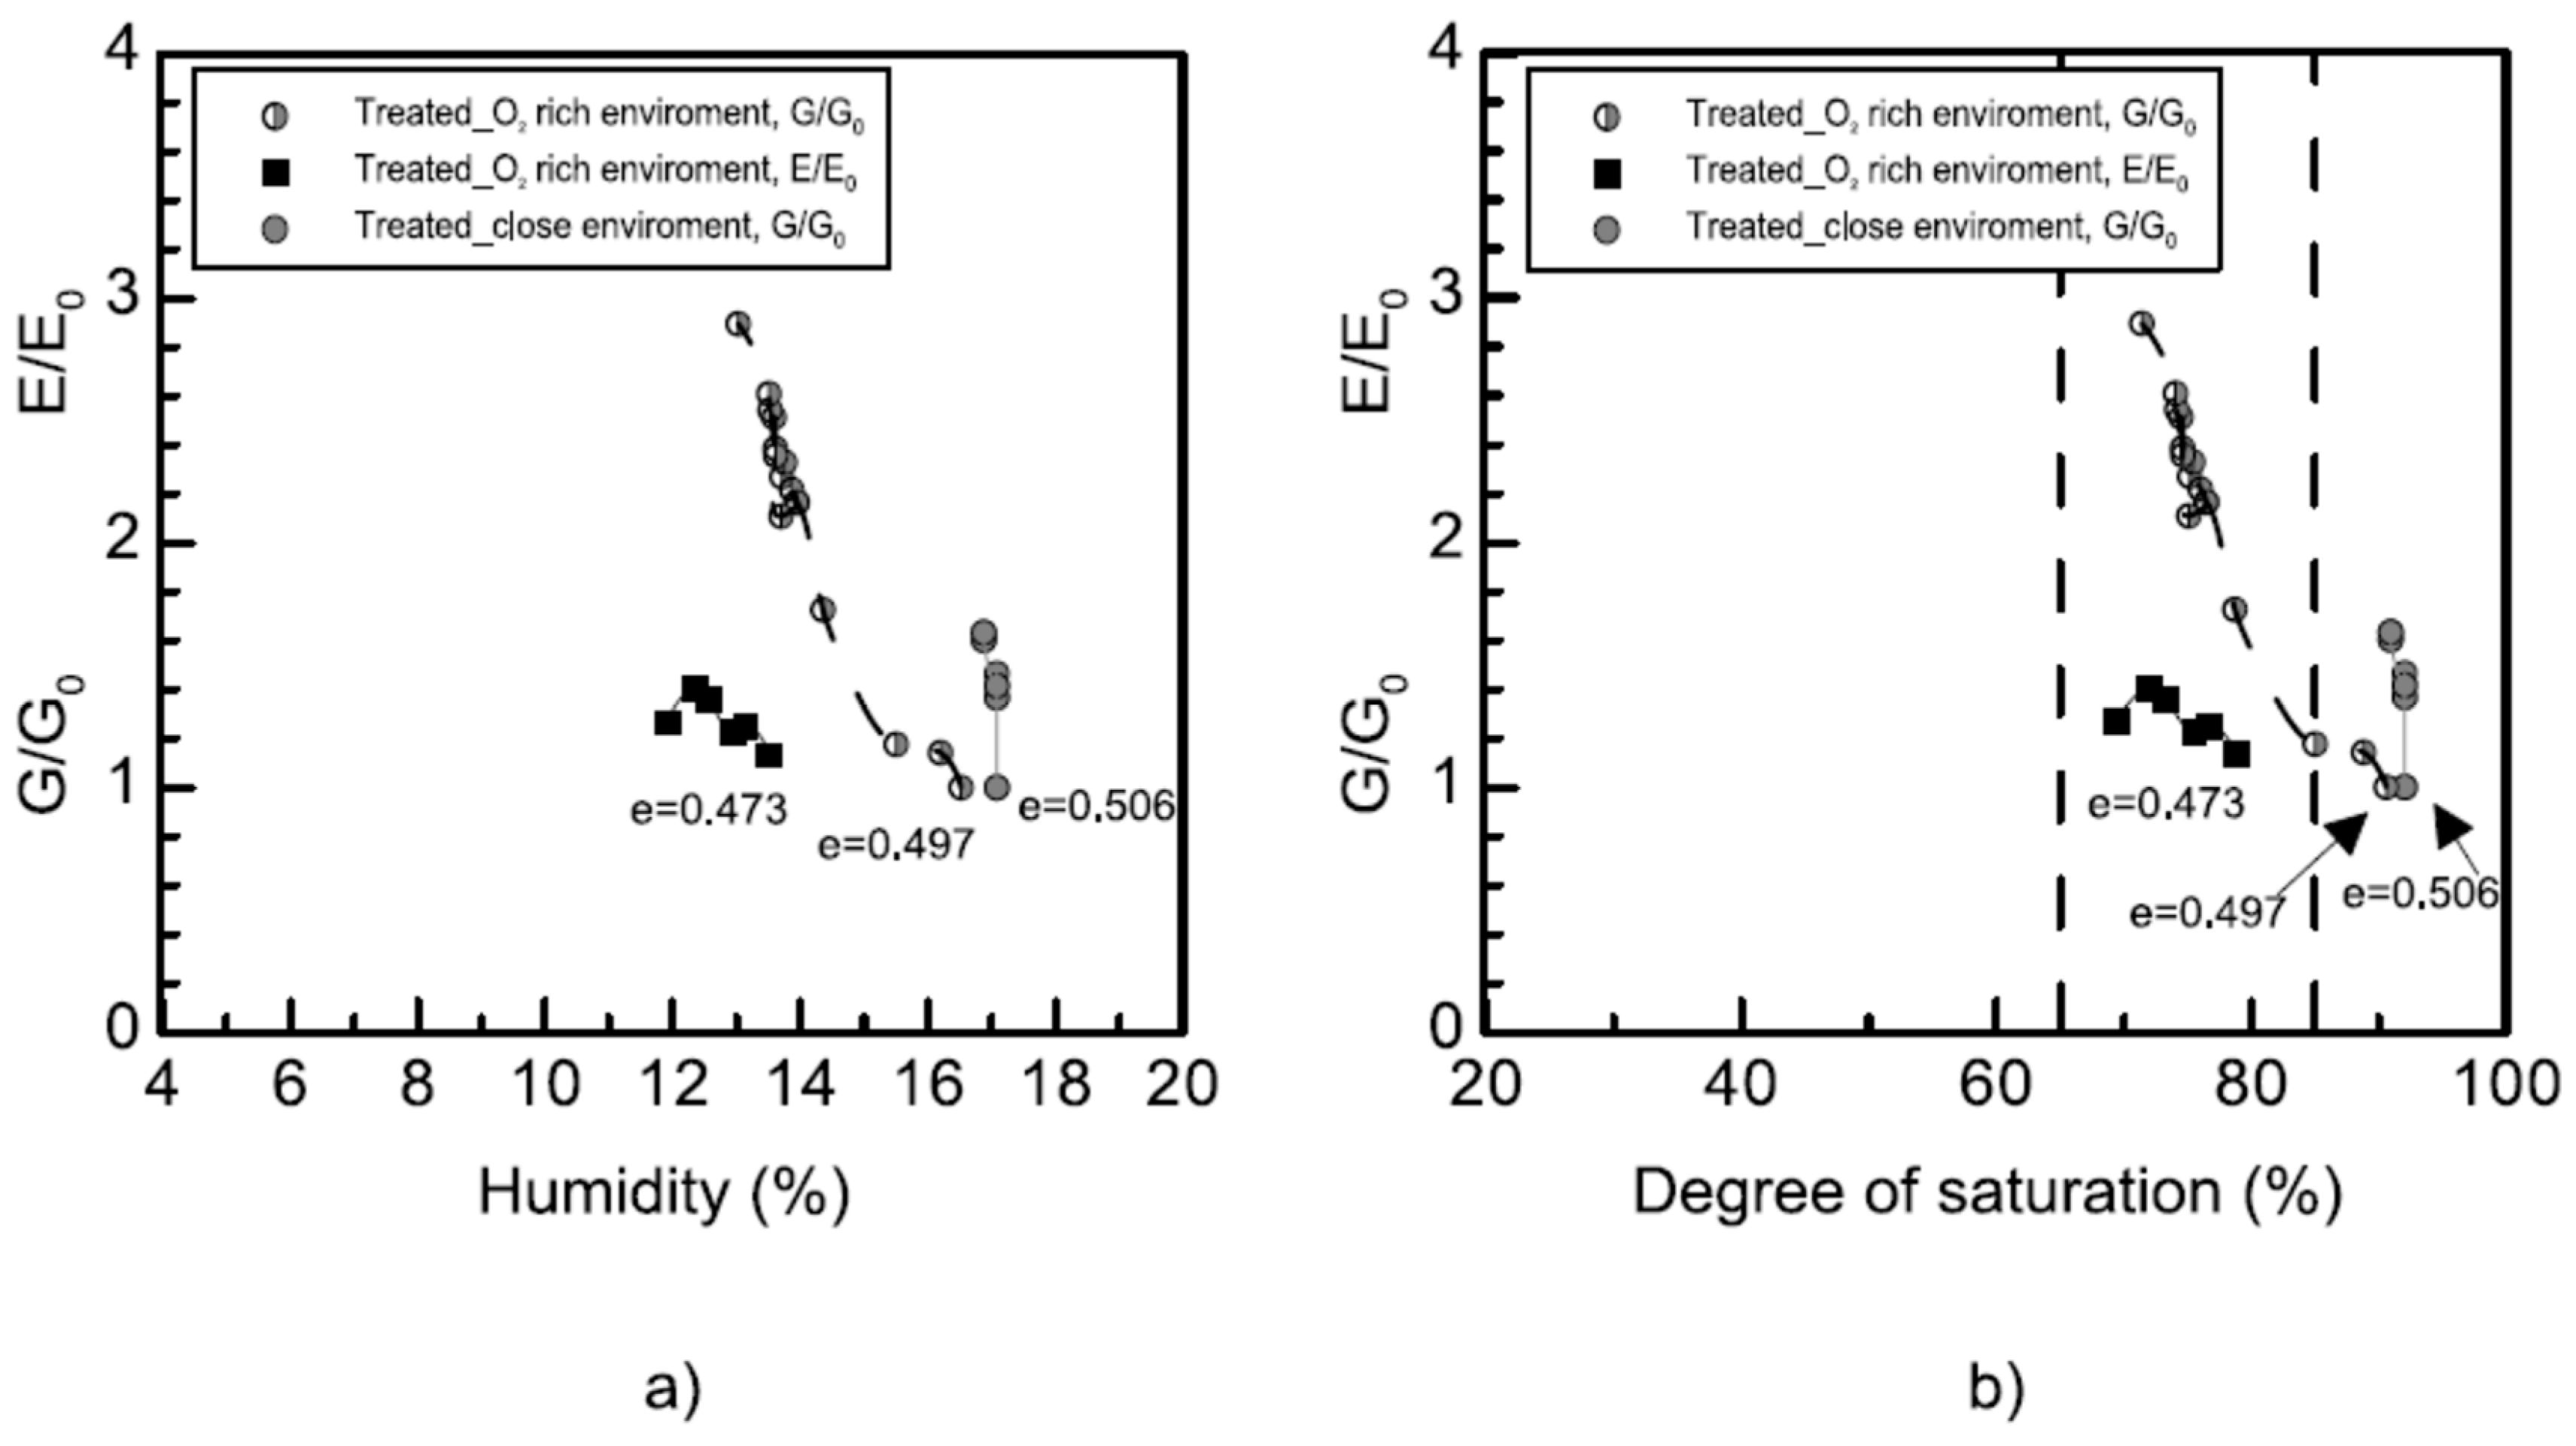
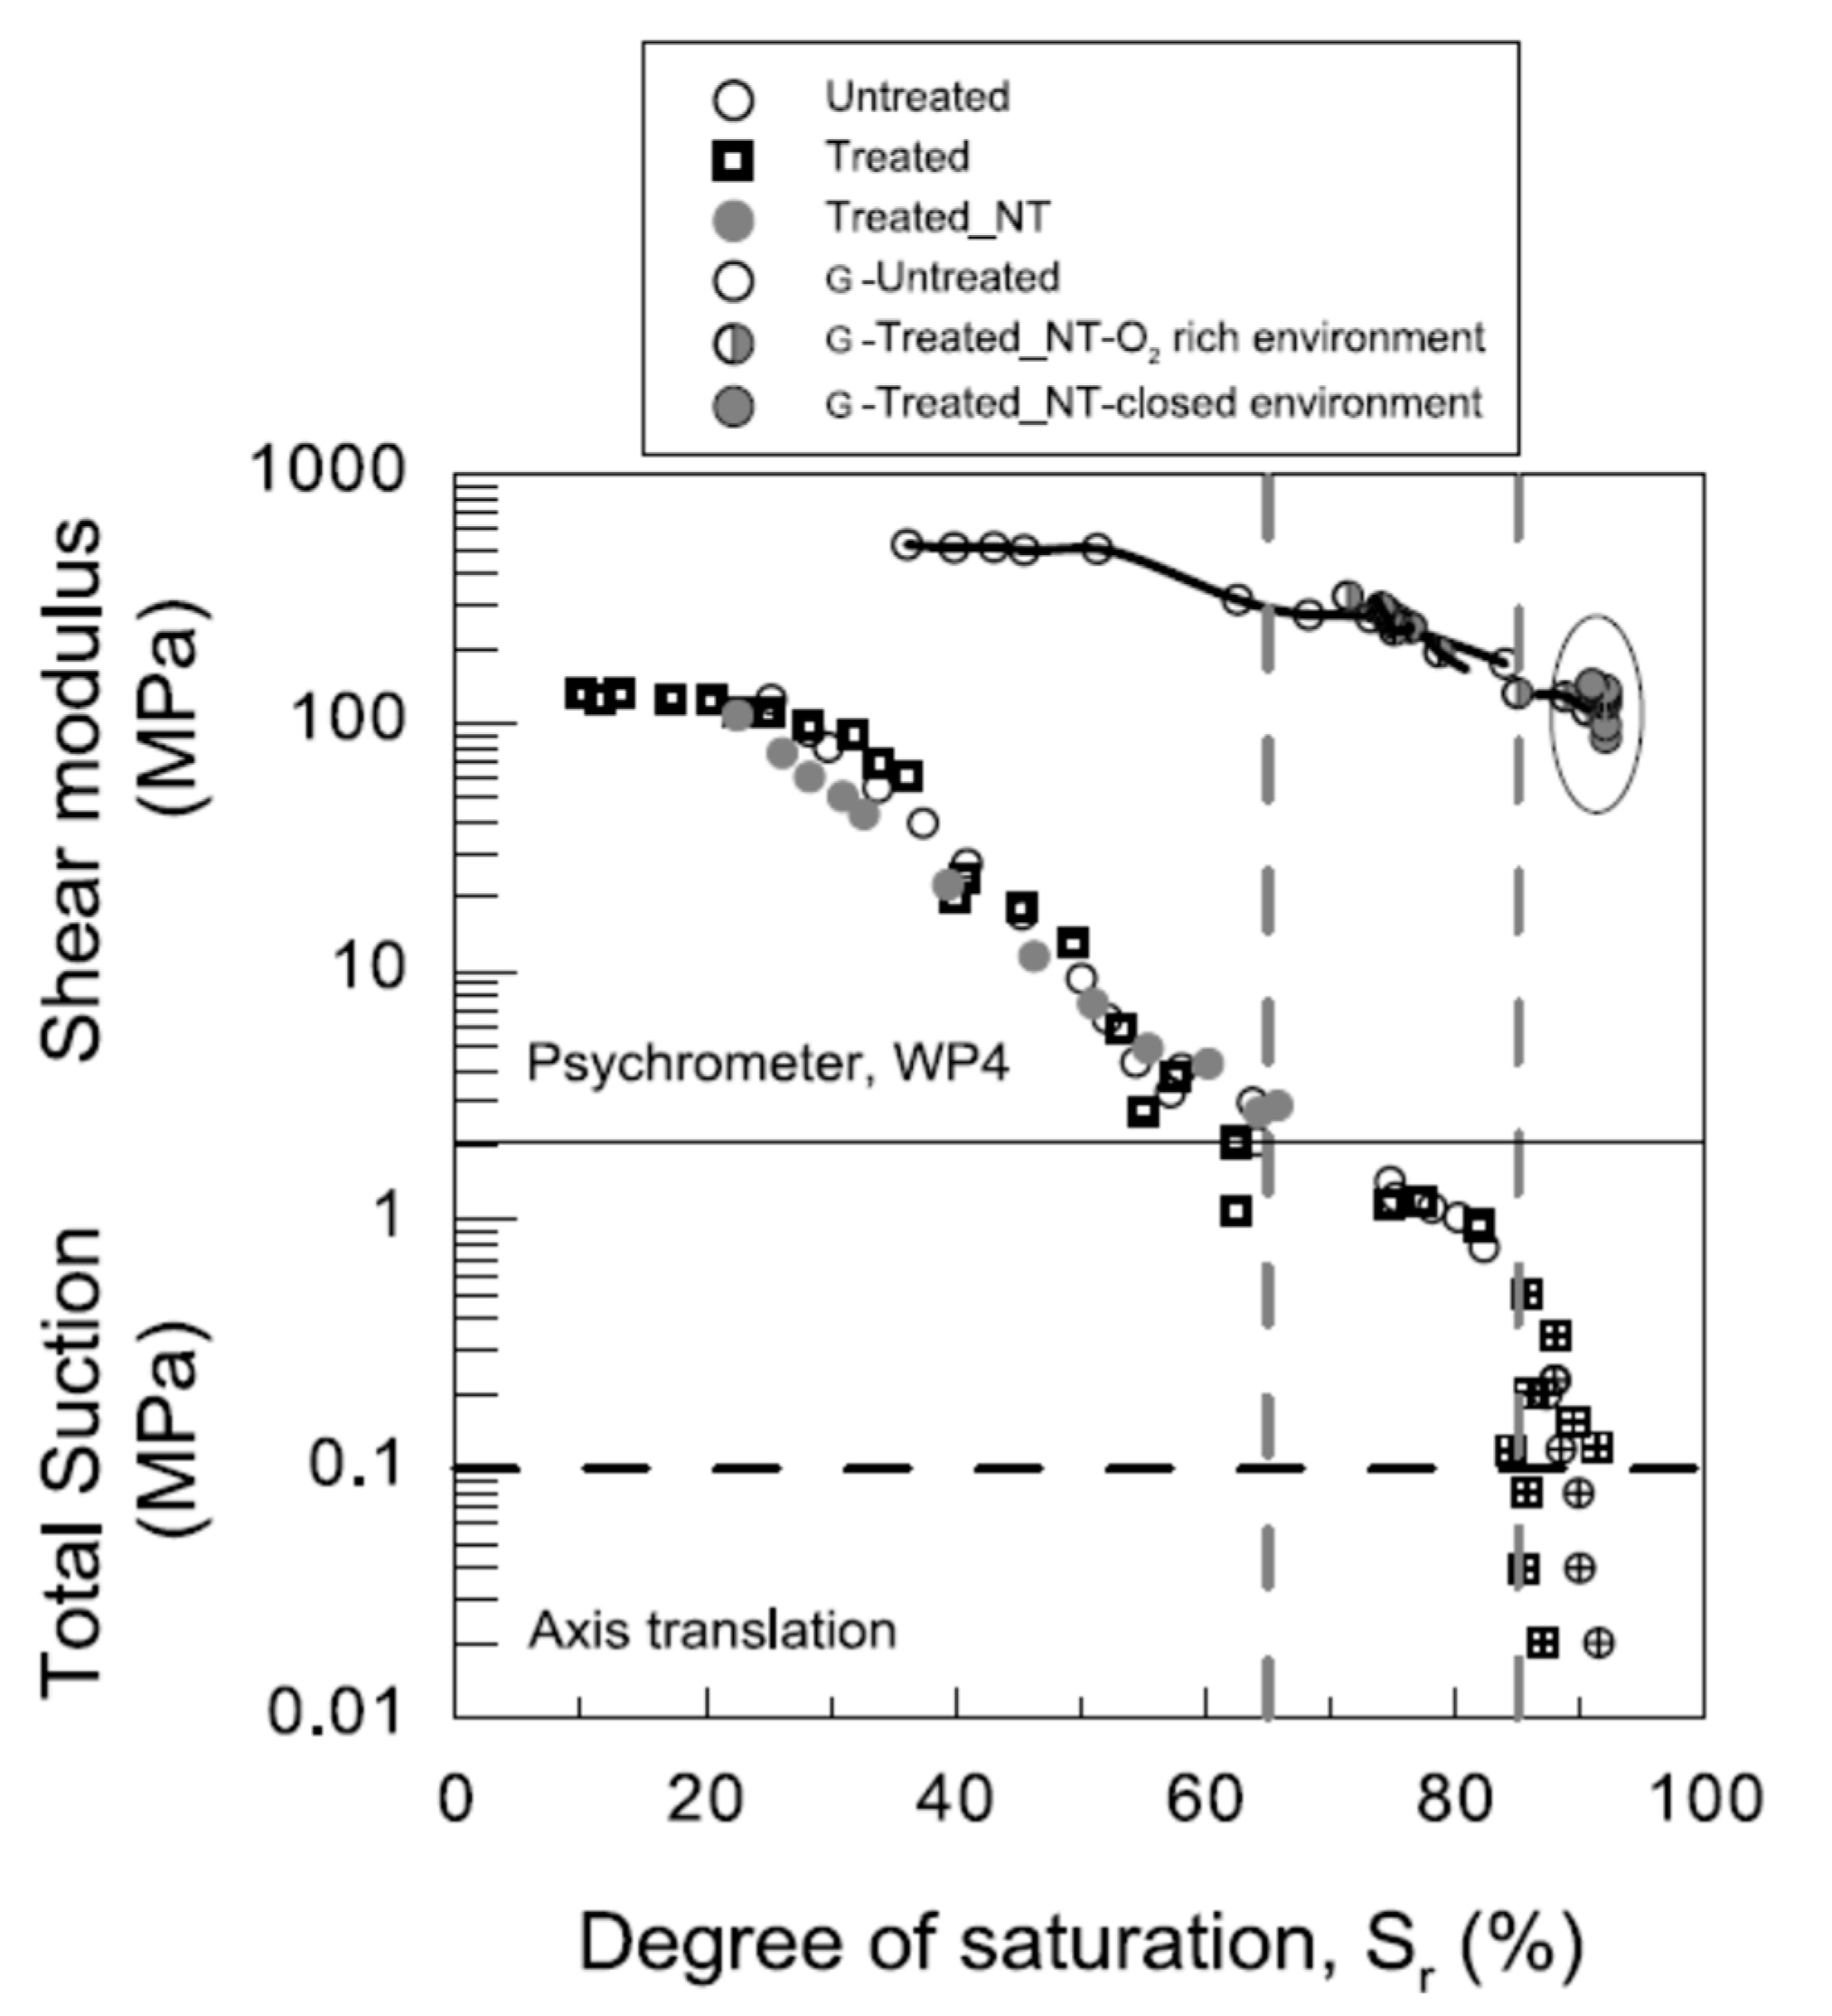
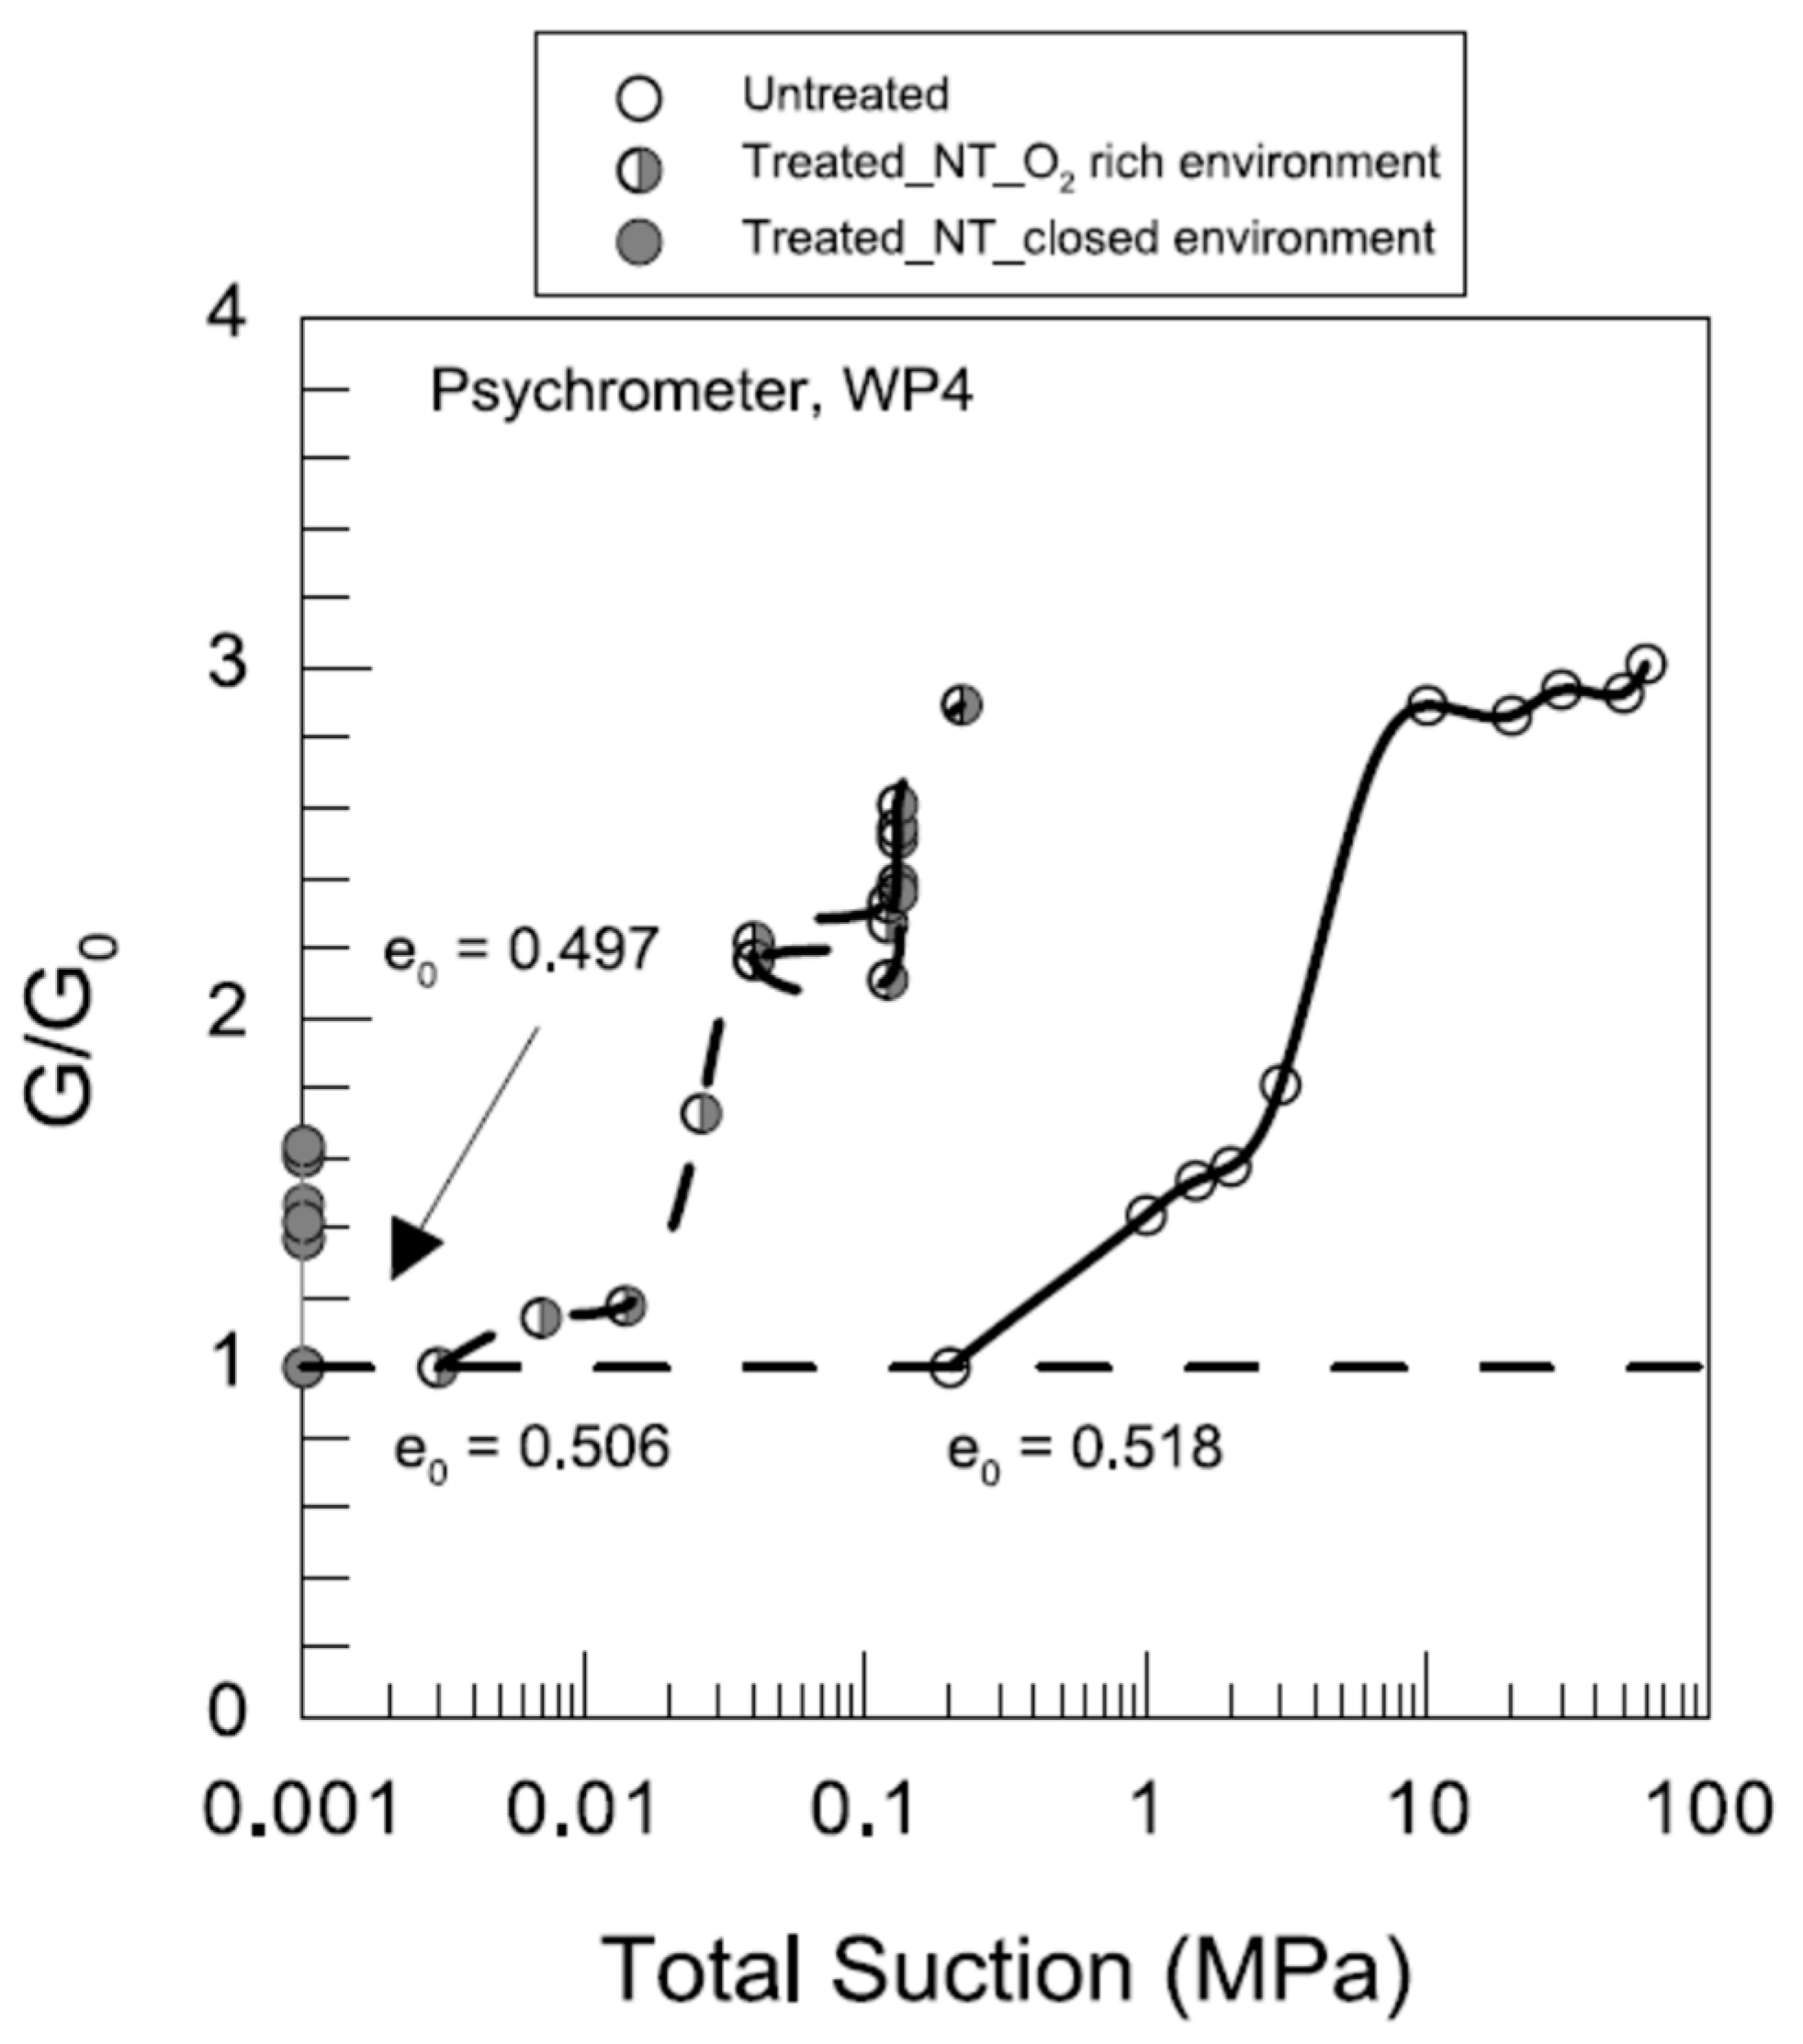
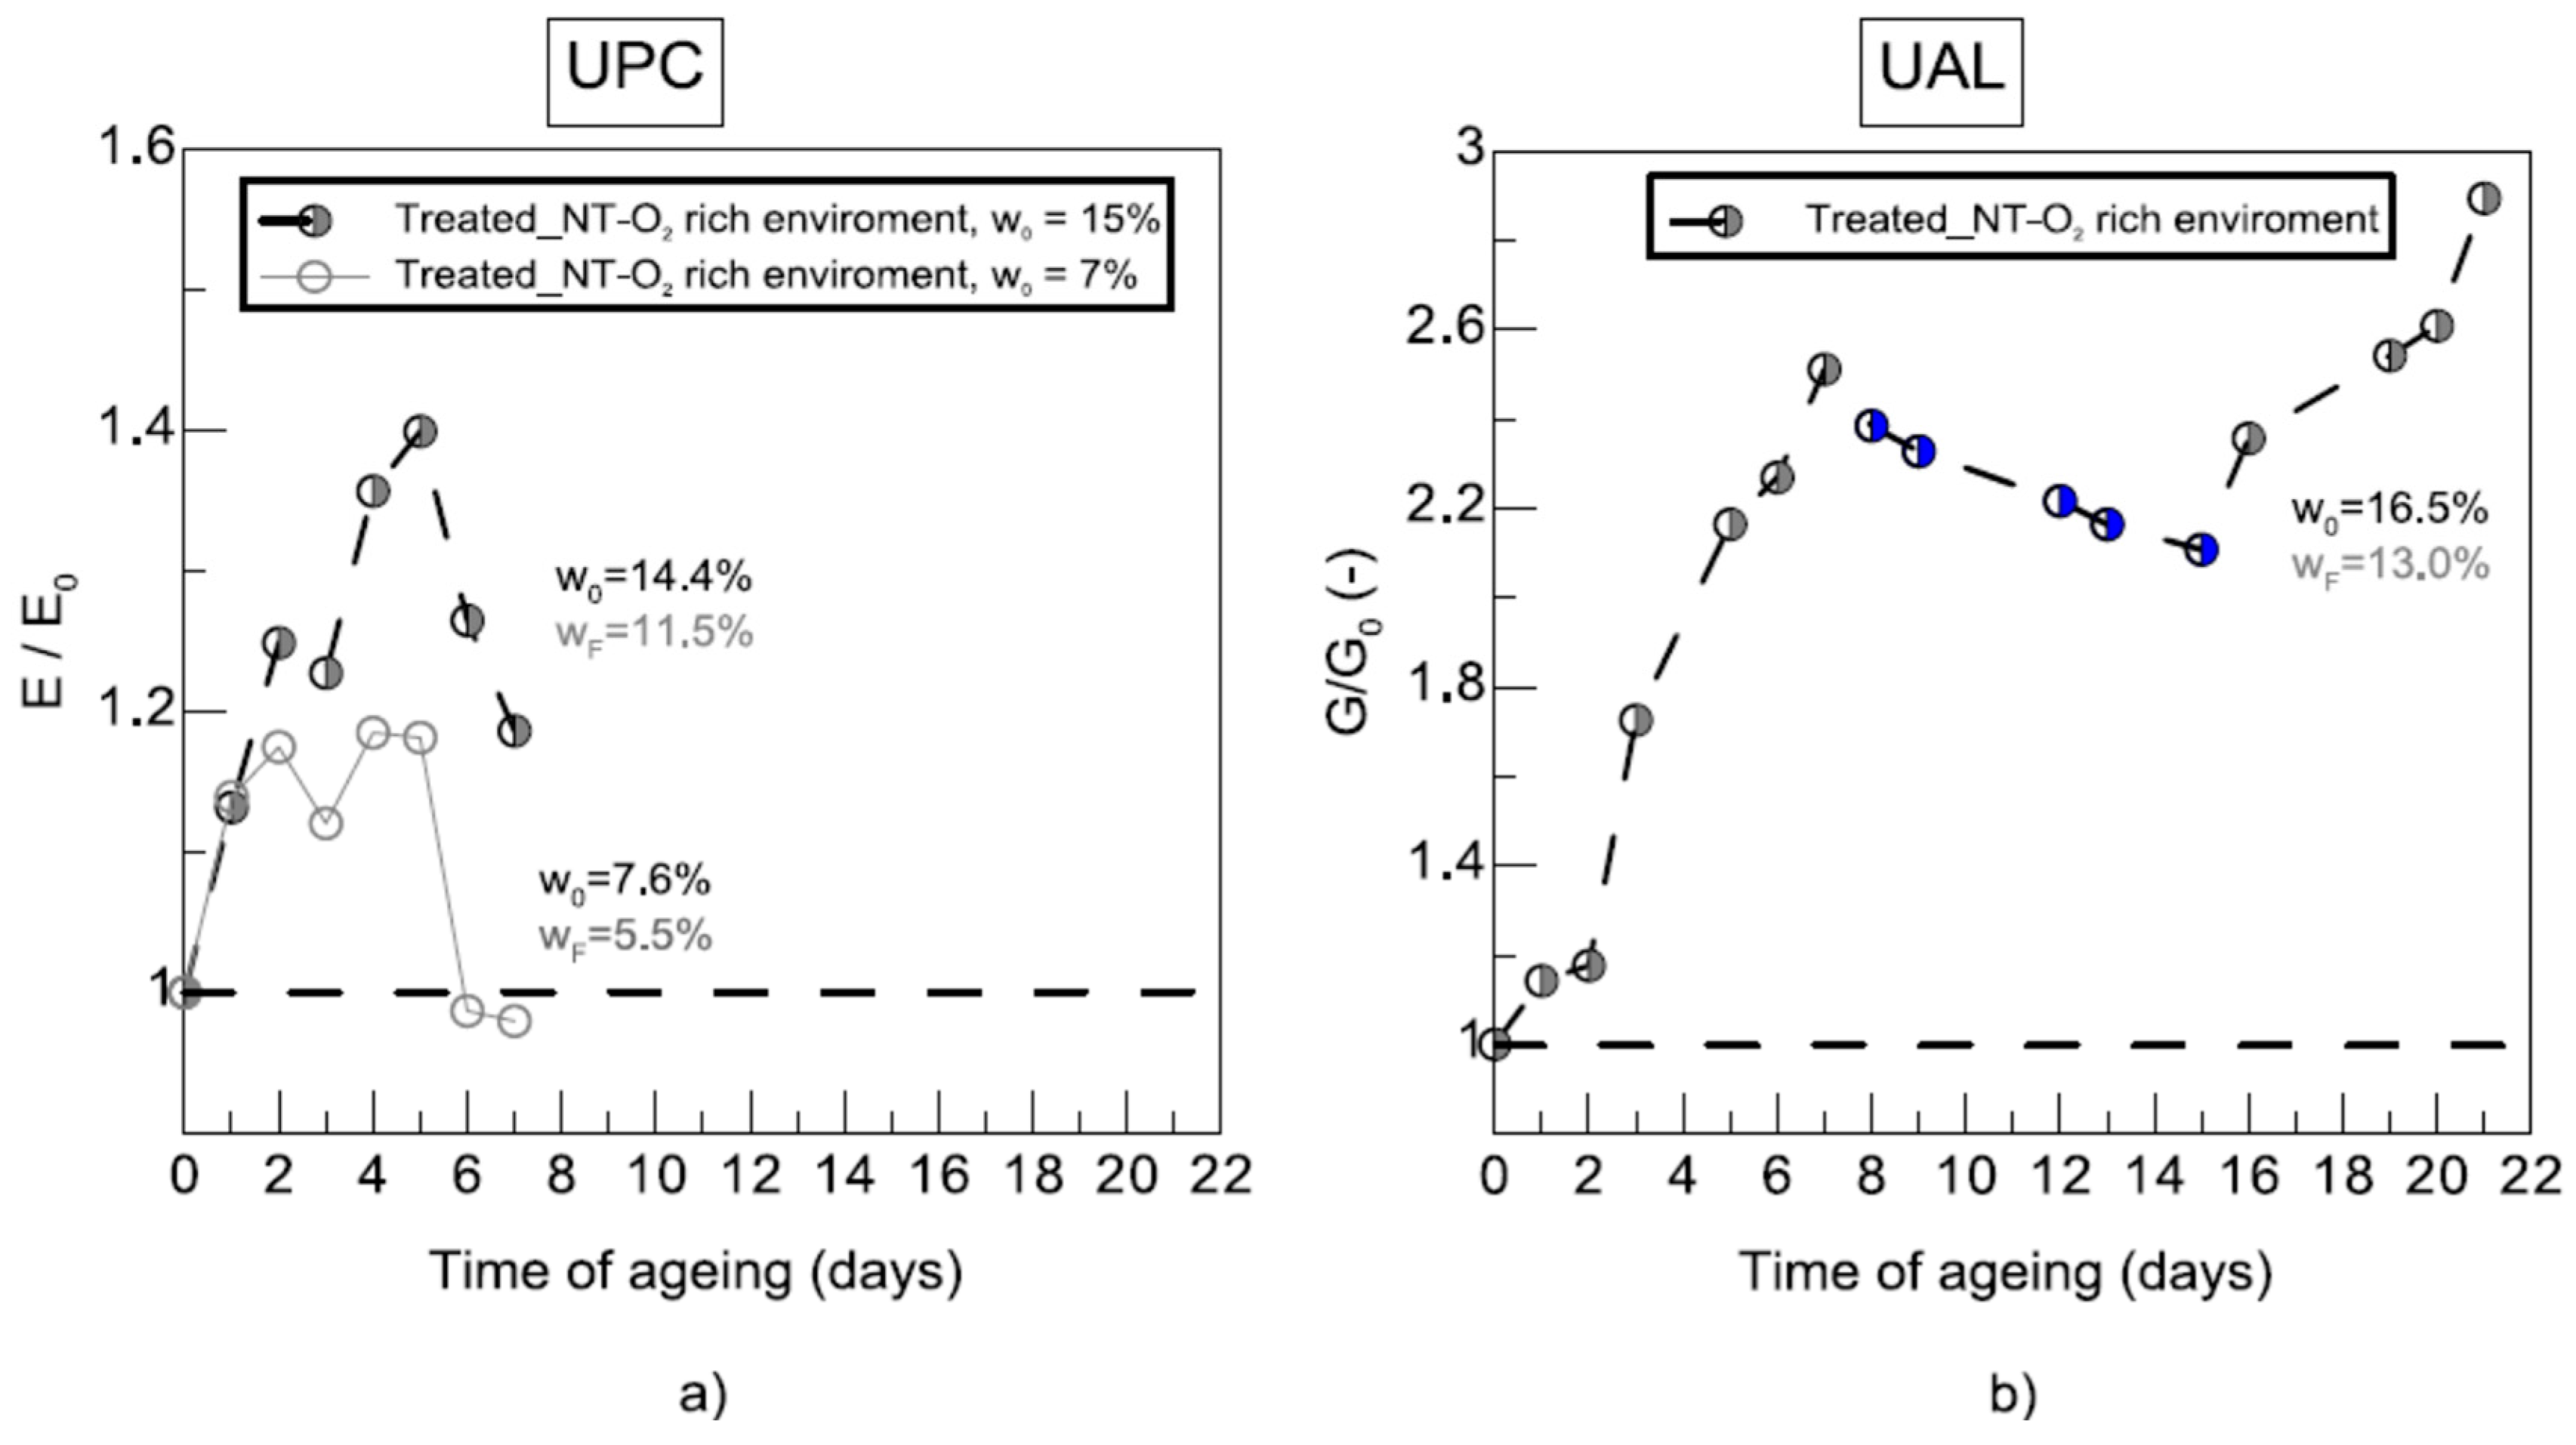
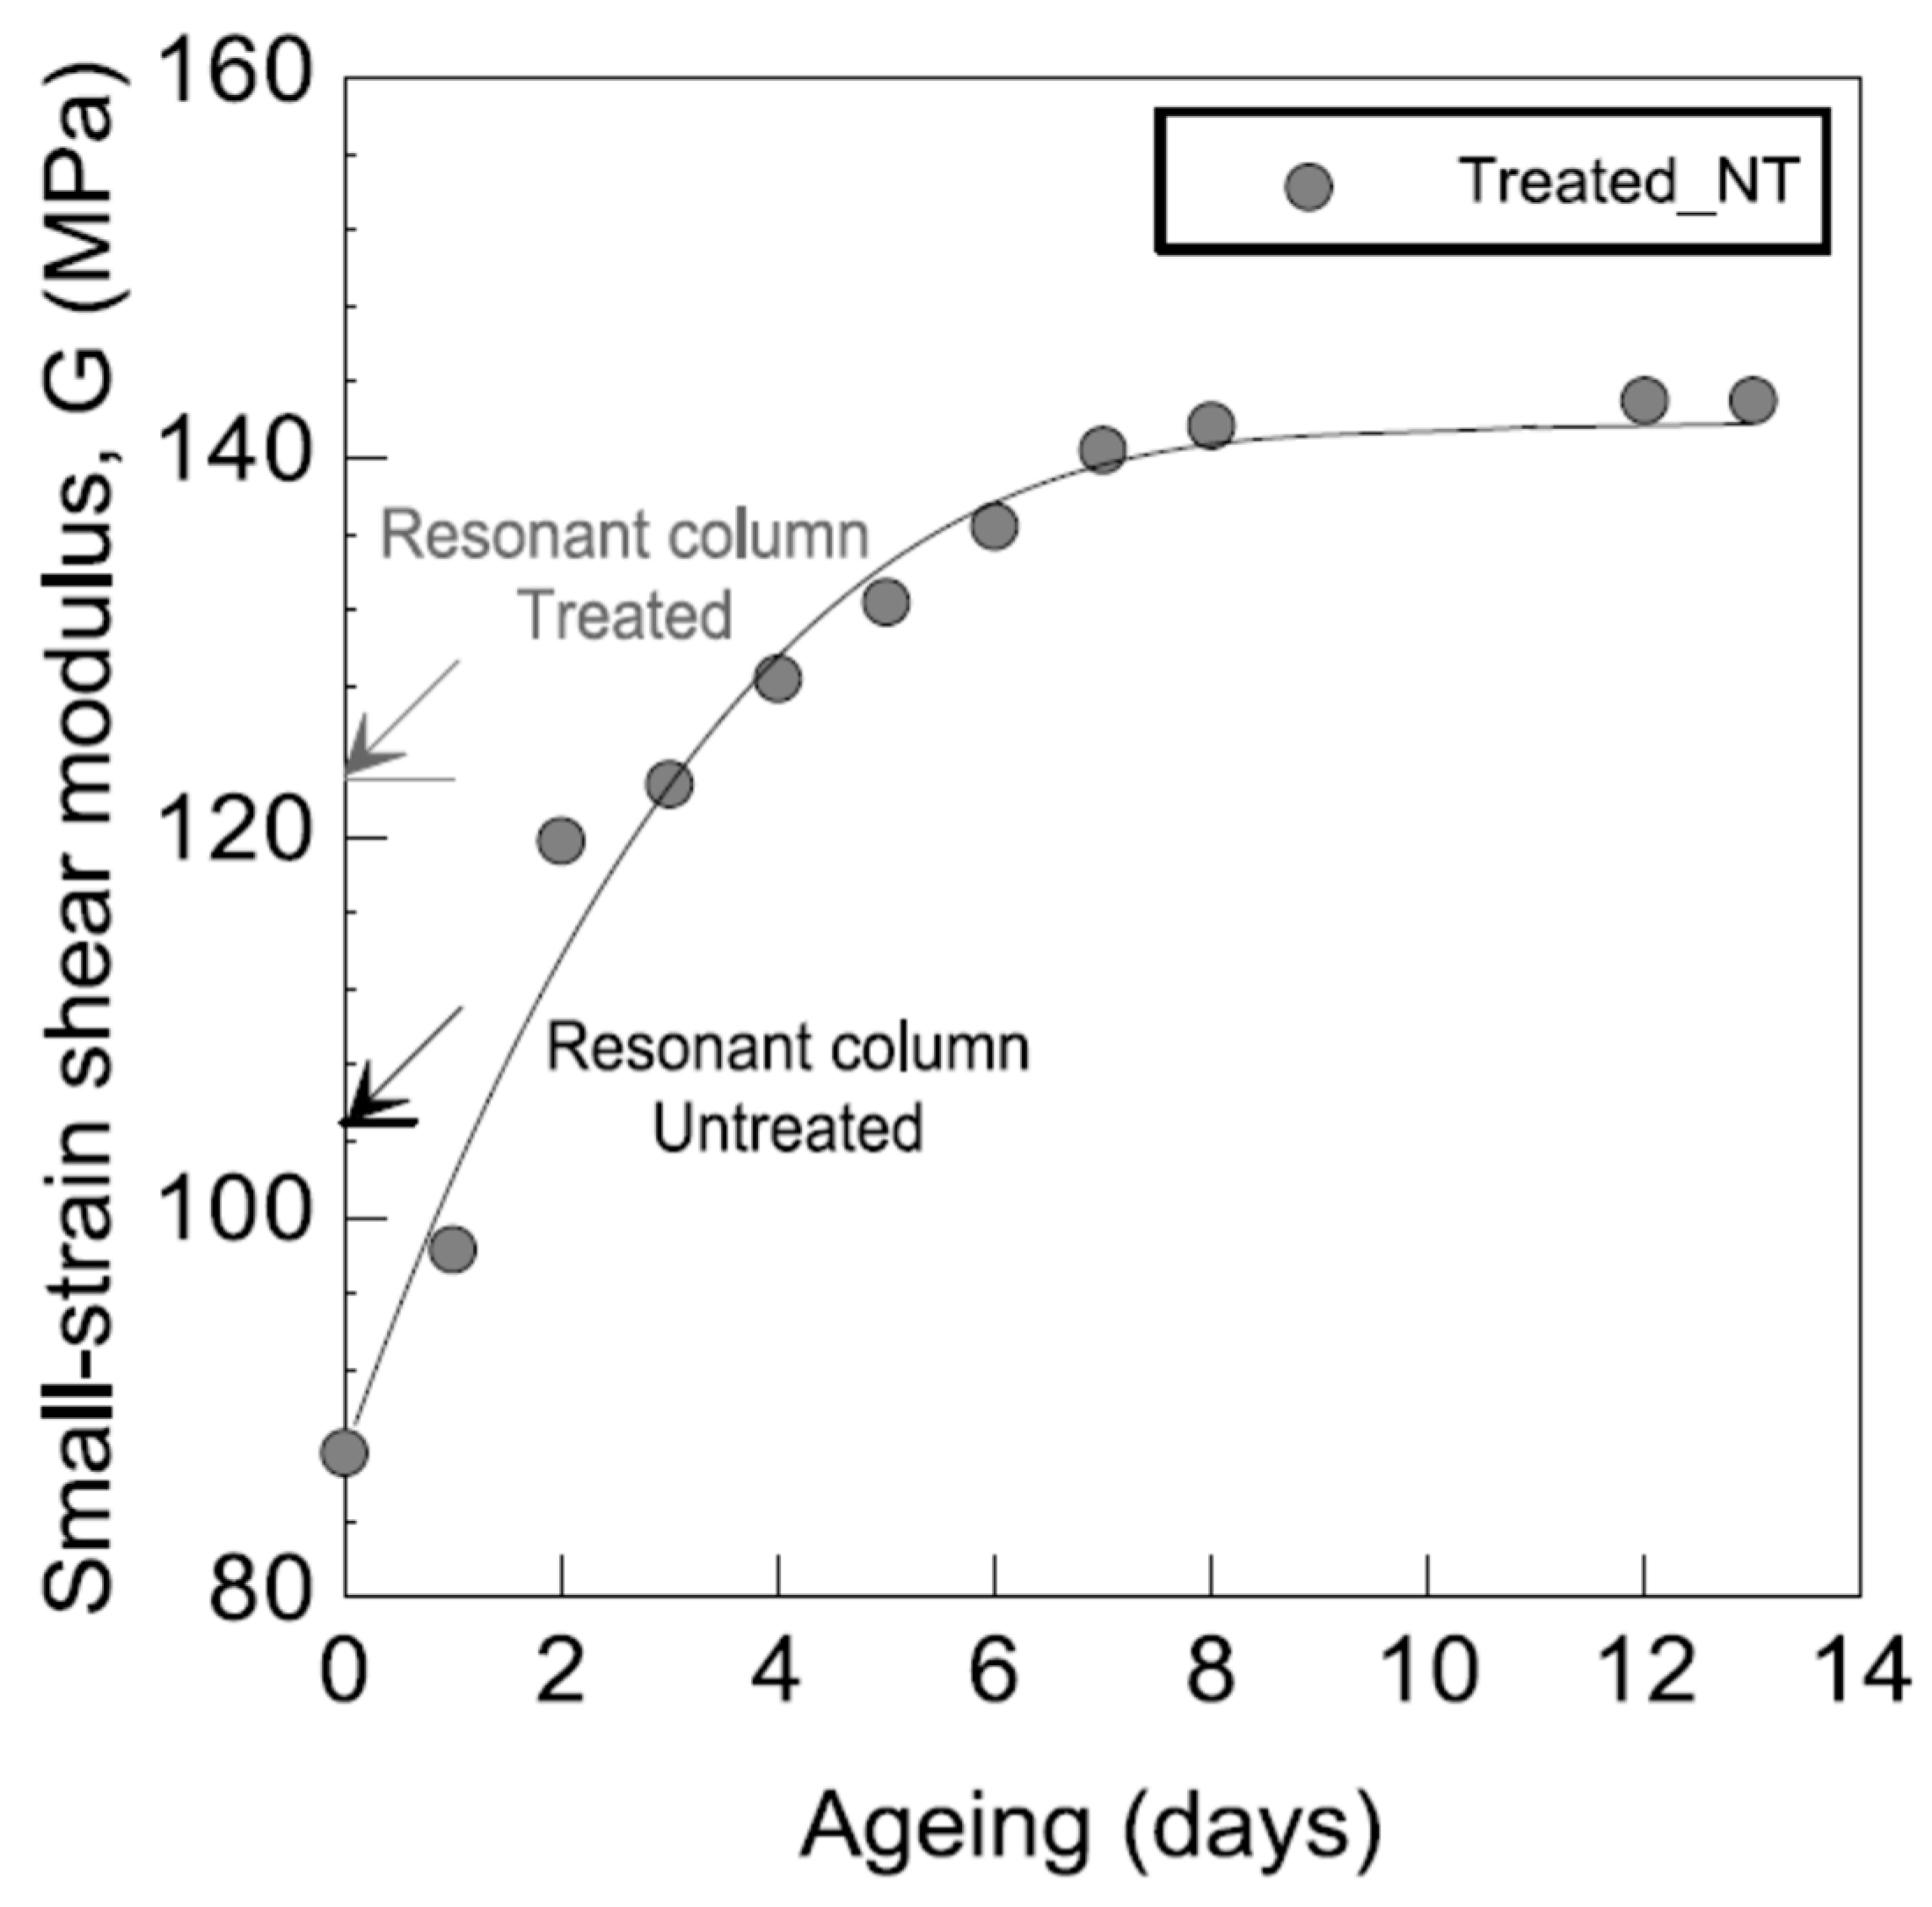
3.2.6. Resonant Column

The time evolution of this stiffness increase is shown in Figure 25. The data from the resonant column were compared with those obtained using the bender elements at a constant water content (15%). The highest small-strain shear stiffness obtained using the torsional resonant-column tests at shear strains below 0.001% and with low confining isotropic stress (σc = 0.1 MPa) are also included in Figure 25 for the treated NT (7 days of curing) and untreated samples. The findings indicate a satisfactory level of concurrence among the outcomes of the various methods utilized to determine the small-strain shear stiffness. One observation is that the untreated material’s resonant-column value was marginally higher than the initial stage of the bender-elements examination of the treated material. This finding is in line with the slightly higher applied confining stress.
Conversely, the small-strain shear stiffness of the substance dealt with, determined by the resonant column, exhibited a slightly inferior to the plateau point achieved through the bender elements of the aged matter. This difference was a consequence of the compaction protocol followed in this investigation. In the bender-element tests, the organogenic bonds and coarse aggregations were not destroyed, since the microbiological treatment was applied on a previously compacted soil. This was not the case for the resonant-column-test results, since the sample was compacted after the microbiological treatment.

4. Conclusions

A study was conducted to examine the feasibility of utilizing microbiological treatment as a means of stabilizing compacted soils that are commonly employed in earthwork construction. The proposed methodology leverages the inherent presence of urea and Ca2+ in the soil, with the sole addition of microorganisms to the compaction water.
This study investigated the changes in small-strain stiffness, unconfined compressive strength, and tensile strength in microbiologically treated and compacted silt–clay sand over a 7-day incubation period. Bacillaceae microorganisms were employed to initiate microbial calcium-carbonate precipitation, thereby enhancing the hydraulic and mechanical characteristics of the compacted soil. The experiment was conducted under two distinct starting water-content conditions, namely, near-optimal standard Proctor conditions and dry conditions. The samples were biotreated and immediately compacted, so that the precipitation of carbonates during the curing process took place in the contact areas between the particles (biocementation) and in the pore spaces (bioclogging).
During the aging process, it was observed that the bacterial activity consumed the water in the hydrolysis of the urea and in other intermediate reactions in order to precipitate the calcium carbonate, resulting in a retraction in the micro-structure and in an increase in the macrostructure. The bioclogging phenomenon was more evident in the soil microstructure, while the biocementation process was easier to observe in the macrostructure.
The findings of the experiment indicate a significant rise in the normalized soil stiffness (G/G0), which was aligned with the moist conditions necessary for the bacteria-induced precipitation of CaCO3.
The investigated specimens exhibited a decrease in water content due to evaporation when subjected to identical aging procedures. Several tests were conducted to investigate the impact of suction on the soil stiffness, revealing a significant increase. Notwithstanding the aforementioned reduction in water content, which led to the augmentation of the soil suction and consequent soil stiffening, a gradual enhancement in the small-strain stiffness was observed throughout the incubation period.
With respect to the unconfined and tensile-compression tests, it was observed that there was a comparable gradual increase in the peak compressive and peak splitting strengths as part of the incubation period. Nonetheless, during these experiments, the increase in suction resulting from the partial depletion of the water content served to obscure the effects of the biological processes on the aging of the material. All these results are of interest for future investigations on simultaneous biocementation and compaction to prevent the breakage of cementitious structures during the execution of earthwork constructions.

Author Contributions

Conceptualization E.G.G.; methodology, E.G.G. and E.R.M.; investigation: L.M.H. and E.G.G.; resources: E.G.G.; project administration: E.G.G. and L.M.H.; formal analysis: L.M.H., E.R.M. and P.J.S.-S.; visualization: L.M.H., E.G.G. and E.R.M.; software: L.M.H. and E.R.M.; supervision: E.G.G.; data curation: L.M.H.; writing-original draft preparation: E.G.G.; writing—review and editing: P.J.S.-S., E.G.G., L.M.H. and E.R.M.; supervision: L.M.H., E.G.G. and P.J.S.-S. All authors have reviewed and consented to this manuscript. All authors have read and agreed to the published version of the manuscript.

Funding

Part of this work was undertaken within the framework of the BIOLIN Project (000697), “Biotechnology of linear works,” in the context of an agreement between ACCIONA Infraestructuras and the University of Almería.

Data Availability Statement

Not applicable.

Acknowledgments

L.M.: expresses gratitude to the University of Almería for a research grant to facilitate their doctoral investigation. The Department of Applied Biology at the University of Almería is acknowledged for their support in conducting the microbiological analysis. Jubert Pineda is acknowledged for the experimental contribution and interpretation of results concerning the bender element.

Conflicts of Interest

The authors assert that there is no conflict of interest. The findings presented in this document are solely attributed to the authors and do not necessarily represent the viewpoints of ACCIONA Infraestructuras.

References

  1. Seagren, E.A.; Aydilek, A.H. Bioremediated Geomechanical Processes. In Environmental Microbiology; John Wiley and Sons: New York, NY, USA, 2010; pp. 319–348. [Google Scholar]
  2. Lian, B.; Hu, Q.; Chen, J.; Ji, J.; Teng, H.H. Carbonate Biomineralization Induced by Soil Bacterium Bacillus Megaterium. Geochim. Cosmochim. Acta 2006, 70, 5522–5535. [Google Scholar] [CrossRef]
  3. Castanier, S.; Le Métayer-Levrel, G.; Perthuisot, J. Ca-Carbonates Precipitation and Limestone Genesis—The Microbiogeologist Point of View. Sediment. Geol. 1999, 126, 9–23. [Google Scholar] [CrossRef]
  4. Rivadeneyra, M.A.; Delgado, R.; del Moral, A.; Ferrer, M.R.; Ramos-Cormenzana, A. Precipitation of Calcium Carbonate by Vibrio Spp. from an Inland Saltern. FEMS Microbiol. Ecol. 1994, 13, 197–204. [Google Scholar] [CrossRef]
  5. Okwadha, G.D.O.; Li, J. Optimum Conditions for Microbial Carbonate Precipitation. Chemosphere 2010, 81, 1143–1148. [Google Scholar] [CrossRef] [PubMed]
  6. Guo, W.; Ma, H.; Li, F.; Jin, Z.; Li, J.; Ma, F.; Wang, C. Citrobacter Sp. Strain GW-M Mediates the Coexistence of Carbonate Minerals with various Morphologies. Geomicrobiol. J. 2013, 30, 749–757. [Google Scholar] [CrossRef]
  7. Silva-Castro, G.A.; Uad, I.; Rivadeneyra, A.; Vilchez, J.I.; Martin-Ramos, D.; González-López, J.; Rivadeneyra, M.A. Carbonate Precipitation of Bacterial Strains Isolated from Sediments and Seawater: Formation Mechanisms. Geomicrobiol. J. 2013, 30, 840–850. [Google Scholar] [CrossRef]
  8. Barabesi, C.; Galizzi, A.; Mastromei, G.; Rossi, M.; Tamburini, E.; Perito, B. Bacillus Subtilis Gene Cluster Involved in Calcium Carbonate Biomineralization. J. Bacteriol. 2007, 189, 228–235. [Google Scholar] [CrossRef] [PubMed]
  9. Saxena, S.K.; Lastrico, R.M. Static Properties of Lightly Cemented Sand. ASCE J. Geotech. Eng. Div. 1978, 104, 1449–1464. [Google Scholar] [CrossRef]
  10. Boquet, E.; Boronat, A.; Ramos Cormenzana, A. Production of Calcite (Calcium Carbonate) Crystals by Soil Bacteria is a General Phenomenon. Nature 1973, 246, 527–529. [Google Scholar] [CrossRef]
  11. Knorre, H.; Krumbein, W.E. Bacterial Calcification. In Microbial Sediments; Riding, R., Awramik, S.M., Eds.; Springer: Berlin/Heidelberg, Germany, 2000; pp. 25–31. [Google Scholar]
  12. McConnaughey, T.A.; Whelan, J.F. Calcification Generates Protons for Nutrient and Bicarbonate Uptake. Earth Sci. Rev. 1997, 42, 95–117. [Google Scholar] [CrossRef]
  13. Hammes, F.; Verstraete, W. Key Roles of pH and Calcium Metabolism in Microbial Carbonate Precipitation. Re. Environ. Sci. Bio/Technol. 2002, 1, 3–7. [Google Scholar] [CrossRef]
  14. Whiffin, V.S. Microbial CaCO3 Precipitation for the Production of Biocement. Ph.D. Thesis, Murdoch University, Perth, Australia, 2004. [Google Scholar]
  15. Ivanov, V.; Chu, J. Applications of Microorganisms to Geotechnical Engineering for Bioclogging and Biocementation of Soil in Situ. Rev. Environ. Sci. Biotechnol. 2008, 7, 139–153. [Google Scholar] [CrossRef]
  16. Xiao, Y.; Xiao, W.; Wu, H.; Liu, H. Fracture of Interparticle MICP Bonds under Compression. Int. J. Geomech. 2023, 23, 04022316. [Google Scholar] [CrossRef]
  17. Sutton, M.; Reis, S.; Baker, S. Atmospheric ammonia: Detecting emission changes and environmental impact. In Results of an Expert Workshop Under the Convention on Long-Range Transboundary Air Pollution; Springer: Berlin/Heidelberg, Germany, 2008. [Google Scholar]
  18. van Paassen, L.A.; Daza, C.M.; Staal, M.; Sorokin, D.Y.; van der Zon, W.; van Loosdrecht, M.C.M. Potential Soil Reinforcement by Biological Denitrification. Ecol. Eng. 2010, 36, 168–175. [Google Scholar] [CrossRef]
  19. van Paassen, L.A.; Ghose, R.; van der Linden, T.J.M.; van der Star, W.R.L.; van Loosdrecht, M.C.M. Quantifying Biomediated Ground Improvement by Ureolysis: Large-Scale Biogrout Experiment. J. Geotech. Geoenviron. Eng. 2010, 136, 1721–1728. [Google Scholar] [CrossRef]
  20. De Muynck, W.; De Belie, N.; Verstraete, W. Microbial Carbonate Precipitation in Construction Materials: A Review. Ecol. Eng. 2010, 36, 118–136. [Google Scholar] [CrossRef]
  21. Carretero, M.I.; Bernabé, J.M.; Galán, E. Application of Sepiolite-Cellulose Pastes for the Removal of Salts from Building Stones. Appl. Clay. Sci. 2006, 33, 43–51. [Google Scholar] [CrossRef]
  22. Rubio, A.; Escudero, A. Effect of Climate and Physiography on Occurrence and Intensity of Decarbonation in Mediterranean Forest Soils of Spain. Geoderma 2005, 125, 309–319. [Google Scholar] [CrossRef]
  23. DeJong, J.T.; Mortensen, B.M.; Martinez, B.C.; Nelson, D.C. Bio-Mediated Soil Improvement. Ecol. Eng. 2010, 36, 197–210. [Google Scholar] [CrossRef]
  24. DeJong, J.T.; Soga, K.; Kavazanjian, E.; Burns, S.; van Paassen, L.; Fragaszy, R.; Al Qabany, A.; Aydilek, A.; Bang, S.S.; Burbank, M.; et al. Biogeochemical Processes and Geotechnical Applications: Progress, Opportunities, and Challenges. Géotechnique 2013, 63, 287–301. [Google Scholar] [CrossRef]
  25. Gowthaman, S.; Nakashima, K.; Ebina, K.; Kawasaki, S. Biocementation for Slope Soil Stabilization against Surface Erosion: A Bench-scale Preliminary Investigation. In 53rd US Rock Mechanics/Geomechanics Symposium; American Rock Mechanics Association (ARMA): Alexandria, VA, USA, 2019; pp. 19–406. [Google Scholar]
  26. Zhang, J.; Shi, X.; Chen, X.; Huo, X.; Yu, Z. Microbial-Induced Carbonate Precipitation: A Review on Influencing Factors and Applications. Adv. Civil Eng. 2021, 2021, 9974027. [Google Scholar] [CrossRef]
  27. Iqbal, D.M.; Wong, L.S.; Kong, S.Y. Bio-Cementation in Construction Materials: A Review. Materials 2021, 14, 2175. [Google Scholar] [CrossRef]
  28. Yu, T.; Souli, H.; Pechand, Y.; Fleureau, J.M. Review on Engineering properties of MICP-treated soils. Geomech. Eng. 2021, 27, 13–30. [Google Scholar]
  29. Valencia-Galindo, M.; Sáez, E.; Ovalle, C.; Ruz, F. Evaluation of the Effectiveness of a Soil Treatment Using Calcium Carbonate Precipitation from Cultivated and Lyophilized Bacteria in Soil’s Compaction Water. Buildings 2021, 11, 545. [Google Scholar] [CrossRef]
  30. Verma, H.; Ray, A.; Rai, R.; Gupta, T.; Mehta, N. Ground improvement using Chemical methods: A review. Heliyon 2021, 7, e07678. [Google Scholar] [CrossRef] [PubMed]
  31. Wu, H.; Wu, W.; Liang, W.; Dai, F.; Liu, H.; Xiao, Y. 3D DEM modeling of biocemented sand with fines as cementing agents. Int. J. Numer. Anal. Methods 2023, 47, 212–240. [Google Scholar] [CrossRef]
  32. Morales, L.; Romero, E.; Jommi, C.; Garzón, E.; Giménez, A. Feasibility of a soft biological improvement of natural soils used in compacted linear earth construction. Acta Geotech. 2013, 10, 157–171. [Google Scholar] [CrossRef]
  33. Morales, L.; Garzón, E.; Romero, E.; Jommi, C. Effects of a microbiological compound for the stabilisation of compacted soils on their microstructure and hydro-mechanical behaviour. In Proceedings of the 5th International Conference on Unsaturated Soils, Barcelona, Spain, 6–8 September 2010; pp. 573–578. [Google Scholar]
  34. Viggiani, G.; Atkinson, J.H. Stiffness of Fine-Grained Soil at very Small Strains. Geotechnique 1995, 45, 249–265. [Google Scholar] [CrossRef]
  35. Blangy, J.P.; Strandenes, S.; Moos, D.; Nur, A. Ultrasonic velocities in sands; revisited. Geophysics 1993, 58, 344–356. [Google Scholar] [CrossRef]
  36. Pineda, J.A.; Mitaritonna, G.; Romero, E.; Arroyo, M. Effects of hydraulic cycling on the stiffness response of a rigid clay. In Proceedings of the 5th International Conference on Unsaturated Soils, Barcelona, Spain, 6–8 September 2010; pp. 1465–1470. [Google Scholar]
  37. Pineda, J.A. Swelling and Degradation of Argillaceous Rocks Induced by Relative Humidity Effects: An Experimental Study. Ph.D. Thesis, Universitat Politècnica de Catalunya (UPC), Barcelona, Spain, 2012. [Google Scholar]
  38. Anderson, D.G.; Stokoe, K.H. Shear Modulus: A Time Dependent Soil Property. In Dynamic Geotechnical Testing, ASTM STP 654; ASTM: Philadelphia, PA, USA, 1978; pp. 66–90. [Google Scholar]
  39. Das, B.M. Advanced Soil Mechanics; Hemisphere Publishing Corporation: Washington, DC, USA, 1983. [Google Scholar]
  40. Suriol, J. Medida de la deformabilidad de suelos mediante el equipo de columna resonante. Revista de Obras Públicas 1993, 3319, 57–66. [Google Scholar]
  41. Morales, L.; López-González, J.A.; Garzón, E.; Giménez, A.; Romero, E. Crecimiento de cristales de CaCO3 como resultado de la actividad microbiológica en suelos. Macla 2011, 15, 141–142. [Google Scholar]
  42. Romero, E.; Della Vecchia, G.; Jommi, C. An Insight into the Water Retention Properties of Compacted Clayey Soils. Geotechnique 2011, 61, 313–328. [Google Scholar] [CrossRef]
  43. Morales, L.; Romero, E.; Pineda, J.A.; Garzón, E.; Giménez, A. Ageing effects on the stiffness behaviour of a microbiologically treated and compacted soil. In Unsaturated Soils: Research and Applications; Springer: Berlin/Heidelberg, Germany, 2012; Volume 1, pp. 371–376. [Google Scholar]
  44. Gallipoli, D.; Gens, A.; Sharma, R.; Vaunat, J. An Elasto-Plastic Model for Unsaturated Soil Incorporating the Effects of Suction and Degree of Saturation on Mechanical Behaviour. Geotechnique 2003, 53, 123–135. [Google Scholar] [CrossRef]
  45. Cho, G.C.; Santamarina, J.C. Unsaturated Particulate Materials-Particle-Level Studies. J. Geotech. Geoenviron. Eng. 2001, 127, 84–97. [Google Scholar] [CrossRef]
Figure 1. Sample preparation following protocol B.
Geotechnics 03 00014 g001
Figure 2. View of open and closed resonant column.
Geotechnics 03 00014 g002
Figure 3. Study of the treated samples by SEM before compaction. (a) SEM micrograph of the sample showing calcified bacterium acting as nucleation point. (b) SEM micrograph with calcified bacteria and calcite crystals. (c) SEM micrograph containing calcite crystals between soil granules.
Geotechnics 03 00014 g003
Figure 4. SEM images of treated samples. (a) Micrograph with calcium-carbonate aggregate surrounded by soil particles. (b) Detailed micrograph of the aggregate with calcite crystals.
Geotechnics 03 00014 g004
Figure 5. SEM images of rhombohedral CaCO3 crystal.
Geotechnics 03 00014 g005
Figure 6. (a) Bacteria belonging to Bacillaceae family (optical microscopy). (b) Grain surface, as observed by SEM, covered by calcified bacteria.
Geotechnics 03 00014 g006
Figure 7. Calcium-carbonate structures detected by optical microscope. (a) Soil grain with crystals. (b) Calcium carbonate.
Geotechnics 03 00014 g007
Figure 8. Calcium-carbonate structure. (a) observed by SEM and (b) the same structure observed by optical microscopy.
Geotechnics 03 00014 g008
Figure 9. The WRC upon drying using a psychrometer and axis-translation data for untreated, treated, and treated_NT soils. MIP-estimated retention curves in the low suction range: (a) total suction vs. water content; (b) total suction vs. degree of saturation.
Geotechnics 03 00014 g009aGeotechnics 03 00014 g009b
Figure 10. Water-retention properties: at the bottom, total suction vs. time of aging is plotted; the top represents humidity vs. time of aging.
Geotechnics 03 00014 g010
Figure 11. Cumulative and density-pore-size distributions for untreated and treated NT samples (data from MICP results).
Geotechnics 03 00014 g011
Figure 12. Micro- and macro-porosity evolution during aging.
Geotechnics 03 00014 g012
Figure 13. Output traces obtained for treated_NT soil by bender elements. (a) O2-rich environment. (b) Closed environment.
Geotechnics 03 00014 g013aGeotechnics 03 00014 g013b
Figure 14. Small-strain stiffness vs. deformation: (a) untreated samples; (b) treated_NT samples.
Geotechnics 03 00014 g014
Figure 15. Variation of the normalized shear modulus and the normalized Young’s modulus in untreated samples regarding (a) water content and (b) the level of saturation.
Geotechnics 03 00014 g015
Figure 16. Variation of the normalized shear modulus and the normalized Young’s modulus in treated_NT samples regarding (a) water content and (b) the level of saturation.
Geotechnics 03 00014 g016
Figure 17. Comparison between the shape of the shear-modulus curve and total suction curve in relation to the degree of saturation of the untreated and treated_NT samples.
Geotechnics 03 00014 g017
Figure 18. Suction influence on the normalized shear modulus.
Geotechnics 03 00014 g018
Figure 19. (a) Evolution of the normalized shear moduli during aging process, at w0 = 7% and w0 = 15%. (b) Evolution of the normalized Young’s moduli during aging process, at w0 = 7% and w0 = 15%.
Geotechnics 03 00014 g019
Figure 20. Soil-stiffness increase during aging for untreated and treated_NT specimens. (a) Shear-wave-velocity evolution. (b) Normalized-shear-modulus evolution.
Geotechnics 03 00014 g020
Figure 21. Experimental changes in the shear-modulus evolution, studied in untreated samples (blank test) and in treated_NT samples.
Geotechnics 03 00014 g021
Figure 22. Deviatoric stress–axial strain curves for treated soils with various starting water contents and in various aging phases.
Geotechnics 03 00014 g022
Figure 23. (a) Time evolution of peak strength during the incubation process. (b) Suction evolution of peak strength during the incubation process.
Geotechnics 03 00014 g023
Figure 24. Time evolution of peak splitting tensile strength during incubation process. Dashed lines connect experimental points, and they are not straight lines of correlation.
Geotechnics 03 00014 g024
Figure 25. Temporal variation of the small-strain shear-stiffness increase (bender elements) in the studied soil that underwent compaction and subsequent aging. The outcomes of the resonant-column test were obtained for both the untreated and the treated samples. The samples were subjected to compaction after undergoing bio-treatment.
Geotechnics 03 00014 g025
Table 1. Physical and chemical soil properties.
SampleLiquid
Limit
Plasticity
Index
Calcium CarbonateParticle SizeSpecific Surface
WL
(%)
PI
(%)
CaCO3
% dry mass
<75 mm (%)<2 mm (%)BET
Ss(m2/g)
Langmuir
Ss(m2/g)
Untreated48304.550233346
Table 2. Compaction energy.
SampleStandard Proctor (SP)Modified Proctor (MP)Static CompactionSoil
Density
ρdWSrCompact.
Energy
ρdWSrCompact.
Energy
ρdWSrCompact.
Energy
ρs
(Mg/m3)(%)-(MJ/m3)(Mg/m3)(%)-(MJ/m3)(Mg/m3)(%)-(MJ/m3)(Mg/m3)
Untreated1.8515.00.870.62.0511.40.952.71.8515.00.871.02.725
1.857.00.409.7
Table 3. Water-content properties.
UntreatedTreated_NT(O2 Rich Environment)Treated_NT(Closed Environment)
W0Ψ0V0WFΨFVFW0Ψ0V0WFΨFVFW0Ψ0V0WFΨFVF
%MPamm/s%MPamm/s%MPamm/s%MPamm/s%MPamm/s%MPamm/s
15.1127511.1342416.50.00323013.00.2239617.10.00120316.90.001260
Disclaimer/Publisher’s Note: The statements, opinions and data contained in all publications are solely those of the individual author(s) and contributor(s) and not of MDPI and/or the editor(s). MDPI and/or the editor(s) disclaim responsibility for any injury to people or property resulting from any ideas, methods, instructions or products referred to in the content.

