Equilibrium Stage of Soil Cracking and Subsidence after Several Wetting and Drying Cycles


Engineering Science, Computer Science and Imaging Laboratory (ICUBE), Institut National Des Sciences Appliquées (INSA) de Strasbourg, 24 Boulevard de la Victoire, 67084 Strasbourg, France
Geotechnics 2023, 3(2), 193-211; https://doi.org/10.3390/geotechnics3020012
Submission received: 28 February 2023
/
Revised: 6 April 2023
/
Accepted: 11 April 2023
/
Published: 13 April 2023
Abstract
:This work investigates the equilibrium stage of the crack propagation of a fine-grained soil after several drying and wetting cycles (shrinkage and swelling hysteresis). This stage is found to be crucial in practical engineering since the soil continues to show its irreversible hydraulic settlement, which is a potential risk for some severe structural damages. The shrinkage area and the shrinkage crack area were determined by using the image processing method. For the cyclic experimental investigations, the shrinkage cracks were followed during six months of successive wetting and drying cycles for two samples (with two different initial water contents). These long-term tests were completed by some short term single drying path tests performed on samples prepared at different initial states. The results showed the existence of a unique equilibrium stage at the end of the wetting and drying cycles for the two studied samples. The equilibrated soil subsidence was separated into two parts: the reversible settlement of the equilibrium stage and the irreversible settlements cumulated during successive wetting and drying cycles. At the equilibrium stage, the reversible deformation was 5.9% and the irreversible deformation was 3.8%. A simplified theoretical approach was also used to predict the cracking equilibrium stage and its soil subsidence. The fitted parameters of the theoretical approach for each cycle were stabilized to confirm the existence of this equilibrium stage.
1. Introduction
Fine-grained soils and, particularly, swelling clays are often exposed to complex suction/stress paths, causing many problems both in surface structures built on them (shallow foundations, retaining structures, landfill liner systems, and earth dam cores) and in buried structures (tunnels, drains, and deep foundations). Furthermore, fine-grained soils include significant variation in physical properties, such as bulk density [1], pore size distribution [2,3,4], and field-saturated hydraulic conductivity [5,6,7,8], with changes in the soil water content. Cumulative swelling or shrinkage strains have been largely reported in the literature as clayey samples are subjected to successive wetting and drying cycles. All these results obtained in the laboratory or field conditions indicate that the soils show signs of hydraulic stabilization or an equilibrium elastic state at the end of several cycles [9,10,11,12,13,14,15,16,17].
In a typical fine-grained soil, individual particles cluster together in aggregates, which in turn group together as a matrix. Assuming that the particles themselves are not porous, the smallest pores are those that occur between individual particles. The packing together of aggregates also forms pores that are typically larger and more connected than the “interparticle” pores [18,19,20,21]. Interparticle and interaggregate pores decrease in size as the soil dries and increase in size as the soil wets. As the soil dries, typically, shrinkage cracks begin at the soil surface [22,23]. As the soil profile dries, these cracks will extend vertically from the surface to some finite depth and often will become interconnected in the horizontal direction. As such, shrinkage cracks can be considered to demarcate individual pedons [24,25,26]. Additionally, during shrinkage the soil surface can vertically subside, which can be considered to be an independent porosity domain that forms external to the soil matrix.
Several laboratory tests were performed to characterize the crack propagation in the compacted clayey soils at different hydraulic conditions [27,28,29,30,31,32,33,34,35,36,37,38]. Field Cracks have been often characterized using in situ measurements of either crack volumes [39,40,41] or vertical subsidence [42,43]. Shrinkage and cracking can be expressed as functions of water content (u) or suction head (h) [44,45].
In recent years, many scholars have researched theoretical models of soil cracking to predict whether the soil will crack and the crack propagation, such as the depth and width of the cracks [46,47,48,49,50,51,52].
The effect of successive wetting and drying cycles on the crack propagation has been less investigated in the literature. Some studies, primarily focused on laboratory samples [53,54], have contended that recognizing the hysteresis in shrinking–swelling processes is an important issue. However, the discussing issue is about the existence of the cracking equilibrium stage, which can be only obtained after several wetting and drying cycles. Experimentally, it is more accessible in the laboratory conditions, but it becomes more problematic in in situ conditions since a longer period is necessary to reach this equilibrium stage.
In this context, this work has investigated the effect of several drying and wetting cycles (shrinkage and swelling hysteresis) on the crack propagation of a fine-grained soil in laboratory conditions. Several shrinkage crack measurements were performed on the soil samples prepared at different initials states during a single drying phase, then during several wetting and drying cycles to reach the equilibrium stage. A simplified theoretical framework proposed for the soil shrinkage crack was also used to quantify the shrinkage crack and the soil subsidence after several hydraulic cycles at the equilibrium stage.
2. Material and Image Processing Method
The physical properties of the studied soil were listed in Table 1.The fine-grained soil was powdered with a grain size less than 80 µm with almost the same quantity of clay and silt in its texture. Soil specimens were prepared by mixing the soil powder with distilled water. Prior to any testing, the prepared specimens were covered for at least 24 h to reach uniformly their initial water content (between 25%, close to liquid limit, and 60%, which is two times more than the liquid limit as reported in Table 2). The specimens were then placed in two Plexiglas molds at their desired initial state. The molds have a square shape with the same length and width of 24 cm and height of 15 cm.
A variable dry density varying between 1 and 1.55 mg/m3 (as presented in Table 2) was also controlled for the different test. To reach this dry density, the weight of the samples was measured at the beginning of the tests. Then, the samples were compacted to their desired height varying between 1 and 4 cm (as summarized in Table 2).
Along with the tests, the specimens were weighed to an accuracy of 0.01 g to monitor the water loss at varying intervals. At the same time, a camera was fixed above the specimens at the same place to monitor crack patterns which will be used for image analysis to determine the related geometrical parameters. At least, two images were taken at each measurement step.
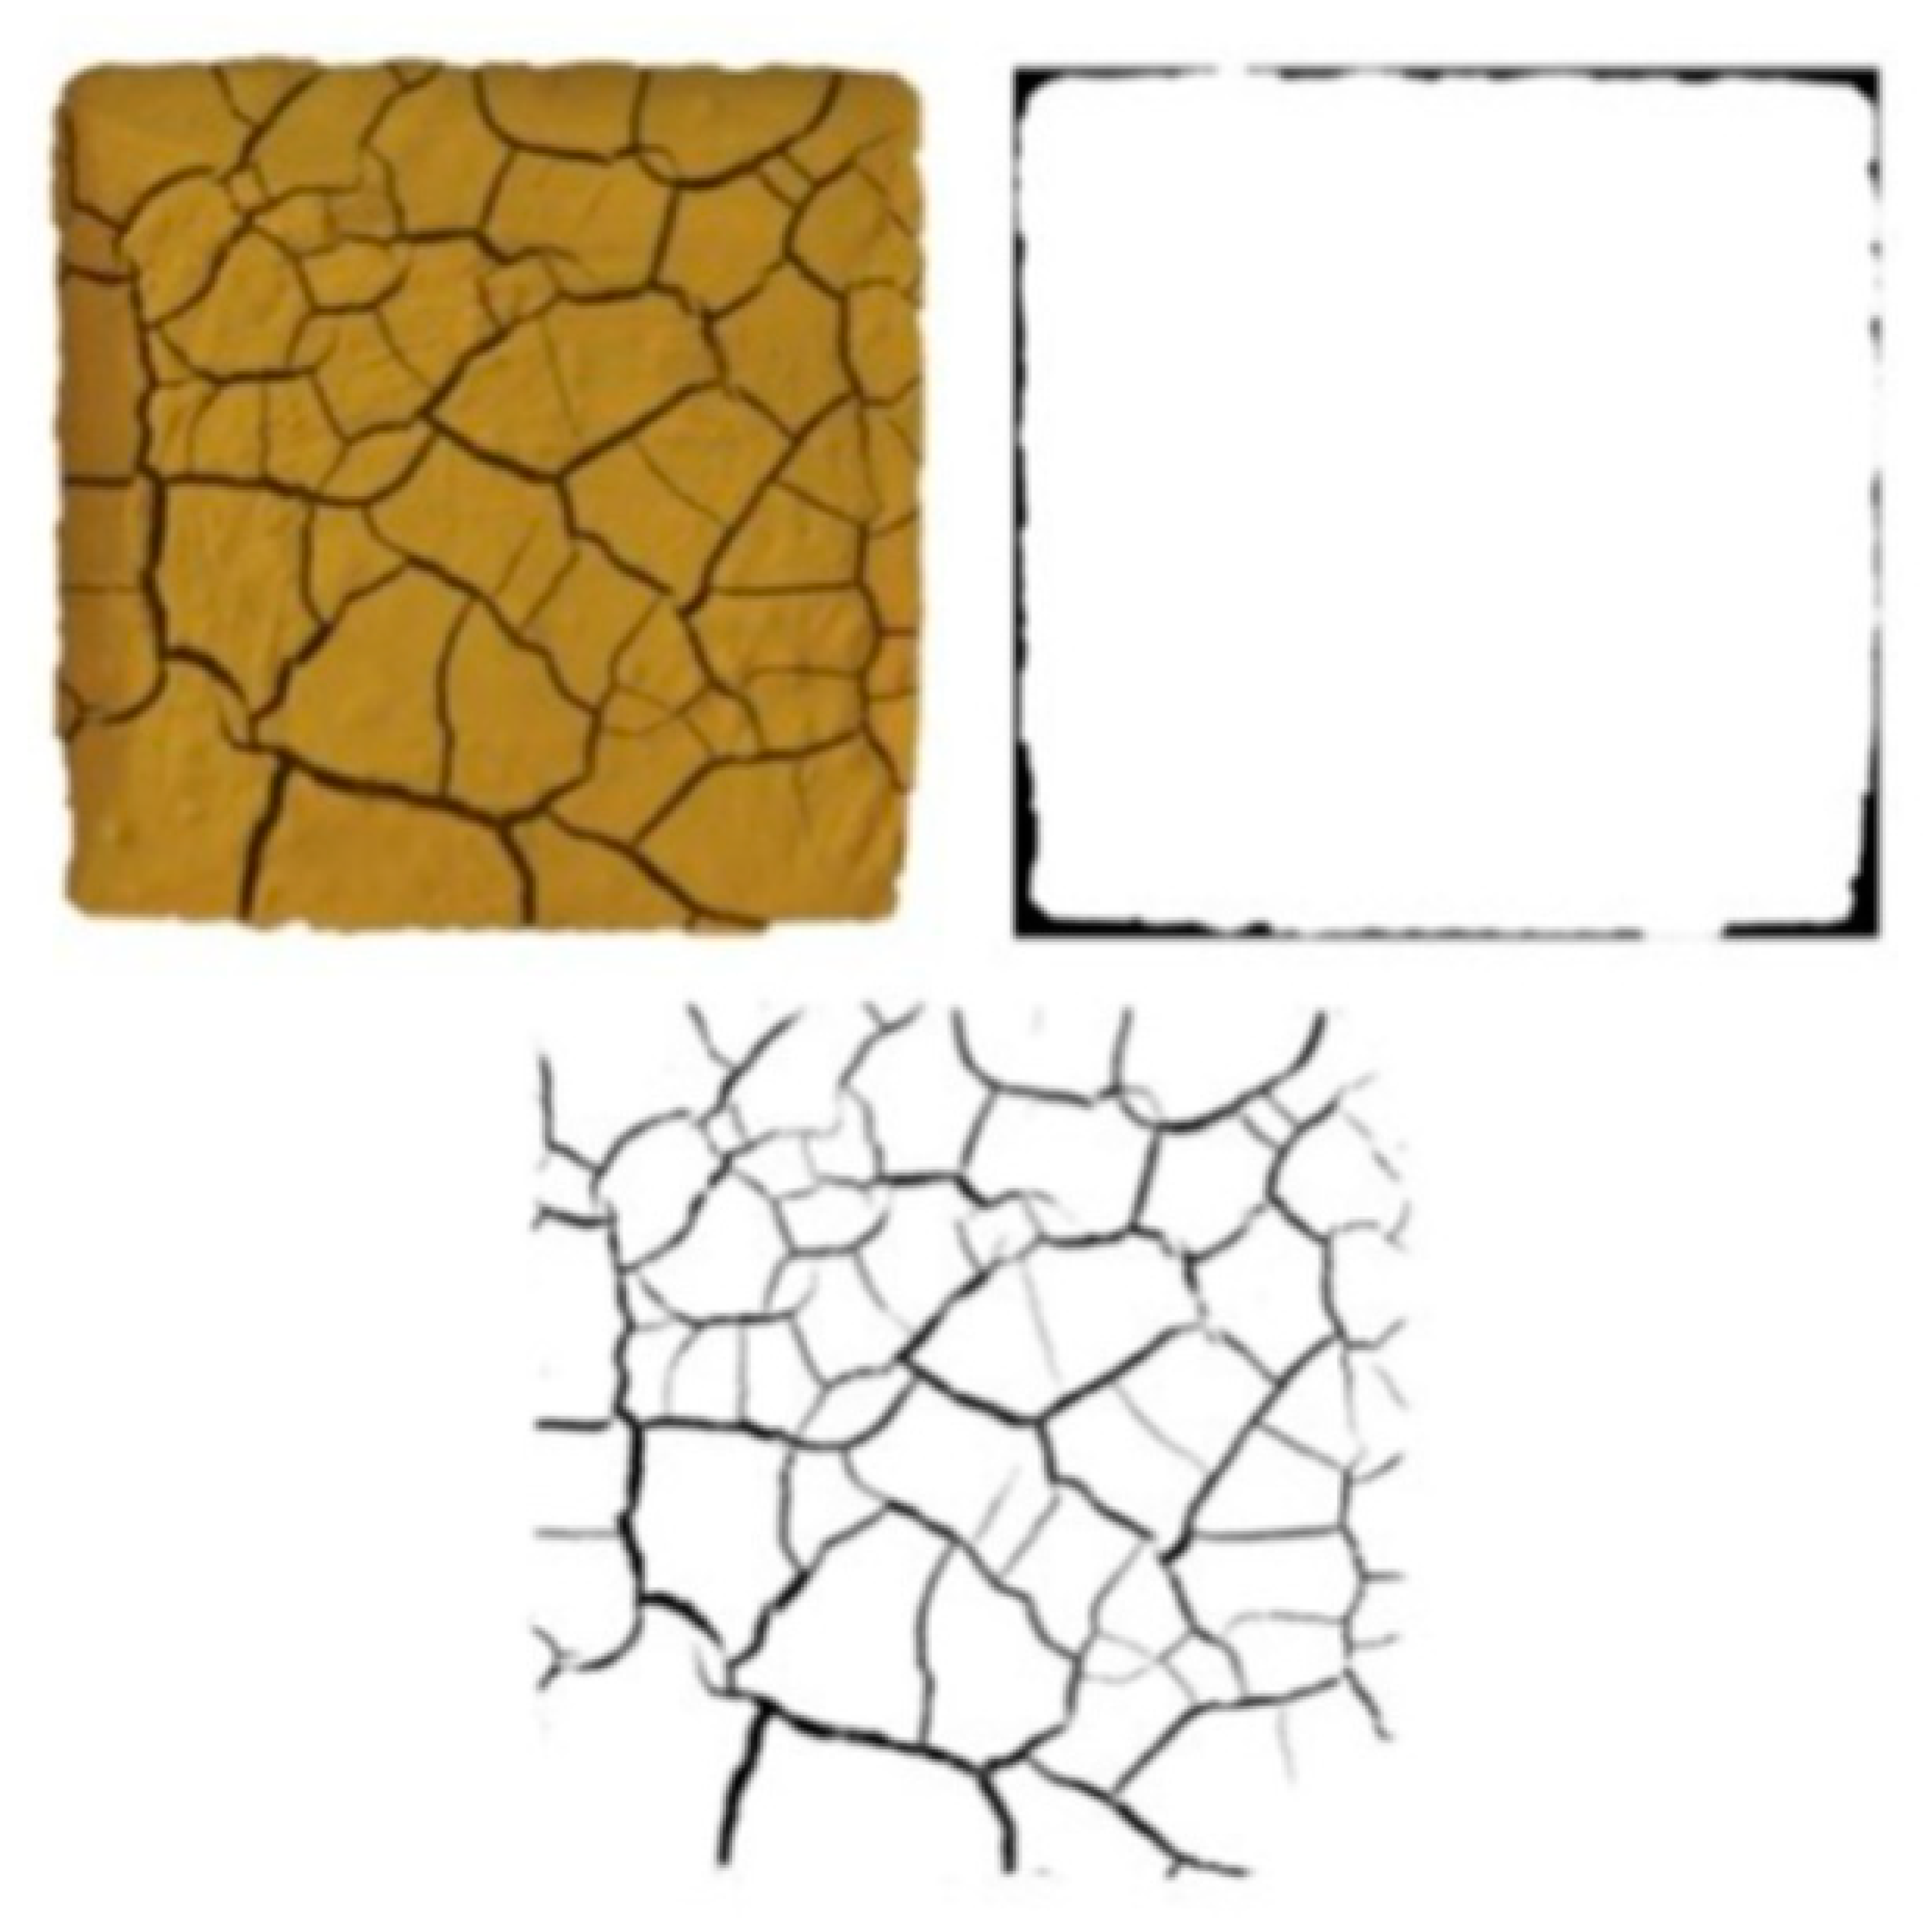
The surface area of cracks within the quadrats were quantified by first converting the digital images to a gray scale, then renormalizing them using a custom ImageJ software such that cracks were black and soil was white. The number of black pixels was then counted and converted to an area. The initial square area and its boundary are fixed at the beginning of the tests. They are then used during the tests to distinguish first the lateral shrinkage and finally the shrinkage crack area.
A set of examples crack images, before and after processing, is shown in Figure 1. After analyzing the images, the ratio between the shrinkage area and the sample area is defined as Shrinkage Intensity Factor (SIF). The ratio between the crack area and the sample area is determined as the Crack Intensity Factor (CIF). The shrinkage crack area is the sum of SIF and CIF, expressed as Shrinkage Crack Intensity Factor (SCIF).
3. Cracking Equilibrium Stage after Successive Wetting and Drying Cycles
Since successive wetting and drying cycles are experimentally time-consuming, a limited number of tests can be carried out for this issue in the laboratory. This limited number makes complicated the interpretation of the cyclic experimental results. To fill this gap, some additional short-term tests were additionally performed by submitting a single drying path to samples. Seven samples were prepared at different initial water contents and initial dry densities (Tests D1 to D7). Table 2 summarizes all the performed tests presenting their initial water content, initial dry density, and initial height.
Figure 2 shows the evolution of shrinkage crack area (SCIF) and the crack area (CIF) for these seven tests by using the image processing method detailed in Section 2.
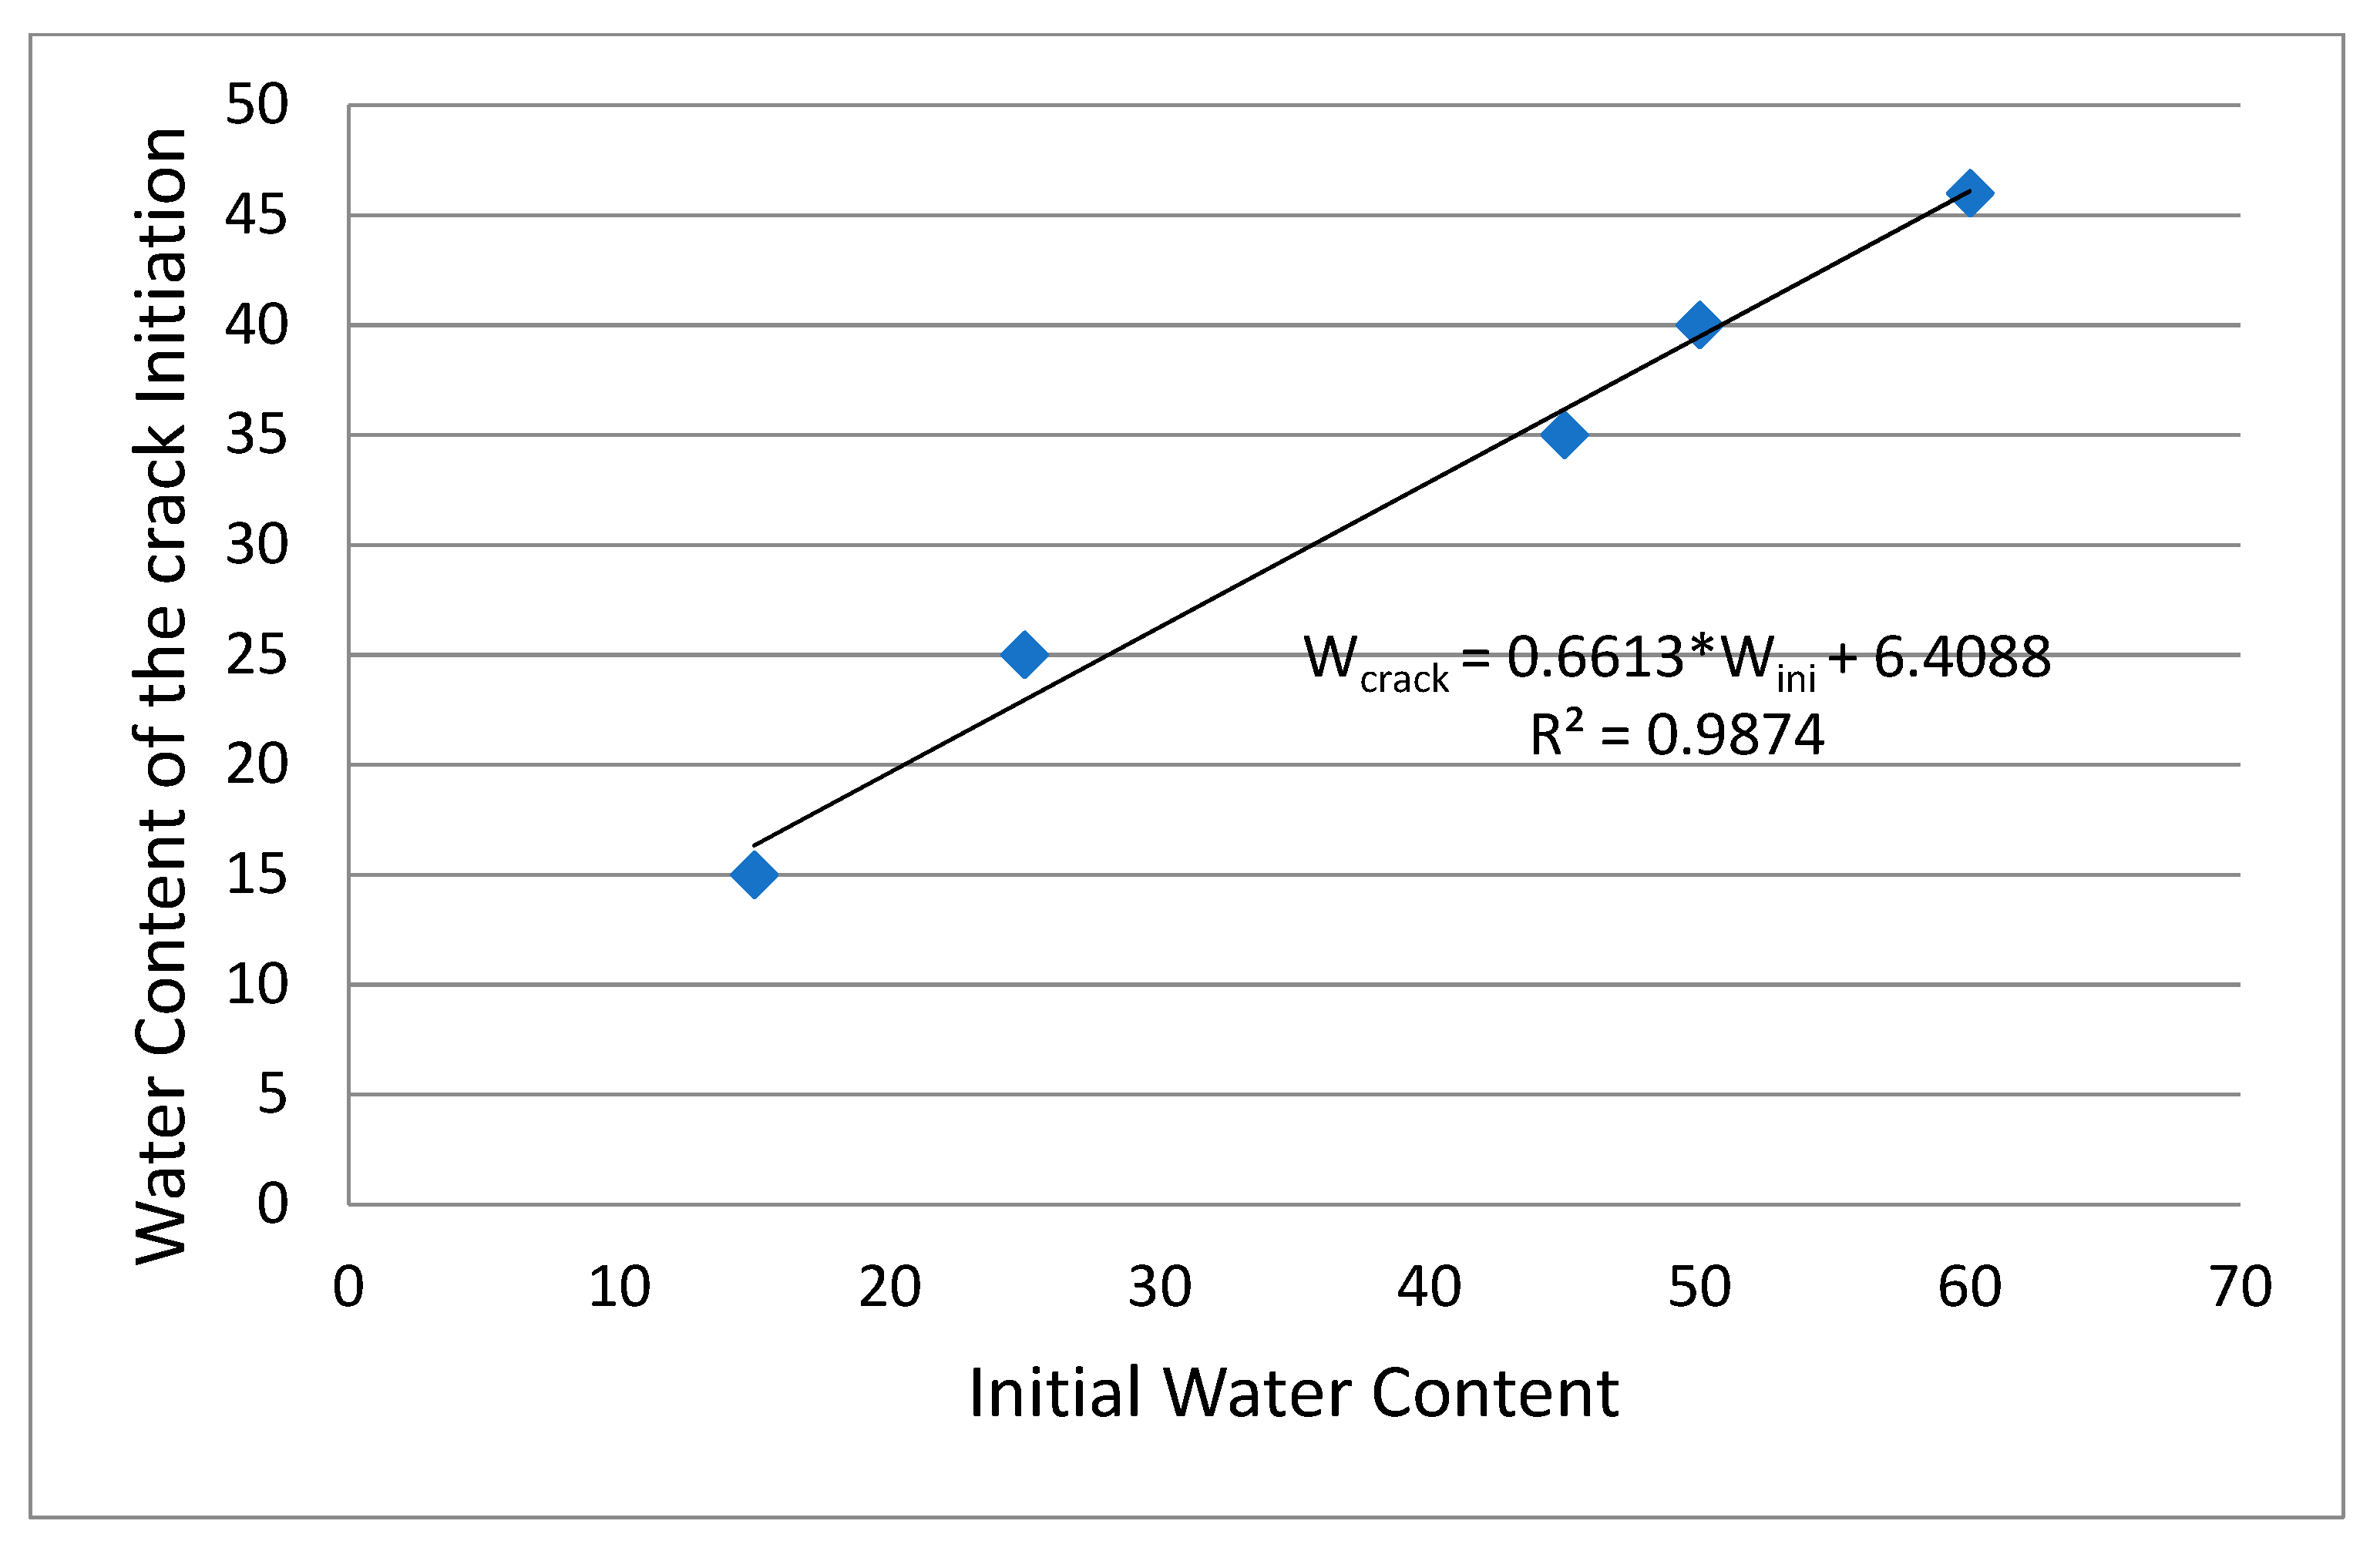
It can be observed that the shrinkage crack area increases with the increase in the initial water content of the samples (Figure 2a). Additionally, the water content in which the shrinkage cracks are initiated is increasing with the initial water content of the studied samples. Figure 3 proposes a linear correlation between these two parameters. No major effect of the initial dry density is detected for the water content of the crack initiation.
Figure 2b shows the same increase in the crack area with water content. Furthermore, an evident effect of the initial dry density of the samples on the crack areas was confirmed. The maximum crack propagation happened for the samples with an initial dry density of 1.25 mg/m3. No crack propagation was observed for the samples with the initial dry density of 1 mg/m3.
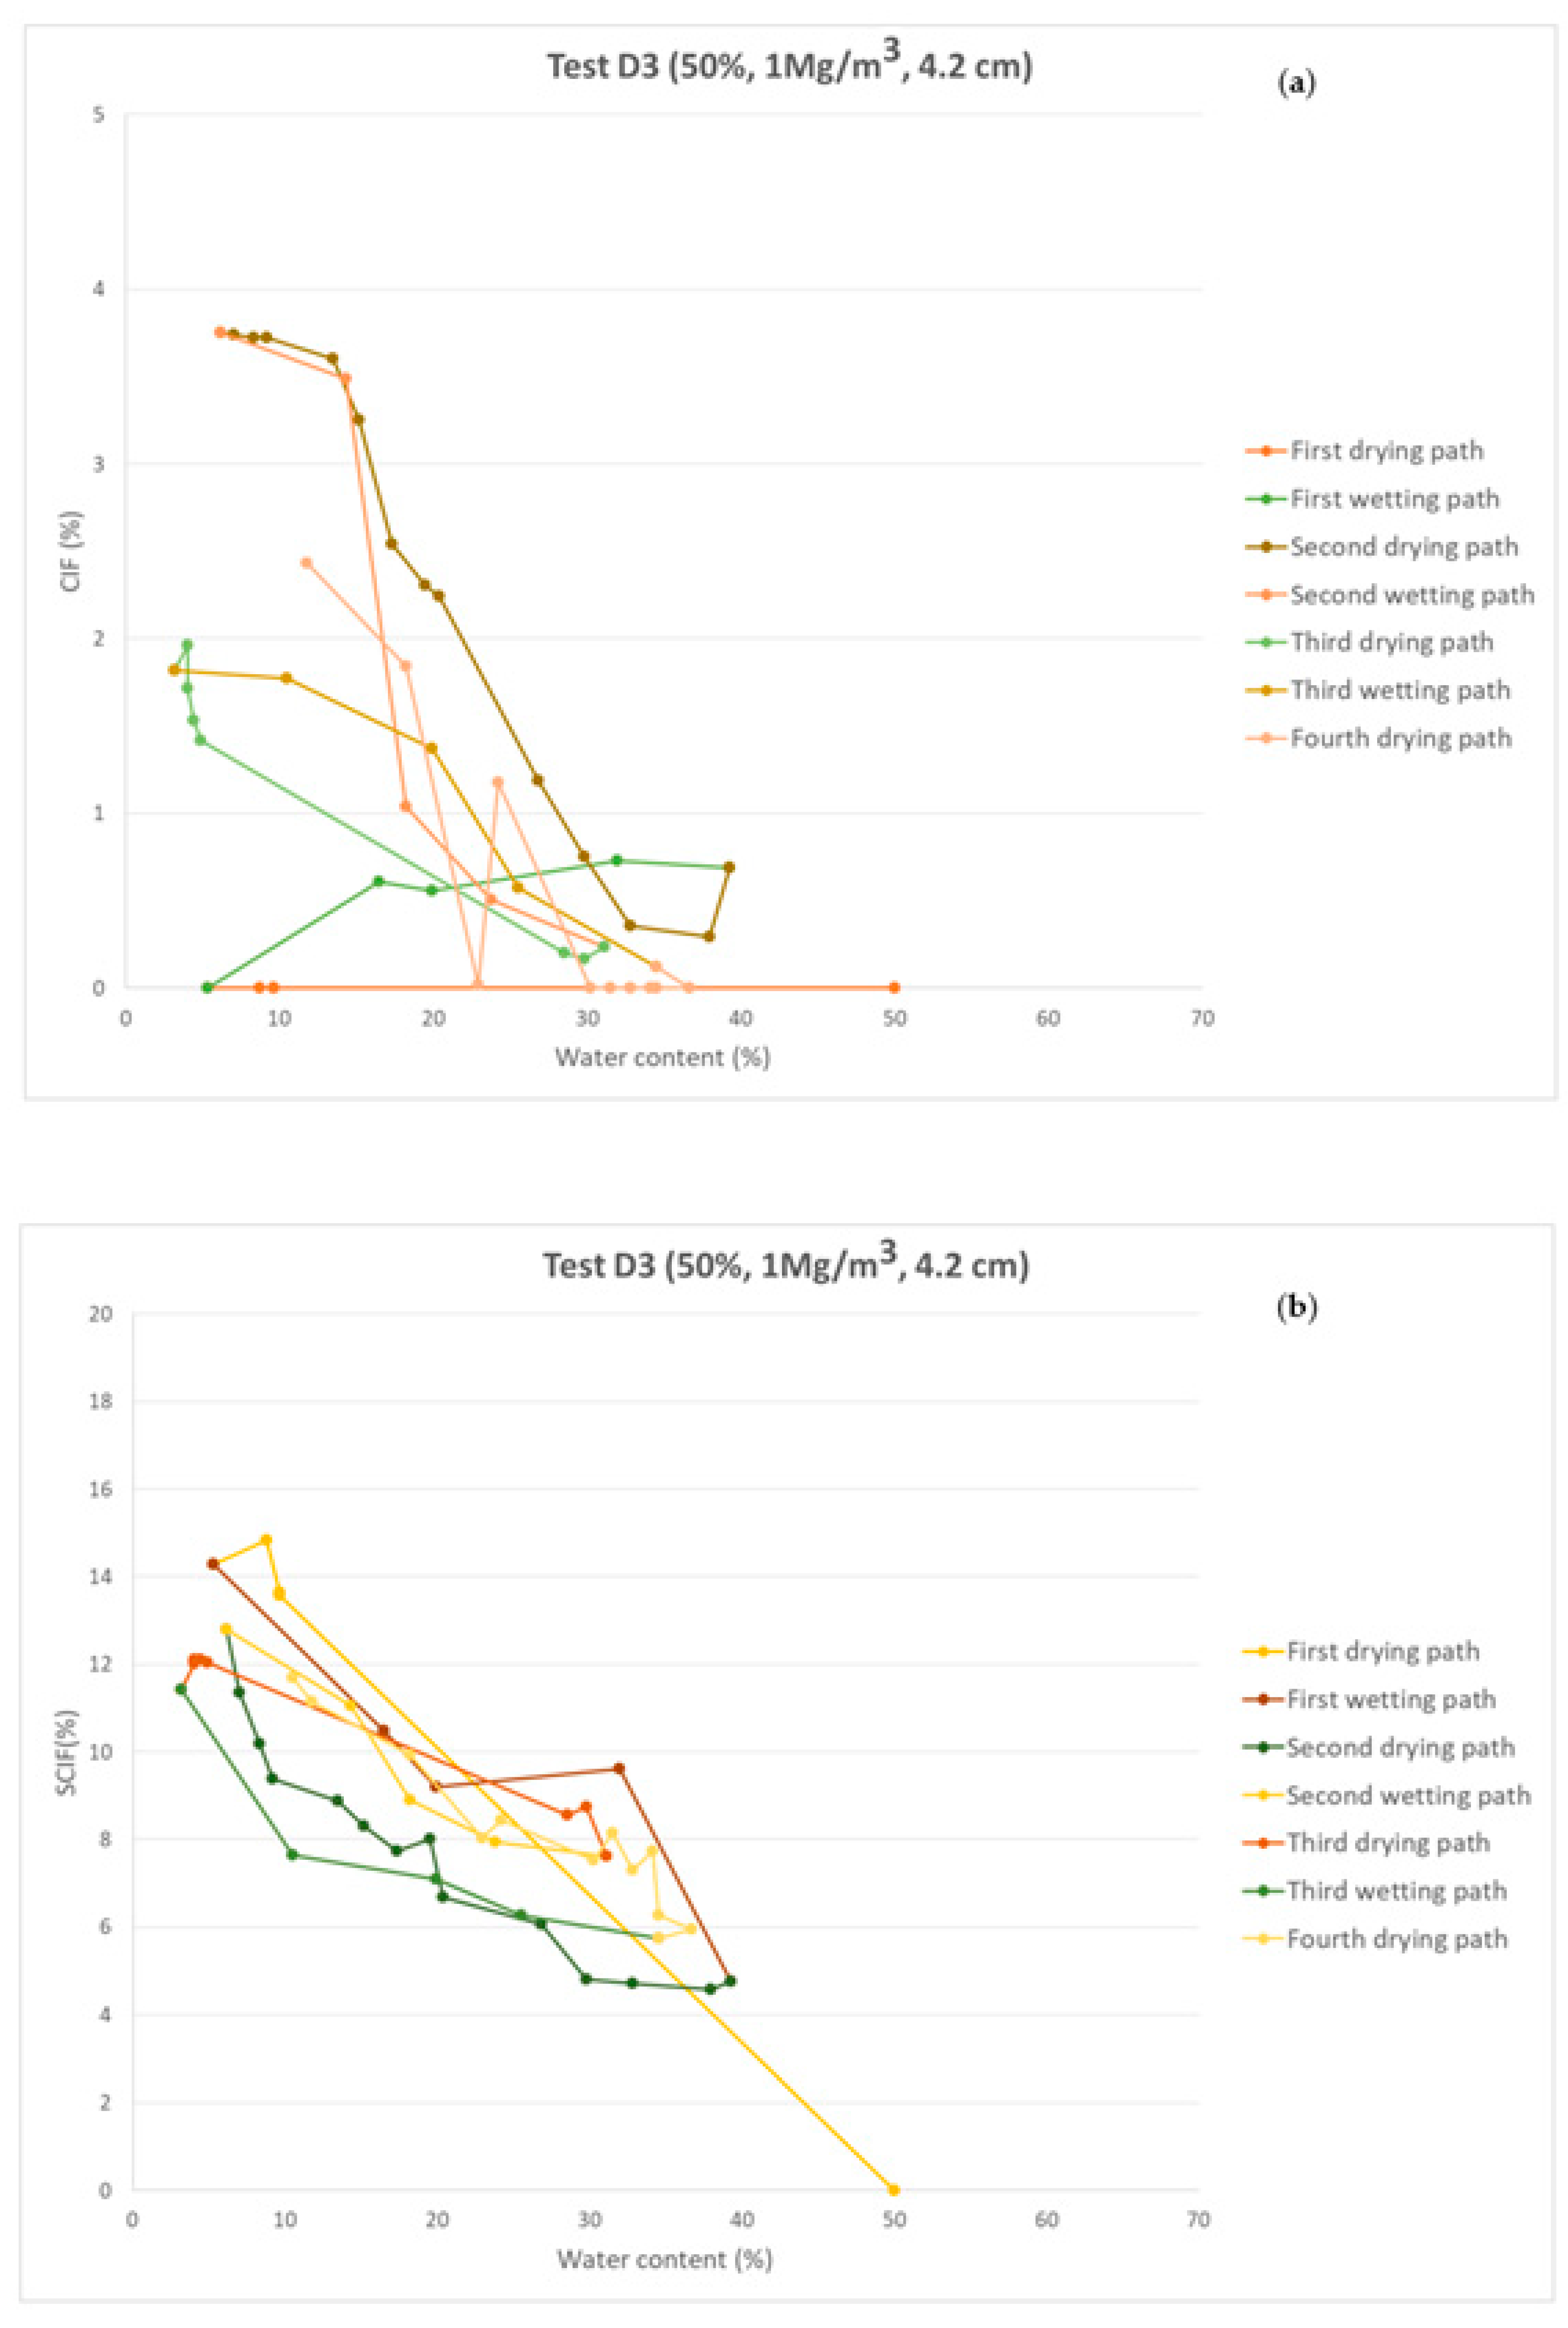
Then, the tests D1 and D3 were continued, and several wetting and drying cycles were performed at the end of the first drying path. Three additional drying wetting cycles were performed for these tests for six months. To wet up the samples, the necessary quantity of water was added each day for a total period of 5 days to disappear the cracks in the samples. Globally, a water content close to 40% was necessary for both samples to disappear the soil cracks on the surface for each wetting path.
Figure 4 and Figure 5 present the Shrinkage Crack Intensity Factor (SCIF) and the Crack Intensity Factor (CIF) for these tests. To follow the experimental values of different wetting and drying paths presented in these figures, Table 3 summarizes also the maximum and the minimum values obtained at the end of wetting and drying cycles and at their corresponding water contents.
Generally, it can be observed that the shrinkage crack area tends to an equilibrium stage after several wetting and drying cycles. This equilibrium stage is more evident for the test D1 with the initial water content of 60%. The wetting and drying loops are closer for this test. For the test D3, the loops are more deviated, and some further wetting and drying cycles are still necessary to reach the equilibrium stage. The same observations for the crack areas can be pronounced. CIF values are closer during the last cycles for test D1 while the loops for the test D3 are more distanced. One or two further wetting and drying cycles are still necessary for the test D3 to reach the equilibrium shrinkage crack state.
Some dispersion can be observed for the estimated results (mostly for CIF data) that can be related to the image processing method and threshold choice. Any improvement in the image processing can result in a higher resolution of the whole estimated results but the same scattering can be found during the successive wetting and drying cycles.
4. Prediction of the Cracking Equilibrium Stage and the Soil Subsidence after Several Wetting and Drying Cycles
Numerous conceptual and mathematical models have been developed to describe the shrinkage of soil aggregates. Such models identify up to four distinct shrinkage phases, including: (i) structural shrinkage; (ii) proportional (i.e., basic or normal) shrinkage; (iii) residual shrinkage; and (iv) zero shrinkage [55,56,57,58]. During periods of drying, individual clay particles shed hydration layers, causing compaction of the soil aggregates. This process results in subsidence and cracking of the soil [20,59]. To demonstrate the distinction among these three domains (aggregate, cracking, and subsidence), Stewart et al. (2016) [52] report an example of the porosity distribution at different water contents. The aggregate porosity is represented by beginning at the minimum porosity ϕmin and extending to the maximum porosity ϕmax; as the aggregate porosity decreases (due to shrinkage), the shrinkage crack and/or subsidence porosities necessarily increase. This extra aggregate (i.e., cracking and/or subsidence) porosity can be seen as the space between the soil shrinkage curve and ϕmax. The total porosity of a clayey soil ϕtotal is partitioned into the following domains: (i) aggregate (ϕaggr); (ii) shrinkage cracks (ϕshrink/crack); and (iii) vertical subsidence (ϕsub). The distribution of porosity between these three domains varies as a function of soil water content [21,60].
In this work, the shrinkage crack porosity is separated into two parts: one is the shrinkage porosity (ϕshrink), and the other part is the crack porosity (ϕcrack).
ϕshrink/crack = ϕshrink + ϕcrack
Since the crack porosity is an important element in this investigation, the crack porosity is proportional to the shrinkage crack porosity. Equation (1) can be then separated into two following parts:
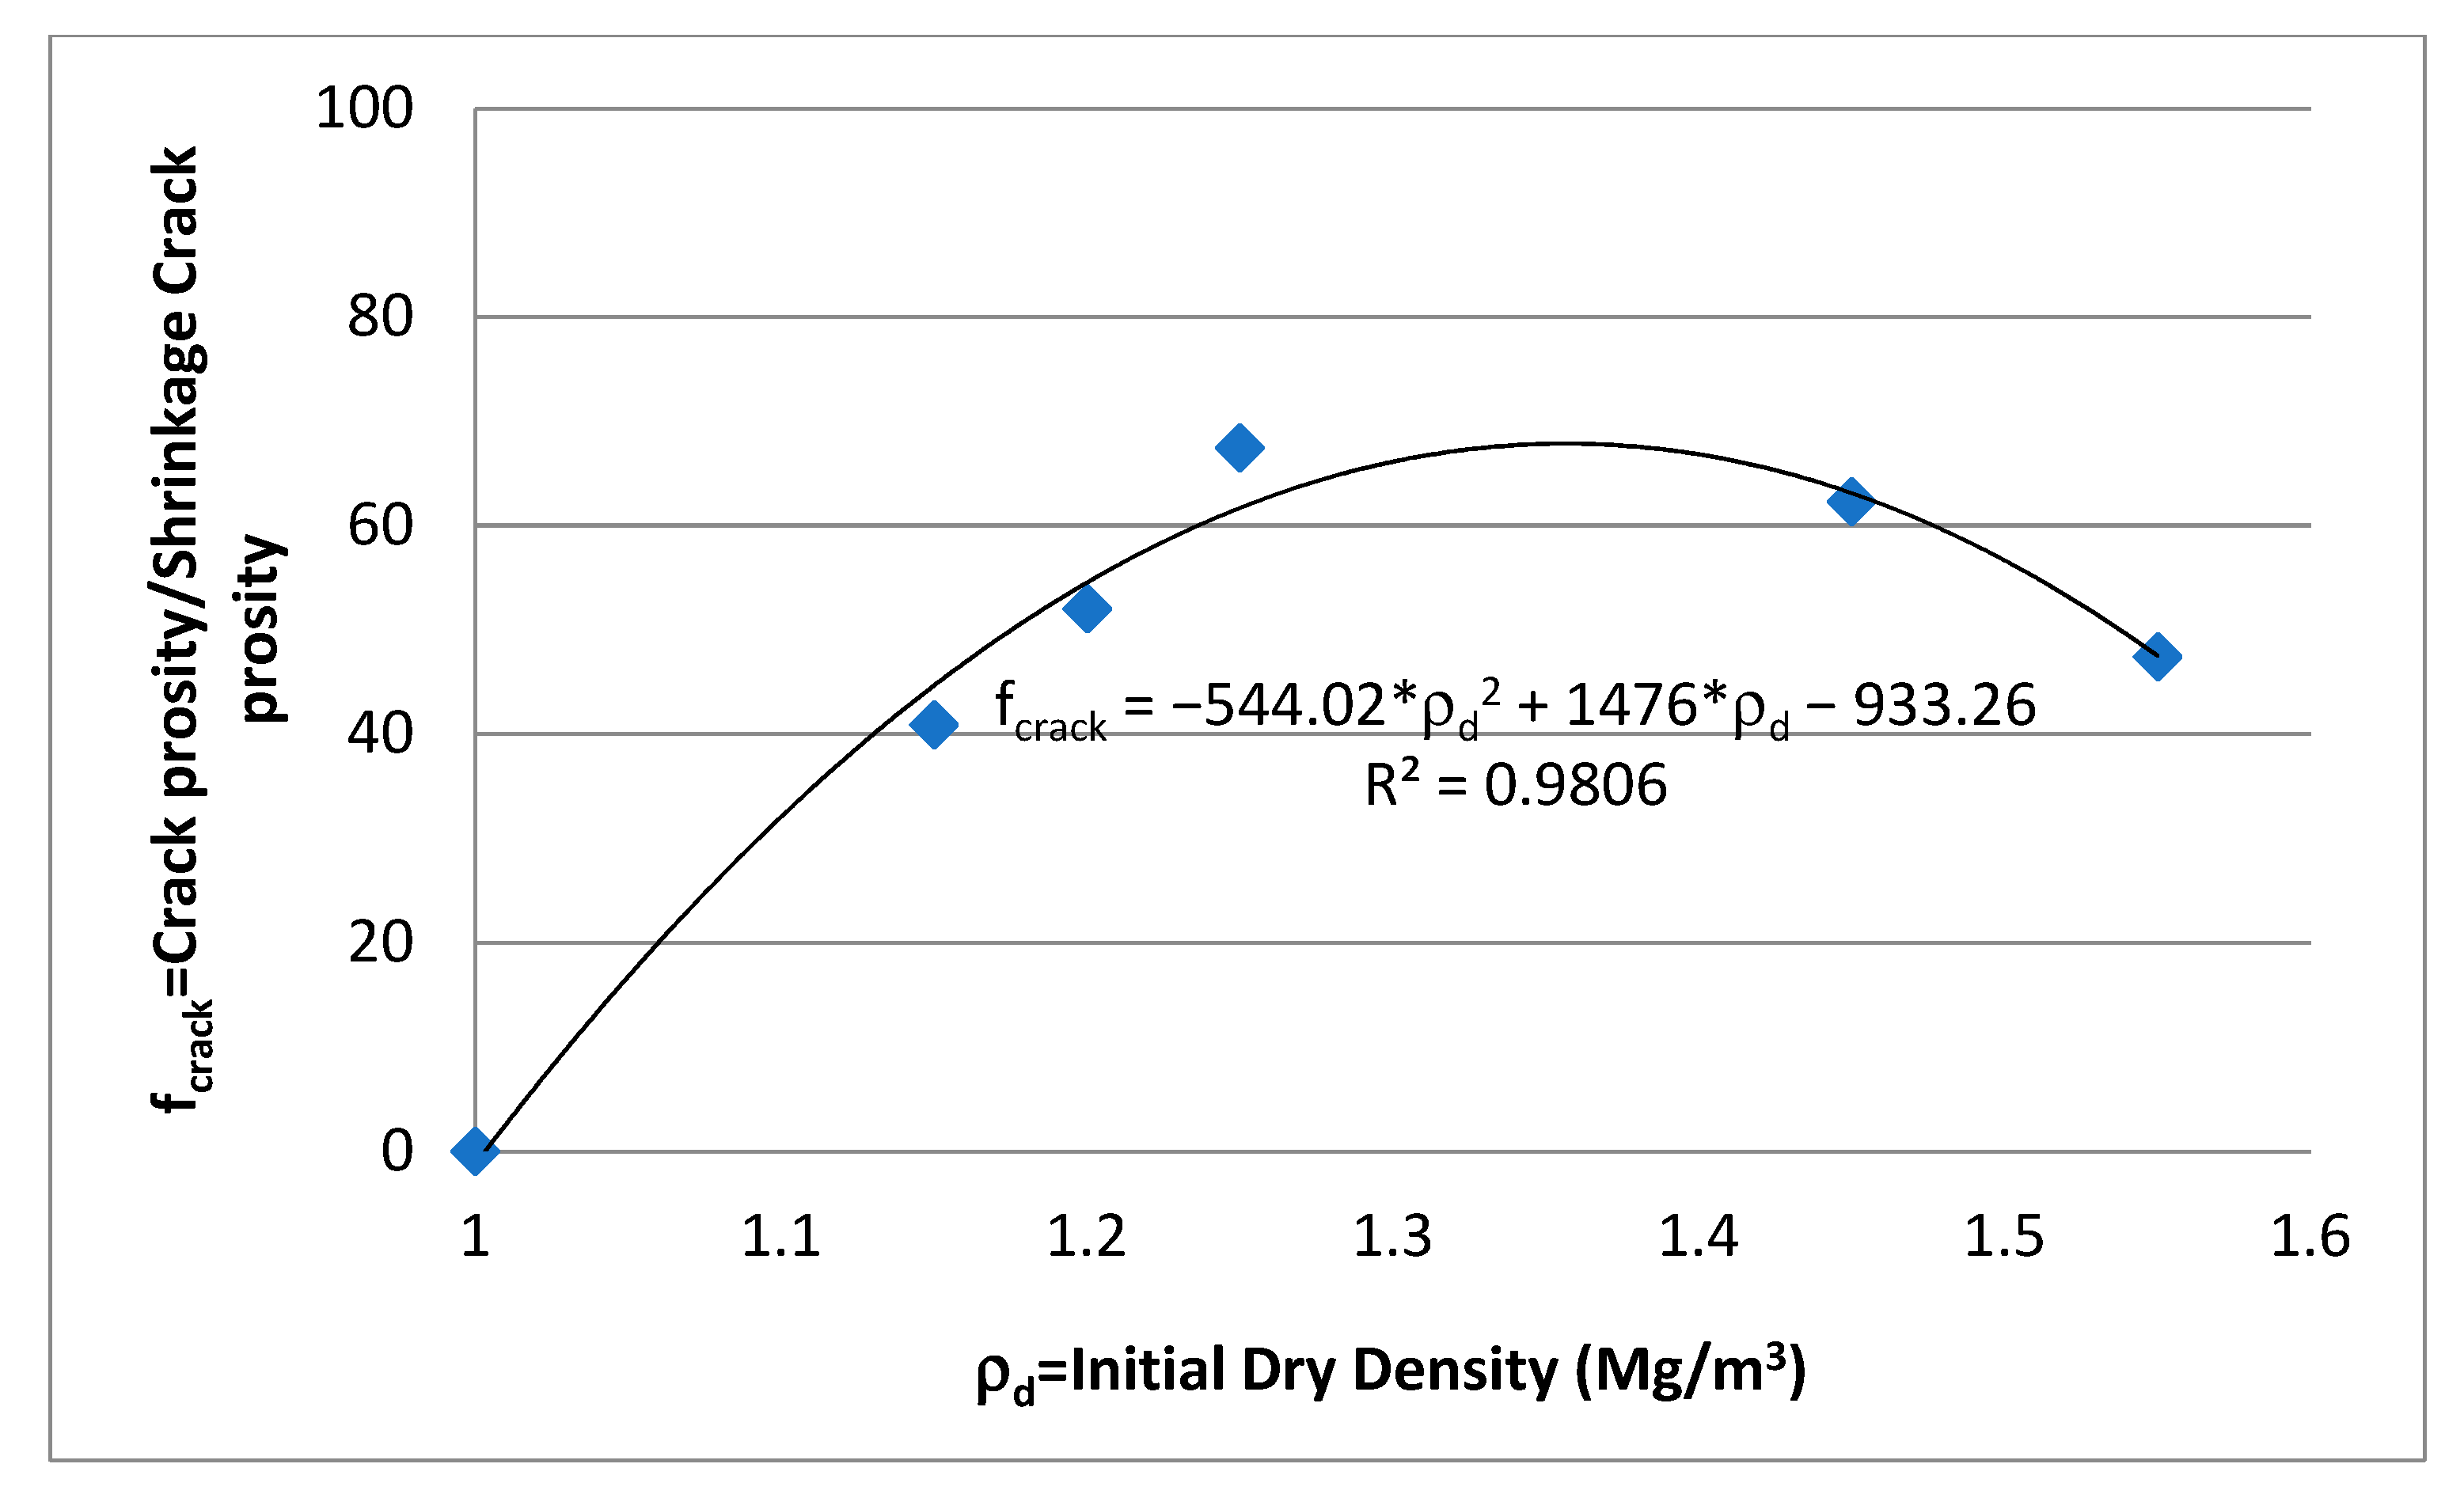
where the function of fcrack was experimentally determined in the last sections by means of the single drying tests. Figure 6 proposes a second-degree polynomial equation to relate the function fcrack to the initial dry density of the studied samples.
ϕcrack = fcrack ∗ ϕshrink/crack
ϕshrink = (1 − fcrack) ∗ ϕshrink/crack
For several wetting and drying cycles, the equations proposed by Stewart et al. (2016) [52] are written incrementally since the initial state of each path corresponds to the final state of the previous path, as follows:
where u is the water content, umax is the maximum water content, U is the normalized water content, ϕpedon is the total porosity attributable to the combination of cracks and aggregate porosities at U = 0, and ε and q are fitting parameters. Note that the proposed equations need only four parameters (ε, q, ϕmax, and ϕmin) to be calibrated. ϕpedon can be expressed in terms of the shrinkage geometry factor χ [61] as follows:
where χ is a constant parameter taken equal to 3.
The theoretical approach is then used to quantify the crack and shrinkage crack of the tests D1 and D3 during several drying and wetting paths. Table 4 and Table 5 summarize the best fitted parameters (Initial dry density for fcrack in Equation (2), and ε, q, ϕmax, and ϕmin in Equations (3) to (7)) for each drying and wetting path to model the experimental results.
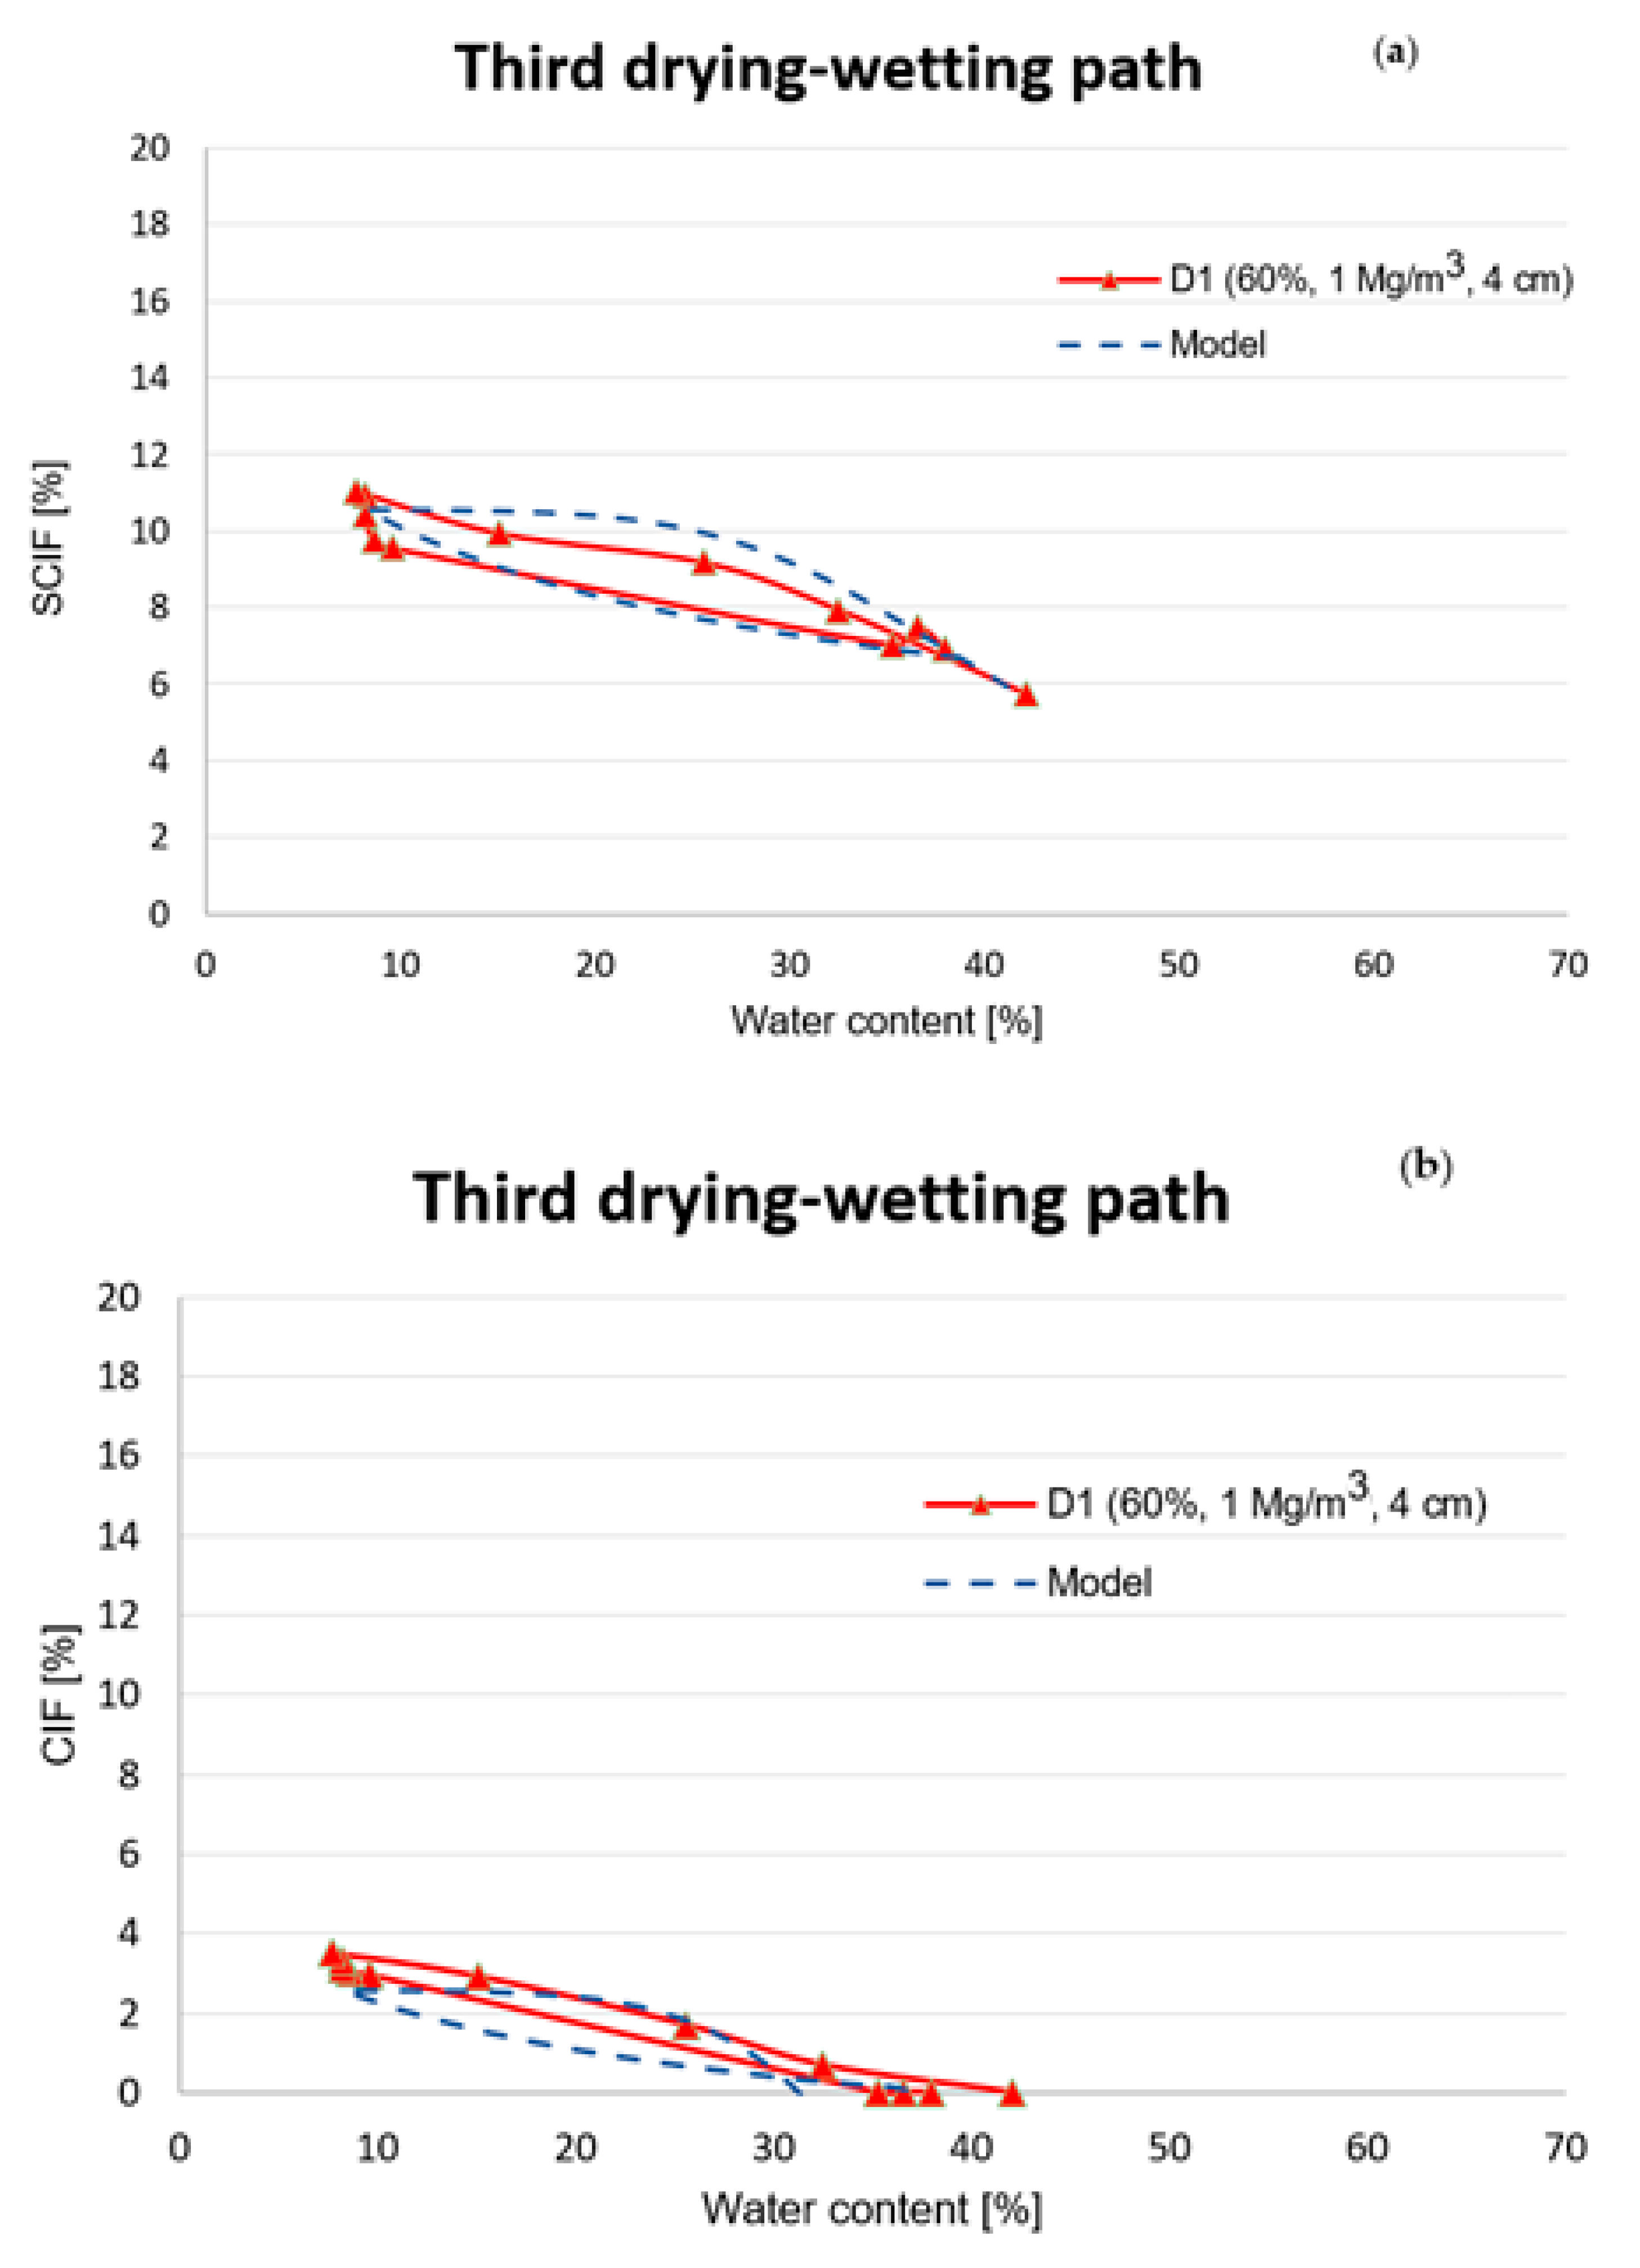
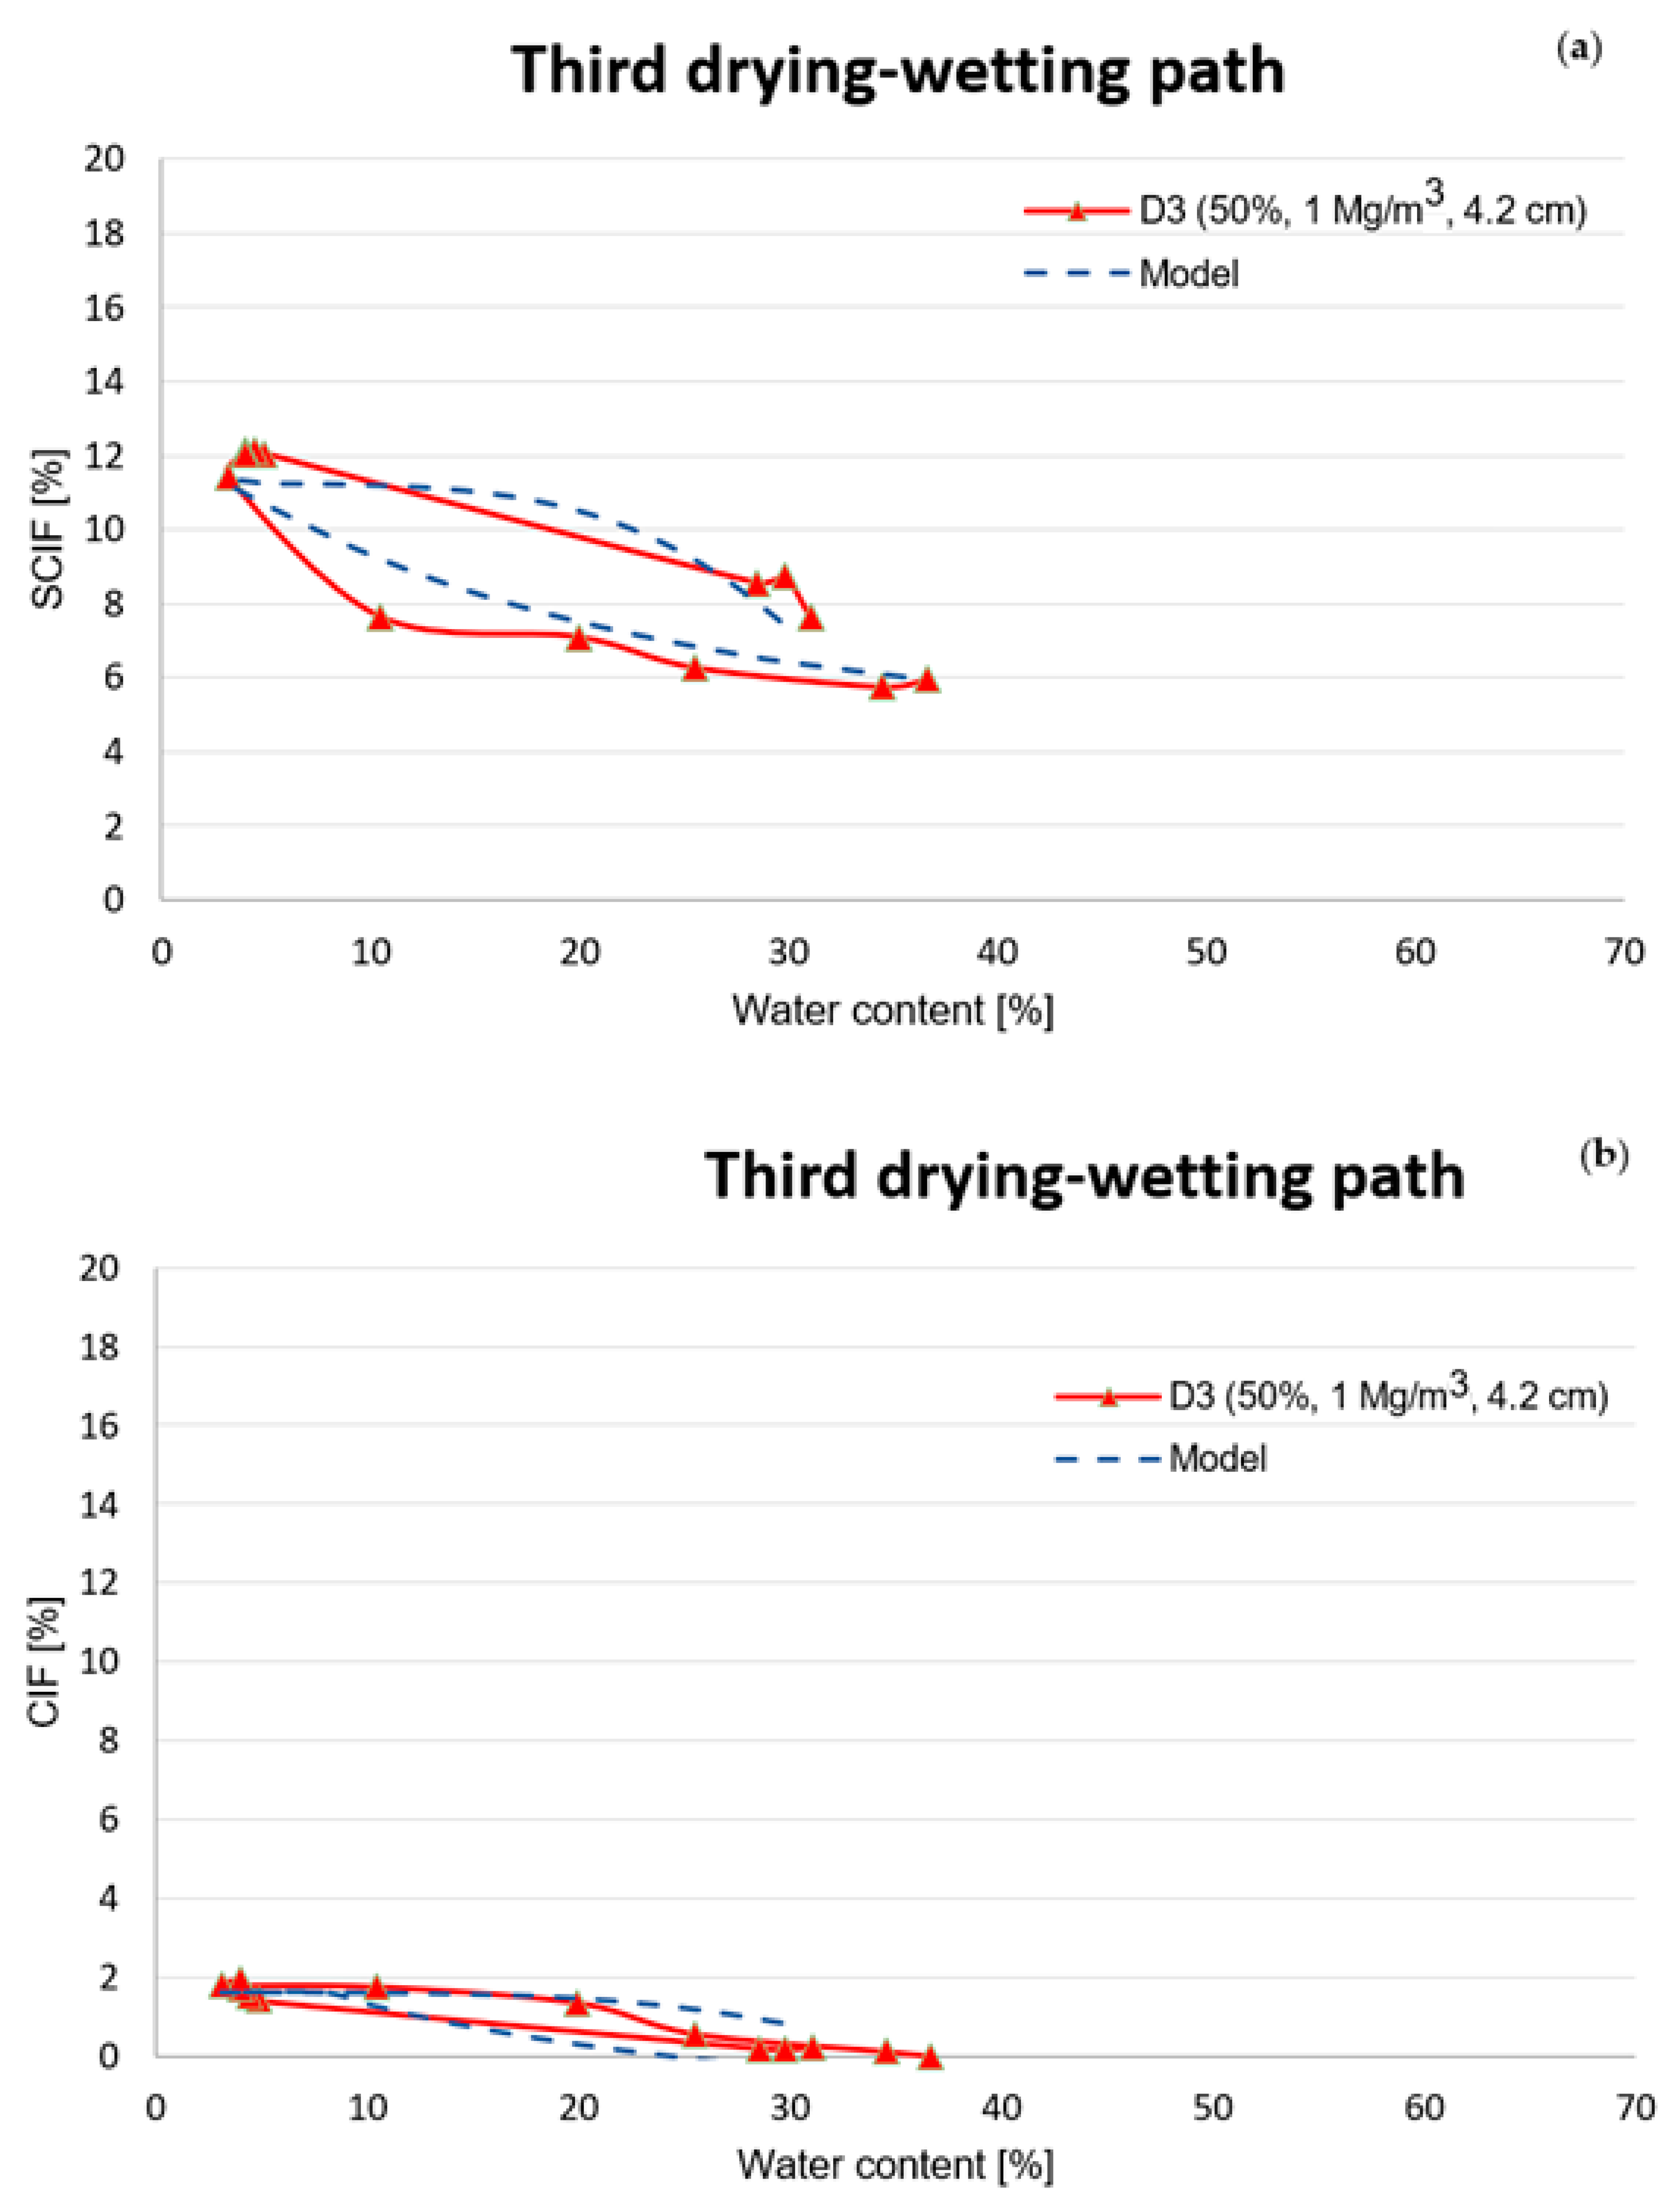
Comparisons have been made for all the wetting and drying cycles between the simulations and measurements. Figure 7 and Figure 8 show specifically the experimental and calculated evolution of SCIF and CIF during the third drying and wetting cycle. The theoretical approach is capable to take into account the general evolution of the shrinkage crack and crack during successive wetting and drying cycles. Furthermore, the fitted parameters for each cycle make it possible to consider the hysteresis phenomenon in the simulations.
Another important point in the analytical simulations is the convergence of the shrinkage cracks toward an equilibrium stage. Figure 9 shows also the evolution of the parameters (Initial dry density, ε, q, and ϕmax) during the drying and wetting cycles. The parameters (Initial dry density, ε, ϕmax, and ϕmin) are more or less stabilized after several wetting and drying paths. Furthermore, no hysteresis effect can be detected for these parameters. For the parameter q, the different values on the wetting and drying path can be observed during the last wetting and drying cycles. This means that the hysteresis will be uniquely controlled at the equilibrium stage by the parameter q.
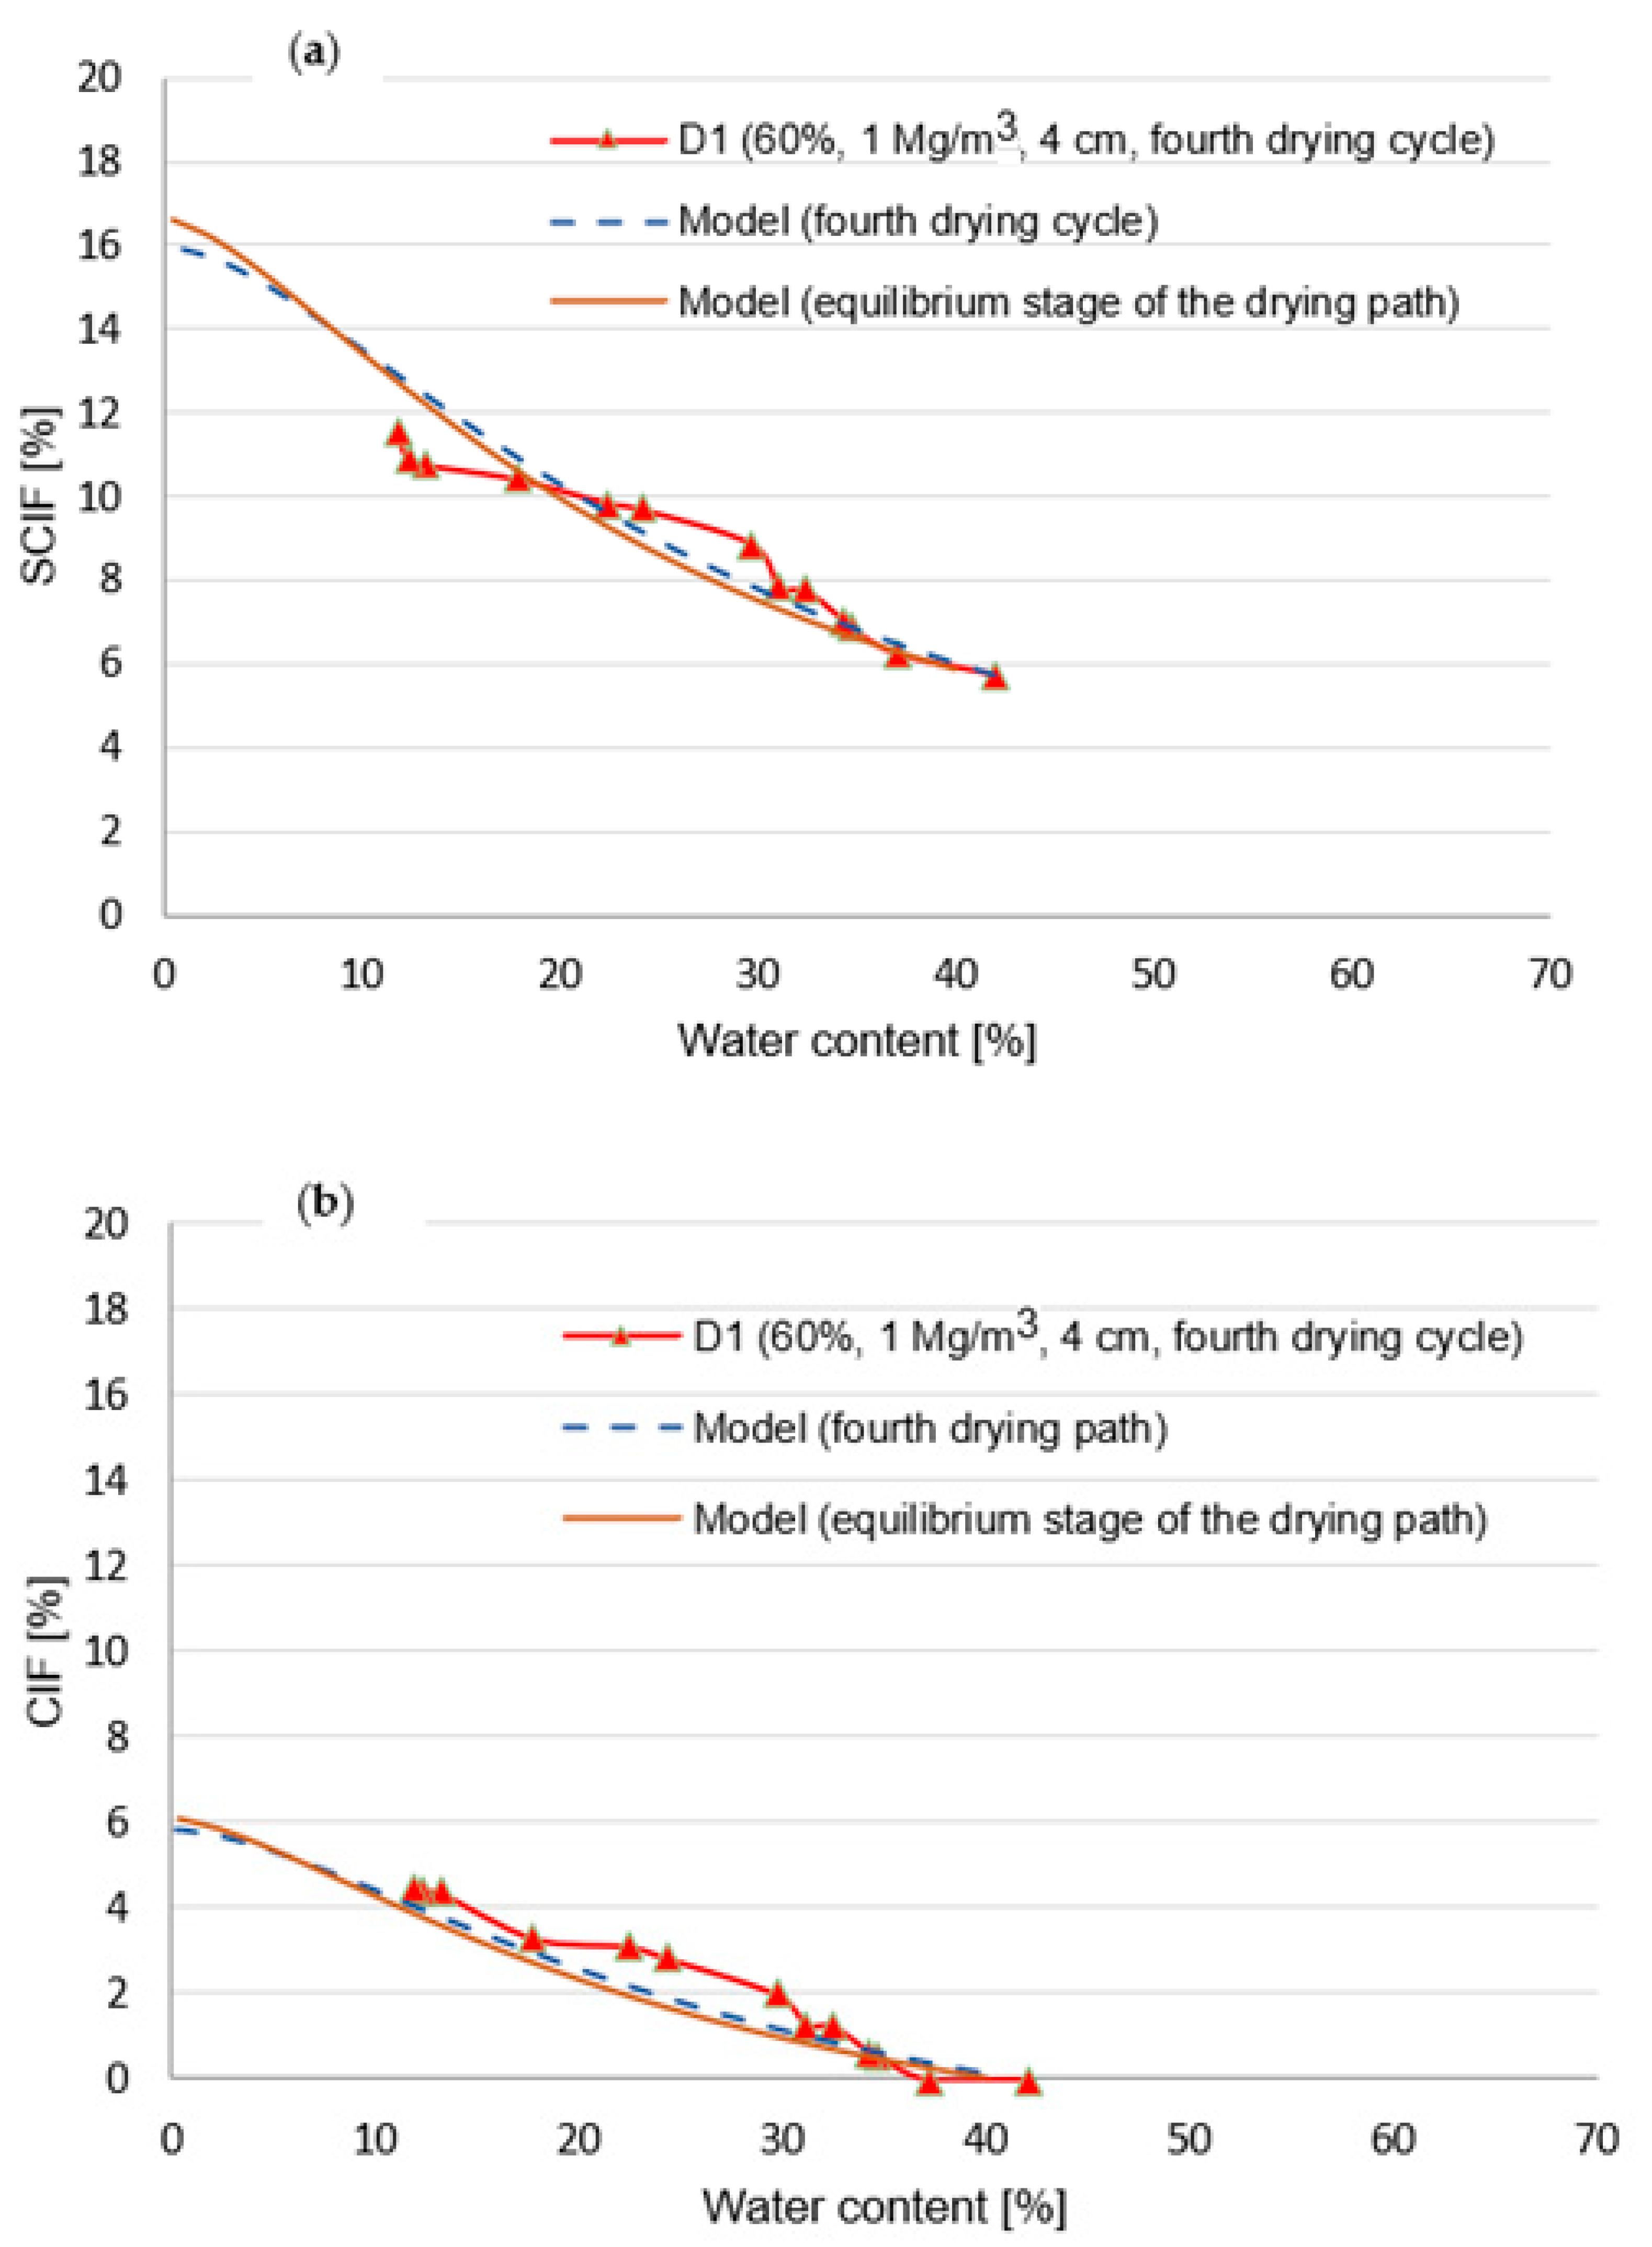
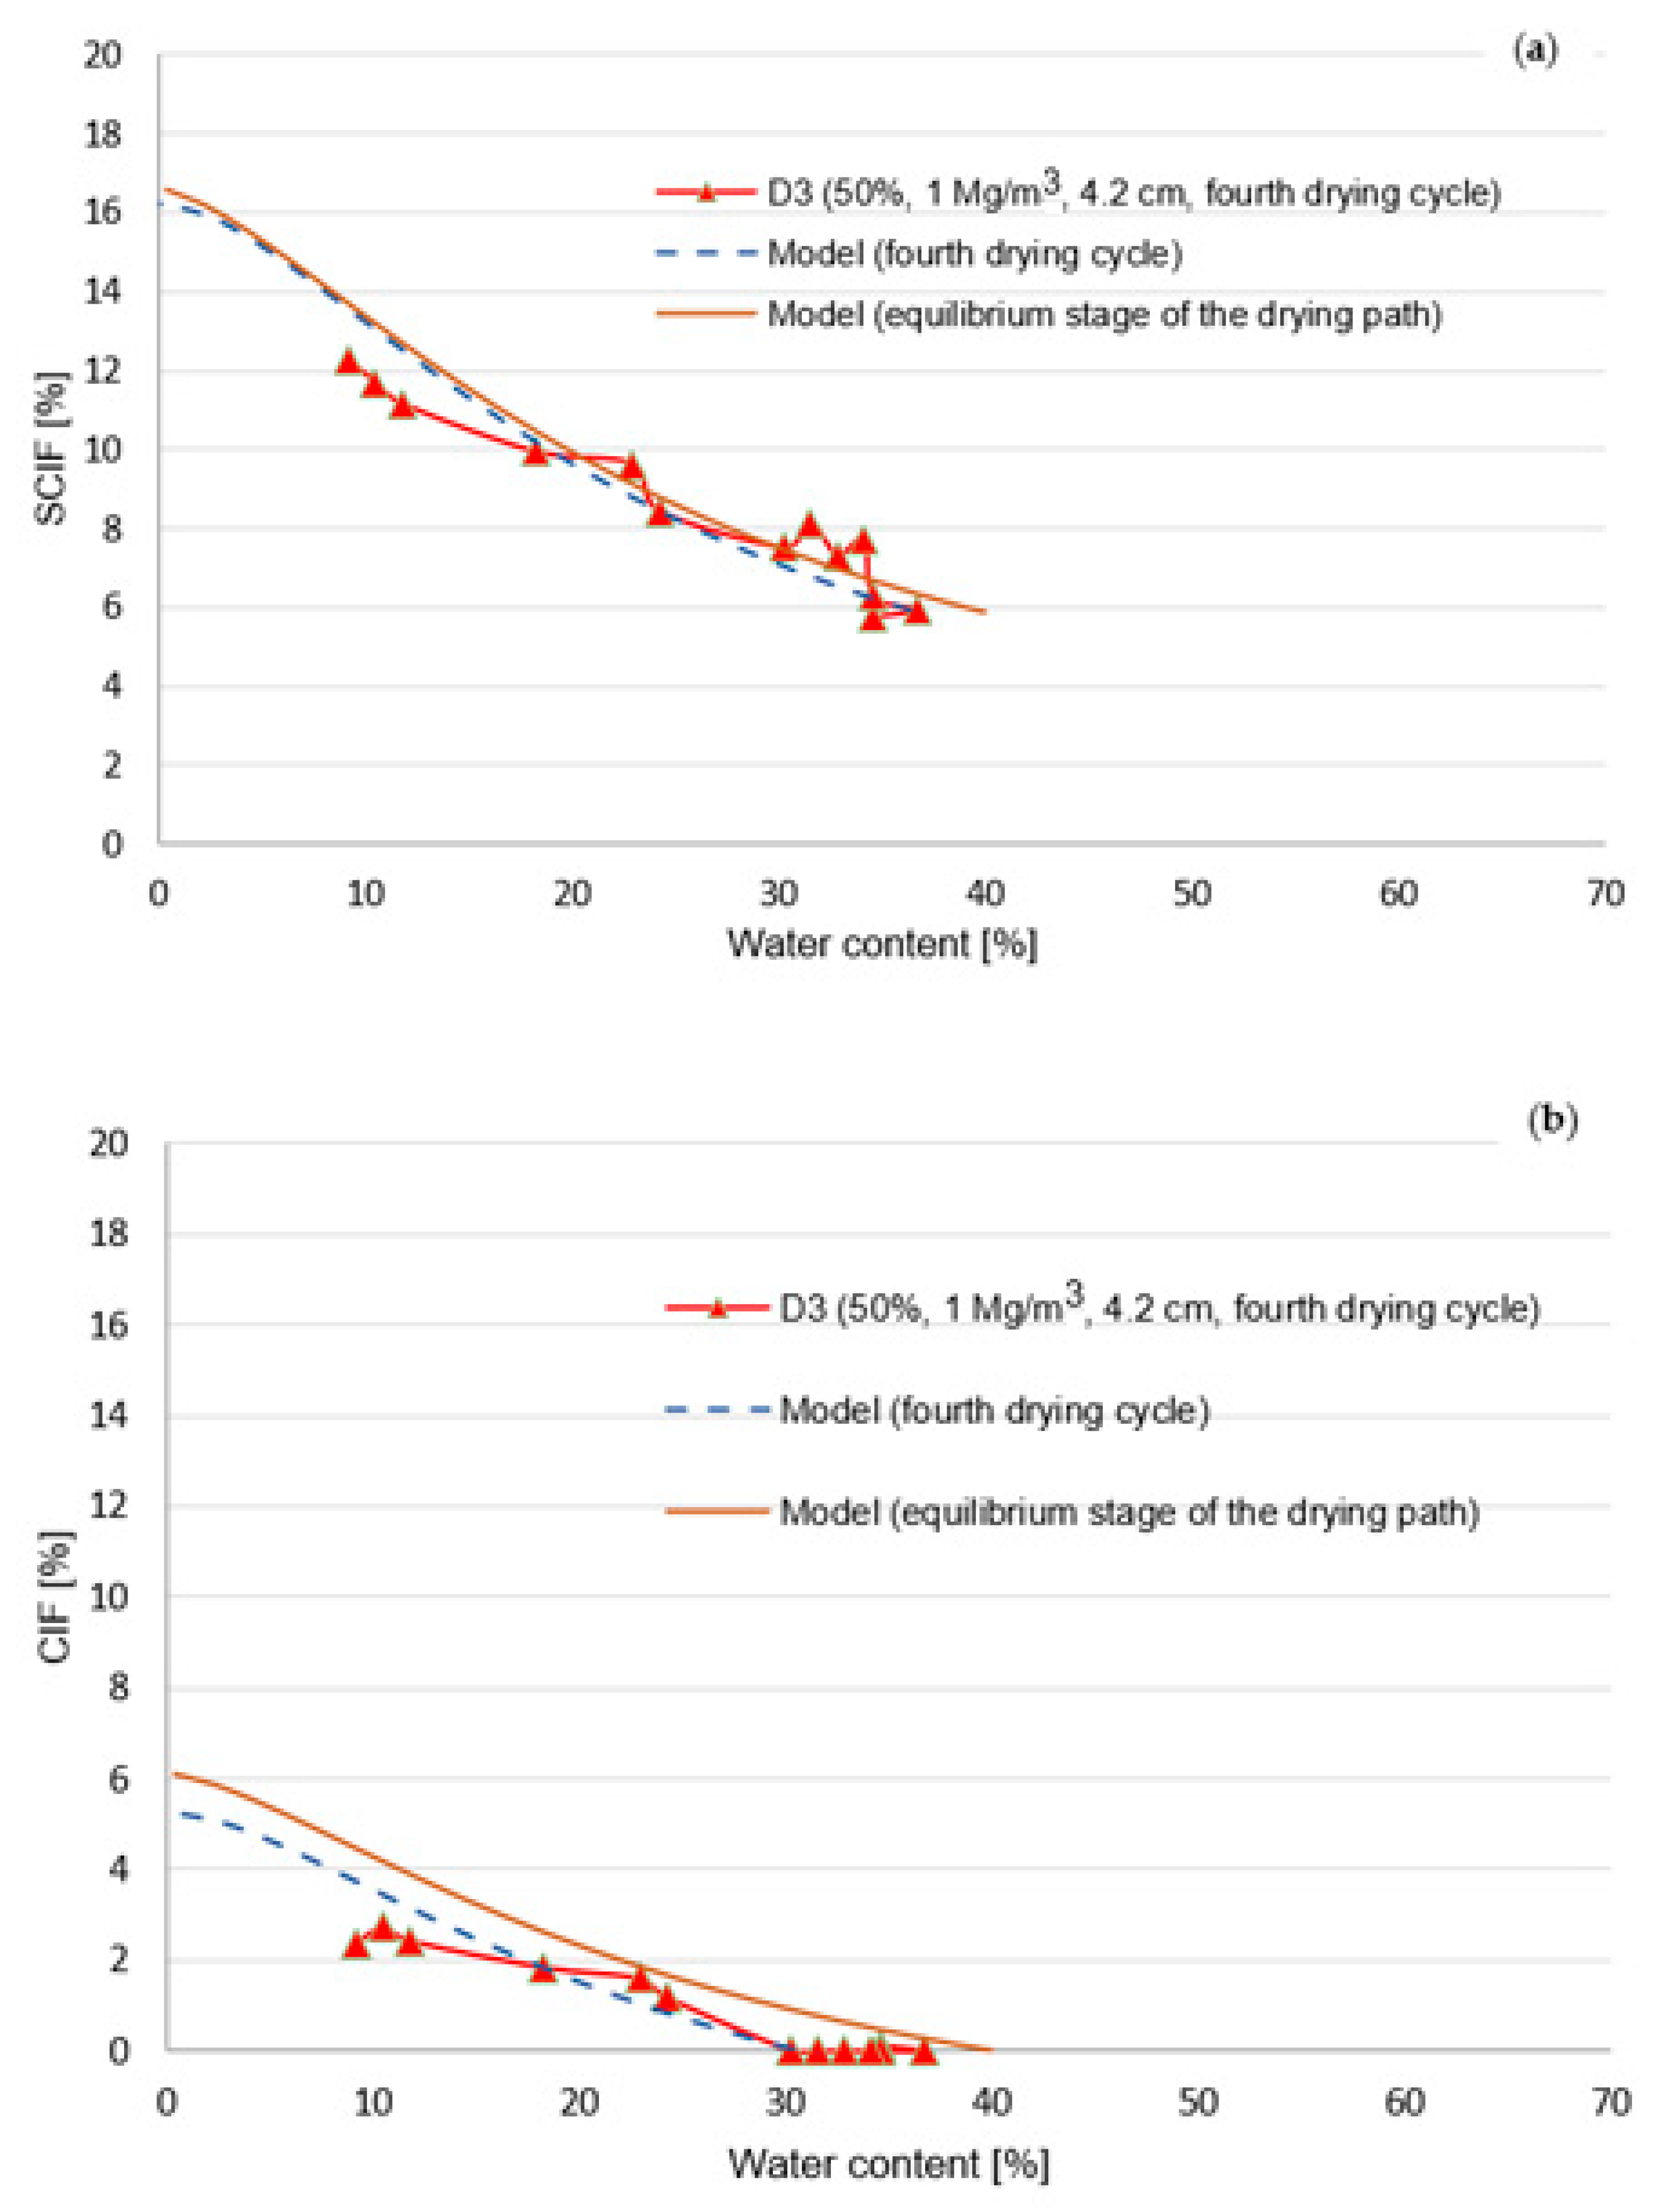
Both tests show the same series of the fitted parameters for the last drying path, confirming the equilibrium stage is unique for both samples constituted of the same material although they are prepared at two different initial water contents. These parameters (reported in Table 4 and Table 5), and constant SCIF and CIF values of 5.85% and 0%, respectively, (the average value of the experimental SCIF and CIF values at the end of the third wetting path reported in Table 4) are used to reproduce the shrinkage crack curve at the equilibrium stage of the drying path. Figure 10 and Figure 11 show the simulated SCIF and CIF results for the fourth drying cycle and the equilibrium stage of the drying path compared to the experimental results of the tests D1 and D3 at their fourth drying path. The simulation results confirm that the equilibrium stage has already been reached for the Test D1, while one or two additional drying and wetting cycles are still necessary for the test D3. This is also the reason that no prediction is presented for the equilibriums stage of the wetting path. The q value ranges between 1 and 6 for the last wetting path of the tests D1 and D3. One or two additional cycles are necessary to stabilize definitely the q value of the wetting paths.
Since it was complex to measure the vertical subsidence of the samples because of its variability on their surface, these proposed equations let us additionally predict the vertical subsidence of the studied samples during the successive wetting and drying cycles.
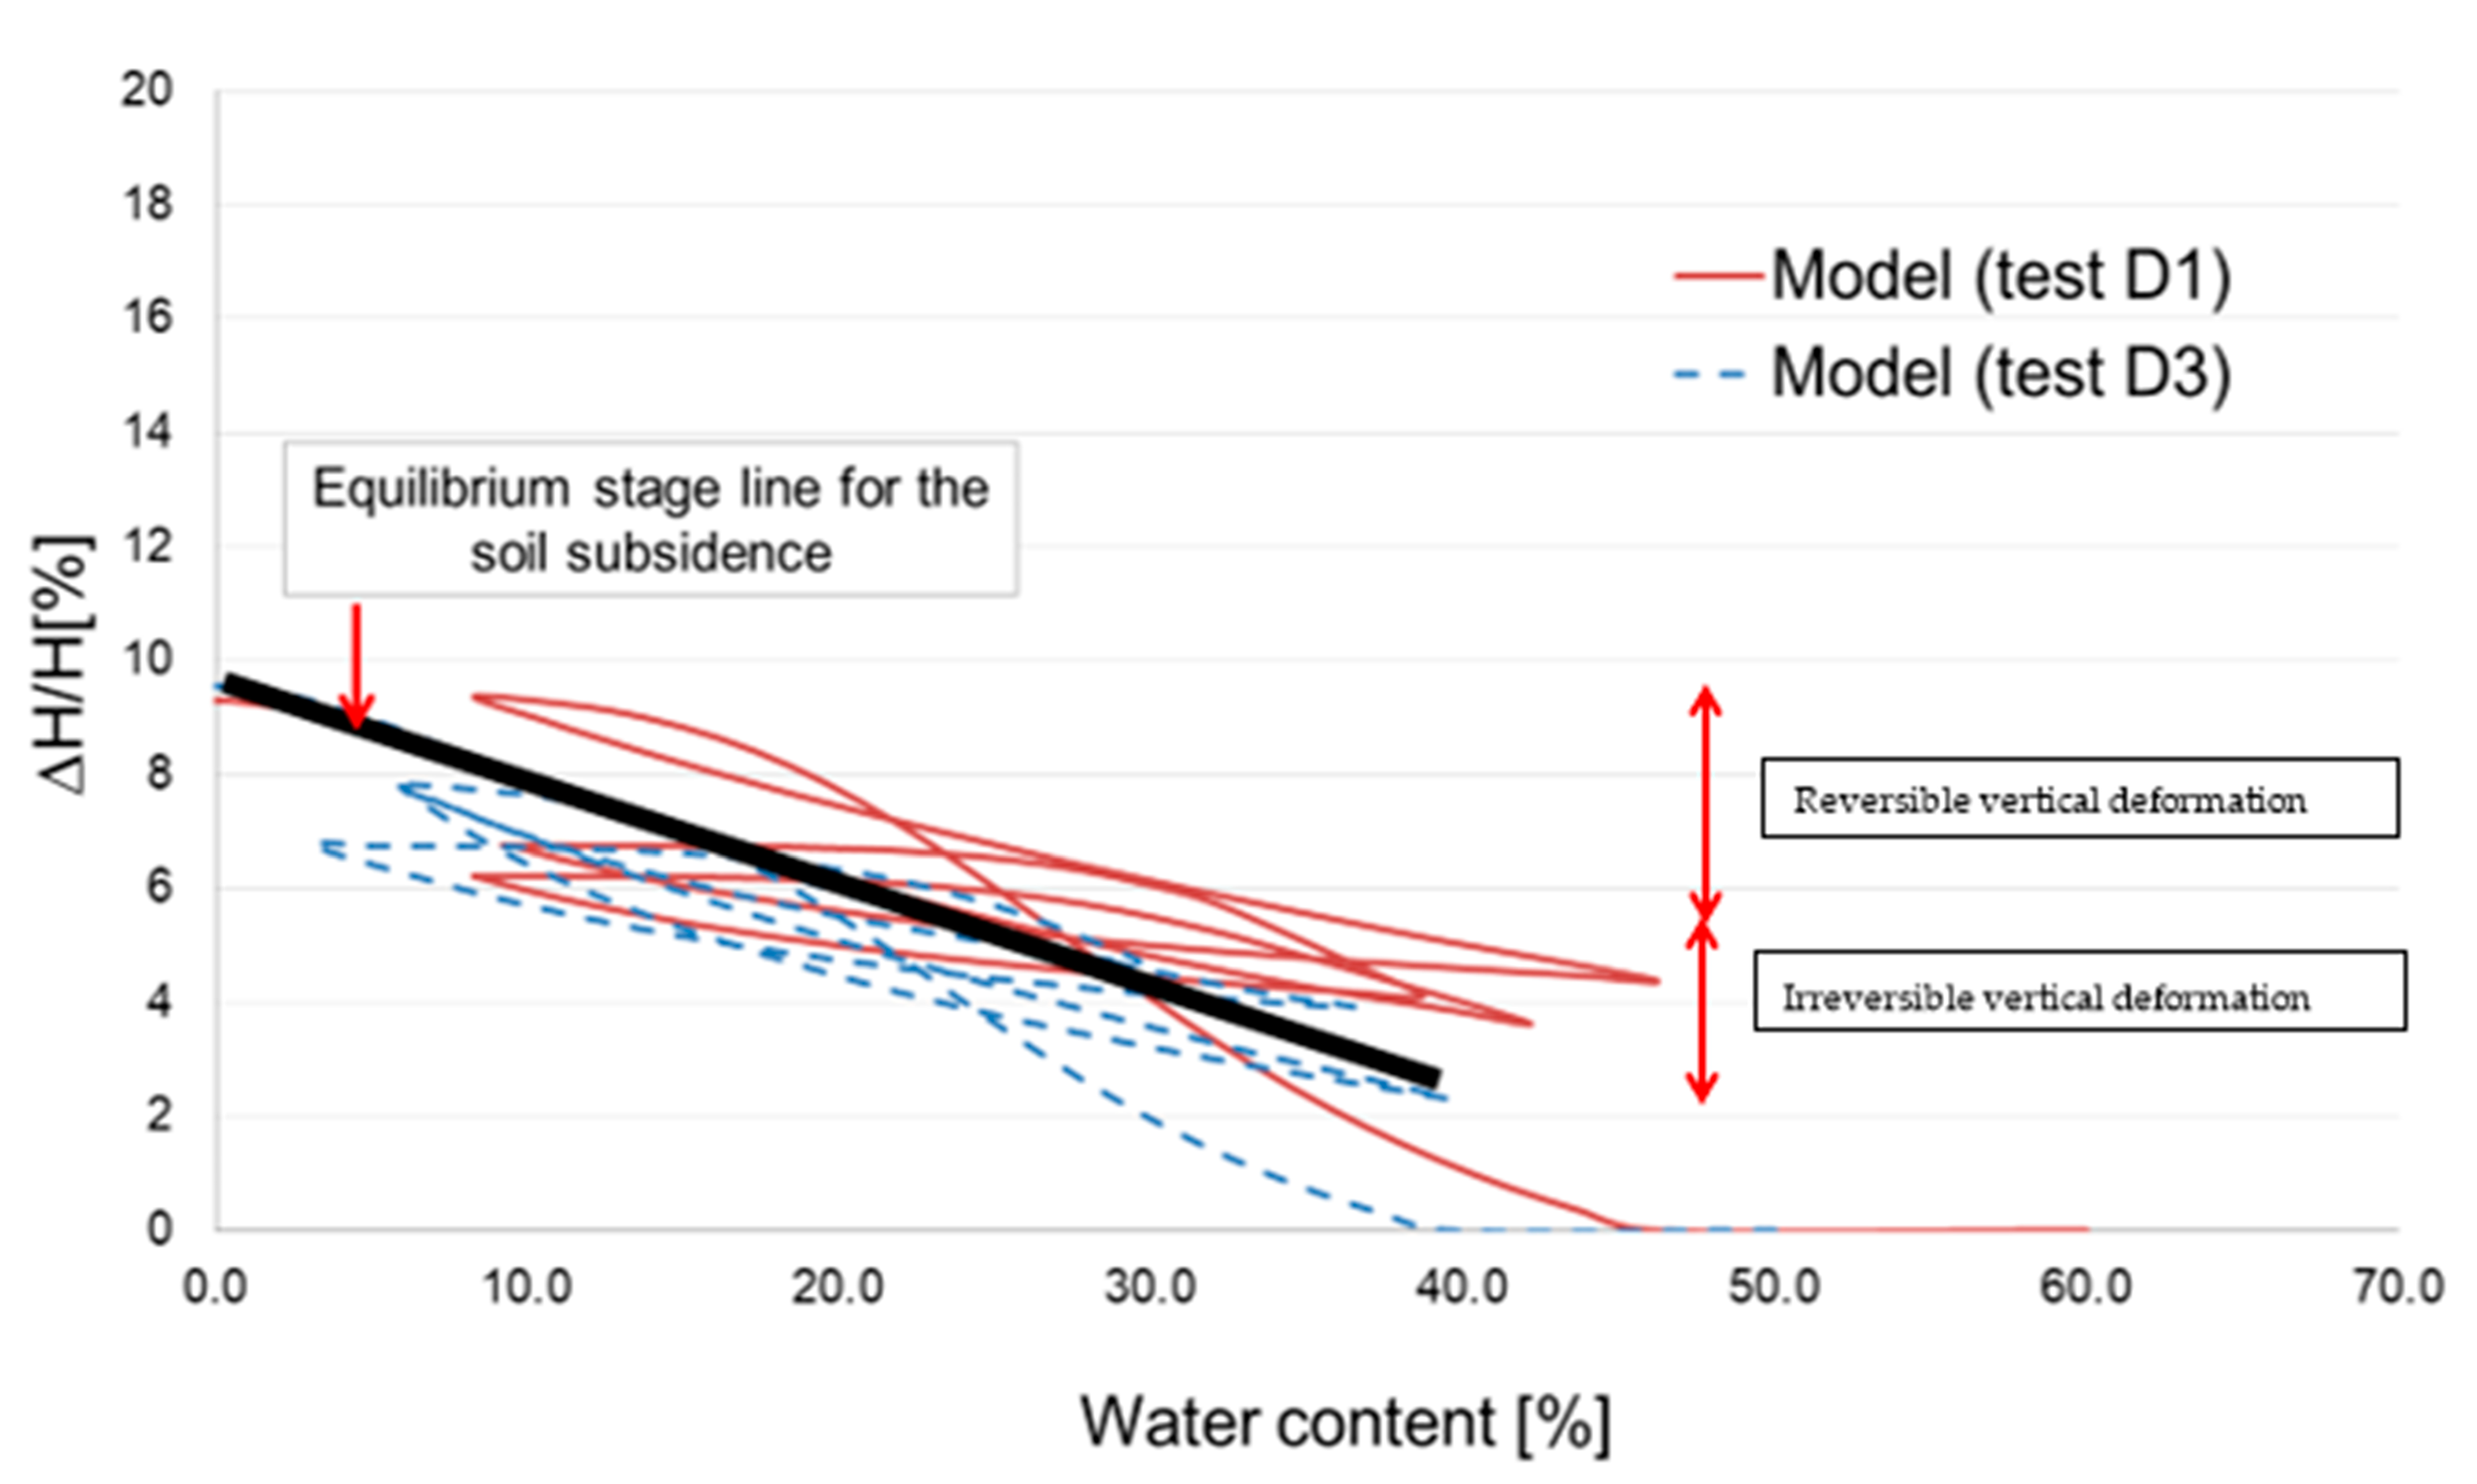
Figure 12 shows the evolution the soil subsidence (∆H/H) during the wetting and drying paths for both tests. A unique equilibrium line is also defined for the last drying cycle of both tests. For the sake of simplification, a linear approach is used to present the nonlinear variation of the last cycle. It shows that both samples can produce a reversible deformation of 5.9% and an irreversible deformation of 3.8% at their equilibrium stage.
The findings of this work can be used for any future application of crack propagation in field conditions. Some laboratory experimental investigations of the soil surface can let us define the final field subsidence of the soil after several wetting and drying cycles. It simplifies the complex long term in situ measurements and helps us to estimate the long-term differential soil settlement, which causes the damages in structures built on these soils.
5. Conclusions
Several laboratory tests were performed on the fine-grained samples prepared at different initials states. The samples were submitted to a single drying phase, then to successive wetting and drying cycles. The shrinkage area and the shrinkage crack area were determined during each test at different water contents by using the image processing method. Globally, the shrinkage crack quantity tends toward an equilibrium stage after several wetting and drying cycles.
A simplified theoretical approach was also able to predict the experimental results by considering shrinkage and swelling in the hysteresis processes. Particularly, both tests presented the same series of the fitted parameters at their last drying path confirming the existence of the unique equilibrium stage after successive wetting and drying cycles. The equilibrium stage is important for practical engineering since the soil settles down before reaching this reversible phase and it can cause some damages in concerned structures.
The soil subsidence was finally predicted during the wetting and drying cycles. It can be separated into two parts at the equilibrium stage: the reversible settlement of the equilibriums stage and the irreversible settlements cumulated during successive wetting and drying cycles. The reversible deformation was 5.9% and the irreversible deformation was 3.8% at the equilibrium stage.
This work has been developed in the laboratory conditions where it is easy to apply successive wetting and drying cycles with the controlled extreme conditions. The next step is to use its findings for long-term field applications. It becomes more complicated since there is no control on the extreme conditions of the environmental solicitations. Some simple field measurements on the soil subsidence and the laboratory characterization of the soil shrinkage crack are necessary to elaborate the proposed approach in field conditions. The approach can be also used to predict whether the in situ soil has already reached its equilibrium stage and how far is it from this stage. This makes it possible to estimate the long-term in situ soil cracking equilibrium stage and the final soil subsidence after successive wetting and drying cycles.
Funding
This research received no external funding.
Data Availability Statement
Not applicable.
Conflicts of Interest
The author declare no conflict of interest.
References
- Nowamooz, H.; Masrouri, F. Density-dependent hydromechanical behaviour of a compacted expansive soil. Eng. Geol. 2009, 106, 105–115. [Google Scholar] [CrossRef]
- Koliji, A.; Laloui, L.; Cusinier, O.; Vulliet, L. Suction induced effects on the fabric of a structured soil. Transp. Porous Media 2006, 64, 261–278. [Google Scholar] [CrossRef]
- Nowamooz, H. Effective stress concept on the multi-structural swelling soils. Appl. Clay Sci. 2014, 101, 205–214. [Google Scholar] [CrossRef]
- Nowamooz, H.; Jahagir, E.; Masrouri, F.; Tisot, J.P. Effective stress in multiscale soils. Eng. Geol. 2016, 210, 33–44. [Google Scholar] [CrossRef]
- Messing, I.; Jarvis, N.J. Seasonal variation in field-saturated hydraulic conductivity in two swelling clay soils in Sweden. J. Soil Sci. 1990, 41, 229–237. [Google Scholar] [CrossRef]
- Chertkov, V.Y. The horizontal hydraulic conductivity of vertical interaggregate capillary cracks in clay soils. In Physical Methods in Agriculture; Blahovec, J., Kutílek, M., Eds.; Springer: New York, NY, USA, 2002; pp. 39–50. [Google Scholar]
- Chertkov, V.Y.; Ravina, I. Shrinking–swelling phenomenon of clay soils attributed to capillary-crack network. Theor. Appl. Fract. Mech. 2000, 34, 61–71. [Google Scholar] [CrossRef]
- Das Gupta, S.; Mohanty, B.P.; Köhne, J.M. Soil hydraulic conductivities and their spatial and temporal variations in a Vertisol. Soil Sci. Soc. Am. J. 2006, 70, 1872–1881. [Google Scholar] [CrossRef] [Green Version]
- Al-homoud, A.S.; Basma, A.A.; Malkawi, A.I.H.; Al-bashabsheh, M.A. Cyclic swelling behavior of clays. J. Geotech. Eng. 1995, 121, 562–565. [Google Scholar] [CrossRef]
- Alonso, E.E.; Romero, E.; Hoffemann, C.; García-Escudero, E. Expansive bentonite/sand mixtures in cyclic controlled suction drying and wetting. Eng. Geol. 2005, 81, 213–226. [Google Scholar] [CrossRef] [Green Version]
- Chu, T.Y.; Mou, C.H. Volume Change Characteristics of Expansive Soils Determined by Controlled Suction Tests. In Proceedings of the 3rd International Conference on Expansive Soils, Haïfa, Israel, 30 July–1 August 1973; Volume 2, pp. 177–185. [Google Scholar]
- Dif, A.E.; Bluemel, W.F. Expansive soils under cyclic drying and wetting. Geotech. Test. J. 1991, 14, 96–102. [Google Scholar]
- Nowamooz, H.; Masrouri, F. Hydromechanical behaviour of an expansive bentonite/silt mixture in cyclic suction-controlled drying and wetting tests. Eng. Geol. 2008, 101, 154–164. [Google Scholar] [CrossRef]
- Nowamooz, H.; Masrouri, F. Shrinkage-swelling of compacted clayey dense and loose soils. Comptes Rendus Mécanique 2009, 337, 781–790. [Google Scholar] [CrossRef]
- Nowamooz, H.; Masrouri, F. Mechanical behaviour of expansive soils after several drying and wetting cycles. Int. J. Geomech. Geoengin. 2010, 5, 213–221. [Google Scholar] [CrossRef]
- Tripathy, S.; Rao, K.S.S.; Fredlund, D.G. Water content–void ratio swell–shrink paths of compacted expansive soils. Can. Geotech. J. 2002, 39, 938–959. [Google Scholar] [CrossRef]
- Qi, W.; Wang, C.; Zhang, Z.; Huang, M.; Xu, J. Experimental Investigation on the Impact of Drying–Wetting Cycles on the Shrink–Swell Behavior of Clay Loam in Farmland. Agriculture 2022, 12, 245. [Google Scholar] [CrossRef]
- Najm, M.R.A.; Jabro, J.D.; Iversen, W.M.; Mohtar, R.H.; Evans, R.G. New method for the characterization of three-dimensional preferential flow paths in the field. Water Resour. Res. 2010, 46, W02503. [Google Scholar] [CrossRef]
- Chertkov, V.Y.; Ravina, I. Effect of interaggregate capillary cracks on the hydraulic conductivity of swelling clay soils. Water Resour. Res. 2001, 37, 1245–1256. [Google Scholar] [CrossRef]
- Kutílek, M. Water relations and water management of Vertisols. Dev. Soil Sci. 1996, 24, 201–230. [Google Scholar] [CrossRef]
- Cabidoche, Y.-M.; Ruy, S. Field shrinkage curves of a swelling clay soil: Analysis of multiple structural swelling and shrinkage phases in the prisms of a Vertisol. Soil Res. 2001, 39, 143–160. [Google Scholar] [CrossRef]
- Konrad, J.M.; Ayad, R. An idealized framework for the analysis of cohesive soils undergoing desiccation. Can. Geotech. J. 1997, 34, 477–488. [Google Scholar] [CrossRef]
- Greco, R. Preferential flow in macroporous swelling soil with internal catchment: Model development and applications. J. Hydrol. 2002, 269, 150–168. [Google Scholar] [CrossRef]
- Bouma, J.; Jongerius, A.; Boersma, O.; Jager, A.; Schoonderbeek, D. The function of different types of macropores during saturated flow through four swelling soil horizons. Soil Sci. Soc. Am. J. 1997, 41, 945–950. [Google Scholar] [CrossRef]
- Cabidoche, Y.-M.; Guillaume, P. A casting method for the three-dimensional analysis of the intraprism structural pores in Vertisols. Eur. J. Soil Sci. 1998, 49, 187–196. [Google Scholar] [CrossRef]
- Favre, F.; Boivin, P.; Wopereis, M. Water movement and soil swelling in a dry, cracked Vertisol. Geoderma 1997, 78, 113–123. [Google Scholar] [CrossRef]
- Costa, S.; Kodikara, J.; Shannon, B. Salient factors controlling desiccation cracking of clay in laboratory experiments. Géotechnique 2013, 63, 18–29. [Google Scholar] [CrossRef]
- Hallaire, V. Evolution of Crack Networks during Shrinkage of a Clay Soil under Grass and Winter Wheat Crops. In Proceedings of the ISSS Symposium on Water and Solute Movement in Heavy Clay Soils, Wageningen, The Netherlands, 27–31 August 1984; Bouma, J., Raats, P.A.C., Eds.; ILRI Publication 37. International Institute for Land Reclamation and Improvement: Wageningen, The Netherlands, 1984. [Google Scholar]
- Liu, C.; Tang, C.H.; Shi, B.; Suo, W.B. Automatic quantification of crack patterns by image processings. Comput. Geosci. 2013, 57, 77–80. [Google Scholar] [CrossRef]
- Peron, H.; Hueckel, T.; Laloui, L.; Hu, L. Fundamentals of desiccation cracking of finegrained soils: Experimental characterisation and mechanisms identification. Can. Geotech. J. 2009, 46, 1177–1201. [Google Scholar] [CrossRef]
- Shin, H.; Santamarina, J.C. Desiccation cracks in saturated fine-grained soils: Particle-level phenomena and effective-stress analysis. Géotechnique 2011, 61, 961–972. [Google Scholar] [CrossRef]
- Shit, P.K.; Bhunia, G.S.; Maiti, R. Soil crack morphology analysis using image processing techniques. Earth Syst. Environ. 2015, 1, 35. [Google Scholar] [CrossRef] [Green Version]
- Tang, C.S.; Shi, B.; Liu, C.; Zhao, L.; Wang, B. Influencing factors of geometrical structure of surface shrinkage cracks in clayey soils. Eng. Geol. 2008, 101, 204–217. [Google Scholar] [CrossRef]
- Tang, C.S.; Cui, Y.J.; Tang, A.M.; Shi, B. Experiment evidence on the temperature dependence of desiccation cracking behavior of clayey soils. Eng. Geol. 2010, 141, 261–266. [Google Scholar] [CrossRef] [Green Version]
- Cordero, J.A.; Prat, P.C.; Ledesma, A. Experimental analysis of desiccation cracks on a clayey silt from a large-scale test in natural conditions. Eng. Geol. 2021, 292, 106256. [Google Scholar] [CrossRef]
- Chaduvula, U.; Viswanadham, B.V.S.; Kodikara, J. Centrifuge model studies on desiccation cracking behaviour of fiber-reinforced expansive clay. Geotext. Geomembr. 2022, 50, 480–497. [Google Scholar] [CrossRef]
- DeCarlo, K.F.; Shokri, N. Salinity effects on cracking morphology and dynamics in 3-D desiccating clays. Water Resour. Res. 2014, 50, 3052–3072. [Google Scholar] [CrossRef]
- Diamond, R.; Varghese, R.M. Desiccation Cracking Behavior and Strength Characteristics of Areca Fiber-Reinforced Fine Grained Soils. In Ground Improvement and Reinforced Soil Structures, Satyanarayana Reddy, C.N.V., Saride, S., Krishna, A.M., Eds.; Springer: Berlin/Heidelberg, Germany, 2022; pp. 105–118. [Google Scholar]
- Návar, J.; Mendez, J.; Bryan, R.B.; Kuhn, N.J. The contribution of shrinkage cracks to bypass flow during simulated and natural rainfall experiments in northeastern Mexico. Can. J. Soil Sci. 2002, 82, 65–74. [Google Scholar] [CrossRef] [Green Version]
- Stewart, R.D.; Abou Najm, M.R.; Rupp, D.E.; Selker, J.S. Measurement tool for dynamics of soil cracks. Vadose Zone J. 2012, 11, vzj2011.0048. [Google Scholar] [CrossRef] [Green Version]
- Stewart, R.D.; Najm, M.R.A.; Rupp, D.E.; Selker, J.S. Nondestructive quantification of macropore volume using shear-thinning fluid. Soil Sci. Soc. Am. J. 2014, 78, 445–453. [Google Scholar] [CrossRef]
- Arnold, J.G.; Potter, K.N.; King, K.W.; Allen, P.M. Estimation of soil cracking and the effect on surface runoff in a Texas Blackland Prairie watershed. Hydrol. Process. 2005, 19, 589–603. [Google Scholar] [CrossRef]
- Brake, B.T.; van der Ploeg, M.J.; de Rooij, G.H. Water storage change estimation from in situ shrinkage measurements of clay soils. Hydrol. Earth Syst. Sci. 2013, 17, 1933–1949. [Google Scholar] [CrossRef] [Green Version]
- Coppola, A.; Comegna, A.; Dragonetti, G.; Gerke, H.H.; Basile, A. Simulated preferential water flow and solute transport in shrinking soils. Vadose Zone J. 2015, 14, vzj2015.02.0021. [Google Scholar] [CrossRef]
- Salager, S.; El Youssoufi, M.S.; Saix, C. Definition and experimental determination of a soil-water retention surface. Can. Geotech. J. 2010, 47, 609–622. [Google Scholar] [CrossRef] [Green Version]
- Lee, F.H.; Lo, K.W.; Lee, S.L. Tension crack development in soils. J. Geotech. Eng. 1988, 114, 915–929. [Google Scholar] [CrossRef]
- Bronswijk, J.J.B. Modeling of water balance, cracking and subsidence of clay soils. J. Hydrol. 1988, 97, 199–212. [Google Scholar] [CrossRef]
- Morris, P.H.; Graham, J.; Williams, D.J. Cracking in drying soils. Can. Geotech. J. 1992, 29, 263–277. [Google Scholar] [CrossRef]
- Hallett, P.D.; Newson, T.A. Describing soil crack formation using elastic–plastic fracture mechanics. Eur. J. Soil Sci. 2005, 56, 31–38. [Google Scholar] [CrossRef]
- Amarasiri, A.L.; Kodikara, J.K.; Costa, S. Numerical modelling of desiccation cracking. Int. J. Numer. Anal. Methods Geomech. 2011, 35, 82–96. [Google Scholar] [CrossRef]
- Amarasiri, A.L.; Costa, S.; Kodikara, J.K. Determination of cohesive properties for mode I fracture from compacted clay beams. Can. Geotech. J. 2011, 48, 1163–1173. [Google Scholar] [CrossRef]
- Stewart, R.D.; Rupp, D.E.; Najm, M.R.A.; Selker, J.S. A unified model for soil shrinkage, subsidence, and cracking. Vadose Zone J. 2016, 15, vzj2015.11.0146. [Google Scholar] [CrossRef] [Green Version]
- Auvray, R.; Rosin-Paumier, S.; Abdallah, A.; Masrouri, F. Quantification of soft soil cracking during suction cycles by image processing. Eur. J. Environ. Civ. Eng. 2014, 18, 11–32. [Google Scholar] [CrossRef]
- Louatia, F.; Trabelsia, H.; Jameia, M.; Taibi, S. Impact of wetting-drying cycles and cracks on the permeability of compacted clayey soil. Eur. J. Environ. Civ. Eng. 2018, 25, 696–721. [Google Scholar] [CrossRef]
- Haines, W.B. The volume-changes associated with variations of water content in soil. J. Agriculture. Sci. 1923, 13, 296–311. [Google Scholar] [CrossRef]
- McGarry, D.; Daniells, I.G. Shrinkage curves indices to quantify cultivation effects on soil structure of a Vertisol. Soil Sci. Soc. Am. J. 1987, 51, 1575–1580. [Google Scholar] [CrossRef]
- Peng, X.; Horn, R. Identifying six types of soil shrinkage curves from a large set of experimental data. Soil Sci. Soc. Am. J. 2013, 77, 372–381. [Google Scholar] [CrossRef]
- SPOSITO, G. Volumes changes in swelling soils. Soil Sci. 1973, 115, 315–320. [Google Scholar] [CrossRef]
- Chertkov, V.Y.; Ravina, I.; Zadoenko, V. An approach for estimating the shrinkage geometry factor at a moisture content. Soil Sci. Soc. Am. J. 2004, 68, 1807–1817. [Google Scholar] [CrossRef]
- Fityus, S.; Buzzi, O. The place of expansive clays in the framework of unsaturated soil mechanics. Appl. Clay Sci. 2009, 43, 150–155. [Google Scholar] [CrossRef]
- Bronswijk, J. Shrinkage geometry of a heavy clay soil at various stresses. Soil Sci. Soc. Am. J. 1990, 54, 1500–1502. [Google Scholar] [CrossRef]
Figure 1.
Example of the crack imaging routine used to estimate shrinkage area (SIF ratio) on the top and crack area (CIF ratio) on the bottom.
Figure 1.
Example of the crack imaging routine used to estimate shrinkage area (SIF ratio) on the top and crack area (CIF ratio) on the bottom.

Figure 2.
Evolution of shrinkage crack of the different studied samples during a single drying path (test D1 to D7) (a) SCIF and (b) CIF.
Figure 2.
Evolution of shrinkage crack of the different studied samples during a single drying path (test D1 to D7) (a) SCIF and (b) CIF.

Figure 3.
Linear correlation between the initial water content of the studied samples with their water content of the shrinkage crack initiation.
Figure 3.
Linear correlation between the initial water content of the studied samples with their water content of the shrinkage crack initiation.

Figure 4.
Evolution of shrinkage crack during several drying and wetting paths (test D1) (a) SCIF and (b) CIF.
Figure 4.
Evolution of shrinkage crack during several drying and wetting paths (test D1) (a) SCIF and (b) CIF.

Figure 5.
Evolution of shrinkage crack during several drying and wetting paths (test D3) (a) SCIF and (b) CIF.
Figure 5.
Evolution of shrinkage crack during several drying and wetting paths (test D3) (a) SCIF and (b) CIF.

Figure 6.
The second polynomial equation for the relation between fcrack and initial dry density of the studied samples.
Figure 6.
The second polynomial equation for the relation between fcrack and initial dry density of the studied samples.

Figure 7.
Simulation results compared to the experimental results for the test D1 during the third drying and wetting cycle: (a) SCIF and (b) CIF.
Figure 7.
Simulation results compared to the experimental results for the test D1 during the third drying and wetting cycle: (a) SCIF and (b) CIF.

Figure 8.
Simulation results compared to the experimental results for the test D3 during the third drying and wetting cycle: (a) SCIF and (b) CIF.
Figure 8.
Simulation results compared to the experimental results for the test D3 during the third drying and wetting cycle: (a) SCIF and (b) CIF.

Figure 9.
Evolution of the model parameters (ε, q, ϕmax, Dry Density) with the drying and wetting cycles.
Figure 9.
Evolution of the model parameters (ε, q, ϕmax, Dry Density) with the drying and wetting cycles.

Figure 10.
Simulation results compared to the experimental results for the test D1 (fourth drying path and equilibrium stage of the drying path) (a) SCIF and (b) CIF.
Figure 10.
Simulation results compared to the experimental results for the test D1 (fourth drying path and equilibrium stage of the drying path) (a) SCIF and (b) CIF.

Figure 11.
Simulation results compared to the experimental results for the test D3 (fourth drying path and equilibrium stage of the drying path) (a) SCIF and (b) CIF.
Figure 11.
Simulation results compared to the experimental results for the test D3 (fourth drying path and equilibrium stage of the drying path) (a) SCIF and (b) CIF.

Figure 12.
Soil subsidence (∆H/H) after several wetting and drying for the tests D1 and D3.


Table 1.
Physical properties of soil.
| Soil Property | Value |
|---|---|
| Specific gravity | 2.65 |
| Liquid limit | 30.9% |
| Plastic limit | 17.7% |
| Plasticity index | 13.2% |
| USUC Classification | ML-CL |
| Grain size analysis | |
| Sand (pores between 50 and 80 µm) | 20% |
| Silt (pores between 2 and 50 µm) | 45% |
| Clay (pores less than 2 µm) | 35% |
Table 2.
Initial states for the different tested samples.
| Test | Water Content (%) | Dry Density (Mg/m3) | Sample Height (cm) |
|---|---|---|---|
| D1 | 60 | 1 | 4 |
| D2 | 60 | 1.15 | 3.6 |
| D3 | 50 | 1 | 4.2 |
| D4 | 45 | 1.25 | 1.05 |
| D5 | 45 | 1.2 | 1.3 |
| D6 | 30 | 1.4 | 2 |
| D7 | 25 | 1.55 | 4.5 |
Table 3.
SCIF and CIF values at the final water content of each drying and wetting path (Tests D1 and D3).
Table 3.
SCIF and CIF values at the final water content of each drying and wetting path (Tests D1 and D3).
| Initial Water Content (%) | Cycle | First Drying | First Wetting | Second Drying | Second Wetting | Third Drying | Third Wetting | Fourth Drying |
|---|---|---|---|---|---|---|---|---|
| 60 | Final water content (%) | 7.7 | 46.7 | 10.0 | 38.0 | 7.75 | 42.1 | 11.9 |
| SCIF (%) | 16.03 | 7.5 | 10.57 | 6.91 | 11.04 | 5.74 | 11.51 | |
| CIF (%) | 0.00 | 0.00 | 4.27 | 0.11 | 3.50 | 0.00 | 4.48 | |
| 50 | Final water content (%) | 5.3 | 39.3 | 6.2 | 31.1 | 4.0 | 36.7 | 9.2 |
| SCIF (%) | 14.29 | 4.76 | 12.81 | 7.61 | 12.03 | 5.95 | 12.25 | |
| CIF (%) | 0 | 0.69 | 3.75 | 0.24 | 1.97 | 0.00 | 2.4 |
Table 4.
Fitted parameters for the analytical simulations of several drying and wetting cycles (Test D1).
Table 4.
Fitted parameters for the analytical simulations of several drying and wetting cycles (Test D1).
| Cycle | First Drying | First Wetting | Second Drying | Second Wetting | Third Drying | Third Wetting | Fourth Drying | Equilibrium Stage | |
|---|---|---|---|---|---|---|---|---|---|
| Parameter | |||||||||
| Initial dry density | 1 | 1.9 | 1.35 | 1.4 | 1.4 | 1.5 | 1.5 | 1.5 | |
| 5 | 0.1 | 2 | 2 | 2 | 2 | 2 | 2 | ||
| 4 | 0.65 | 0.65 | 7 | 0.6 | 6 | 1.5 | 1.5 | ||
| 0.54 | 0.5 | 0.45 | 0.4 | 0.45 | 0.37 | 0.45 | 0.45 | ||
| 0.283 | 0.283 | 0.283 | 0.283 | 0.283 | 0.283 | 0.283 | 0.283 | ||
Table 5.
Fitted parameters for the analytical simulations of several drying and wetting cycles (Test D3).
Table 5.
Fitted parameters for the analytical simulations of several drying and wetting cycles (Test D3).
| Parameter | First Drying | First Wetting | Second Drying | Second Wetting | Third Drying | Third Wetting | Fourth Drying | Equilibrium Stage | |
|---|---|---|---|---|---|---|---|---|---|
| Cycle | |||||||||
| Initial dry density | 1 | 1.9 | 1.15 | 1.5 | 1.65 | 1.5 | 1.5 | 1.5 | |
| 5 | 0.1 | 0.5 | 2 | 0.5 | 2 | 2 | 2 | ||
| 4 | 0.7 | 0.4 | 1 | 4.2 | 1 | 1.5 | 1.5 | ||
| 0.5 | 0.5 | 0.6 | 0.45 | 0.45 | 0.4 | 0.45 | 0.45 | ||
| 0.283 | 0.283 | 0.283 | 0.283 | 0.283 | 0.283 | 0.283 | 0.283 | ||
Disclaimer/Publisher’s Note: The statements, opinions and data contained in all publications are solely those of the individual author(s) and contributor(s) and not of MDPI and/or the editor(s). MDPI and/or the editor(s) disclaim responsibility for any injury to people or property resulting from any ideas, methods, instructions or products referred to in the content. |
© 2023 by the author. Licensee MDPI, Basel, Switzerland. This article is an open access article distributed under the terms and conditions of the Creative Commons Attribution (CC BY) license (https://creativecommons.org/licenses/by/4.0/).
Share and Cite
MDPI and ACS Style
Nowamooz, H. Equilibrium Stage of Soil Cracking and Subsidence after Several Wetting and Drying Cycles. Geotechnics 2023, 3, 193-211. https://doi.org/10.3390/geotechnics3020012
AMA Style
Nowamooz H. Equilibrium Stage of Soil Cracking and Subsidence after Several Wetting and Drying Cycles. Geotechnics. 2023; 3(2):193-211. https://doi.org/10.3390/geotechnics3020012
Chicago/Turabian StyleNowamooz, Hossein. 2023. "Equilibrium Stage of Soil Cracking and Subsidence after Several Wetting and Drying Cycles" Geotechnics 3, no. 2: 193-211. https://doi.org/10.3390/geotechnics3020012