
Spatial Variability during Shrinkage Testing of Expansive Clays


Abstract
:1. Introduction
2. Research Methodology
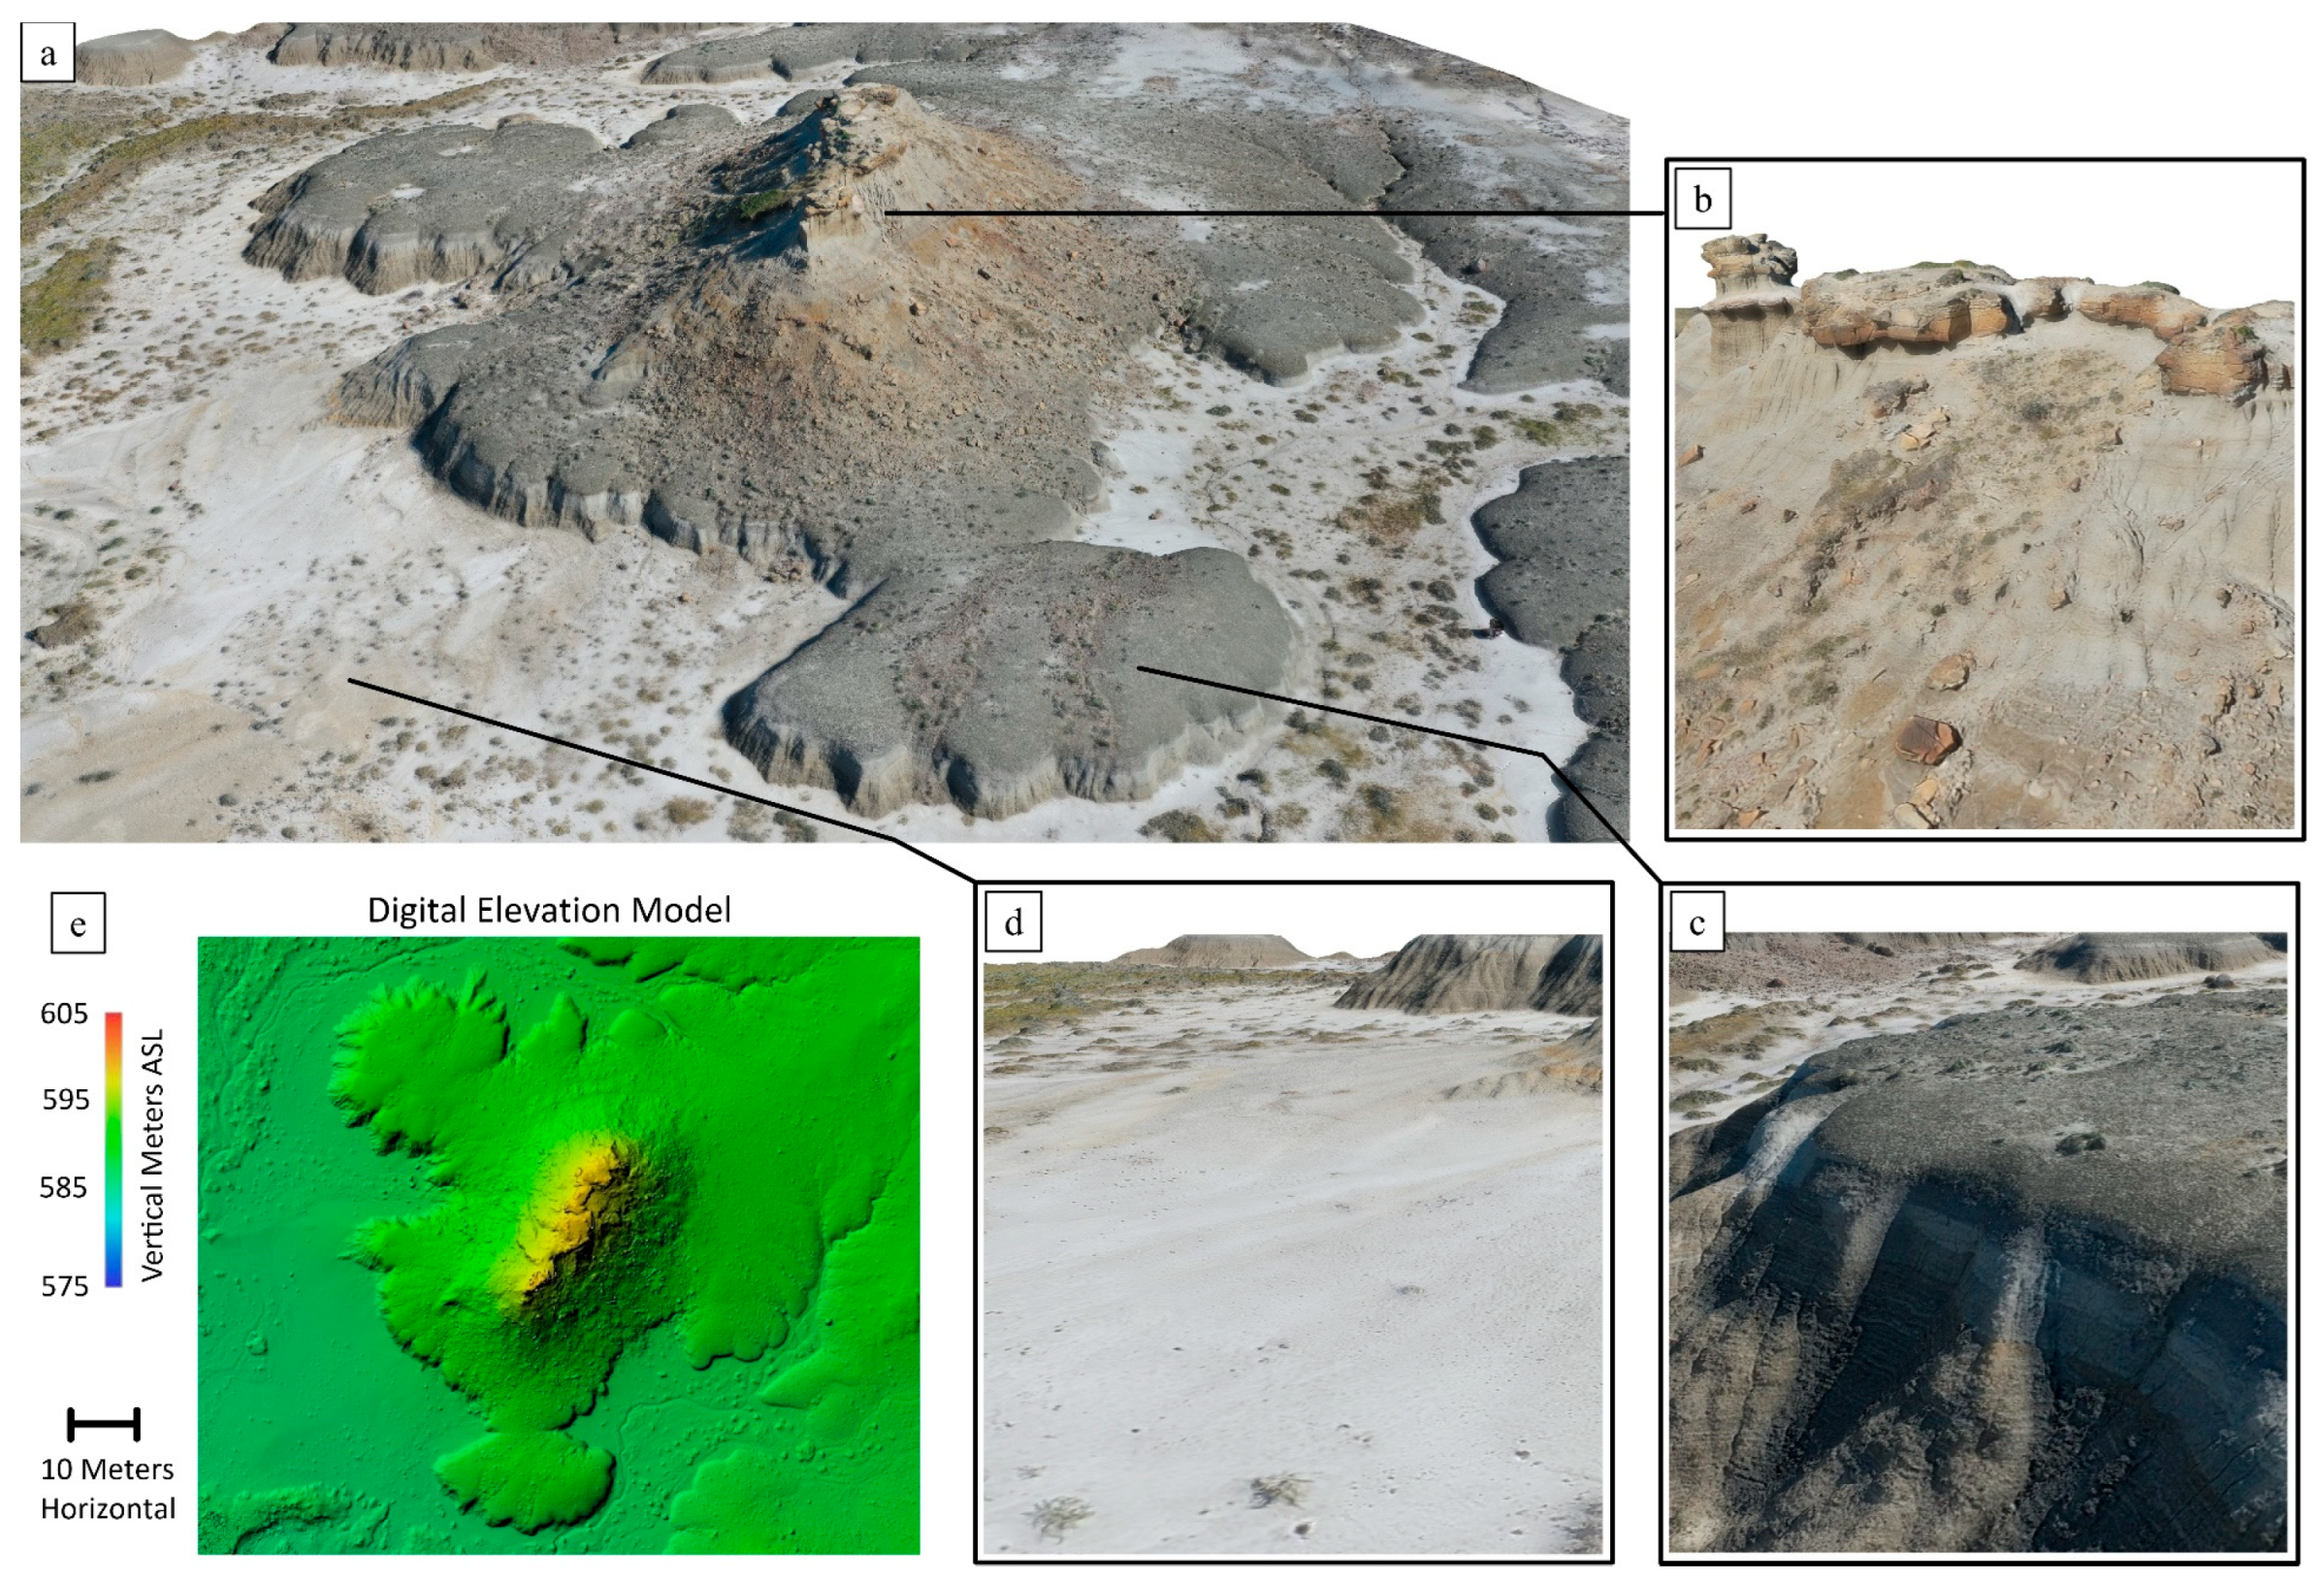
2.1. Site Investigation and Sample Selection
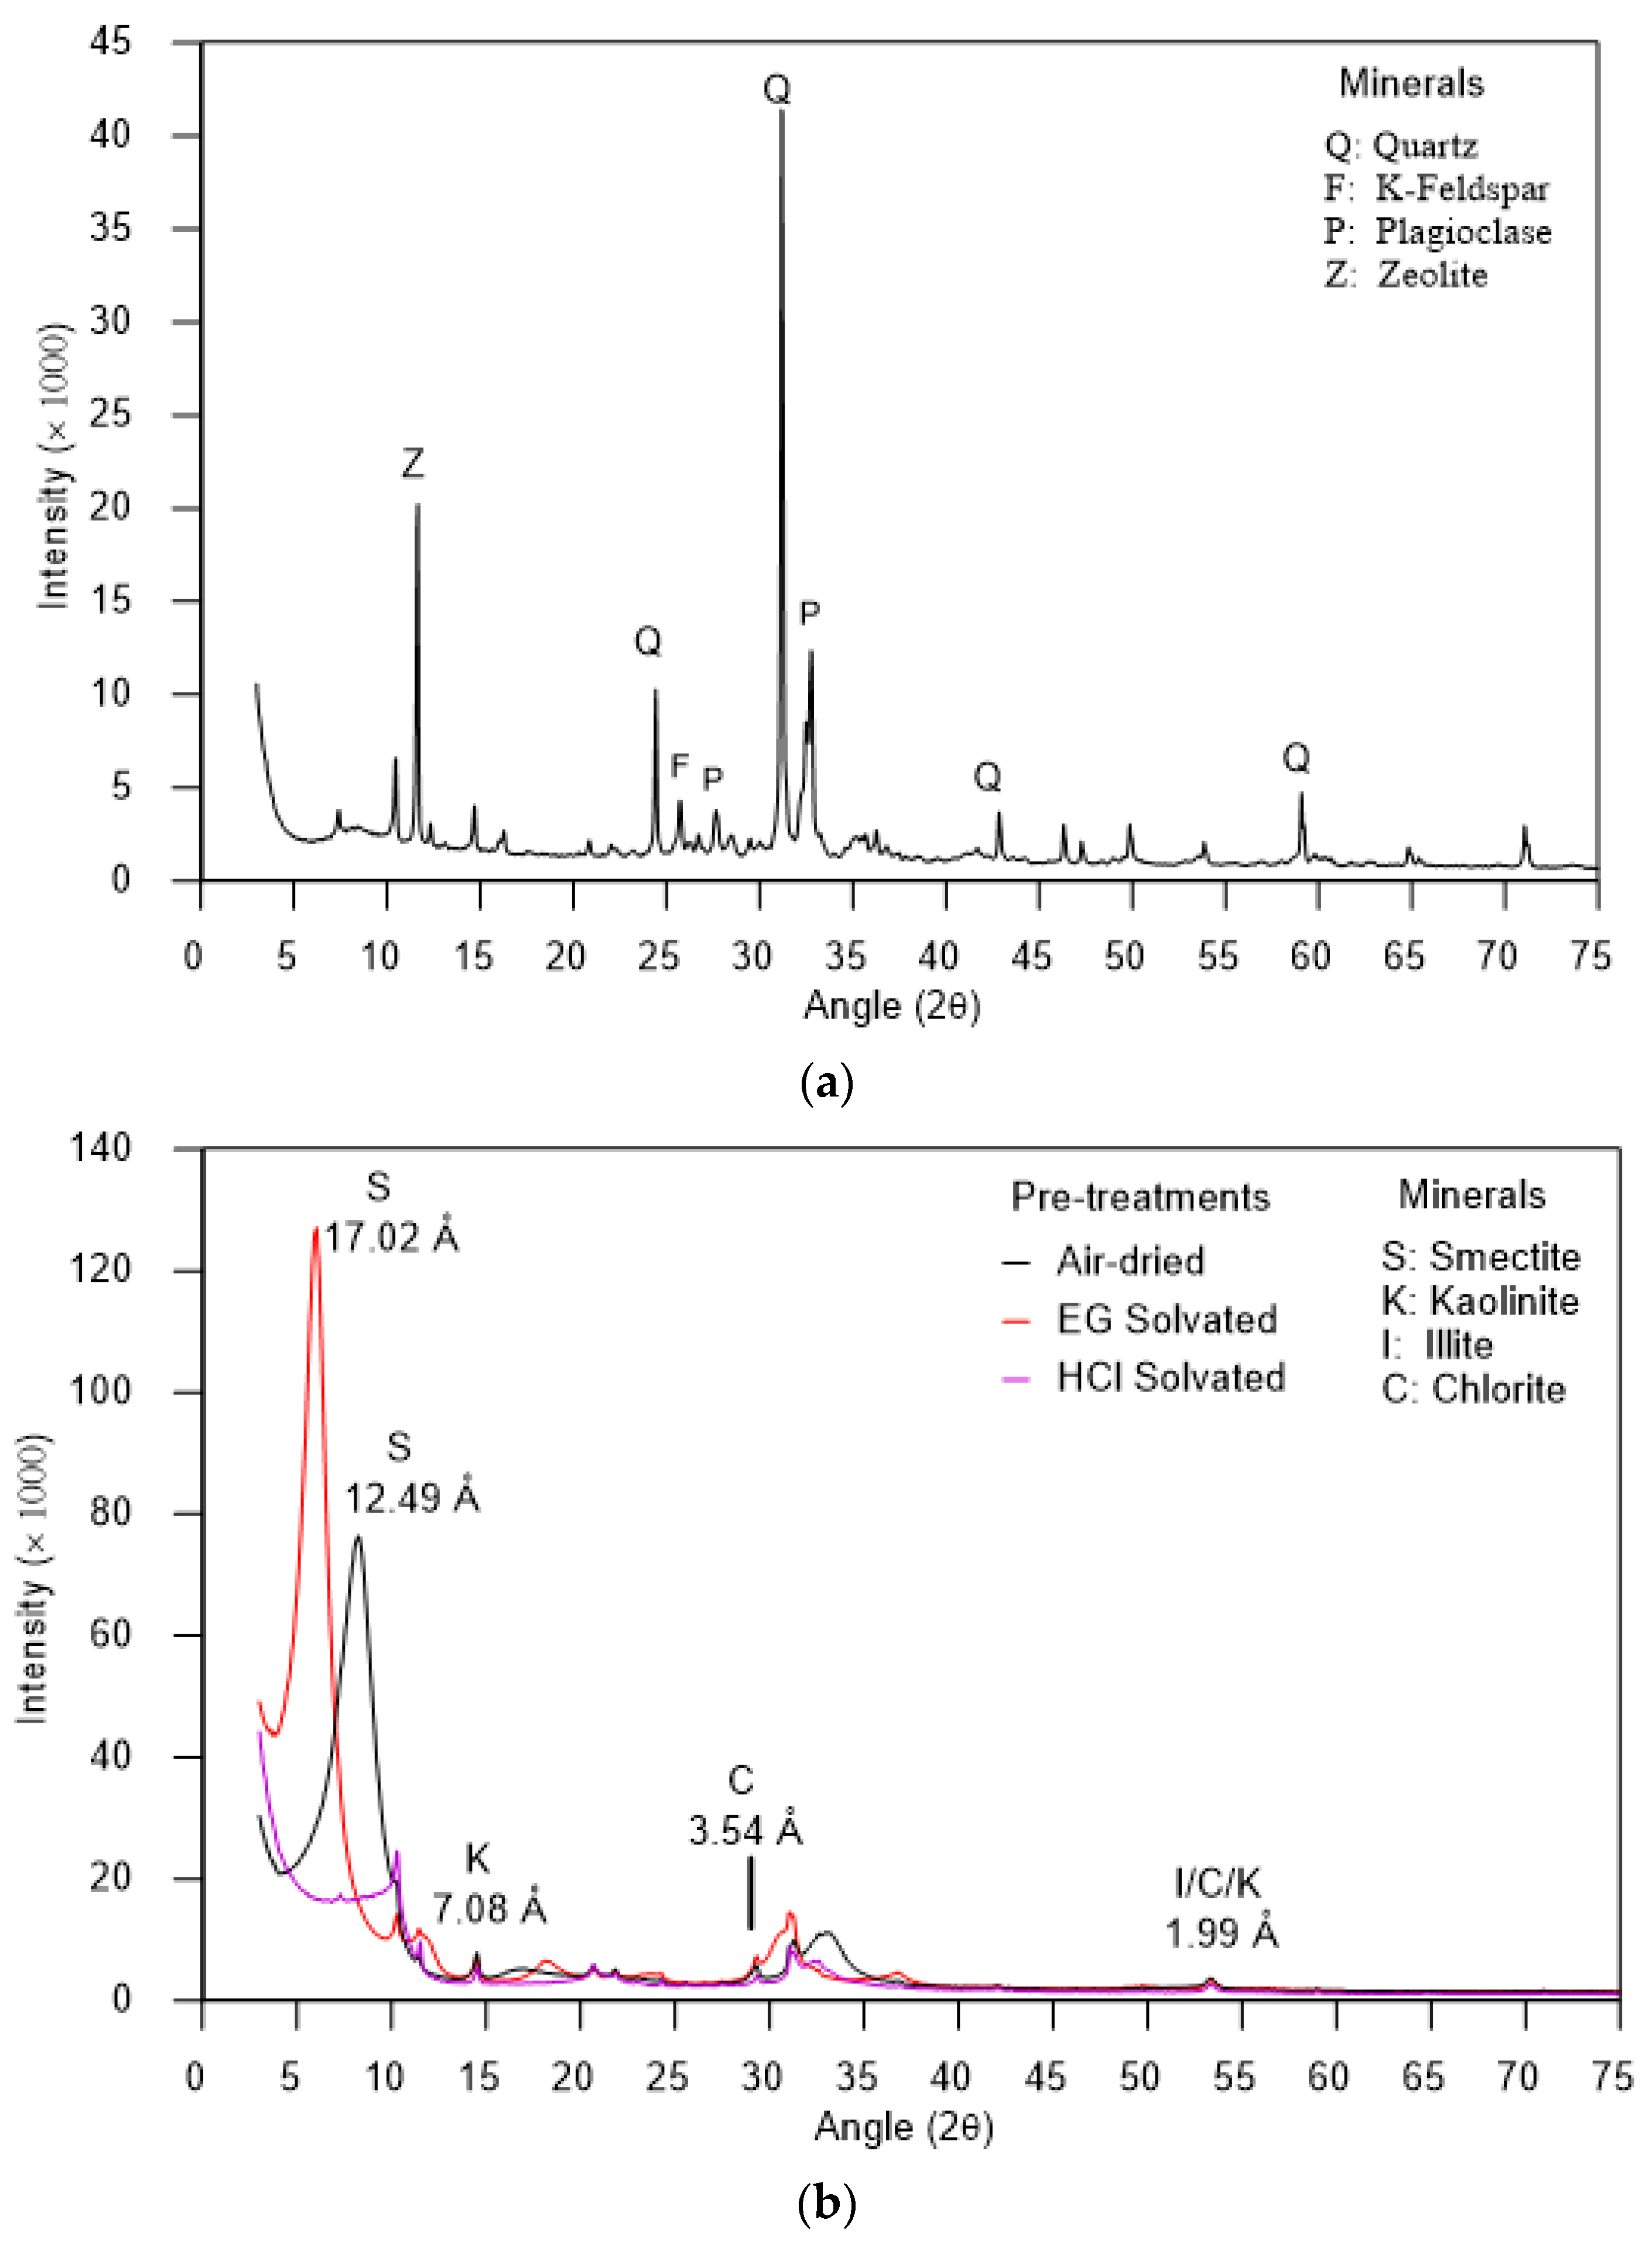
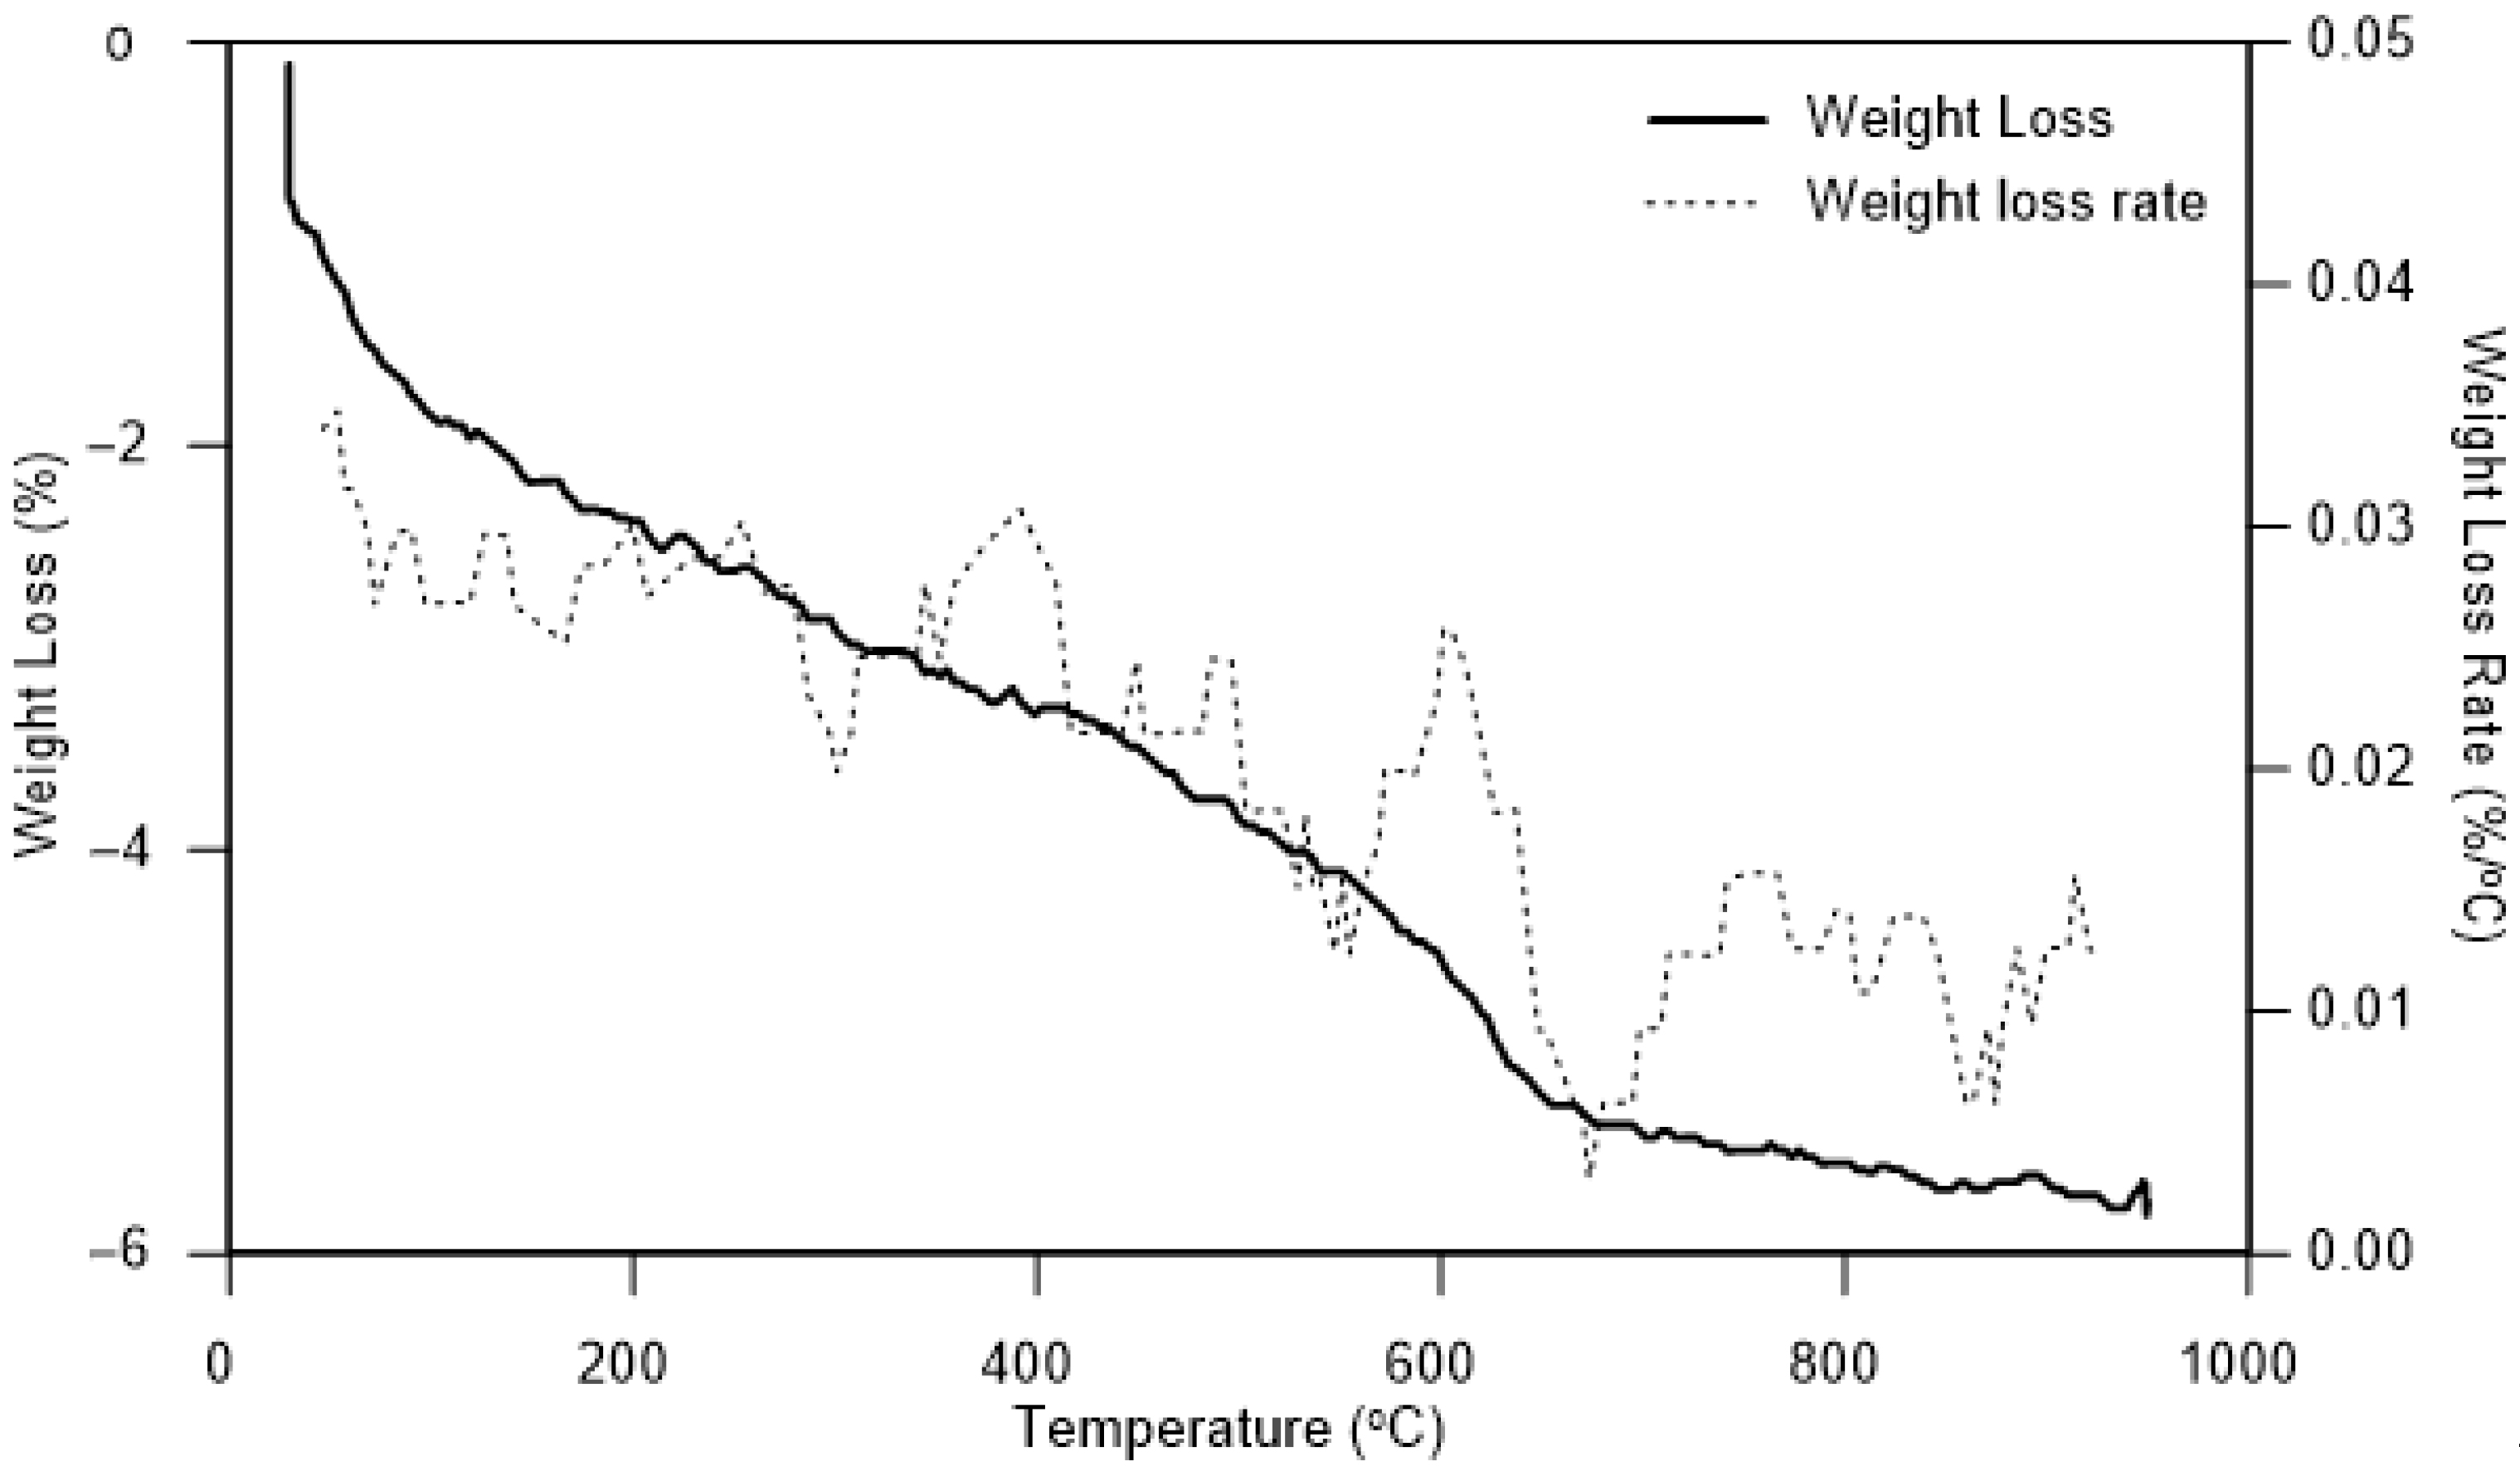
2.2. Soil and Water Composition
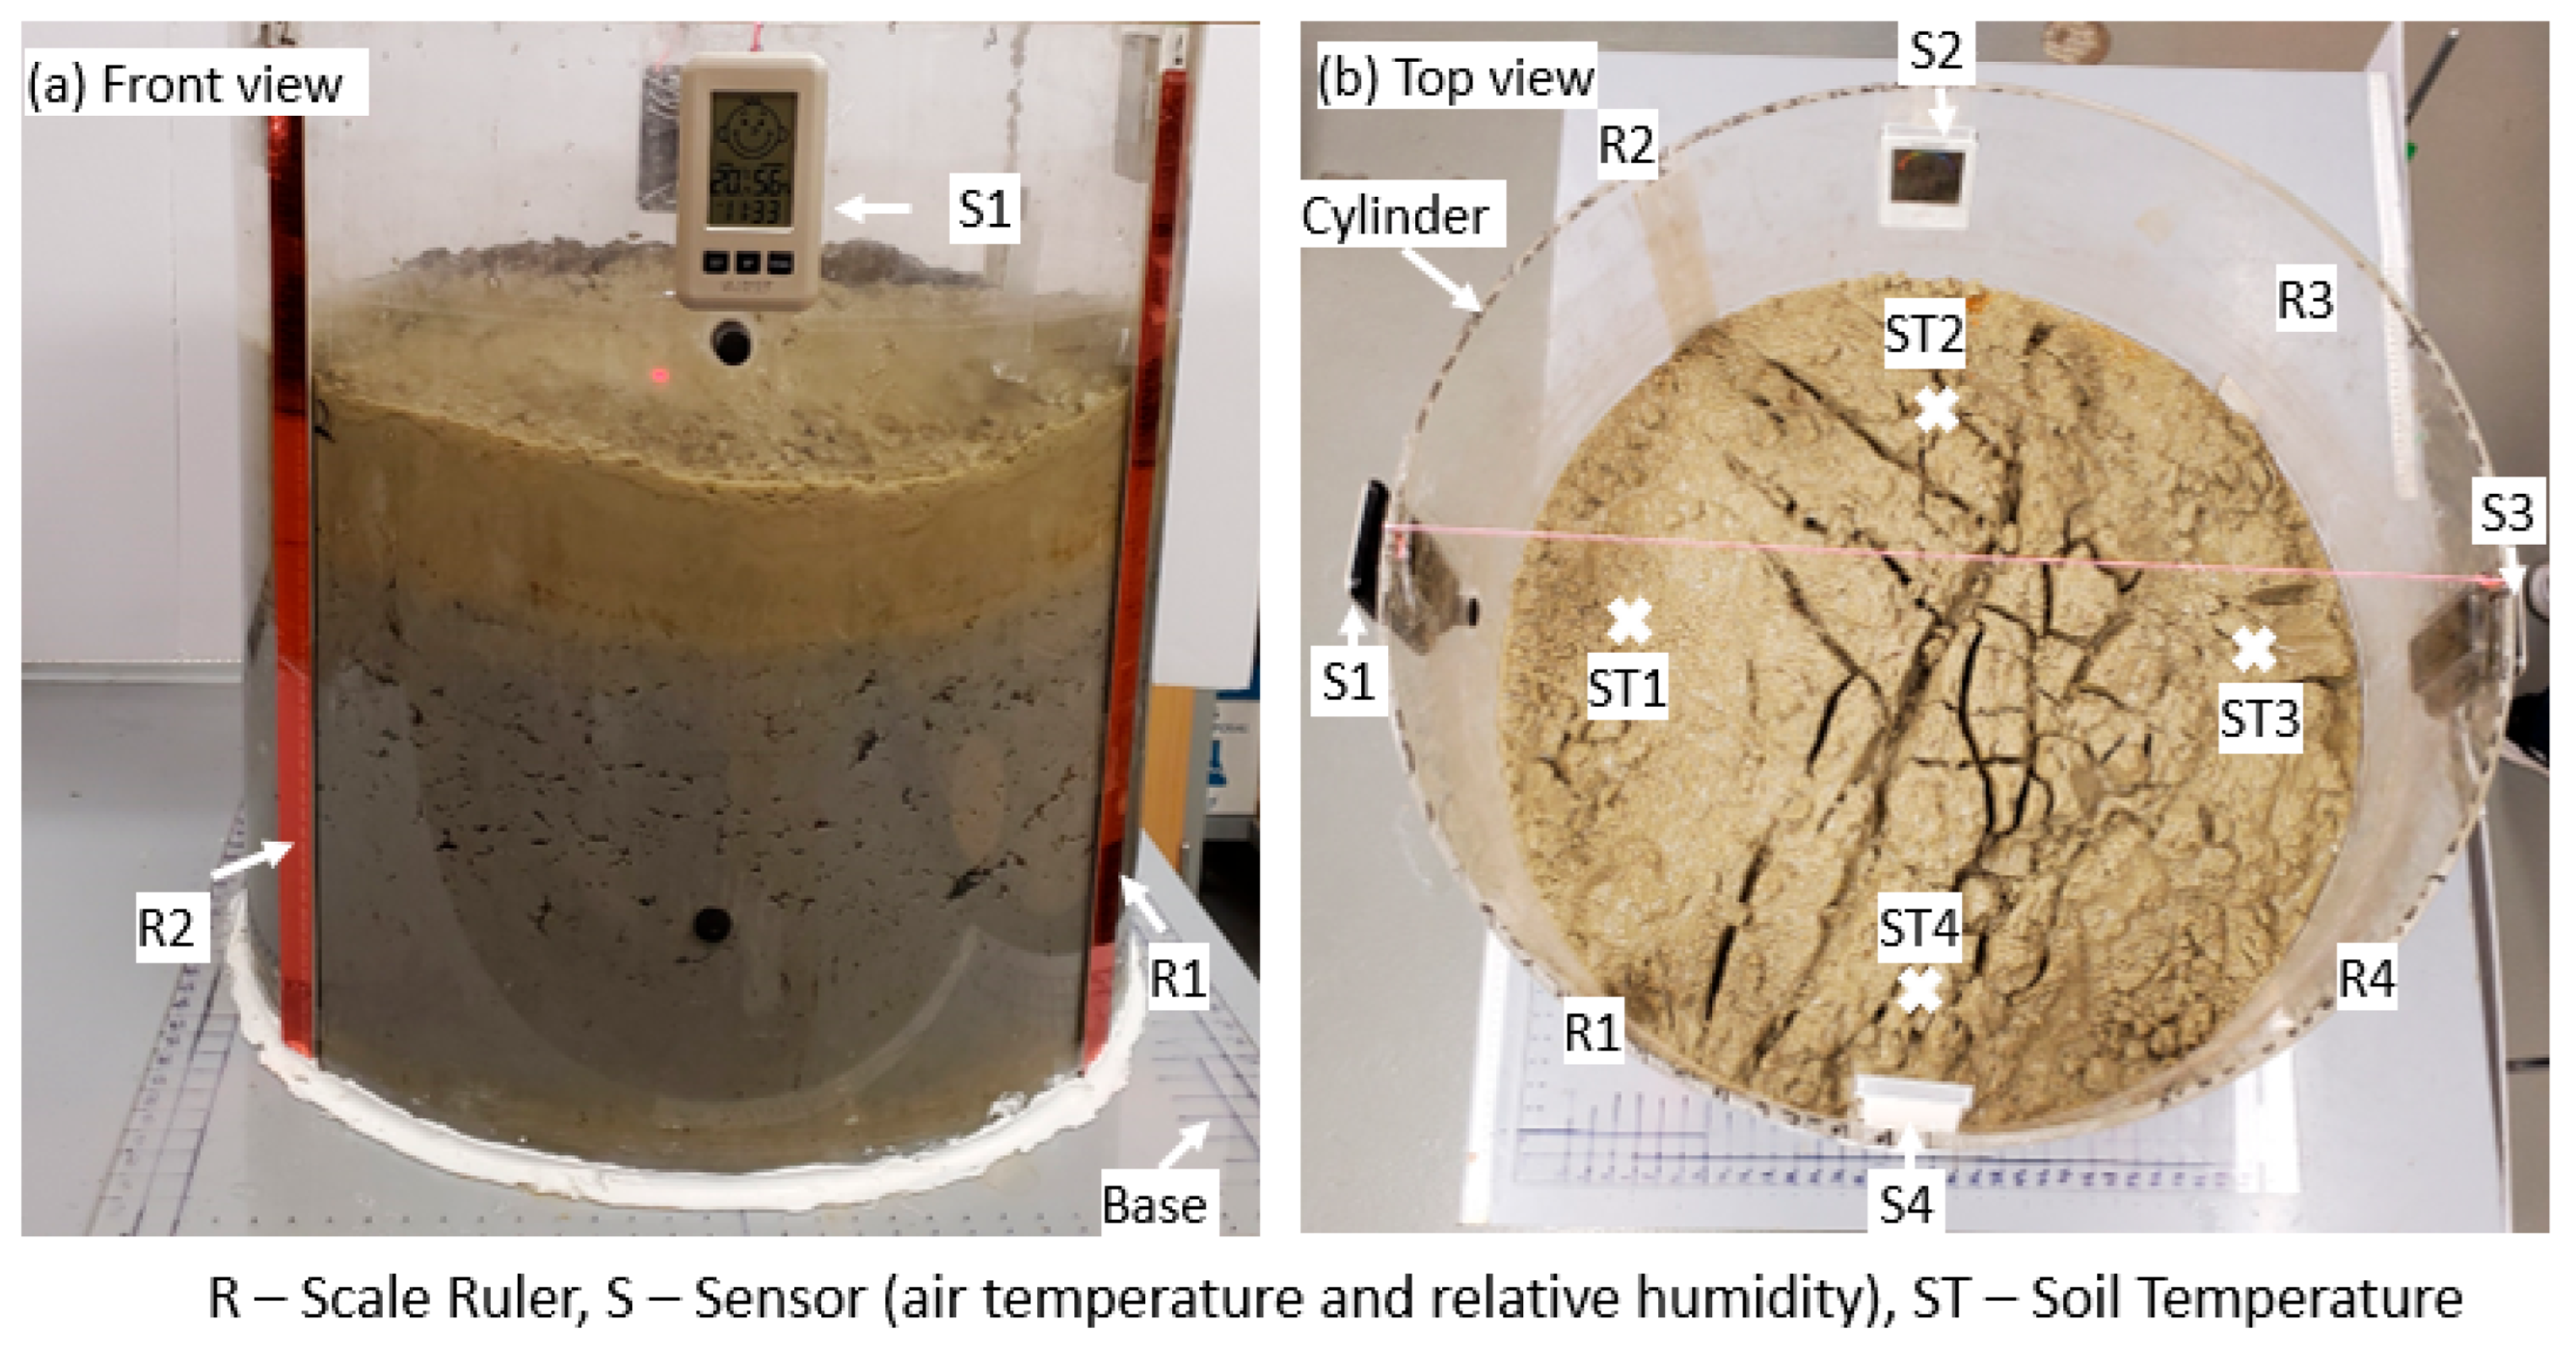
2.3. Shrinkage Monitoring and Sample Modeling
3. Results and Discussion
4. Summary and Conclusions
- The selected clay comprised expansive minerals, such as smectite (30%) and illite (14%), and the pore water mainly showed the presence of Na+ (695 mg/L) and SO42− (1150 mg/L). With a cation-exchange capacity of 42.5 cmol(+)/kg, the predominant exchange complex was found to be Na+-smectite, which is associated with a dispersive soil fabric.
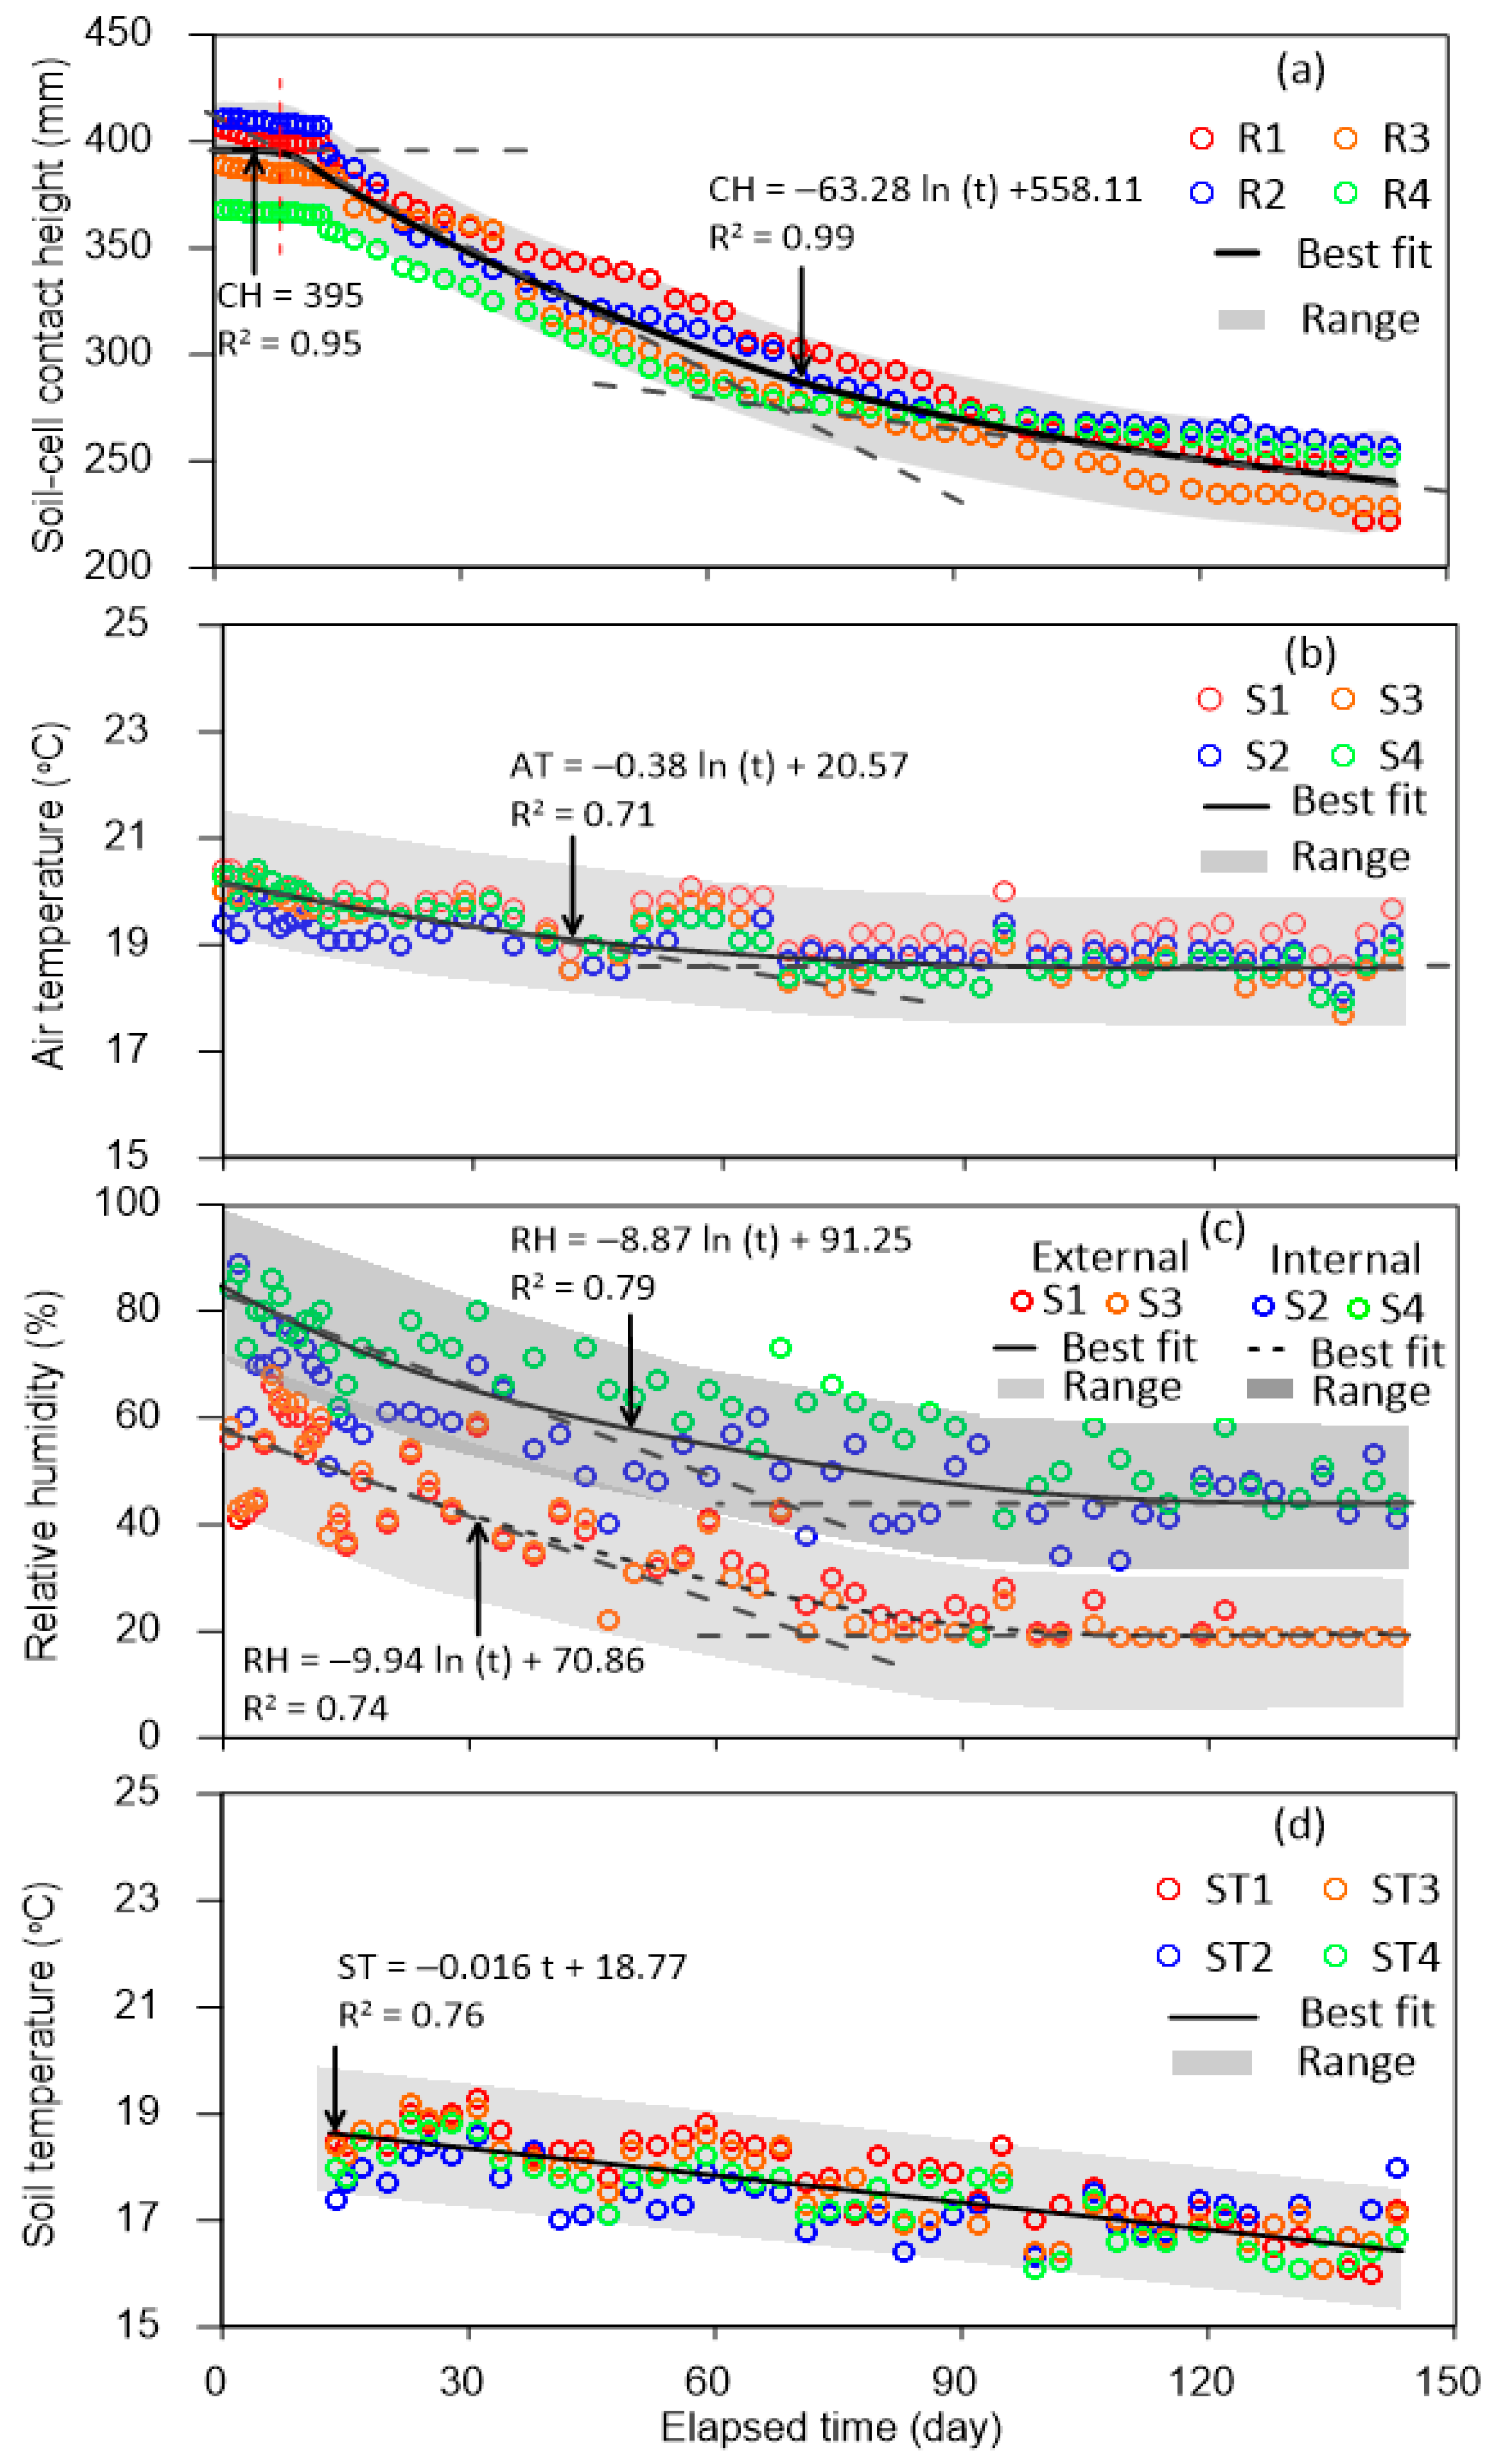
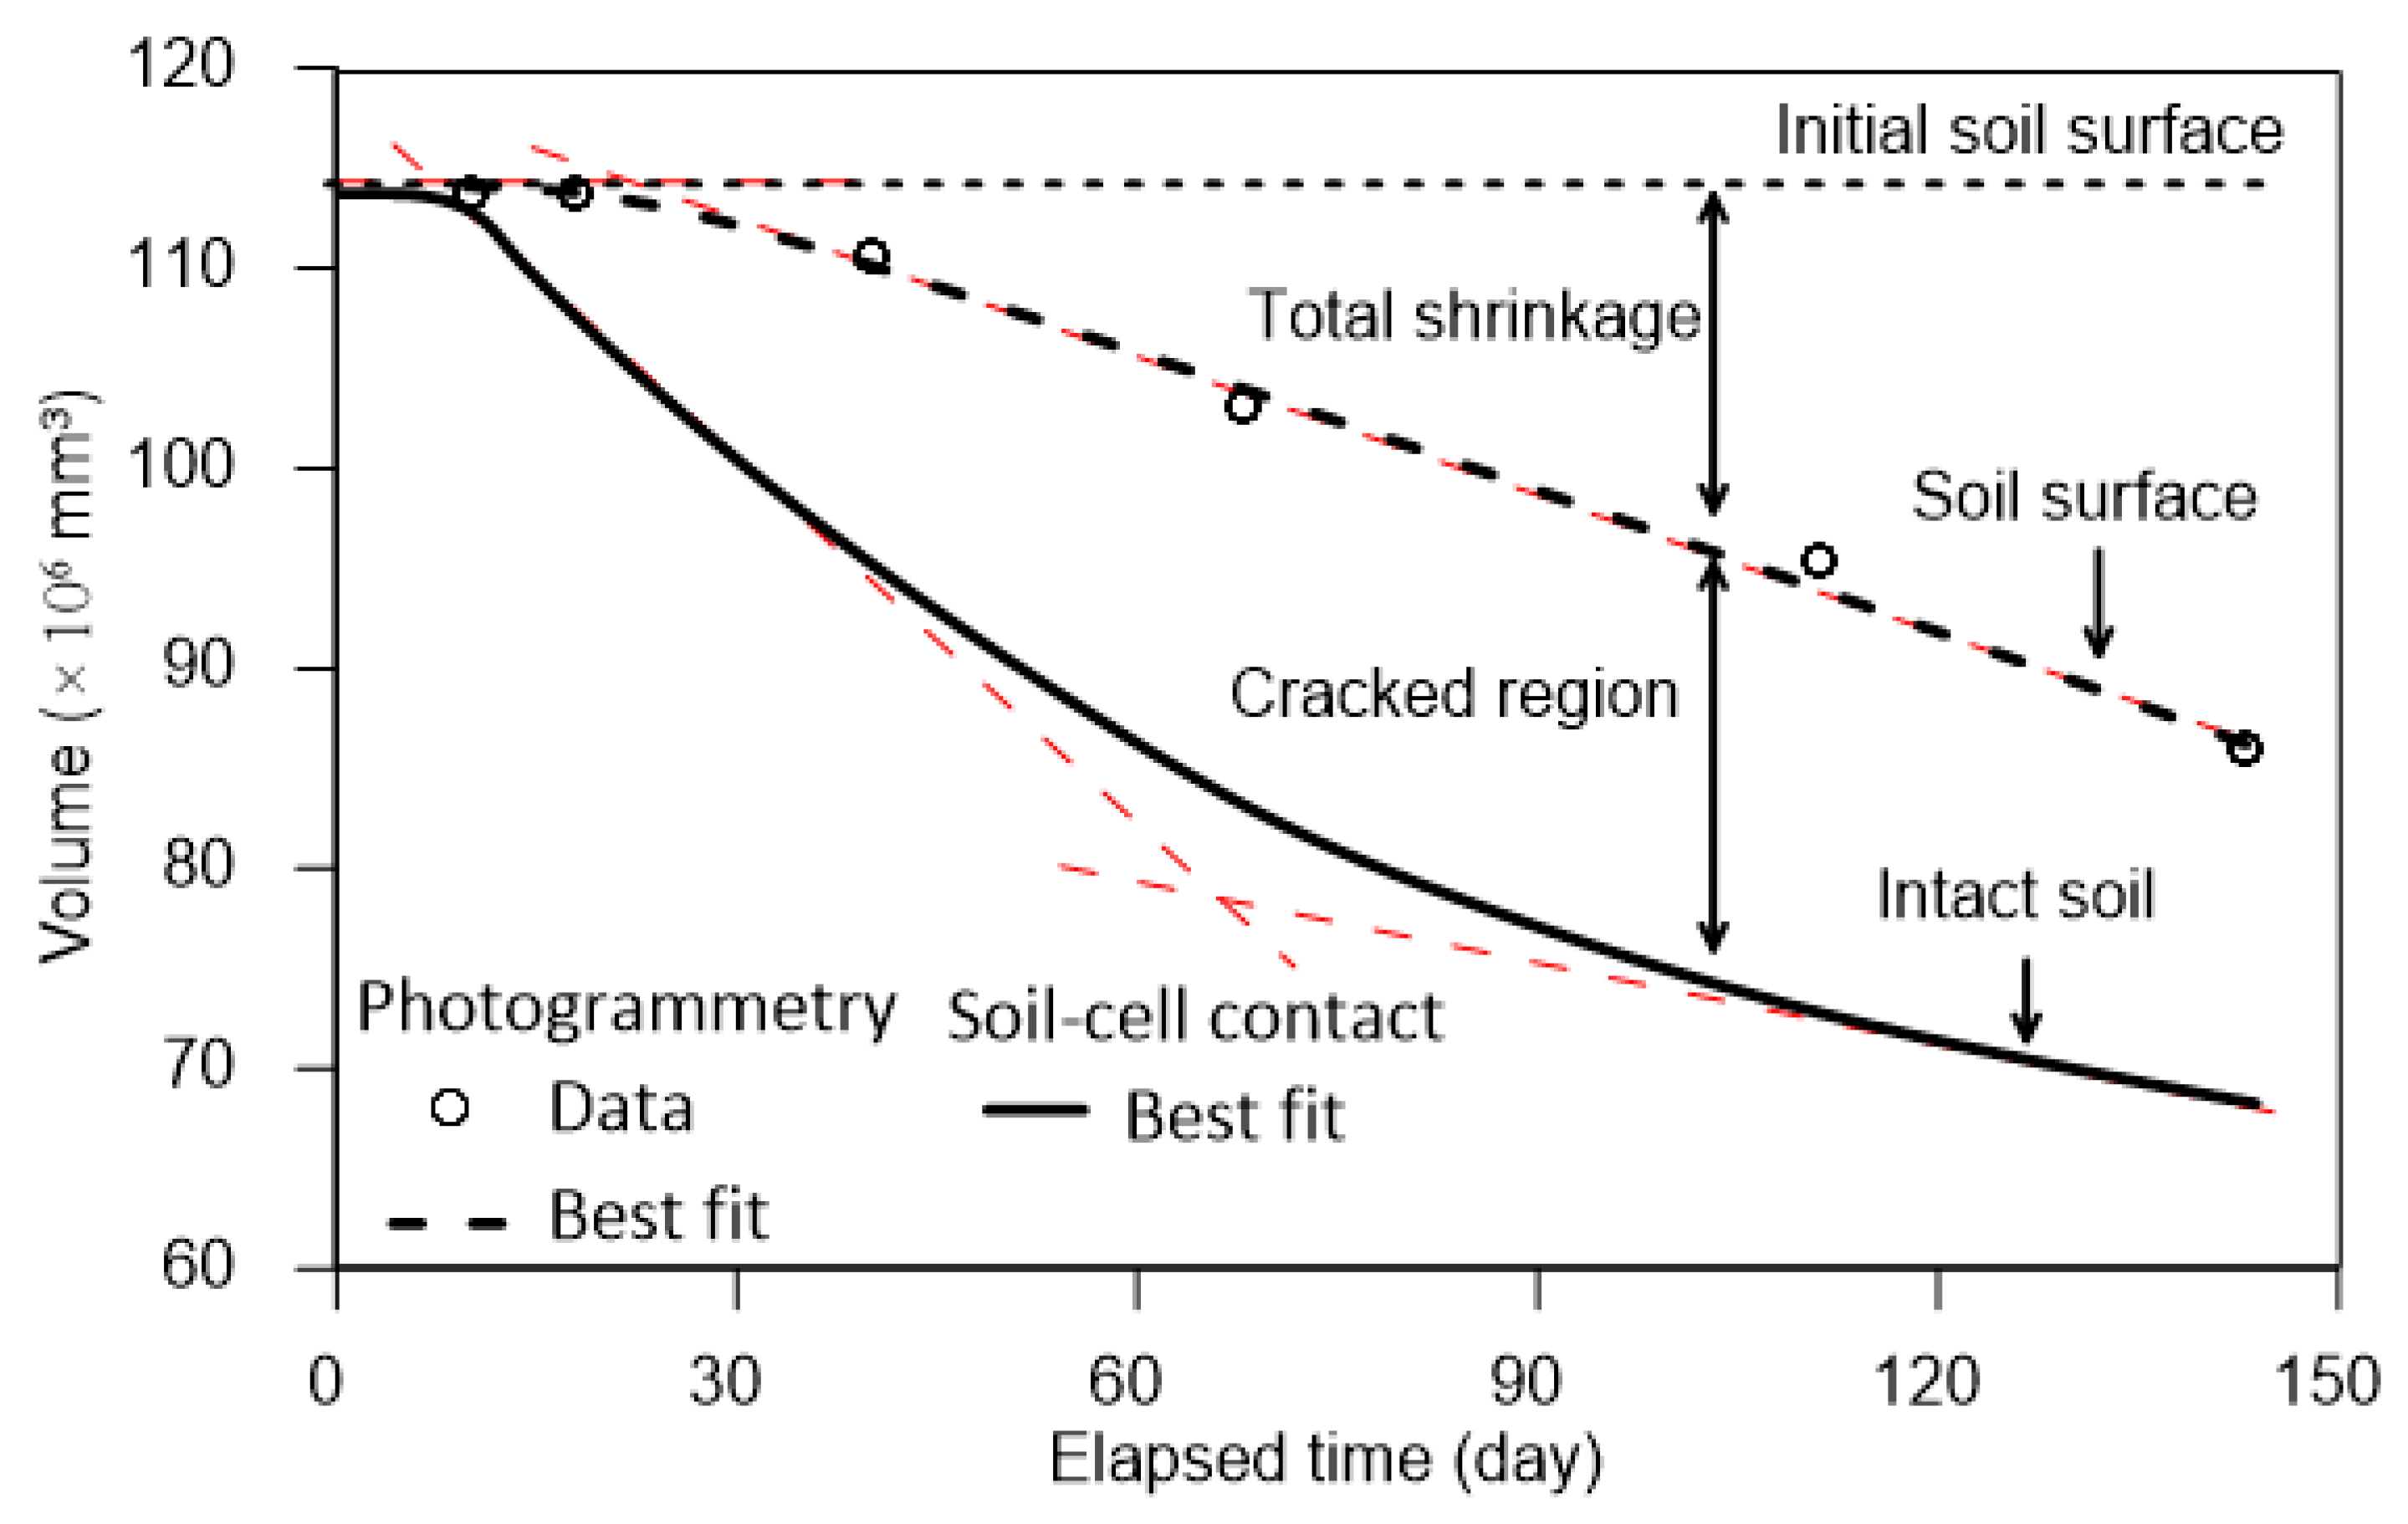
- The vertical shrinkage in the intact-soil portion was unchanged (remaining at 114 × 106 mm3) in the first 10 days because of pore-water expulsion, followed by a sharp decrease of up to 280 mm (80 × 106 mm3) over 68 days because of surface exposure and, subsequently, by a slow decrease down to 240 mm (68 × 106 mm3) over 145 days because of partial coverage by the upper soil.
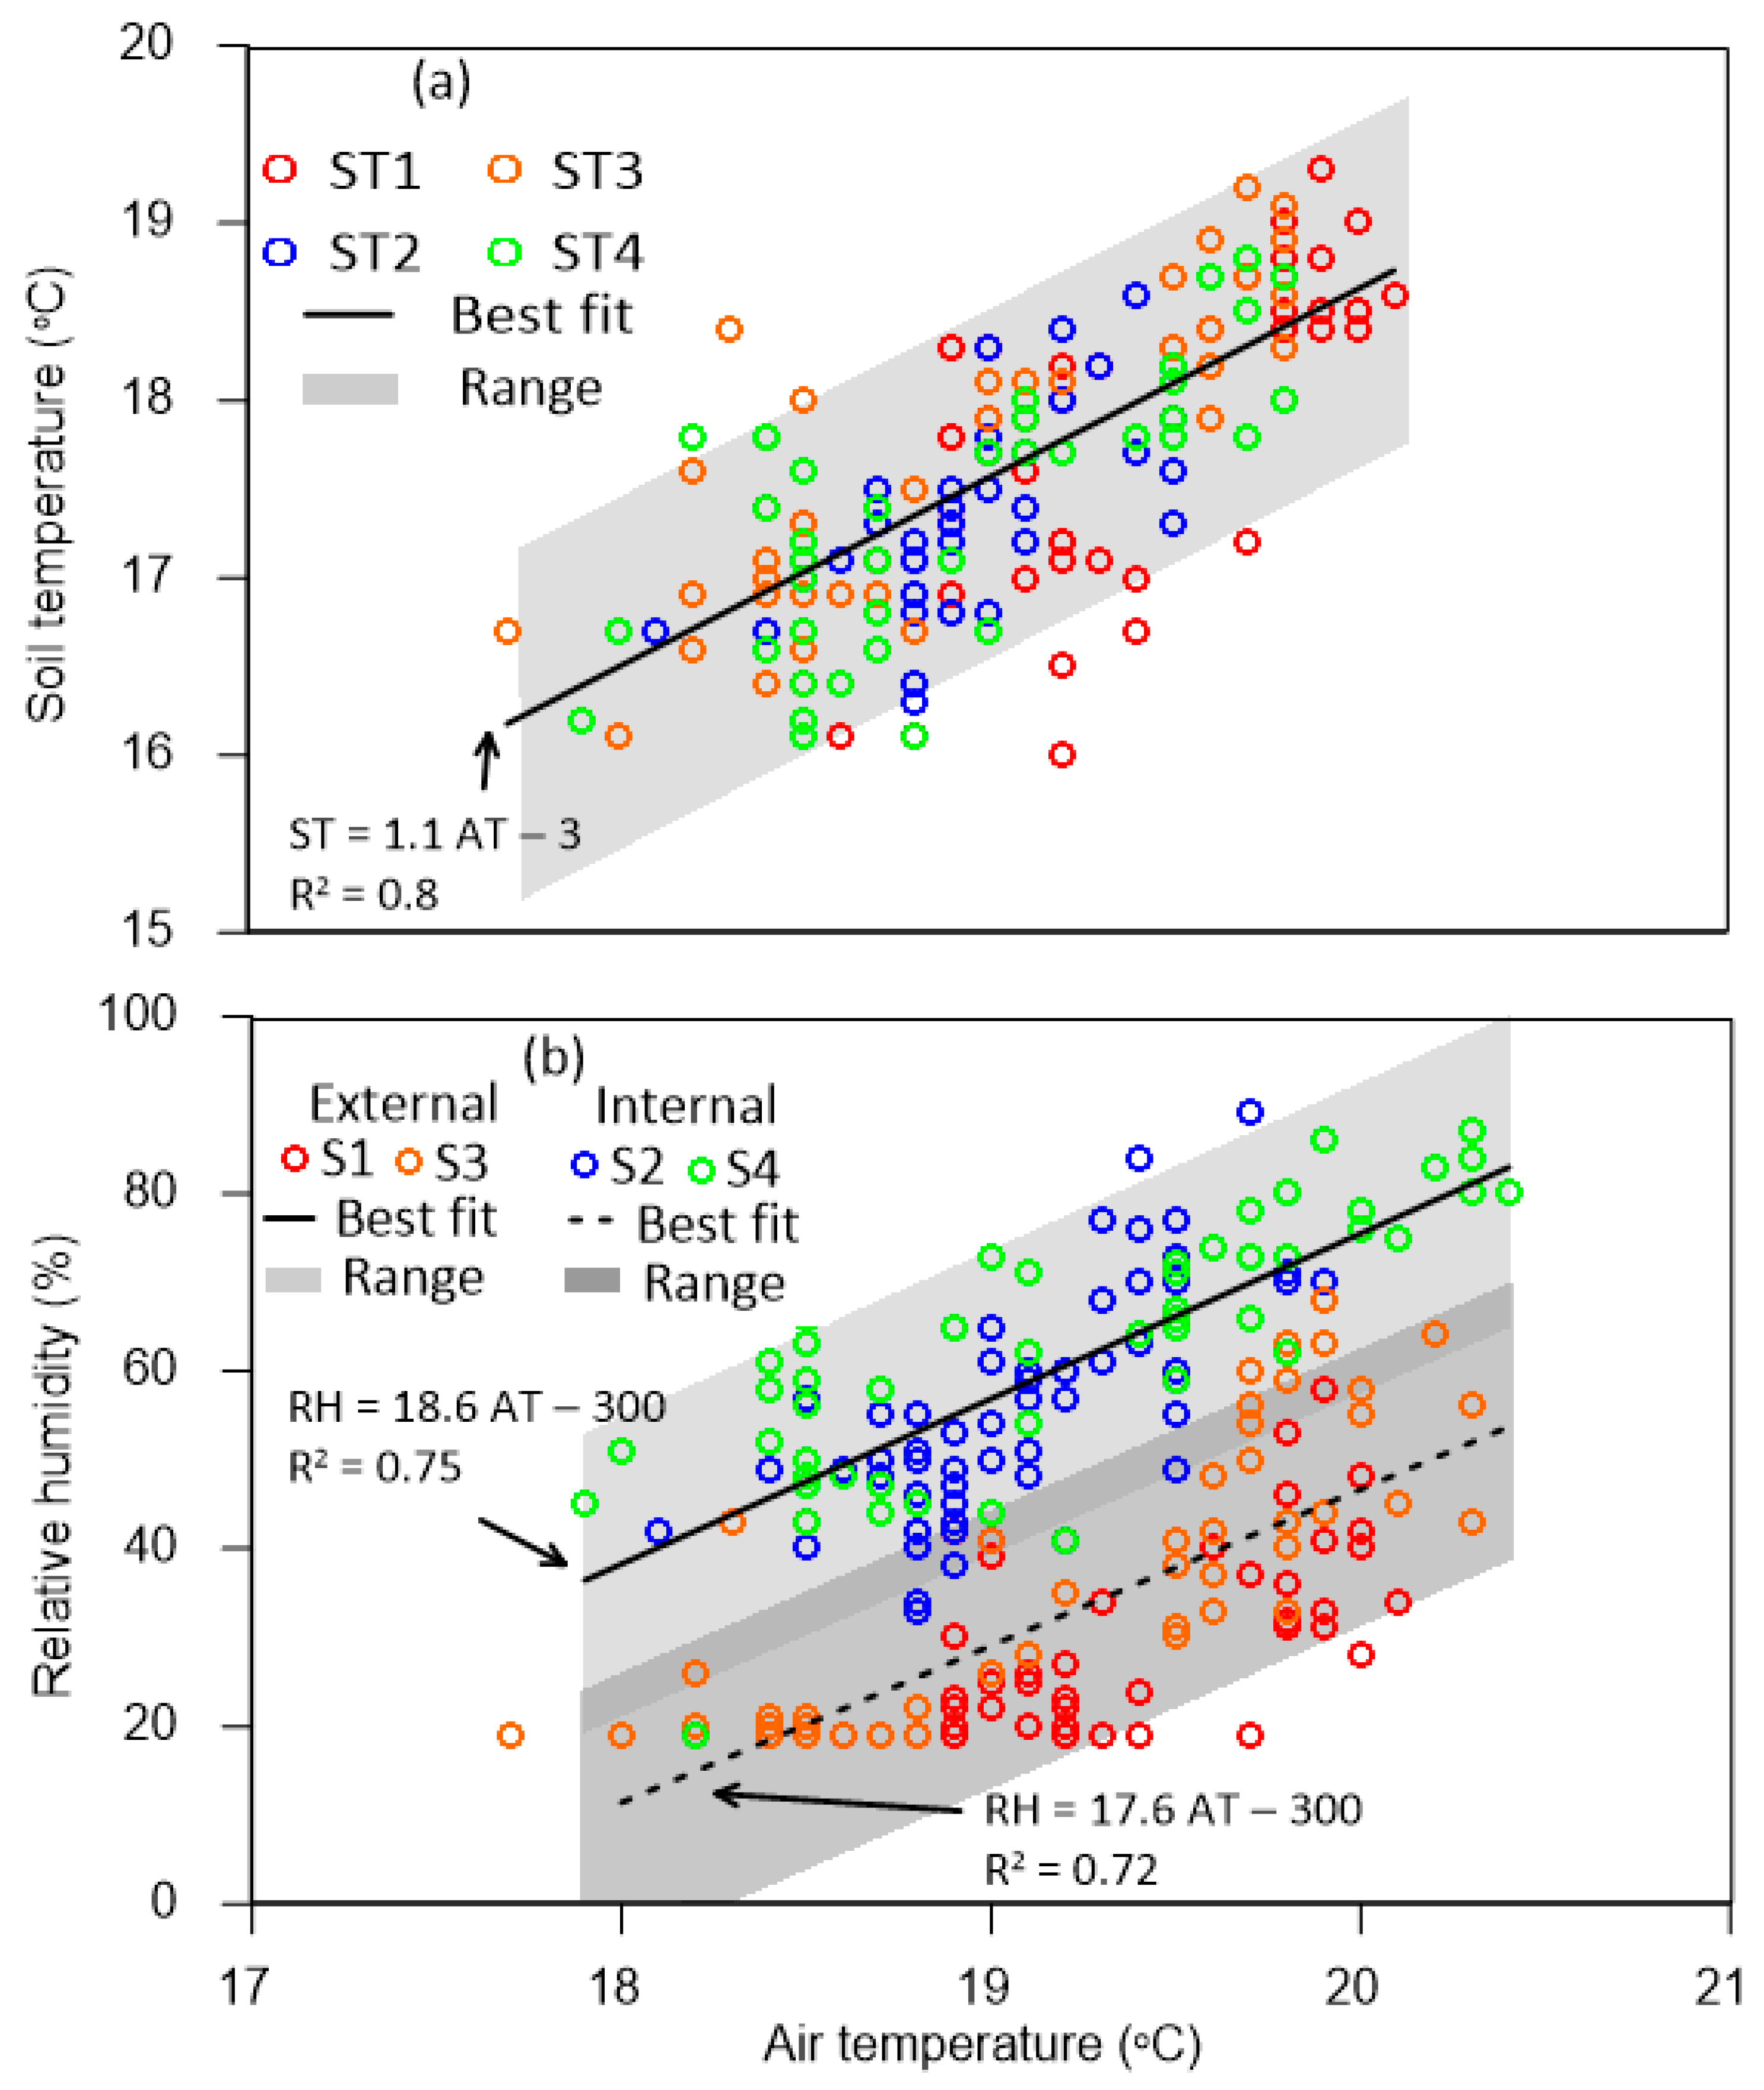
- The shrinkage behavior of the investigated expansive clay corroborated well with the ambient environmental parameters during the five-month test duration. The soil temperature inside the cell was found to be 10% lower than the air temperature, whereas the relative humidity within the cell was found to be 30% higher than that outside the cell.
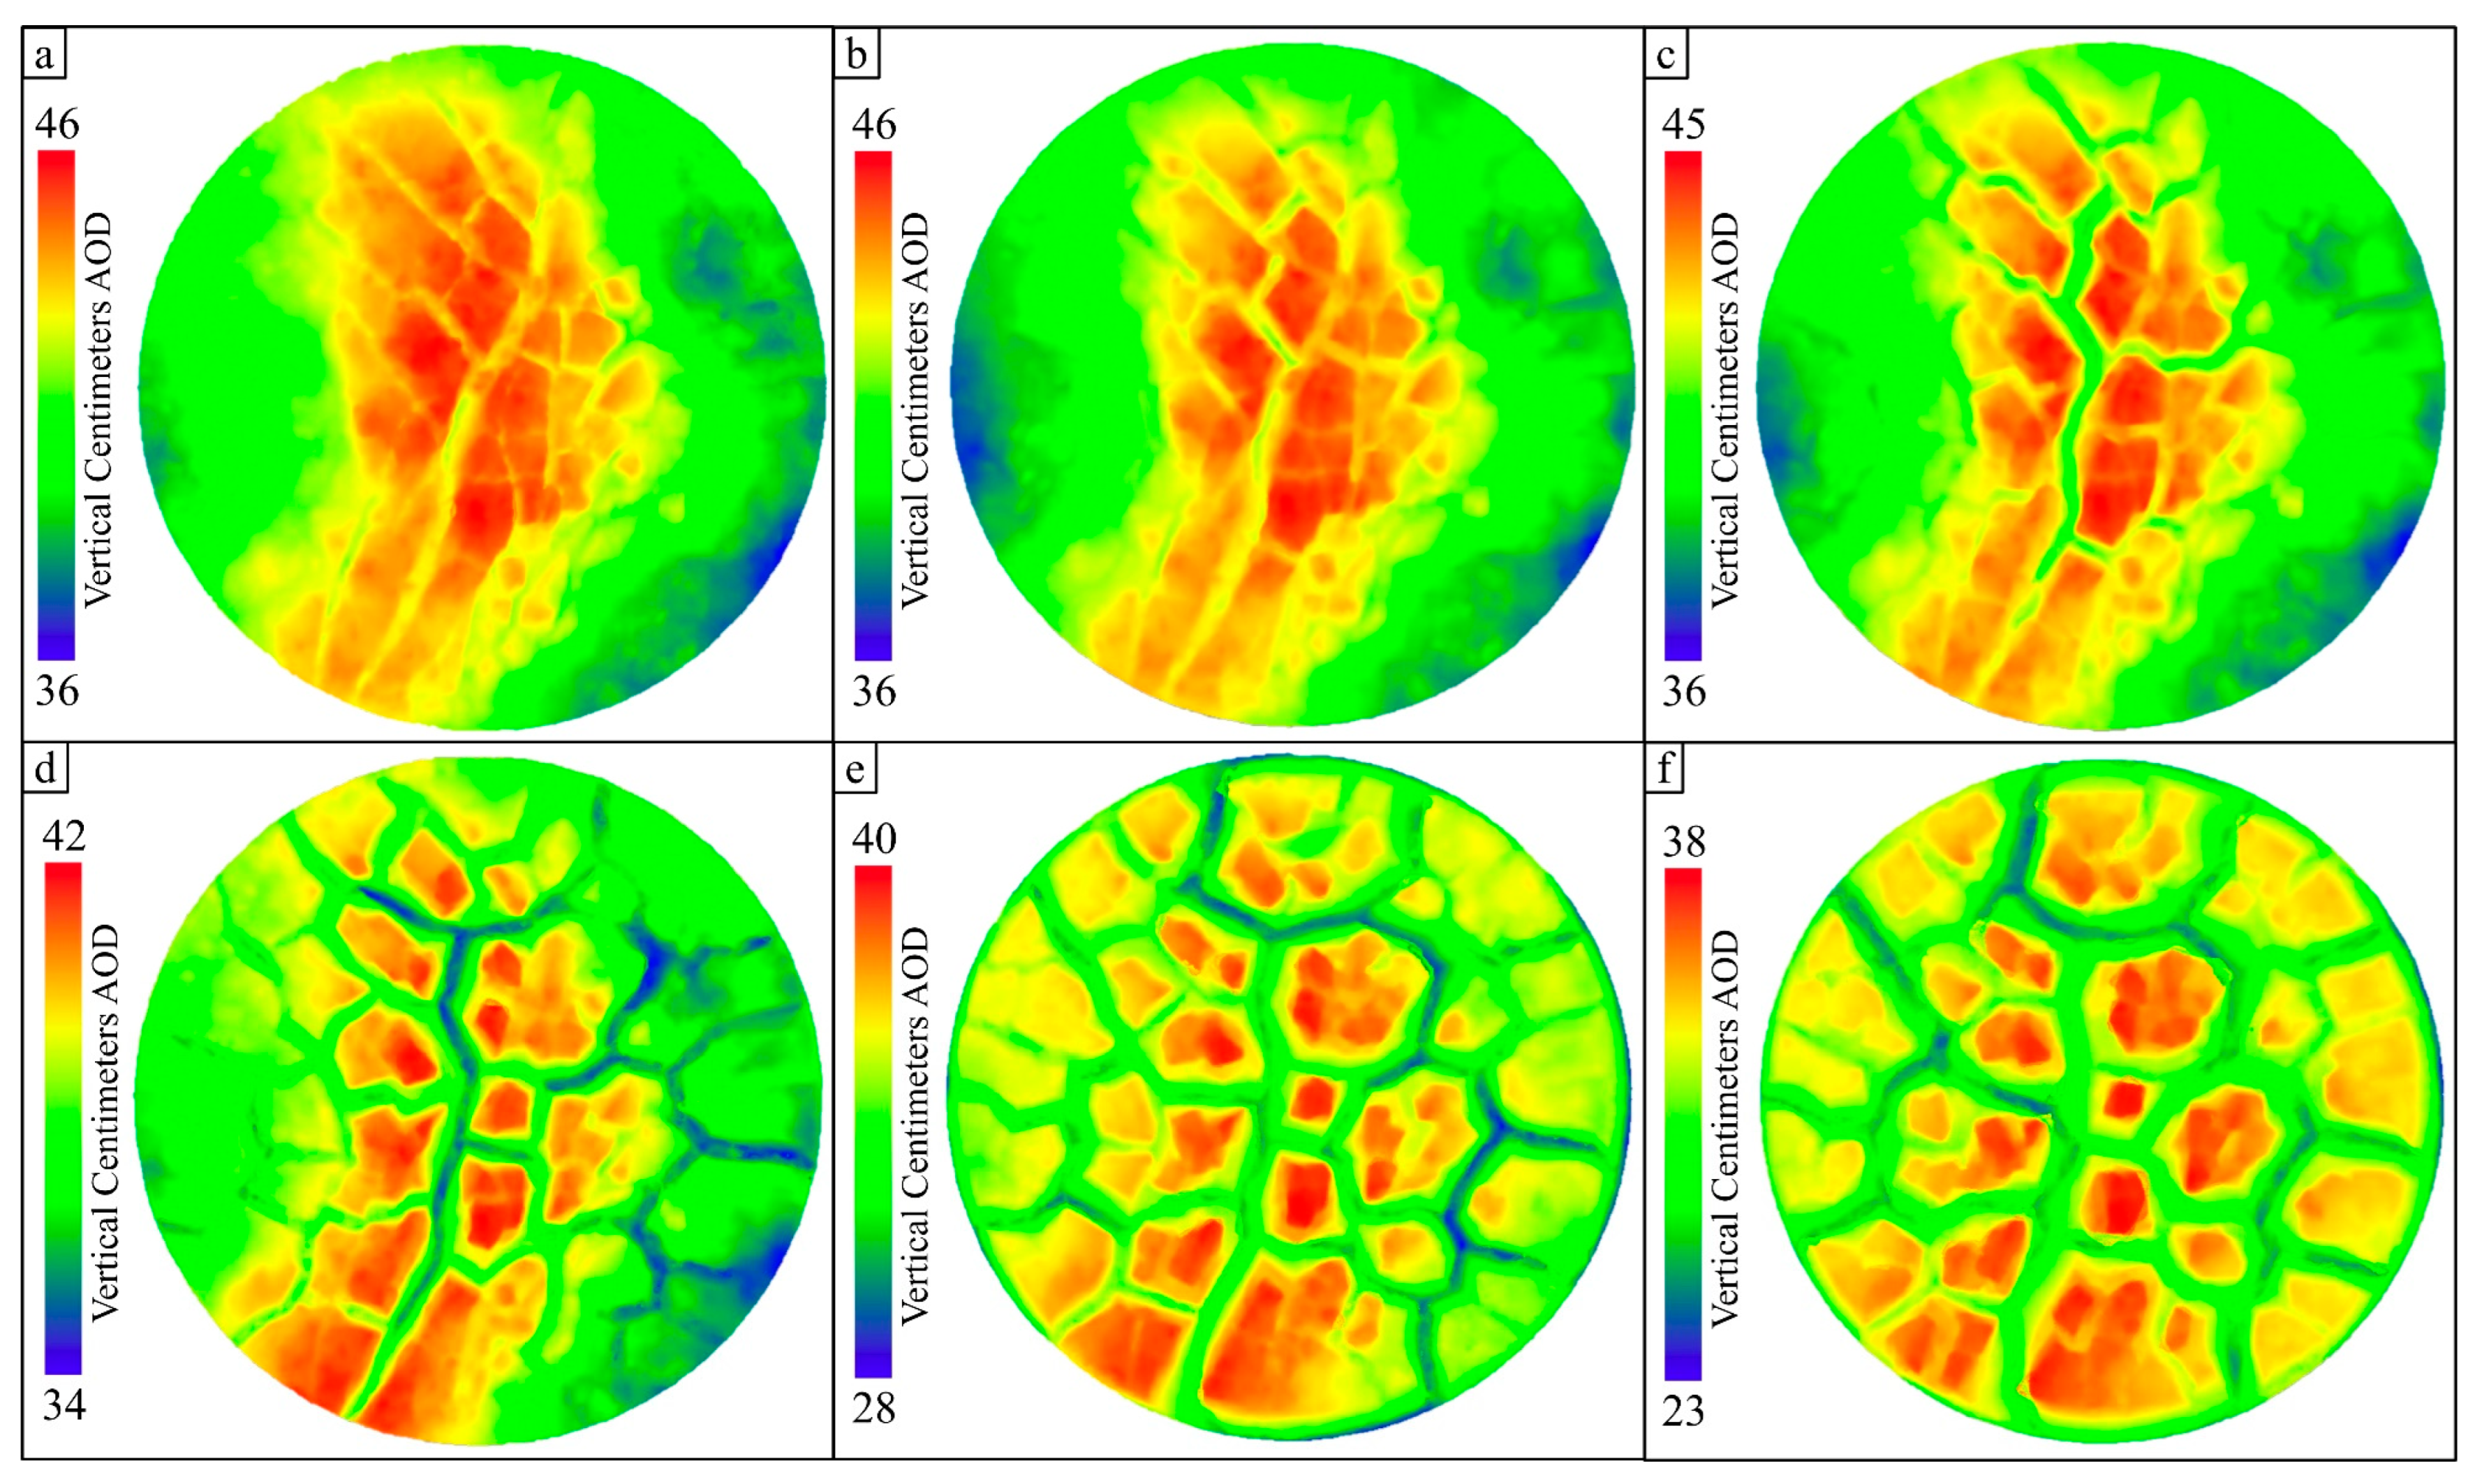
- The soil initially showed a prominent central ridge with a few cracks that gradually evolved to a distinct crack pattern with equal-sized and irregular soil chunks. The average soil surface showed no volume reduction up to 18 days and a subsequent linear volume reduction, reaching 25% of the initial value by the end of the test.
Author Contributions
Funding
Institutional Review Board Statement
Informed Consent Statement
Data Availability Statement
Acknowledgments
Conflicts of Interest
References
- Mishra, A.K.; Dhawan, S.; Rao, S.M. Analysis of Swelling and Shrinkage Behavior of Compacted Clays. Geotech. Geol. Eng. 2008, 26, 289–298. [Google Scholar] [CrossRef]
- Mitchell, J.K.; Soga, K. Fundamentals of Soil Behavior; John Wiley & Sons: New York, NY, USA, 2005. [Google Scholar]
- Ito, M.; Azam, S. Engineering Characteristics of a Glacio-Lacustrine Clay Deposit in a Semi-Arid Climate. Bull. Eng. Geol. Environ. 2009, 68, 551–557. [Google Scholar] [CrossRef]
- Hillel, D. Environmental Soil Physics: Fundamentals, Applications, and Environmental Considerations; Elsevier: Amsterdam, The Netherlands, 1998. [Google Scholar]
- Hu, Y.; Hubble, D.W. Failure Conditions of Asbestos Cement Water Mains in Regina. In Proceedings of the 1st CSCE Specialty Conference on Infrastructure Technologies, Management and Policy, Toronto, ON, Canada, 2–4 June 2005; pp. 2–4. [Google Scholar]
- Nelson, J.D.; Miller, D.J. Expansive Soils: Problems and Practice in Foundation and Pavement Engineering; John Wiley & Sons, Inc.: New York, NY, USA, 1992. [Google Scholar]
- Li, J.; Cameron, D.A.; Ren, G. Case Study and Back Analysis of a Residential Building Damaged by Expansive Soils. Comput. Geotech. 2014, 56, 89–99. [Google Scholar] [CrossRef] [Green Version]
- Hu, Y.; Vu, H.Q.; Lotfian, K. Instrumentation of a Section of AC Pipe in Expansive Soil. In Pipelines 2008: Pipeline Asset Management: Maximizing Performance of Our Pipeline Infrastructure; Curran Associates, Inc.: New York, NY, USA, 2008; pp. 1–10. [Google Scholar]
- Paranthaman, R.; Azam, S. Coupled Hydraulic-Thermal Model for Soils under Extreme Weather in Cold Regions. J. Environ. Inform. Lett. 2022, 7, 90–102. [Google Scholar] [CrossRef]
- Azam, S.; Shah, I.; Raghunandan, M.E.; Ito, M. Study on Swelling Properties of an Expansive Soil Deposit in Saskatchewan, Canada. Bull. Eng. Geol. Environ. 2013, 72, 25–35. [Google Scholar] [CrossRef]
- Julina, M.; Thyagaraj, T. Quantification of Desiccation Cracks Using X-Ray Tomography for Tracing Shrinkage Path of Compacted Expansive Soil. Acta Geotech. 2019, 14, 35–56. [Google Scholar] [CrossRef]
- Ito, M.; Azam, S.; Clifton, W. Suction-Based Model for Predicting Cyclic and Transient Volume Changes in Expansive Clays Using a Material Property Function. Eng. Geol. 2022, 296, 106491. [Google Scholar] [CrossRef]
- Morris, P.H.; Graham, J.; Williams, D.J. Cracking in Drying Soils. Can. Geotech. J. 1992, 29, 263–277. [Google Scholar] [CrossRef]
- Cordero, J.A.; Prat, P.C.; Ledesma, A. Experimental Analysis of Desiccation Cracks on a Clayey Silt from a Large-Scale Test in Natural Conditions. Eng. Geol. 2021, 292, 106256. [Google Scholar] [CrossRef]
- Ito, M.; Azam, S. Relation between Flow through and Volumetric Changes in Natural Expansive Soils. Eng. Geol. 2020, 279, 105885. [Google Scholar] [CrossRef]
- Bordoloi, S.; Hussain, R.; Gadi, V.K.; Bora, H.; Sahoo, L.; Karangat, R.; Garg, A.; Sreedeep, S. Monitoring Soil Cracking and Plant Parameters for a Mixed Grass Species. Géotech. Lett. 2018, 8, 49–55. [Google Scholar] [CrossRef]
- Cameron, D.A. The Extent of Soil Desiccation near Trees in a Semi-Arid Environment. In Unsaturated Soil Concepts and Their Application in Geotechnical Practice; Toll, D.G., Ed.; Springer: Dordrecht, The Netherlands, 2001; pp. 357–370. ISBN 978-94-015-9775-3. [Google Scholar]
- Kleiner, Y.; Rajani, B. Considering Time-Dependent Factors in the Statistical Prediction of Water Main Breaks. In Proceedings of the American Water Works Association Infrastructure Conference, Baltimore, MD, USA, 12–15 March 2000. [Google Scholar]
- Yu, F.; Zhang, M.; Lai, Y.; Liu, Y.; Qi, J.; Yao, X. Crack Formation of a Highway Embankment Installed with Two-Phase Closed Thermosyphons in Permafrost Regions: Field Experiment and Geothermal Modelling. Appl. Therm. Eng. 2017, 115, 670–681. [Google Scholar] [CrossRef]
- Puppala, A.J.; Katha, B.; Hoyos, L.R. Volumetric Shrinkage Strain Measurements in Expansive Soils Using Digital Imaging Technology. Geotech. Test. J. 2004, 27, 547–556. [Google Scholar]
- ASTM D4318-17; Standard Test Methods for Liquid Limit, Plastic Limit, and Plasticity Index of Soils. Annual Book of ASTM Standards: West Conshohocken, PA, USA, 2017.
- TxDOT. Test Procedure for Determining the Bar Linear Shrinkage of Soils; Texas Department of Transportation: Austin, TX, USA, 1999. [Google Scholar]
- Tripathy, S.; Rao, K.S.; Fredlund, D.G. Water Content-Void Ratio Swell-Shrink Paths of Compacted Expansive Soils. Can. Geotech. J. 2002, 39, 938–959. [Google Scholar] [CrossRef]
- ASTM D4943-18; Standard Test Method for Shrinkage Factors of Cohesive Soils by the Water Submersion Method. Annual Book of ASTM Standards: West Conshohocken, PA, USA, 2018.
- Peron, H.; Hueckel, T.; Laloui, L.; Hu, L. Fundamentals of Desiccation Cracking of Fine-Grained Soils: Experimental Characterisation and Mechanisms Identification. Can. Geotech. J. 2009, 46, 1177–1201. [Google Scholar] [CrossRef]
- Vogel, H.-J.; Hoffmann, H.; Leopold, A.; Roth, K. Studies of Crack Dynamics in Clay Soil: II. A Physically Based Model for Crack Formation. Geoderma 2005, 125, 213–223. [Google Scholar] [CrossRef]
- Cuadrado, A.; Encalada López, D.A.; Ledesma Villalba, A.; Prat Catalán, P. Soil Surface Boundary Condition in Desiccating Soils. In Proceedings of the Conference Proceedings on Geotechnical Engineering, Foundation of the Future, Reykjavík, Iceland, 1–7 September 2019; The Icelandic Geotechnical Society (IGS): Reykjavík, Iceland; pp. 1–8. [Google Scholar]
- Lakshmikantha, M.R.; Prat, P.C.; Ledesma, A. Boundary Effects in the Desiccation of Soil Layers with Controlled Environmental Conditions. Geotech. Test. J. 2018, 41, 675–697. [Google Scholar] [CrossRef] [Green Version]
- Khan, F.S.; Azam, S. Spatial Variability in Swelling of Aggregated Expansive Clays. Innov. Infrastruct. Solut. 2016, 1, 11. [Google Scholar] [CrossRef] [Green Version]
- Suchan, J.; Azam, S. Controlled Photogrammetry System for Determination of Volume and Surface Features in Soils. MethodsX 2021, 8, 101368. [Google Scholar] [CrossRef]
- Imumorin, P.; Azam, S. Effect of Precipitation on the Geological Development of Badlands in Arid Regions. Bull. Eng. Geol. Environ. 2011, 70, 223–229. [Google Scholar] [CrossRef]
- Paranthaman, R.; Azam, S. Effect of Composition on Engineering Behavior of Clay Tills. Geosciences 2021, 11, 427. [Google Scholar] [CrossRef]
- Azam, S.; Khan, F. Geohydrological Properties of Selected Badland Sediments in Saskatchewan, Canada. Bull. Eng. Geol. Environ. 2014, 73, 389–399. [Google Scholar] [CrossRef]
- Khan, F.S.; Azam, S. Determination of the Desiccation Behavior of Clay Slurries. Int. J. Min. Sci. Technol. 2017, 27, 981–988. [Google Scholar] [CrossRef]
- Holtz, R.D.; Kovacs, W.D.; Sheahan, T.C. An Introduction to Geotechnical Engineering, 2nd ed.; Prentice-Hall: Englewood Cliffs, NJ, USA, 2011; Volume 733. [Google Scholar]
- Moore, D.M.; Reynolds, R.C. X-Ray Diffraction and the Identification and Analysis of Clay Minerals; Oxford University Press (OUP): Oxford, UK, 1989. [Google Scholar]
- Hendershot, W.H.; Lalande, H.; Duquette, M. Chapter 18. Ion Exchange and Exchangeable Cations. In Soil Sampling and Methods of Analysis; Canadian Society of Soil Science: Pinawa, MB, Canada; CRC Press: Boca Raton, FL, USA, 2008; pp. 173–178. [Google Scholar]
- Khan, F.S.; Azam, S. Determination of Swelling Potential of a Fissured Expansive Clay in a Large Cell. In Proceedings of the 67th Canadian Geotechnical Conference, Regina, SK, Canada, 30 September 2014. [Google Scholar]
- Gottardi, G. The Genesis of Zeolites. Eur. J. Mineral. 1989, 1, 479–488. [Google Scholar] [CrossRef] [Green Version]
- Wilson, M.J.; Deer, W.A.; Howie, R.A.; Zussman, J. Rock-Forming Minerals. 3C: Sheet Silicates. Clay Minerals; Geological Soc.: London, UK, 2013. [Google Scholar]
- Khan, F.M. Engineering Properties of Badlands in Semi-Arid Regions. Master’s Thesis, The University of Regina (Canada), Regina, SK, Canada, 2012. [Google Scholar]
- Azam, S. Solid-Liquid Separation of Laterite Slurries. Ph.D. Thesis, Faculty of Graduate Studies and Research, University of Alberta, Edmonton, AB, Canada, 2003. [Google Scholar]
- Azam, S.; Abduljauwad, S.N.; Al-Shayea, N.A.; Al-Amoudi, O.B. Effects of Calcium Sulfate on Swelling Potential of an Expansive Clay. Geotech. Test. J. 2000, 23, 389–403. [Google Scholar]
- Smykatz, K. Differential Thermal Analysis. Application and Results in Mineralogy; Springer: Berlin/Heidelberg, Germany, 1974. [Google Scholar]
- Lehmann, P.; Merlin, O.; Gentine, P.; Or, D. Soil Texture Effects on Surface Resistance to Bare-Soil Evaporation. Geophys. Res. Lett. 2018, 45, 10–398. [Google Scholar] [CrossRef]
- Bedient, P.B.; Huber, W.C.; Vieux, B.E. Hydrology and Floodplain Analysis, 5th ed.; Pearson Education Limited: Edinburgh, UK, 2013. [Google Scholar]
- Yang, F.; Su, D.; Ma, Y.; Feng, C.; Yang, A.; Wang, M. Refraction Correction of Airborne LiDAR Bathymetry Based on Sea Surface Profile and Ray Tracing. IEEE Trans. Geosci. Remote Sens. 2017, 55, 6141–6149. [Google Scholar] [CrossRef]
- Tommasi, P.; Boldini, D.; Caldarini, G.; Coli, N. Influence of Infiltration on the Periodic Re-Activation of Slow Movements in an Overconsolidated Clay Slope. Can. Geotech. J. 2013, 50, 54–67. [Google Scholar] [CrossRef]
- Ting, L.; Chaosheng, T.; Dan, X.U.; Yunsheng, L.I.; Yan, Z.; Kan, W.; Bin, S.H.I. Advance on the engineering geological characteristics of expansive soil. J. Eng. Geol. 2018, 26, 112–128. [Google Scholar] [CrossRef]
- Udukumburage, R.S.; Gallage, C.; Dawes, L. Oedometer Based Estimation of Vertical Shrinkage of Expansive Soil in a Large Instrumeted Soil Column. Heliyon 2019, 5, e02380. [Google Scholar] [CrossRef]
- Umezaki, T.; Kawamura, T. Shrinkage and Desaturation Properties during Desiccation of Reconstituted Cohesive Soil. Soils Found. 2013, 53, 47–63. [Google Scholar] [CrossRef] [Green Version]


| Property | Value |
|---|---|
| Minerals (%) * | Coarse (47) |
| Quartz (14), Zeolite (20), Plagioclase (7), | |
| K-Feldspar (3), Others (3) | |
| Clay (53) | |
| Smectite (30), Illite (14), Chlorite (7), Kaolinite (2) | |
| Exchangeable cations (cmol(+)/kg) | Na+ (22.7), K+ (1.2), Ca2+ (17.2), Mg2+ (1.2) |
| Cation-exchange capacity (cmol(+)/kg) | 42.5 |
| Dissolved ions (mg/L) | Na+ (695), K+ (4.3), Ca2+ (21.2), Mg2+ (3.1), HCO3−(561), CO32−(44), Cl−(50.8), NO3−(2.2), SO42−(1150) |
| Total dissolved solids (mg/L) | 2250 |
| Sodium-absorption ratio † | 37.3 |
| Days | Elevation of Soil Surface in the Middle (cm) | Elevation of Cracked Soil in the Middle (cm) | Maximum Crack Depth (cm) |
|---|---|---|---|
| 10 (Figure 7a) | 46 (red) | 43 (yellow) | 3 |
| 18 (Figure 7b) | 46 (red) | 41 (light green) | 5 |
| 40 (Figure 7c) | 45 (red) | 39 (green) | 6 |
| 68 (Figure 7d) | 42 (red) | 35 (dark purple) | 7 |
| 111 (Figure 7e) | 40 (red) | 29 (light purple) | 11 |
| 143 (Figure 7f) | 38 (red) | 29 (green) | 9 |
Disclaimer/Publisher’s Note: The statements, opinions and data contained in all publications are solely those of the individual author(s) and contributor(s) and not of MDPI and/or the editor(s). MDPI and/or the editor(s) disclaim responsibility for any injury to people or property resulting from any ideas, methods, instructions or products referred to in the content. |
© 2023 by the authors. Licensee MDPI, Basel, Switzerland. This article is an open access article distributed under the terms and conditions of the Creative Commons Attribution (CC BY) license (https://creativecommons.org/licenses/by/4.0/).
Share and Cite
Paranthaman, R.; Suchan, J.; Azam, S. Spatial Variability during Shrinkage Testing of Expansive Clays. Geotechnics 2023, 3, 43-56. https://doi.org/10.3390/geotechnics3010004
Paranthaman R, Suchan J, Azam S. Spatial Variability during Shrinkage Testing of Expansive Clays. Geotechnics. 2023; 3(1):43-56. https://doi.org/10.3390/geotechnics3010004
Chicago/Turabian StyleParanthaman, Rajeevkaran, Jared Suchan, and Shahid Azam. 2023. "Spatial Variability during Shrinkage Testing of Expansive Clays" Geotechnics 3, no. 1: 43-56. https://doi.org/10.3390/geotechnics3010004