
Spatial Evaluation of Dengue Transmission and Vector Abundance in the City of Dhaka, Bangladesh


1
Natural Resources Institute, University of Manitoba, Winnipeg, MB R3T 2M6, Canada
2
Center for Sustainable Development and Resilience, University of the District of Columbia, Washington, DC 20008, USA
3
Department of Mathematics and Statistics, University of Winnipeg, Winnipeg, MB R3B 2E9, Canada
4
Department of Environment and Geography, University of Manitoba, Winnipeg, MB R3T 2M6, Canada
*
Author to whom correspondence should be addressed.
Geographies 2023, 3(2), 268-285; https://doi.org/10.3390/geographies3020014
Submission received: 4 March 2023
/
Revised: 8 April 2023
/
Accepted: 13 April 2023
/
Published: 14 April 2023
(This article belongs to the Special Issue A GIS Spatial Analysis Model for Land Use Change (Volume II))
Abstract
:In recent years, many urban areas in low and middle income countries have experienced major dengue epidemics, and the city of Dhaka, the capital city of Bangladesh, is one of them. Understanding models based on land cover and land use in urban areas in relation to vector abundance and possible disease transmission can be a major epidemiological tool in identifying disease incidence and prevalence. Demographic and human behavioral factors can also play a role in determining microenvironments for entomological distribution—which is a major risk factor for epidemicity. Data collected from a cross-sectional entomological survey in the city of Dhaka during the monsoon season of 2012 and two serological surveys—one pre-monsoon and another post-monsoon in 2012—were analyzed in this study. A total of 898 households and 1003 containers with water were inspected, and 1380 Ae. aegypti pupae and 4174 larvae were counted in these containers. All Stegomyia indices were found to be the highest in the central business and residential mixed zone. The odds ratios of risk factors for seroprevalence, including sex, age, self-reported febrile illness during the previous six months, and travel during the last six months, were calculated; age distribution was found to be a highly significant risk factor (p = value < 0.0001). The study offers clear patterns of dengue viral transmission, disease dynamics, and their association with critical spatial dimensions.
1. Introduction
The abundance, lifespan, and behavior of the principal mosquito vector, Aedes aegypti, have profoundly affected the natural history of dengue fever among the human population. Additionally, the level of immunity to the circulating virus serotype in the local human population, the density and movement of humans, and the time required for the virus to develop in Ae. aegypti also play a significant role [1,2]. However, the relative influence of these factors on virus transmission dynamics, including the spatial distribution patterns of dengue vector density, is not well researched or understood [3]. More than one billion people are infected with and more than one million people die from vector-borne diseases, of which mosquito-borne diseases constitute a significant proportion [4]. The distribution of Ae. aegypti is largely influenced by human movement and the presence of a suitable climate [5]. The analysis of the spatial pattern of Ae. aegypti distribution, which is typically limited to vector distribution and habitat preferences [6], also has many facets involving microenvironmental variables, such as vegetation, stagnant water, and localized topographical depressions, with plenty of sites less exposed to sunlight, transportation routes and hubs, and human dominated uncontrolled urban development, which favor the spread of Ae. aegypti [7]. Studies of the association of the patterns of Ae. aegypti distribution with environmental variables at the city scale are critical in understanding the relationship between vector abundance and dengue transmission at the local landscape scale [8]. In the context of mosquito-borne diseases, human-induced changes to the landscape have a significant impact on the transmission of vector-borne pathogens [9,10], as they promote the proliferation of organisms that can easily colonize and adapt to new environments. Landscape characteristics also influence the dynamics and ecology of dengue fever by affecting the presence, behavior, and interactions of hosts and vectors. In the context of zoonotic diseases, Salinas-Ramos et al. [11] asserted that they are strongly favored by the ever-growing deforestation and expansion of farmland and urban areas at the expense of natural habitats, leading to increasing wildlife–human interactions. Zheng and Li [12], in a recent study in the Shandong Province of China, observed a significant reduction in the average habitat quality due to increases in industrial and mining residential land use. As well, urban landscape characteristics influence the epidemiology of dengue diseases by affecting human availability and accessibility [13].
To address potential outbreaks of vector-borne diseases, scientists and public health organizations have attempted to apply land cover/land use vector relationships to develop place-based models to predict vector abundance and dengue disease risk [9,14]. Additionally, a recent study in Sáo Paulo, Brazil, observed a pattern of spatial segregation of Aedes species, affirming the ecological preferences of each species of mosquitoes in an urban environment [15]. In this regard, the Stegomyia indices, which usually include the House Index (HI) (the percentage of houses infested with larvae and/or pupae of vector mosquitoes), the Container Index (the percentage of water-holding containers infested with larvae and/or pupae), and the Breteau Index (BI) (the number of positive (infested) containers per 100 houses inspected) [16,17], are the established metrics for spatial monitoring of vector populations. Kolivras [18] pointed out that spatial epidemiology approaches have provided numerous place-based models for malaria vectors but fewer spatial models have been formulated for other important disease vectors, including dengue. Although the relationship between climate, land use, and mosquito abundance is extensively documented worldwide, there limited research has been conducted in Bangladesh to explore the correlation between land use and land cover variables, the risk posed by Ae. aegypti abundance, and their impact on seroincidence or seroconversion.
The scope and significance of studying urban mosquito microhabitats are embedded in the fact that Ae. aegypti is an anthropophilic species that thrives in human-modified landscapes in and around human dwellings [19]. Risk factors for dengue seropositivity and seroconversion may vary per site, reflecting the variation in local infection and transmission patterns. In an urban setting, there are ample suitable habitats for Ae. aegypti and the presence of breeding sites for the vector is not the limiting factor for dengue infection [7].
The objectives of the study were (a) to test whether Stegomyia indices vary in accordance with landscape usage as classified by integrated urban ecological (IUE) zoning; (b) to determine whether the association between age distribution and the occurrence of seroprevalence as well as seroconversion are homogeneous among the IUE zones; (c) to test whether demographics (such as age and/or sex) and human behavioral (e.g., attending mass gatherings and travelling during the last six months) or epidemiological factors (febrile illness during the last six months) are associated with seroconversion (i.e., exposure to recent infection), and whether such associations are common to all IUE zones, and (d) to determine whether the household microenvironmental (e.g., number of potted plants), social and behavioral (e.g., attending mass gatherings and travelling during the last six months), and epidemiological factors (e.g., febrile illness during the last six months) are associated with seroconversion (i.e., exposure to recent infection) in each of the IUE zones.
2. Materials and Methods
2.1. Study Area
The study area included the Dhaka City Corporation (DCC) territory, the region that is the most affected and vulnerable to dengue in the country [20,21,22]. Dhaka is divided into 90 wards, which are administrative sub-units of the city corporation each with a governing council. The city experiences a hot, wet, and humid tropical climate and has a distinct monsoon season. The annual average temperature is 28 °C, and monthly means range from 20 °C in January to 32 °C in May. Almost 80% of the average annual rainfall of 1854 mm occurs between May and September [23]. Between 2005 and 2009, there were 3130 admissions for dengue fever in Dhaka’s 11 hospitals.
2.2. IUE Zonation by Land Cover and Land Use Data
The study area was geographically limited to 12 randomly chosen wards out of a total of 90. We reclassified them into broader “integrated urban ecological” zones [24,25] by applying land use and land cover data for the 2012 period in order to find out their association with the spatial distribution of vector abundance and dengue seroconversion. RapidEye satellite sensor 5-band multispectral images (blue, green, red, red edge, and near-infrared; 440–850 nm spectral range) with a spatial resolution of 5 m were acquired for mapping the land use and land cover attributes [26]. A supervised maximum-likelihood classification of 7 land cover classes using a Fisher linear discriminant analysis was performed [27]. Further data on land use and cover were obtained from external sources, specifically RAJUK (Rajdhani Unnayan Kartripakkha) and Dhaka City Corporation (DCC). These data were integrated into the classification by means of polygon overlay to include residential, commercial, industrial, and paved areas as land use attributes, and coarse vegetation, water bodies, and bare soil as land cover attributes. To calculate the percentage of different land cover categories in each study ward, zonal statistics were applied in ArcGIS Desktop 10.2.
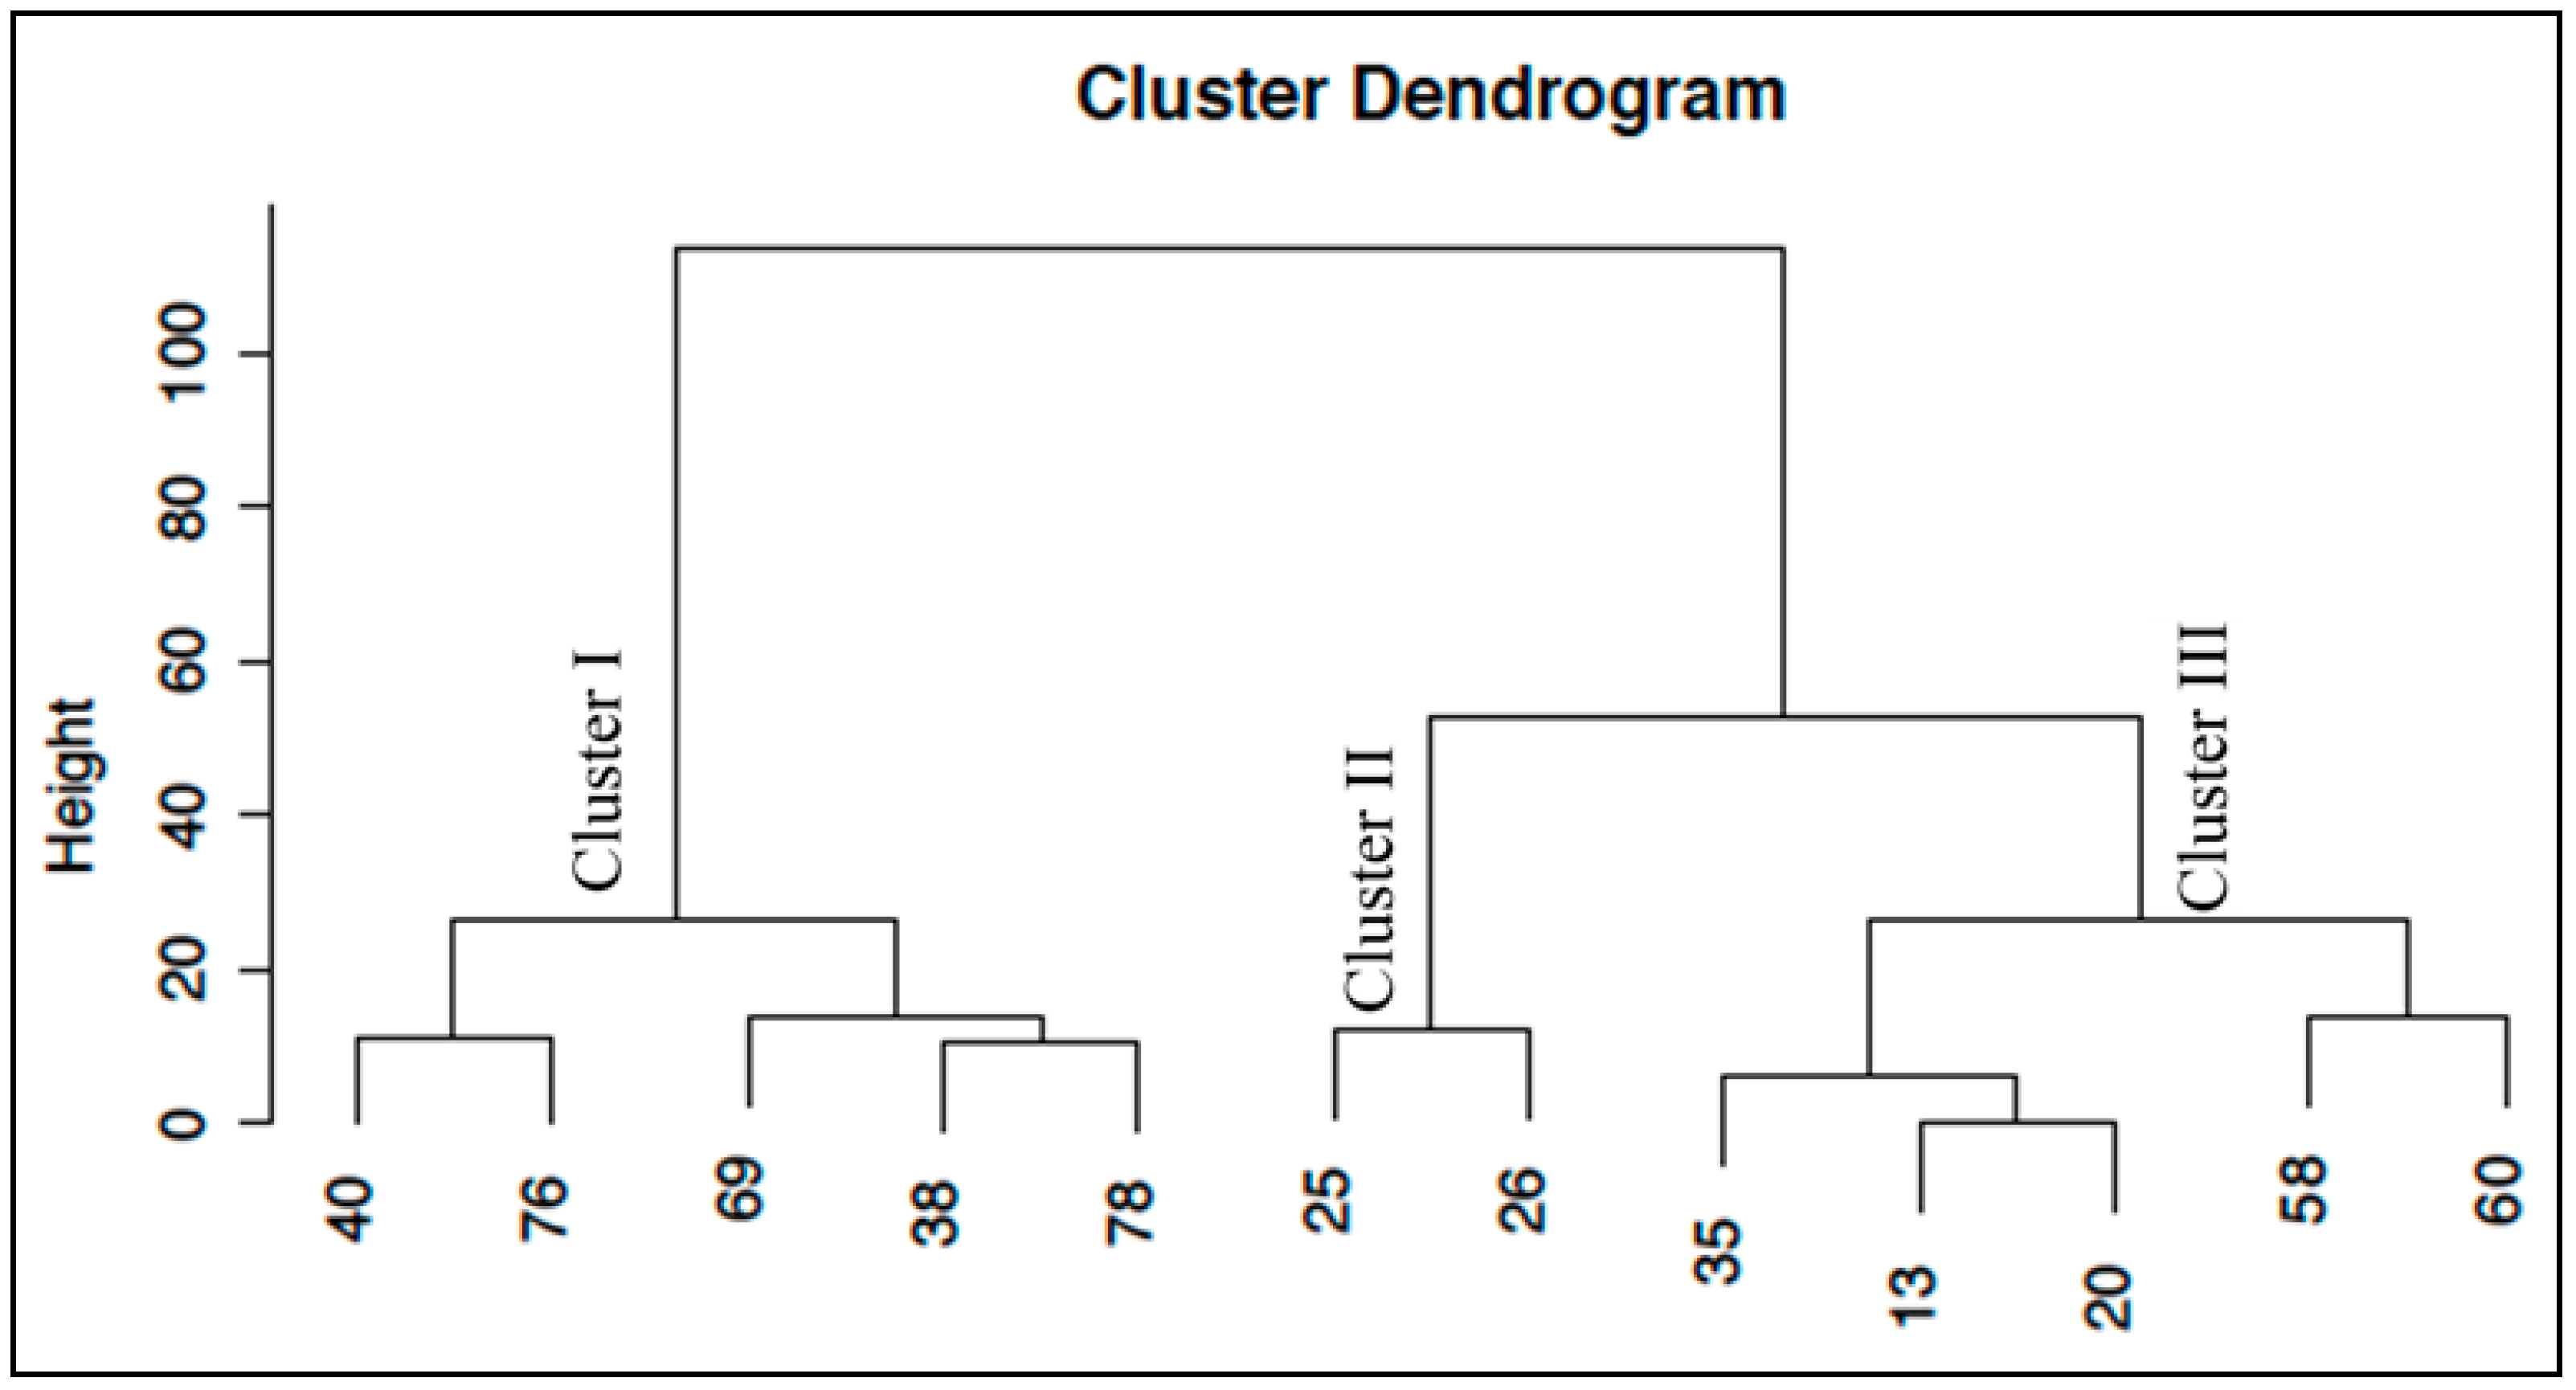
A cluster analysis was performed in CRAN R (R Core Team, 2016) with the function “hclust” (hierarchical clustering) using the ward method. A dendogram was produced and used to establish IUE clusters for the selected 12 Dhaka City wards (Figure 1). For the purpose of this study, three IUE zones were delineated: (i) the CBR zone that includes Dhaka City wards 40, 76, 69, 38, and 78 and is characterized mainly by commercial, residential, and administrative mixed land use and land cover; (ii) the established residential (ER) zone, consisting chiefly of old, well-established residential areas in wards 35, 13, 20, 58, and 60, with relatively modest built up proportions (60–68%), and (iii) the newly built residential (NBR) zone, which has only two wards (i.e., 25 and 26) and has the highest building ratios (i.e., 80–85%).
2.3. Study Design
This study utilized individual household premises as the primary sampling units and employed a multi-stage sampling design. Specifically, out of the 90 wards in the DCC, a total of 12 wards were selected using a spatial randomization procedure that involved overlaying 100 m × 100 m grid cells on each ward and randomly selecting 100 grid cells. From each selected ward, 100 household premises were then randomly chosen as sampling units for both entomological and serological surveys, resulting in a total of 1200 households being targeted for the study.
The response rate for the entomological survey (monsoon) was 74.8% (898/1200) and was 32.5% (390/1200) for the serological surveys (pre- and post-monsoon paired data). Thus, 390 households which provided paired serological data were also included in the inspections for immature mosquitoes.
2.4. Entomological Surveillance
Immature Aedes mosquito inspections at 898 household premises in the 12 selected wards were carried out during July–August (monsoon months) in 2012. All containers in each household premise were inspected for a total of 1003 containers included in the study. Using established criteria from the Directorate of General of Public Health, Bangladesh, for entomological surveys, any water-filled containers with water stored for more than 3 days were considered as wet containers. For wet (water-holding) containers, the amount of water at the time of the survey was also recorded, and householders were asked about the source and use of the water. Information on dry containers was also collected to assist in calculating the container index. All wet containers were examined with flashlights to confirm the presence of immature Aedes. Larvae and pupae from sequential dips were saved for species identification, and counts of both the larvae and pupae (per dip) were recorded.
Samples containing larvae or pupae were transported from the field sites to the laboratory at North South University (Dhaka, Bangladesh). Once in the laboratory, larvae were killed by submerging them in formaldehyde and species determination was performed using dissecting microscopes and the dichotomous taxonomic keys of Consoli and Lourenço-de-Oliveira, which are based on morphological characteristics [28]. Additionally, all collected pupae were reared in the laboratory until they reached adulthood, at which point their species was determined.
2.5. Blood Sample Collection and Serological Data Processing
In this study, seroprevalence was defined as the percentage of total individuals in a population who tested positive for the presence of IgG antibodies to DENV. Individuals identified as seroconverted were found to be negative for the dengue antibodies during the pre-monsoon period but were positive for dengue IgM or IgG based on the serological analysis of their post-monsoon sample. The extent of seroconversion or seroincidence (synonymously used in this study) refers to the percentage of new cases as well as exposures identified between the pre- and post-monsoon period.
For the purpose of assessing the seroprevalence and the extent of seroconversion of DENV, two household serosurveys were conducted in 2012. Collection of blood samples was performed by members of the serological research team, which was led by the International Centre for Diarrheal Disease Research, Bangladesh (CDDR, b), and conducted in Dhaka. The first serosurvey was conducted during the last two weeks of June of 2012 (i.e., pre-monsoon). Concurrent with the serosurvey, information on demographic, socioeconomic, and other relevant characteristics were obtained from the study participants using a structured questionnaire. Although the original sampling protocol included only one volunteer member from each of the sampled household to provide blood samples, because of repeated and ardent requests, all household members sharing one roof, all meals, and common living spaces were allowed to participate. The 2012 pre-monsoon serosurvey served as a baseline for the determination of DENV seroprevalence and involved the testing of 1125 individuals.
Seasonality in dengue incidence is an important factor, especially because of the effects of the monsoon on vector abundance. Considering this, during the 2012 post-monsoon period (the last two weeks of November), a follow-up serosurvey was carried out and households that participated in the baseline serosurvey were revisited. Out of 1125 individuals of the pre-monsoon serosurveys, 600 (53.2%) individuals were still residing in the previously recorded locations and were willing to provide another blood sample. These 600 serological study participants from 390 households who provided paired serum samples comprised the sample set for measuring the extent of seroconversion between the 2012 pre- and post-monsoon time frames.
Serological analyses of patient sera were performed at the National Microbiology Laboratory, Winnipeg, Canada, using commercially prepared Focus Diagnostics Dengue DxSelect™ IgM and IgG ELISA kits. An IgG ELISA was used to establish previous exposure to dengue virus or as an epidemiological tool for DENV seroprevalence surveys. The IgG ELISA kit consists of polystyrene microwells that are pre-coated with equal proportions of inactivated, purified DENV types 1–4. Diluted serum samples and controls were incubated in microwells to allow the dengue-specific antibodies present in the samples to react with the coating antigen. Nonspecific reactants were removed by washing, and horseradish peroxidase-conjugated anti-human IgG was added, which reacted with bound DENV-specific IgG antibodies. Excess conjugate was removed by washing. Tetramethylbenzidine (TMB), a chromogenic substrate, was added for color development. Following an incubation period, the reaction was stopped by the addition of 1 M sulfuric acid. The optical density was measured with a spectrophotometer (BioTek Elx808, Vernier Canada, Markham, ON, Canada) at a wavelength of 450 nm. Index values were calculated for patient samples relative to the cut-off calibrator. Samples with index values >1.00 were considered positive.
3. Data Analysis
The analysis was conducted on baseline entomological and seroprevalence data obtained from the 1200 selected households, and from the 390 households in the follow-up survey. Initially, one participant from each household was targeted for the study; however, multiple serum samples were sometimes collected from households when more than one household member was willing to participate. All data analyses were performed using SAS (Statistical Analysis System) 9.1.3 (SAS Institute, Cary, NC, USA) and IBM SPSS (Statistical Package for the Social Sciences) (version 22.0; SPSS Inc., Chicago, Il, USA). The analytical tests for each objective are presented below:
Objective (1): A test of homogeneity of Stegomyia indices among the IUE zones (delineated based on land cover/land use) was performed by using a χ2 test. Here, the null hypothesis was that the Stegomyia indices and total number of pupa of the vector do not vary by IUE zones.
Objective (2): Odds ratio tests were performed on individual risk factors for seroprevalence (the outcome/dependent variable), including age as one of the principal factors, in each IUE zone. Age (demographic) categories were defined as individuals under 12 years, 12–34 years, and more than 34 years. Taking into account the local context and the relevant literature, other categorical risk factors (independent variables) that were considered in the analysis included sex, history of febrile illness among household members in the last six months, and travel outside the homestead in the same period. While frequency data would have been ideal, categorical variables were used due to the absence of household-level records and the fading memory of interviewees.
Objective (3): To test seroconversion/recent DENV infection (the outcome/dependent variable) based on demographic, behavioral, and epidemiological factors. Upon completion of an extensive survey of the existing literature and considering the local Bangladesh socioeconomic and ecological contexts, the following categorical independent variables were considered: demographic (age and/or sex) and behavioral (attending mass gatherings and travelling during the last six months) and epidemiological factors (febrile illness during the last six months). A χ2 test was used to test statistical relationships between seroconversion and the selected explanatory variables.
Objective (4): To determine the association between the dengue seroconversion (outcome variable—"yes” or “no”—dichotomous) a binary logistic regression model with stepwise selection method was developed. Independent variables included the demographic (age and sex), socioeconomic status (household income, education, and occupation), and the household microenvironmental (indoor potted plants, number water vessels inside household, and vegetation/tree nearby), human behavioral (types of mosquito control measures, attendance in mass gatherings, and travel during last six months), and epidemiological factors (e.g., had fever during last six months).
4. Results
4.1. Spatial Distribution of Immature Aedes aegypti and Land Cover/Land Use
The 2012 entomological survey during the monsoon months revealed that the immature stages of Ae. aegypti were present in all selected wards. In these 12 selected wards, out of 898 inspected household premises (total population = 6232), 222 households (24.7%) were found positive for Aedes larvae and/or pupae. At the time of the survey, 25.7% containers (258 containers out of 1003 containers inspected) had immature Aedes. The traditional Stegomyia indices for the study area were an HI of 24.7% (222 positive household premises of 898 sampled), a Container Index of 25.7% (258 positive containers of 1003 sampled), and a BI of 28.7% (258 positive containers of 898 household premises inspected) (Table 1).
A total of 1380 Ae. aegypti pupae and 4174 larvae were present in 258 (25.7%) of 1003 containers with water. The distribution of inspected households and Aedes positive households, as can be seen in Figure 2, is indicative of relatively higher abundance of Aedes mosquitoes across the city [11]. However, a visual clustering of positive households is apparent in the CBR zone more so than the others.
To evaluate the association between land use/land cover characteristics and vector abundance, the traditional Stegomyia indices for each integrated urban ecological zone were calculated and compared to assess their statistical significance. In the CBR zone, the infestation intensity was much higher than the two other ecological zones. The HI for the CBR zone was 28.4%, whereas this index was 22.0% and 22.2% for the ER and NBR zones, respectively (Table 1). A similar pattern was observed in case of Container Index, as reflected in a value of 29.9% for the CBR zone and 22.6% and 22.5% for the ER and NBR, respectively. The BI was also highest in the CBR (i.e., 34.2%) compared to the ER (25.5%) and NBR (23.3%) zones. The null hypothesis that there was no significant difference in terms of HI could not be rejected (HI: χ2 = 4.68, df = 2, p-value = 0.096). However, for Container Index, the null hypothesis was rejected (Container Index: χ2 = 7.00, df = 2, p-value = 0.030), which presumably was largely due to the large Container Index value in the CBR zone. For the Breteau Index, a similar null hypothesis could not be rejected. However, we found significant differences among the IUE zones in terms of proportion of pupa (number of pupa/person) (χ2 = 160.8, df = 2, p-value < 0.0001) and the number of pupa collected from these zones (χ2 = 731.0, df = 2, p-value < 0.0001).
The hypothesis that there was no significant difference in HI could not be rejected (HI: χ2 = 4.68, df = 2, p-value = 0.096). However, the null hypothesis for Container Index was rejected (Container Index: χ2 = 7.00, df = 2, p-value = 0.030). This was likely due to the high Container Index value in the CBR zone. A similar null hypothesis could not be rejected for the Breteau Index. However, significant differences were found among the IUE zones in terms of the proportion of pupae (number of pupae per person) (χ2 = 160.8, df = 2, p-value < 0.0001) and the number of pupae collected from these zones (χ2 = 731.0, df = 2, p-value < 0.0001).
4.2. Spatial Patterns in Seroprevalence, Serocoversion, and Land Cover/Land Use
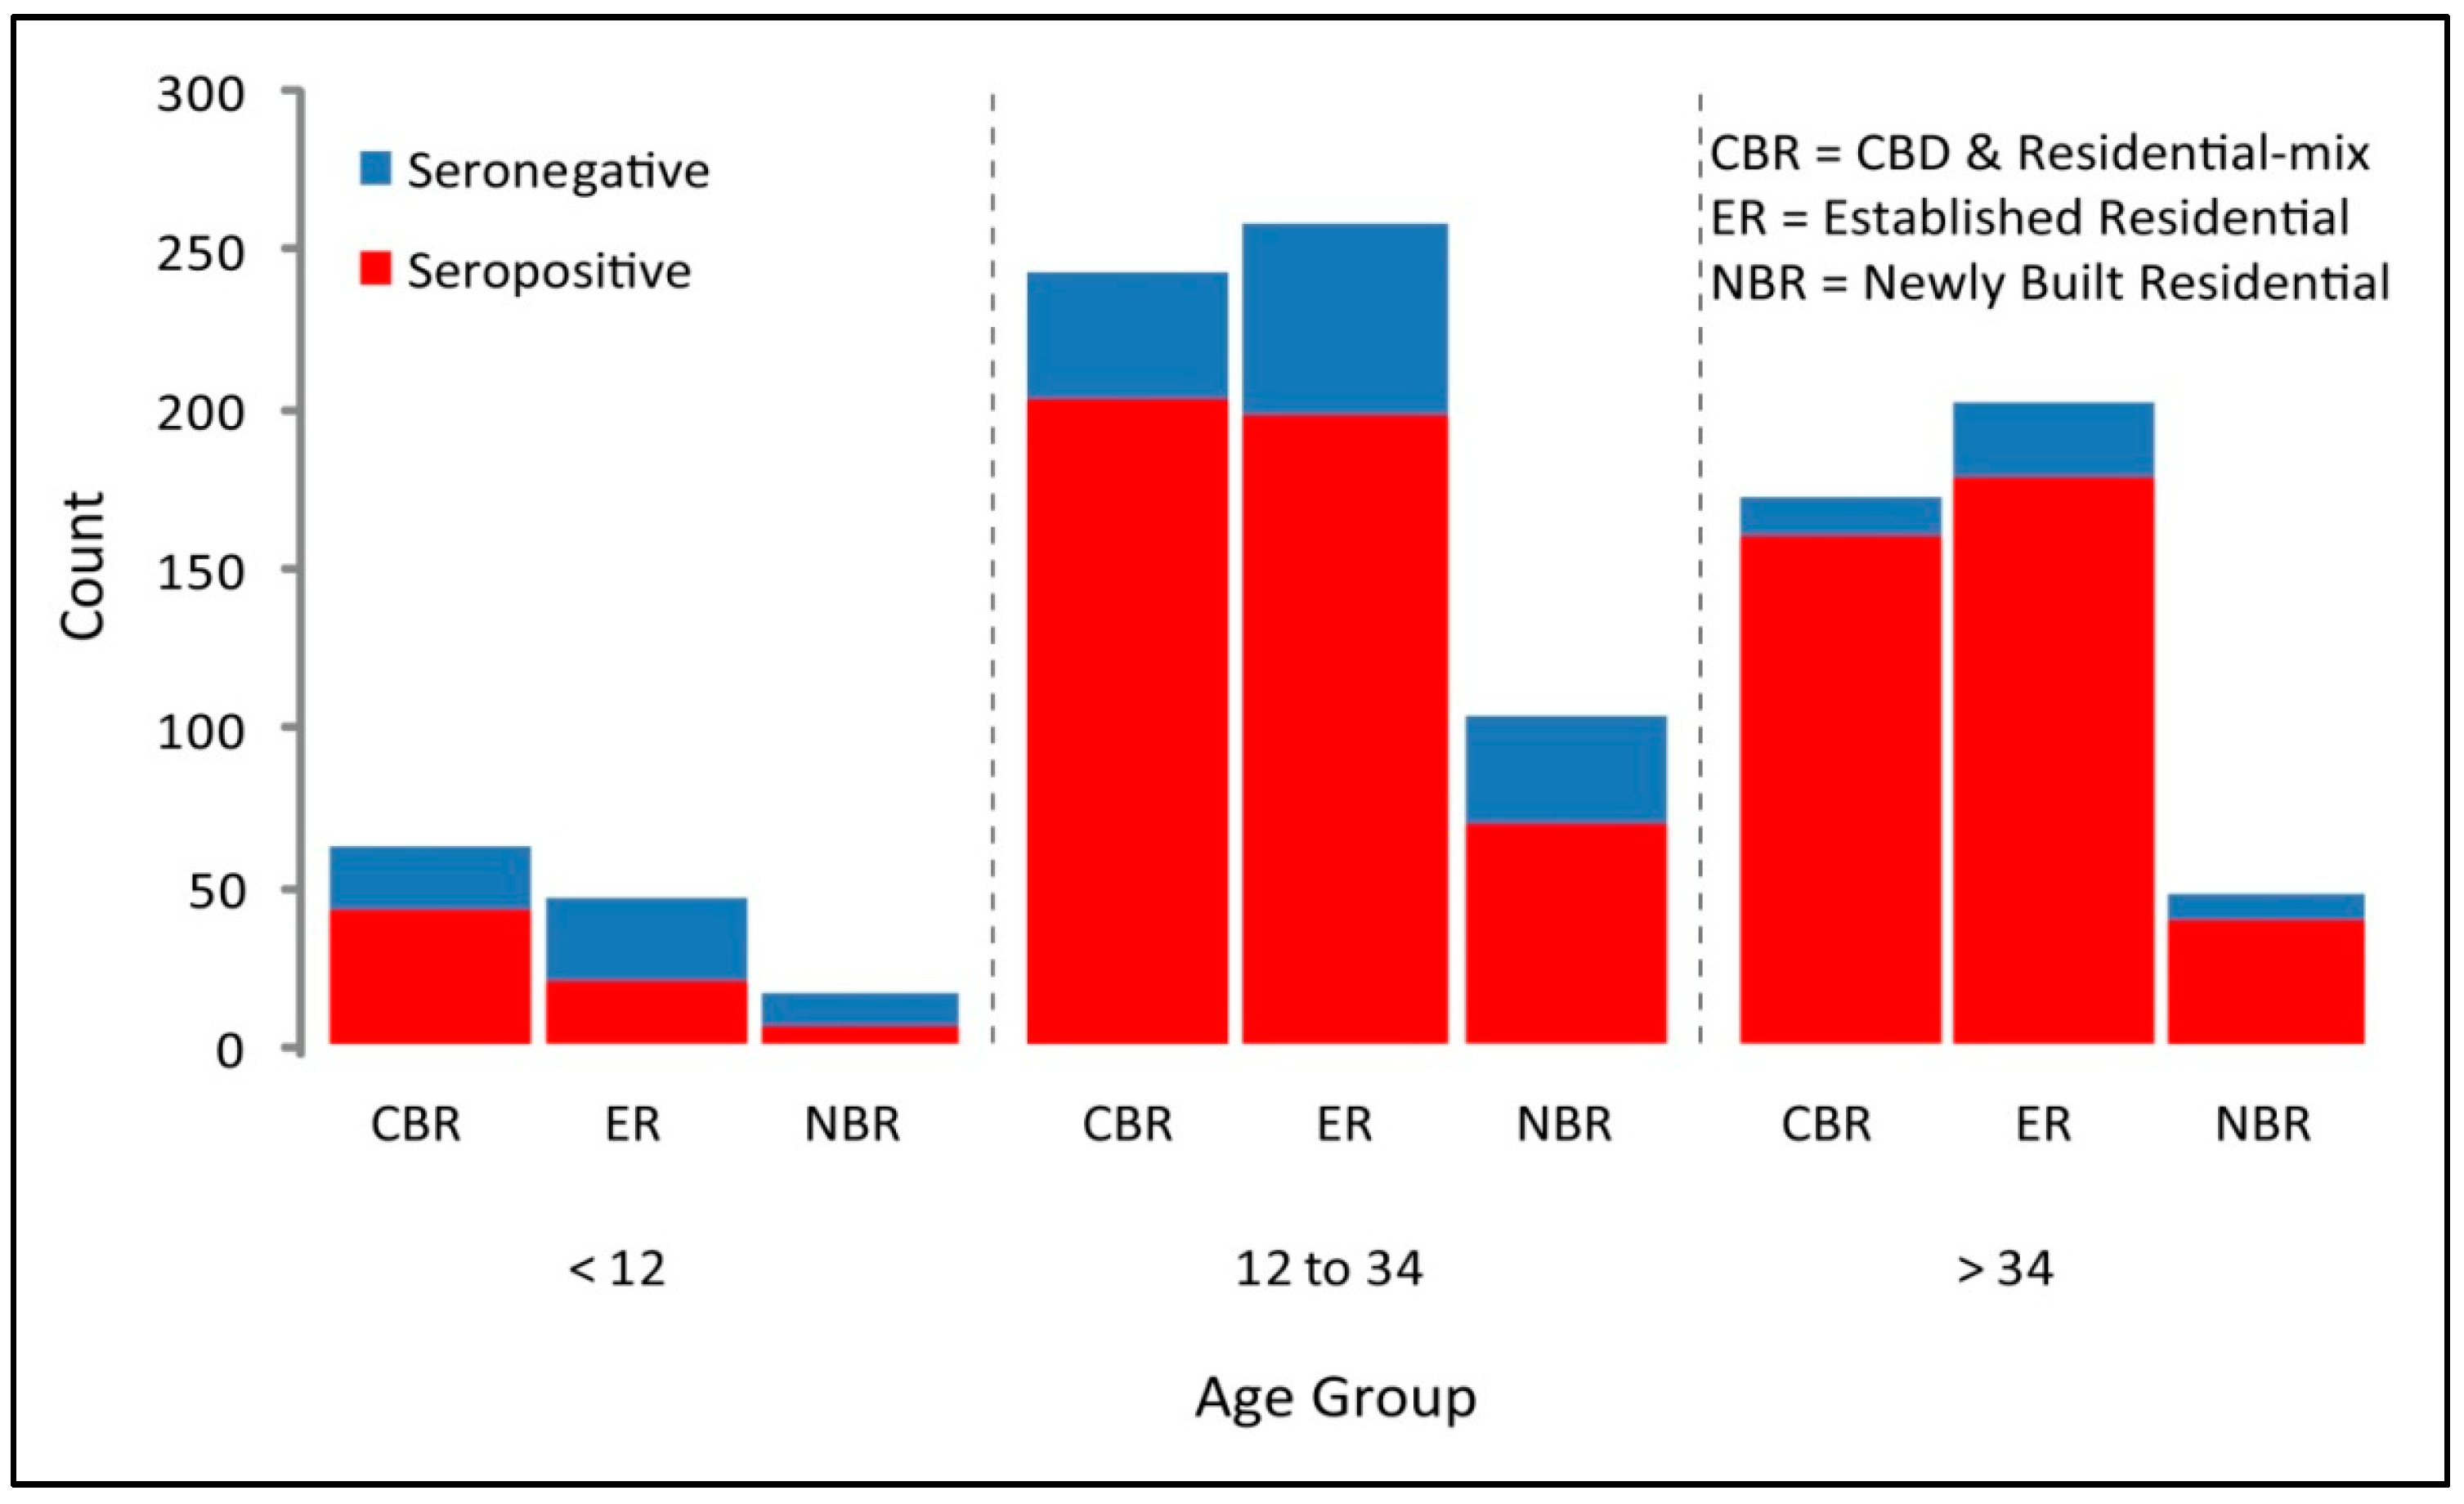
The 2012 pre-monsoon serological survey results revealed that dengue seroprevalence was 79.91% in the city of Dhaka. Among the IUE zones, the extent of seroprevalence was 81.12% in the CBR zone, 80.28% in the ER zone, and 75.16% in the NBR zone (χ2 = 166.3, df = 2, p-value < 0.0001) (Table 2). In the CBR zone, the seroprevalence was the highest among all IUE zones as well as was consistently highest among all age groups (Figure 3).
As expected from cumulative exposures and infections over time, the frequency of seropositive (confirming the presence of DENV antibody) samples increased consistently with age (Container Index: 2.70–5.90; p-value < 0.0001) [29]. This is valid in each of the IUE zones (Figure 3). Among all seropositive samples, 55.79% were female and 44.21% were male and the variation in seroprevalence by age was found to be statistically significant in each individual IUE zone (CBR: OR = 0.14, p-value = < 0.0001; ER: OR = 0.09, p-value = < 0.0001; NBR: OR = 0.09, p-value = < 0.001). Notably, only within the ER zone was travel during last six months outside the usual residence found to be associated with seroprevalence (Table 3).
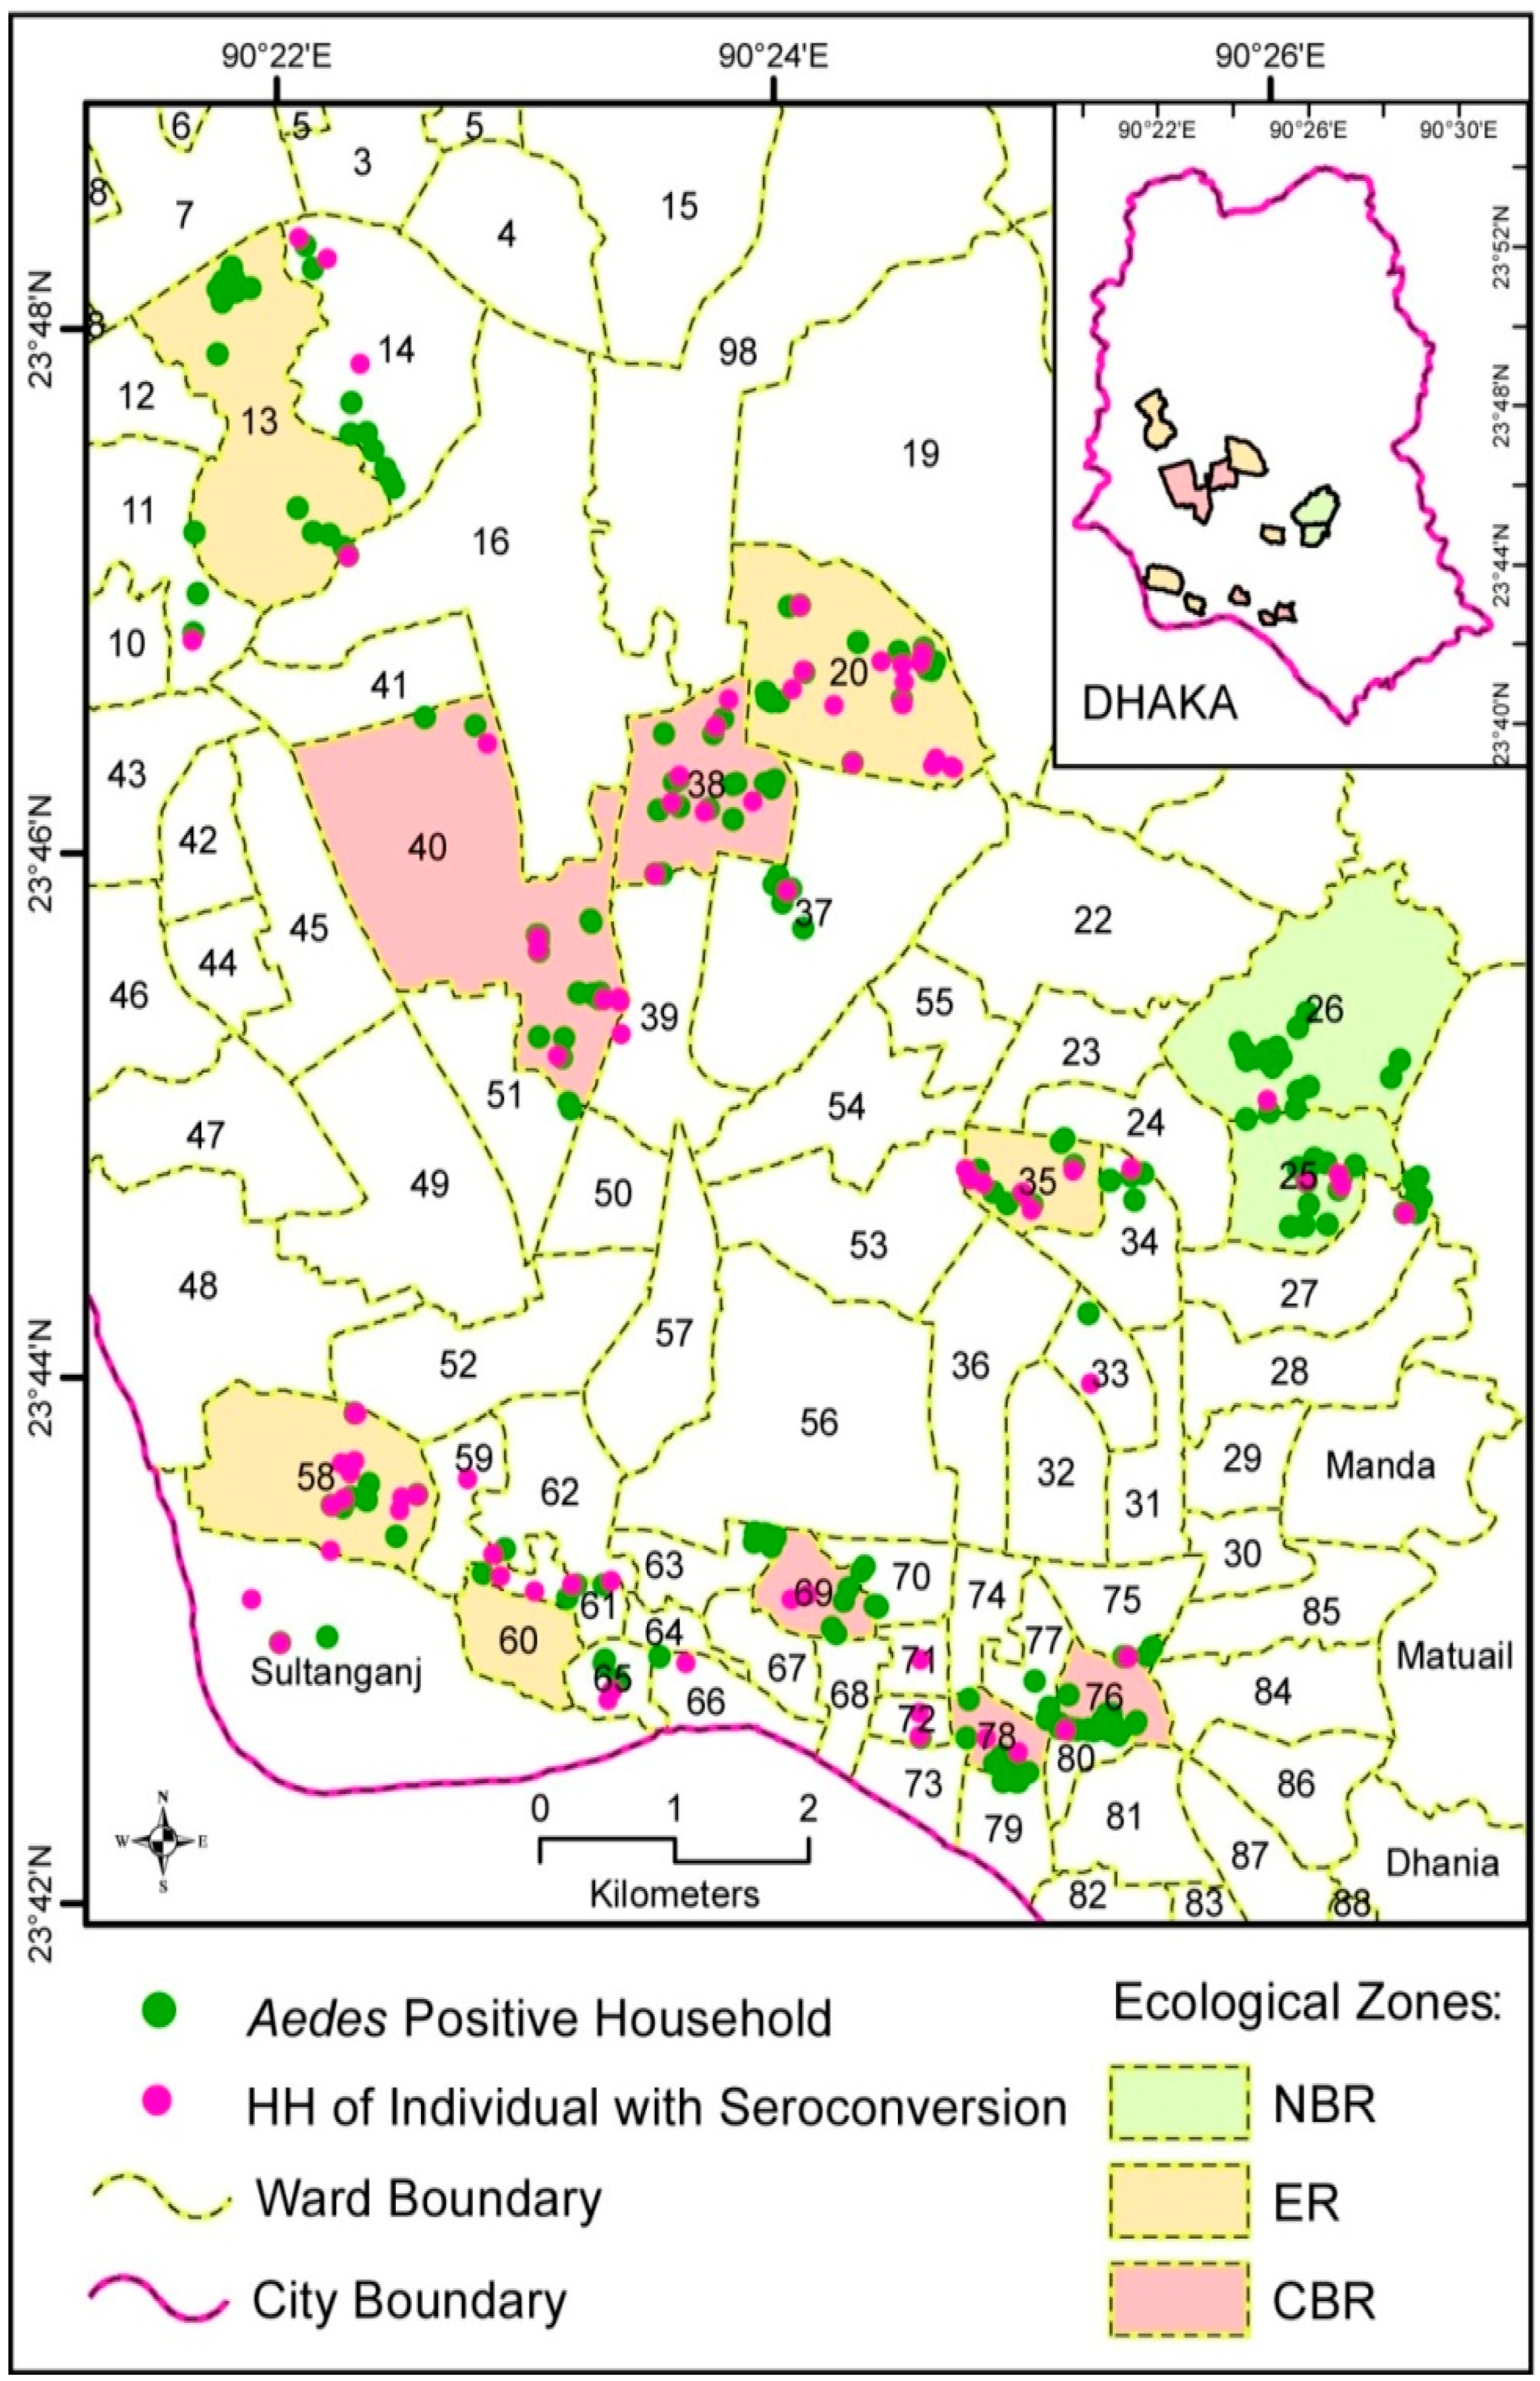
Figure 4 depicts the spatial patterns of immature Aedes abundance in household premises by IUE zone. Each dot indicates the location of Aedes positive households with or without seroconverted person(s) in the household. As noted above, some degree of clustered patterns in Aedes positive households are visually apparent.
In total, 95 individuals from 83 households were identified as seroconverted post-monsoon in 2012. Out of a total of 222 Aedes positive households of 898 inspected households during 2012 monsoon, only 3.1% of individuals were seroconverted during the monsoon period (as was detected by the post-monsoon population serological survey results). When the association between households with a seroconverted person and Aedes aegypti pupae positive households was tested, it confirmed that there was no statistical relationship between them (χ2 value = 0.42, df = 1; p-value = 0.52). Further tests by IUE zone have revealed that the relationship between geographical location of seroconversion and vector habitats was nominal, which is indicative of people being infected in distant areas outside their usual homes.
4.3. Logistic Regression Modeling of the Presence or Absence of Vector and Seroconversion in Households
As explained above in the data analysis section, we applied the stepwise regression method on a set of independent variables. Based on the bivariate regression results between seroconversion and each individual independent variable, and using the cutoff p value of <0.25, a multivariate logistic regression model was formulated. The results of our investigation have revealed that attendance by any member of the household of mass gatherings or to public places, such as schools, mosques, recreational parks, and restaurants, is significantly associated with dengue seroconversion. Household members who appeared in places of public congregation were 8.69 times (adjusted risk ratio: 8.69 (1.80–42.0); p-value 0.007) more likely to experience seroconversion than the members who did not (Table 4). Persons in households without any potted plants in their premises were more likely to be seroconverted than those who had potted plants (adjusted risk ratio: 0.86 (0.76–0.98); p-value 0.02). The other explanatory variables considered were not statistically significant (Table 4).
The above overall relationships between the microhabitat and behavioral risk factors and seroconversion do not account for the possible influence of land use/land cover classes in the city of Dhaka. Recognizing that such broad-scale urban ecological factors can play a significant role in vector ecology and thus in dengue infection, it is important to consider similarities and differences between land use and land cover classes. When land cover was included in the regression analysis as an independent variable, we found two distinctive patterns of relationship. In the CBR zone, attendance of mass gatherings, travel during the last six months, indoor potted plants, and febrile illness any time during the last six months were found to be significant factors for recent dengue infection (i.e., seroconversion) at the 95% level of confidence. It was revealed that the likelihood of the people in the CBR zone who did not travel outside their usual residence during the last six months to be “recently infected” is 2.4 times higher than of the people who did travel within such time frame. In contrast, in both ER and NBR zones, none of the selected independent variables were found to be significant in relation to the seroconversion among the sample residents.
5. Discussion
The existing literature on dengue transmission in rapidly growing urban centers of the developing world primarily focuses on the role of socioeconomic factors, particularly population density and household water use practices [30,31]. However, it is important to recognize that societal and ecological factors are interconnected in integrated social–ecological systems. Therefore, it is crucial to analyze ecological variables that influence dengue transmission since it involves the distribution of Aedes mosquitoes and DENV across a geographical area, along with their interactions with host populations. For instance, recent studies have emphasized that shaded and vegetated neighborhoods with numerous sites exposed to rainwater and less sunlight provide favorable microhabitats for Ae. aegypti larvae in urban tropical settings [32,33]. On a larger scale, deforestation and new urbanization transition larval habitats to artificial containers. Additionally, urban land cover/land use characteristics profoundly influence the epidemiology of vector-borne diseases, including dengue, by impacting host availability and accessibility. Urbanization adversely affects many ecologically critical areas unless addressed appropriately; for example, Aouissi et al. [34] observed in Algerian cities that avian diversity has decreased with rapid urban growth.
In this context, Wilcox and Gubler [35] have explained that the host–vector–virus nexus can be distorted by anthropological landscape alterations that significantly contribute to vector breeding conditions, resulting in shifts in host–vector–virus relationships. These dynamics are associated with land cover/use change as well as alterations in microhabitats of vectors and viruses. In our study, we considered multiple scales including the landscape scale (focusing on land cover/land use characteristics of integrated urban ecological zones) and household premise and neighborhood scales, focusing on microenvironmental features.
5.1. Land Cover/Land Use Variables Influencing the Distribution of Aedes and Seroprevalence
Direct detection of immature mosquito habitats in housing areas on remotely sensed images has proven to be challenging [8,36,37]. Within a small area surrounding a household (dwelling site), site conditions profoundly affect the characteristics of mosquito larval habitat (e.g., shade, gardens, and containers and planters suitable for breeding), requiring data collection on a small scale. To complement satellite observations about larval habitats, it is necessary to conduct direct field site visits. The IUE framework developed for this study enabled a spatially hierarchical approach, which, although not entirely addressing fine-scale variation at the household level, was more sensitive to variations in the overall urban environment when combined with site-level data. Other studies conducted in different countries have shown associations between urban landscape features and Aedes mosquito habitats. For instance, Vanwambeke et al. [8] found a correlation between Aedes larvae and “human activities” in northern Thailand and noted that the density of artificial containers was particularly high in areas with high human activity.
Mirroring the variations in human activities and artificial containers, the findings of our study revealed that there were significant differences among the IUE zones in terms of the spatial distribution of the proportion of Aedes pupa (number of pupa/person). This can partially be explained by the fact that in the ER and NBR zones of Dhaka, the household premises are characterized by relatively “tidier” surroundings because of limited human commercial activities and a lower magnitude of development.
It is interesting that while the pupa/person ratio significantly varied among the IUE zones, the Stegomyia indices revealed otherwise. This could be attributed to the mobile nature of transports, containers, and people in the very dynamic city of Dhaka, through which adult mosquitoes are likely to move among various IUE zones. Most of our findings underscore the homogeneity of immature Aedes distribution across the City, as reflected in that “mosquitoes are everywhere” [38] and hence there was no difference in the Stegomyia indices among the IUE zones. A similar homogeneous spatial distribution of Ae. aegypti was also observed in several countries of Latin America, namely in the city of Manaus in Brazil [36] and in the Amazonian city of Iquitos in Peru [3]. A homogeneously high level of Ae. aegypti infestation throughout the city of Dhaka, similar to other Amazonian cities, can be attributed to “the relatively high availability of artificial containers throughout the city, high rainfall, and temperature” [39].
We also noticed consistency in the spatial patterns in dengue seroprevalence among all three IUE zones. However, results of our study revealed that along with a high rate of seroprevalence across the city, seroprevalence was more concentrated in the areas of more intense commercial activity and in the main bus stations and other transportation nodes, schools and colleges, and community centers. Such spatial distributions of dengue were also observed in a number of studies in Thailand [7,40], supporting the notion that mosquito-borne disease incidences are highly focal and essentially heterogeneous [40,41]. The spatial configuration of the intensity of dengue seroprevalence and dengue cases can be vigorously delineated by applying GIS-based statistical techniques, e.g., Kernel estimation [30,42] and the Kriging method [43], as well as by applying an integrative genetic and spatial ecology approach [44], which was beyond the scope of the present study. Further research should be undertaken with a larger sample size than the present study to understand more clearly the clustering patterns and processes in dengue seroprevalence, seroconversion, and case distribution.
5.2. Microenvironmental Variables Influencing Presence of Aedes, Human Mobility and Migration, and Dengue Transmission
The large number of reported cases in the city of Dhaka provides clear evidence of the high dengue virus activity in Bangladesh during the past 15 years. As Honorio et al. [45] pointed out, recent infection and seroconversion data in population surveys are generally scant in the literature, and this is especially true in case of disaggregated data. We therefore decided to present the disaggregated data on seroconversion with special attention to the spatial distribution by IUE zone. We found the most seroconverted persons in households where prevalence of immature Aedes was lowest during the 2012 monsoon season, suggesting that recent infection took place in residences outside individual’s own home (i.e., in households located in distant places) and/or in places of mass congregation such as schools, mosques, market, shopping areas, or outdoor locations (such as parks and recreational areas where people usually stay during the daytime, when Aedes mosquitoes are most active). In order to delineate the location of exposure and infection, and to address the lack of coherence between household immature Aedes counts and seroconversion, further investigation should be undertaken by comparing current data with infected Ae. aegypti information.
As the existing literature offers conflicting findings with regard to the location of dengue risk exposure, without vigorous scientific research, it is difficult to be conclusive about the specific places where dengue vector and human interactions take place. For example, in the West Indies and in India, Chadee et al. [46] and Pandian and Dwarakanath [47] observed that dengue risk exposure is higher in and around houses, because female Ae. aegypti and Aedes mostly bite during daytime, with pronounced peaks of activity around sunrise and sunset. In contrast, van Benthem et al. [7] argued that since not all members of families stay at home during the day and Aedes bite mainly during daytime, one should not be too certain that transmission occurs primarily in or around the house.
Th findings of our research regarding the influence of microenvironmental and behavioral factors in Dhaka suggest that the variable that affects dengue risk exposure, as reflected in seroprevalence, is chiefly the participation in mass or public gatherings. In a recent study of Aedes along the coast of Paraná, Brazil, de Souza et al. [48] similarly found a high positive association between Aedes species and a high human density index. Although our study was limited in temporal scope, we found that factors related to microenvironment and human mobility were more strongly associated with seroincidences in the CBR compared to the ER and NBR zones. However, future longitudinal studies may reveal that these factors also pose significant risks throughout the entire city.
Our study findings suggest that the concentration of human socioeconomic and cultural activities in a particular area, rather than the presence of Aedes breeding at one’s own residence or dwelling, is the primary factor influencing dengue risk exposure in Dhaka. In this regard, Tabatabaei and Metanat [49] and Hernandez-Suarez and Mendoza-Cano [50] explain that mass gatherings are of great importance due to the potential risk for transmission of DENV, as the participants themselves may play a role as a source of infection or that they may be susceptible to infectious agents that are circulating at the gathering location. Consistent with their recommendation, we call upon for a plan of action for developing health risk assessments for mass gatherings, including improved epidemiological surveillance, enhanced prevention and control capacities, and improved communication and management of infectious disease cases.
Several studies have emphasized the significance of entomological surveillance for early detection of dengue transmission risk and directing vector control measures [45,51,52]. However, we would like to argue that such surveillance should be accompanied by epidemiological research so that statistical risk factors for human infection or diseases can be identified with a high degree of statistical confidence. Spatially explicit models can help to generate various scenarios and assist in entomological surveillance and formulating appropriate management strategies [53]. Similar to our study findings, numerous studies in Brazil have found that vector surveillance using the Premise and Breteau indices were poorly correlated with “dengue incidence” [54,55,56]. Although the Breteau Index, reflecting the number of positive containers per 100 units of households inspected, is a good indicator of infestation and vector population potential, it cannot fully account for the extent of seroprevalence and dengue transmission [57]. This is because, as Reiter et al. [58] have illustrated from the cases in Nuevo Laredo, Mexico, and Laredo, Texas, USA, having or not having air conditioning is the most significant factor in dengue transmission irrespective of Ae. aegypti infestation. Other infrastructural conditions, such as window nets, use of bed nets, mosquito coils, etc., can also modify mosquito bite rates. In assessing the relationship between serological and epidemiological surveys and mosquito density in Puerto Rico, Rodriguez-Figueroa [59] observed that none of the household characteristics considered were significantly associated with recent dengue infection, except the number of female Ae. aegypti per person.
This study is limited by several factors. (1) Considering the limited scope of our research, we only obtained the entomological data at a single time interval and therefore the trends we observed might have been different had we sampled over an entire season or over several years. (2) We focused primarily on household containers and surroundings to delineate Ae. aegypti and Ae. albopictus habitats and excluded other habitats in the urban environment. In order to capture the dynamics fully, future studies will require examining the phenology and distribution of mosquitoes in non-household environments, including shopping malls, markets, places of worship, and other mass gathering places. (3) As demographic, socioeconomic, and land-use heterogeneity prevail in a city such as Dhaka, estimates should not be considered definitive without a larger sample and longitudinal study. However, there are important inferences that can be made from a limited sample size and cross-sectional study such as the present one and there is sufficient reason presented for further study. (4) The representation of sample households through random selection, although ensuring robust estimates of the household population, may provide insufficient coverage of cryptic larval development sites and thus constrain the estimation of Ae. aegypti production. (5) This empirical investigation was carried out in the 2011–2013 period and a follow up investigation was planned in 2022, which could not be implemented due to coronavirus disease 2019 (COVID-19) pandemic. Therefore, a follow-up empirical investigation to detect recent changes is required.
Overall, the results of our study underscore the important role of spatial concentration of socioeconomic activities, where human movements densely converge, in driving dengue disease transmission dynamics, perhaps more so than an individual’s own home environment [40]. In this regard, considerable numbers of studies have argued “people rather than mosquitoes rapidly move dengue virus within and among communities” [40]. The findings of our study are also indicative of this type of transmission dynamic.
6. Conclusions
In this study, our efforts to determine the association between geographic distribution of Aedes mosquitoes and recent dengue infection in the city of Dhaka, Bangladesh, via using spatial analytical tools have provided evidence for a correlation between land use patterns and dengue seroconversion. An analysis of Stegomyia indices by different land cover/land use types reflected in the Integrated Urban Ecological zones revealed that there is some association between Aedes habitats and urban land cover/land use in Dhaka. The most obvious case is the densely populated, commercial, administrative, and residential mixed zone (i.e., central business and residential (CBR) zone), which is defined by urban functions and anthropogenic economic activities. All of the House Index, Container Index, and Breteau Index values were considerably higher in the CBR zone than in the ER and NBR zones, with the Container Index being statistically significant. In terms of age distribution of the population and seroprevalence, the age group <12 bore the maximum risk.
Our study concluded that, depending on the characteristics of urban functions in various zones, most of the mosquito–human interactions take place outside of residences in Dhaka. These patterns call for special attention to be given to the spatial concentration of human socioeconomic and cultural activities in dengue risk exposure in Dhaka, rather than to the location of Aedes breeding. Public policy interventions and action programs should emphasize interventions at the transportation network hubs and other points of mass gatherings, especially by keeping these places clean and screens or lids on water containers, as well as enhanced public awareness of the risks to avoid exposure of dengue patients to Aedes mosquitoes. Further research is needed to understand the implications of land use and land cover changes for Aedes habitats and vector-borne diseases and to determine more effective dengue preventions and controlling interventions.
Author Contributions
Conceptualization, C.E.H., P.D.-C. and D.W.; methodology, C.E.H., P.D.-C. and S.H.; software, C.E.H., S.H. and D.W.; validation, C.E.H., S.H. and D.W.; formal analysis, P.D.-C., C.E.H. and S.H.; investigation, P.D.-C. and C.E.H.; resources, C.E.H.; data curation, S.H. and D.W.; writing—original draft preparation, C.E.H., P.D.-C. and S.H.; writing—review and editing, C.E.H. and D.W.; visualization, C.E.H. and P.D.-C.; supervision, C.E.H., S.H. and D.W.; project administration, C.E.H.; funding acquisition, C.E.H. All authors have read and agreed to the published version of the manuscript.
Funding
This research was funded by the International Development Research Centre (IDRC), Ottawa, Canada, Ecohealth Program (grant # 106-040-001). Additional funding was awarded to the first author from a graduate research fellowship by the Manitoba Health Research Council (MHRC) and the International Development Research Centre (IDRC) doctoral research award (IDRA). The funding bodies had no role in the design of the study and collection, analysis, and interpretation of data and in writing the manuscript.
Institutional Review Board Statement
The research was approved by the Bangladesh Medical Research Council (Bangladesh) and the Joint Faculty Research Ethics Board of the University of Manitoba (Canada) (protocol #HS12094 (J2010:124)). The purpose and objectives were explained to the head of each household and their informed consent was sought to collect demographic, socioeconomic, household infrastructure, and ecological information.
Data Availability Statement
The datasets used and/or analyzed during the present study are available from the corresponding author on reasonable request.
Acknowledgments
We acknowledge the kind participation of householders of the twelve selected ward communities of the city of Dhaka, Bangladesh, in the study. We would also like to acknowledge the extensive support provided by the Department of Public Health of North South University, Directorate General of Health Services, Dhaka, Bangladesh, and the Natural Resources Institute of the University of Manitoba, Winnipeg, Canada. We are also thankful to G.U. Ahsan, North South University, Bangladesh, for facilitating the entomological survey; to Abdullah Brooks, International Center for Diarrheal Disease, Bangladesh (ICDDR,B), for his contribution to the formulation of the study design; and to Khandakar Hasan Mahmud, Department of Geography and Environment, Jahangirnagar University, Bangladesh, for his assistance in processing the satellite images and finalizing the maps and figures.
Conflicts of Interest
The authors declare no conflict of interest. The funders had no role in the design of the study; in the collection, analyses, or interpretation of data; in the writing of the manuscript, or in the decision to publish the results.
Abbreviations
IUE = integrated urban ecological zone; CBR = central business and residential mix; ER = established residential; NBR = newly built residential; DENV = Dengue virus; HI = House Index; BI = Breteau Index; DCC = Dhaka City Corporation; SES = socio-economic status; IgG = immunoglobulin G; IgM = immunoglobulin M; CI = confidence interval; OR = odds ratio.
References
- Halstead, S.B. Global epidemiology of dengue hemorrhagic fever. Southeast Asian J. Trop. Med. Public Health 1990, 21, 636–641. [Google Scholar] [PubMed]
- Halstead, S.B.; Scanlon, J.E.; Umpaivit, P.; Udomsakdi, S. Dengue and chikungunya virus infection in man in Thailand, 1962–1964. IV. Epidemiologic studies in the Bangkok metropolitan area. Am. J. Trop. Med. Hyg. 1969, 18, 997–1021. [Google Scholar] [CrossRef]
- Getis, A.; Morrison, A.C.; Gray, K.; Scott, T.W. Characteristics of the spatial pattern of the dengue vector, Aedes aegypti, in Iquitos, Peru. Am. J. Trop. Med. Hyg. 2003, 69, 494–505. [Google Scholar] [CrossRef] [PubMed]
- Leta, S.; Beyene, T.J.; De Clercq, E.M.; Amenu, K.; Kraemer, M.U.G.; Revie, C.W. Global risk mapping for major diseases transmitted by Aedes aegypti and Aedes albopictus. Int. J. Infect. Dis. 2018, 67, 25–35. [Google Scholar] [CrossRef] [Green Version]
- Kraemer, M.U.G.; Reiner, R.C., Jr.; Brady, O.J.; Messina, J.P.; Gilbert, M.; Pigott, D.M.; Yi, D.; Johnson, K.; Earl, L.; Marczak, L.B.; et al. Past and future spread of the arbovirus vectors Aedes aegypti and Aedes albopictus. Nat. Microbiol. 2019, 4, 854–863. [Google Scholar] [CrossRef] [Green Version]
- Kitron, U. Landscape ecology and epidemiology of vector-borne diseases: Tools for spatial analysis. J. Med. Entomol. 1998, 35, 435–445. [Google Scholar] [CrossRef]
- van Benthem, B.H.; Vanwambeke, S.O.; Khantikul, N.; Burghoorn-Maas, C.; Panart, K.; Oskam, L.; Lambin, E.F.; Somboon, P. Spatial patterns of and risk factors for seropositivity for dengue infection. Am. J. Trop. Med. Hyg. 2005, 72, 201–208. [Google Scholar] [CrossRef] [Green Version]
- Vanwambeke, S.O.; Lambin, E.F.; Eichhorn, M.P.; Flasse, S.P.; Harbach, R.E.; Oskam, L.; Somboon, P.; van Beers, S.; van Benthem, B.H.; Walton, C. Impact of land-use change on dengue and malaria in northern Thailand. EcoHealth 2007, 4, 37–51. [Google Scholar] [CrossRef]
- Patz, J.A.; Daszak, P.; Tabor, G.M.; Aguirre, A.A.; Pearl, M.; Epstein, J.; Wolfe, N.D.; Kilpatrick, A.M.; Foufopoulos, J.; Molyneux, D.; et al. Working Group on land use change and disease emergence: Unhealthy landscapes: Policy recommendations on land use change and infectious disease emergence. Environ. Health Perspect. 2004, 112, 1092–1098. [Google Scholar] [CrossRef] [Green Version]
- Ferraguti, M.; Puente, J.M.; Roiz, D.; Ruiz, S.; Soriguer, R.; Figuerola, J. Effects of landscape anthropization on mosquito community composition and abundance. Sci. Rep. 2016, 6, 29002. [Google Scholar] [CrossRef] [Green Version]
- Salinas-Ramos, V.B.; Mori, E.; Bosso, L.; Ancillotto, L.; Russo, D. Zoonotic risk: One more good reason why cats should be kept away from bats. Pathogens 2021, 10, 304. [Google Scholar] [CrossRef]
- Zheng, H.; Li, H. Spatial-temporal evolution characteristics of land use and habitat quality in Shandong Province, China. Sci. Rep. 2022, 12, 15422. [Google Scholar] [CrossRef]
- Cox, J.; Grillet, M.E.; Ramos, O.M.; Amador, M.; Barrera, R. Habitat segregation of dengue vectors along an urban environmental gradient. Am. J. Trop. Med. Hyg. 2007, 76, 820–826. [Google Scholar] [CrossRef] [PubMed]
- Vanwambeke, S.O.; Bennett, S.N.; Kapan, D.D. Spatially disaggregated disease transmission risk: Land cover, land use and risk of dengue transmission on the island of Oahu. Trop. Med. Int. Health 2011, 16, 174–185. [Google Scholar] [CrossRef] [PubMed] [Green Version]
- Heinisch, M.R.S.; Diaz-Quijano, F.A.; Chiaravalloti-Neto, F.; Pancetti, F.G.M.; Coelho, R.R.; Andrade, P.D.S.; Urbinatti, P.R.; de Almeida, R.M.M.S.; Lima-Camara, T.N. Seasonal and spatial distribution of Aedes aegypti and Aedes albopictus in a municipal urban park in Sáo Paulo, SP, Brazil. Acta Trop. 2019, 189, 104–113. [Google Scholar] [CrossRef] [PubMed]
- Dhar-Chowdhury, P.; Haque, C.E.; Lindsay, R.; Hossain, S. Socioeconomic and ecological factors influencing Aedes aegypti prevalence, abundance, and distribution in Dhaka, Bangladesh. Am. J. Trop. Med. Hyg. 2016, 94, 1223–1233. [Google Scholar] [CrossRef] [Green Version]
- WHO. Dengue: Guidelines for Diagnosis, Treatment, Prevention and Control; Special Programme for Research, Training in Tropical Diseases; World Health Organization: Geneva, Switzerland, 2009. [Google Scholar]
- Kolivras, K.N. Mosquito habitat and dengue risk potential in Hawaii: A conceptual framework and GIS application. Prof. Geogr. 2006, 58, 139–154. [Google Scholar] [CrossRef]
- Hayden, M.H.; Uejio, C.K.; Walker, K.; Ramberg, F.; Moreno, R.; Rosales, C.; Gameros, M.; Mearns, L.O.; Zielinski-Gutierrez, E.; Janes, C.R. Microclimate and human factors in the divergent ecology of Aedes aegypti along the Arizona, US/Sonora, MX border. EcoHealth 2010, 7, 64–77. [Google Scholar] [CrossRef]
- Banu, S.; Hu, W.; Hurst, C.; Guo, Y.; Islam, M.Z.; Tong, S. Space-time clusters of dengue fever in Bangladesh. Trop. Med. Inter. Health 2012, 17, 1086–1091. [Google Scholar] [CrossRef] [Green Version]
- Sharmin, S.; Viennet, E.; Glass, K.; Harley, D. The emergence of dengue in Bangladesh: Epidemiology, challenges and future disease risk. Trans. R. Soc. Trop. Med. Hyg. 2015, 109, 619–627. [Google Scholar] [CrossRef]
- Dhar-Chowdhury, P.; Haque, C.E.; Driedger, S.M. Dengue disease risk mental models in the city of Dhaka, Bangladesh: Juxtapositions and gaps between the public and experts. Risk Anal. 2015, 36, 874–891. [Google Scholar] [CrossRef] [PubMed]
- Bangladesh Bureau of Statistics. Statistical Pocketbook of Bangladesh 2010; Ministry of Planning, Bangladesh Bureau of Statistics: Dhaka, Bangladesh, 2010. [Google Scholar]
- Pickett, S.T.; Cadenasso, M.L.; Grove, J.M.; Groffman, P.M.; Band, L.E.; Boone, C.G.; Burch, W.R.; Grimmond, C.S.B.; Hom, J.; Jenkins, J.C. Beyond urban legends: An emerging framework of urban ecology, as illustrated by the Baltimore Ecosystem Study. Bioscience 2008, 58, 139–150. [Google Scholar] [CrossRef] [Green Version]
- Pickett, S.T.; Cadenasso, M.; Grove, J.; Nilon, C.; Pouyat, R.; Zipperer, W.; Costanza, R. Urban ecological systems: Linking terrestrial ecological, physical, and socioeconomic components of metropolitan areas. Annu. Rev. Ecol. Syst. 2001, 32, 127–157. [Google Scholar] [CrossRef] [Green Version]
- Satellite Imaging Corporation. RapidEye Satellite Sensor (5 m). Acquisition Date for 2011: 29 January; for 2012: 25 January; for 2013 15 January. Satellite Imaging Corporation, Houston, TX, USA. Available online: http://www.satimagingcorp.com/satellite-sensors/other-satellite-sensors/rapideye/ (accessed on 4 March 2023).
- Fukunaga, K. Introduction to Statistical Pattern Recognition; Academic Press: San Diego, CA, USA, 1990. [Google Scholar]
- Consoli, R.A.G.B.; de Oliveira, R.A. Principais Mosquitos de Importância Sanitâria No Brasil; Editora Fiocruz: Rio de Janeiro, Brazil, 1994. [Google Scholar]
- Dhar-Chowdhury, P.; Paul, K.K.; Haque, C.E.; Hossain, S.; Lindsay, I.R.; Dibernardo, A.; Brooks, A.; Drebot, M. Dengue seroprevalence, seroconversion and risk factors in Dhaka, Bangladesh. PLoS Neg. Trop. Dis. 2017, 11, e0005475. [Google Scholar] [CrossRef] [Green Version]
- Arunachalam, N.; Tana, S.; Espino, F.; Kittayapong, P.; Abeyewickrem, W.; Wai, K.T.; Tyagi, B.K.; Kroeger, A.; Sommerfeld, J.; Petzold, M. Eco-bio-social determinants of dengue vector breeding: A multicountry study in urban and periurban Asia. Bull. World Health Organ. 2010, 88, 173–184. [Google Scholar] [CrossRef] [PubMed] [Green Version]
- Schmidt, W.; Suzuki, M.; Thiem, V.D.; White, R.G.; Tsuzuki, A.; Yoshida, L.; Yanai, H.; Haque, U.; Anh, D.D.; Ariyoshi, K. Population density, water supply, and the risk of dengue fever in Vietnam: Cohort study and spatial analysis. PLoS Med. 2011, 8, e1001082. [Google Scholar] [CrossRef]
- Gleiser, R.; Zalazar, L. Distribution of mosquitoes in relation to urban landscape characteristics. Bull. Entomol. Res. 2010, 100, 153–158. [Google Scholar] [CrossRef]
- Pham, H.V.; Doan, H.T.; Phan, T.T.; Minh, N.N.T. Ecological factors associated with dengue fever in a central highlands province, Vietnam. BMC Infect. Dis. 2011, 11, 172. [Google Scholar] [CrossRef]
- Aouissi, H.A.; Petrisor, A.-I.; Ababsa, M.; Bostenaru-Dan, M.; Tourki, M.; Bouslama, Z. Influence of land use on Avian diversity in North African urban environments. Land 2021, 10, 434. [Google Scholar] [CrossRef]
- Wilcox, B.A.; Gubler, D.J. Disease ecology and the global emergence of zoonotic pathogens. Environ. Health Prev. Med. 2005, 10, 263–272. [Google Scholar] [CrossRef]
- Moloney, J.M.; Skelly, C.; Weinstein, P.; Maguire, M.; Ritchie, S. Domestic Aedes aegypti breeding site surveillance: Limitations of remote sensing as a predictive surveillance tool. Am. J. Trop. Med. Hyg. 1998, 59, 261–264. [Google Scholar] [CrossRef] [Green Version]
- Jacob, B.G.; Arheart, K.L.; Griffith, D.A.; Mbogo, C.M.; Githeko, A.K.; Regens, J.L.; Githure, J.I.; Novak, R.; Beier, J.C. Evaluation of environmental data for identification of Anopheles (Diptera: Culicidae) aquatic larval habitats in Kisumu and Malindi, Kenya. J. Med. Entomol. 2005, 42, 751–755. [Google Scholar] [CrossRef] [Green Version]
- Dhar-Chowdhury, P.; Haque, C.E.; Driedger, S.M.; Hossain, S. Community perspectives on dengue transmission in the city of Dhaka, Bangladesh. Int. Health 2014, 6, 306–316. [Google Scholar] [CrossRef] [PubMed]
- Ríos-Velásquez, C.M.; Codeço, C.T.; Honório, N.A.; Sabroza, P.S.; Moresco, M.; Cunha, I.C.; Levino, A.; Toledo, L.M.; Luz, S.L. Distribution of dengue vectors in neighborhoods with different urbanization types of Manaus, state of Amazonas, Brazil. Memórias Inst. Oswaldo Cruz 2007, 102, 617–623. [Google Scholar] [CrossRef] [PubMed] [Green Version]
- Mammen, M.P., Jr.; Pimgate, C.; Koenraadt, C.J.; Rothman, A.L.; Aldstadt, J.; Nisalak, A.; Jarman, R.G.; Jones, J.W.; Srikiatkhachorn, A.; Ypil-Butac, C.A. Spatial and temporal clustering of dengue virus transmission in Thai villages. PLoS Med. 2008, 5, e205. [Google Scholar] [CrossRef] [Green Version]
- Lloyd-Smith, J.O.; Cross, P.C.; Briggs, C.J.; Daugherty, M.; Getz, W.M.; Latto, J.; Sanchez, M.S.; Smith, A.B.; Swei, A. Should we expect population thresholds for wildlife disease? Trends Ecol. Evol. 2005, 20, 511–519. [Google Scholar] [CrossRef]
- Gatrell, A.C.; Bailey, T.C.; Diggle, P.J.; Rowlingson, B.S. Spatial point pattern analysis and its application in geographical epidemiology. Trans. Inst. Br. Geogr. 1996, 21, 256–274. [Google Scholar] [CrossRef]
- Oliver, M.A.; Webster, R. Kriging: A method of interpolation for geographical information systems. Int. J. Geogr. Inf. Syst. 1990, 4, 313–332. [Google Scholar] [CrossRef]
- Raffini, F.; Bertorelle, G.; Biello, R.; D’Urso, G.; Russo, D.; Bosso, L. From nucleotides to satellite imagery: Approaches to identify and manage the invasive pathogen Xylella fastidiosa and its insect vectors in Europe. Sustainability 2020, 12, 4508. [Google Scholar] [CrossRef]
- Honório, N.A.; Nogueira, R.M.R.; Codeço, C.T.; Carvalho, M.S.; Cruz, O.G.; Magalhães Mafra, M.D.A.F.; Araújo, J.M.G.; de Araújo, E.S.M.; Gomes, M.Q.; Pinheiro, L.S. Spatial evaluation and modeling of dengue seroprevalence and vector density in Rio de Janeiro, Brazil. PLoS Negl. Trop. Dis. 2009, 3, e545. [Google Scholar] [CrossRef]
- Chadee, D.D.; Martinez, R. Landing periodicity of Aedes aegypti with implications for dengue transmission in Trinidad, West Indies. J. Vector Ecol. 2000, 25, 158–163. [Google Scholar]
- Pandian, R.; Dwarakanath, S. The biting activity rhythm in Aedes mosquitoes of Madurai. Comp. Physiol. Ecol. 1992, 17, 66–70. [Google Scholar]
- De Souza, S.J.P.; Guaraldo, A.D.C.; Honório, N.A.; Cámara, D.C.P.; Sukow, N.M.; Machado, S.T.; dos Santos, C.N.D.; da Costa-Ribeiro, M.C.V. Spatial and temporal distribution of Aedes aegypti and Aedes albopictus oviposition on the coast of Paraná, Brazil, a recent area of dengue virus transmission. Trop. Med. Infect. Dis. 2022, 7, 246. [Google Scholar] [CrossRef] [PubMed]
- Tabatabaei, S.M.; Metanat, M. Mass gatherings and infectious diseases epidemiology and surveillance. Int. J. Infect. 2016, 2, e22833. [Google Scholar] [CrossRef]
- Hernandez-Suarez, C.M.; Mendoza-Cano, O. Empirical evidence of the effect of school gathering on the dynamics of dengue epidemics. Glob. Health Action 2016, 9, 28026. [Google Scholar] [CrossRef]
- World Health Organization. Global Strategy for Dengue Prevention and Control, 2012–2020; WHO: Geneva, Switzerland, 2012. [Google Scholar]
- Achee, N.L.; Gould, F.; Perkin, T.A.; Relner, R.C., Jr.; Morrison, C.; Ritchie, S.A.; Gubler, D.J.; Teyssou, R.; Scott, T.W. A critical assessment of vector control for dengue prevention. PLoS Neg. Trop. Dis. 2015, 9, e0003655. [Google Scholar] [CrossRef] [Green Version]
- Bertolino, S.; Sciandra, C.; Bosso, L.; Russo, D.; Lurz, P.W.; Di Febbraro, M. Spatially explicit models as tools for implementing effective management strategies for invasive alien mammals. Mammal Rev. 2020, 50, 187–199. [Google Scholar] [CrossRef]
- Câmara, F.P.; Theophilo, R.L.G.; Santos, G.T.D.; Pereira, S.R.F.G.; Câmara, D.C.P.; de Matos, R.R.C. Regional and dynamics characteristics of dengue in Brazil: A retrospective study. Rev. Soc. Bras. Med. Trop. 2007, 40, 192–196. [Google Scholar] [CrossRef] [Green Version]
- Luz, P.M.; Mendes, B.V.; Codeco, C.T.; Struchiner, C.J.; Galvani, A.P. Time series analysis of dengue incidence in Rio de Janeiro, Brazil. Am. J. Trop. Med. Hyg. 2008, 79, 933–939. [Google Scholar] [CrossRef]
- Souza, I.C.A.d.; Vianna, R.P.d.T.; Moraes, R.M.d. Modeling of dengue incidence in Paraíba State, Brazil, using distributed lag models. Cad. Saúde Pública 2007, 23, 2623–2630. [Google Scholar] [CrossRef] [Green Version]
- Kroeger, A.; Lenhart, A.; Ochoa, M.; Villegas, E.; Levy, M.; Alexander, N.; McCall, P.J. Effective control of dengue vectors with curtains and water container covers treated with insecticide in Mexico and Venezuela: A cluster randomized trials. BMJ 2006, 332, 1247–1252. [Google Scholar] [CrossRef] [PubMed] [Green Version]
- Reiter, P.; Lathtop, S.; Bunning, M.; Biggerstaff, B.; Singer, D.; Tiwari, T.; Baber, L.; Amador, M.; Thirion, J.; Hayes, J.; et al. Texas lifestyle limits transmission of dengue virus. Emerg. Infect. Dis. 2003, 9, 86–89. [Google Scholar] [CrossRef] [PubMed]
- Rodriguez-Figueroa, L.; Rigau-Perez, J.G.; Suarez, E.L.; Reiter, P. Risk factors for dengue infection during an outbreak in Yanes, Puerto Rico in 1991. Am. J. Trop. Med. Hyg. 1995, 52, 496–502. [Google Scholar] [CrossRef] [PubMed]
Figure 1.
Cluster dendogram for the selected 12 wards based on land use and land cover data, 2012. (Cluster I: central business and residential (CBR) mix zone; Cluster II: newly built residential (NBR) zone; and Cluster III: established residential (ER) mix zone).
Figure 1.
Cluster dendogram for the selected 12 wards based on land use and land cover data, 2012. (Cluster I: central business and residential (CBR) mix zone; Cluster II: newly built residential (NBR) zone; and Cluster III: established residential (ER) mix zone).

Figure 2.
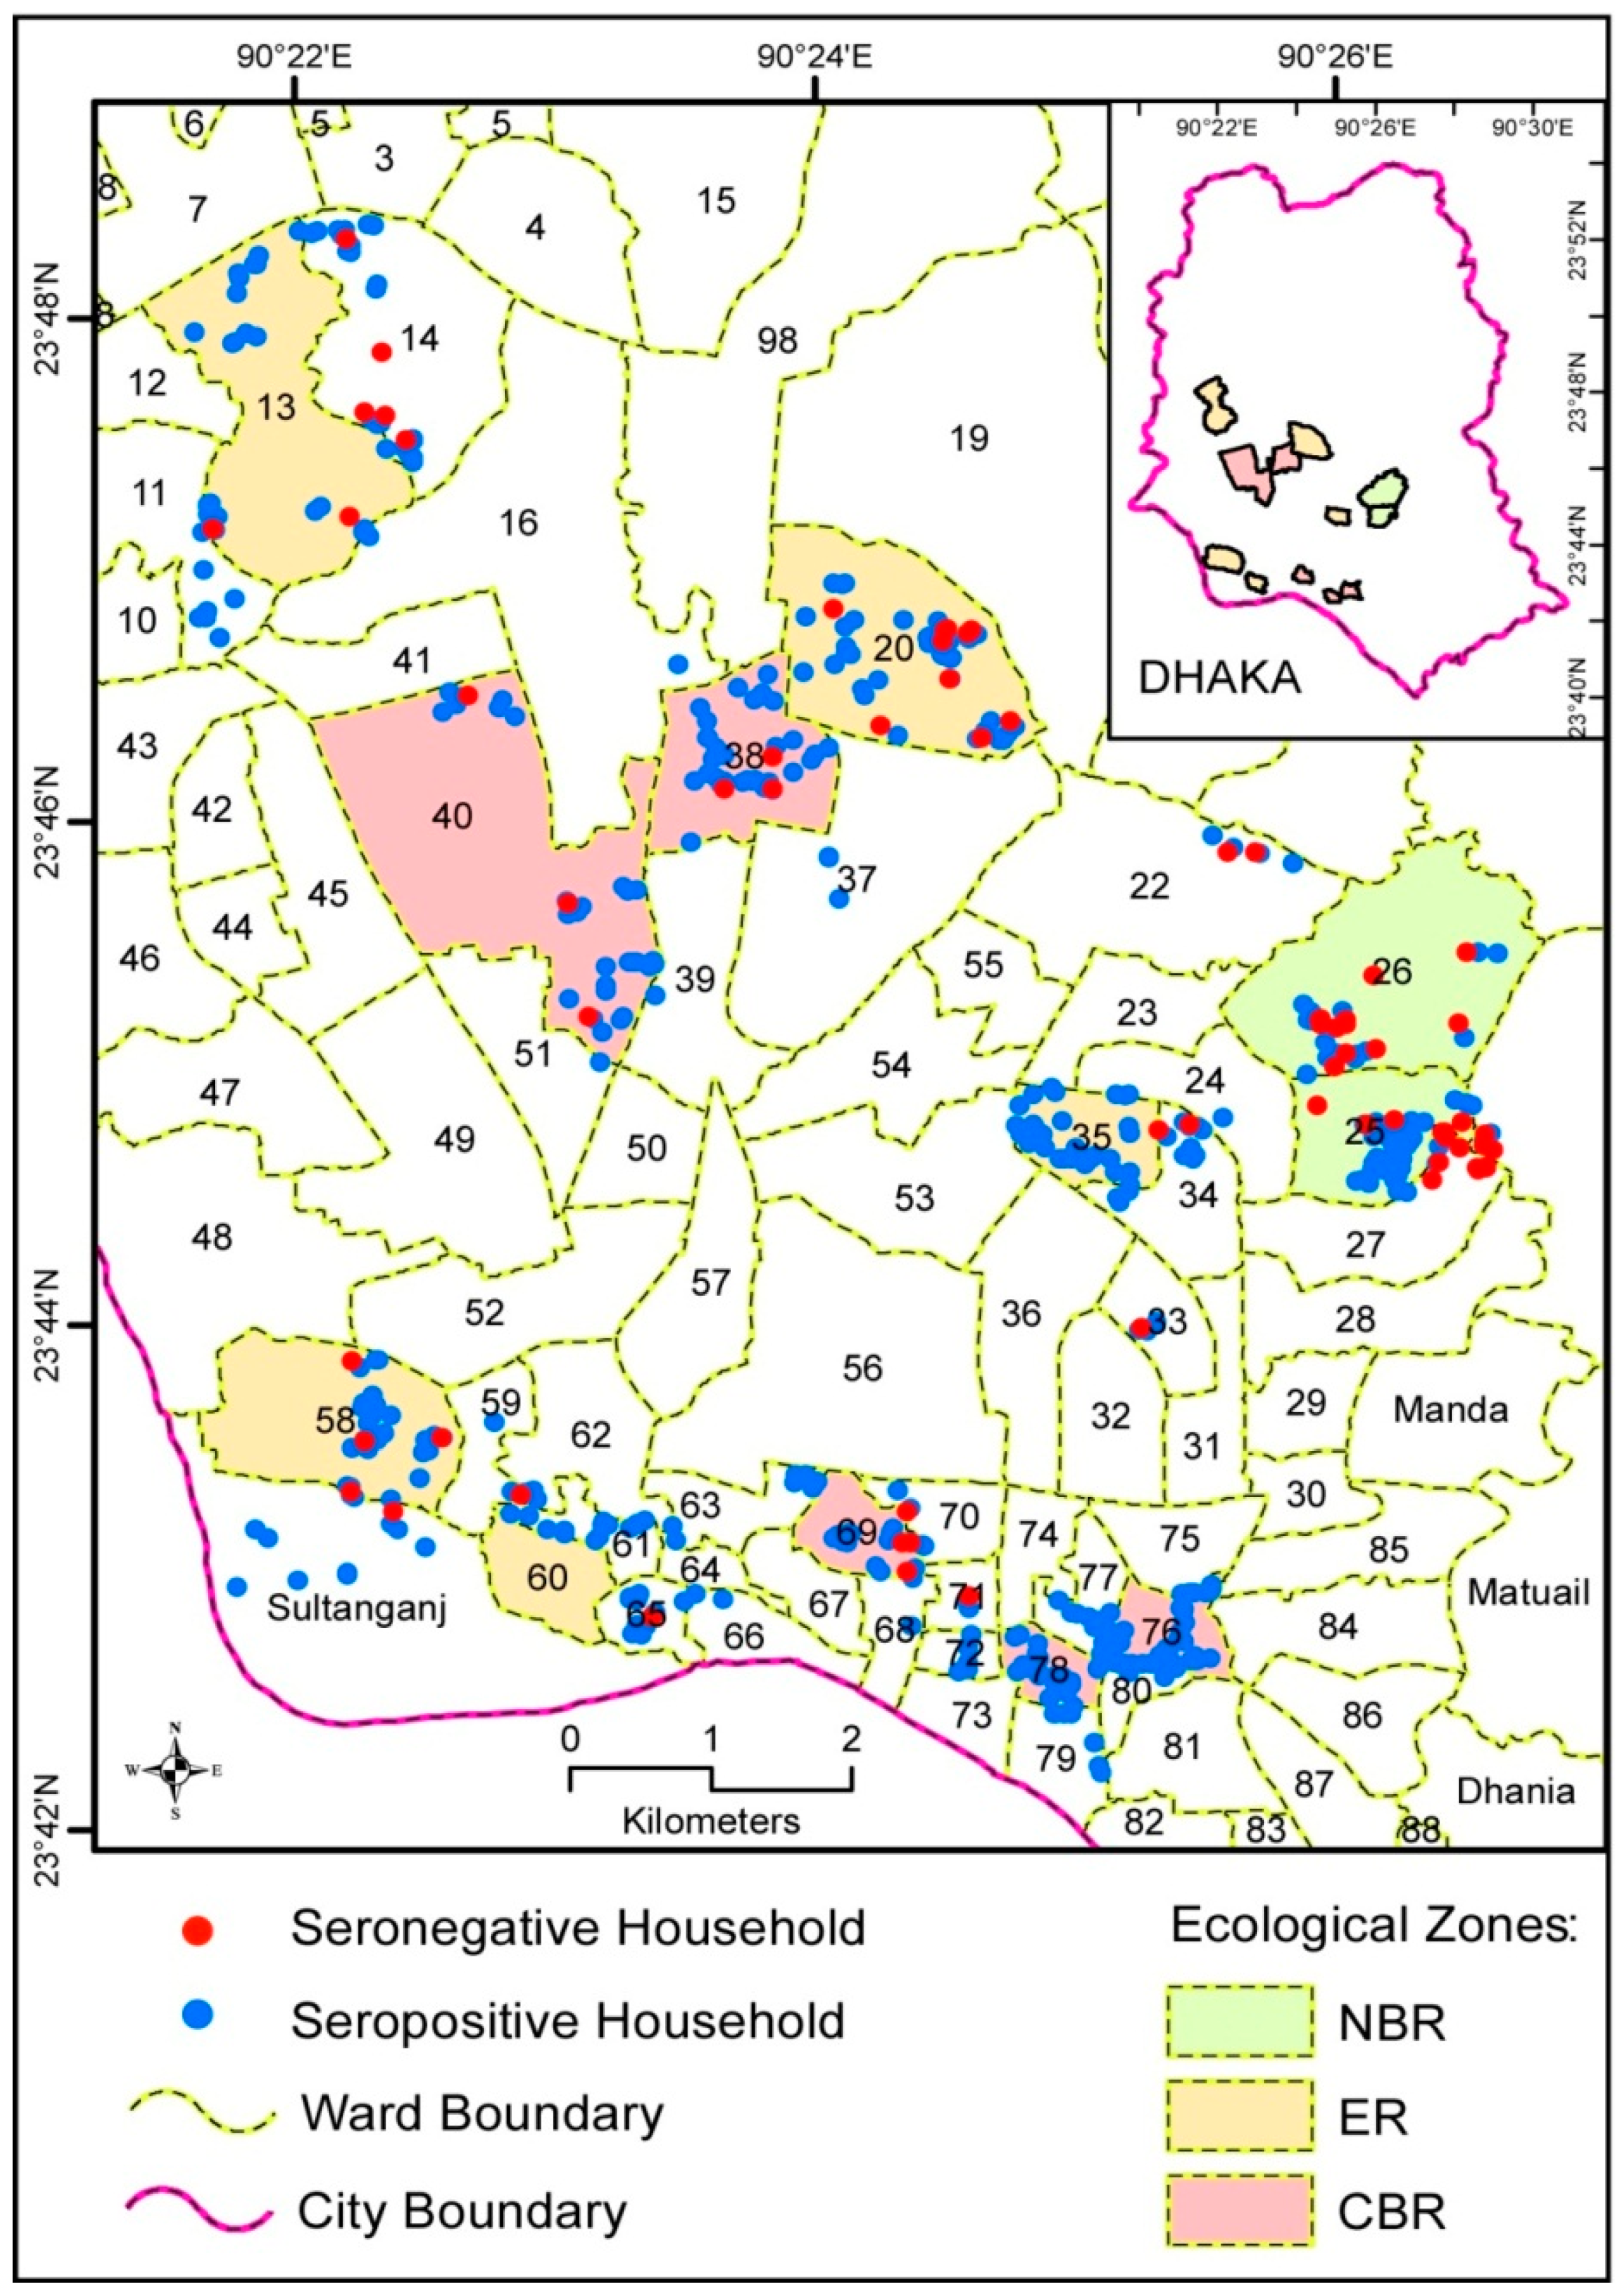
Spatial distribution of seropositive and seronegative household premises, 2012 (pre-monsoon). (Note: Total counts of dots in each ward may not sum up to total sample size of households in them because of overlap. The numbers inside each Ward boundaries represent City Ward number).
Figure 2.
Spatial distribution of seropositive and seronegative household premises, 2012 (pre-monsoon). (Note: Total counts of dots in each ward may not sum up to total sample size of households in them because of overlap. The numbers inside each Ward boundaries represent City Ward number).

Figure 3.
Distribution (count) of dengue seropositive and seronegative per age group by integrated urban ecological zone, 2012 (pre-monsoon).
Figure 3.
Distribution (count) of dengue seropositive and seronegative per age group by integrated urban ecological zone, 2012 (pre-monsoon).

Figure 4.
Spatial distribution of Aedes positive households (2012 monsoon) and households with seroconverted individuals, 2012 (post-monsoon). (Note: Total counts of dots in each ward may not sum up to total sample size of households in them because of overlap. The numbers inside each Ward boundaries represent City Ward number).


Table 1.
Distribution of Stegomyia indices with 95% Confidence Interval in different IUE zones.
| Integrated Urban Ecological (IUE) Zones | House Index (HI) (%) | 95% Confidence Interval | Conatiner Index (%) | 95% Confidence Interval (CI) | Breteau Index (BI) (%) | 95% Confidence Interval |
|---|---|---|---|---|---|---|
| Central Business Residential (CBR) | 28.4 | (0.24–0.33) | 29.9 | (0.25–0.35) | 34.2 | (0.29–0.39) |
| Established Residential (ER) | 22.0 | (0.18–0.26) | 22.6 | (0.18–0.27) | 25.5 | (0.21–0.30) |
| Newly Built Residential (NBR) | 22.2 | (0.16–0.28) | 22.5 | (0.16–0.29) | 23.3 | (0.17–0.30) |
Table 2.
Seroprevalence, seroconversion, and median age of sample based on 2012 pre-monsoon and post-monsoon serological survey results in the IUE zones, Dhaka, Bangladesh.
Table 2.
Seroprevalence, seroconversion, and median age of sample based on 2012 pre-monsoon and post-monsoon serological survey results in the IUE zones, Dhaka, Bangladesh.
| IUE Zone | Serum Sample (IgG) Surveys | Serum Sample (IgM) Surveys | |||||
|---|---|---|---|---|---|---|---|
| Pre-monsoon 2012 | Post-monsoon 2012 | Seroconversion paired sample (IgG) | Pre-monsoon 2012 | Post-monsoon 2012 | Seroconversion paired sample (IgM) | ||
| CBR | n | 466 | 448 | 29 | 466 | 448 | 29 |
| Positives | 378 | 397 | 15 | 8 | 30 | 16 | |
| Median age * | 43 (0.6–85) | 28 (3–76) | 34 (7–66) | 43 | 28 (3–76) | 34 (7–66) | |
| ER | n | 502 | 481 | 61 | 502 | 481 | 61 |
| Positives | 403 | 426 | 37 | 12 | 42 | 27 | |
| Median age * | 30 (2–80) | 28 (2–97) | 25 (2–78) | 30 (2–80) | 28 (2–97) | 25 (2–78) | |
| NBR | n | 157 | 139 | 5 | 157 | 139 | 5 |
| Positives | 118 | 119 | 1 | 3 | 16 | 4 | |
| Median age * | 28 (1–92) | 27 (2–92) | 30 (24–43) | 28 (1–92) | 27 (2–92) | 30 (24–43) | |
| Total | Positive/total | 899/1125 | 942/1068 | 38/95 | 23/1125 | 88/1068 | 0/95 |
* Median ages for IgG and IgM were identical due to same number of samples.
Table 3.
Individual risk factors odds ratio for seroprevalence in IUE zones, Dhaka, Bangladesh (2012 pre-monsoon).
Table 3.
Individual risk factors odds ratio for seroprevalence in IUE zones, Dhaka, Bangladesh (2012 pre-monsoon).
| Risk Factor | CBR | ER | NBR | |||||||
|---|---|---|---|---|---|---|---|---|---|---|
| n | OR | p-Value | n | OR | p-Value | n | OR | p-Value | ||
| Sex | Male | 171 | 1 | 178 | 1 | 48 | 1 | |||
| Female | 226 | 1.07 | 0.8 | 215 | 1.37 | 0.16 | 60 | 0.98 | 0.96 | |
| Age (in years) | 0–11 | 41 | 1 | 19 | 1 | 5 | 1 | |||
| 12–34 | 199 | 0.4 | 0.83 | 197 | 0.22 | 0.22 | 66 | 0.24 | 0.56 | |
| ≥35 | 157 | 0.14 | <0.0001 * | 177 | 0.09 | <0.0001 * | 37 | 0.09 | 0.001 * | |
| Febrile illness during last 6 months | No | 1945 | 1 | 213 | 1 | 64 | 1 | |||
| Yes | 203 | 1.27 | 0.35 | 180 | 1.38 | 0.15 | 44 | 1.18 | 0.63 | |
| Travel during last 6 months | No | 111 | 1 | 348 | 1 | 4 | 1 | |||
| Yes | 286 | 0.85 | 0.55 | 45 | 3.30 | 0.03 * | 104 | 0.59 | 0.50 | |
* Significant at p < 0.05 level.
Table 4.
Binary logistic regression results concerning association between selected microhabitat and behavioral factors and seroconversion, 2012 surveys, Dhaka, Bangladesh.
Table 4.
Binary logistic regression results concerning association between selected microhabitat and behavioral factors and seroconversion, 2012 surveys, Dhaka, Bangladesh.
| Variables | Adjusted Risk Ratio | p-Value |
|---|---|---|
| Have indoor potted plants (have no potted plants vs. have potted plants) | 0.86 (0.76–0.98) | 0.020 * |
| Attendance in public/mass gathering (no attendance vs. attendance) | 8.69 (1.80–4.2) | 0.007 * |
| Travel during the last 6 months (no vs. yes) | 2.49 (0.91–6.85) | 0.077 |
| Febrile illness during the last 6 months (no vs. yes) | 0.34 (0.11–1.01) | 0.052 |
* Significant at p < 0.05 level.
Disclaimer/Publisher’s Note: The statements, opinions and data contained in all publications are solely those of the individual author(s) and contributor(s) and not of MDPI and/or the editor(s). MDPI and/or the editor(s) disclaim responsibility for any injury to people or property resulting from any ideas, methods, instructions or products referred to in the content. |
© 2023 by the authors. Licensee MDPI, Basel, Switzerland. This article is an open access article distributed under the terms and conditions of the Creative Commons Attribution (CC BY) license (https://creativecommons.org/licenses/by/4.0/).
Share and Cite
MDPI and ACS Style
Haque, C.E.; Dhar-Chowdhury, P.; Hossain, S.; Walker, D. Spatial Evaluation of Dengue Transmission and Vector Abundance in the City of Dhaka, Bangladesh. Geographies 2023, 3, 268-285. https://doi.org/10.3390/geographies3020014
AMA Style
Haque CE, Dhar-Chowdhury P, Hossain S, Walker D. Spatial Evaluation of Dengue Transmission and Vector Abundance in the City of Dhaka, Bangladesh. Geographies. 2023; 3(2):268-285. https://doi.org/10.3390/geographies3020014
Chicago/Turabian StyleHaque, C. Emdad, Parnali Dhar-Chowdhury, Shakhawat Hossain, and David Walker. 2023. "Spatial Evaluation of Dengue Transmission and Vector Abundance in the City of Dhaka, Bangladesh" Geographies 3, no. 2: 268-285. https://doi.org/10.3390/geographies3020014