
Net-Zero Target and Emissions from Land Conversions: A Case Study of Maryland’s Climate Solutions Now Act

 , , ,
, , ,  , and
, and
Abstract
:1. Introduction
The Relevance of Soils to Maryland’s Greenhouse Gas Emissions Reduction Act
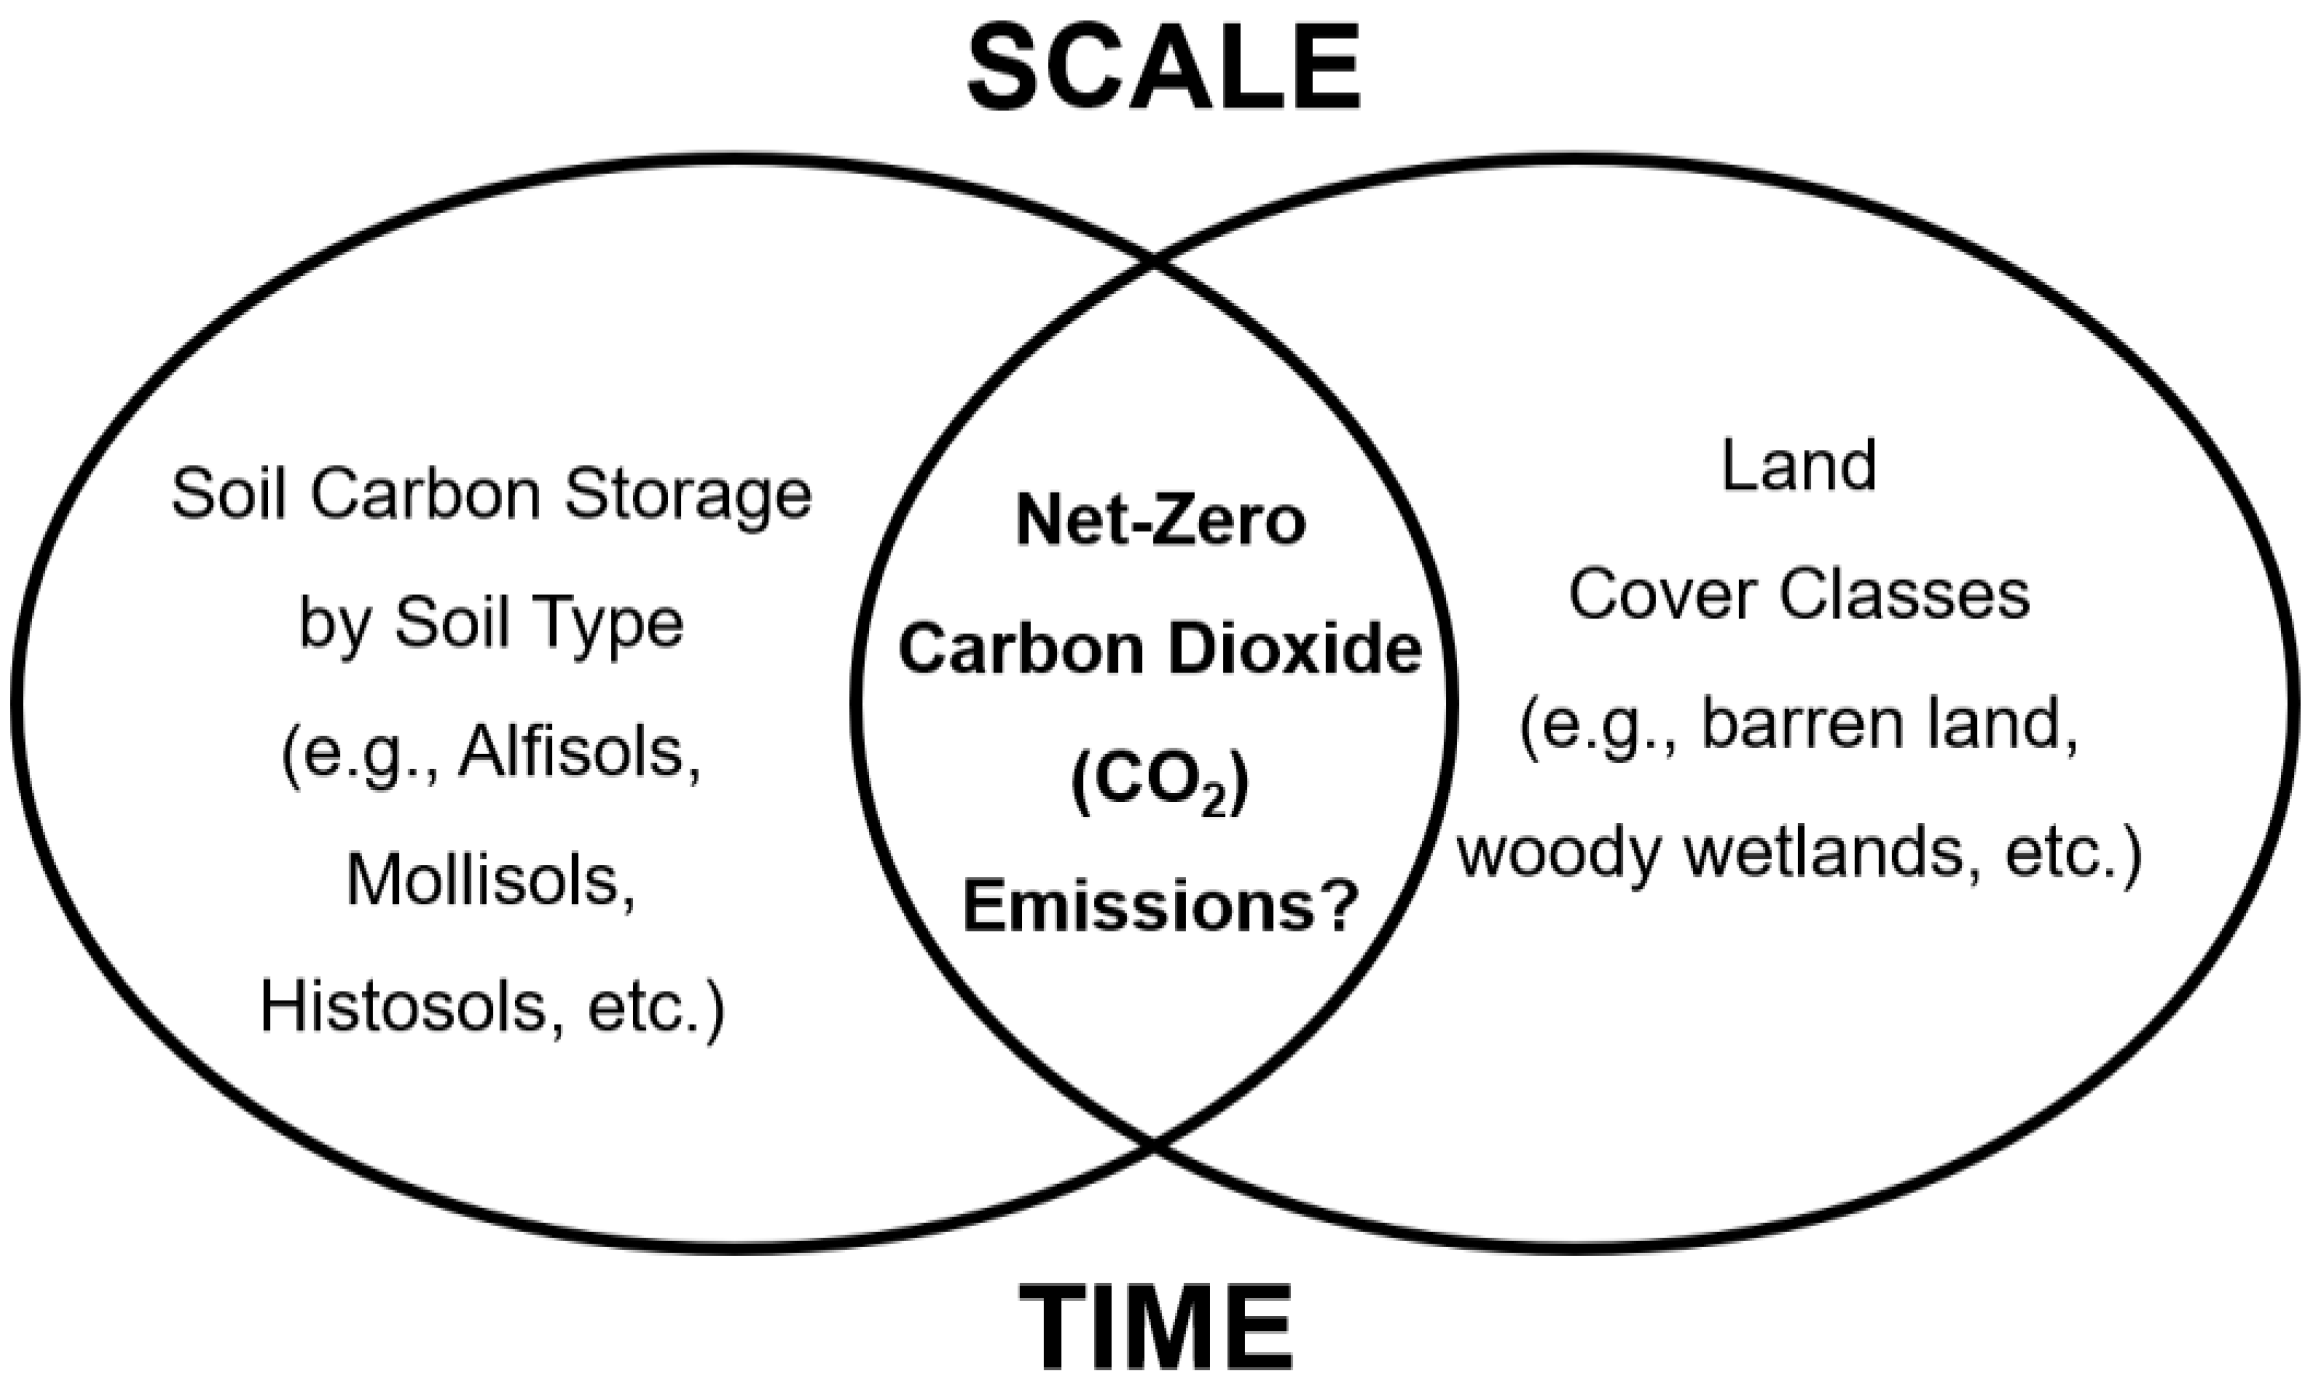
2. Materials and Methods
3. Results and Discussion
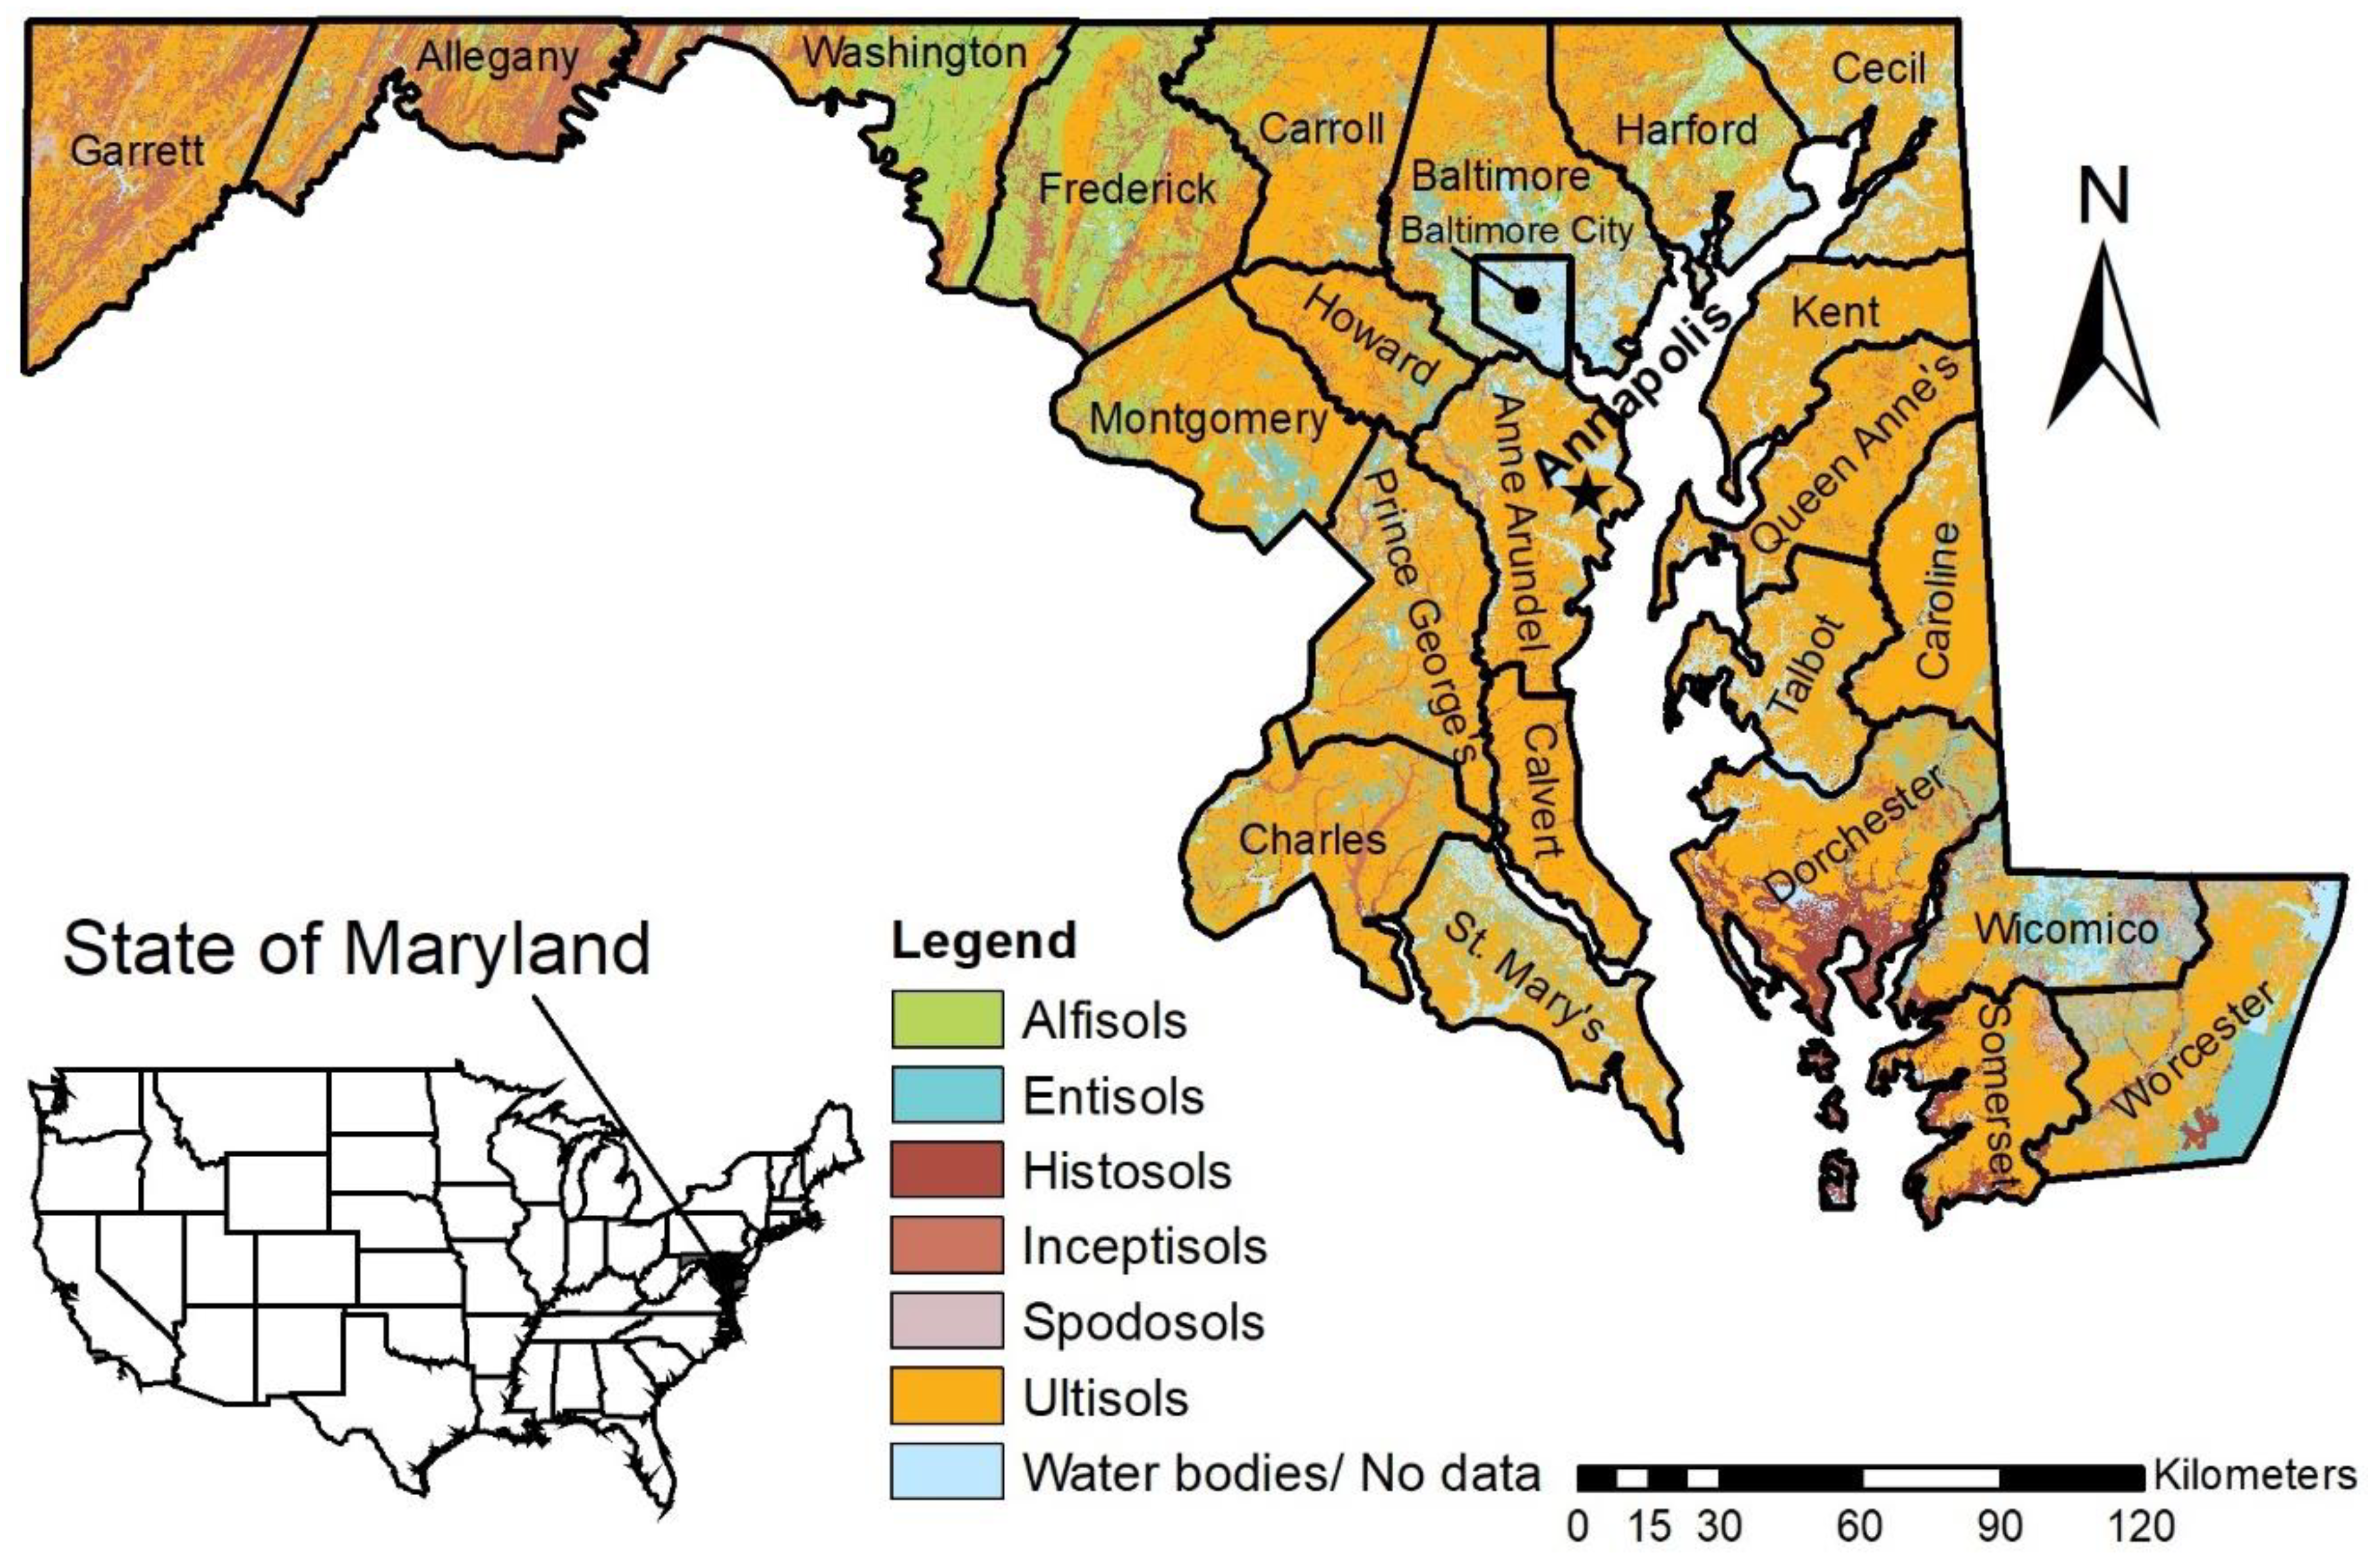
3.1. Soil Organic Carbon (SOC) Storage and Value in Maryland
3.2. Soil Inorganic Carbon (SIC) Storage and Value in Maryland
3.3. Total Soil Carbon (TSC = SOC + SIC) Storage and Value in Maryland
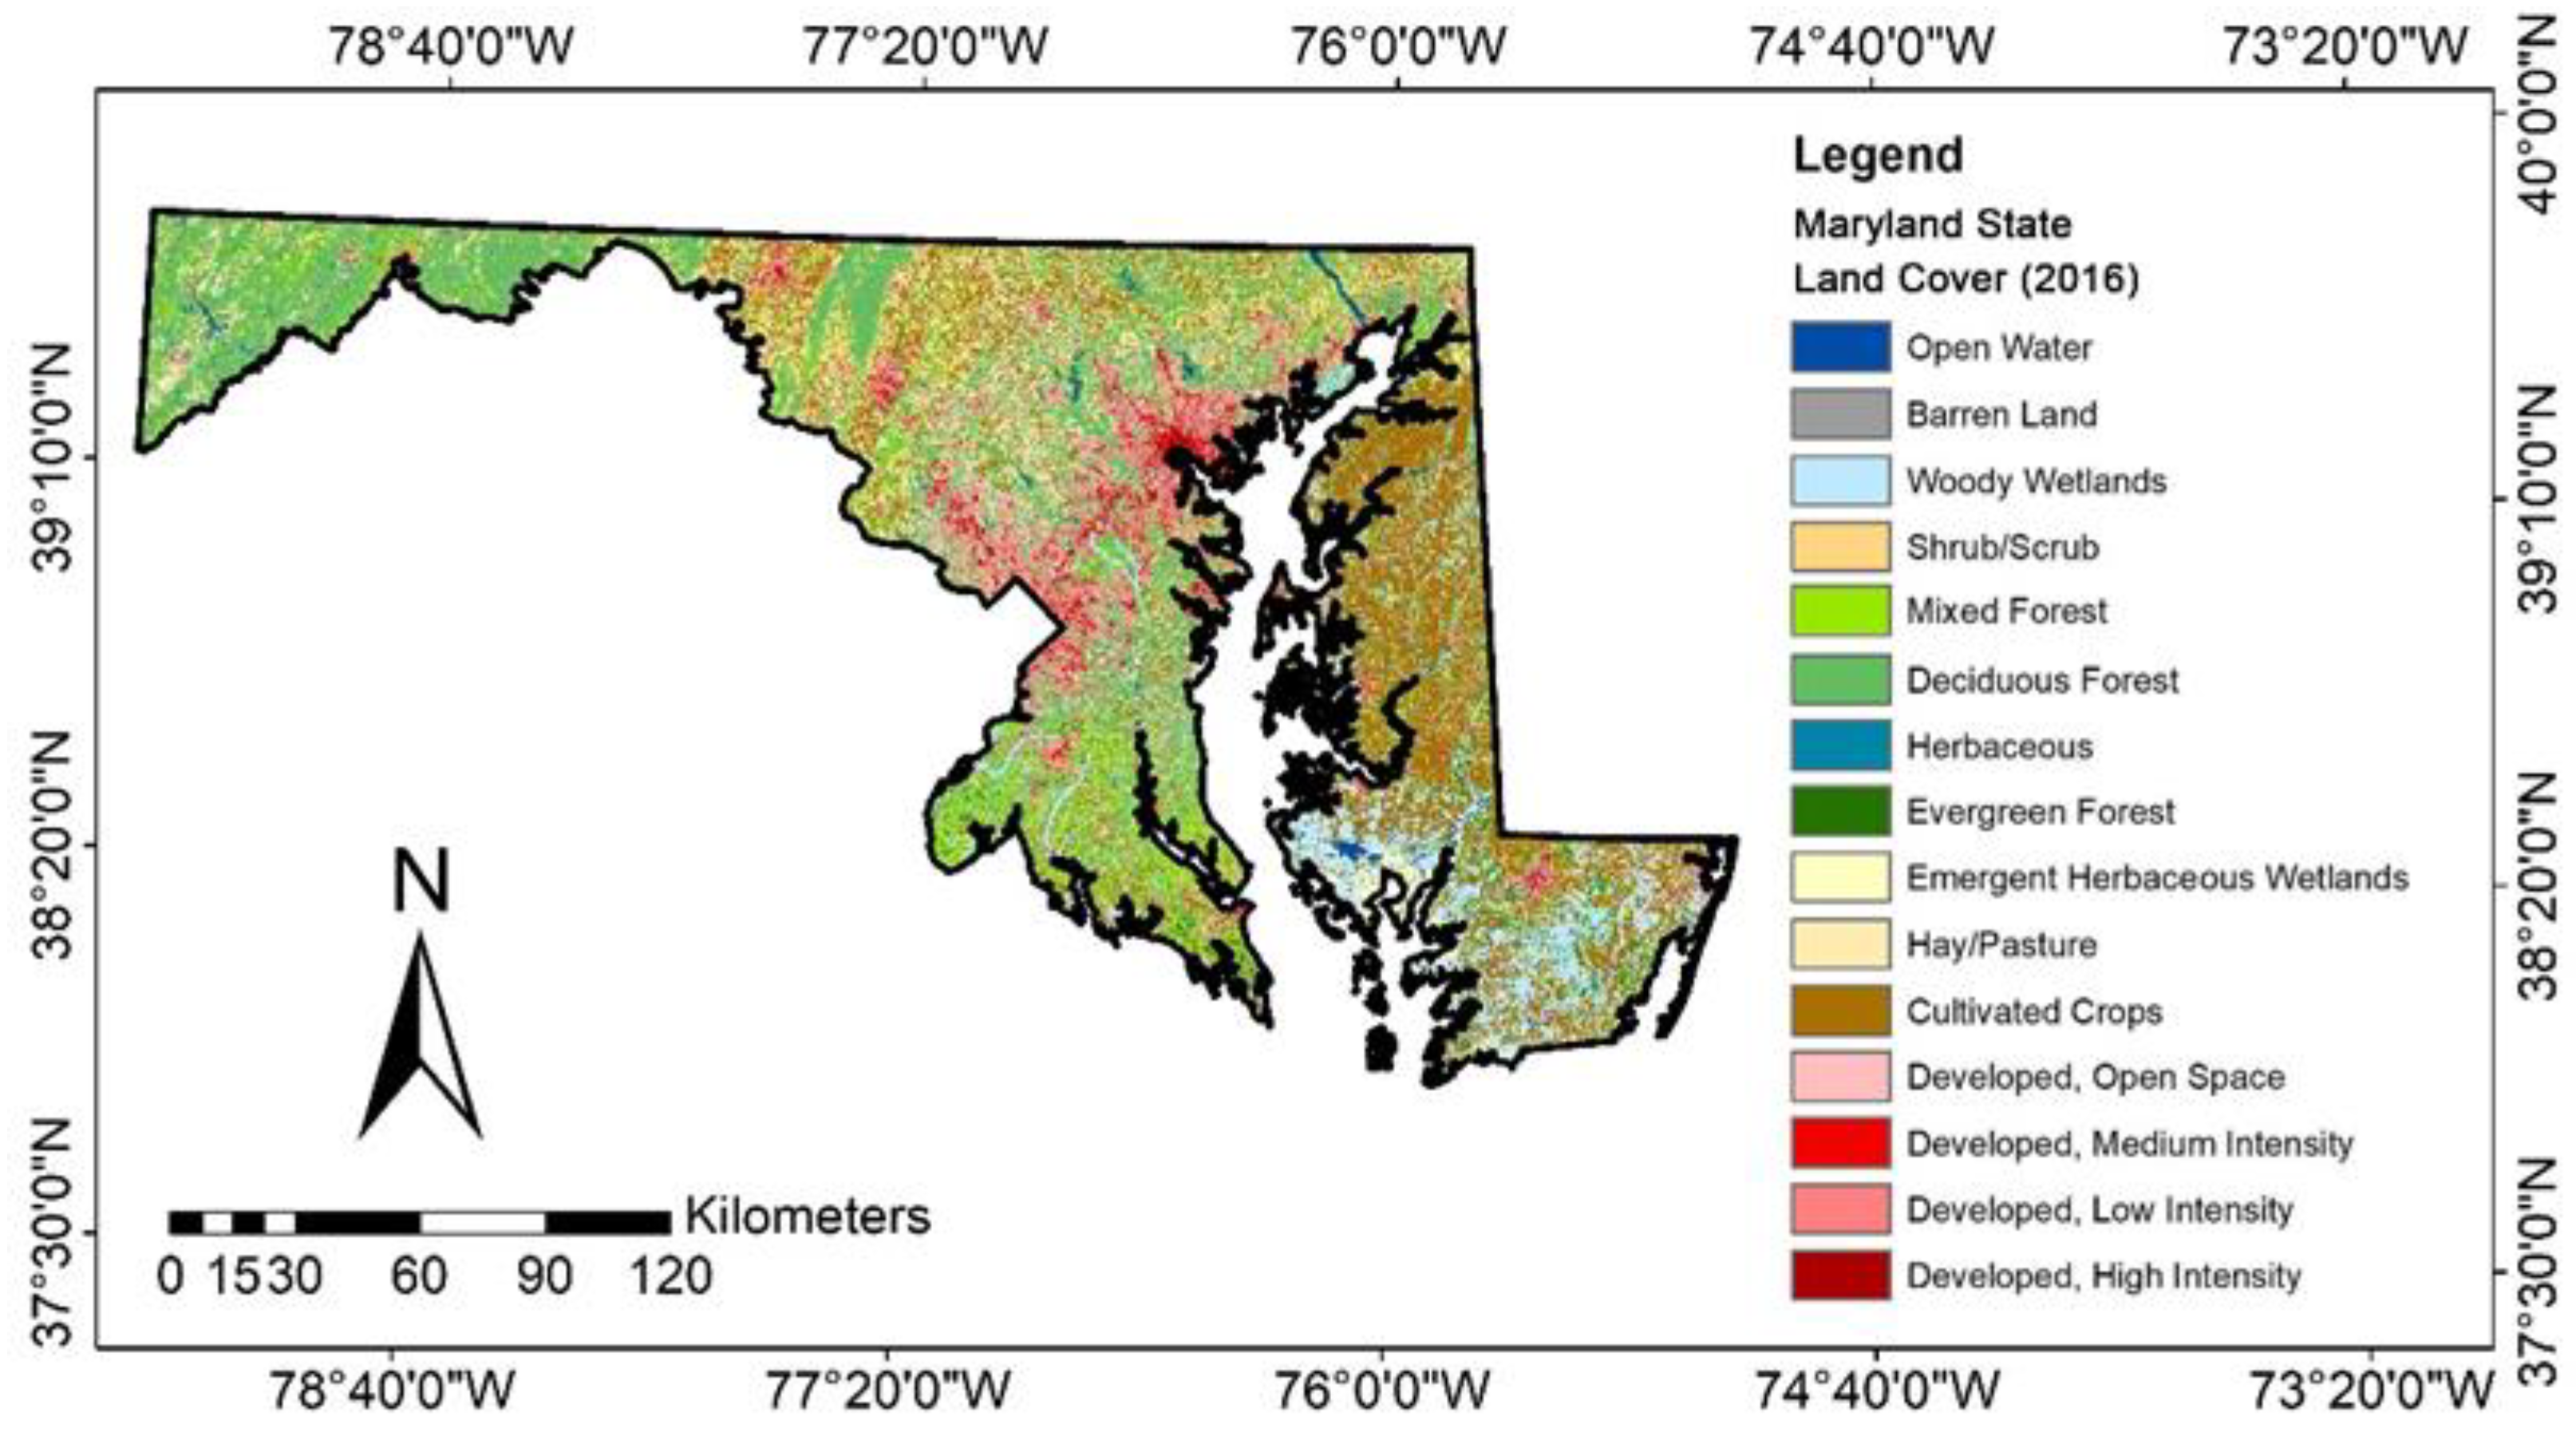
3.4. Land Development Change for Maryland between 2001 and 2016
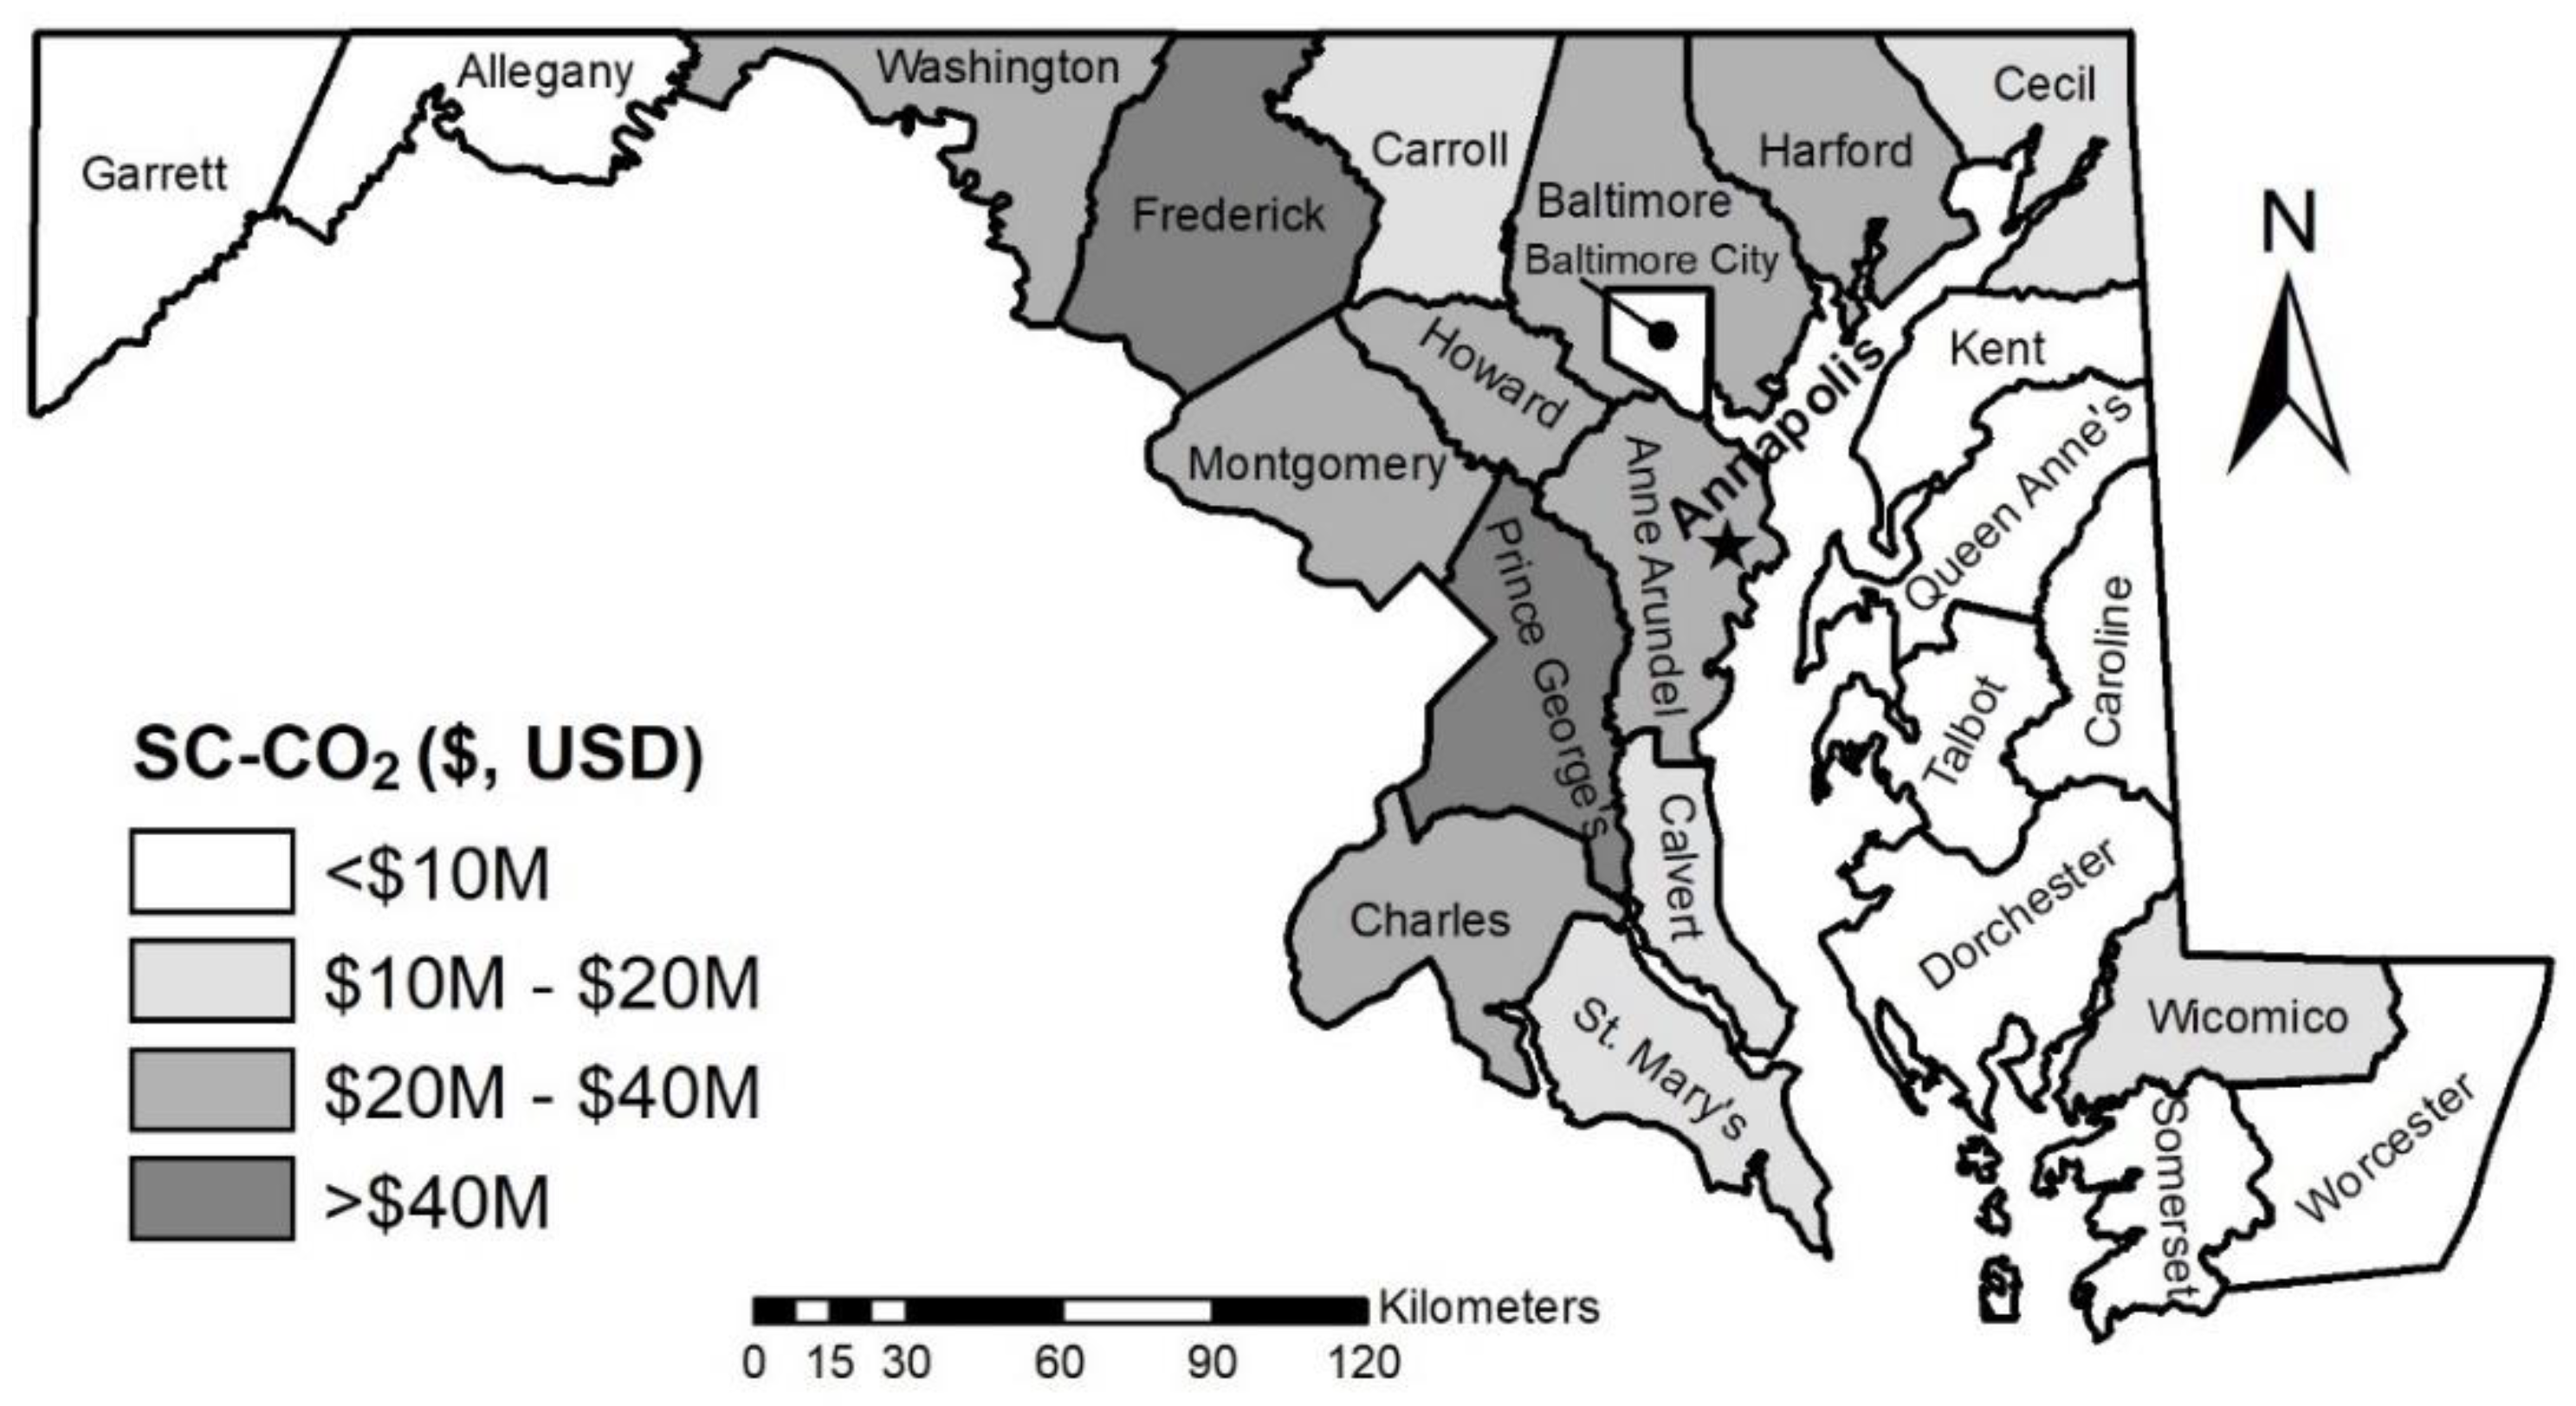
3.5. Significance of Results for Maryland’s Climate Solutions Now Act
3.6. Importance of Results
3.6.1. The Role of Net-Zero Goals in Addressing Climate Change
3.6.2. The Legal Aspects of the Net-Zero Goals
4. Conclusions
Supplementary Materials
Author Contributions
Funding
Data Availability Statement
Acknowledgments
Conflicts of Interest
Glossary
| CF | Carbon footprint |
| ED | Ecosystem disservices |
| ES | Ecosystem services |
| EPA | Environmental Protection Agency |
| SC-CO2 | Social cost of carbon emissions |
| SDGs | Sustainable Development Goals |
| SOC | Soil organic carbon |
| SIC | Soil inorganic carbon |
| SOM | Soil organic matter |
| SSURGO | Soil Survey Geographic Database |
| STATSGO | State Soil Geographic Database |
| TSC | Total soil carbon |
| USDA | United States Department of Agriculture |
References
- Fankhauser, S.; Smith, S.M.; Allen, M.; Axelsson, K.; Hale, T.; Hepburn, C.; Kendall, J.M.; Radhika Khosla, R.; Lezaun, J.; Mitchell-Larson, E.; et al. The meaning of net-zero and how to get it right. Nat. Clim. Change 2022, 12, 15–21. [Google Scholar] [CrossRef]
- Loveday, J.; Morrison, G.M.; Martin, D.A. Identifying knowledge and process gaps from a systematic literature review of net-zero definitions. Sustainability 2022, 14, 3057. [Google Scholar] [CrossRef]
- Organisation for Economic Co-operation and Development (OECD). Understanding Countries’ Net-Zero Emissions Targets. 2021. Available online: https://www.oecd.org/environment/understanding-countries-net-zero-emissions-targets-8d25a20c-en.htm (accessed on 27 October 2022).
- Mikhailova, E.A.; Lin, L.; Hao, Z.; Zurqani, H.A.; Post, C.J.; Schlautman, M.A.; Post, G.C. Contribution of land cover conversions to Connecticut (USA) carbon footprint. Geographies 2022, 2, 286–302. [Google Scholar] [CrossRef]
- Rogelj, J.; Geden, O.; Cowie, A.; Reisinger, A. Three ways to improve net-zero emissions targets. Nature 2021, 591, 365–368. [Google Scholar] [CrossRef]
- Maryland Senate Bill 528. Climate Solutions Now Act of 2022. Available online: https://mgaleg.maryland.gov/2022RS/bills/sb/sb0528E.pdf (accessed on 1 September 2022).
- Mikhailova, E.A.; Zurqani, H.A.; Post, C.J.; Schlautman, M.A.; Post, C.J. Soil diversity (pedodiversity) and ecosystem services. Land 2021, 10, 288. [Google Scholar] [CrossRef]
- USDA/NRCS. Sassafras—Maryland State Soil. Available online: https://stmarysscd.com/wp-content/uploads/2015/02/md_soil.pdf (accessed on 1 September 2022).
- Soil Survey Staff. n.d.a. Natural Resources Conservation Service, United States Department of Agriculture. Soil Survey Geographic 548 (SSURGO) Database. Available online: https://nrcs.app.box.com/v/soils (accessed on 10 September 2022).
- The United States Census Bureau. TIGER/Line Boundary Shapefiles. 2018. Available online: https://www.census.gov/geographies/mapping-files/time-series/geo/tiger-line-file.2018.html (accessed on 10 September 2022).
- U.S. Bureau of the Census. Statistical Abstract of the United States. 1991; p. 201. Available online: https://www.census.gov/library/publications/1991/compendia/statab/111ed.html (accessed on 10 December 2022).
- Aighewi, I.T.; Nosakhare, O.K.; Ishaque, A.B. Land use-land cover changes and sewage loading in the lower eastern shore watersheds and coastal bays of Maryland: Implications for surface water quality. J. Coast. Res. 2013, 29, 1073–1082. [Google Scholar] [CrossRef]
- Sexton, J.O.; Song, X.; Huang, C.; Channan, S.; Baker, M.E.; Townshend, J.R. Urban growth of the Washington, D.C.-Baltimore, MD metropolitan region from 1984 to 2010 by annual, Landsat-based estimates of impervious cover. Remote Sens. Environ. 2013, 129, 42–53. [Google Scholar] [CrossRef]
- EPA (United States Environmental Protection Agency). The Social Cost of Carbon. EPA Fact Sheet. 2016. Available online: https://19january2017snapshot.epa.gov/climatechange/social-cost-carbon_.html (accessed on 15 August 2022).
- Guo, Y.; Amundson, R.; Gong, P.; Yu, Q. Quantity and spatial variability of soil carbon in the conterminous United States. Soil Sci. Soc. Am. J. 2006, 70, 590–600. [Google Scholar] [CrossRef] [Green Version]
- Groshans, G.R.; Mikhailova, E.A.; Post, C.J.; Schlautman, M.A.; Zhang, L. Determining the value of soil inorganic carbon stocks in the contiguous United States based on the avoided social cost of carbon emissions. Resources 2019, 8, 119. [Google Scholar] [CrossRef] [Green Version]
- Multi-Resolution Land Characteristics Consortium (MRLC). Available online: https://www.mrlc.gov/ (accessed on 1 March 2022).
- ESRI (Environmental Systems Research Institute). ArcGIS Pro 2.6. Available online: https://pro.arcgis.com/en/pro-app/2.6/get-started/whats-new-in-arcgis-pro.htm (accessed on 1 March 2022).
- Mikhailova, E.A.; Groshans, G.R.; Post, C.J.; Schlautman, M.A.; Post, C.J. Valuation of total soil carbon stocks in the contiguous United States based on the avoided social cost of carbon emissions. Resources 2019, 8, 157. [Google Scholar] [CrossRef]
- Mikhailova, E.A.; Groshans, G.R.; Post, C.J.; Schlautman, M.A.; Post, G.C. Valuation of soil organic carbon stocks in the contiguous United States based on the avoided social cost of carbon emissions. Resources 2019, 8, 153. [Google Scholar] [CrossRef] [Green Version]
- Soil Survey Staff. Natural Resources Conservation Service, United States Department of Agriculture. Photos of Soil Orders. Available online: https://www.nrcs.usda.gov/resources/education-and-teaching-materials/the-twelve-orders-of-soil-taxonomy (accessed on 20 September 2022).
- Petrie, M.D.; Collins, S.L.; Swann, A.M.; Ford, P.L.; Litvak, M.E. Grassland to shrubland state transitions enhance carbon sequestration in the northern Chihuahuan Desert. Glob. Change Biol. 2014, 21, 1226–1235. [Google Scholar] [CrossRef]
- National Oceanic and Atmospheric Administration (NOAA). Climate.gov. Available online: https://www.climate.gov/maps-data (accessed on 2 October 2022).
- Net-zero Tracker. 2022. Available online: https://zerotracker.net/ (accessed on 19 October 2022).
- Nugent, C. The World’s Top Carbon Emitters Now All Have Net-Zero Pledges. Most of Them Are Too Vague. Time 2021. Available online: https://time.com/6113845/net-zero-climate-pledge-impact/ (accessed on 27 October 2022).
- National Caucus of Environmental Legislators (NCEL), Maryland Passes the Climate Solutions Now Act. 11 April 2022. Available online: https://www.ncelenviro.org/articles/maryland-passes-the-climate-solutions-now-act/ (accessed on 27 October 2022).
- Neumann, J. Climate Solutions Now Act: What’s in the New Law? Environment Maryland. 19 April 2022. Available online: https://environmentamerica.org/maryland/articles/climate-solutions-now-act-whats-new-law/ (accessed on 27 October 2022).
- Powell, M. The Climate Solutions Now Act of 2022, Gordon-Feinblatt Legal Bulletins. 4 April 2022. Available online: https://www.gfrlaw.com/what-we-do/insights/climate-solutions-now-act-2022 (accessed on 27 October 2022).
- Harford, T. Climate Change and the Prisoner’s Dilemma, Financial Times. 24 January 2020. Available online: https://www.ft.com/content/5312691c-3d3c-11ea-b232-000f4477fbca (accessed on 27 October 2022).
- Bearak, M. Climate Pledges Are Falling Short, and a Chaotic Future Looks More Like Reality, New York Times. 26 October 2022. Available online: https://www.nytimes.com/2022/10/26/climate/un-climate-pledges-warming.html (accessed on 27 October 2022).
- Da Silva, C. World ‘Nowhere Near’ Hitting Climate Targets, U.N. Warns, NBC News. 26 October 2022. Available online: https://www.nbcnews.com/news/world/world-emissions-paris-climate-targets-un-report-rcna54044 (accessed on 27 October 2022).
- Weston, P.; Greenfield, P. The World Made a Biodiversity Pact, and of Course We Aren’t Part of It. Mother Jones 2022. Available online: https://www.motherjones.com/politics/2022/12/cop15-2022-un-biodiversity-convention-united-states/ (accessed on 12 December 2022).
- The White House. Executive Order on Tackling the Climate Crisis at Home and Abroad. 27 January 2021. Available online: https://www.whitehouse.gov/briefing-room/presidential-actions/2021/01/27/executive-order-on-tackling-the-climate-crisis-at-home-and-abroad/ (accessed on 12 December 2022).
- U.S. Department of the Interior. Fact Sheet: President Biden to Take Action to Uphold Commitment to Restore Balance on Public Lands and Waters, Invest in Clean Energy Future. 2021. Available online: https://www.doi.gov/pressreleases/fact-sheet-president-biden-take-action-uphold-commitment-restore-balance-public-lands (accessed on 12 December 2022).


| Stocks | Area | Ecosystem Services | |
|---|---|---|---|
| Soil Order | General Characteristics and Constraints | (km2) | |
| Slightly Weathered | 5160.1 | ||
| Entisols | Embryonic soils with ochric epipedon | 1524.0 | + |
| Inceptisols | Young soils with ochric or umbric epipedon | 3357.9 | + |
| Histosols | Organic soils with ≥20% of organic carbon | 278.2 | + |
| Moderately Weathered | 2829.8 | ||
| Alfisols | Clay-enriched B horizon with B.S. ≥35% | 2829.8 | + |
| Strongly Weathered | 14,701.3 | ||
| Spodosols | Coarse-textured soils with albic and spodic horizons | 242.6 | + |
| Ultisols | Highly leached soils with B.S. <35% | 14,458.6 | + |
| OWNERSHIP (e.g., single, shared, government, foreign, private, etc.) | |||||
| Timeline (e.g., information disclosures, etc.) | STOCKS/SOURCE ATTRIBUTION | FLOWS | VALUE | ||
| Science-Based Biophysical Stocks | Boundary-Based Administrative Stocks | Monetary Accounts | Benefits/ Damages | Total Values | |
| Soil extents: | Administrative extents: | Ecosystem good(s) and service(s): | Sector: | Type of value: | |
| Total stock: Total soil carbon (TSC) = Soil inorganic carbon (SIC) + Soil organic carbon (SOC) | |||||
| Past (e.g., after land development disclosure) Current (e.g., status) Future (e.g., before land development disclosure) | Environment: | The social cost of carbon (SC-CO2) emissions: | |||
| - Soil orders (Entisols, Inceptisols, Histosols, Alfisols, Spodosols, Ultisols) | - State (Maryland) - County (23 counties) | - Regulation (e.g., carbon release, carbon sequestration) | - Carbon sequestration, Carbon loss | - $46 per metric ton of CO2 applicable for the year 2025 (2007 U.S. dollars, with an average discount rate of 3% [14]) | |
| Carbon Footprint Change: Net-zero carbon dioxide (CO2) emissions? | |||||
| Carbon Footprint Change: Net-zero social costs from carbon dioxide (CO2) emissions ($)? | |||||
| County/City | Total Soil Area (km2) (%) | Degree of Weathering and Soil Development | |||||
|---|---|---|---|---|---|---|---|
| Slight | Moderate | Strong | |||||
| Entisols | Inceptisols | Histosols | Alfisols | Spodosols | Ultisols | ||
| 2016 Area (km2), (% of Total County Area) | |||||||
| Allegany | 1028.3 (5) | 51.8 (5) | 551.6 (54) | 0 | 95.4 (9) | 0 | 329.6 (32) |
| Anne Arundel | 883.6 (4) | 39.5 (4) | 92.3 (10) | 6.8 (1) | 40.2 (5) | 0 | 704.6 (80) |
| Baltimore City | 111.9 (0) | 25.7 (23) | 7.0 (6) | 0 (0) | 29.3 (26) | 0 | 49.8 (45) |
| Baltimore | 1313.1 (6) | 183.0 (14) | 167.7 (13) | 6.9 (1) | 136.5 (10) | 0 | 819.0 (62) |
| Calvert | 546.0 (2) | 43.0 (8) | 235.9 (43) | 11.2 (2) | 5.4 (1) | 0 | 250.6 (46) |
| Caroline | 632.5 (3) | 50.8 (8) | 20.8 (3) | 3.2 (1) | 3.1 (0) | 0 | 554.5 (88) |
| Carroll | 1109.4 (5) | 33.2 (3) | 115.0 (10) | 0 | 172.3 (16) | 0 | 788.9 (71) |
| Cecil | 712.6 (3) | 46.1 (6) | 28.3 (4) | 0 | 49.9 (7) | 0 | 588.3 (83) |
| Charles | 1174.6 (5) | 88.7 (8) | 123.8 (11) | 0 | 38.8 (3) | 0 | 923.3 (79) |
| Dorchester | 1365.4 (6) | 119.7 (9) | 52.0 (4) | 132.1 (10) | 232.1 (17) | 0 | 829.6 (61) |
| Frederick | 1621.8 (7) | 16.2 (1) | 273.0 (17) | 0 | 833.6 (51) | 3.9 (0) | 495.1 (31) |
| Garrett | 1660.7 (7) | 37.1 (2) | 551.7 (33) | 0 | 93.6 (6) | 53.0 (3) | 925.3 (56) |
| Harford | 939.6 (4) | 4.5 (0) | 270.1 (29) | 20.7 (2) | 131.7 (14) | 0 | 512.6 (55) |
| Howard | 564.8 (2) | 33.2 (6) | 123.1 (22) | 0 | 16.8 (3) | 0 | 391.7 (69) |
| Kent | 654.5 (3) | 35.8 (5) | 0.2 (0) | 8.4 (1) | 0 | 0 | 610.1 (93) |
| Montgomery | 1260.0 (6) | 63.7 (5) | 143.5 (11) | 0 | 82.5 (7) | 0 | 970.2 (77) |
| Prince George’s | 1067.8 (5) | 118.3 (11) | 115.9 (11) | 0 | 4.5 (0) | 0 | 829.1 (78) |
| Queen Anne’s | 946.7 (4) | 49.2 (5) | 75.2 (8) | 7.1 (1) | 6.7 (1) | 0 | 808.5 (85) |
| Somerset | 733.8 (3) | 49.3 (7) | 1.3 (0) | 9.0 (1) | 157.9 (22) | 24.4 (3) | 491.9 (67) |
| St. Mary’s | 746.7 (3) | 43.7 (6) | 54.9 (7) | 0 | 0 | 0 | 648.0 (87) |
| Talbot | 494.2 (2) | 3.5 (1) | 0 | 6.5 (1) | 11.5 (2) | 0 | 472.7 (96) |
| Washington | 1119.8 (5) | 17.5 (2) | 178.9 (16) | 0 | 644.8 (58) | 0.2 (0) | 278.5 (25) |
| Wicomico | 825.5 (4) | 140.6 (17) | 175.5 (21) | 9.4 (1) | 43.3 (5) | 28.5 (3) | 428.2 (52) |
| Worcester | 1177.9 (5) | 229.9 (20) | 0.2 (0) | 56.8 (5) | 95.4 (0) | 132.7 (11) | 758.4 (64) |
| Totals | 22,691.2(100) | 1524.0(7) | 3357.9(15) | 278.2(1) | 2829.8(12) | 242.6(1) | 14,458.6(64) |
| Soil Order | SOC Content | SIC Content | TSC Content | SOC Value | SIC Value | TSC Value |
|---|---|---|---|---|---|---|
| Minimum—Midpoint—Maximum Values | Midpoint Values | |||||
| (kg m−2) | (kg m−2) | (kg m−2) | ($ m−2) | ($ m−2) | ($ m−2) | |
| Slightly Weathered | ||||||
| Entisols | 1.8—8.0—15.8 | 1.9—4.8—8.4 | 3.7—12.8—24.2 | 1.35 | 0.82 | 2.17 |
| Inceptisols | 2.8—8.9—17.4 | 2.5—5.1—8.4 | 5.3—14.0—25.8 | 1.50 | 0.86 | 2.36 |
| Histosols | 63.9—140.1—243.9 | 0.6—2.4—5.0 | 64.5—142.5—248.9 | 23.62 | 0.41 | 24.03 |
| Moderately Weathered | ||||||
| Alfisols | 2.3—7.5—14.1 | 1.3—4.3—8.1 | 3.6—11.8—22.2 | 1.27 | 0.72 | 1.99 |
| Strongly Weathered | ||||||
| Spodosols | 2.9—12.3—25.5 | 0.2—0.6—1.1 | 3.1—12.9—26.6 | 2.07 | 0.10 | 2.17 |
| Ultisols | 1.9—7.1—13.9 | 0.0—0.0—0.0 | 1.9—7.1—13.9 | 1.20 | 0.00 | 1.20 |
| Soil Regulating Ecosystem Services in the State of Maryland | |||||
|---|---|---|---|---|---|
| Degree of Weathering and Soil Development | |||||
| Slight 23% | Moderate 12% | Strong 65% | |||
| Entisols 7% | Inceptisols 15% | Histosols 1% | Alfisols 12% | Spodosols 1% | Ultisols 64% |
 |  |  |  |  |  |
| Soil organic carbon (SOC) social cost: $35.1B | |||||
| $2.1B | $5.0B | $6.6B | $3.6B | $502.3M | $17.4B |
| 6% | 14% | 19% | 10% | 1% | 49% |
| Soil inorganic carbon (SIC) social cost: $6.3B | |||||
| $1.2B | $2.9B | $114.1M | $2.0B | $24.3M | $0.0 |
| 20% | 46% | 2% | 32% | 0% | 0% |
| Total soil carbon (TSC) social cost: $41.1B | |||||
| $3.3B | $7.9B | $6.7B | $5.6B | $526.5M | $17.4B |
| 8% | 19% | 16% | 14% | 1% | 42% |
| Sensitivity to climate change | |||||
| Low | Low | High | High | Low | Low |
| SOC and SIC sequestration (recarbonization) potential | |||||
| Low | Low | Low | Low | Low | Low |
| NLCD Land Cover Classes (LULC) | 2016 Total Area by LULC (km2) (Change in Area, 2001–2016, %) | Degree of Weathering and Soil Development | |||||
|---|---|---|---|---|---|---|---|
| Slight | Moderate | Strong | |||||
| Entisols | Inceptisols | Histosols | Alfisols | Spodosols | Ultisols | ||
| 2016 Area by Soil Order, km2 (Change in Area, 2001–2016, %) | |||||||
| Barren land | 70.3 (−1.9) | 30.3 (−0.5) | 6.8 (1.6) | 0.0 (23.1) | 3.9 (−20.1) | 0.6 (11.7) | 28.7 (−1.4) |
| Woody wetlands | 2464.5 (2.6) | 266.1 (3.4) | 379.3 (0.9) | 128.8 (1.3) | 109.3 (6.5) | 110.7 (1.9) | 1470.3 (2.9) |
| Shrub/Scrub | 147.7 (−22.2) | 11.8 (−39.0) | 23.0 (−16.2) | 0.0 (−40.7) | 8.1 (−14.9) | 1.7 (−37.4) | 103.1 (−21.2) |
| Mixed forest | 2222.2 (1.2) | 122.0 (2.1) | 435.7 (1.5) | 0.6 (0.7) | 249.0 (1.2) | 10.9 (5.4) | 1404.0 (0.9) |
| Deciduous forest | 5338.0 (−2.8) | 174.8 (−5.0) | 1381.9 (−1.2) | 1.0 (−4.7) | 445.1 (−2.8) | 44.5 (−1.9) | 3290.8 (−3.4) |
| Herbaceous | 116.6 (60.3) | 11.2 (13.5) | 20.1 (78.7) | 0.2 (38.6) | 8.2 (150.8) | 1.4 (16.3) | 75.5 (60.6) |
| Evergreen forest | 579.8 (7.6) | 71.1 (9.4) | 56.5 (9.5) | 0.3 (−6.3) | 24.8 (−0.1) | 12.8 (14.9) | 414.4 (7.3) |
| Emergent herbaceous wetlands | 725.2 (−8.9) | 100.1 (−9.7) | 15.6 (−17.2) | 141.2 (−1.5) | 363.6 (−1.8) | 0.7 (−76.6) | 104.0 (−30.5) |
| Hay/Pasture | 2436.3 (−7.8) | 62.1 (−11.6) | 394.2 (−6.4) | 0.0 (−22.2) | 612.1 (−8.6) | 1.6 (−0.9) | 1366.3 (−7.6) |
| Cultivated crops | 4786.9 (1.0) | 220.8 (−1.5) | 310.6 (4.1) | 0.9 (−1.5) | 564.4 (4.8) | 47.6 (−2.6) | 3642.7 (0.4) |
| Developed, open space | 2141.8 (2.7) | 156.7 (−1.0) | 230.4 (2.4) | 3.0 (−2.2) | 225.1 (4.9) | 7.9 (4.1) | 1518.8 (2.9) |
| Developed, medium intensity | 446.1 (25.1) | 117.3 (11.2) | 21.3 (31.6) | 0.5 (96.0) | 49.0 (34.2) | 0.5 (58.4) | 257.5 (30.1) |
| Developed, low intensity | 1081.4 (6.9) | 126.7 (2.8) | 77.6 (6.1) | 1.4 (−3.9) | 153.9 (8.1) | 1.6 (8.8) | 720.2 (7.5) |
| Developed, high intensity | 134.3 (29.1) | 53.2 (10.2) | 4.9 (43.5) | 0.2 (313.6) | 13.4 (54.9) | 0.2 (112.6) | 62.5 (43.5) |
| NLCD Land Cover Classes (LULC), Developed Area Increase between 2001 and 2016 (km2), Complete Loss of Total Soil Carbon (kg), SC-CO2 ($ = USD) | Degree of Weathering and Soil Development | |||||
|---|---|---|---|---|---|---|
| Slight | Moderate | Strong | ||||
| Entisols | Inceptisols | Histosols | Alfisols | Spodosols | Ultisols | |
| Developed Area Increase between 2001 and 2016 (km2) Complete Loss of Total Soil Carbon (kg) SC-CO2 ($ = USD) | ||||||
| Developed, open space 58.6 km2 (6.6 × 10⁸ kg C) $85.3M | - | 5.4 | - | 10.5 | 0.3 | 42.4 |
| 7.6 × 10⁷ | 1.2 × 10⁸ | 3.9 × 10⁶ | 3.0 × 10⁸ | |||
| $12.8M | $20.9M | $665973.0 | $50.9M | |||
| Developed, medium intensity 89.4 km2 (8.3 × 10⁸ kg C) $140.1M | 11.8 | 5.1 | 0.2 | 12.5 | 0.2 | 59.6 |
| 1.5 × 10⁸ | 7.1 × 10⁷ | 2.9 × 10⁷ | 1.5 × 10⁸ | 2.6 × 10⁶ | 4.2 × 10⁸ | |
| $25.6M | $12.1M | $5.6M | $24.8M | $425754.0 | $71.5M | |
| Developed, low intensity 70.1 km2 (6.0 × 10⁸ kg C) $101.9M | 3.4 | 4.5 | - | 11.5 | 0.1 | 50.5 |
| 4.4 × 10⁷ | 6.3 × 10⁷ | 1.4 × 10⁸ | 1.3 × 10⁶ | 3.6 × 10⁸ | ||
| $7.5M | $10.6M | $22.9M | $285137.9 | $60.6M | ||
| Developed, high intensity 30.3 km2 (2.9 × 10⁸ kg C) $49.5M | 4.9 | 1.5 | 0.1 | 4.7 | 0.1 | 18.9 |
| 6.3 × 10⁷ | 2.1 × 10⁷ | 1.4 × 10⁷ | 5.5 × 10⁷ | 1.3 × 10⁶ | 1.3 × 10⁸ | |
| $10.7M | $3.4M | $2.9M | $9.4M | $208971.0 | $22.7M | |
| Totals 248.4 km2 (2.4× 10⁹ kg C) $376.7M | 20.1 | 16.5 | 0.3 | 39.2 | 0.7 | 171.4 |
| 2.6× 10⁸ | 2.3× 10⁸ | 4.3× 10⁷ | 4.6× 10⁸ | 9.0× 10⁶ | 1.2× 10⁹ | |
| $43.8M | $38.9M | $8.5M | $78.0M | $1.6M | $205.7M | |
| County/City | Total Area Change (km2), (SC-CO2, $ = USD), Loss of TSC (kg) | Degree of Weathering and Soil Development | |||||
|---|---|---|---|---|---|---|---|
| Slight | Moderate | Strong | |||||
| Entisols | Inceptisols | Histosols | Alfisols | Spodosols | Ultisols | ||
| Developed Area Increase between 2001 and 2016 (km2) Complete Loss of Total Soil Carbon (kg) | |||||||
| Allegany | 2.6 ($4.7M) 2.7 × 10⁷ | 0.3 3.8 × 10⁶ | 1.0 1.4 × 10⁷ | 0 0 | 0.1 1.2 × 10⁶ | 0 0 | 1.1 7.8 × 10⁶ |
| Anne Arundel | 22.5 ($35.8M) 2.1 × 10⁸ | 1.3 1.7 × 10⁷ | 0.5 7.0 × 10⁶ | 0.3 4.3 × 10⁷ | 0.1 1.2 × 10⁶ | 0 0 | 20.3 1.4 × 10⁸ |
| Baltimore City | 2.1 ($3.9M) 2.2 × 10⁷ | 0.9 1.2 × 10⁷ | 0.1 1.4 × 10⁶ | 0 0 | 0.4 4.7 × 10⁶ | 0 0 | 0.6 4.3 × 10⁶ |
| Baltimore | 14.1 ($23.9M) 1.4 × 10⁸ | 5.0 6.4 × 10⁷ | 0.8 1.1 × 10⁷ | 0 0 | 1.1 1.3 × 10⁷ | 0 0 | 7.3 5.2 × 10⁷ |
| Calvert | 5.4 ($10.3M) 5.8 × 10⁷ | 0.4 5.1 × 10⁶ | 2.4 3.4 × 10⁷ | 0 0 | 0.1 1.2 × 10⁶ | 0 0 | 2.5 1.8 × 10⁷ |
| Caroline | 1.2 ($1.6M) 9.8 × 10⁶ | 0.1 1.3 × 10⁶ | 0.1 1.4 × 10⁶ | 0 0 | 0 0 | 0 0 | 1.0 7.1 × 10⁶ |
| Carroll | 8.8 ($12.7M) 7.5 × 10⁷ | 0.6 7.7 × 10⁶ | 0.5 7.0 × 10⁶ | 0 0 | 1.1 1.3 × 10⁷ | 0 0 | 6.6 4.7 × 10⁷ |
| Cecil | 12.2 ($16.5M) 9.8 × 10⁷ | 1.1 1.4 × 10⁷ | 0.1 1.4 × 10⁶ | 0 0 | 0.9 1.1 × 10⁷ | 0 0 | 10.1 7.2 × 10⁷ |
| Charles | 16.6 ($23.6M) 1.4 × 10⁸ | 3.4 4.4 × 10⁷ | 0.3 4.2 × 10⁶ | 0 0 | 0 0 | 0 0 | 12.9 9.2 × 10⁷ |
| Dorchester | 2.5 ($3.4M) 2.0 × 10⁷ | 0.3 3.8 × 10⁶ | 0.1 1.4 × 10⁶ | 0 0 | 0 0 | 0 0 | 2.1 1.5 × 10⁷ |
| Frederick | 22.6 ($42.5M) 2.5 × 10⁸ | 0.3 3.8 × 10⁶ | 2.0 2.8 × 10⁷ | 0 0 | 16.1 1.9 × 10⁸ | 0 0 | 4.2 3.0 × 10⁷ |
| Garrett | 3.2 ($5.7M) 3.4 × 10⁷ | 0.1 1.3 × 10⁶ | 1.2 1.7 × 10⁷ | 0 0 | 0.2 2.4 × 10⁶ | 0.2 2.6 × 10⁶ | 1.5 1.1 × 10⁷ |
| Harford | 13.1 ($20.2M) 1.2 × 10⁸ | 0.1 1.3 × 10⁶ | 2.0 2.8 × 10⁷ | 0 0 | 2.7 3.2 × 10⁷ | 0 0 | 8.3 5.9 × 10⁷ |
| Howard | 17.3 ($25.3M) 1.5 × 10⁸ | 0.6 7.7 × 10⁶ | 2.4 3.4 × 10⁷ | 0 0 | 1.4 1.7 × 10⁷ | 0 0 | 12.9 9.2 × 10⁷ |
| Kent | 1.4 ($1.7M) 9.9 × 10⁶ | 0 0 | 0 0 | 0 0 | 0 0 | 0 0 | 1.4 9.9 × 10⁶ |
| Montgomery | 24.5 ($31.6M) 1.9 × 10⁸ | 1.0 1.3 × 10⁷ | 0.6 8.4 × 10⁶ | 0 0 | 0.6 7.1 × 10⁶ | 0 0 | 22.3 1.6 × 10⁸ |
| Prince George’s | 35.6 ($46.6M) 2.8 × 10⁸ | 2.8 3.6 × 10⁷ | 0.9 1.3 × 10⁷ | 0 0 | 0.2 2.4 × 10⁶ | 0 0 | 31.7 2.3 × 10⁸ |
| Queen Anne’s | 5.1 ($7.0M) 4.0 × 10⁷ | 0.2 2.6 × 10⁶ | 0.4 5.6 × 10⁶ | 0 0 | 0 0 | 0 0 | 4.5 3.2 × 10⁷ |
| Somerset | 1.4 ($2.1M) 1.2 × 10⁷ | 0.3 3.8 × 10⁶ | 0 0 | 0 0 | 0 0 | 0 0 | 1.1 7.8 × 10⁶ |
| St. Mary’s | 8.4 ($10.8M) 6.4 × 10⁷ | 0.5 6.4 × 10⁶ | 0.2 2.8 × 10⁶ | 0 0 | 0 0 | 0 0 | 7.7 5.5 × 10⁷ |
| Talbot | 3.0 ($3.7M) 2.1 × 10⁷ | 0 0 | 0 0 | 0 0 | 0 0 | 0 0 | 3.0 2.1 × 10⁷ |
| Washington | 16.0 ($31.3M) 1.9 × 10⁸ | 0.1 1.3 × 10⁶ | 0.5 7.0 × 10⁶ | 0 0 | 14.5 1.2 × 10⁶ | 0 0 | 0.9 6.4 × 10⁶ |
| Wicomico | 6.7 ($11.4M) 6.7 × 10⁷ | 2.9 3.7 × 10⁷ | 0.4 5.6 × 10⁶ | 0 0 | 0 0 | 0.1 1.3 × 10⁶ | 3.3 2.3 × 10⁷ |
| Worcester | 5.6 ($7.8M) 1.3 × 10⁷ | 0.6 7.7 × 10⁶ | 0 0 | 0 0 | 0 0 | 0.1 1.3 × 10⁶ | 0.5 3.6 × 10⁶ |
| Totals | 252.0 ($383.8M) 2.2 × 10⁹ | 23.0 ($50.0M) 2.9 × 10⁸ | 16.5 ($39.0M) 2.3 × 10⁸ | 0.3 ($8.5M) 4.3 × 10⁷ | 39.5 ($78.5M) 5.7 × 10⁸ | 0.4 ($1.6M) 5.2 × 10⁶ | 171.9 ($206.3M) 1.2 × 10⁹ |
| NLCD Land Cover Classes (LULC) | 2016 Total Area by LULC (%) | Degree of Weathering and Soil Development | |||||
|---|---|---|---|---|---|---|---|
| Slight | Moderate | Strong | |||||
| Entisols | Inceptisols | Histosols | Alfisols | Spodosols | Ultisols | ||
| 2016 Area by Soil Order, % from Total Area in Each LULC | |||||||
| Barren land | 0.3 | 43.1 | 9.7 | 0.0 | 5.6 | 0.8 | 40.8 |
| Woody wetlands | 10.9 | 10.8 | 15.4 | 5.2 | 4.4 | 4.5 | 59.7 |
| Shrub/Scrub | 0.7 | 8.0 | 15.6 | 0.0 | 5.5 | 1.1 | 69.8 |
| Mixed forest | 9.8 | 5.5 | 19.6 | 0.0 | 11.2 | 0.5 | 63.2 |
| Deciduous forest | 23.5 | 3.3 | 25.9 | 0.0 | 8.3 | 0.8 | 61.6 |
| Herbaceous | 0.5 | 9.6 | 17.3 | 0.2 | 7.0 | 1.2 | 64.8 |
| Evergreen forest | 2.6 | 12.3 | 9.7 | 0.0 | 4.3 | 2.2 | 71.5 |
| Emergent herbaceous wetlands | 3.2 | 13.8 | 2.2 | 19.5 | 50.1 | 0.1 | 14.3 |
| Hay/Pasture | 10.7 | 2.5 | 16.2 | 0.0 | 25.1 | 0.1 | 56.1 |
| Cultivated crops | 21.1 | 4.6 | 6.5 | 0.0 | 11.8 | 1.0 | 76.1 |
| Developed, open space | 9.4 | 7.3 | 10.8 | 0.1 | 10.5 | 0.4 | 70.9 |
| Developed, medium intensity | 2.0 | 26.3 | 4.8 | 0.1 | 11.0 | 0.1 | 57.7 |
| Developed, low intensity | 4.8 | 11.7 | 7.2 | 0.1 | 14.2 | 0.1 | 66.6 |
| Developed, high intensity | 0.6 | 39.6 | 3.7 | 0.1 | 10.0 | 0.1 | 46.5 |
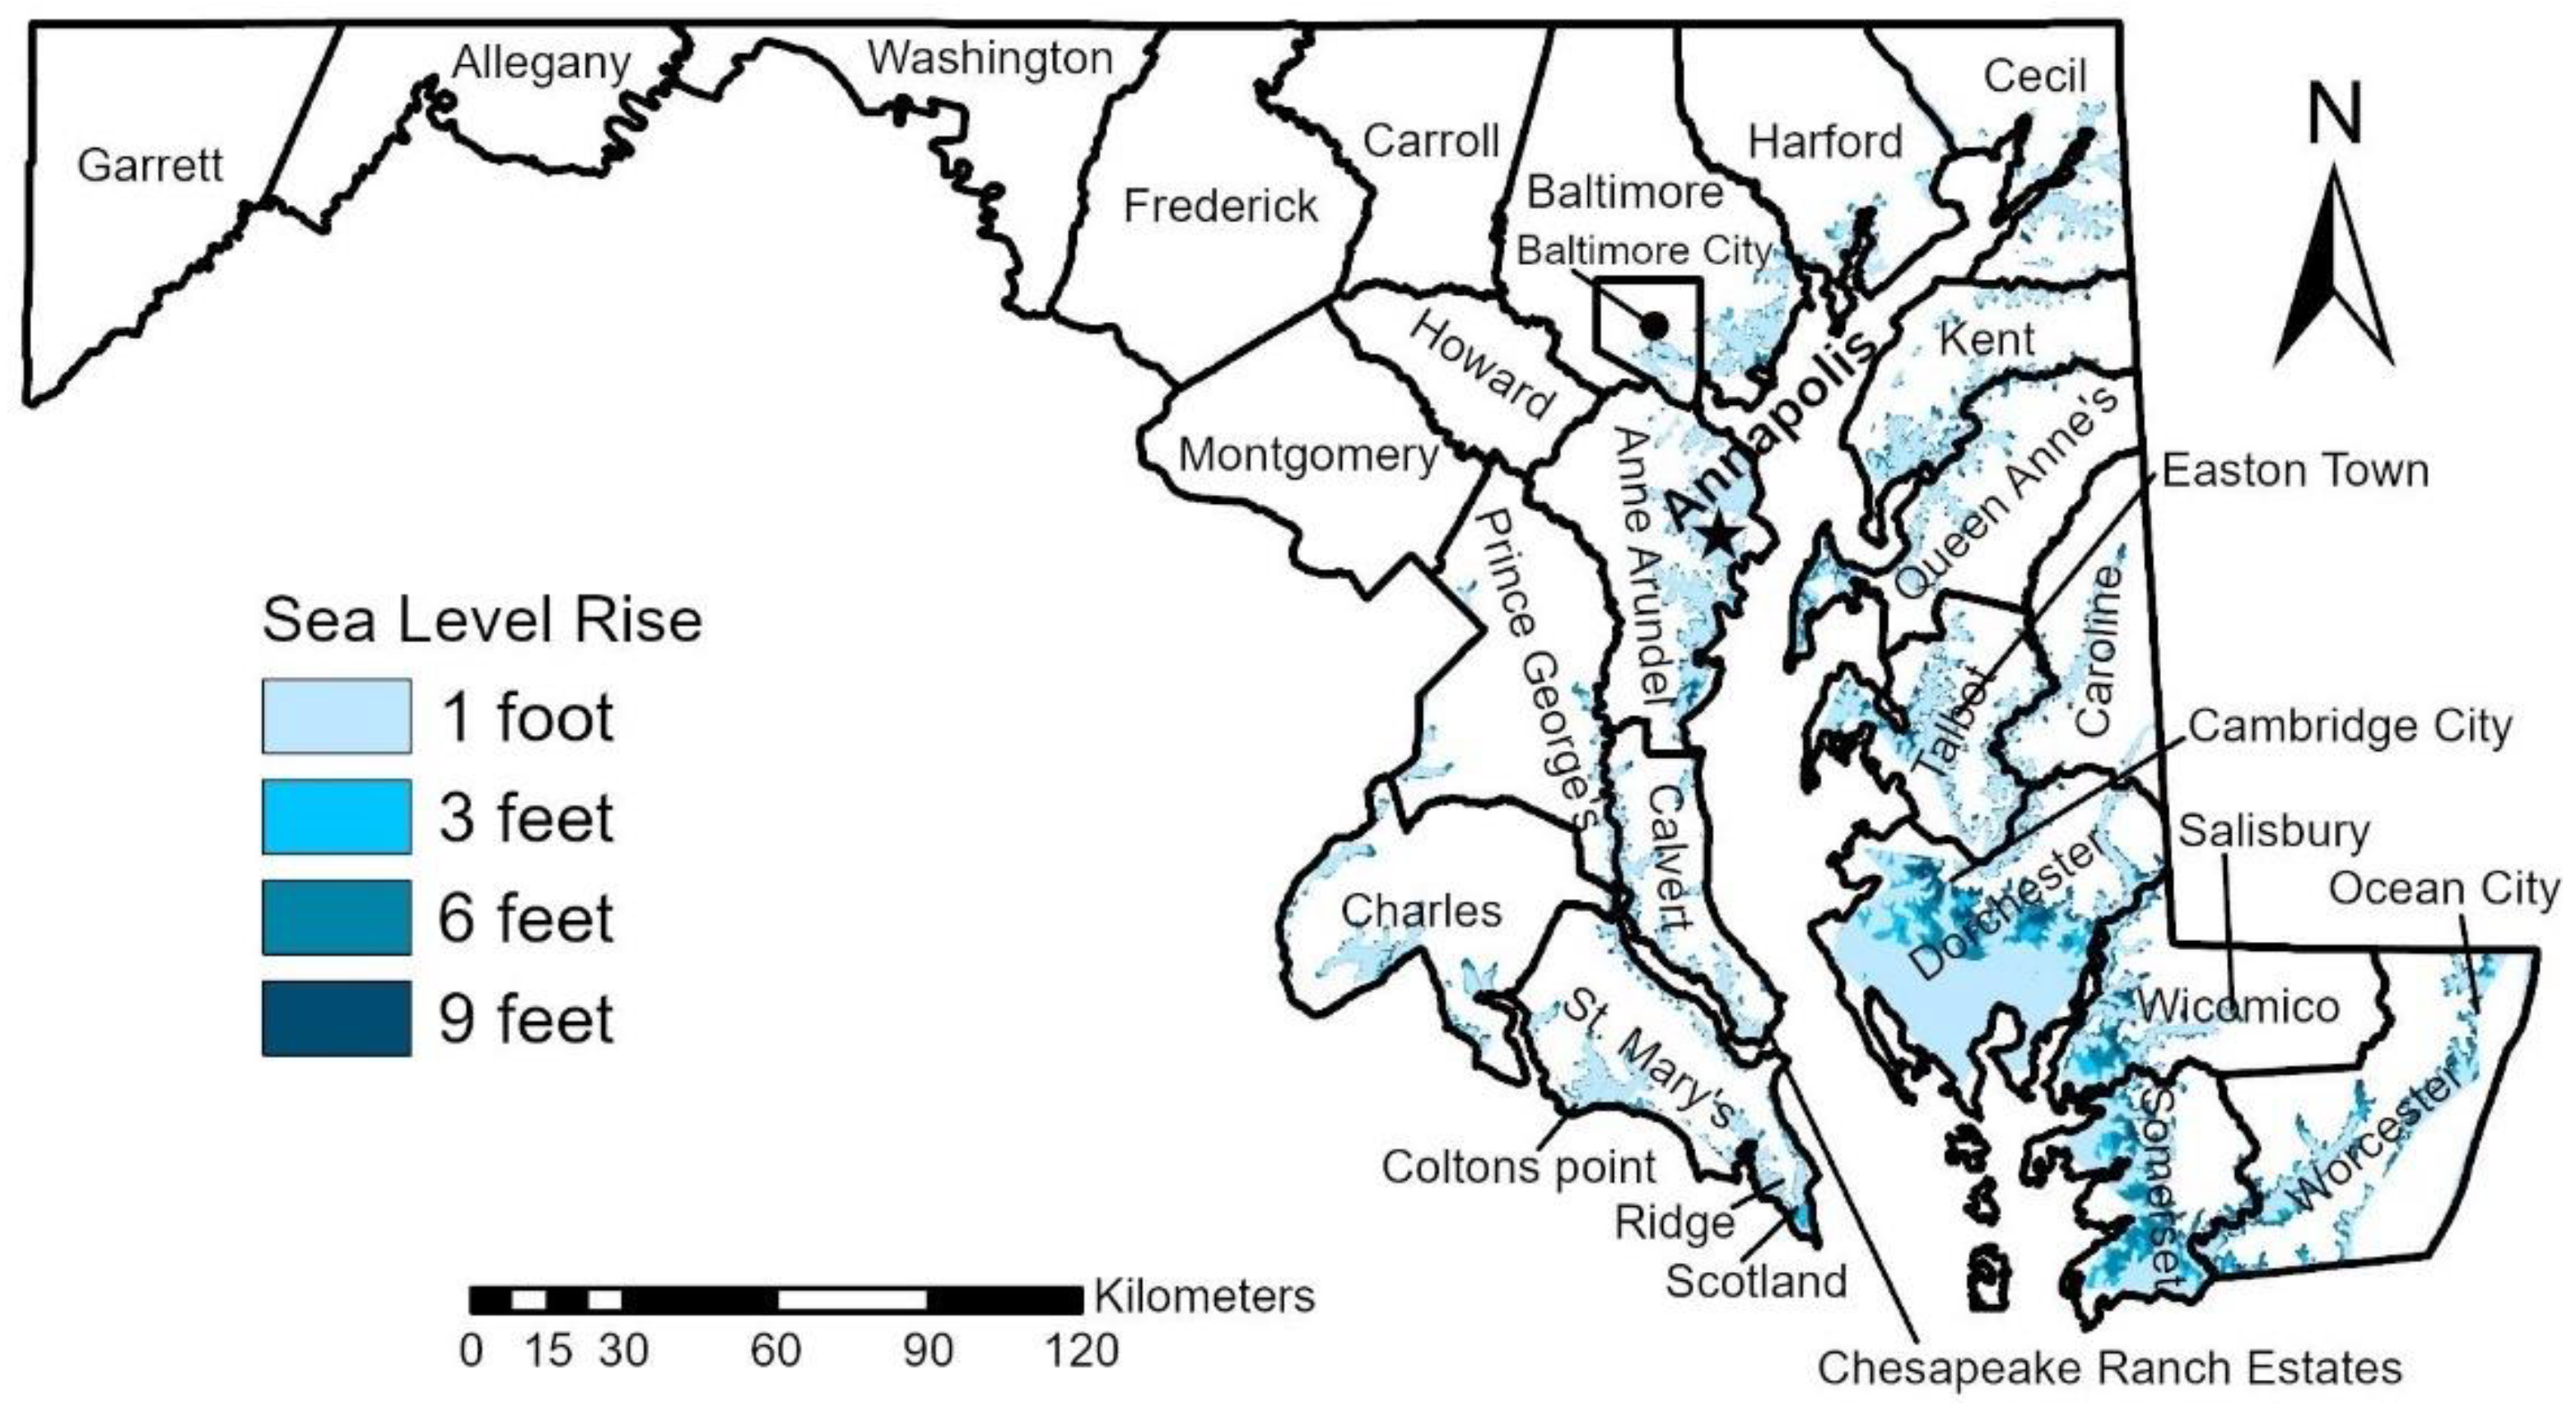
| County (Affected by Sea Level Rise) | County Area Loss Due to Sea Level Rise (%) | |||
|---|---|---|---|---|
| 1 Foot | 3 Feet | 6 Feet | 9 Feet | |
| Anne Arundel | 8.8 | 9.9 | 11.7 | 14.4 |
| Baltimore | 3.0 | 3.6 | 4.3 | 5.2 |
| Baltimore City | 11.4 | 11.6 | 12.5 | 15.3 |
| Calvert | 5.4 | 6.9 | 8.1 | 9.3 |
| Caroline | 3.3 | 3.8 | 4.4 | 5.3 |
| Cecil | 6.8 | 7.4 | 8.1 | 9.0 |
| Charles | 4.9 | 5.9 | 7.1 | 8.5 |
| Dorchester | 40.9 | 55.1 | 63.8 | 69.0 |
| Harford | 2.1 | 2.4 | 2.7 | 2.9 |
| Howard | 11.6 | 14.1 | 17.1 | 19.9 |
| Kent | 4.2 | 4.8 | 5.4 | 5.9 |
| Prince George‘s | 5.4 | 6.6 | 8.4 | 10.7 |
| Queen Anne‘s | 23.9 | 36.2 | 47.1 | 51.7 |
| Somerset | 9.6 | 11.7 | 15.0 | 18.6 |
| St. Mary‘s | 14.7 | 16.7 | 22.6 | 30.8 |
| Talbot | 8.6 | 12.8 | 17.5 | 22.2 |
| Wicomico | 40.1 | 44.9 | 52.8 | 60.7 |
| Key Categories | Details |
|---|---|
| Targets | Status: in law |
| Interim first target: 2031 | |
| Interim target type: reduction of emissions | |
| Coverage | Greenhouse gases: not provided |
| Consumption emissions: yes | |
| Historical emissions: no | |
| All territorial emissions: not provided | |
| Governance | Plan detail level: incomplete |
| Includes reporting on an annual basis: yes | |
| Includes equity: yes | |
| Formal mechanisms for accountability: not provided | |
| Offsets and Sinks | Includes plans to utilize external offset credits: no |
| Details separate emission targets for removals and reductions: no | |
| Includes conditions to utilize offset credits: no | |
| Plans for carbon dioxide removal (CDR): nature-based removals |
| Net-Zero Emissions and Social Costs | ||
|---|---|---|
| Net-Zero Emissions | + | Net-Zero Social Costs |
| Units: kg of emissions | Units: Monetary value (e.g., $ = USD) | |
| Advantages | ||
| 1. Reduction in physical emissions from various sources to net-zero. | 1. Equitable and market-based allocation of financial resources for social costs of climate change compensation. | |
| 2. Removal of current emitted emissions. | 2. Equitable and market-based investment to reduce social costs beyond the emissions reductions. | |
| Limitations | ||
| 1. Disregards damages to the society and environment. | 1. Requires significant financial resources from the public and private sectors. | |
| 2. Disregards historical emissions and damages. | 2. Cross-boundary challenges. | |
| 3. Not all sources of emissions are included. Removal may not be possible. | 3. Assuming fixed social costs of emissions will likely undervalue the true costs of climate change. | |
Disclaimer/Publisher’s Note: The statements, opinions and data contained in all publications are solely those of the individual author(s) and contributor(s) and not of MDPI and/or the editor(s). MDPI and/or the editor(s) disclaim responsibility for any injury to people or property resulting from any ideas, methods, instructions or products referred to in the content. |
© 2022 by the authors. Licensee MDPI, Basel, Switzerland. This article is an open access article distributed under the terms and conditions of the Creative Commons Attribution (CC BY) license (https://creativecommons.org/licenses/by/4.0/).
Share and Cite
Hutton, P.C.; Mikhailova, E.A.; Lin, L.; Hao, Z.; Zurqani, H.A.; Post, C.J.; Schlautman, M.A.; Shepherd, G.B. Net-Zero Target and Emissions from Land Conversions: A Case Study of Maryland’s Climate Solutions Now Act. Geographies 2023, 3, 40-59. https://doi.org/10.3390/geographies3010003
Hutton PC, Mikhailova EA, Lin L, Hao Z, Zurqani HA, Post CJ, Schlautman MA, Shepherd GB. Net-Zero Target and Emissions from Land Conversions: A Case Study of Maryland’s Climate Solutions Now Act. Geographies. 2023; 3(1):40-59. https://doi.org/10.3390/geographies3010003
Chicago/Turabian StyleHutton, Philip C., Elena A. Mikhailova, Lili Lin, Zhenbang Hao, Hamdi A. Zurqani, Christopher J. Post, Mark A. Schlautman, and George B. Shepherd. 2023. "Net-Zero Target and Emissions from Land Conversions: A Case Study of Maryland’s Climate Solutions Now Act" Geographies 3, no. 1: 40-59. https://doi.org/10.3390/geographies3010003