
A Novel Method to Assist Clinical Management of Mild Traumatic Brain Injury by Classifying Patient Subgroups Using Wearable Sensors and Exertion Testing: A Pilot Study
 ,
,  ,
,
Abstract
:1. Introduction
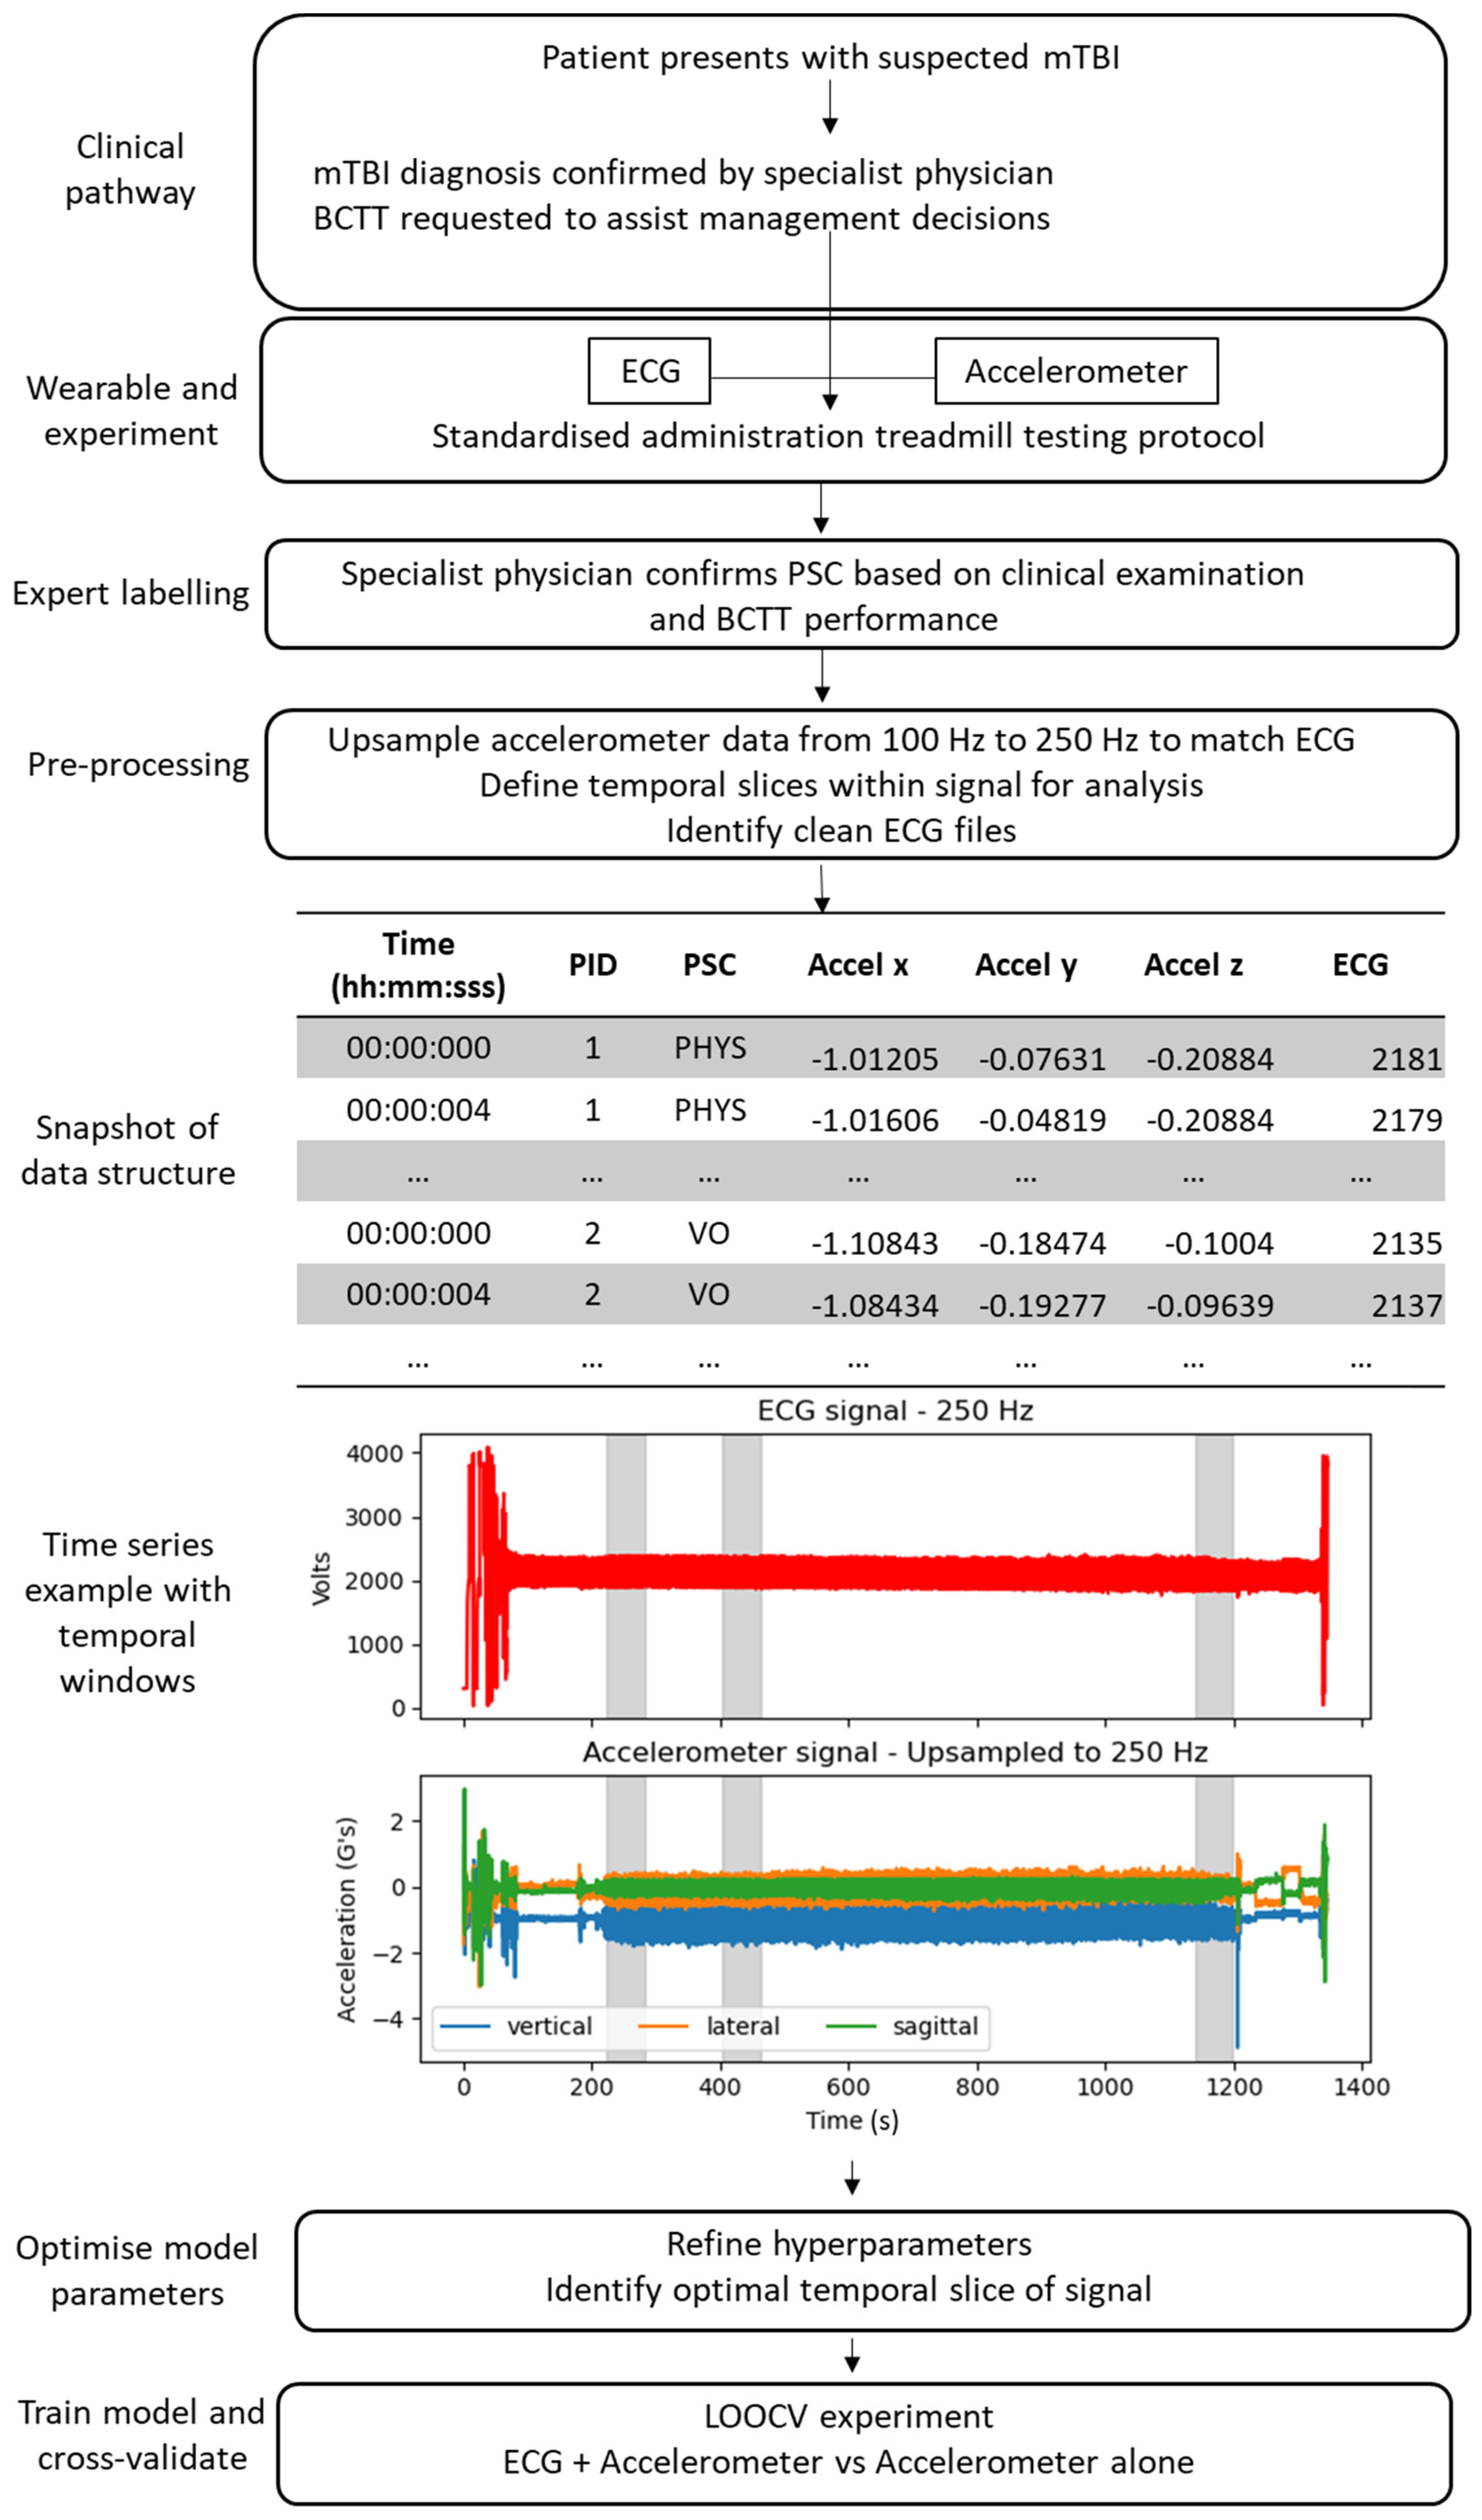
2. Methods
2.1. Study Design and Participants
2.2. Procedures
2.2.1. Timing of BCTT
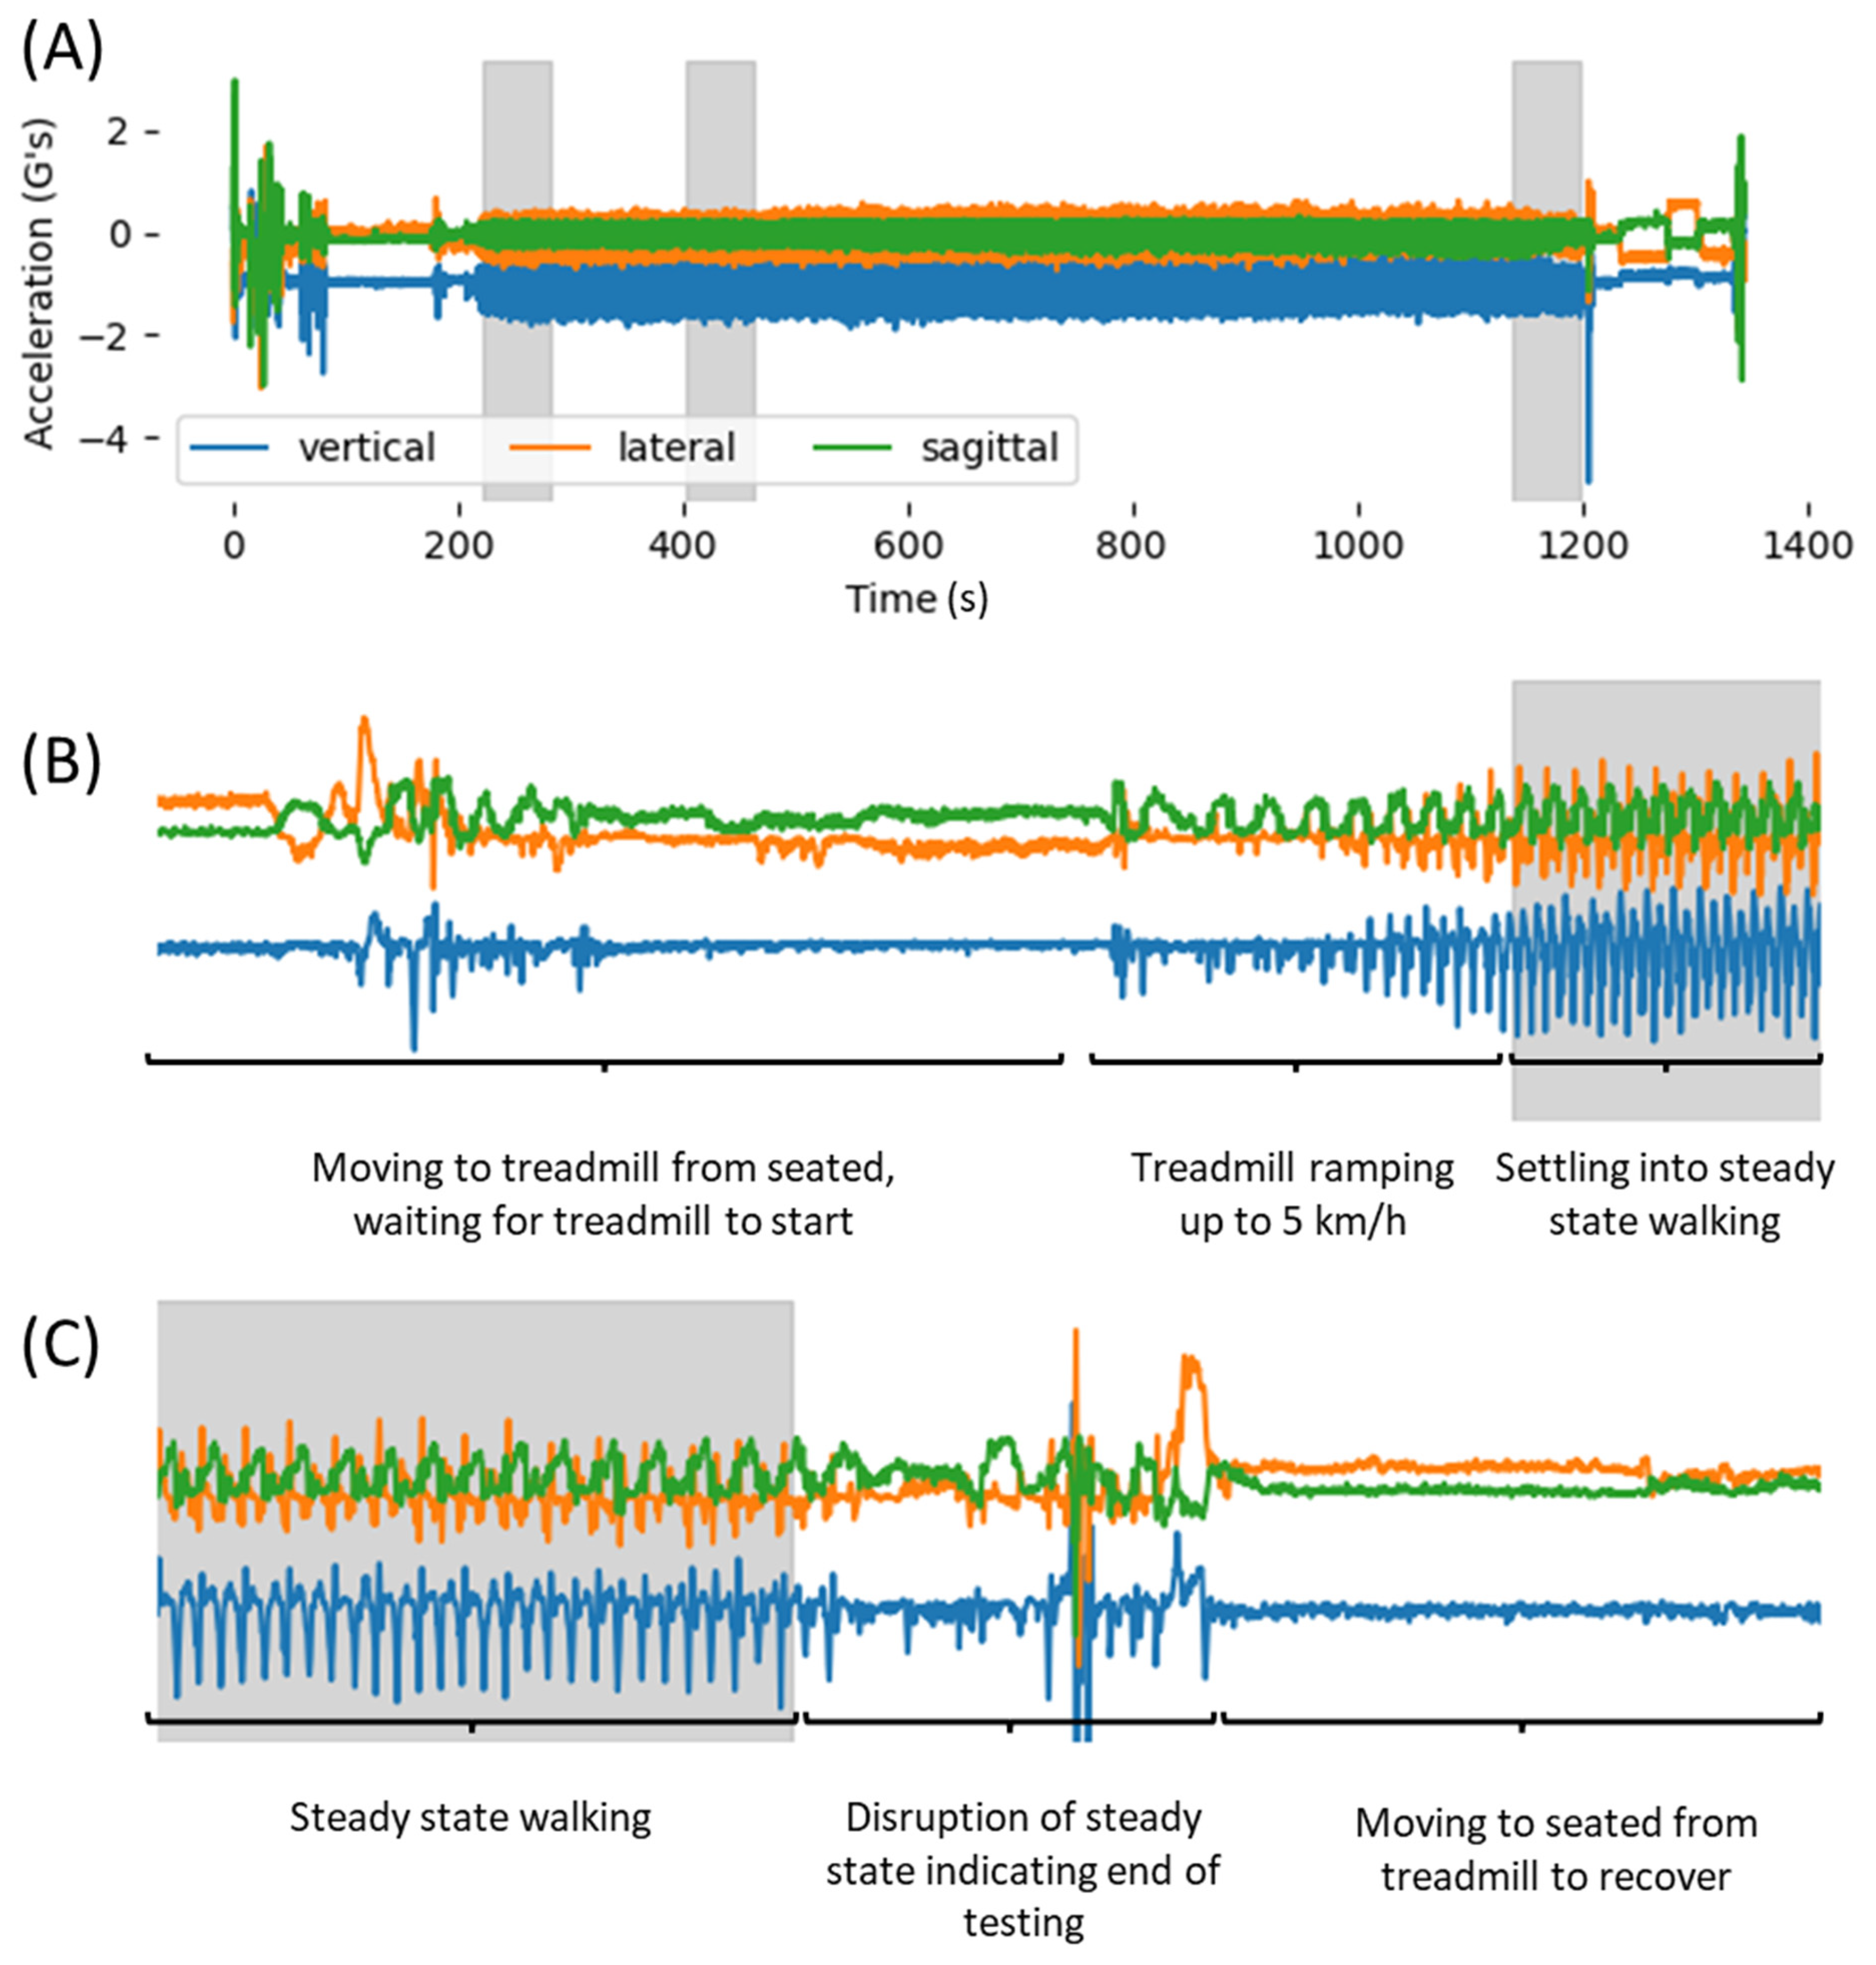
2.2.2. Treadmill Testing Protocol
2.2.3. Expert Labelling
2.3. Instrumentation
2.4. Deep Learning Pipeline
2.4.1. Dataset Preparation and Pre-Processing
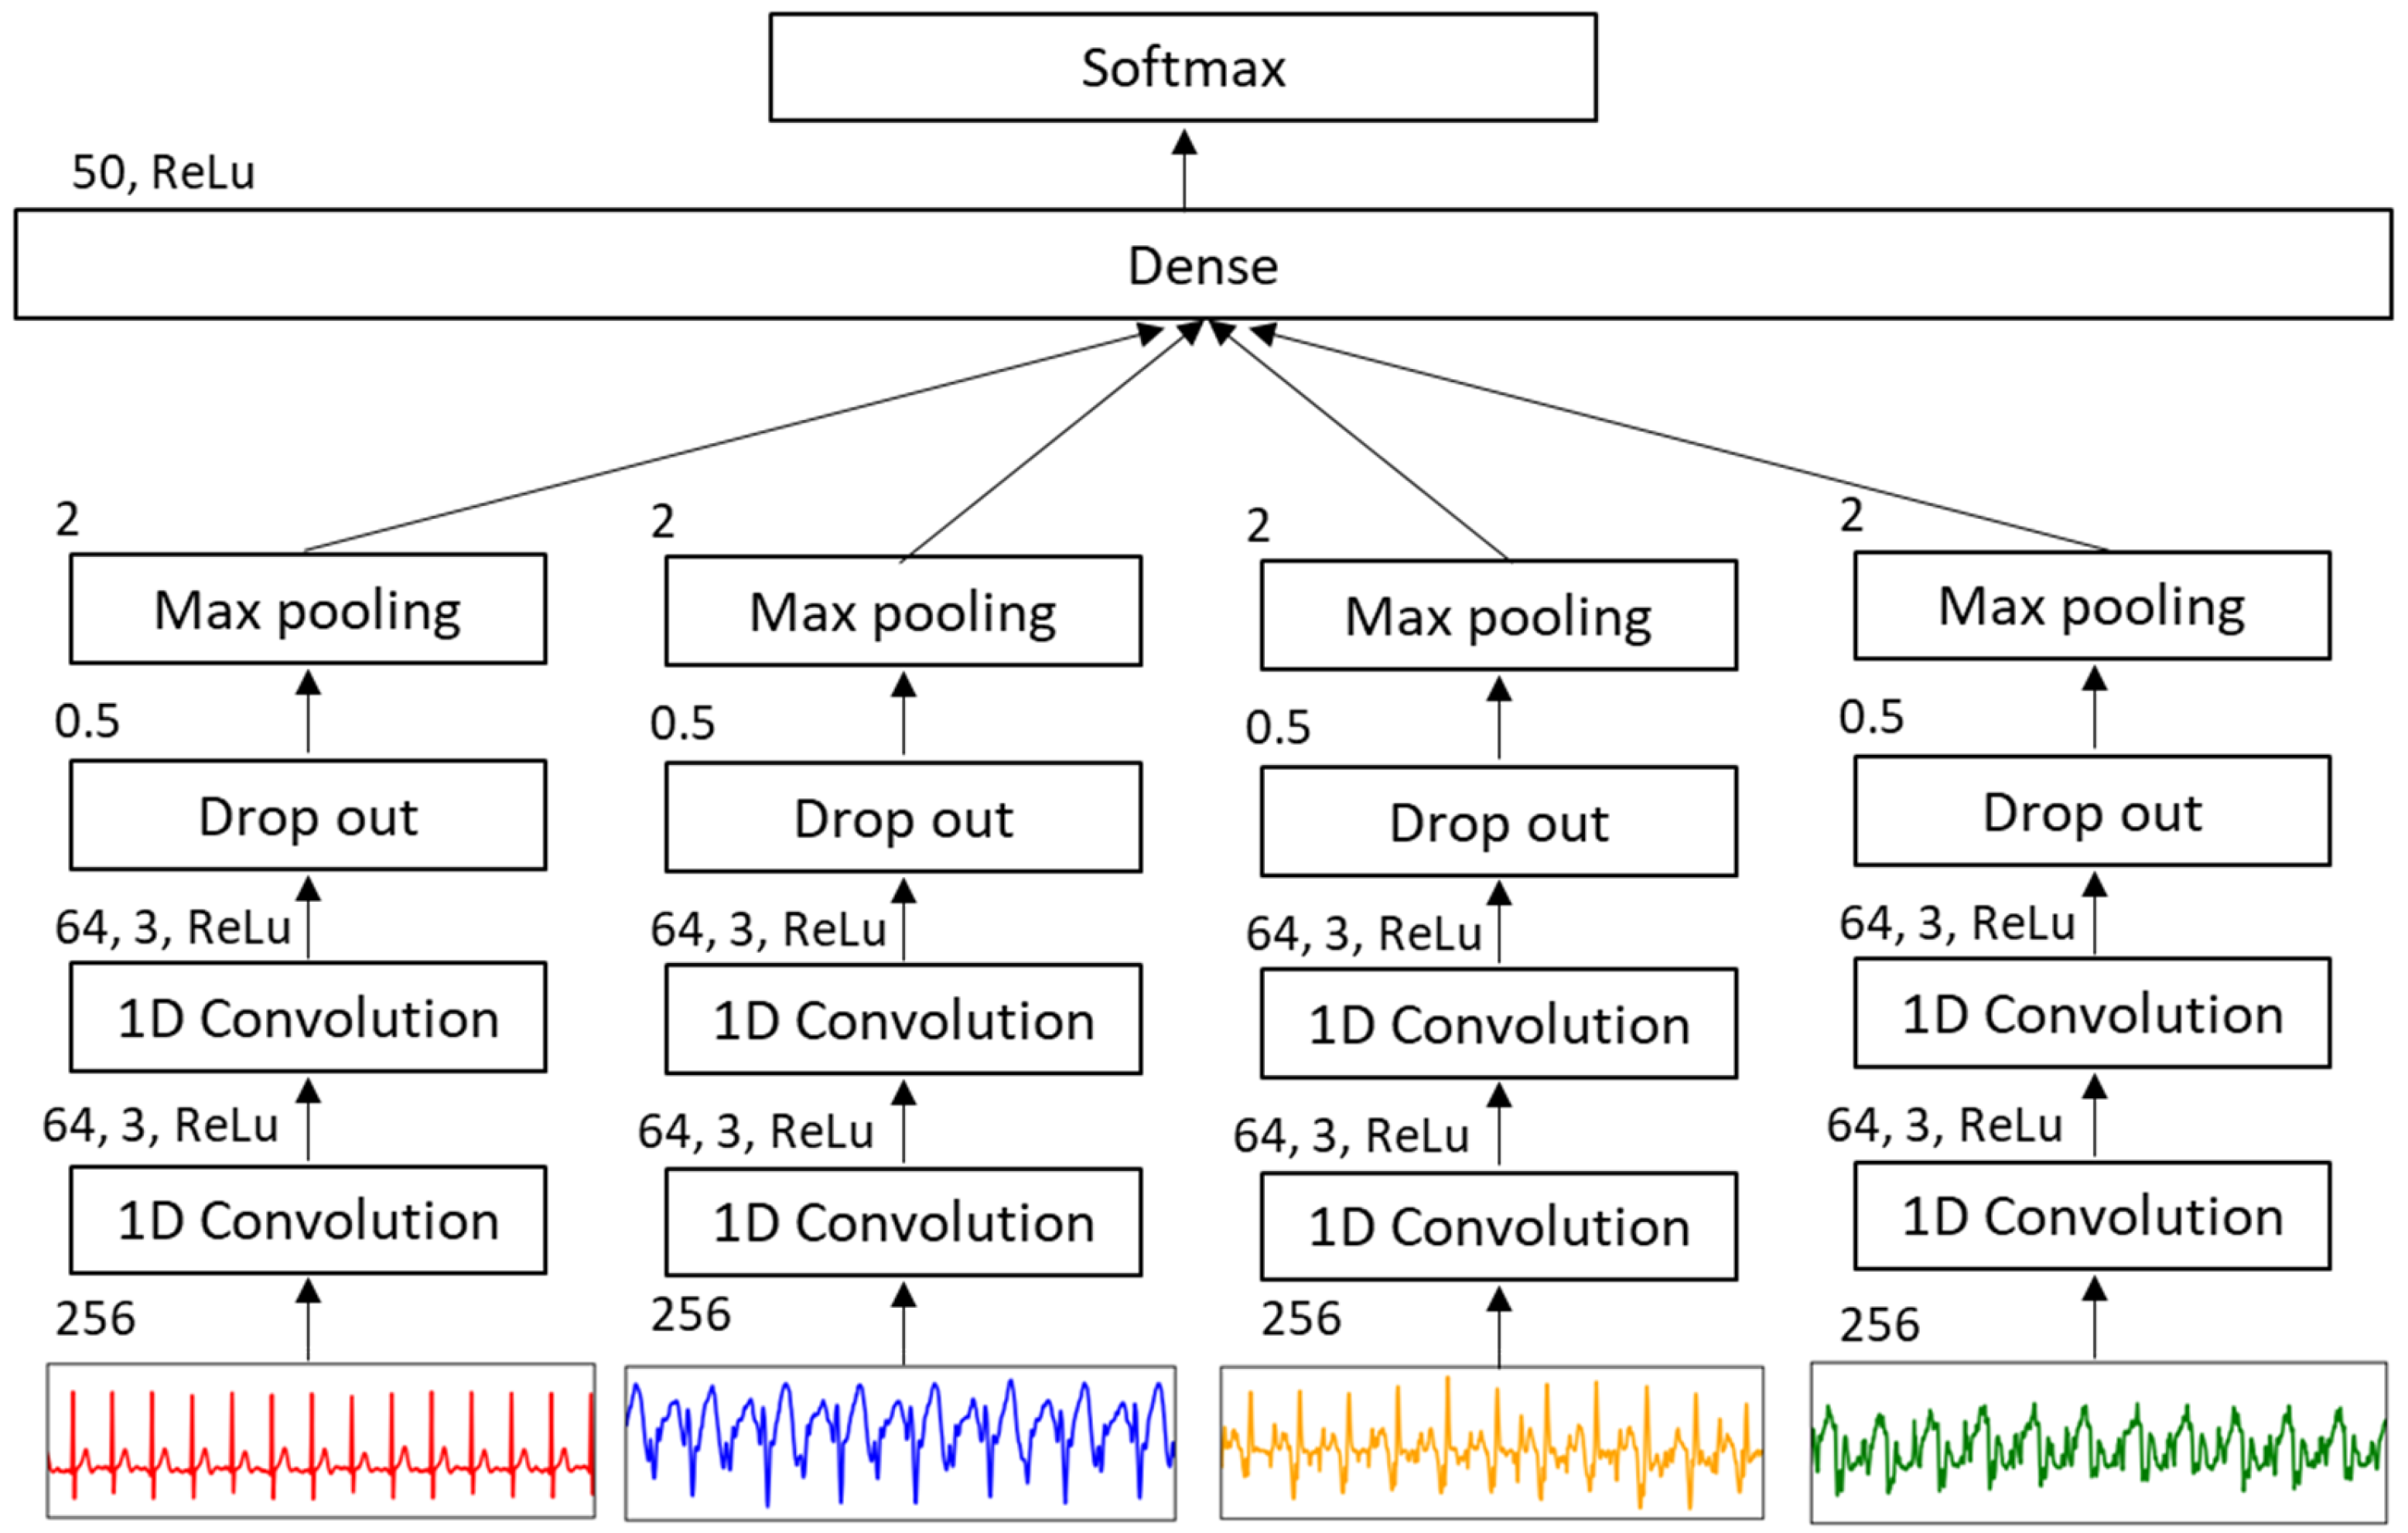
2.4.2. Deep Learning Model
2.4.3. Hyperparameter Tuning
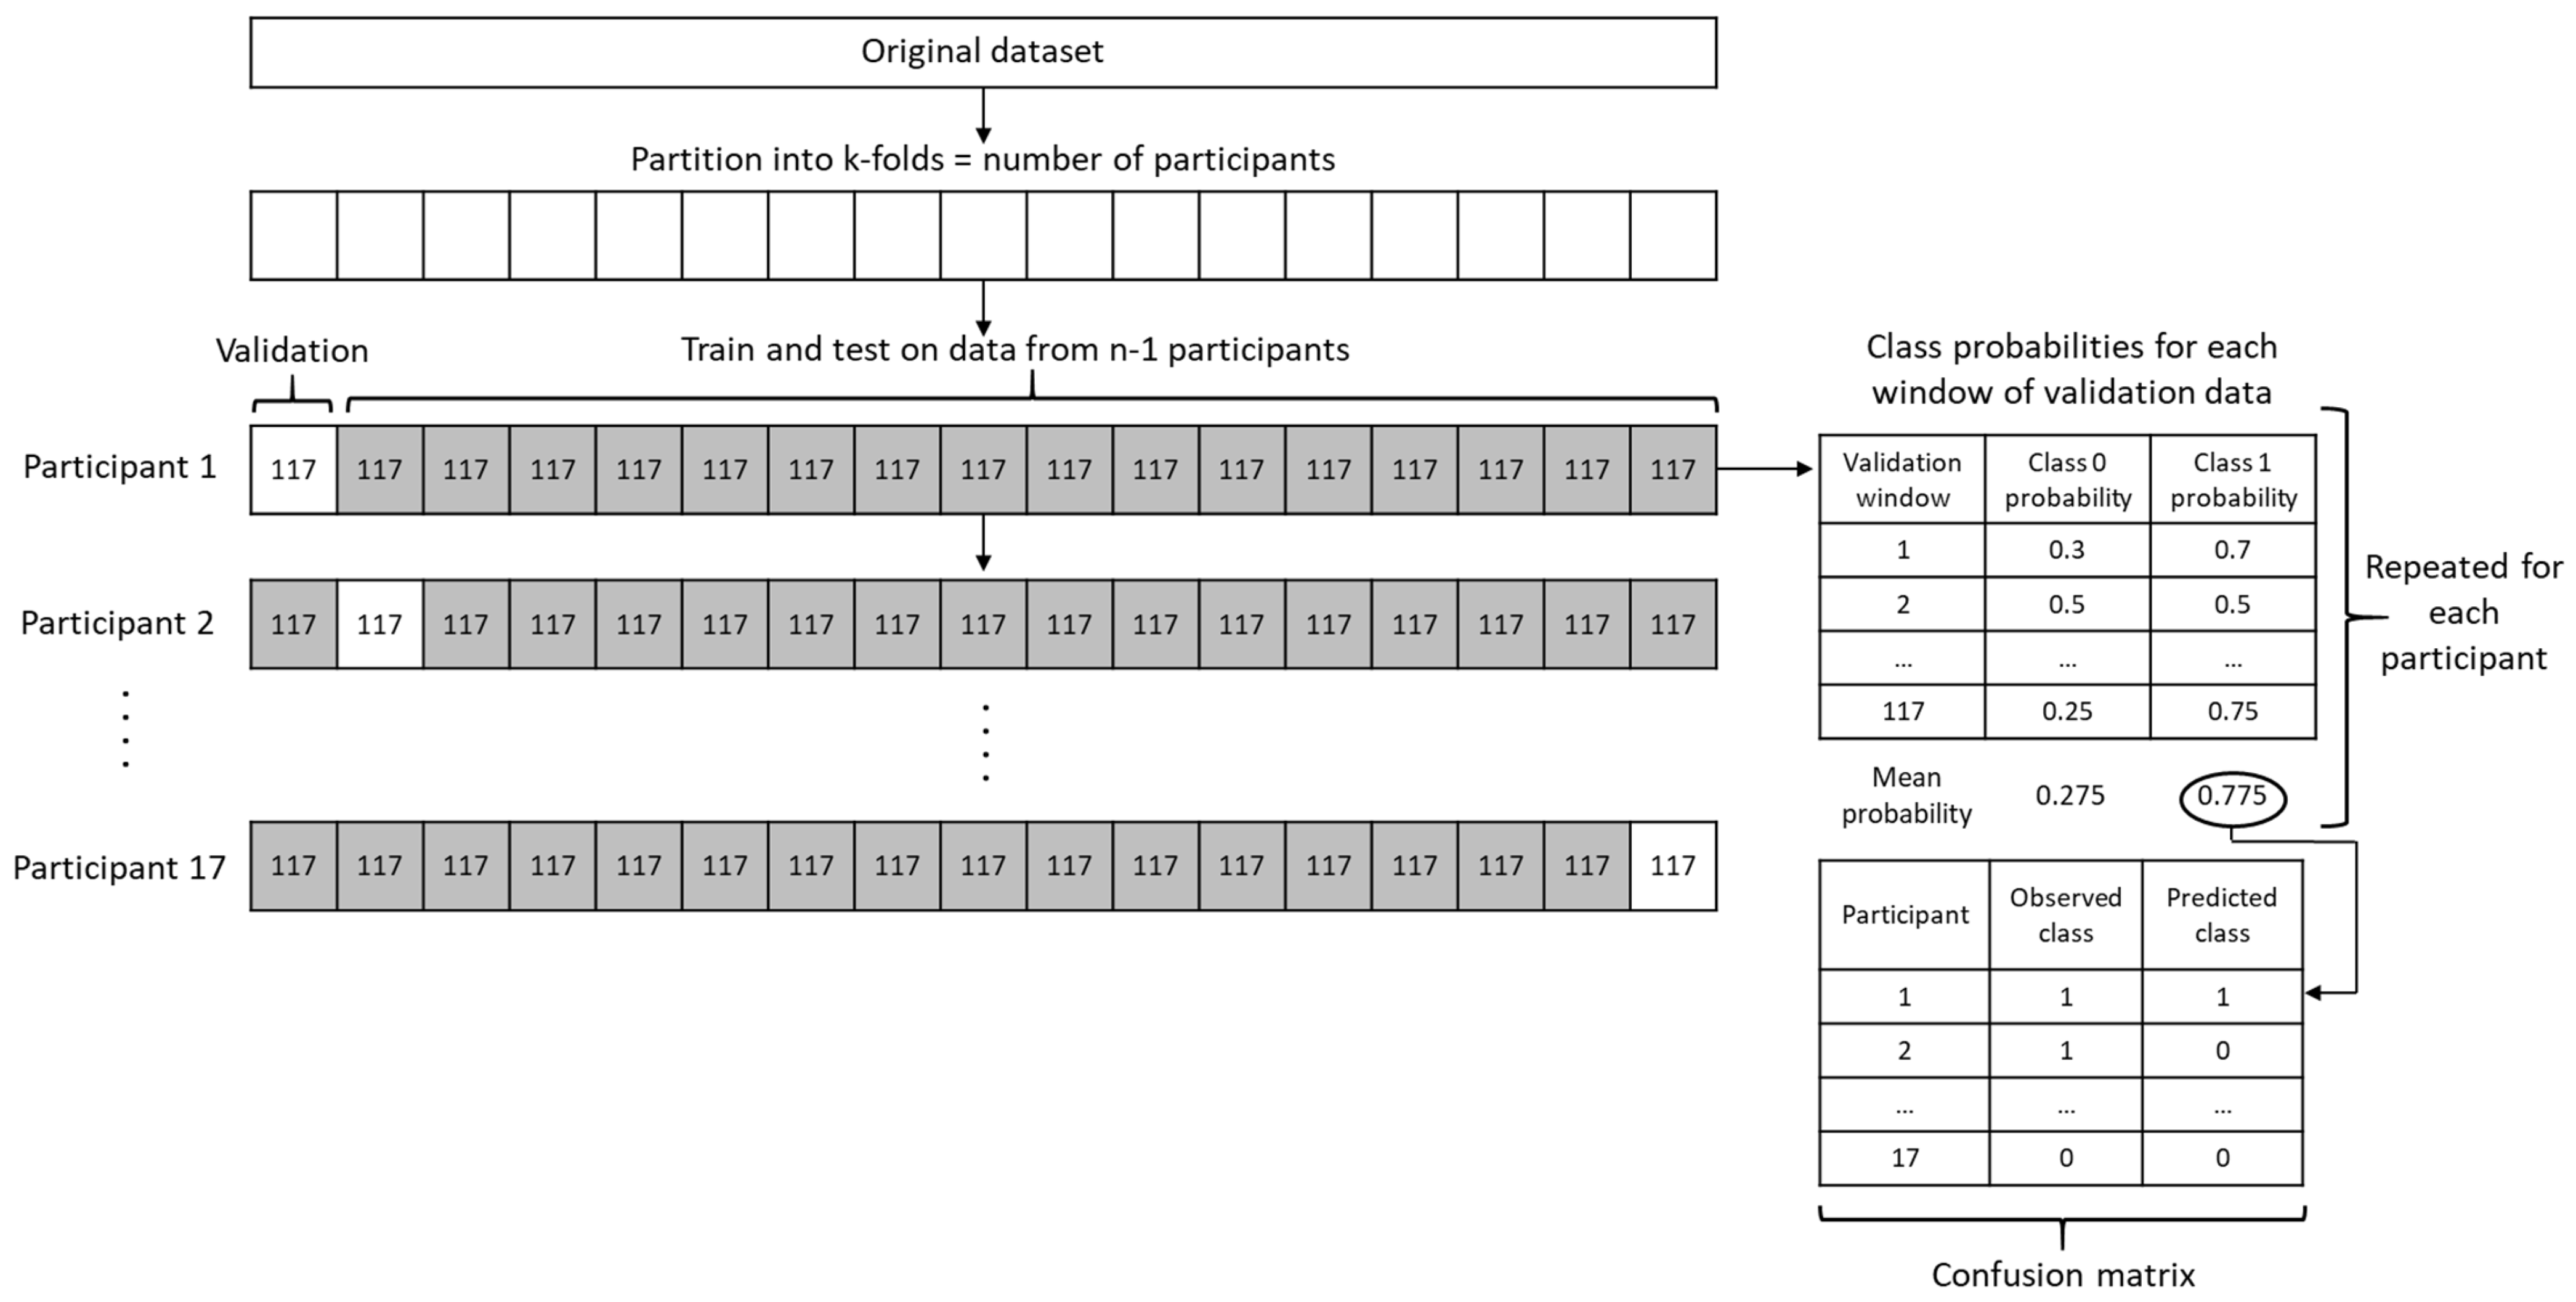
2.4.4. LOOCV Experiment
2.5. Post-Hoc Feature Exploration: PSD and Entropy Analysis
3. Results
3.1. Demographics
3.2. Hyperparameters and Temporal Slices
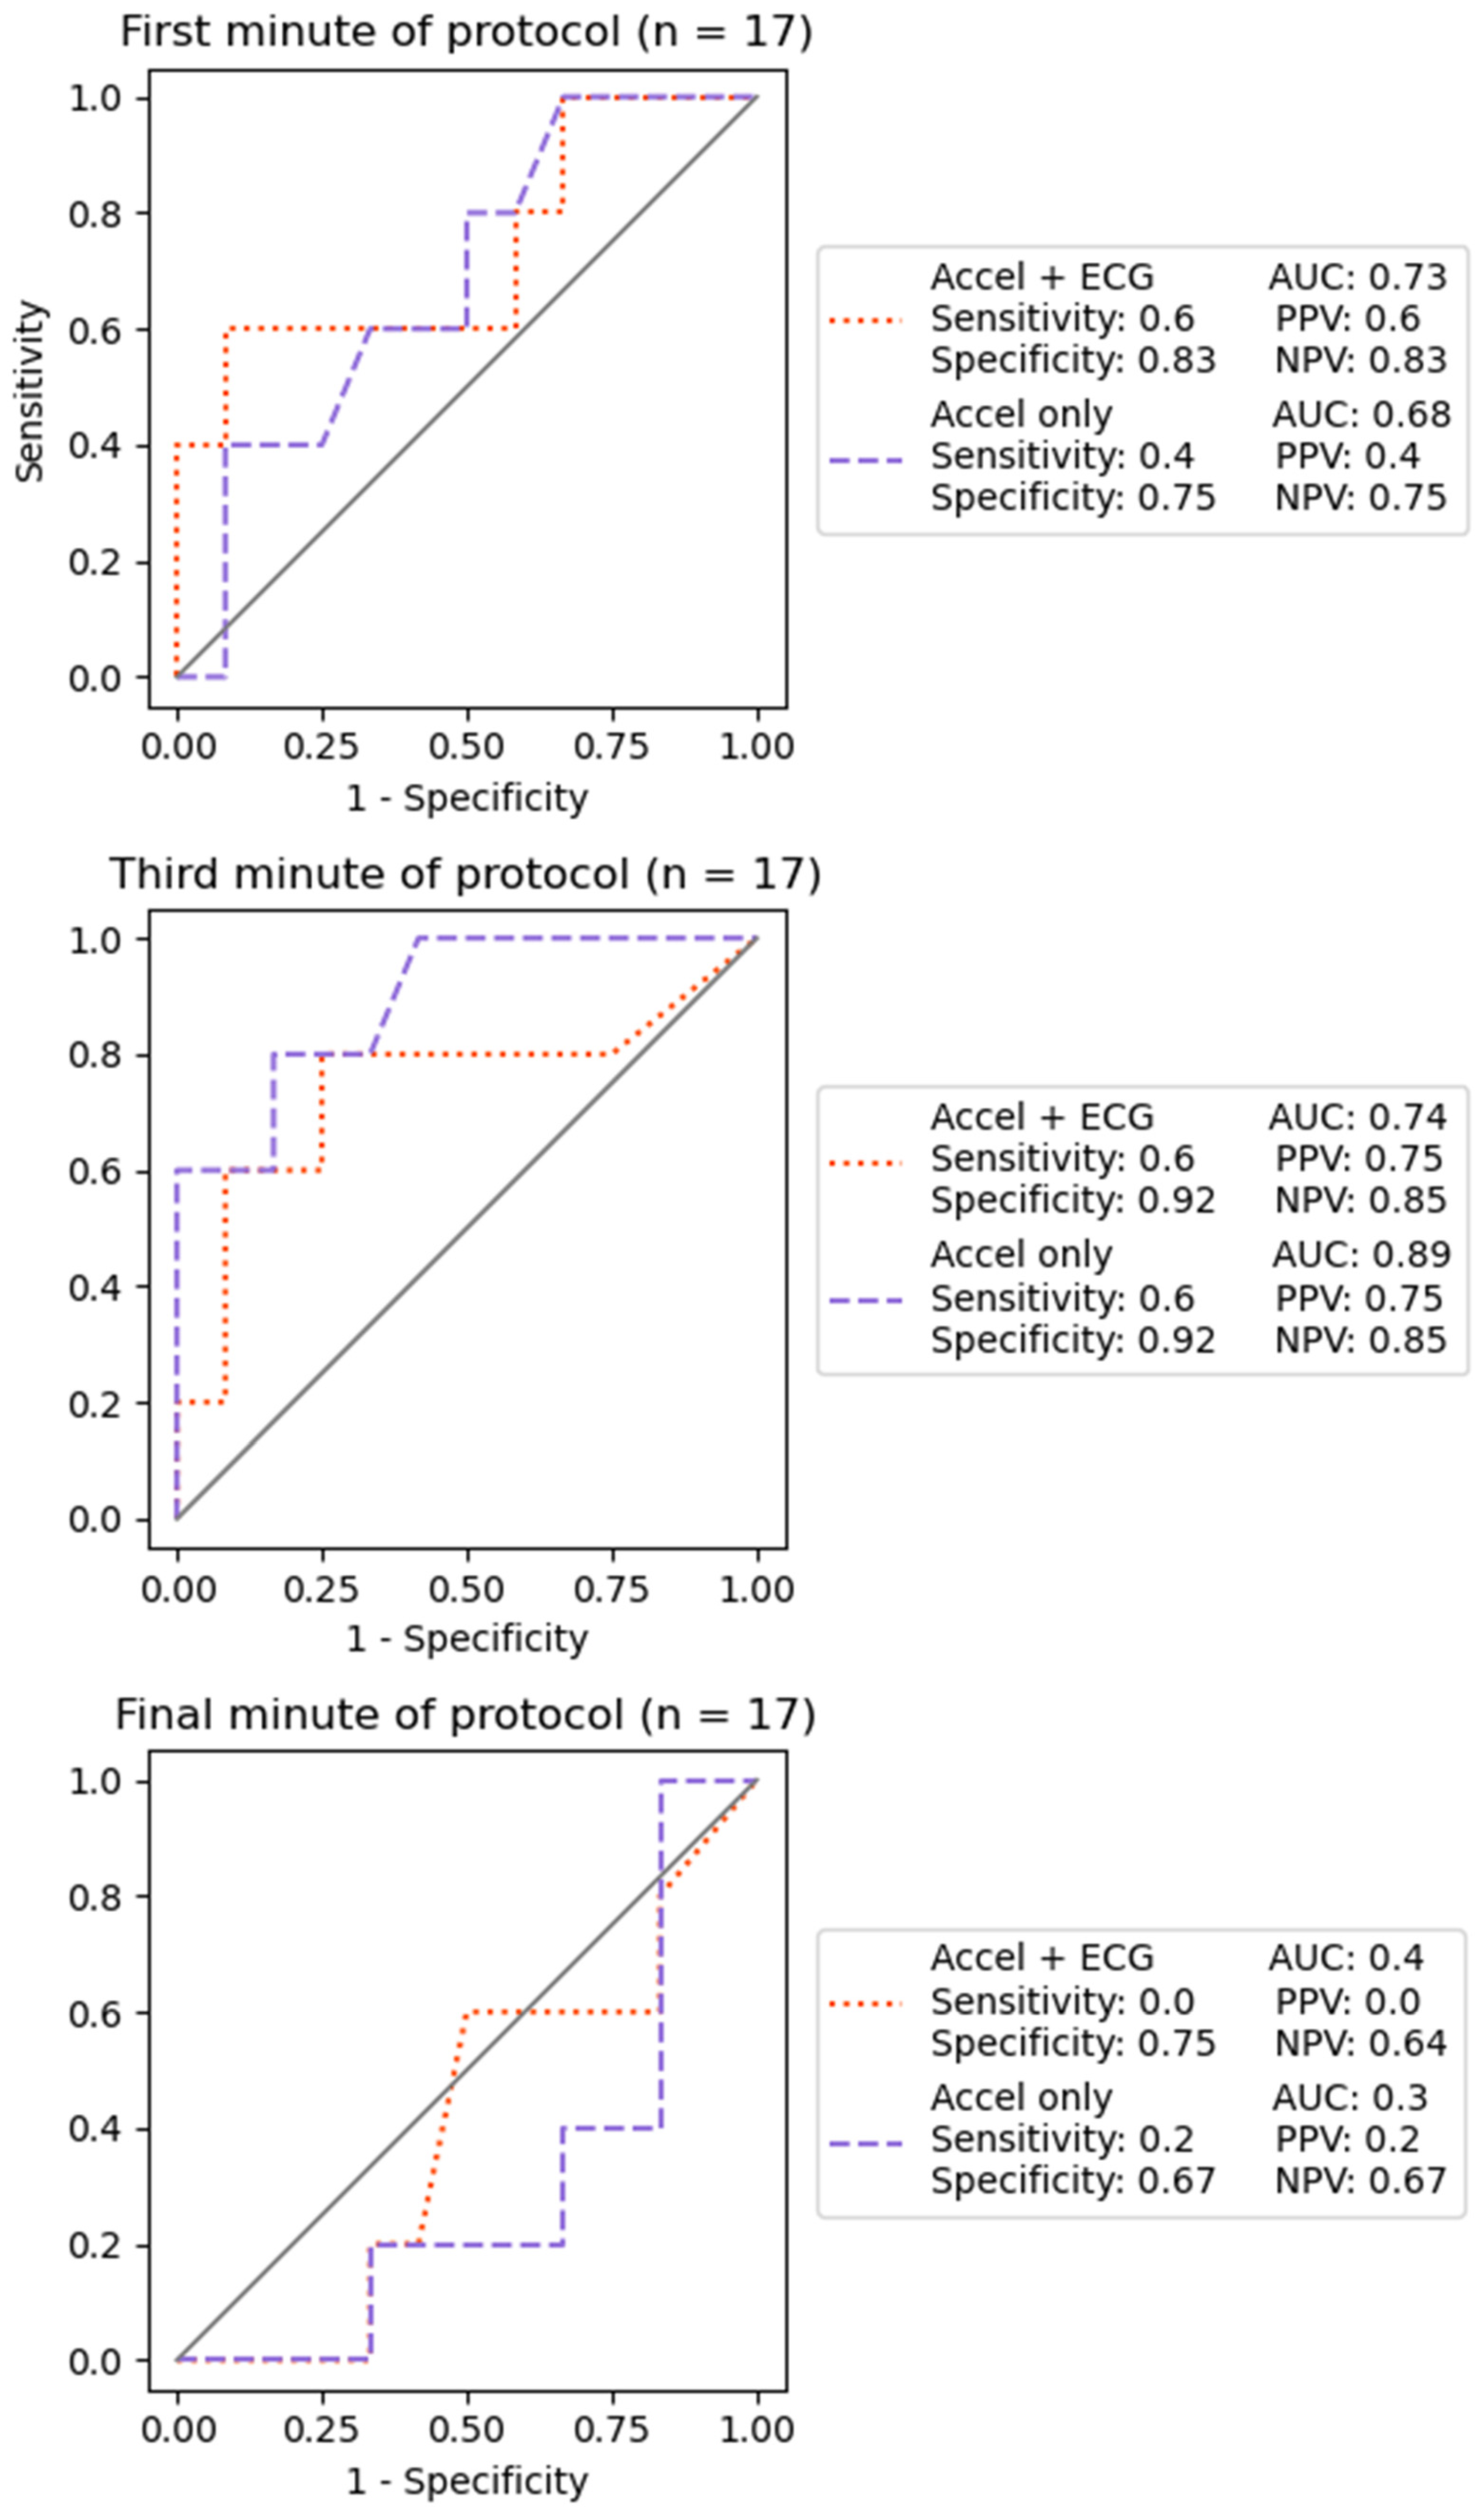
3.3. LOOCV Experiment
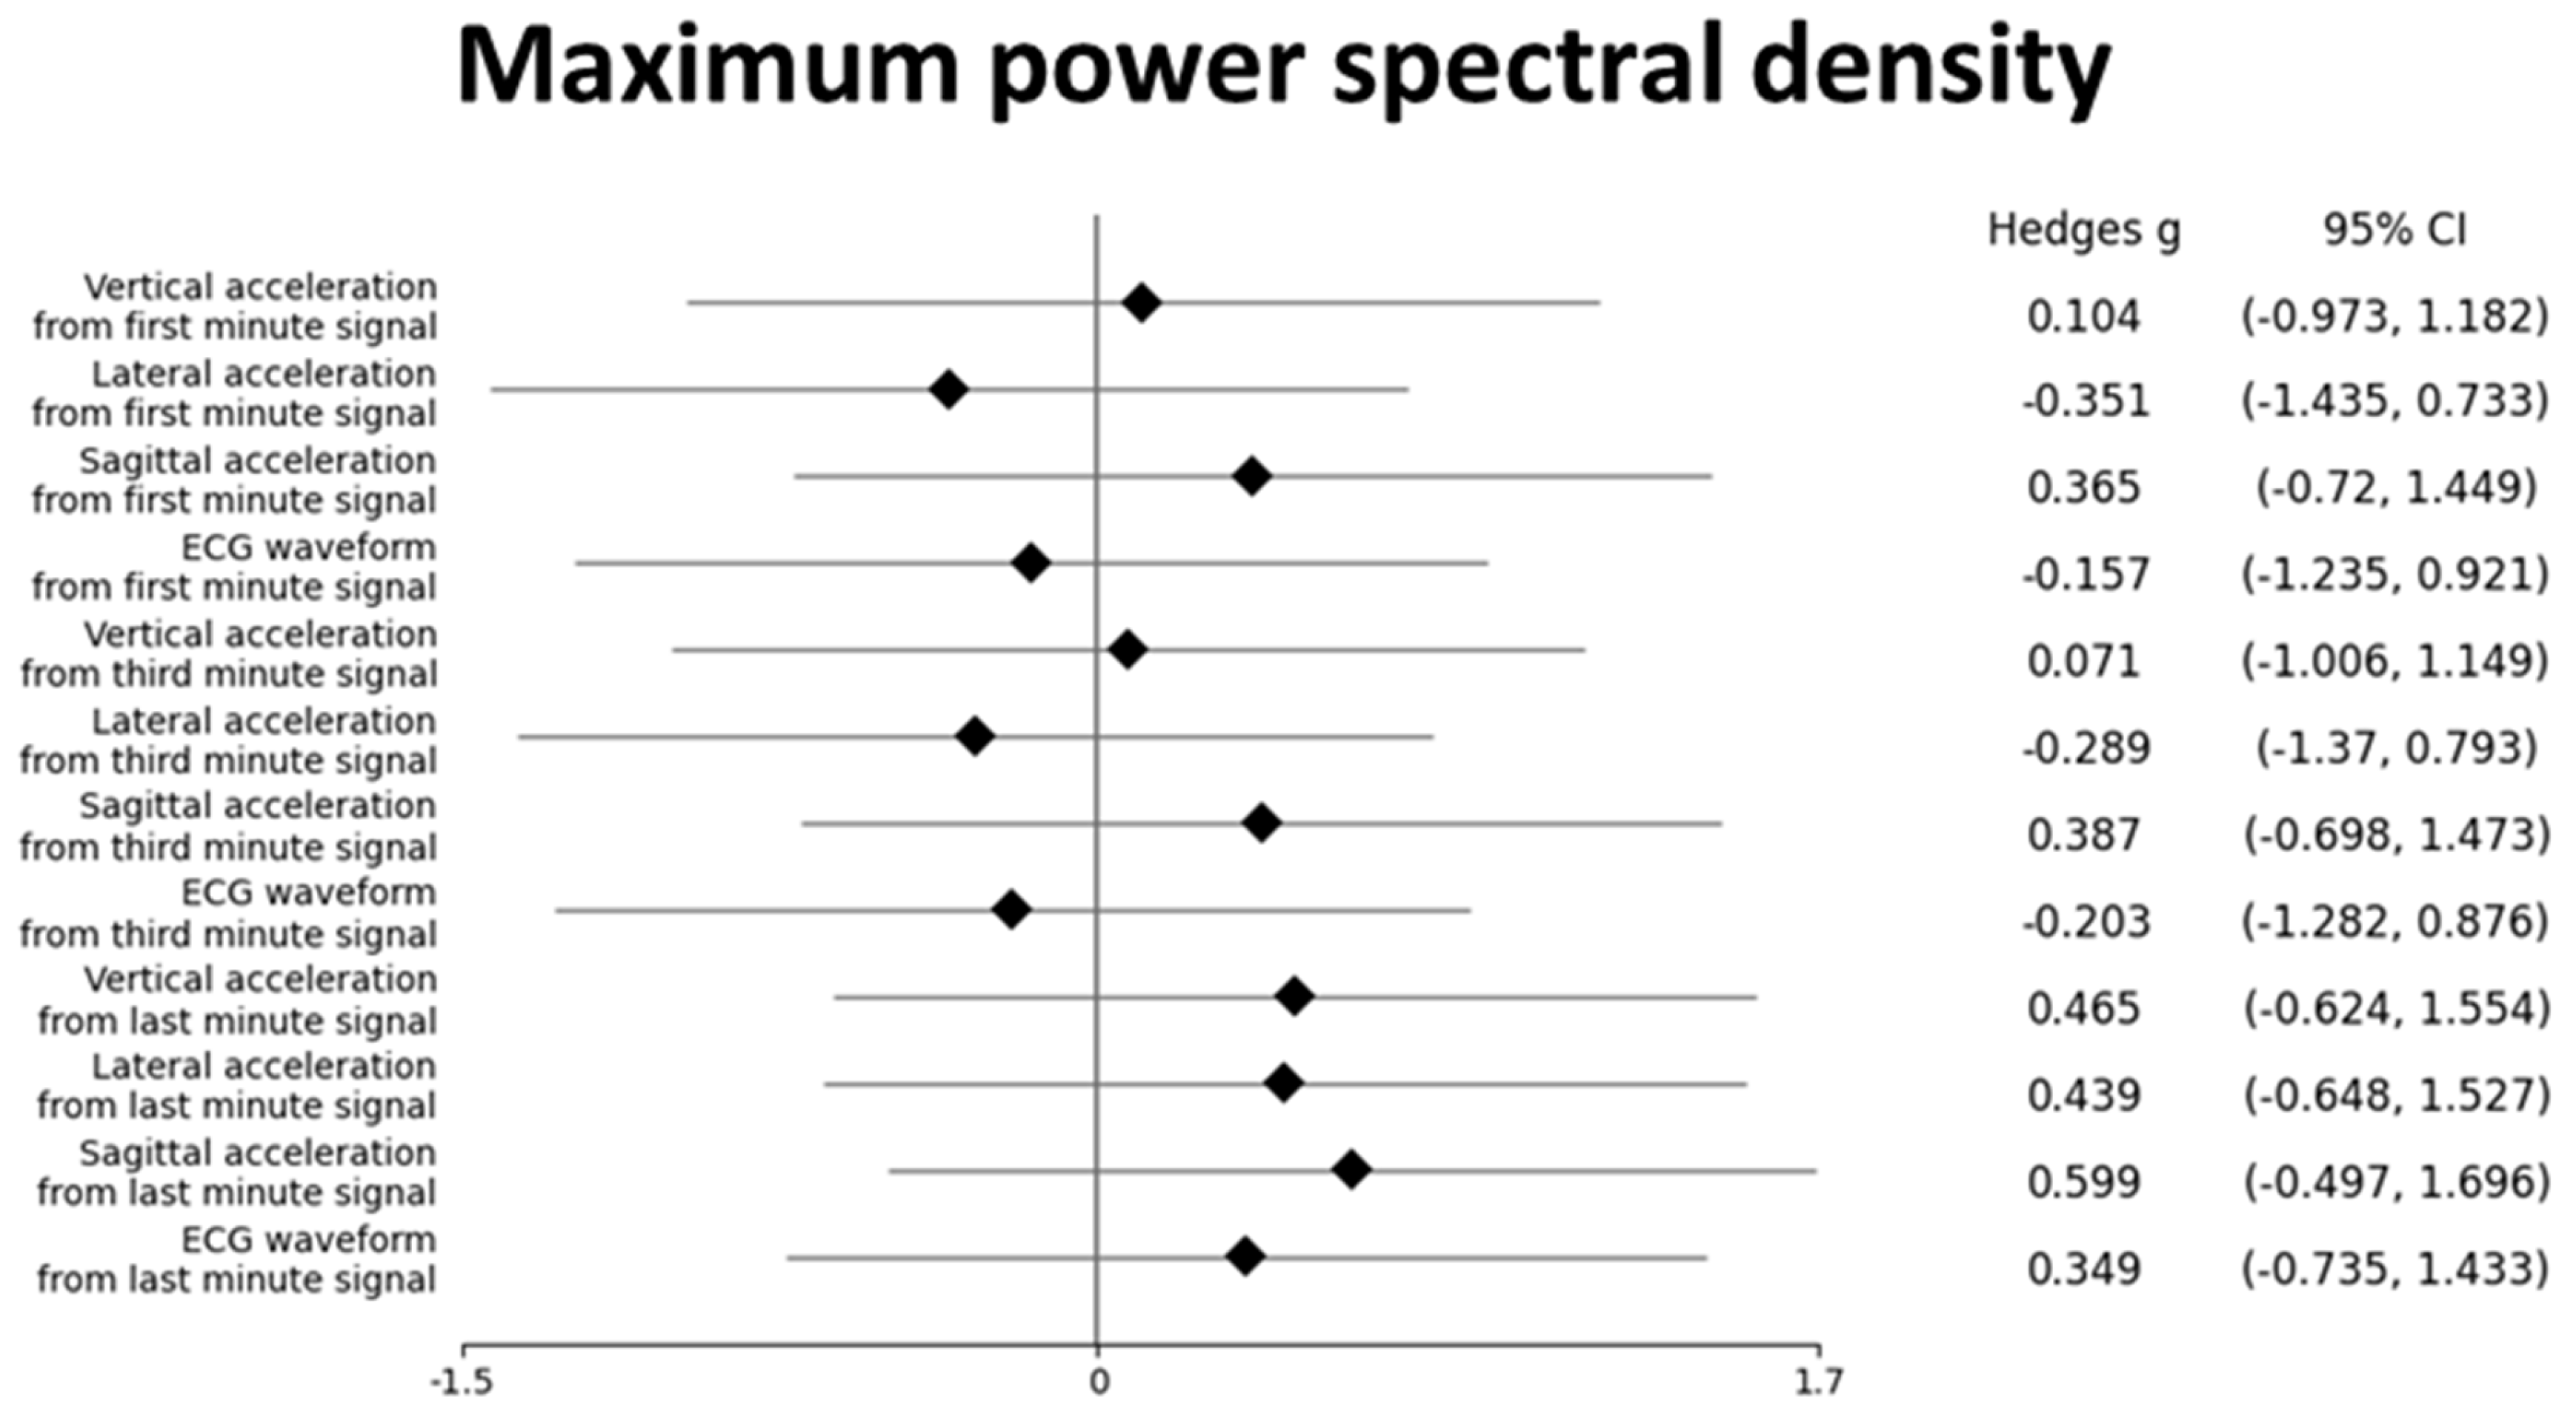
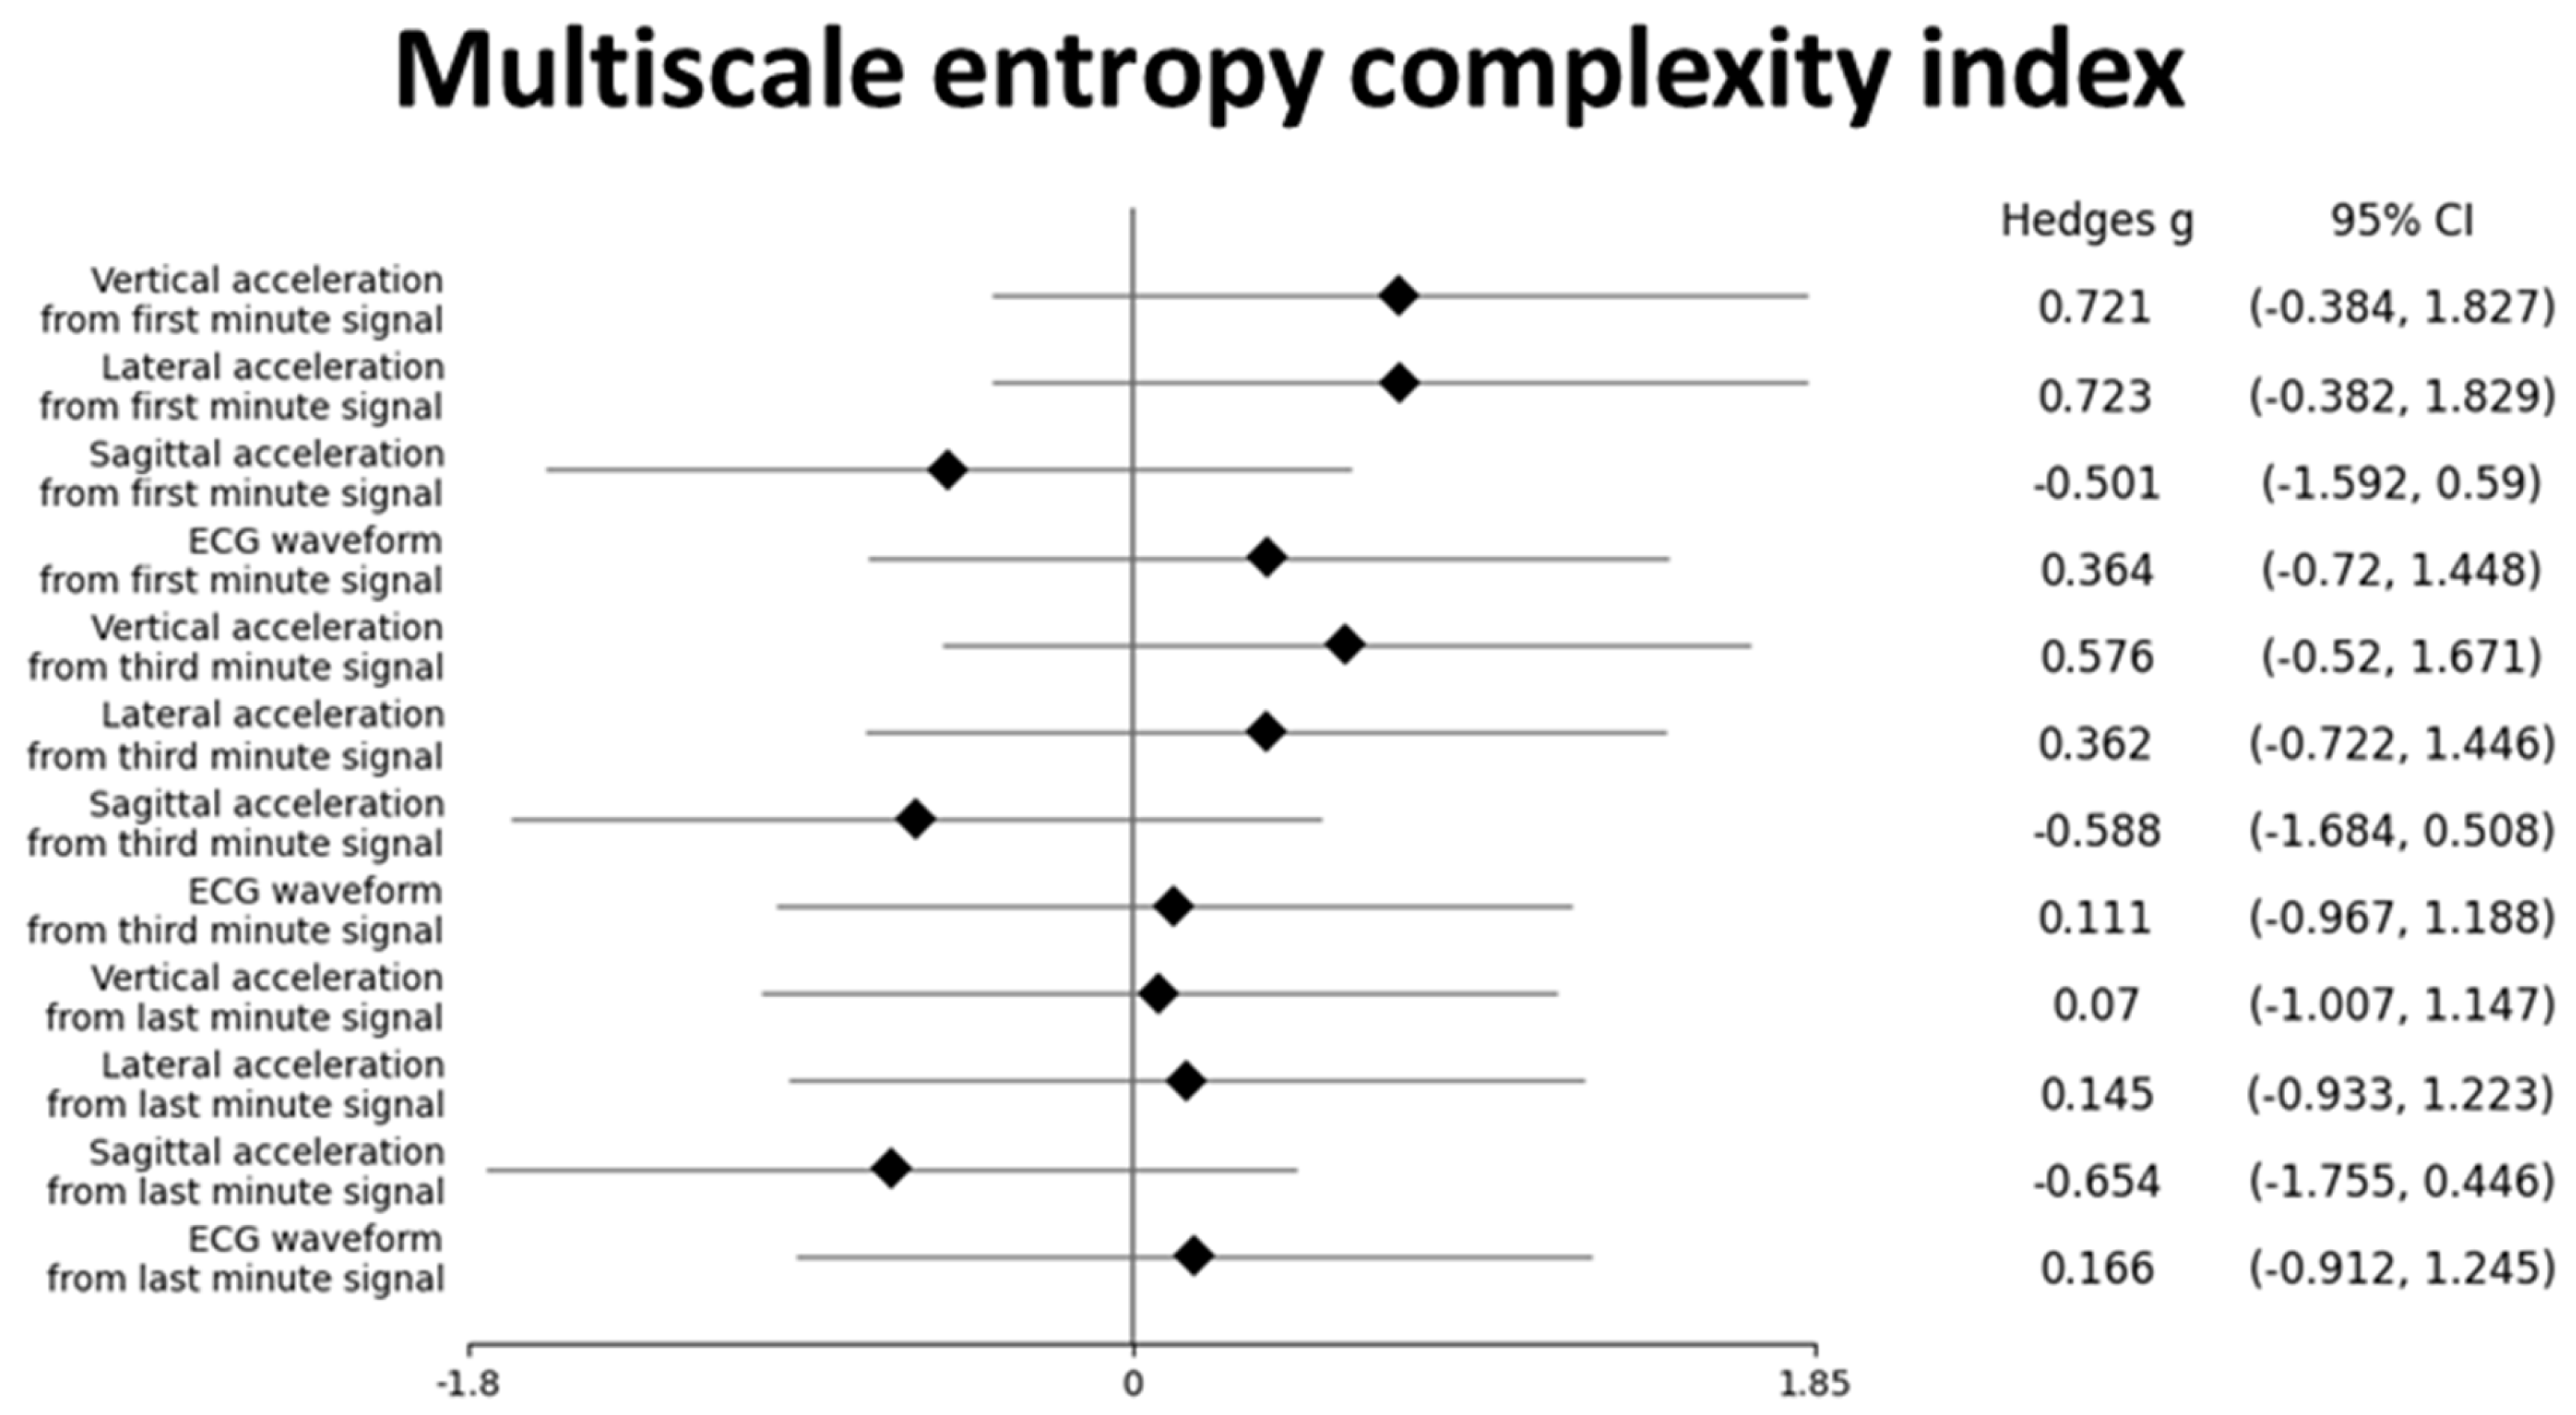
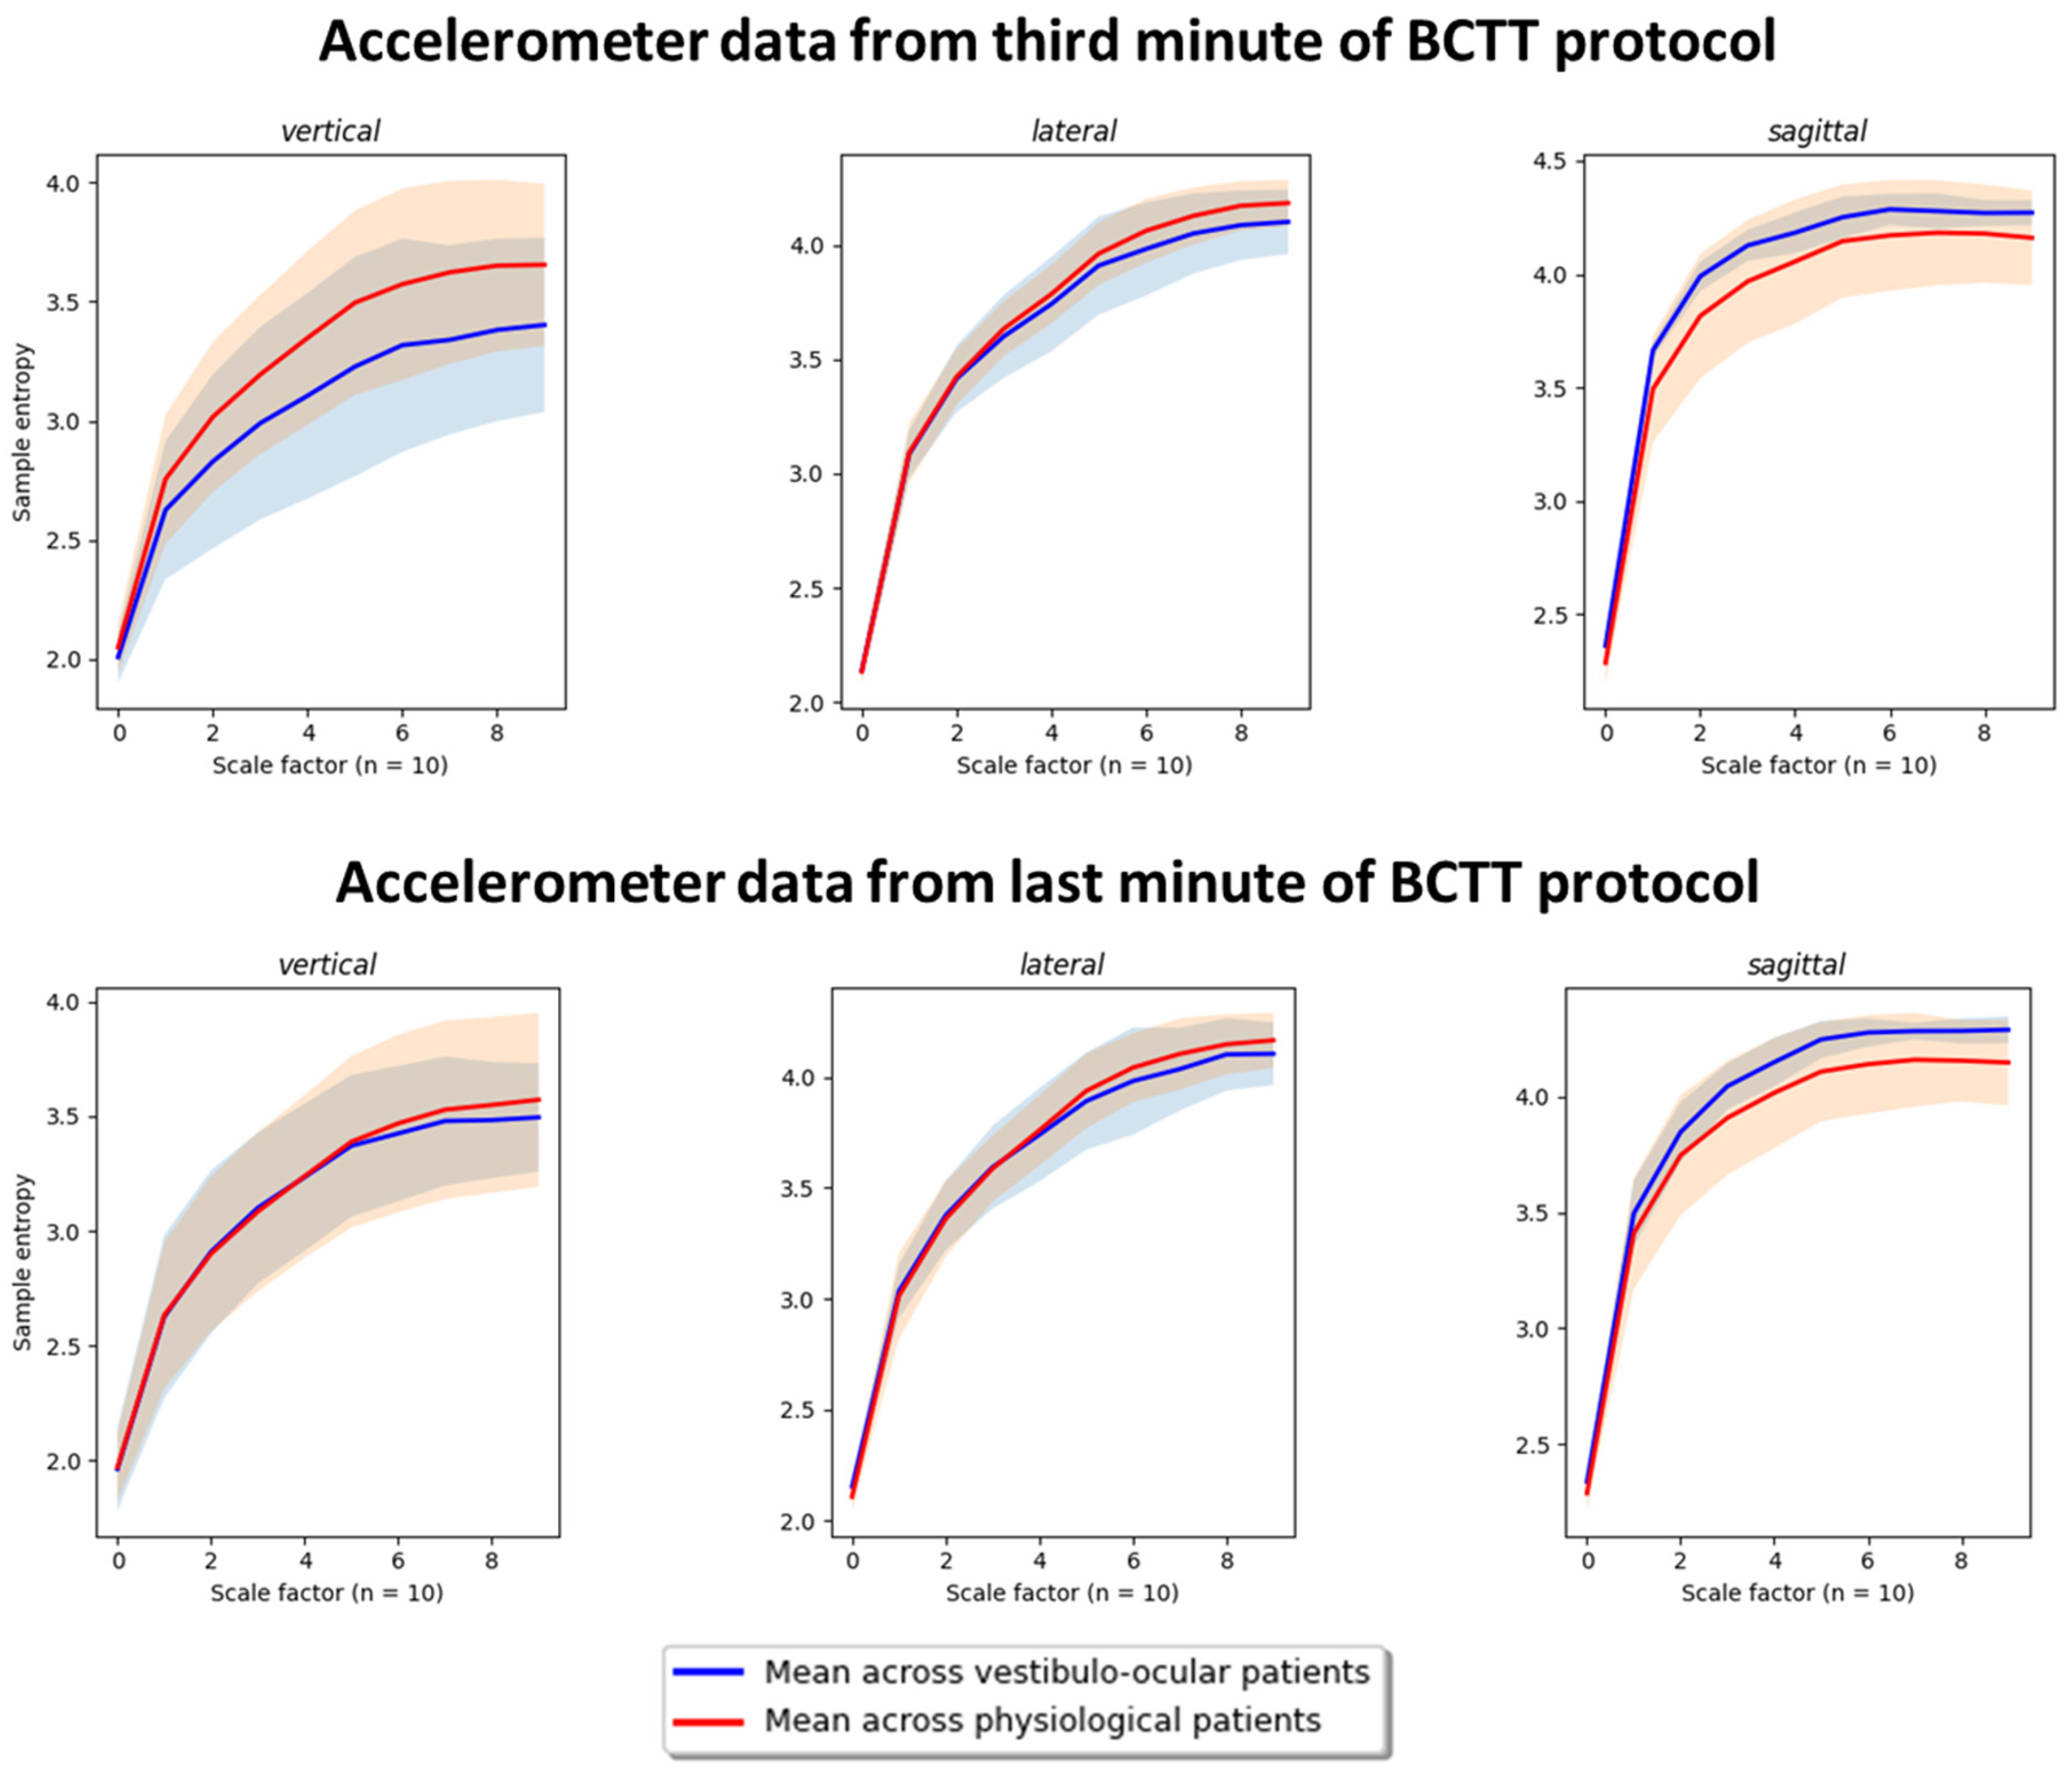
3.4. Post-Hoc Results
4. Discussion
5. Limitations
6. Future Directions
7. Conclusions
Author Contributions
Funding
Institutional Review Board Statement
Informed Consent Statement
Data Availability Statement
Conflicts of Interest
References
- Romeu-Mejia, R.; Giza, C.C.; Goldman, J.T. Concussion Pathophysiology and Injury Biomechanics. Curr. Rev. Musculoskelet. Med. 2019, 12, 105–116. [Google Scholar] [CrossRef] [PubMed]
- Feigin, V.L.; Theadom, A.; Barker-Collo, S.; Starkey, N.J.; McPherson, K.; Kahan, M.; Dowell, A.; Brown, P.; Parag, V.; Kydd, R.; et al. Incidence of traumatic brain injury in New Zealand: A population-based study. Lancet Neurol. 2013, 12, 53–64. [Google Scholar] [CrossRef] [PubMed]
- Douglas, D.B.; Ro, T.; Toffoli, T.; Krawchuk, B.; Muldermans, J.; Gullo, J.; Dulberger, A.; Anderson, A.E.; Douglas, P.K.; Wintermark, M. Neuroimaging of Traumatic Brain Injury. Med. Sci. 2018, 7, 2. [Google Scholar] [CrossRef] [PubMed]
- Jain, S.; Iverson, L. Glasgow Coma Scale; StatPearls Publishing: Treasure Island, FL, USA, 2020. [Google Scholar]
- Sussman, E.S.; Pendharkar, A.V.; Ho, A.L.; Ghajar, J. Mild traumatic brain injury and concussion: Terminology and classification. Handb. Clin. Neurol. 2018, 158, 21–24. [Google Scholar]
- Theadom, A.; Starkey, N.J.; Dowell, T.; Hume, P.A.; Kahan, M.; McPherson, K.; Feigin, V.; Group, B.R. Sports-related brain injury in the general population: An epidemiological study. J. Sci. Med. Sport 2014, 17, 591–596. [Google Scholar] [CrossRef]
- McCrory, P.; Meeuwisse, W.H.; Aubry, M.; Cantu, B.; Dvorak, J.; Echemendia, R.J.; Engebretsen, L.; Johnston, K.; Kutcher, J.S.; Raftery, M.; et al. Consensus statement on concussion in sport: The 4th International Conference on Concussion in Sport held in Zurich, November 2012. Br. J. Sport. Med. 2013, 47, 250–258. [Google Scholar] [CrossRef]
- McCrory, P.; Meeuwisse, W.; Dvorak, J.; Aubry, M.; Bailes, J.; Broglio, S.; Cantu, R.C.; Cassidy, D.; Echemendia, R.J.; Castellani, R.J.; et al. Consensus statement on concussion in sport-the 5(th) international conference on concussion in sport held in Berlin, October 2016. Br. J. Sport. Med. 2017, 51, 838–847. [Google Scholar]
- Kara, S.; Crosswell, H.; Forch, K.; Cavadino, A.; McGeown, J.; Fulcher, M. Less than Half of Patients Recover within 2 Weeks of Injury after a Sports-Related Mild Traumatic Brain Injury: A 2-Year Prospective Study. Clin. J. Sport. Med. 2020, 30, 96–101. [Google Scholar] [CrossRef]
- Theadom, A.; Parag, V.; Dowell, T.; McPherson, K.; Starkey, N.; Barker-Collo, S.; Jones, K.; Ameratunga, S.; Feigin, V.L.; BIONIC Research Group. Persistent problems 1 year after mild traumatic brain injury: A longitudinal population study in New Zealand. Br. J. Gen. Pract. 2016, 66, e16–e23. [Google Scholar] [CrossRef]
- Voormolen, D.C.; Zeldovich, M.; Haagsma, J.A.; Polinder, S.; Friedrich, S.; Maas, A.I.R.; Wilson, L.; Steyerberg, E.W.; Covic, A.; Andelic, N.; et al. Outcomes after Complicated and Uncomplicated Mild Traumatic Brain Injury at Three-and Six-Months Post-Injury: Results from the CENTER-TBI Study. J. Clin. Med. 2020, 9, 1525. [Google Scholar] [CrossRef]
- Nelson, L.D.; Temkin, N.R.; Dikmen, S.; Barber, J.; Giacino, J.T.; Yuh, E.; Levin, H.S.; McCrea, M.A.; Stein, M.B.; Mukherjee, P.; et al. Recovery After Mild Traumatic Brain Injury in Patients Presenting to US Level I Trauma Centers: A Transforming Research and Clinical Knowledge in Traumatic Brain Injury (TRACK-TBI) Study. JAMA Neurol. 2019, 76, 1049–1059. [Google Scholar] [CrossRef] [PubMed]
- Ellis, M.J.; Leddy, J.J.; Willer, B. Physiological, vestibulo-ocular and cervicogenic post-concussion disorders: An evidence-based classification system with directions for treatment. Brain Inj. 2015, 29, 238–248. [Google Scholar] [CrossRef] [PubMed]
- Leddy, J.J. Buffalo Concussion Test—Instruction Manual. Available online: https://ubortho.com/wp-content/uploads/2020/10/Buffalo-Concussion-Treadmill-Test-Manual.pdf (accessed on 10 May 2020).
- Leddy, J.J.; Baker, J.G.; Merchant, A.; Picano, J.; Gaile, D.; Matuszak, J.; Willer, B. Brain or strain? Symptoms alone do not distinguish physiologic concussion from cervical/vestibular injury. Clin. J. Sport Med. 2015, 25, 237–242. [Google Scholar] [CrossRef]
- Leddy, J.J.; Baker, J.G.; Willer, B. Active rehabilitation of concussion and post-concussion syndrome. Phys. Med. Rehabil. Clin. N. Am. 2016, 27, 437–454. [Google Scholar] [CrossRef] [PubMed]
- Leddy, J.; Baker, J.G.; Haider, M.N.; Hinds, A.; Willer, B. A physiological approach to prolonged recovery from sport-related concussion. J. Athl. Train. 2017, 52, 299–308. [Google Scholar] [CrossRef]
- Ellis, M.J.; Leddy, J.; Willer, B. Multi-disciplinary management of athletes with post-concussion syndrome: An evolving pathophysiological approach. Front. Neurol. 2016, 7, 136. [Google Scholar] [CrossRef]
- Leddy, J.J.; Baker, J.G.; Kozlowski, K.; Bisson, L.; Willer, B. Reliability of a graded exercise test for assessing recovery from concussion. Clin. J. Sport Med. 2011, 21, 89–94. [Google Scholar] [CrossRef]
- Leddy, J.J.; Hinds, A.L.; Miecznikowski, J.; Darling, S.; Matuszak, J.; Baker, J.G.; Picano, J.; Willer, B. Safety and Prognostic Utility of Provocative Exercise Testing in Acutely Concussed Adolescents: A Randomized Trial. Clin. J. Sport Med. Off. J. Can. Acad. Sport. Med. 2018, 28, 13–20. [Google Scholar] [CrossRef]
- Leddy, J.J.; Kozlowski, K.; Donnelly, J.P.; Pendergast, D.R.; Epstein, L.H.; Willer, B. A preliminary study of subsymptom threshold exercise training for refractory post-concussion syndrome. Clin. J. Sport. Med. 2010, 20, 21–27. [Google Scholar] [CrossRef]
- Kenzie, E.S.; Parks, E.L.; Bigler, E.D.; Wright, D.W.; Lim, M.M.; Chesnutt, J.C.; Hawryluk, G.W.J.; Gordon, W.; Wakeland, W. The dynamics of concussion: Mapping pathophysiology, persistence, and recovery with causal-loop diagramming. Front. Neurol. 2018, 9, 203. [Google Scholar] [CrossRef]
- Gall, B.; Parkhouse, W.; Goodman, D. Heart rate variability of recently concussed athletes at rest and exercise. Med. Sci. Sport. Exerc. 2004, 36, 1269–1274. [Google Scholar] [CrossRef] [PubMed]
- Bishop, S.A.; Dech, R.; Baker, T.; Butz, M.; Aravinthan, K.; Neary, J.P. Parasympathetic baroreflexes and heart rate variability during acute stage of sport concussion recovery. Brain Inj. 2017, 31, 247–259. [Google Scholar] [CrossRef] [PubMed]
- Akin, F.W.; Murnane, O.D.; Hall, C.D.; Riska, K.M. Vestibular consequences of mild traumatic brain injury and blast exposure: A review. Brain Inj. 2017, 31, 1188–1194. [Google Scholar] [CrossRef] [PubMed]
- Franke, L.M.; Walker, W.C.; Cifu, D.X.; Ochs, A.L.; Lew, H.L. Sensorintegrative dysfunction underlying vestibular disorders after traumatic brain injury: A review. J. Rehabil. Res. Dev. 2012, 49, 985–993. [Google Scholar] [CrossRef] [PubMed]
- Doherty, C.; Zhao, L.; Ryan, J.; Komaba, Y.; Inomata, A.; Caulfield, B. Quantification of postural control deficits in patients with recent concussion: An inertial-sensor based approach. Clin. Biomech. 2017, 42, 79–84. [Google Scholar] [CrossRef]
- Doherty, C.; Zhao, L.; Ryan, J.; Komaba, Y.; Inomata, A.; Caulfield, B. Concussion is associated with altered preparatory postural adjustments during gait initiation. Hum. Mov. Sci. 2017, 52, 160–169. [Google Scholar] [CrossRef] [PubMed]
- Slobounov, S.; Sebastianelli, W.; Hallett, M. Residual brain dysfunction observed one year post-mild traumatic brain injury: Combined EEG and balance study. Clin. Neurophysiol. 2012, 123, 1755–1761. [Google Scholar] [CrossRef]
- McCrea, M.; Hammeke, T.; Olsen, G.; Leo, P.; Guskiewicz, K. Unreported concussion in high school football players: Implications for prevention. Clin. J. Sport Med. 2004, 14, 13–17. [Google Scholar] [CrossRef]
- Delaney, J.S.; Lacroix, V.J.; Leclerc, S.; Johnston, K.M. Concussions among university football and soccer players. Clin. J. Sport. Med. 2002, 12, 331–338. [Google Scholar] [CrossRef]
- Meier, T.B.; Brummel, B.J.; Singh, R.; Nerio, C.J.; Polanski, D.W.; Bellgowan, P.S. The underreporting of self-reported symptoms following sports-related concussion. J. Sci. Med. Sport. 2015, 18, 507–511. [Google Scholar] [CrossRef]
- Asken, B.M.; McCrea, M.A.; Clugston, J.R.; Snyder, A.R.; Houck, Z.M.; Bauer, R.M. “Playing Through It”: Delayed Reporting and Removal From Athletic Activity After Concussion Predicts Prolonged Recovery. J. Athl. Train. 2016, 51, 329–335. [Google Scholar] [CrossRef] [PubMed]
- Galbraith, H.; Quesnele, J.; Kenrick-Rochon, S.; Grenier, S.; Baldisera, T. What are the knowledge, attitudes and beliefs regarding concussion of primary care physicians and family resident physicians in rural communities? J. Concussion 2020, 4, 2059700220974548. [Google Scholar] [CrossRef]
- Yorke, A.M.; Littleton, S.; Alsalaheen, B.A. Concussion Attitudes and Beliefs, Knowledge, and Clinical Practice: Survey of Physical Therapists. Phys. Ther. 2016, 96, 1018–1028. [Google Scholar] [CrossRef] [PubMed]
- Reid, D.; Stuart, C.; Fulcher, M.; Hume, A.P.; Theadom, A.; Whatman, C.; Walters, S. Knowledge and Attitudes (KA) Surveys on Concussion in Sports: Doctor September 2017 Survey. Report #4 to Accident Compensation Corporation; SPRINZ, Auckland University of Technology: Auckland, New Zealand, 2018; p. 15. [Google Scholar]
- Russell, B.; McDaid, A.; Toscano, W.; Hume, P. Moving the Lab into the Mountains: A Pilot Study of Human Activity Recognition in Unstructured Environments. Sensors 2021, 21, 654. [Google Scholar] [CrossRef] [PubMed]
- Sidey-Gibbons, J.A.M.; Sidey-Gibbons, C.J. Machine learning in medicine: A practical introduction. BMC Med. Res. Methodol. 2019, 19, 64. [Google Scholar] [CrossRef] [PubMed]
- Ignatov, A. Real-time human activity recognition from accelerometer data using Convolutional Neural Networks. Appl. Soft Comput. 2018, 62, 915–922. [Google Scholar] [CrossRef]
- Clouthier, A.L.; Ross, G.B.; Graham, R.B. Sensor Data Required for Automatic Recognition of Athletic Tasks Using Deep Neural Networks. Front. Bioeng. Biotechnol. 2020, 7, 473. [Google Scholar] [CrossRef]
- Attia, Z.I.; Kapa, S.; Lopez-Jimenez, F.; McKie, P.M.; Ladewig, D.J.; Satam, G.; Pellikka, P.A.; Enriquez-Sarano, M.; Noseworthy, P.A.; Munger, T.M.; et al. Screening for cardiac contractile dysfunction using an artificial intelligence–enabled electrocardiogram. Nat. Med. 2019, 25, 70–74. [Google Scholar] [CrossRef]
- Esteva, A.; Robicquet, A.; Ramsundar, B.; Kuleshov, V.; DePristo, M.; Chou, K.; Cui, C.; Corrado, G.; Thrun, S.; Dean, J. A guide to deep learning in healthcare. Nat. Med. 2019, 25, 24–29. [Google Scholar] [CrossRef]
- Haider, M.N.; Leddy, J.J.; Wilber, C.G.; Viera, K.B.; Bezherano, I.; Wilkins, K.J.; Miecznikowski, J.C.; Willer, B.S. The Predictive Capacity of the Buffalo Concussion Treadmill Test After Sport-Related Concussion in Adolescents. Front. Neurol. 2019, 10, 339. [Google Scholar] [CrossRef]
- Borg, G. Borg’s Perceived Exertion and Pain Scales; Human Kinetics: Champaign, IL, USA, 1998. [Google Scholar]
- McGeown, J.P.; Kara, S.; Fulcher, M.; Crosswell, H.; Borotkanics, R.; Hume, P.A.; Quarrie, K.L.; Theadom, A. Predicting Sport-related mTBI Symptom Resolution Trajectory Using Initial Clinical Assessment Findings: A Retrospective Cohort Study. Sport. Med. 2019, 50, 1191–1202. [Google Scholar] [CrossRef] [PubMed]
- Johnstone, J.A.; Ford, P.A.; Hughes, G.; Watson, T.; Garrett, A.T. Bioharness multivariable monitoring device: Part. II: Reliability. J. Sport. Sci. Med. 2012, 11, 409–417. [Google Scholar]
- Johnstone, J.A.; Ford, P.A.; Hughes, G.; Watson, T.; Garrett, A.T. Bioharness multivariable monitoring device: Part. I: Validity. J. Sport. Sci. Med. 2012, 11, 400–408. [Google Scholar]
- Nazari, G.; Bobos, P.; MacDermid, J.C.; Sinden, K.E.; Richardson, J.; Tang, A. Psychometric properties of the Zephyr bioharness device: A systematic review. BMC Sport. Sci. Med. Rehabil. 2018, 10, 6. [Google Scholar] [CrossRef]
- Cust, E.E.; Sweeting, A.J.; Ball, K.; Robertson, S. Machine and deep learning for sport-specific movement recognition: A systematic review of model development and performance. J. Sport. Sci. 2019, 37, 568–600. [Google Scholar] [CrossRef]
- Welch, P. The use of fast Fourier transform for the estimation of power spectra: A method based on time averaging over short, modified periodograms. IEEE Trans. Audio Electroacoust. 1967, 15, 70–73. [Google Scholar] [CrossRef]
- Pérez-Zapata, A.F.; Cardona-Escobar, A.F.; Jaramillo-Garzón, J.A.; Díaz, G.M. Deep Convolutional Neural Networks and Power Spectral Density Features for Motor Imagery Classification of EEG Signals. In Augmented Cognition: Intelligent Technologies; Springer International Publishing: Cham, Switzerland, 2018; pp. 158–169. [Google Scholar]
- Park, J.-S.; Seo, J.; Cha, H.; Song, H.-J.; Lee, S.-H.; Jang, K.E.; Lee, H.J.; Park, J.; Lee, H.-W.; Chang, Y. Altered power spectral density in the resting-state sensorimotor network in patients with myotonic dystrophy type 1. Sci. Rep. 2018, 8, 987. [Google Scholar] [CrossRef]
- Luft, F.; Sharifi, S.; Mugge, W.; Schouten, A.C.; Bour, L.J.; van Rootselaar, A.F.; Veltink, P.H.; Heida, T. A Power Spectral Density-Based Method to Detect Tremor and Tremor Intermittency in Movement Disorders. Sensors 2019, 19, 4301. [Google Scholar] [CrossRef]
- Costa, M.; Goldberger, A.L.; Peng, C.K. Multiscale entropy analysis of complex physiologic time series. Phys. Rev. Lett. 2002, 89, 068102. [Google Scholar] [CrossRef]
- Costa, M.; Peng, C.K.; Goldberger, A.L.; Hausdorff, J.M. Multiscale entropy analysis of human gait dynamics. Phys. A Stat. Mech. Its Appl. 2003, 330, 53–60. [Google Scholar] [CrossRef]
- Costa, M.; Goldberger, A.L.; Peng, C.K. Multiscale entropy analysis of biological signals. Phys. Rev. E Stat. Nonlin. Soft Matter Phys. 2005, 71, 021906. [Google Scholar] [CrossRef] [PubMed]
- Wu, C.-H.; Lee, C.-H.; Jiang, B.C.; Sun, T.-L. Multiscale Entropy Analysis of Postural Stability for Estimating Fall Risk via Domain Knowledge of Timed-Up-And-Go Accelerometer Data for Elderly People Living in a Community. Entropy 2019, 21, 1076. [Google Scholar] [CrossRef]
- Vabalas, A.; Gowen, E.; Poliakoff, E.; Casson, A.J. Machine learning algorithm validation with a limited sample size. PLoS ONE 2019, 14, e0224365. [Google Scholar] [CrossRef] [PubMed]
- Kis, M. Reliability of a New Test of Balance Function in Healthy and Concussion Populations. J. Funct. Morphol. Kinesiol. 2020, 5, 13. [Google Scholar] [CrossRef] [PubMed]
- Hou, Y.-R.; Chiu, Y.-L.; Chiang, S.-L.; Chen, H.-Y.; Sung, W.-H. Development of a Smartphone-Based Balance Assessment System for Subjects with Stroke. Sensors 2019, 20, 88. [Google Scholar] [CrossRef]
- Iverson, G.L.; Gardner, A.J.; Terry, D.P.; Ponsford, J.L.; Sills, A.K.; Broshek, D.K.; Solomon, G.S. Predictors of clinical recovery from concussion: A systematic review. Br. J. Sport. Med. 2017, 51, 941–948. [Google Scholar] [CrossRef]
- Saito, T.; Rehmsmeier, M. The Precision-Recall Plot Is More Informative than the ROC Plot When Evaluating Binary Classifiers on Imbalanced Datasets. PLoS ONE 2015, 10, e0118432. [Google Scholar] [CrossRef]
- Hajian-Tilaki, K. Receiver Operating Characteristic (ROC) Curve Analysis for Medical Diagnostic Test Evaluation. Casp. J. Intern. Med. 2013, 4, 627–635. [Google Scholar]
- Trevethan, R. Sensitivity, Specificity, and Predictive Values: Foundations, Pliabilities, and Pitfalls in Research and Practice. Front. Public. Health 2017, 5, 307. [Google Scholar] [CrossRef]


| Window Size | Overlap | Accuracy | Kappa | Sensitivity | Specificity | PPV | NPV | |
|---|---|---|---|---|---|---|---|---|
| First minute | 16 | 8 | 0.90 | 0.76 | 0.84 | 0.92 | 0.82 | 0.93 |
| 32 | 16 | 0.93 | 0.83 | 0.92 | 0.93 | 0.84 | 0.97 | |
| 64 | 32 | 0.95 | 0.88 | 0.93 | 0.96 | 0.9 | 0.97 | |
| 128 | 64 | 0.97 | 0.92 | 0.92 | 0.98 | 0.96 | 0.97 | |
| 256 | 128 | 0.98 | 0.96 | 0.98 | 0.99 | 0.97 | 0.99 | |
| Third minute | 16 | 8 | 0.89 | 0.72 | 0.7 | 0.97 | 0.91 | 0.88 |
| 32 | 16 | 0.93 | 0.83 | 0.88 | 0.95 | 0.88 | 0.95 | |
| 64 | 32 | 0.96 | 0.90 | 0.92 | 0.98 | 0.94 | 0.96 | |
| 128 | 64 | 0.95 | 0.88 | 0.87 | 0.99 | 0.96 | 0.94 | |
| 256 | 128 | 0.97 | 0.94 | 0.96 | 0.98 | 0.95 | 0.98 | |
| Final minute | 16 | 8 | 0.88 | 0.69 | 0.7 | 0.95 | 0.86 | 0.88 |
| 32 | 16 | 0.93 | 0.82 | 0.8 | 0.98 | 0.94 | 0.92 | |
| 64 | 32 | 0.96 | 0.91 | 0.95 | 0.97 | 0.92 | 0.98 | |
| 128 | 64 | 0.96 | 0.90 | 0.91 | 0.97 | 0.94 | 0.96 | |
| 256 | 128 | 0.94 | 0.86 | 0.92 | 0.95 | 0.88 | 0.97 |
| Accelerometry + ECG | |||||||||||||||||||
|---|---|---|---|---|---|---|---|---|---|---|---|---|---|---|---|---|---|---|---|
| Participant | 1 | 2 | 3 | 4 | 5 | 6 | 7 | 8 | 9 | 10 | 11 | 12 | 13 | 14 | 15 | 16 | 17 | # of VO Correct | # of Phys correct |
| PSC | V | V | P | V | P | P | V | P | P | P | P | V | P | P | P | P | P | ||
| First minute | 0.01 | 0.01 | 0.29 | 0.84 | 0.00 | 0.09 | 0.65 | 0.39 | 0.62 | 0.00 | 0.49 | 0.93 | 0.04 | 0.22 | 0.54 | 0.00 | 0.00 | 3/5 | 10/12 |
| Third minute | 0.00 | 0.56 | 0.03 | 0.85 | 0.00 | 0.10 | 0.30 | 0.73 | 0.17 | 0.00 | 0.35 | 0.63 | 0.23 | 0.39 | 0.11 | 0.02 | 0.00 | 3/5 | 11/12 |
| Final minute | 0.02 | 0.00 | 0.19 | 0.19 | 0.00 | 0.26 | 0.19 | 0.80 | 0.15 | 0.16 | 0.83 | 0.46 | 0.16 | 0.51 | 0.50 | 0.18 | 0.00 | 0/5 | 8/12 |
| Accelerometry Only | |||||||||||||||||||
| Participant | 1 | 2 | 3 | 4 | 5 | 6 | 7 | 8 | 9 | 10 | 11 | 12 | 13 | 14 | 15 | 16 | 17 | # of VO Correct | # of Phys correct |
| PSC | V | V | P | V | P | P | V | P | P | P | P | V | P | P | P | P | P | ||
| First minute | 0.01 | 0.08 | 0.30 | 0.89 | 0.00 | 0.06 | 0.36 | 0.36 | 0.22 | 0.00 | 0.91 | 0.70 | 0.01 | 0.52 | 0.54 | 0.00 | 0.00 | 2/5 | 9/12 |
| Third minute | 0.05 | 0.95 | 0.03 | 0.79 | 0.00 | 0.18 | 0.38 | 0.44 | 0.04 | 0.01 | 0.61 | 0.85 | 0.01 | 0.33 | 0.05 | 0.02 | 0.00 | 3/5 | 11/12 |
| Final minute | 0.07 | 0.01 | 0.21 | 0.07 | 0.00 | 0.10 | 0.11 | 0.88 | 0.34 | 0.08 | 0.88 | 0.51 | 0.41 | 0.28 | 0.54 | 0.87 | 0.00 | 1/5 | 8/12 |
Disclaimer/Publisher’s Note: The statements, opinions and data contained in all publications are solely those of the individual author(s) and contributor(s) and not of MDPI and/or the editor(s). MDPI and/or the editor(s) disclaim responsibility for any injury to people or property resulting from any ideas, methods, instructions or products referred to in the content. |
© 2023 by the authors. Licensee MDPI, Basel, Switzerland. This article is an open access article distributed under the terms and conditions of the Creative Commons Attribution (CC BY) license (https://creativecommons.org/licenses/by/4.0/).
Share and Cite
McGeown, J.P.; Pedersen, M.; Hume, P.A.; Theadom, A.; Kara, S.; Russell, B. A Novel Method to Assist Clinical Management of Mild Traumatic Brain Injury by Classifying Patient Subgroups Using Wearable Sensors and Exertion Testing: A Pilot Study. Biomechanics 2023, 3, 231-249. https://doi.org/10.3390/biomechanics3020020
McGeown JP, Pedersen M, Hume PA, Theadom A, Kara S, Russell B. A Novel Method to Assist Clinical Management of Mild Traumatic Brain Injury by Classifying Patient Subgroups Using Wearable Sensors and Exertion Testing: A Pilot Study. Biomechanics. 2023; 3(2):231-249. https://doi.org/10.3390/biomechanics3020020
Chicago/Turabian StyleMcGeown, Joshua P., Mangor Pedersen, Patria A. Hume, Alice Theadom, Stephen Kara, and Brian Russell. 2023. "A Novel Method to Assist Clinical Management of Mild Traumatic Brain Injury by Classifying Patient Subgroups Using Wearable Sensors and Exertion Testing: A Pilot Study" Biomechanics 3, no. 2: 231-249. https://doi.org/10.3390/biomechanics3020020