Reliability of a Pendulum Apparatus for the Execution of Plyometric Rebound Exercises and the Comparison of Their Biomechanical Parameters with Load-Matching Vertical Drop Jumps


Abstract
:1. Introduction
2. Materials and Methods
2.1. Design of the Study
2.2. Participants
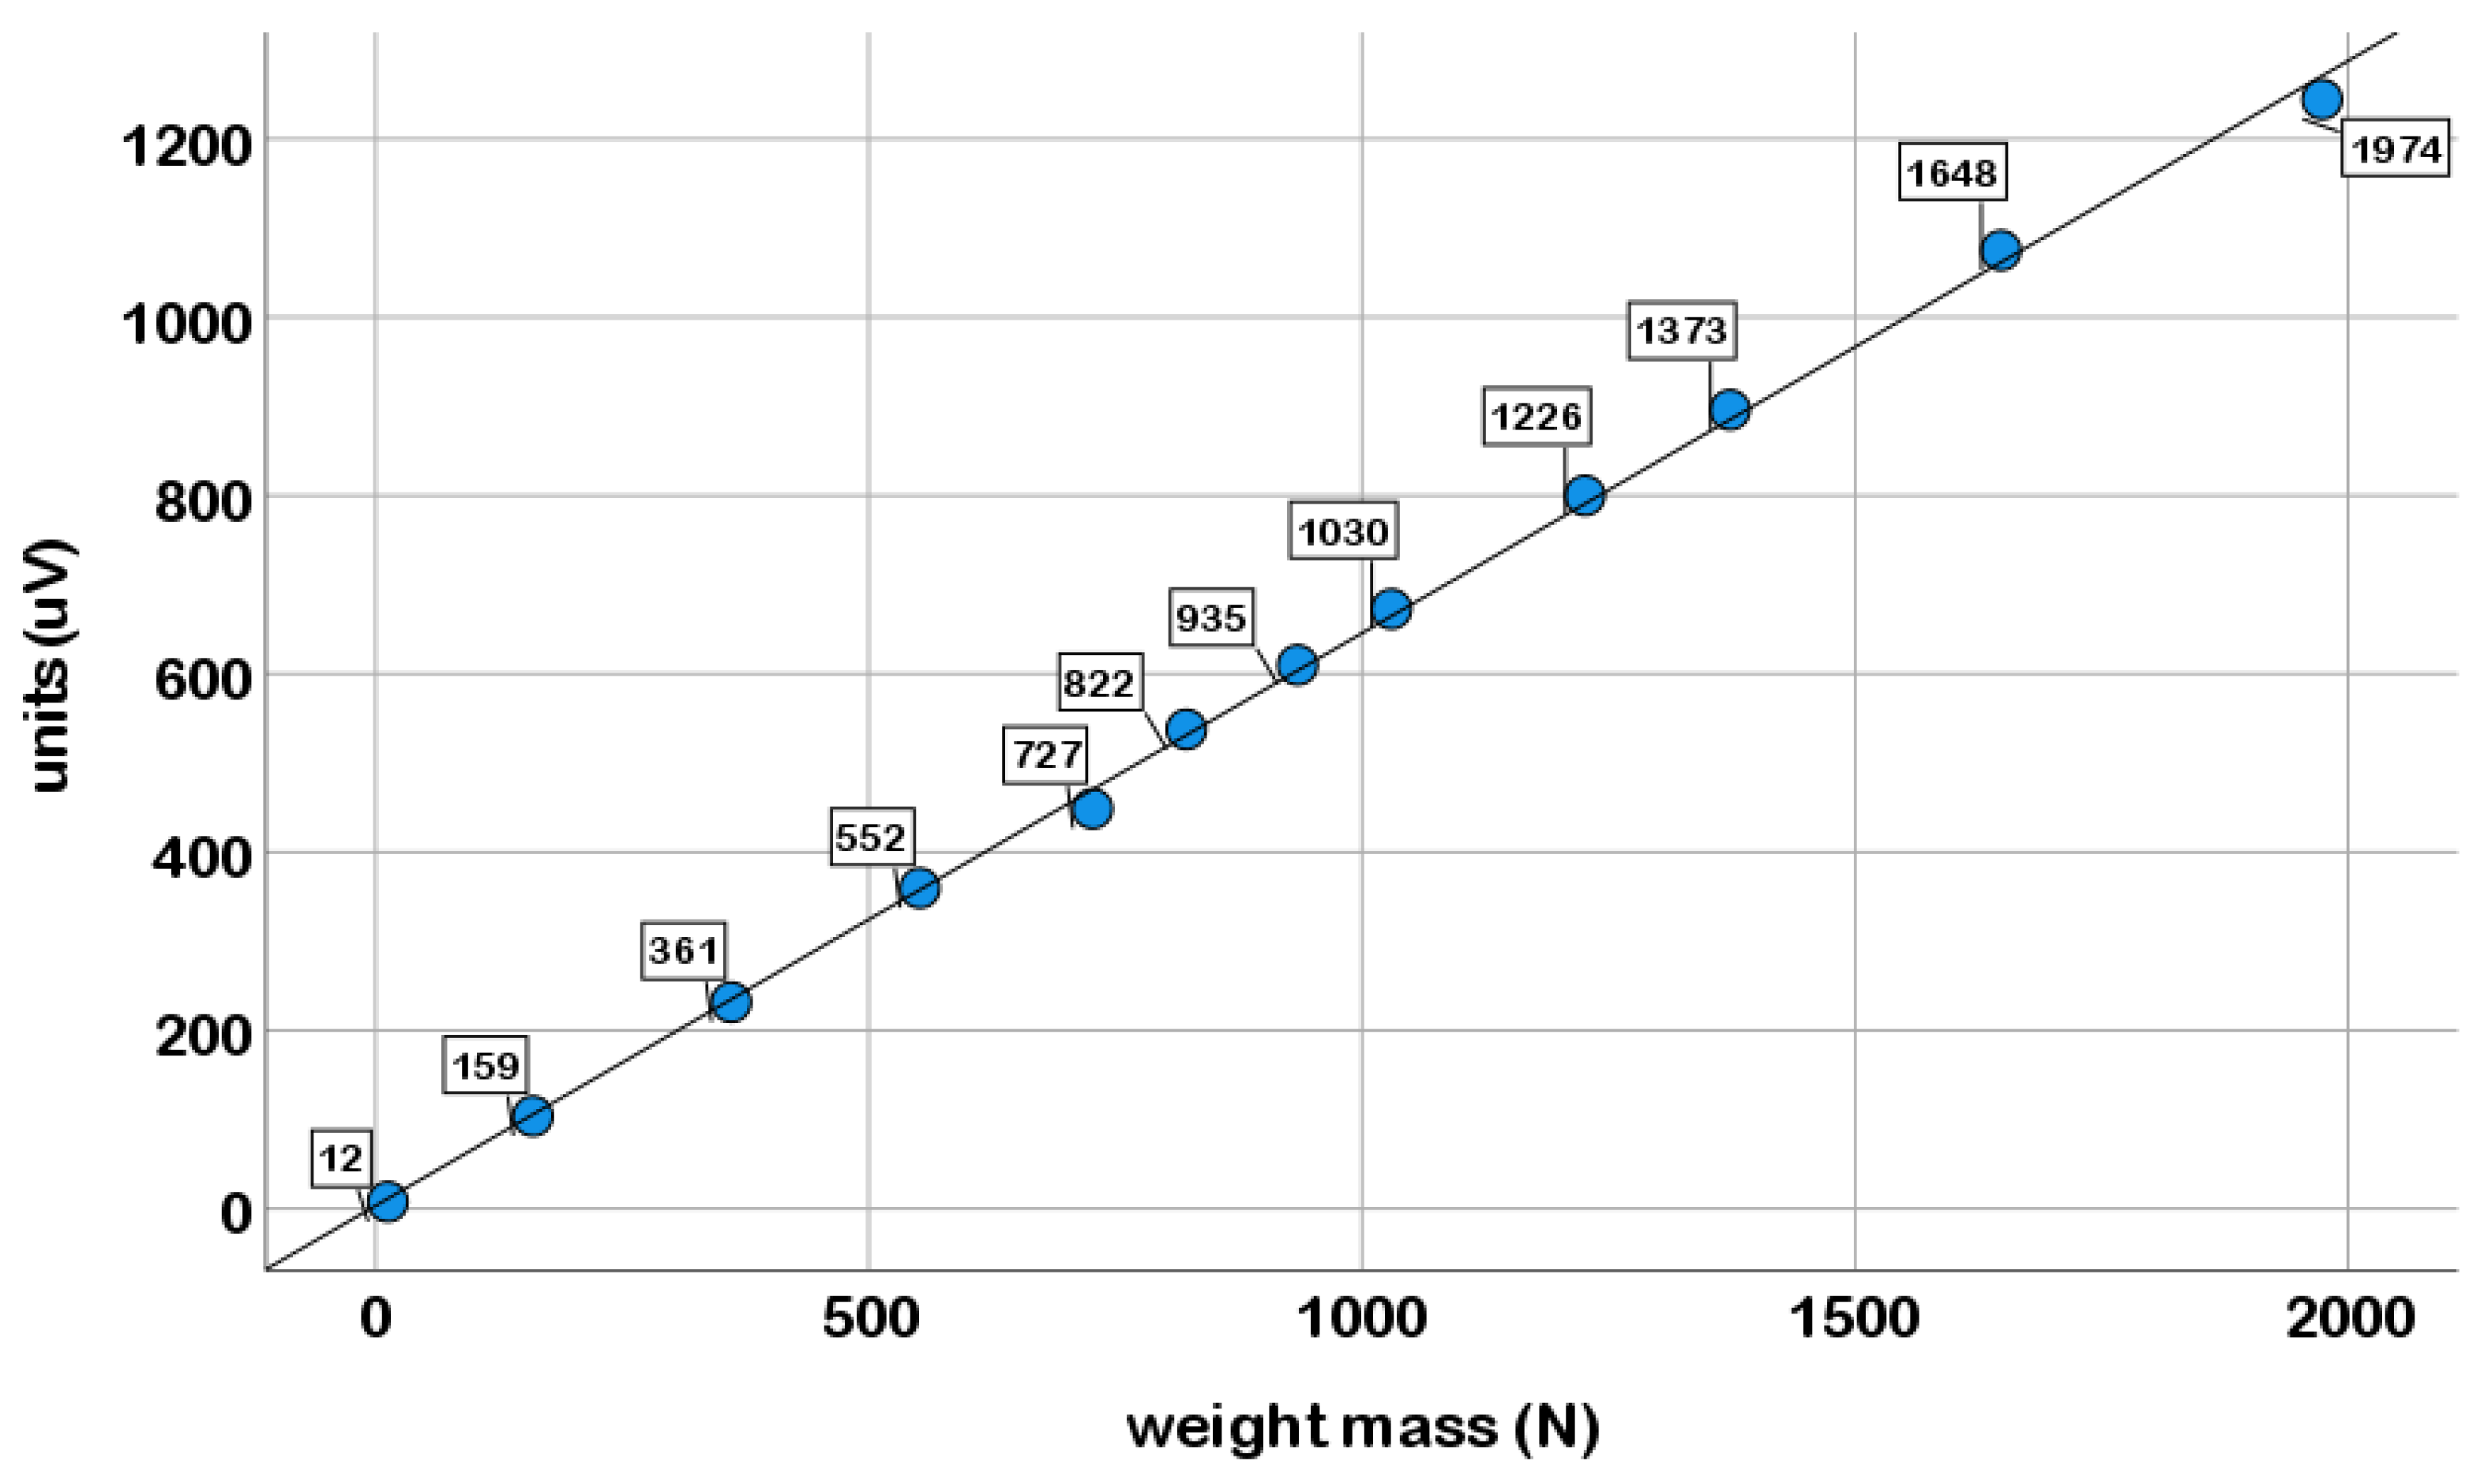
2.3. Instruments
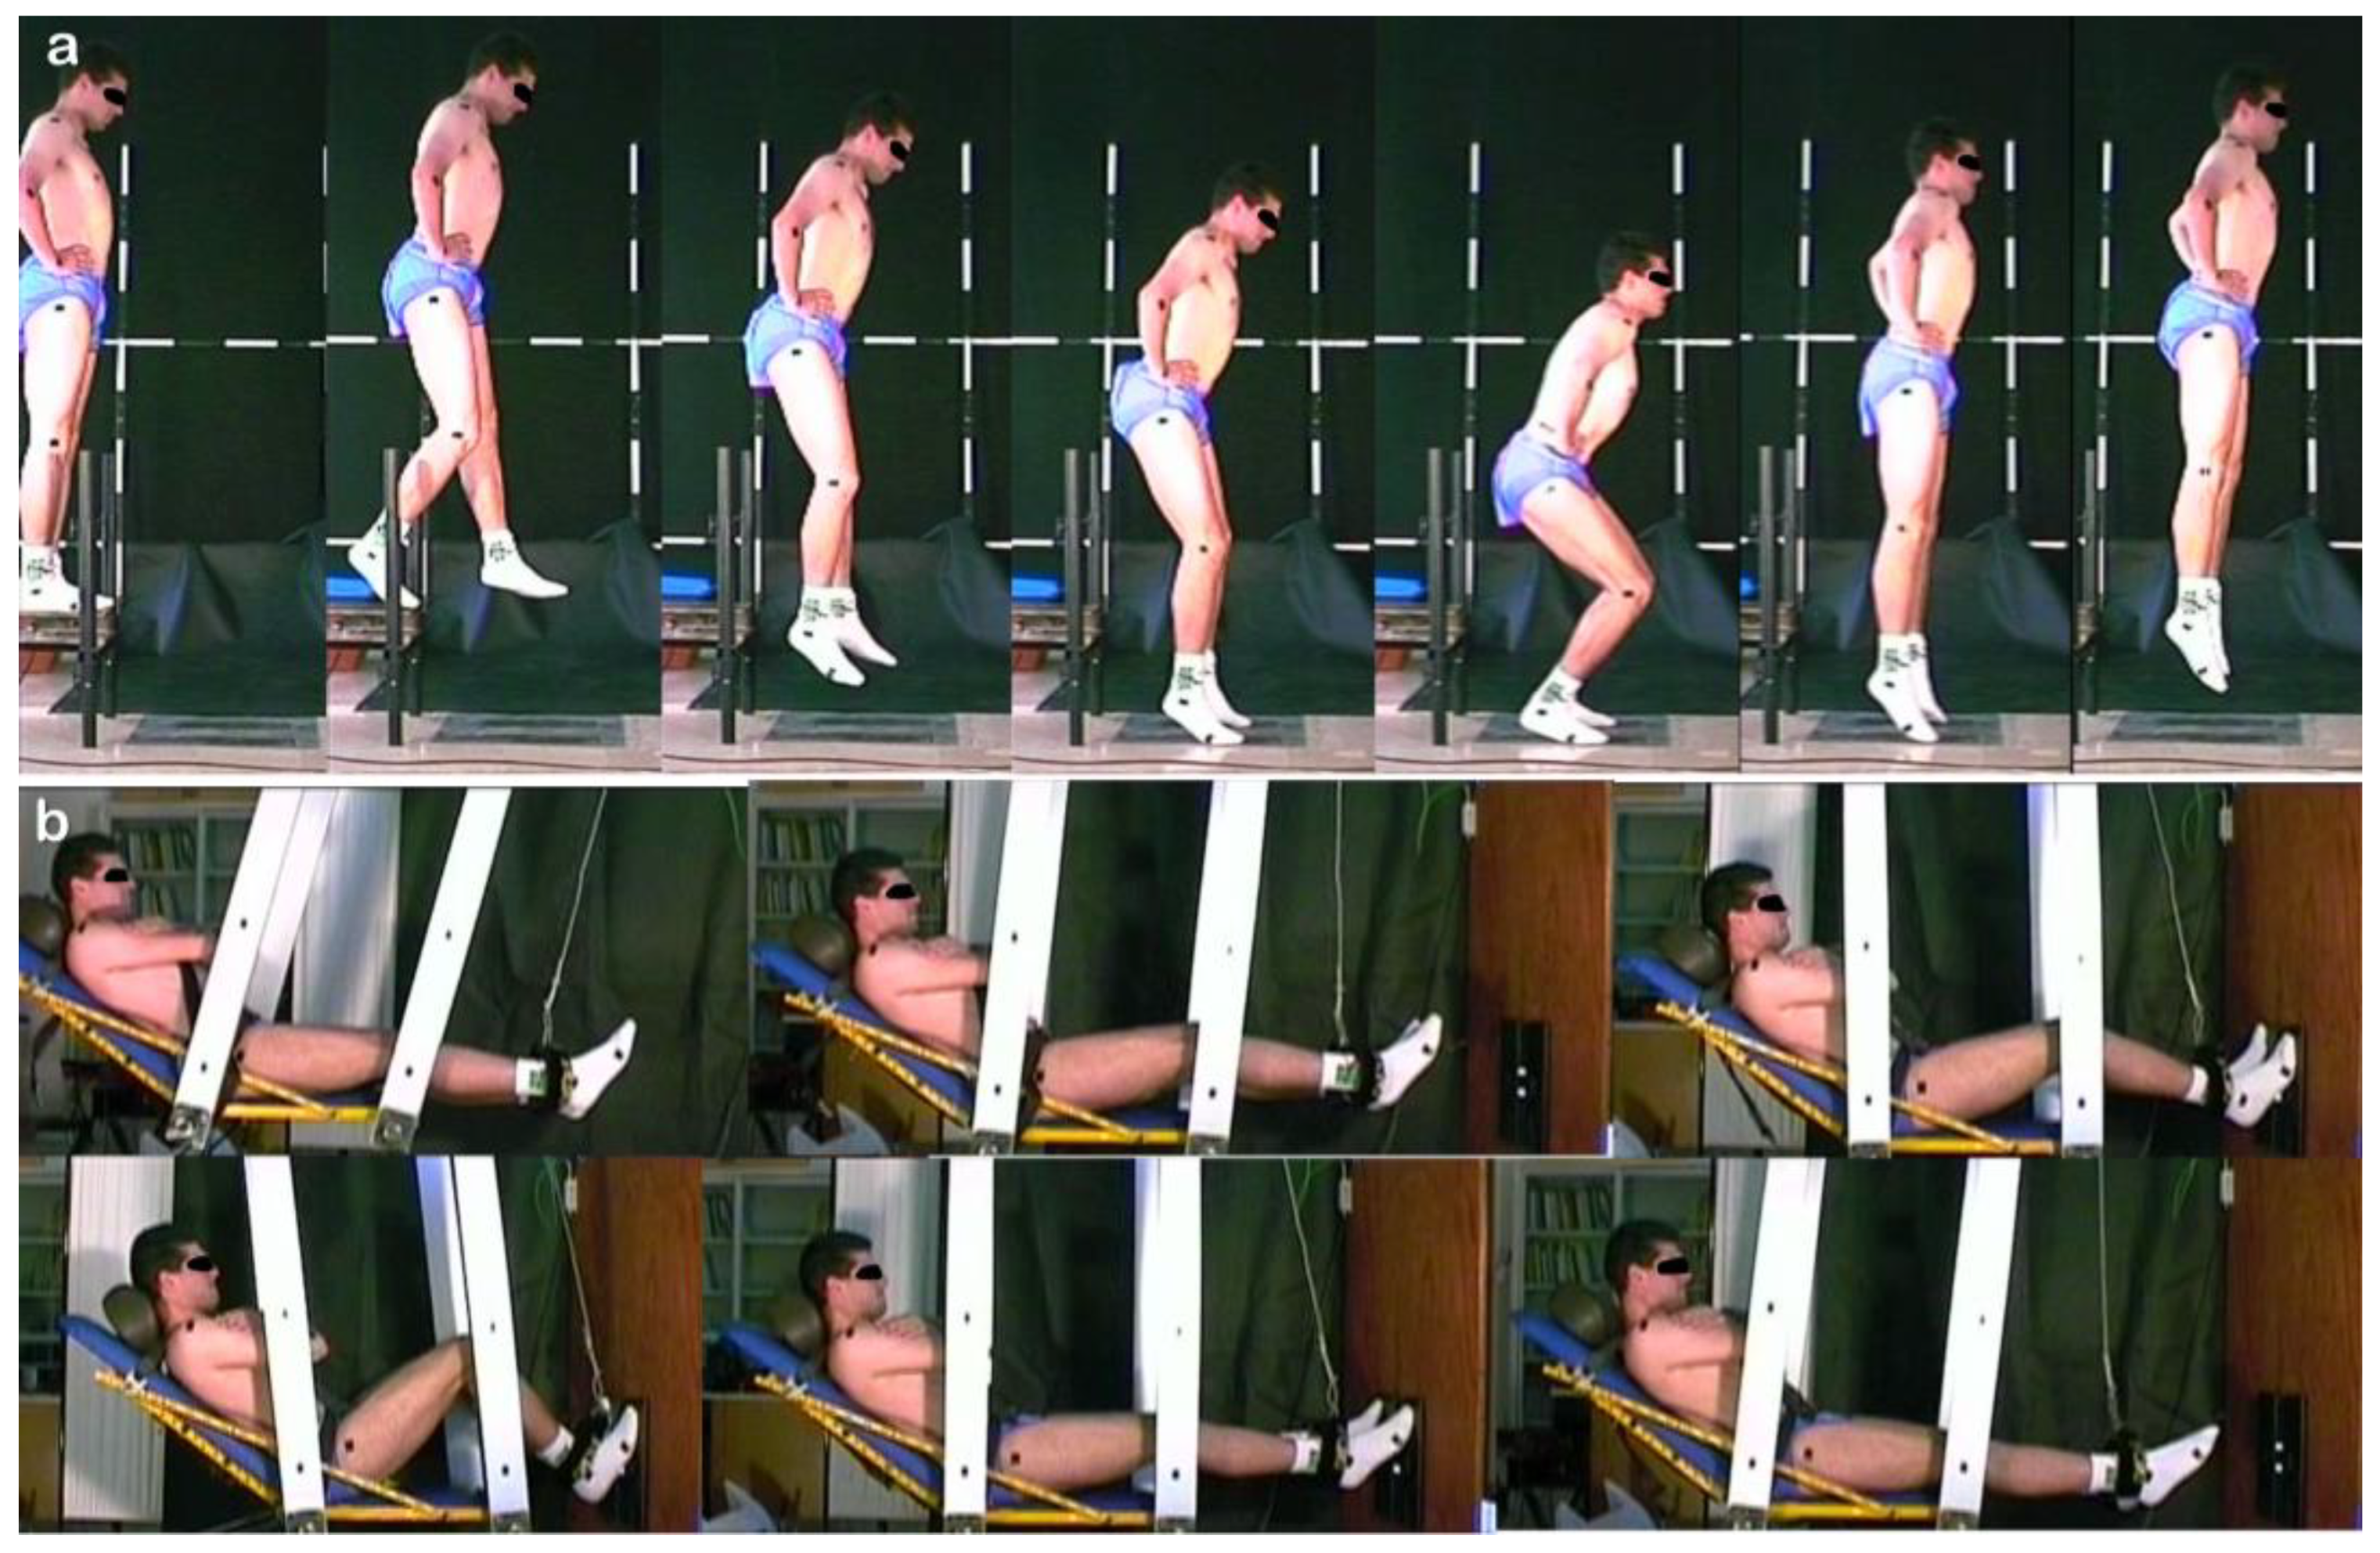
2.3.1. Vertical Drop Jumps
2.3.2. Horizontal Pendulum Rebound Jumps
- A pendulous foothold with a shock absorbing system connected to a Kistler 932-1B force-transducer (FTD; Kistler Instrumente AG, Winterthur, Switzerland). It was used to guide subjects’ lower extremities to the wall dynamometer; it was also used to calculate any contribution of the lower extremity in the vertical component.
- A Lucas R60D (Lucas Control Systems Products, Hampton, VA, USA) electronic goniometer, which was used to monitor the temporal angular position of the bifilar pendulum. It was attached at the front-up parallel bar.
- A Kyowa AS-20GB (Kyowa Electronic Instruments Co., Japan) accelerometer, which was used to monitor the instant velocity of the bifilar pendulum.
2.3.3. Video Recording
2.4. Experimental Procedure
2.5. Data Analysis
2.5.1. Kinematic and Kinetic Parameters Derived from the Force Recordings
- Spatial parameters: jump height (HJUMP); actual drop take-off height (hDROP); height of release (HR) of the pendulum; BCM vertical displacement during the braking (SBR) and propulsion (SPR) phases.
- Temporal parameters: total ground contact time (tC); braking phase duration (tBR); time to achieve maximum vGRF/hWRF (tFMAX); time to achieve peak power during the propulsion phase (tPMAX).
- Kinematic parameters: BCM velocity at the instants of touchdown (VTD) and take-off (VTO).
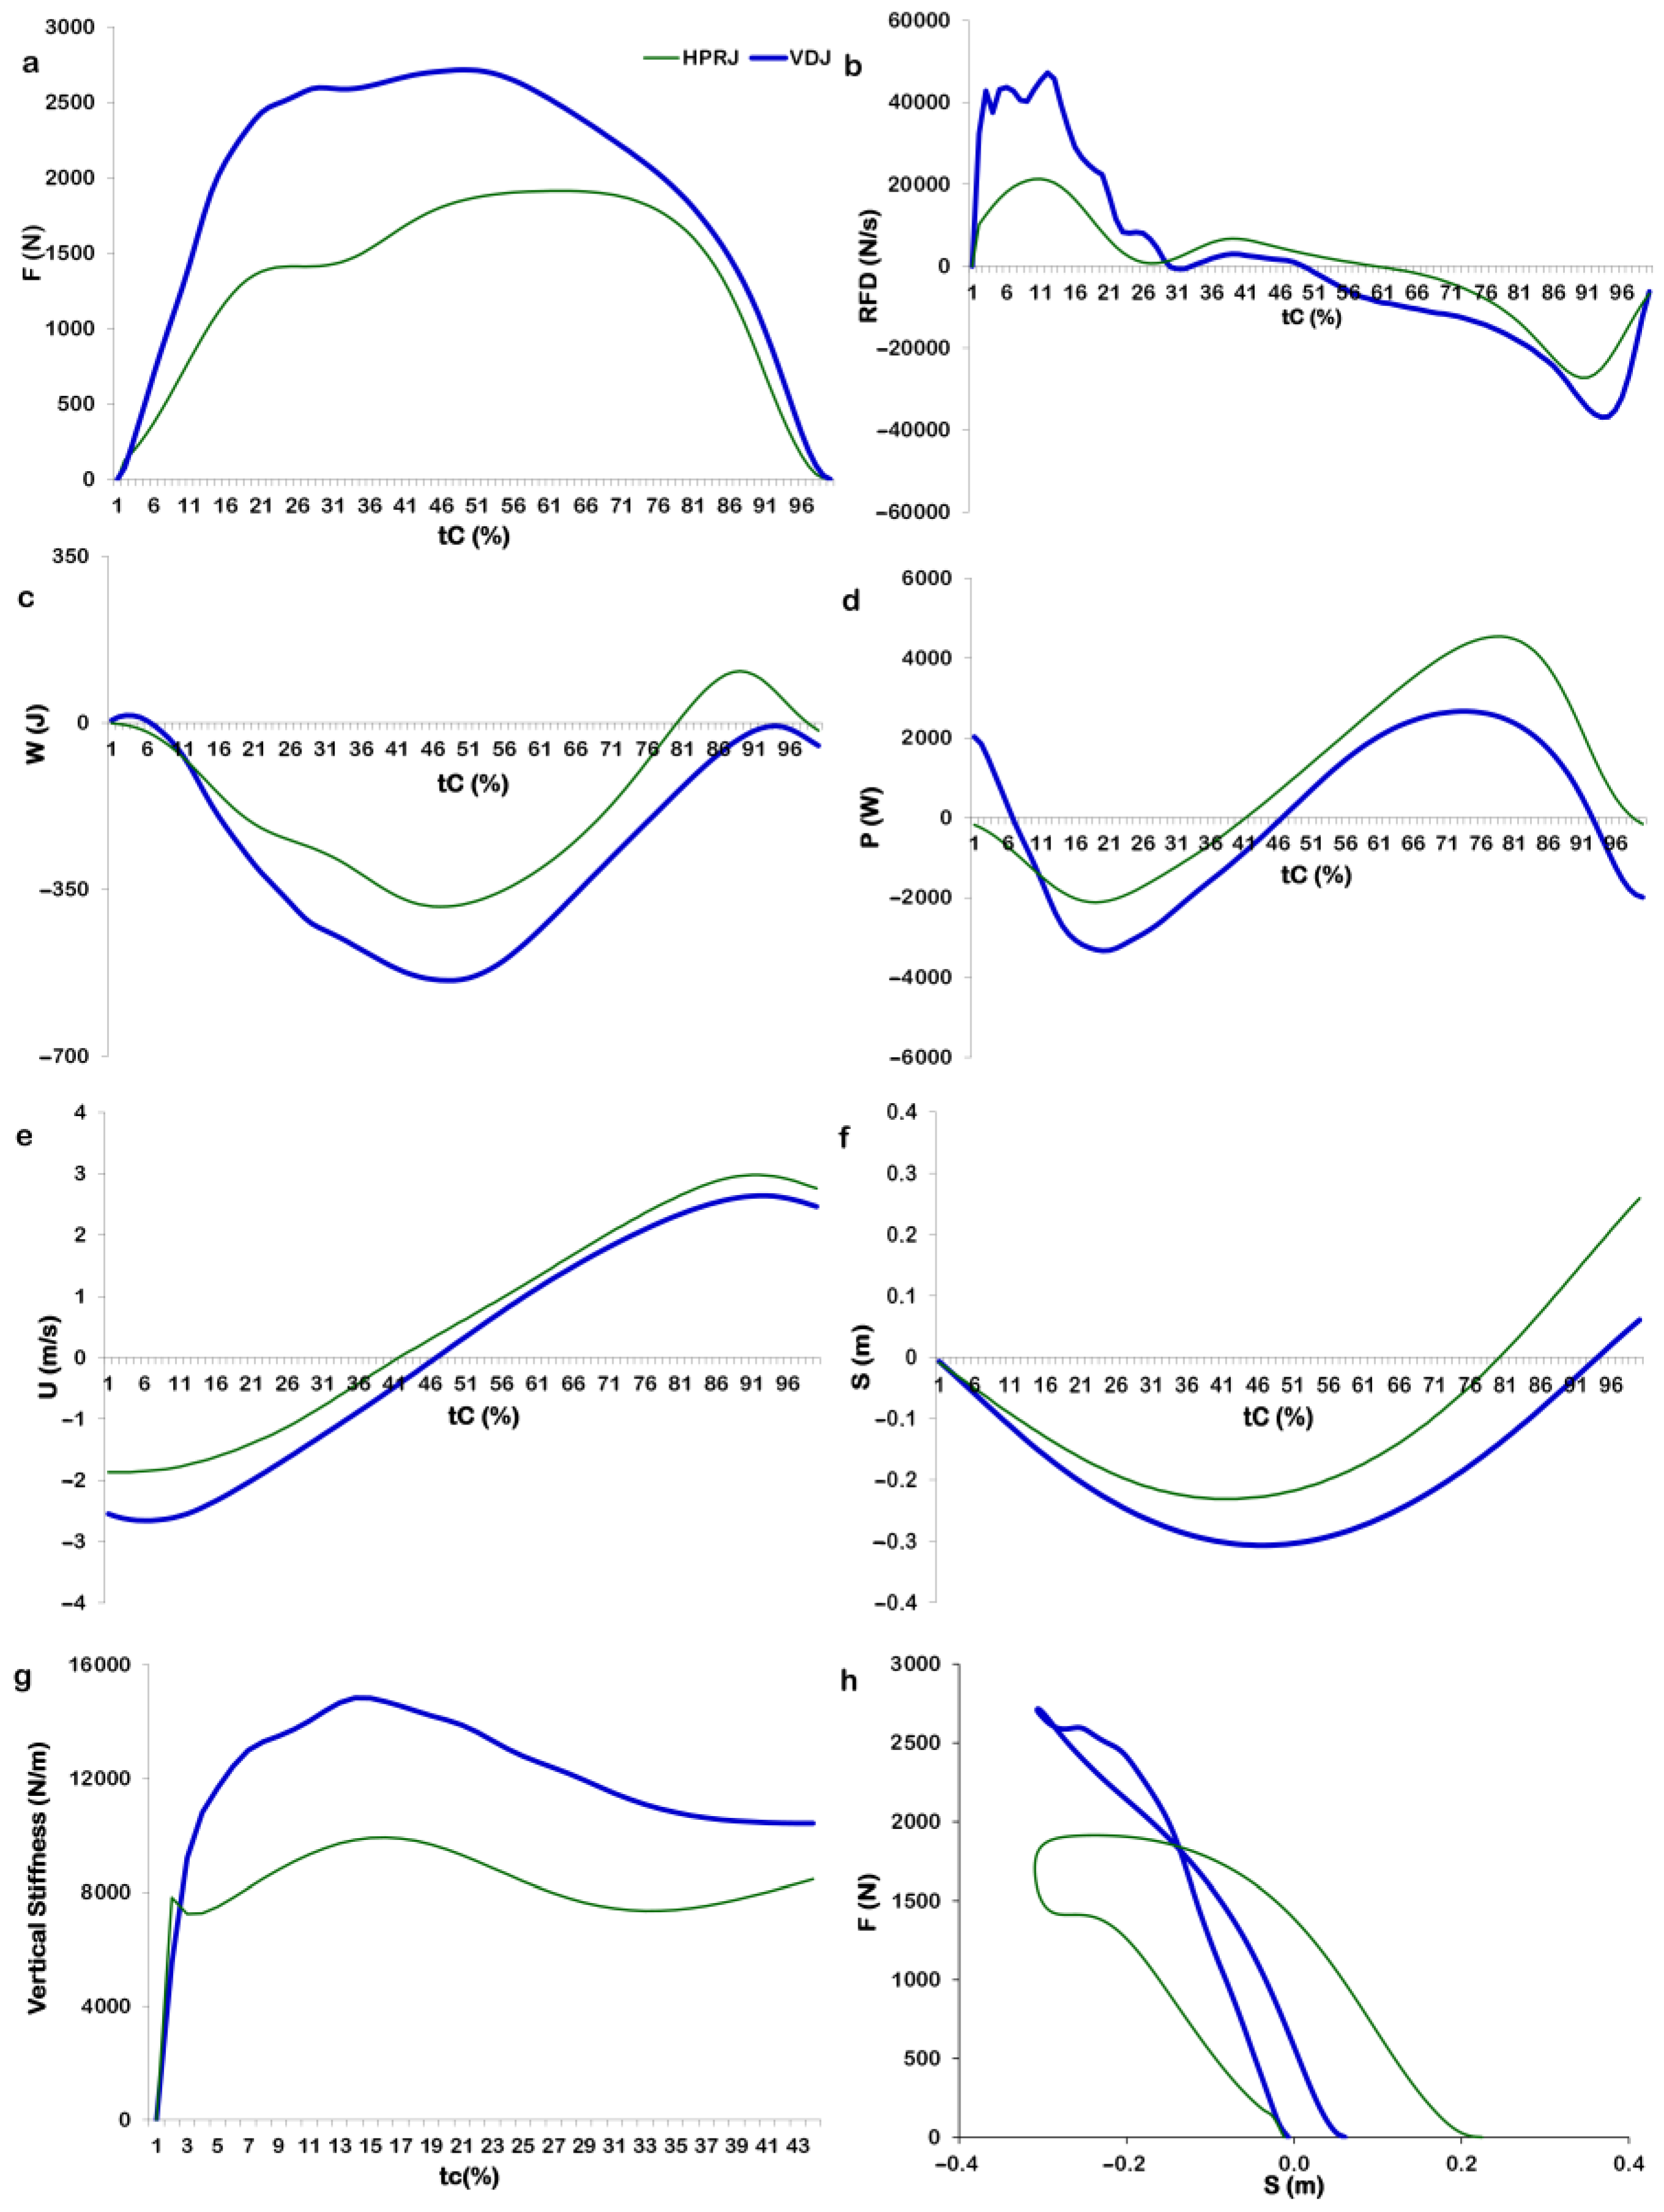
- Kinetic parameters: peak force output (F); peak rate of force development (RFD); power in the propulsion phase (P); vertical stiffness (KVERT); leg stiffness (KLEG).
2.5.2. Definition of the KEI for the Horizontal Pendulum Rebound Jumps
2.5.3. Kinematic Parameters Derived from the Video Analysis
2.5.4. Signal Synchronization
2.6. Statistical Analysis
3. Results
3.1. Reliability Measures
3.2. Comparison between VDJ and HPRJ
3.2.1. Spatiotemporal, Kinetic, and Kinematic Parameters
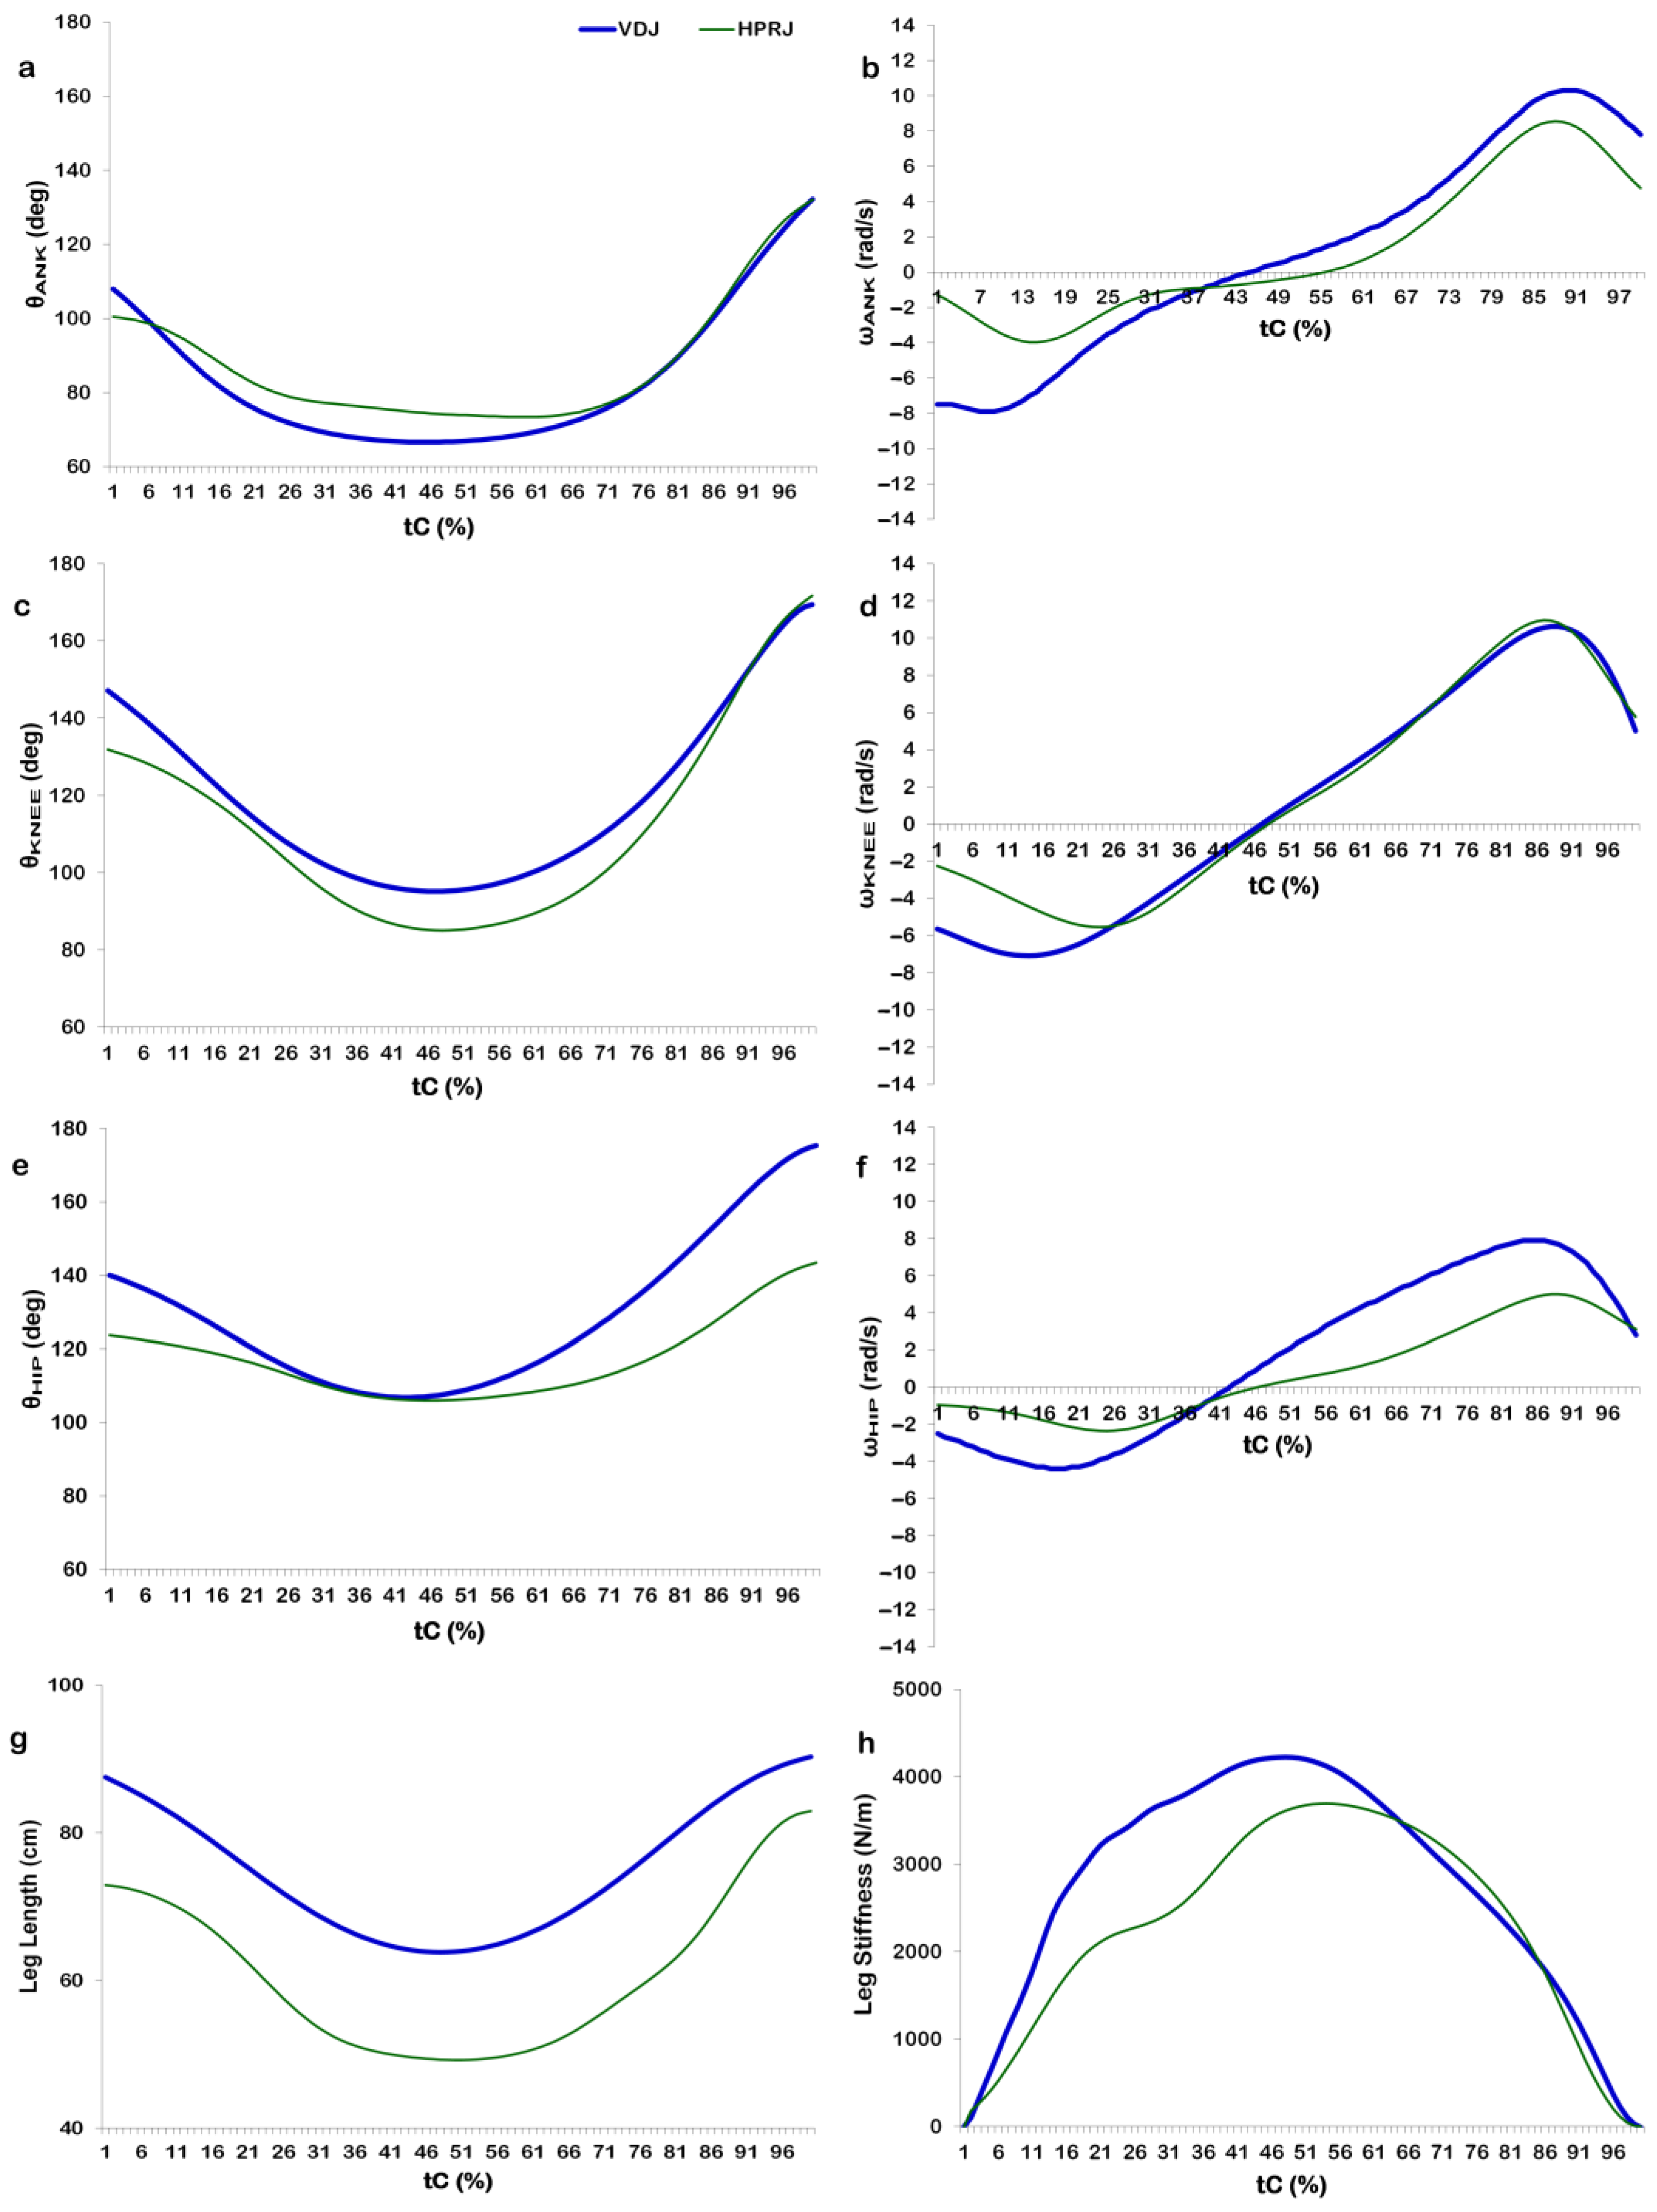
3.2.2. Joint Angular Kinematic Parameters
4. Discussion
5. Conclusions
Author Contributions
Funding
Institutional Review Board Statement
Informed Consent Statement
Data Availability Statement
Conflicts of Interest
Appendix A

| Mass (kg) | Amplitude Period (s) | Center of Mass (m) | Moment of Inertia (kg·m2) | Radius of Inertia (m) | Center of Percussion (m) |
|---|---|---|---|---|---|
| 42.5 | 3.0 | 1.54 | 146 | 1.85 | 2.24 |
Appendix B

References
- Bobbert, M.F. Drop Jumping as a Training Method for Jumping Ability. Sports Med. 1990, 9, 7–22. [Google Scholar] [CrossRef] [PubMed]
- Moran, J.; Ramirez-Campillo, R.; Liew, B.; Chaabene, H.; Behm, D.G.; García-Hermoso, A.; Izquierdo, M.; Granacher, U. Effects of Vertically and Horizontally Orientated Plyometric Training on Physical Performance: A Meta-analytical Comparison. Sports Med. 2020, 51, 65–79. [Google Scholar] [CrossRef] [PubMed]
- Ramirez-Campillo, R.; Álvarez, C.; García-Hermoso, A.; Ramírez-Vélez, R.; Gentil, P.; Asadi, A.; Chaabene, H.; Moran, J.; Meylan, C.; García-De-Alcaraz, A.; et al. Methodological Characteristics and Future Directions for Plyometric Jump Training Research: A Scoping Review. Sports Med. 2018, 48, 1059–1081. [Google Scholar] [CrossRef]
- De Villarreal, E.S.-S.; Kellis, E.; Kraemer, W.J.; Izquierdo, M. Determining Variables of Plyometric Training for Improving Vertical Jump Height Performance: A Meta-Analysis. J. Strength Cond. Res. 2009, 23, 495–506. [Google Scholar] [CrossRef]
- Wilson, J.M.; Flanagan, E.P. The Role of Elastic Energy in Activities with High Force and Power Requirements: A Brief Review. J. Strength Cond. Res. 2008, 22, 1705–1715. [Google Scholar] [CrossRef] [PubMed]
- Bosco, C.; Tihanyi, J.; Komi, P.V.; Fekete, G.; Apor, P. Store and recoil of elastic energy in slow and fast types of human skeletal muscles. Acta Physiol. Scand. 1982, 116, 343–349. [Google Scholar] [CrossRef]
- Panoutsakopoulos, V.; Chalitsios, C.; Nikodelis, T.; Kollias, I.A. Kinetic time-curves can classify individuals in distinct levels of drop jump performance. J. Sports Sci. 2022, 40, 2143–2152. [Google Scholar] [CrossRef]
- Ferreira, L.C.; Weiss, L.W.; Hammond, K.G.; Schilling, B.K. Structural and functional predictors of drop vertical jump. J. Strength Cond. Res. 2010, 24, 2456–2467. [Google Scholar] [CrossRef] [PubMed]
- Kollias, I.; Panoutsakopoulos, V.; Papaiakovou, G. Comparing jumping ability among athletes of various sports: Vertical drop jumping from 60 centimeters. J. Strength Cond. Res. 2004, 18, 546–550. [Google Scholar] [PubMed]
- Komi, P.V.; Nicol, C. Stretch-Shortening Cycle of muscle function. In Neuromuscular Aspects of Sport Performance; Komi, P.V., Ed.; Blackwell Publishing Ltd.: Oxford, UK, 2011; pp. 15–31. [Google Scholar]
- Ball, N.B.; Zanetti, S. Relationship Between Reactive Strength Variables in Horizontal and Vertical Drop Jumps. J. Strength Cond. Res. 2012, 26, 1407–1412. [Google Scholar] [CrossRef]
- Feldmann, C.R.; Weiss, L.W.; Schilling, B.K.; Whitehead, P.N. Association of Drop Vertical Jump Displacement with Select Performance Variables. J. Strength Cond. Res. 2012, 26, 1215–1225. [Google Scholar] [CrossRef] [PubMed]
- Nedeljkovic, A.; Mirkov, D.M.; Markovic, S.; Jaric, S. Tests of Muscle Power Output Assess Rapid Movement Performance When Normalized for Body Size. J. Strength Cond. Res. 2009, 23, 1593–1605. [Google Scholar] [CrossRef]
- Prilutsky, B.I. Work, Energy Expenditure and Efficiency of the Stretch-Shortening Cycle. J. Appl. Biomech. 1997, 13, 466–471. [Google Scholar] [CrossRef]
- Baca, A. Application of computer animation techniques for presenting biomechanical research results. Comput. Biol. Med. 1998, 28, 449–454. [Google Scholar] [CrossRef]
- Baca, A. A comparison of methods for analyzing drop jump performance. Med. Sci. Sports Exerc. 1999, 31, 437–442. [Google Scholar] [CrossRef]
- Kornecki, S. Relazione tra gradi di liberta’ cinematici e forza muscolare durante l’esecuzione di esercizi dinamici per l’alle-namento. Atleticastudi 1988, 19, 285–288. [Google Scholar]
- Tenisci, T. Pendulum swing. Track Tech. 1980, 81, 2591–2592. [Google Scholar]
- Kaneko, M.; Komi, P.V.; Aura, O. Mechanical efficiency of concentric and eccentric exercises performed with medium to fast contraction rates. Scand. J. Sports Sci. 1984, 1, 15–20. [Google Scholar]
- Aura, O.; Komi, P.V. Mechanical Efficiency of Pure Positive and Pure Negative Work with Special Reference to the Work Intensity. Int. J. Sports Med. 1986, 07, 44–49. [Google Scholar] [CrossRef]
- Bosco, C.; Belli, A.; Astrua, M.; Tihanyi, J.; Pozzo, R.; Kellis, S.; Tsarpela, O.; Foti, C.; Manno, R.; Tranquilli, C. A dynamometer for evaluation of dynamic muscle work. Eur. J. Appl. Physiol. Occup. Physiol. 1995, 70, 379–386. [Google Scholar] [CrossRef] [PubMed]
- Karpilowski, B.; Nosarzewski, Z.; Iskra, L.; Staniak, Z.; Trzaskoma, Z. Pendulum training unit. Biol. Sport 1989, 6 (Suppl. S3), 309–310. [Google Scholar]
- Dick, F.W. Sports Training Principles, 2nd ed.; A & C Black: London, UK, 1992; p. 180. [Google Scholar]
- Trzaskoma, Z.; Wit, A.; Iskra, L.; Karpilowski, B. Application of an pendulum training simulator in training strength of lower extremities muscles. Biol. Sport 1989, 6 (Suppl. S3), 214–220. [Google Scholar]
- Eloranta, V. Effect of postural and load variation on the coordination of the leg muscles in rebound jumping movement. Electromyogr. Clin. Neurophysiol. 1997, 37, 79–88. [Google Scholar]
- Fowler, N.E.; Trzaskoma, Z.; Wit, A.; Iskra, L.; Lees, A. The effectiveness of a pendulum swing for the development of leg strength and counter-movement jump performance. J. Sports Sci. 1995, 13, 101–108. [Google Scholar] [CrossRef]
- Fowler, N.E.; Lees, A.; Reilly, T. Changes in stature following plyometric drop-jump and pendulum exercises. Ergonomics 1997, 40, 1279–1286. [Google Scholar] [CrossRef]
- Fowler, N.E.; Lees, A. A Comparison of the Kinetic and Kinematic Characteristics of Plyometric Drop-Jump and Pendulum Exercises. J. Appl. Biomech. 1998, 14, 260–275. [Google Scholar] [CrossRef] [PubMed]
- Trzaskoma, Z. Application of the pendulum training simulator to increasing the strength-speed potential of human lower limb muscles. Biol. Sport 1994, 11 (Suppl. S6), 3–119. [Google Scholar]
- Trzaskoma, L.; Tihanyi, J.; Trzaskoma, Z. The Effect of a Short-Term Combined Conditioning Training for the Development of Leg Strength and Power. J. Strength Cond. Res. 2010, 24, 2498–2505. [Google Scholar] [CrossRef]
- Trzaskoma, Z.; Wit, A. Comparison of three laboratory tests of short duration with respect to the mechanical power output by lower limbs of junior tennis players. Biol. Sport 1996, 13, 145–154. [Google Scholar]
- Trzaskoma, Z.; Wit, A.; Eliasz, J. Comparison of three laboratory tests of short duration with respect to the mechanical power output by lower limbs of athletes. Biol. Sport 1996, 13, 61–69. [Google Scholar]
- Trzaskoma, Z. Mechanical power output of lower limbs in advanced male tennis players. Biol. Sport 1997, 14, 55–63. [Google Scholar]
- Rodacki, A.L.F.; Fowler, N.E. Intermuscular coordination during pendulum rebound exercises. J. Sports Sci. 2001, 19, 411–425. [Google Scholar] [CrossRef] [PubMed]
- Rodacki, A.L.F.; Fowler, N.E.; Bennett, S. The Effect of Postural Variations in Movement Co-Ordination during Plyometric Rebound Exercises. J. Appl. Biomech. 2001, 17, 14–27. [Google Scholar] [CrossRef]
- Panoutsakopoulos, V.; Kollias, I.; Chomatas, D. Performance and variability of biomechanical parameters in consecutive plyometric pendulum rebound jumps. In Book of Abstracts of the 4th International Conference on Strength Training, Serres, Greece, 3–7 November 2004; Kellis, E., Amiridis, I., Vrabas, I., Eds.; Aristotle University of Thessaloniki: Serres, Greece, 2004; pp. 161–163. [Google Scholar]
- Wilder, J.N.; Riggins, E.R.; Noble, R.A.; Lelito, C.M.; Widenhoefer, T.L.; Almonroeder, T.G. The effects of drop vertical jump technique on landing and jumping kinetics and jump performance. J. Electromyogr. Kinesiol. 2021, 56, 102504. [Google Scholar] [CrossRef] [PubMed]
- Den Hartog, J.P. Mechanics; Dover Publications, Inc.: New York, NY, USA, 1961; pp. 247–248. [Google Scholar]
- Giatsis, G.; Panoutsakopoulos, V.; Kollias, I.A. Drop Jumping on Sand Is Characterized by Lower Power, Higher Rate of Force Development and Larger Knee Joint Range of Motion. J. Funct. Morphol. Kinesiol. 2022, 7, 17. [Google Scholar] [CrossRef] [PubMed]
- Panoutsakopoulos, V. Influence of kinetic energy on lower limb impact dynamics in the case of frontal collision during pendulum swing exercising. In Proceedings of the 3rd EMUNI Research Souk, Thessaloniki, Greece, 21 March 2011; Čurčić, D., Ed.; EMUNI University: Portorož, Slovenia, 2011; pp. 140–149. [Google Scholar]
- Dempster, W.T. Space Requirements of the Seated Operator; WADC-TR (55-159); Wright Patterson Air Force Base: Dayton, OH, USA, 1955. [Google Scholar]
- Winter, D.A. Biomechanics and Motor Control of Human Movement, 2nd ed.; John Wiley & Sons, Inc.: New York, NY, USA, 1990. [Google Scholar]
- Fleiss, J.L. The Design and Analysis of Clinical Experiments; John Wiley & Sons, Inc.: New York, NY, USA, 1986. [Google Scholar]
- Cohen, J. Statistical Power Analysis for the Behavioral Sciences, 2nd ed.; Lawrence Erlbaum Associates Publishers: Hillsdale, NJ, USA, 1988. [Google Scholar]
- Arampatzis, A.; Schade, F.; Walsh, M.; Brüggemann, G.-P. Influence of leg stiffness and its effect on myodynamic jumping performance. J. Electromyogr. Kinesiol. 2001, 11, 355–364. [Google Scholar] [CrossRef]
- Bobbert, M.F.; Huijing, P.A.; van Ingen Schenau, G.J. Drop jumping. II. The influence of dropping height on the biomechanics of drop jumping. Med. Sci. Sports Exerc. 1987, 19, 339–346. [Google Scholar] [CrossRef]
- Sanders, R.H.; Allen, J.B. Changes in net joint torques during accomodation to change in surface compliance in a drop jumping task. Hum. Mov. Sci. 1993, 12, 299–326. [Google Scholar] [CrossRef]
- Viitasalo, J.T.; Salo, A.; Lahtinen, J. Neuromuscular functioning of athletes and non-athletes in the drop jump. Eur. J. Appl. Physiol. Occup. Physiol. 1998, 78, 432–440. [Google Scholar] [CrossRef]
- Bubeck, D.; Gollhofer, A. Load induced changes of jump performance and activation patterns in free drop jump exercises and sledge jumps. Eur. J. Sport Sci. 2001, 1, 1–17. [Google Scholar] [CrossRef]
- Kibele, A. Technical Note: Possible errors in the comparative evaluation of drop jumps from different heights. Ergonomics 1999, 42, 1011–1014. [Google Scholar] [CrossRef] [PubMed]
- McMahon, J.J.; Lake, J.P.; Stratford, C.; Comfort, P. A Proposed Method for Evaluating Drop Jump Performance with One Force Platform. Biomechanics 2021, 1, 178–189. [Google Scholar] [CrossRef]
- Geraldo, G.F.; Bredt, S.T.; Menzel, H.J.; Peixoto, G.H.; Carvalho, L.A.; Lima, F.V.; Soares, J.S.; Andrade, A.G. Drop height is influenced by box height but not by individual stature during drop jumps. J. Phys. Educ. 2019, 30, e-3078. [Google Scholar] [CrossRef]
- Walsh, M.; Arampatzis, A.; Schade, F.; Brüggemann, G.P. The effect of drop jump starting height and contact time on power, work performed, and moment of force. J. Strength Cond. Res. 2004, 18, 561–566. [Google Scholar] [PubMed]
- Voigt, M.; Simonsen, E.; Dyhre-Poulsen, P.; Klausen, K. Mechanical and muscular factors influencing the performance in maximal vertical jumping after different prestretch loads. J. Biomech. 1995, 28, 293–307. [Google Scholar] [CrossRef] [PubMed]
- Avela, J.; Komi, P.V.; Santos, P.M. Effects of differently induced stretch loads on neuromuscular control in drop jump exercise. Eur. J. Appl. Physiol. Occup. Physiol. 1996, 72, 553–562. [Google Scholar] [CrossRef] [PubMed]
- Leukel, C.; Taube, W.; Gruber, M.; Hodapp, M.; Gollhofer, A. Influence of falling height on the excitability of the soleus H-reflex during drop-jumps. Acta Physiol. 2008, 192, 569–576. [Google Scholar] [CrossRef] [PubMed]
- Lafortune, M.A.; Lake, M.J.; Hennig, E.M. Differential shock transmission response of the human body to impact severity and lower limb posture. J. Biomech. 1996, 29, 1531–1537. [Google Scholar] [CrossRef] [PubMed]
- Pithioux, M.; Chavet, P.; St-Onge, N.; Nicol, C. Influence of muscle preactivation of the lower limb on impact dynamics in the case of frontal collision. Int. J. Crashworthiness 2005, 10, 557–565. [Google Scholar] [CrossRef]
- Guy-Cherry, D.; Alanazi, A.; Miller, L.; Staloch, D.; Ortiz-Rodriguez, A. Landing Styles Influences Reactive Strength Index without Increasing Risk for Injury. Sports Med. Int. Open 2018, 02, E35–E40. [Google Scholar] [CrossRef]
- You, C.-H.; Huang, C.-H. Effects of Leg Stiffness Regulated by Different Landing Styles on Vertical Drop Jump Performance. J. Hum. Kinet. 2022, 83, 29–37. [Google Scholar] [CrossRef] [PubMed]
- Young, W.B.; Pryor, J.F.; Wilson, G.J. Effect of instructions on characteristics of countermovement and drop jump performance. J. Strength Cond. Res. 1995, 9, 232–236. [Google Scholar]
- Arampatzis, A.; Brüggemann, G.P.; Klapsing, G.M. Leg stiffness and mechanical energetic processes during jumping on a sprung surface. Med. Sci. Sports Exerc. 2001, 33, 923–931. [Google Scholar] [CrossRef]
- Bassa, E.; Adamopoulos, I.; Panoutsakopoulos, V.; Xenofondos, A.; Yannakos, A.; Galazoulas, C.; Patikas, D.A. Optimal Drop Height in Prepubertal Boys Is Revealed by the Performance in Squat Jump. Sports 2023, 11, 1. [Google Scholar] [CrossRef]
- Moir, G.L.; Snyder, B.W.; Connaboy, C.; Lamont, H.S.; Davis, S.E. Using Drop Jumps and Jump Squats to Assess Eccentric and Concentric Force-Velocity Characteristics. Sports 2018, 6, 125. [Google Scholar] [CrossRef] [PubMed]
- Byrne, P.J.; Moran, K.; Rankin, P.; Kinsella, S. A Comparison of Methods Used to Identify ‘Optimal’ Drop Height for Early Phase Adaptations in Depth Jump Training. J. Strength Cond. Res. 2010, 24, 2050–2055. [Google Scholar] [CrossRef]
- Avela, J.; Santos, P.M.; Kyröläinen, H.; Komi, P.V. Effects of different simulated gravity conditions on neuromuscular control in drop jump exercises. Aviat. Space Environ. Med. 1994, 65, 301–308. [Google Scholar]
- Asmussen, E.; Bonde-Petersen, F. Storage of Elastic Energy in Skeletal Muscles in Man. Acta Physiol. Scand. 1974, 91, 385–392. [Google Scholar] [CrossRef]
- Rodacki, A.L.F.; Fowler, N.E. A movement pat tern repeatability approach during the eccentric ± concentric cycle in the pendulum swing. J. Sports Sci. 1998, 17, 549. [Google Scholar]


| Parameter | VDJ | HPRJ | t | p | d |
|---|---|---|---|---|---|
| KEI (J) | 240.6 ± 39.5 | 243.9 ± 16.0 | 0.541 | 0.592 | 0.11 |
| HJUMP (m) | 0.323 ± 0.072 | 0.302 ± 0.072 | 1.399 | 0.170 | 0.28 |
| SBR (m) | −0.301 ± 0.087 | −0.241 ± 0.060 | 4.699 | <0.001 * | 0.80 |
| SPR (m) | 0.370 ± 0.105 | 0.454 ± 0.110 | 0.319 | 0.754 | 0.78 |
| tC (ms) | 408.8 ± 123.0 | 426.7 ± 92.8 | 0.819 | 0.418 | 0.16 |
| tBR (ms) | 192.5 ± 60.3 | 185.6 ± 51.1 | 0.647 | 0.522 | 0.12 |
| tFMAX (ms) | 131.4 ± 65.3 | 269.1 ± 101.1 | 7.682 | <0.001 * | 1.62 |
| tPMAX (ms) | 322.0 ± 117.0 | 346.7 ± 94.3 | 1.133 | 0.265 | 0.23 |
| VTD (m/s) | −2.58 ± 0.15 | −1.90 ± 0.10 | 21.416 | <0.001 * | 5.33 |
| VTO (m/s) | 2.51 ± 0.29 | 2.73 ± 0.35 | 3.262 | 0.002 * | 0.69 |
| Parameter | VDJ | HPRJ | t | p | d |
|---|---|---|---|---|---|
| F (kN) | 2.15 ± 0.91 | 2.74 ± 1.49 | 2.168 | 0.037 * | 0.48 |
| F (N/kg) | 3.68 ± 1.15 | 3.07 ± 0.98 | 2.942 | 0.006 * | 0.57 |
| RFD (kN/s) | 47.1 ± 23.8 | 33.7 ± 24.3 | 2.885 | 0.006 * | 0.56 |
| P (kW) | 2.93 ± 1.11 | 4.88 ± 0.92 | 9.188 | <0.001 * | 1.91 |
| P (W/kg) | 35.9 ± 13.7 | 38.8 ± 7.3 | 1.216 | 0.232 | 0.26 |
| KVERT (kN/m) | 14.84 ± 9.35 | 9.92 ± 6.93 | 2.502 | 0.017 * | 0.60 |
| KLEG (kN/m) | 4.23 ± 2.58 | 3.69 ± 1.64 | 0.628 | 0.534 | 0.25 |
| Parameter | VDJ | HPRJ | t | p | d |
|---|---|---|---|---|---|
| θANK-td (deg) | 100.9 ± 7.9 | 92.1 ± 9.3 | 5.300 | <0.001 * | 1.02 |
| θANK-low (deg) | 66.4 ± 6.2 | 73.9 ± 10.3 | 4.356 | <0.001 * | 0.88 |
| θANK-to (deg) | 136.2 ± 6.8 | 127.0 ± 7.7 | 5.153 | <0.001 * | 1.27 |
| ROMANK-BR (deg) | −34.4 ± 8.8 | −18.2 ± 10.5 | 7.862 | <0.001 * | 1.67 |
| ROMANK-PR (deg) | 69.8 ± 9.4 | 53.1 ± 11.0 | 7.106 | <0.001 * | 1.63 |
| ωANK (rad/s) | 12.2 ± 2.2 | 11.5 ± 2.5 | 1.217 | 0.232 | 0.30 |
| θKNEE-td (deg) | 140.1 ± 8.6 | 121.2 ± 16.7 | 6.532 | <0.001 * | 1.42 |
| θKNEE-low (deg) | 95.8 ± 14.4 | 96.0 ± 21.3 | 0.052 | 0.959 | 0.01 |
| θKNEE-to (deg) | 175.2 ± 4.4 | 165.4 ± 7.5 | 6.698 | <0.001 * | 1.59 |
| ROMKNEE-BR (deg) | −44.3 ± 17.1 | −25.1 ± 14.7 | 5.612 | <0.001 * | 1.20 |
| ROMKNEE-PR (deg) | 79.3 ± 15.2 | 69.4 ± 19.0 | 2.814 | 0.008 * | 0.58 |
| ωKNEE (rad/s) | 11.4 ± 2.0 | 12.4 ± 2.9 | 1.754 | 0.089 | 0.40 |
| θHIP-td (deg) | 135.9 ± 11.2 | 121.0 ± 8.3 | 6.581 | <0.001 * | 1.51 |
| θHIP-low (deg) | 106.9 ± 22.5 | 111.8 ± 9.7 | 1.243 | 0.223 | 0.28 |
| θHIP-to (deg) | 176.8 ± 4.8 | 140.4 ± 5.9 | 30.456 | <0.001 * | 6.77 |
| ROMHIP-BR (deg) | −29.0 ± 22.0 | −9.2 ± 5.1 | 5.466 | <0.001 * | 1.24 |
| ROMHIP-PR (deg) | 69.9 ± 22.8 | 28.5 ± 8.6 | 11.206 | <0.001 * | 2.40 |
| ωHIP (rad/s) | 8.6 ± 1.5 | 5.1 ± 1.4 | 11.604 | <0.001 * | 2.41 |
Disclaimer/Publisher’s Note: The statements, opinions and data contained in all publications are solely those of the individual author(s) and contributor(s) and not of MDPI and/or the editor(s). MDPI and/or the editor(s) disclaim responsibility for any injury to people or property resulting from any ideas, methods, instructions or products referred to in the content. |
© 2023 by the authors. Licensee MDPI, Basel, Switzerland. This article is an open access article distributed under the terms and conditions of the Creative Commons Attribution (CC BY) license (https://creativecommons.org/licenses/by/4.0/).
Share and Cite
Panoutsakopoulos, V.; Kollias, I.A. Reliability of a Pendulum Apparatus for the Execution of Plyometric Rebound Exercises and the Comparison of Their Biomechanical Parameters with Load-Matching Vertical Drop Jumps. Biomechanics 2023, 3, 204-219. https://doi.org/10.3390/biomechanics3020018
Panoutsakopoulos V, Kollias IA. Reliability of a Pendulum Apparatus for the Execution of Plyometric Rebound Exercises and the Comparison of Their Biomechanical Parameters with Load-Matching Vertical Drop Jumps. Biomechanics. 2023; 3(2):204-219. https://doi.org/10.3390/biomechanics3020018
Chicago/Turabian StylePanoutsakopoulos, Vassilios, and Iraklis A. Kollias. 2023. "Reliability of a Pendulum Apparatus for the Execution of Plyometric Rebound Exercises and the Comparison of Their Biomechanical Parameters with Load-Matching Vertical Drop Jumps" Biomechanics 3, no. 2: 204-219. https://doi.org/10.3390/biomechanics3020018