
Relationship between Swimming Velocity and Trunk Twist Motion in Short-Distance Crawl Swimming

1
Graduate School of Engineering, Kokushikan University, Tokyo 154-8515, Japan
2
National Institute of Technology, Kochi College, Kochi 783-8508, Japan
3
Faculty of Health and Sport Science, University of Tsukuba, Tsukuba 305-8577, Japan
4
School of Science and Engineering, Kokushikan University, Tokyo 154-8515, Japan
*
Author to whom correspondence should be addressed.
Biomechanics 2023, 3(2), 193-203; https://doi.org/10.3390/biomechanics3020017
Submission received: 23 March 2023
/
Revised: 12 April 2023
/
Accepted: 17 April 2023
/
Published: 19 April 2023
(This article belongs to the Section Sports Biomechanics)
Abstract
:This study aimed to estimate the trunk twist angle from the shoulder and hip rotation angles in short-distance crawl swimming and to elucidate the twist motion of the relationship between the trunk and the rotation angular velocity in response to changes in swimming speed. Swimming speed during the experimental trials was computed from the subject’s best times in the 50 and 100 m crawl swims. Wireless self-luminous LED markers were attached to seven locations on the body. The actual coordinate values of the LED markers were obtained using 18 cameras for underwater movements and 4 on the water for above-water movements. A comparison of the rate of change between trials revealed a high correlation (r = 0.722, p < 0.01) between the twist angle and shoulder rotation angular velocity in the Push phase. In the same phase, a high correlation (r = 0.748, p < 0.01) was also found between the twist angle and the angular velocity of hip rotation. These results suggest that swimmers increase the twist angle of their trunks to obtain a higher swimming speed.
1. Introduction
The crawl stroke is considered to be the swimming technique that can achieve the highest swimming speed among competitive swimming events. It is a swimming technique that alternately moves the upper and lower extremities to propel oneself, and in the water, it is an event that exerts propulsive force in an environment without fixed support points while maintaining a horizontal posture [1]. When classified as a short-distance event in competitive swimming, the average swimming speeds for the 50 m and 100 m crawl strokes can be compared to world records. In the 50 m crawl stroke, the world record is 20.91 s, and the average swimming speed is 2.39 m/s. In the 100 m crawl stroke, the world record is 46.91 s, and the average swimming speed is 2.13 m/s. This confirms a difference of 0.26 m/s between the two distances. Even among swimmers who compete in national competitions in Japan, there is a difference of over 2.0 m/s in average swimming speed in short-distance events. Narita et al. (2018) reported that the resistance that the body receives from the fluid during swimming increases significantly, being proportional to the cube of the swimming speed [2]. Therefore, in a high-speed swimming environment, it is considered that greater resistance occurs, and there may be differences in the characteristics of swimming between the 50 m and 100 m crawl strokes due to differences in swimming speed. Therefore, it is necessary to distinguish the characteristics of swimming movements in each distance during races, and by comparing the swimming movements even in short-distance events, it is expected to discover insights that contribute to improving maximum swimming speed.
It has been reported that in freestyle swimming, approximately 90% of the total body propulsion is generated by the upper body movements [1,3,4,5]. In addition, previous studies that measured fluid forces generated by the swimmer’s hands using pressure distribution measurement reported that the increase in hand velocity in water contributes to the increase in propulsive force generated by the hands, highlighting the importance of hand velocity in increasing propulsion force [6,7]. Furthermore, during freestyle swimming, a rotational movement around the long axis of the trunk, which is coordinated with the upper body movements, is performed and defined as trunk rotation [8]. It has been confirmed that the increase in rotational velocity of the shoulders in relation to trunk rotation is associated with the increase in hand velocity and contributes to the propulsive force generated by the hands [9,10,11,12].
However, three-dimensional motion analysis in short-distance events is difficult to perform in a standard competitive pool due to the fast water flow around the body, which causes an increase in noise from bubbles and splashes. Therefore, in this study, we use a recirculating tank to eliminate this noise data and measure the three-dimensional motion at a faster speed. Using this data, we aim to calculate the rotation angles of the shoulders and hips, as well as the rotation angle of the torso that accompanies them, in short-distance freestyle swimming at different swimming speeds, and to clarify the relationship between swimming speed and trunk rotation.
2. Materials and Methods
2.1. Analysis
A total of 10 participants (Table 1) took part in this study (age: 21.0 ± 2.5 years; height: 179.8 ± 6.7 cm; weight: 77.3 ± 5.9 kg). All participants trained six days a week and had experience competing in national championships.
Regarding their consent to participate in the study, participants who were minors had their legal guardians’ permission to withdraw from the study at any time, without any negative consequences, and these terms were explained to them before agreeing to participate. In addition, they were informed that any personal information obtained during the study would be treated with appropriate measures to prevent leakage or loss. Before the experiment, participants were explained the purpose and methods of the study and were asked for their consent to participate.
2.2. Measurement Method
The experiment was conducted in a recirculating water tank (manufactured by Igarashi Kogyo Co., Ltd., Chiba, Japan) with glass walls and bottom, which allowed us to control the swimming speed by artificially flowing water. The swimming speeds during the experiments were calculated based on the subjects’ best times for 50 m and 100 m freestyle swimming. To eliminate the effect of diving, the start position was set as the point where the subject passed 15 m from the start signal, and the average swimming speed for the positions except the start position was set as the designated swimming speed. After sufficient warm-up, the subjects performed a 100 m freestyle swimming trial with a designated swimming speed (hereafter abbreviated as “V100 m”) and a 50 m freestyle swimming trial with a designated swimming speed (hereafter abbreviated as “V50 m”) for 10 s each. To ensure that the swimming speed during the trial did not change, markers were placed on the pool floor to prevent the subjects from moving out of the measurement zone. The subjects performed a six-beat kick during each stroke, as in a race, and the trial was conducted without breathing to eliminate the influence of the stroke motion due to breathing.
2.3. Phasing of Upper Limb Strokes
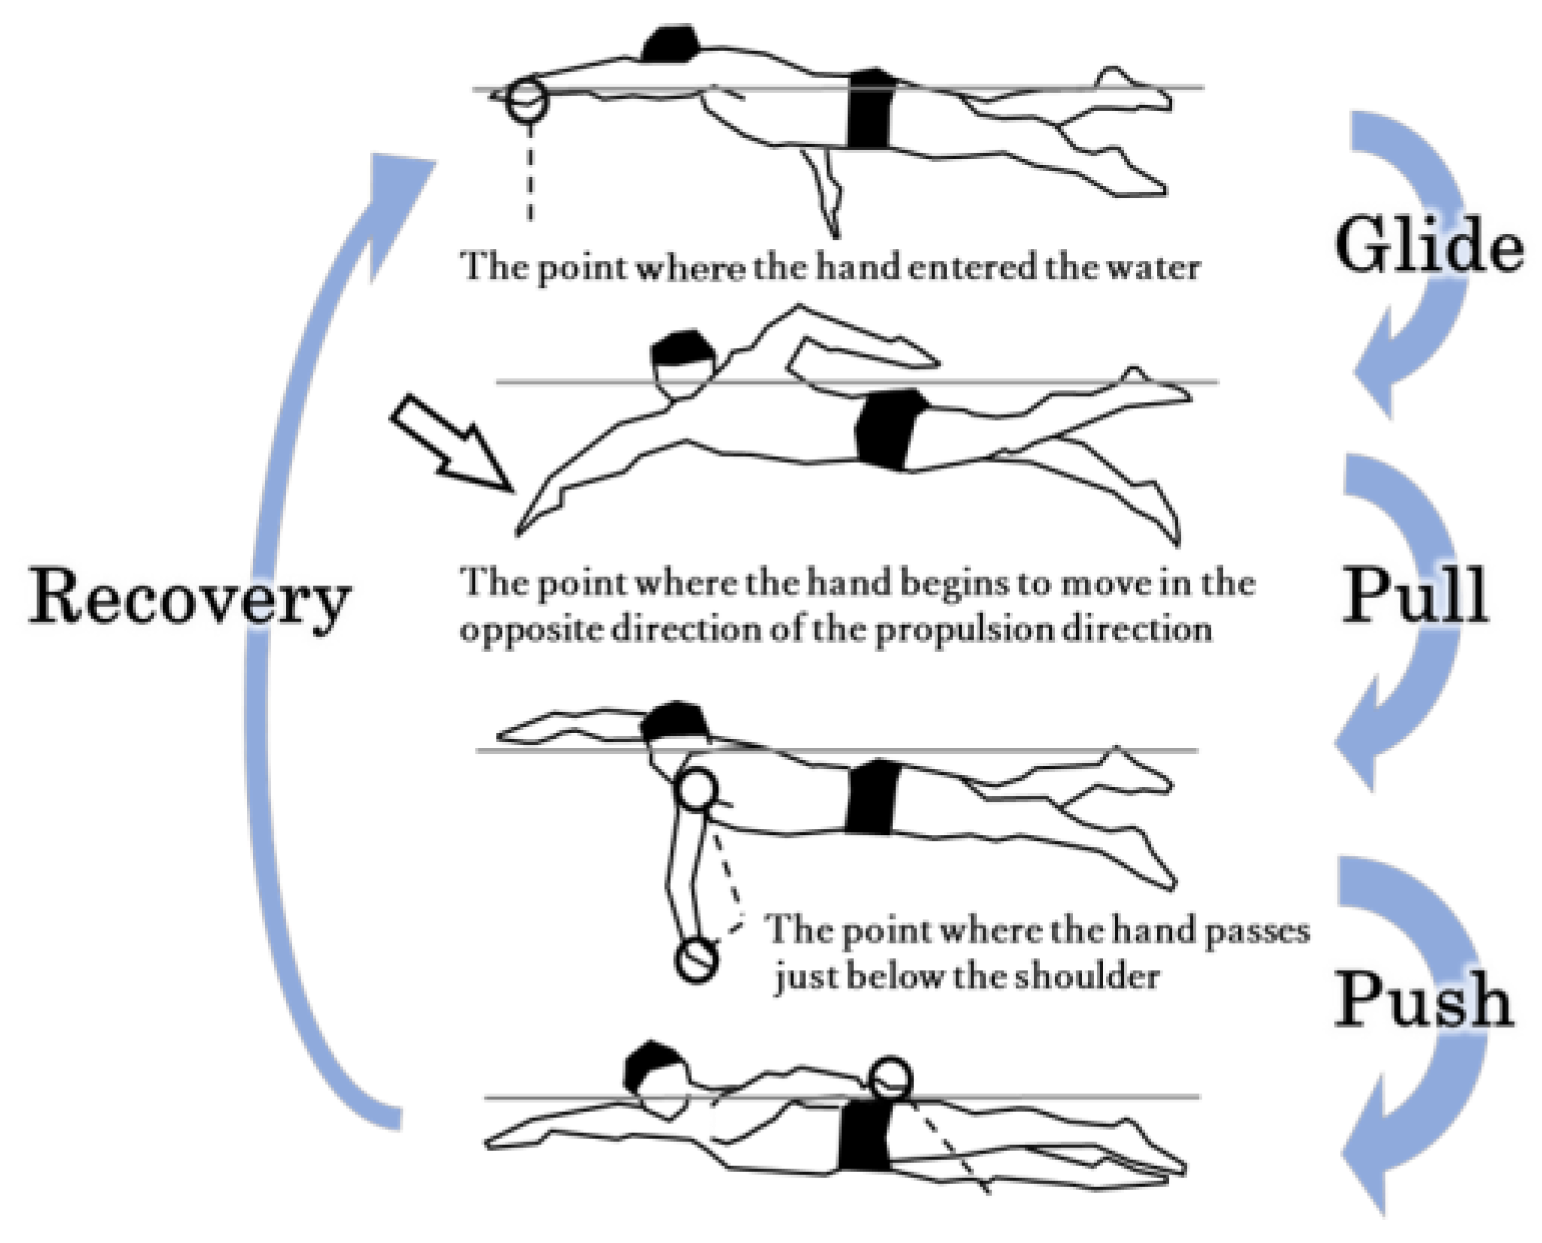
In this study, we divided the upper limb stroke motion into four phases (Figure 1) following the method of Chollet et al. (2000) to analyze the relationship between each variable and swimming motion. It should be noted that the division of swimming motion phases was performed using an absolute coordinate system, not a moving coordinate system fixed to the swimmer. We divided one cycle of the stroke into the following four phases: Glide, Pull, Push, and Recovery. The Glide phase was defined as the period from the point where the Z-coordinate of the fifth metacarpophalangeal joint became negative (entry point) when the water surface was set to 0, to the point where the Y-coordinate of the fifth metacarpophalangeal joint began to move in the opposite direction of the swimmer’s direction of travel. The Pull phase was defined as the period from the end of the Glide phase to the point where the Y-coordinate of the fifth metacarpophalangeal joint reached just below the Y-coordinate of the acromion. The Push phase was defined as the period from the end of the Pull phase to the point where the Z-coordinate of the fifth metacarpophalangeal joint became positive (exit point). Finally, the Recovery phase was defined as the period from the end of the Push phase to the beginning of the Glide phase (end of one cycle).
2.4. Three-Dimensional Motion Analysis and Measurement of Upper Limb Strokes
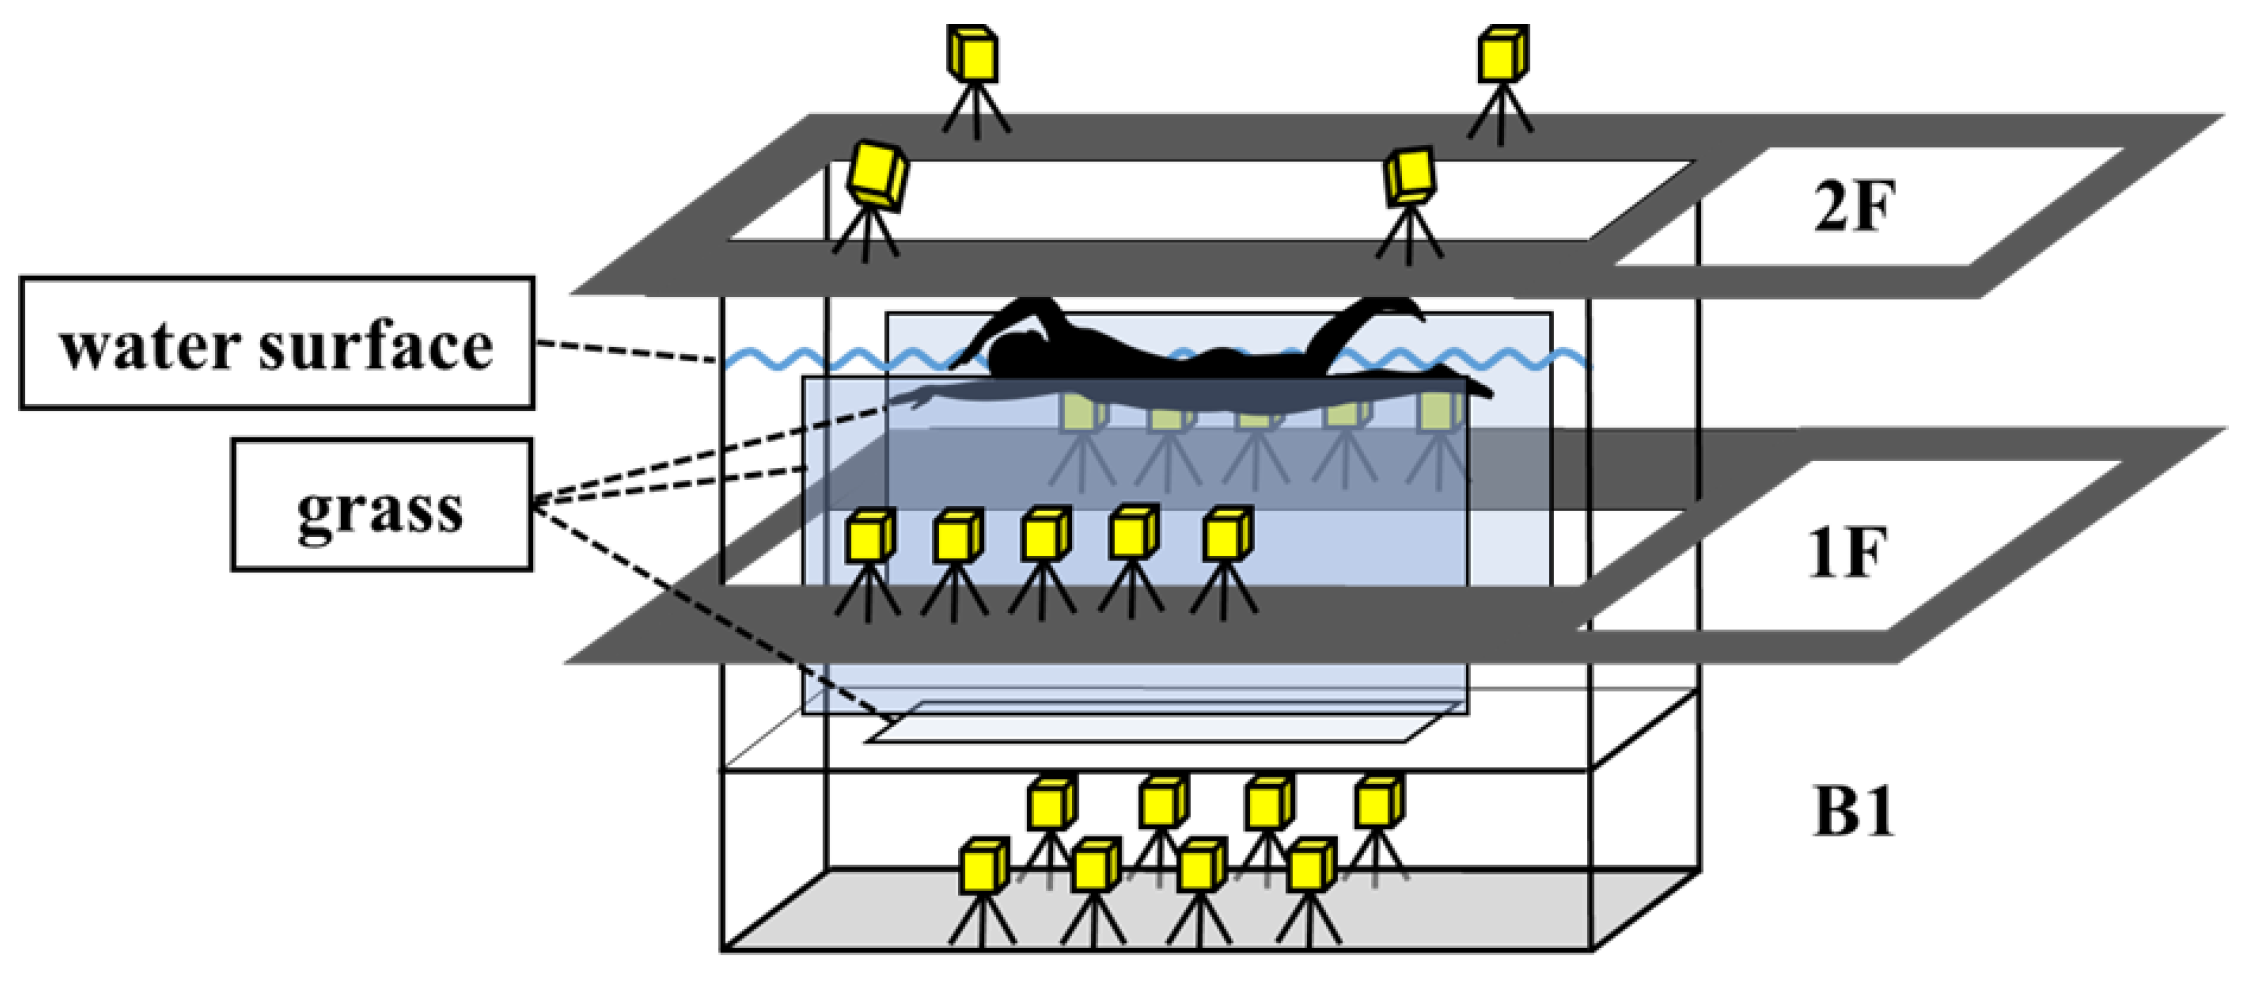
To investigate variables such as upper limb and trunk movements of the subjects, we marked seven points on the body (crown; left and right acromions; left and right fifth MCP; left and right great trochanter) using wireless self-illuminating LED markers (Kirameki, Nobby Tech Inc., Tokyo, Japan) based on the method of [13] (Figure 2). Motion capture cameras (VENUS 3D, Nobby Tech Inc., Japan) were installed around the experimental recirculating water tank to measure underwater movements. A total of 18 cameras, 5 on each side of the swimmer and 8 below, were used to capture the movements, while 4 cameras were installed above the recirculating water tank to capture surface movements. The LED marker’s actual coordinate values were obtained by calibrating the calibration volume’s LED markers. To reduce refraction caused by the glass surface of the recirculating water tank, the cameras were adjusted parallel to the glass projection surface, and the camera positions were determined to ensure that the markers attached to the body could be captured by at least two cameras (Figure 3). To prevent misidentification of the LED markers due to reflection of light on the water and glass surfaces during both the calibration and trial sessions, we tried to block out as much sunlight as possible from outside using curtains. We used an illuminometer (KEW5204, KYORITSU Inc., Japan) to measure the light intensity and confirmed that the light intensity on the water surface and underwater, which was within the measurement range, was less than 50 lx.
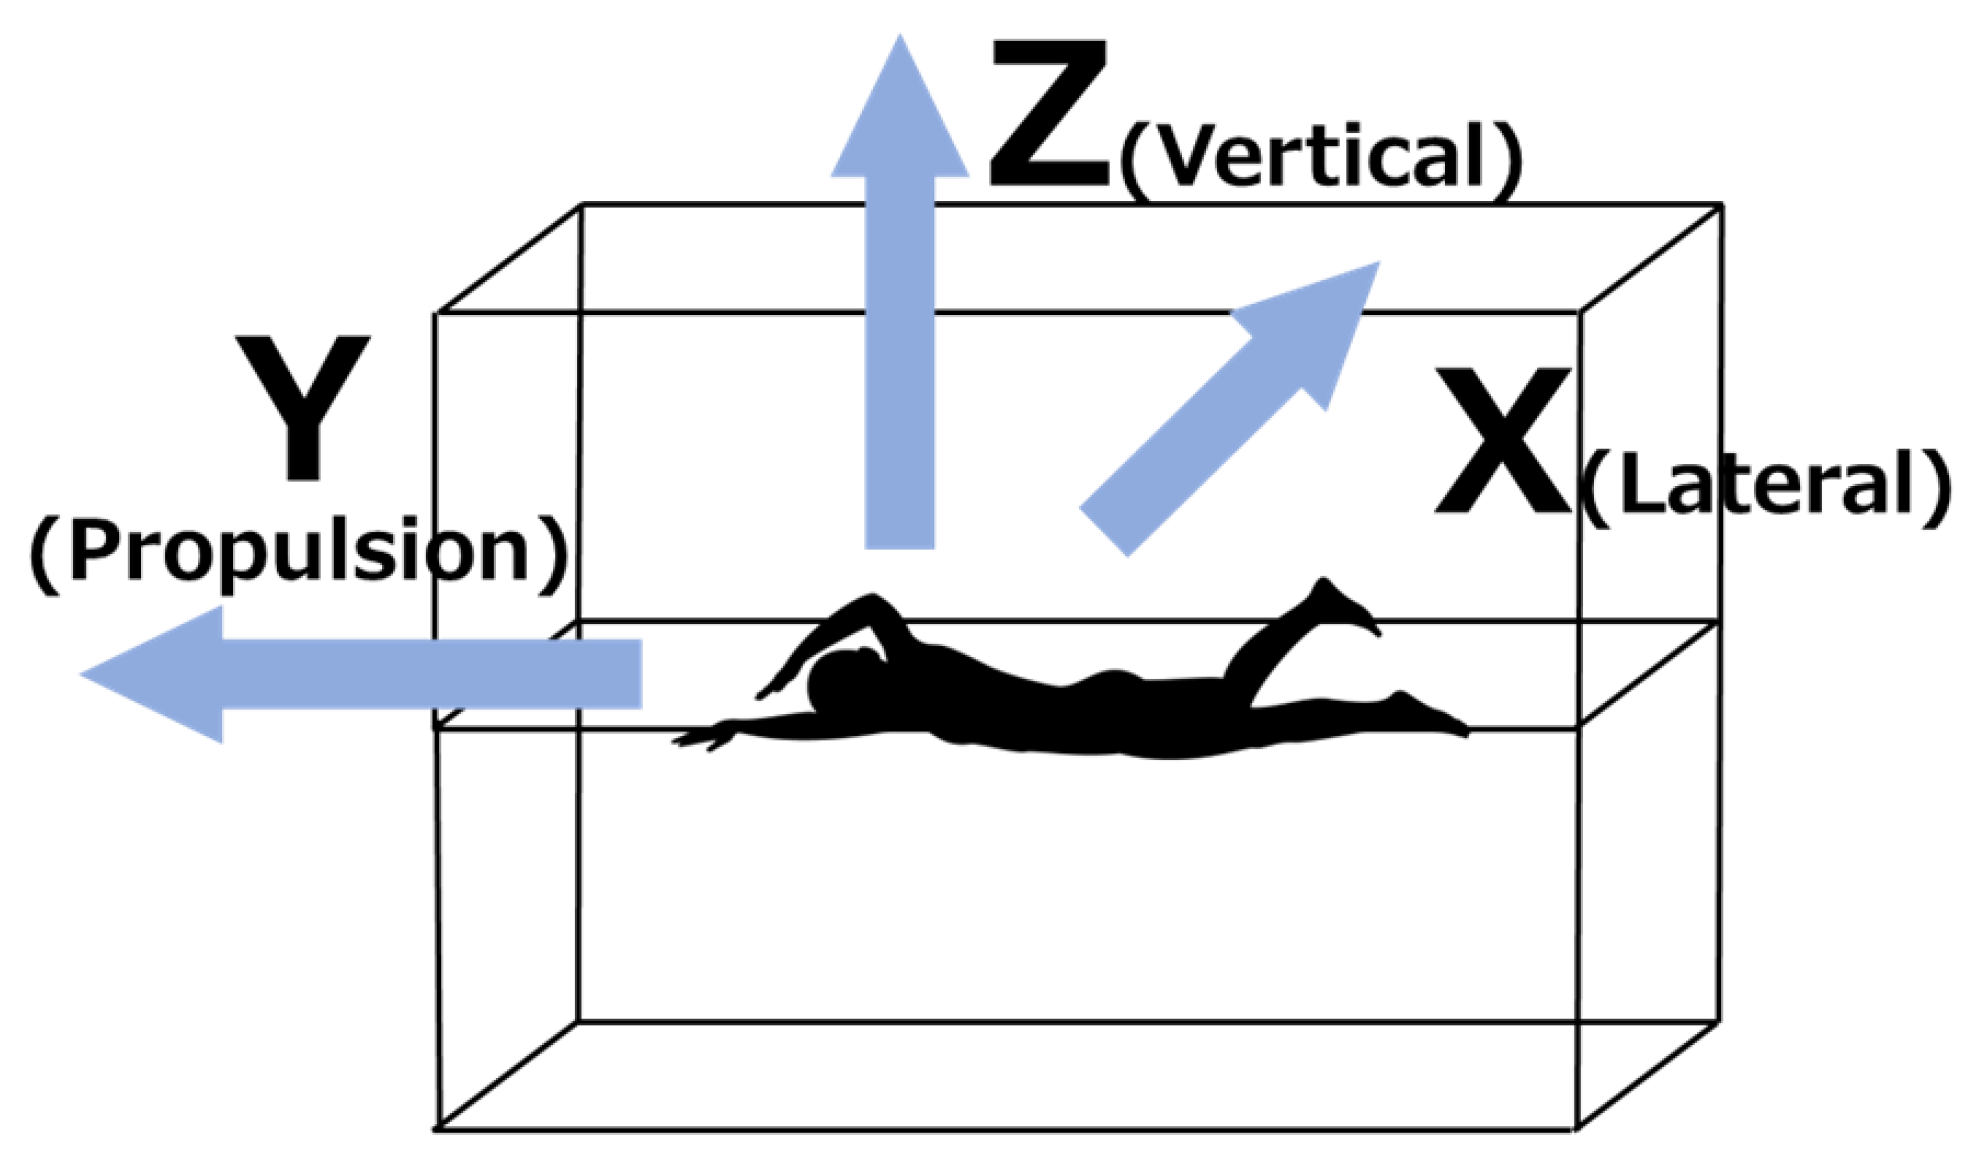
For analysis, image analysis software (VENUS 3D R, Novitec Corporation, Japan) was used to construct a 3D space from the 3D coordinate values of the body by calculating the distance from the camera to the LED markers using an epipolar matching algorithm. A right-handed fixed coordinate system was used, with the X-axis representing the left–right direction of the subject (with left as the positive direction), the Y-axis representing the direction of motion (with propulsion as the positive direction), and the Z-axis representing the vertical direction (with the water surface as the positive direction) (Figure 4). The obtained actual coordinate values were filtered using a low-pass filter to eliminate frequencies above outlier values, reduce noise, and smooth the data.
Prior to the experiment, a dynamic calibration using a dedicated calibration wand was conducted to construct a 3D coordinate space of the measurement range. The wand was swung within the field of view of each camera to acquire 1500 or more samples from each camera. Dynamic calibration was performed separately for underwater and above-water environments to eliminate refraction of light by the water surface. The standard error of motion capture after calibration was less than 0.5 mm for both underwater and above-water environments. Subsequently, a calibration LED marker plate was placed on the water surface in an L-shape with three points to synthesize the 3D coordinate space of the underwater and above-water environments. Calibration was performed for 30 s by identifying the water surface through capturing the position of the markers from underwater and above-water perspectives, and aligning the coordinate axes to determine the origin of the space. Since the plate had thickness and there were gaps between the markers placed in the underwater and above-water environments, the length of the gaps was measured and reflected in aligning the coordinate axes. Additionally, calculation errors were calculated by measuring the length of a wand with a predetermined size at multiple positions within the field of view after calibration [14]. The length of the wand was measured 100 times at three locations (front, middle, and back) within the measurement range, and the maximum error was less than 0.5 mm.
The analysis items in this study are as follows, and the abbreviation for each item is shown. Stroke frequency (stroke/min) is abbreviated as “SF (Stroke Frequency)”. SF is calculated by taking the strokes from the position where the Z-axis direction of the hand becomes negative to the position where it becomes positive again and then negative again, as one cycle, and by calculating the rotation speed per second from the time required for one cycle. Stroke length (m/stroke) is abbreviated as “SL (Stroke Length)”. Using the method of Kennedy et al. (1990) as a reference, stroke length was calculated by subtracting SF from the set swimming speed [15].
Shoulder rotation angle (degree) is abbreviated as “ShR (Shoulder Roll)”. ShR is the angle between the horizontal plane and the line connecting the left and right shoulder peaks when projected onto the XZ plane, and this is defined as the shoulder rotation angle. For the rotation angle, when both shoulders of the swimmer are parallel to the horizontal plane, the value is defined as 0°, and the value of the rotation angle in the direction where the right shoulder drops is defined as the negative direction. Hip rotation angle (degree) is abbreviated as “HiR (Hip Roll)”. HiR is the angle between the horizontal plane and the line connecting the left and right greater trochanters when projected onto the XZ plane, and this is defined as the hip rotation angle. For the rotation angle, when both hips of the swimmer are parallel to the horizontal plane, the value is defined as 0°, and the value of the rotation angle in the direction where the right hip drops is defined as the negative direction. Trunk twist angle (degree) is abbreviated as “TA (Twist Angle)”. The trunk twist angle is calculated by subtracting HiR from ShR, referring to the method of [16] (Figure 5). The timing where the angle difference is maximum is defined as the maximum twist, and the value at that time is defined as the trunk twist angle.
The shoulder and hip rotation angular velocities were calculated by differentiating the displacement of ShR and HiR with respect to time. In addition, during the Pull phase, because the movement direction changes from negative to positive, the phase where the right shoulder moves toward the pool bottom and rotates in the negative direction was defined as the Pull Roll phase, and the phase where the shoulder moves toward the water surface and rotates in the positive direction was defined as the Pull Roll Back phase. The phase from the end of the Pull phase to the hand exit was defined as the Push phase, and the average angular velocity was calculated for each phase.
The timing at which the rotation angles of the shoulder and hip reach their maximum values was analyzed and abbreviated as “Peak Time”. In the phases where the maximum rotation angles were observed, the time from the start of the phase to the point where the rotation angle reaches its maximum value was expressed as a relative time (%) value. The start of the phase was considered as 0%, and the end of the phase was considered as 100%. The peak timing of shoulder rotation angle (ShR Peak Time %) and hip rotation angle (HiR Peak Time %) were calculated. To compare the results at different swimming speeds, the time taken for each phase was normalized to 100%, and the time from the start of the phase to the point where the rotation angle reaches its maximum value was expressed as a phase percentage (%).
2.5. Statistical Analysis
The normality of the data was confirmed using the Shapiro–Wilk test. The differences between the skills at different swimming speeds were analyzed using paired t-tests. The correlation between variables was analyzed using Pearson’s correlation coefficient, and the absence of correlation was confirmed using a significance test. The threshold values for correlation coefficients indicating small, moderate, large, very large, and nearly perfect correlations were defined as 0.1, 0.3, 0.5, 0.7, and 0.9, respectively, based on Hopkins et al. (2009) [17]. All statistical analyses were performed using SPSS Statistics ver.25 (IBM, Chicago), and a significance level of less than 5% was used as the criterion for statistical significance. A power calculation using G*Power ver.3.1.9.6 (Heinrich Heine University Dusseldorf, GER) was performed to calculate the ES based on 10 participants to achieve a satisfactory power of 1-β err prob = 0.8.
3. Results
3.1. Set Swim Speed (SV), SF, and SL for Each Trial
Table 2 shows the mean and standard deviation of SV, SF, and SL for each trial. The mean values of swimming speed calculated from the best time excluding the start phase were 1.97 ± 0.06 m/s for V50 m and 1.87 ± 0.04 m/s for V100 m, and V50 m was significantly higher than V100 m (t = 7.21, p < 0.01). The mean values of SF were 63.08 ± 3.93 stroke/min for V50 m and 56.69 ± 3.26 stroke/min for V100 m, and V50 m was significantly higher than V100 m (t = 7.29, p < 0.01). The mean values of SL were 1.88 ± 0.14 m/stroke for V50 m and 1.98 ± 0.11 m/stroke for V100 m, and V50 m was significantly lower than V100 m (t = 4.25, p < 0.01).
3.2. Comparison of Different Swimming Speeds
Table 3 shows the mean and standard deviation of ShR, HiR, TA, ShRAV, HiRAV, and Peak Time for each rotation movement. In terms of ShR, HiR, and TA, ShR showed a significant difference between V50 m (52.9 ± 12.9 deg) and V100 m (55.8 ± 14.0 deg), with a lower value observed in V50 m (t = 2.22, p < 0.05). HiR did not show any significant differences between trials. For TA, a significant difference was observed between V50 m (34.0 ± 7.2 deg) and V100 m (30.6 ± 8.9 deg), with a lower value observed in V50 m (t = 2.75, p < 0.05). In terms of angular velocity, there were no significant differences between trials for ShRAV and HiRAV at any rotation movement. ShR and HiR showed the maximum values during the Pull phase, so the time from the start of the Pull phase to the peak value of ShR and HiR was calculated. The result showed that the HiR Peak Time was significantly lower in V50 m compared to V100 m (t = 4.45, p < 0.01).
3.3. Relationship between Rotation Angular Velocity and TA
Table 4 shows the correlation coefficients between the change rates of TA, ShRAV, and HiRAV in each phase, as well as the change rate of TA from V50 m to V100 m. In the Pull Roll phase, no correlation was found between the shoulder and hip in either parameter. In the Pull Roll Back phase, a moderate correlation was found between the change rates of TA and ShRAV (r = 0.575, p < 0.05). In the Push phase, a high correlation was found between the change rates of TA and ShRAV (r = 0.722, p < 0.01), as well as between the change rates of TA and HiRAV (r = 0.748, p < 0.01).
4. Discussion
4.1. Comparison of ShR, HiR, and TA between Trials
In each trial, ShR showed a significantly lower value for V50 m compared to V100 m. In addition, there was no significant difference between skills for HiR. In a previous study, Yanai (2003) reported a correlation between ShR and SF, where ShR decreased as SF increased [8]. Although the swimming speed set in this study was for short-distance events, which was faster than in the previous study on middle- to long-distance events, SF showed a significantly higher value for V50 m, and ShR was observed to be lower, indicating that similar results were obtained for short-distance events as in the previous study on middle- to long-distance events.
In TA calculated from the difference between ShR and HiR, V50 m showed a significantly higher value than V100 m. Hyodo et al. (2021) reported that during the phase when the trunk rotational angle showed the maximum value, the HiR exhibited a significantly lower value as the swimming speed increased until the HiR showed the maximum value [13]. In this study, similar results were obtained, suggesting that the rotation of the waist shifted early in the positive direction from the negative direction of rotational movement, resulting in an increase in the twisting angle as the time for the waist to rotate back in the positive direction and the time for the shoulder to rotate in the negative direction increased. Furthermore, Welch et al. (1995) investigated trunk rotational movement during batting and reported that the rotation of the waist occurs earlier than the rotation of the shoulder, which increases the moment produced by the shoulder and the angular velocity [18]. Based on this, in this study, we also analyzed the rotational angular velocity of the shoulder and waist simultaneously.
4.2. Comparison of Rotation Angular Velocity between Trials
Regarding ShRAV, no significant differences were observed between the two trials for the overall performance, but a change in the angular velocity from a negative to positive direction was confirmed during the rotation movement in the Pull phase for both trials. ShRAV showed the highest value in the Push phase. Kudo et al. (2013) reported that shoulder rotation angular velocity increased from the latter half of the Pull phase and reached a maximum value in the Push phase, which was also observed in race speed during short-distance crawl swimming. Similarly, no significant differences were observed between trials in HiRAV [12]. Psycharakis (2008) investigated the relationship between rotation movements of the shoulder and waist, and the upper and lower limbs, by Fourier transformation of each frequency [19]. As a result, it was shown that waist rotation movement is performed with the lower limbs and is greatly influenced by the kicking motion, and the direct relationship between waist rotation movement and hand movement is small. Therefore, it is necessary to investigate the relationship between a kicking motion and waist rotation movement, which is considered to be closely related to waist rotation movement, at the same time. From these results, it was inferred that there were significant individual differences in shoulder and waist rotation angular velocities. Therefore, the intra-individual changes between trials when changing swimming speeds were also investigated.
4.3. Relationship between the Rate of Change in TA and the Rate of Change in Rotation Angular Velocity between Trials
To compare the changes between the test techniques associated with changes in swimming speed, the change rates between the V50 m and V100 m test techniques were calculated, and the correlation between the change rates of TA and the rotation angular velocity of the shoulder and waist at each phase was analyzed. In ShRAV, significant correlations were observed between the change rate of TA and the change rate of the Pull Roll Back phase and the Push phase, respectively. In HiRAV, a significant correlation was observed between the change rate of TA and the change rate of the Push phase. Takahashi et al. (2018) reported that increasing the activity of the main muscles involved in trunk rotation, such as the external oblique and latissimus dorsi, before the start of the main movement of trunk rotation increases the moment of the shoulder [20]. In addition, previous studies by Kageyama et al. (2010) have reported that trunk rotation movements contribute to the improvement of ShRAV during the return twist by involving a stretch-shortening cycle of the trunk muscle group after ShR reaches its maximum [21]. In this study, a high correlation was observed between the change rate of TA and the change rates of the Pull Roll Back and Push phases, which are the return twist phases in ShRAV, similarly to the results of previous studies that investigated trunk rotation movements in other sports. Therefore, it is speculated that the increase in TA in short-distance freestyle swimming induces a stretch-shortening cycle of the trunk muscle group and affects the changes in ShRAV during the return twist phases (Pull Roll Back and Push phases) after ShR reaches its maximum. Koga et al. (2020) and Kudo et al. (2017) have reported that the increase in the angular velocity of the shoulder during the Push phase is related to the improvement of the propulsive force during the Push phase [14,22]. Therefore, it is suggested that the increase in TA contributes to the increase in angular velocity and affects the improvement of the propulsive force during the Push phase. In the future, it will be necessary to investigate the factors causing trunk rotation movements, including the recovery movements of the upper limbs, and their relationship with the trunk muscle group.
5. Conclusions
This study suggests that an increase in TA during short-distance crawl swimming induces SSC motion in the trunk muscle groups, which affects ShRAV in the Pull Roll Back phase and Push phases after ShR has reached its maximum value. To obtain a higher swimming speed, swimmers increase the trunk angle and increase the activity of their primary muscles, such as the external obliques and the latissimus dorsi muscles, before the start of the main motion of the twist back motion, which may induce the SSC motion in the trunk muscle group. However, since this study did not investigate the actual muscle activity of the trunk muscles, in the future, it is necessary to investigate muscle activity during trunk rotation motion using electromyography. Additionally, this study did not consider the resistance exerted on the swimmer from the front of the body or the buoyancy provided by the water with an increase in swimming speed. The development of systems and equipment that can measure these values simultaneously is also important for the development of swimming.
Author Contributions
Conceptualization, H.H. and D.K.; methodology, H.H. and D.K.; software, H.H.; validation, H.H., D.K. and Y.S.; formal analysis, H.H.; investigation, H.H.; resources, Y.S.; data curation, H.H.; writing—original draft preparation, H.H.; writing—review and editing, H.H., D.K., T.W. and Y.S.; visualization, H.H.; supervision, H.H.; project administration, H.H.; funding acquisition, H.H. and Y.S. All authors have read and agreed to the published version of the manuscript.
Funding
This research received no external funding.
Institutional Review Board Statement
The study was conducted in accordance with the Declaration of Helsinki, and approved by the Institutional Kokushikan University Ethics Committee (protocol code R4-005 and October 17th, 2022).
Informed Consent Statement
The study participants and school authorities agreed to publish data from the outbreak.
Data Availability Statement
The datasets generated during and/or analyzed during the current study are available from the corresponding author upon reasonable request.
Conflicts of Interest
The authors declare no conflict of interest.
References
- Hollander, A.P.; De Groot, G.; van Ingen Schenau, G.J.; Toussaint, H.M.; De Best, H.; Peeters, W.; Schreurs, A.W. Measurement of active drag during crawl arm stroke swimming. J. Sport. Sci. 1986, 4, 21–30. [Google Scholar] [CrossRef]
- Narita, K.; Nakashima, M.; Takagi, H. Effect of leg kick on active drag in front-crawl swimming: Comparison of whole stroke and arms-only stroke during front-crawl and the streamlined position. J. Biomech. 2018, 76, 197–203. [Google Scholar] [CrossRef]
- Watkins, J.; Gordon, A.T. The effects of leg action on performance in the sprint front crawl stroke. Int. Symp. Biomech. Med. Swim. 1983, 14, 310–314. [Google Scholar]
- Deschodt, V.J.; Arsac, L.M.; Rouard, A.H. Relative contribution of arms and legs in humans to propulsion in 25-m sprint front-crawl swimming. Eur. J. Appl. Physiol. Occup. Physiol. 1999, 80, 192–199. [Google Scholar] [CrossRef]
- Gourgoulis, V.; Boli, A.; Aggeloussis, N.; Toubekis, A.; Antoniou, P.; Kasimatis, P.; Mavromatis, G. The effect of leg kick on sprint front crawl swimming. J. Sport. Sci. 2014, 32, 278–289. [Google Scholar] [CrossRef] [PubMed]
- Narita, K.; Nakashima, M.; Takagi, H. Developing a methodology for estimating the drag in front-crawl swimming at various velocities. J. Biomech. 2017, 54, 123–128. [Google Scholar] [CrossRef]
- Tsunokawa, T.; Mankyu, H.; Ogita, F. Relationship between swimming velocity and stroke parameters during the front-crawl. Jpn. Soc. Phys. Educ. Health Sport Sci. 2019, 64, 385–400. [Google Scholar] [CrossRef]
- Yanai, T. Stroke frequency in front crawl: Its mechanical link to the fluid forces required in non-propulsive directions. J. Biomech. 2003, 36, 53–62. [Google Scholar] [CrossRef]
- Schleihauf, R.E. Three-Dimensional Analysis of Hand Propulsion in the Sprint Front Crawl Stroke, Biomechanics and Medicine in Swimming; Human Kinetics Publishers: Champaign, IL, USA, 1983; pp. 173–184. [Google Scholar]
- Grimston, S.K.; Hay, J.G. Relationships among anthropometric and stroking characteristics of college swimmers. Med. Sci. Sport. Exerc. 1986, 18, 60–68. [Google Scholar] [CrossRef]
- Payton, C.; Baltzopoulos, V.; Bartlett, R. Contributions of rotations of the trunk and upper extremity to hand velocity during front crawl swimming. J. Appl. Biomech. 2002, 18, 243–256. [Google Scholar] [CrossRef]
- Kudo, S.; Vennell, R.; Wilson, B. The effect of unsteady flow due to acceleration on hydrodynamic forces acting on the hand in swimming. J. Biomech. 2013, 46, 1697–1704. [Google Scholar] [CrossRef] [PubMed]
- Hyodo, H.; Koga, D.; Wada, T.; Sengoku, Y. A study of shoulder and hip rotation in short-distance front crawl swimming. Jpn. Soc. Phys. Educ. Health Sport Sci. 2021, 66, 841–852. [Google Scholar] [CrossRef]
- Koga, D.; Gonjo, T.; Kawai, E.; Tsunokawa, T.; Sakai, S.; Sengoku, Y.; Takagi, H. Effects of exceeding stroke frequency of maximal effort on hand kinematics and hand propulsive force in front crawl. Sport. Biomech. 2020, 29, 1–13. [Google Scholar] [CrossRef]
- Kennedy, P.; Brown, P.; Chengalur, S.N.; Nelson, R.C. Analysis of male and female Olympic swimmers in the 100-meter events. J. Appl. Biomech. 1990, 6, 187–197. [Google Scholar] [CrossRef]
- Wada, S.; Ae, T.; Endo, T.; Tanaka, M. Biomechanical analysis of the torso twisting during the spiking motion in volleyball. Jpn. Soc. Volleyb. 2003, 5, 1–5. [Google Scholar] [CrossRef]
- Hopkins, W.; Marshall, S.; Batterham, A.; Hanin, J. Progressive statistics for studies in sports medicine and exercise science. Med.+ Sci. Sport.+ Exerc. 2009, 41, 3. [Google Scholar] [CrossRef]
- Welch, C.M.; Banks, S.A.; Cook, F.F.; Draovitch, P. Hitting a baseball: A biomechanical description. J. Orthop. Sport. Phys. Ther. 1995, 22, 193–201. [Google Scholar] [CrossRef] [PubMed]
- Psycharakis, S.G.; Sanders, R.H. Shoulder and hip roll changes during 200-m front crawl swimming. Med. Sci. Sport. Exerc. 2008, 40, 2129–2136. [Google Scholar] [CrossRef]
- Takahashi, K.; Kariyama, H.; Yoshida, T.; Hayashi, R.; Asai, T. Characteristics of force and power outputs during the trunk-twist exercise accompanying stretch-shortening cycle movement. Jpn. Soc. Phys. Educ. Health Sport Sci. 2018, 63, 641–657. [Google Scholar] [CrossRef]
- Kageyama, M.; Iwamoto, M.; Sugiyama, T.; Mizutani, M.; Kanehisa, H.; Maeda, A. Effect of stretch-shortening cycle and pitching movements elicited by trunk rotation on ball velocity in university baseball pitchers. Jpn. Soc. Phys. Educ. Health Sport Sci. 2014, 59, 189–201. [Google Scholar] [CrossRef]
- Kudo, S.; Sakurai, Y.; Miwa, T.; Matsuda, Y. Relationship between shoulder roll and hand propulsion in the front crawl stroke. J. Sport. Sci. 2017, 35, 945–952. [Google Scholar] [CrossRef] [PubMed]
Figure 1.
Phase Division of Upper Limb Stroke.

Figure 2.
Diagram of Marking Points.

Figure 3.
Diagram of the Experimental Setting.

Figure 4.
Coordinate Axis Definition.

Figure 5.
Definition of Trunk Twist Angle.


Table 1.
Physical Characteristic Performance Level of Subjects.
| Subject | Age (years) | Height (cm) | Weight (kg) | Best Record of 50 m FreeStyle (s″) | Fina Point | Best Record of 100 m FreeStyle (s″) | Fina Point |
|---|---|---|---|---|---|---|---|
| A | 21 | 189 | 80 | 23.37 | 716.3 | 51.74 | 745.3 |
| B | 20 | 169 | 71 | 23.94 | 666.3 | 53.04 | 691.8 |
| C | 23 | 180 | 83 | 23.41 | 712.6 | 51.34 | 762.8 |
| D | 18 | 180 | 76 | 24.06 | 656.4 | 51.72 | 746.1 |
| E | 22 | 180 | 74 | 23.59 | 696.4 | 51.91 | 738.0 |
| F | 18 | 185 | 72 | 23.40 | 713.5 | 52.11 | 729.5 |
| G | 21 | 169 | 72 | 23.87 | 672.2 | 50.95 | 780.5 |
| H | 20 | 183 | 75 | 24.26 | 640.3 | 51.43 | 758.8 |
| I | 20 | 175 | 79 | 23.95 | 665.5 | 51.33 | 763.3 |
| J | 27 | 188 | 91 | 21.67 | 898.4 | 48.35 | 913.3 |
| mean | 21.0 | 179.8 | 77.3 | 23.55 | 51.39 | ||
| SD | 2.5 | 6.7 | 5.9 | 0.69 | 1.15 |
Table 2.
Mean Values of Each Variable at V50 m and V100 m.
| Subject | SV (m/s) | SF (Stroke/min) | SL (m/Stroke) | |||||
|---|---|---|---|---|---|---|---|---|
| V50 m | V100 m | V50 m | V100 m | V50 m | V100 m | |||
| A | 1.97 | 1.85 | 65.22 | 58.82 | 1.81 | 1.89 | ||
| B | 1.94 | 1.81 | 62.50 | 53.57 | 1.86 | 2.03 | ||
| C | 1.97 | 1.86 | 59.41 | 54.55 | 1.99 | 2.05 | ||
| D | 1.92 | 1.86 | 65.22 | 59.41 | 1.77 | 1.88 | ||
| E | 1.98 | 1.85 | 67.42 | 58.25 | 1.76 | 1.91 | ||
| F | 1.99 | 1.84 | 61.86 | 51.72 | 1.93 | 2.13 | ||
| G | 1.93 | 1.88 | 69.77 | 60.61 | 1.66 | 1.86 | ||
| H | 1.90 | 1.86 | 55.56 | 52.63 | 2.05 | 2.12 | ||
| I | 1.94 | 1.88 | 63.83 | 61.22 | 1.82 | 1.84 | ||
| J | 2.14 | 1.98 | 60.00 | 56.07 | 2.14 | 2.12 | ||
| mean | 1.97 ** | 1.87 | 63.08 ** | 56.69 | 1.88 ** | 1.98 | ||
| SD | 0.06 | 0.04 | 3.93 | 3.26 | 0.14 | 0.11 | ||
Significant difference between conditions. ** p < 0.01.
Table 3.
Mean Values of ShR, HiR, and TA Variables at V50 m and V100 m.
| Variables | Unit | V50 m | V100m | Difference | Rate of Change (%) | |||||||
|---|---|---|---|---|---|---|---|---|---|---|---|---|
| Mean | ± | SD | Mean | ± | SD | |||||||
| ShR | deg | 52.9 | 12.9 | 55.8 | 14.0 | −2.9 | 94.8 | |||||
| HiR | deg | 29.0 | 8.8 | 30.8 | 8.1 | −1.8 | 94.2 | |||||
| TA | deg | 34.0 | 7.2 | 30.6 | 8.9 | 3.3 * | 110.9 | |||||
| ShRAV | Pull Roll | rad/s | −3.5 | 1.0 | −3.8 | 1.0 | 0.3 | 92.7 | ||||
| Pull Roll Back | rad/s | 2.7 | 1.8 | 2.7 | 1.6 | 0.0 | 99.7 | |||||
| Push | rad/s | 4.9 | 1.0 | 4.5 | 0.8 | 0.4 | 108.5 | |||||
| HiRAV | Pull Roll | rad/s | −2.3 | 0.6 | −2.4 | 0.7 | 0.0 | 98.5 | ||||
| Pull Roll Back | rad/s | 2.3 | 1.0 | 2.4 | 0.9 | −0.1 | 97.7 | |||||
| Push | rad/s | 2.5 | 0.7 | 2.4 | 0.7 | 0.1 | 104.3 | |||||
| ShR Peak Time | % | 35.3 | 1.0 | 37.4 | 10.4 | −2.1 | 94.4 | |||||
| HiR Peak Time | % | 29.0 | 12.4 | 33.9 | 12.0 | −4.9 ** | 85.5 | |||||
Significant difference between conditions. * p < 0.05, ** p < 0.01.
Table 4.
Correlation Coefficients between the Percent Change in TA at V50 m Relative to V100 m and the Percent Change in ShRAV and HiRAV for Each Phase.
Table 4.
Correlation Coefficients between the Percent Change in TA at V50 m Relative to V100 m and the Percent Change in ShRAV and HiRAV for Each Phase.
| Variables | Rate of Change (%) | Correlation Coefficient (r) | ||
|---|---|---|---|---|
| vs. TA | ||||
| TA | 110.9 | |||
| ShRAV | Pull Roll | 92.7 | 0.080 | |
| Pull Roll Back | 99.7 | 0.575 * | ||
| Push | 105.7 | 0.722 ** | ||
| HiRAV | Pull Roll | 97.6 | −0.317 | |
| Pull Roll Back | 97.7 | 0.117 | ||
| Push | 104.3 | 0.748 ** | ||
Significant difference between conditions. * p < 0.05, ** p < 0.01.
Disclaimer/Publisher’s Note: The statements, opinions and data contained in all publications are solely those of the individual author(s) and contributor(s) and not of MDPI and/or the editor(s). MDPI and/or the editor(s) disclaim responsibility for any injury to people or property resulting from any ideas, methods, instructions or products referred to in the content. |
© 2023 by the authors. Licensee MDPI, Basel, Switzerland. This article is an open access article distributed under the terms and conditions of the Creative Commons Attribution (CC BY) license (https://creativecommons.org/licenses/by/4.0/).
Share and Cite
MDPI and ACS Style
Hyodo, H.; Koga, D.; Sengoku, Y.; Wada, T. Relationship between Swimming Velocity and Trunk Twist Motion in Short-Distance Crawl Swimming. Biomechanics 2023, 3, 193-203. https://doi.org/10.3390/biomechanics3020017
AMA Style
Hyodo H, Koga D, Sengoku Y, Wada T. Relationship between Swimming Velocity and Trunk Twist Motion in Short-Distance Crawl Swimming. Biomechanics. 2023; 3(2):193-203. https://doi.org/10.3390/biomechanics3020017
Chicago/Turabian StyleHyodo, Hiroki, Daiki Koga, Yasuo Sengoku, and Tadashi Wada. 2023. "Relationship between Swimming Velocity and Trunk Twist Motion in Short-Distance Crawl Swimming" Biomechanics 3, no. 2: 193-203. https://doi.org/10.3390/biomechanics3020017