
Biomechanical Modeling of Cerebral Aneurysm Progression to Estimate Rupture Risk


1
Centre for Biomedical Engineering, Indian Institute of Technology (IIT), Delhi 110016, India
2
Department of Biomedical Engineering, All India Institute of Medical Sciences (AIIMS), Delhi 110029, India
*
Author to whom correspondence should be addressed.
Biomechanics 2023, 3(1), 13-28; https://doi.org/10.3390/biomechanics3010002
Submission received: 11 October 2022
/
Revised: 17 December 2022
/
Accepted: 27 December 2022
/
Published: 3 January 2023
(This article belongs to the Section Tissue and Vascular Biomechanics)
Abstract
:A cerebral aneurysm is a medical condition described as the bulging out of the cerebral artery under adverse pressure conditions. Patients with such medical conditions have a mortality of 20% and additional morbidity of 30–40% due to aneurysm rupture. The currently used imaging tools such as MRI and CT scans only provide geometrical information of the aneurysm and not the rupture risk associated with the progression of the aneurysm. A novel computational modeling framework was developed to model aneurysm progression and evaluate the stress distribution under varying pressure loading conditions to bridge this gap. Image segmentation was used to segment two middle cerebral arteries (MCA) and reconstructed to design aneurysm models at vulnerable sites for aneurysm progression simulation. Five aneurysm sizes and two different wall thicknesses were modeled to simulate different stages of aneurysm progression. Three pressures (i.e., diastolic, systolic, and hypertensive) were adopted to mimic the realistic pressure loading scenario for the middle cerebral arteries, and the stress distributions across all the models were estimated to understand the rupture risk. It was observed that the induced stresses in the aneurysm walls increased with an increase in the aneurysm diameter and blood pressure. Additionally, an aneurysm with a large diameter and thin walls exhibited a high risk of rupture, especially at high blood pressures. The reported results are anticipated to help medical practitioners predict rupture risks with known imaging-based aneurysm sizes and make timely decisions for such aneurysm conditions.
1. Introduction
A cerebral aneurysm is a medical condition wherein thin spots appear in a weak section of the artery, which balloons or bulges out due to pressure. The developed aneurysm generates extra back pressure on the arterial walls which affects the nerves of the human brain. In the worst-case scenario, an aneurysm may burst or rupture or spill blood on the surrounding tissue. The condition of arteries bursting due to an aneurysm is termed brain hemorrhage [1,2,3,4,5]. Patients with known ruptures have around 20% mortality and an additional 30–40% morbidity [6,7,8]. Upon diagnosis of a cerebral aneurysm, the rupture risk is assessed to determine whether surgical operation should be undertaken. The decision to surgically operate the aneurysm is taken by comparing the rupture risk against the risks inherent in the operation. The treatment for cerebral aneurysms is either surgical clipping or endovascular coiling [9,10,11].
De Gelidi et al. [12] computationally investigated the initiation of an aneurysm in a regular aorta arterial model by inflating it with high pressure. To predict the aneurysm formation, they used two different material properties (anisotropic and isotropic) for designing two geometries of descending aorta, i.e., cylindrical and physiological. They found that the properties of the materials significantly affect the modeling results and predict the aneurysm formation. Kroon [9] modeled and simulated the growth of a cerebral aneurysm. The pressure stresses during the cardiac cycle were considered, and structural analysis was performed. The developed framework assessed the rupture risk of a cerebral aneurysm and reproduced the clinical results when compared for validation. Cebral et al. [13] modeled and simulated 62 patient-specific aneurysm models to evaluate the rupture of cerebral aneurysms. The results indicated that disturbed flow patterns, small impingement regions, and narrow jets are significantly associated with ruptured aneurysms. John [14] undertook a study to characterize the different flow types present in anterior communicating artery aneurysms. Patient-specific computational models were constructed, and simulations were performed to investigate ruptures. The findings showed that aneurysms with small impaction zones and higher flow rates entering the aneurysm were more prone to rupture risk. Jeong et al. [15] summarized hemodynamic studies, highlighting the initiation, progress, and rupture of cerebral aneurysms. The results showed that aneurysms rupturing at the arterial walls were observed with maximum stress values and displacement.
It is known from the literature that excessive stress and deformation of cerebral arteries trigger biological and biochemical responses in the arteries, which lead to changes in biomechanical characteristics of artery structure. The changes in the mechanical properties are mainly observed in terms of elastic modulus and Poisson’s ratio with the development and progression of aneurysms. In earlier models of aneurysm progression, researchers considered factors such as mechanical properties, geometries of the aneurysm, and application of various pressures. In this work, biomechanical modeling of aneurysm progression has been performed with different aneurysm sizes and thicknesses of the aneurysm wall. Aneurysm models were developed considering the ratio of aneurysm diameter to neck width to simulate the conditions more realistically. These models were studied to understand the effect of the different structural parameters and pressures on the development of stress and rupture risk.
2. Materials and Methods
2.1. Geometrical Modeling
2.1.1. Arterial Segmentation and Modeling
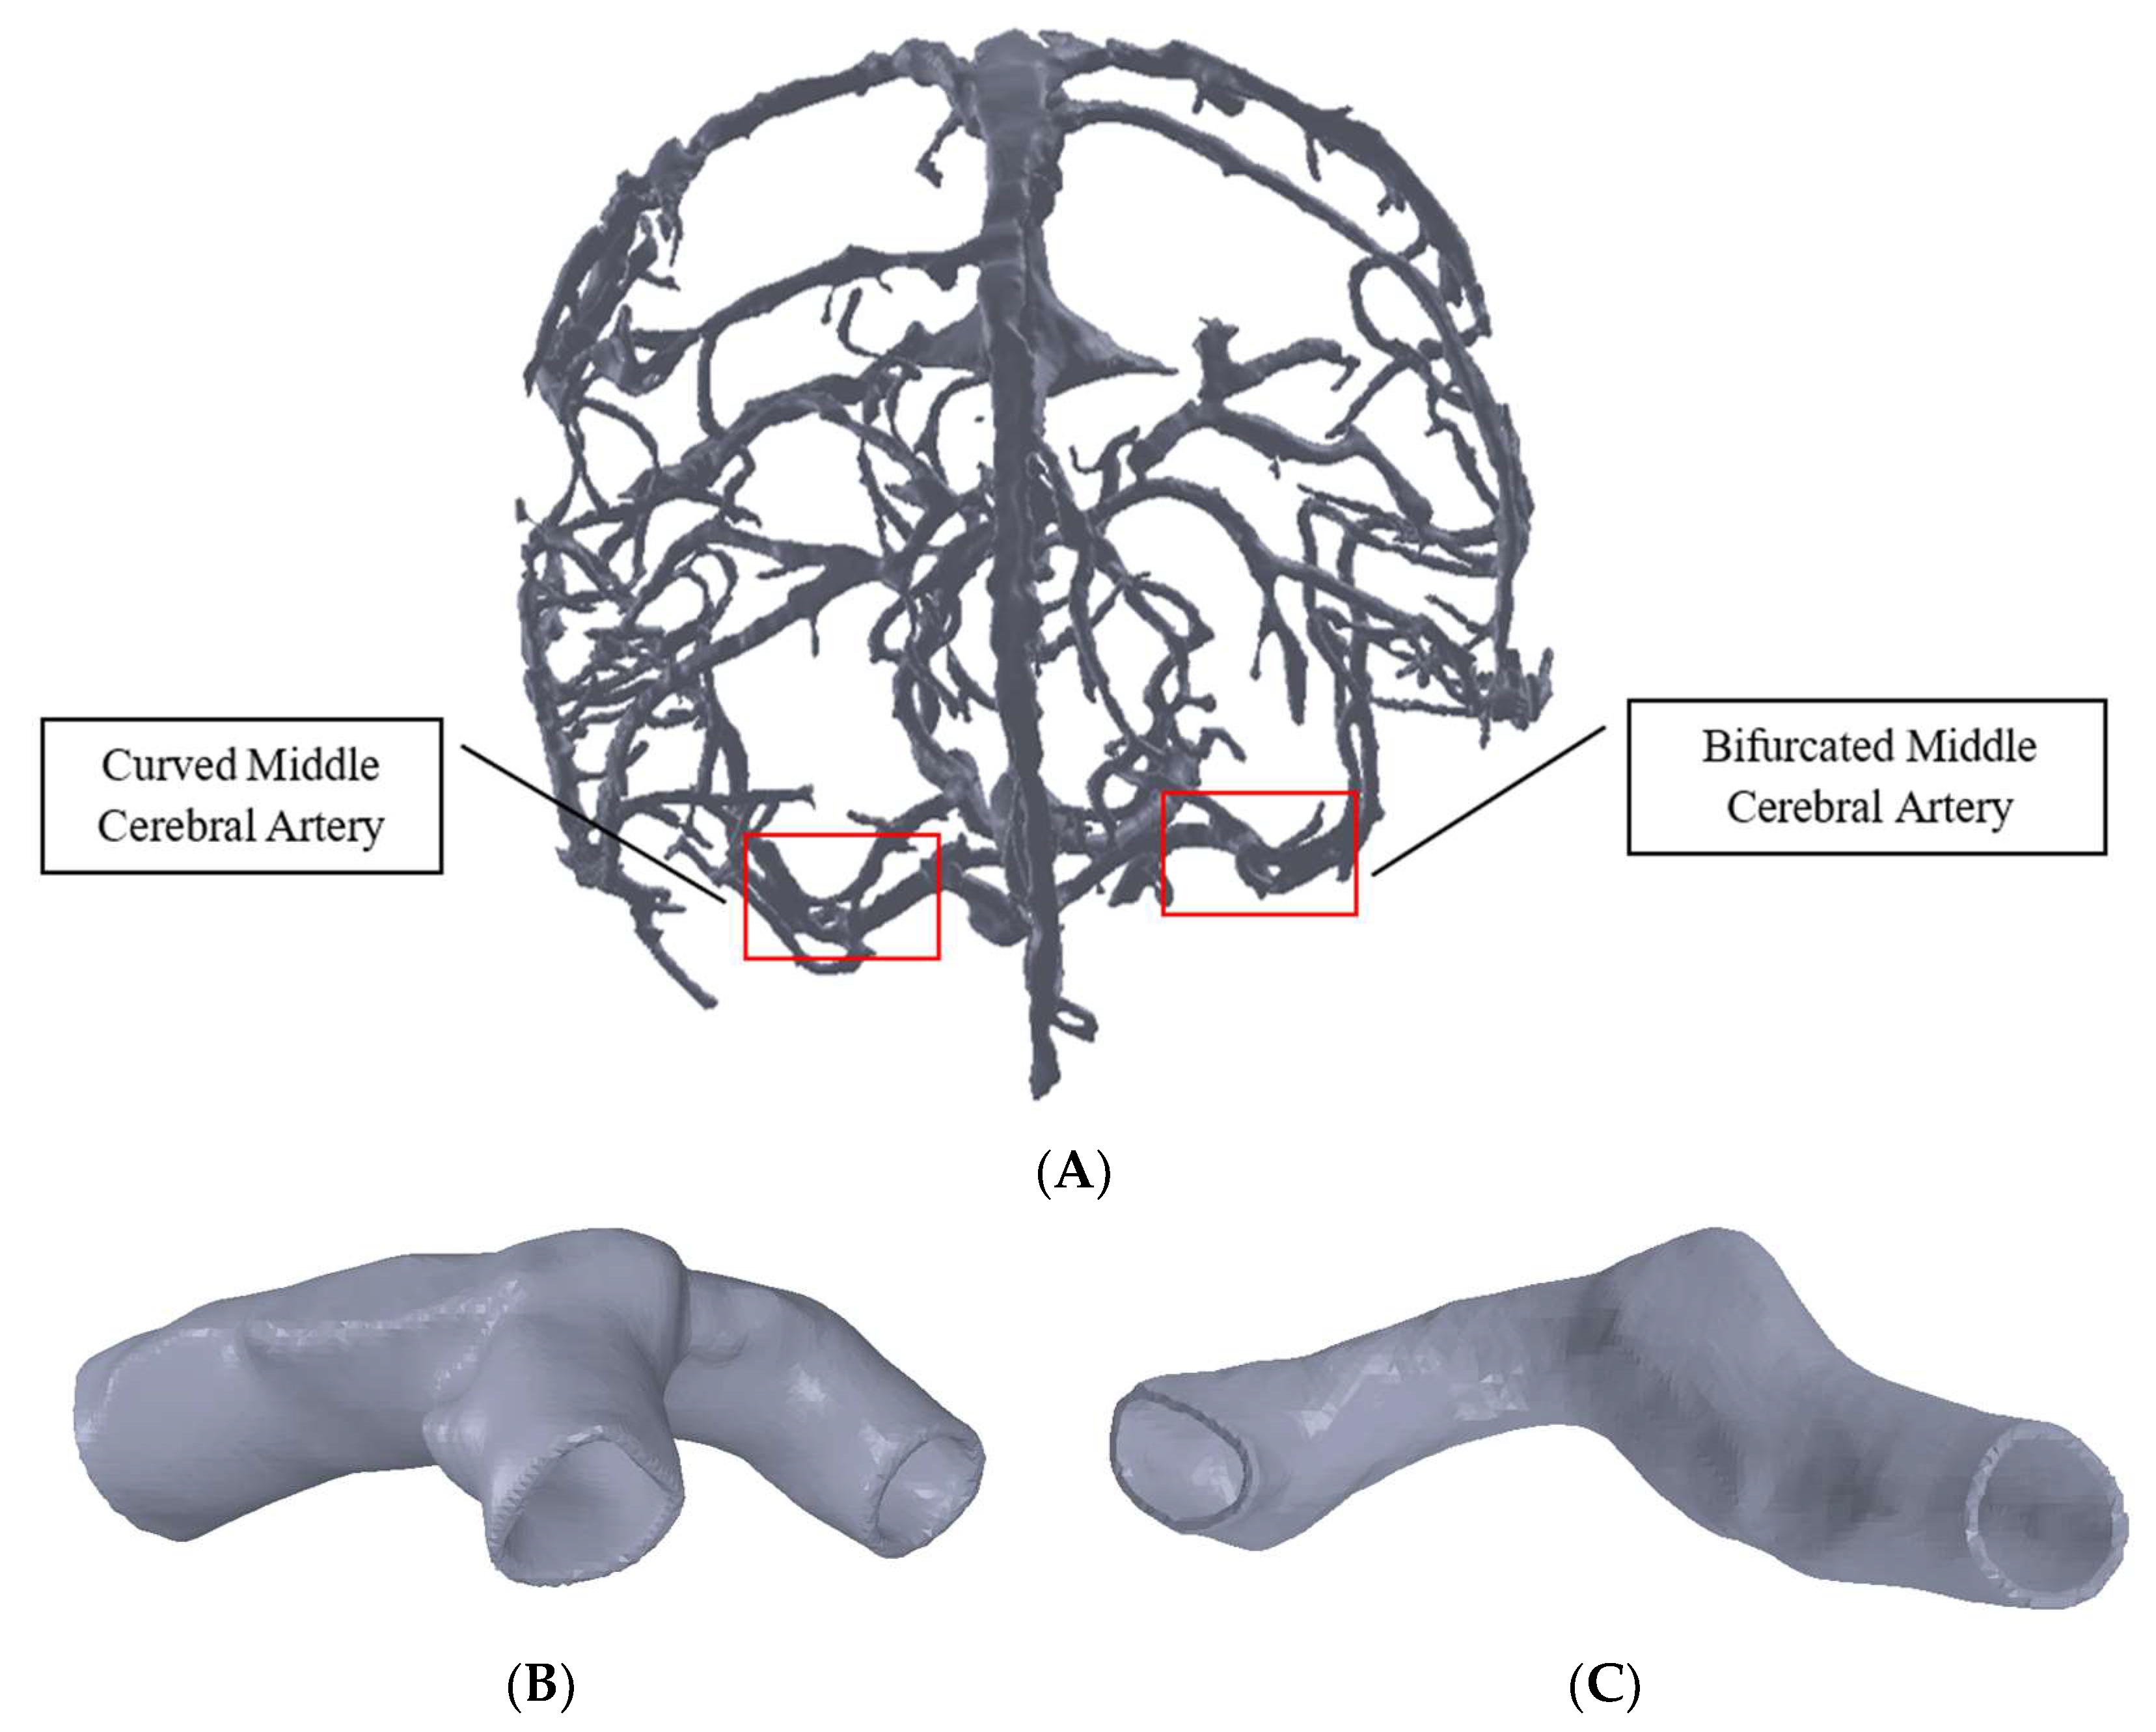
Magnetic resonance imaging (MRI) images of the human brain were accessed from the NIH Visible Human database to develop the cerebral arteries model. The MRI images were segmented using TurtleSeg software and reconstructed to generate the geometry of the cerebral artery network (Figure 1A). Literature studies [15] indicate that cerebral arteries with curvature or bifurcation are more susceptible to aneurysms and their progression. Accordingly, two middle cerebral artery (MCA) sections, which are vulnerable to aneurysm initiation and progression, were sectioned out from the whole of the artery network using MeshLab software. The first MCA section had arterial bifurcation, and the other MCA had arterial curvature (Figure 1B,C). The meshes of the cropped-out sections of the cerebral arteries were then refined in Fusion360 software (Autodesk, San Rafael, CA, USA). The bifurcated MCA section and curved MCA section had diameters of 3 mm and 2.5 mm, respectively, and were given thicknesses of 0.3 mm and 0.25 mm (i.e., 10% of diameter [16]), respectively, using SpaceClaim.
2.1.2. Modeling of Different Grades of Aneurysm
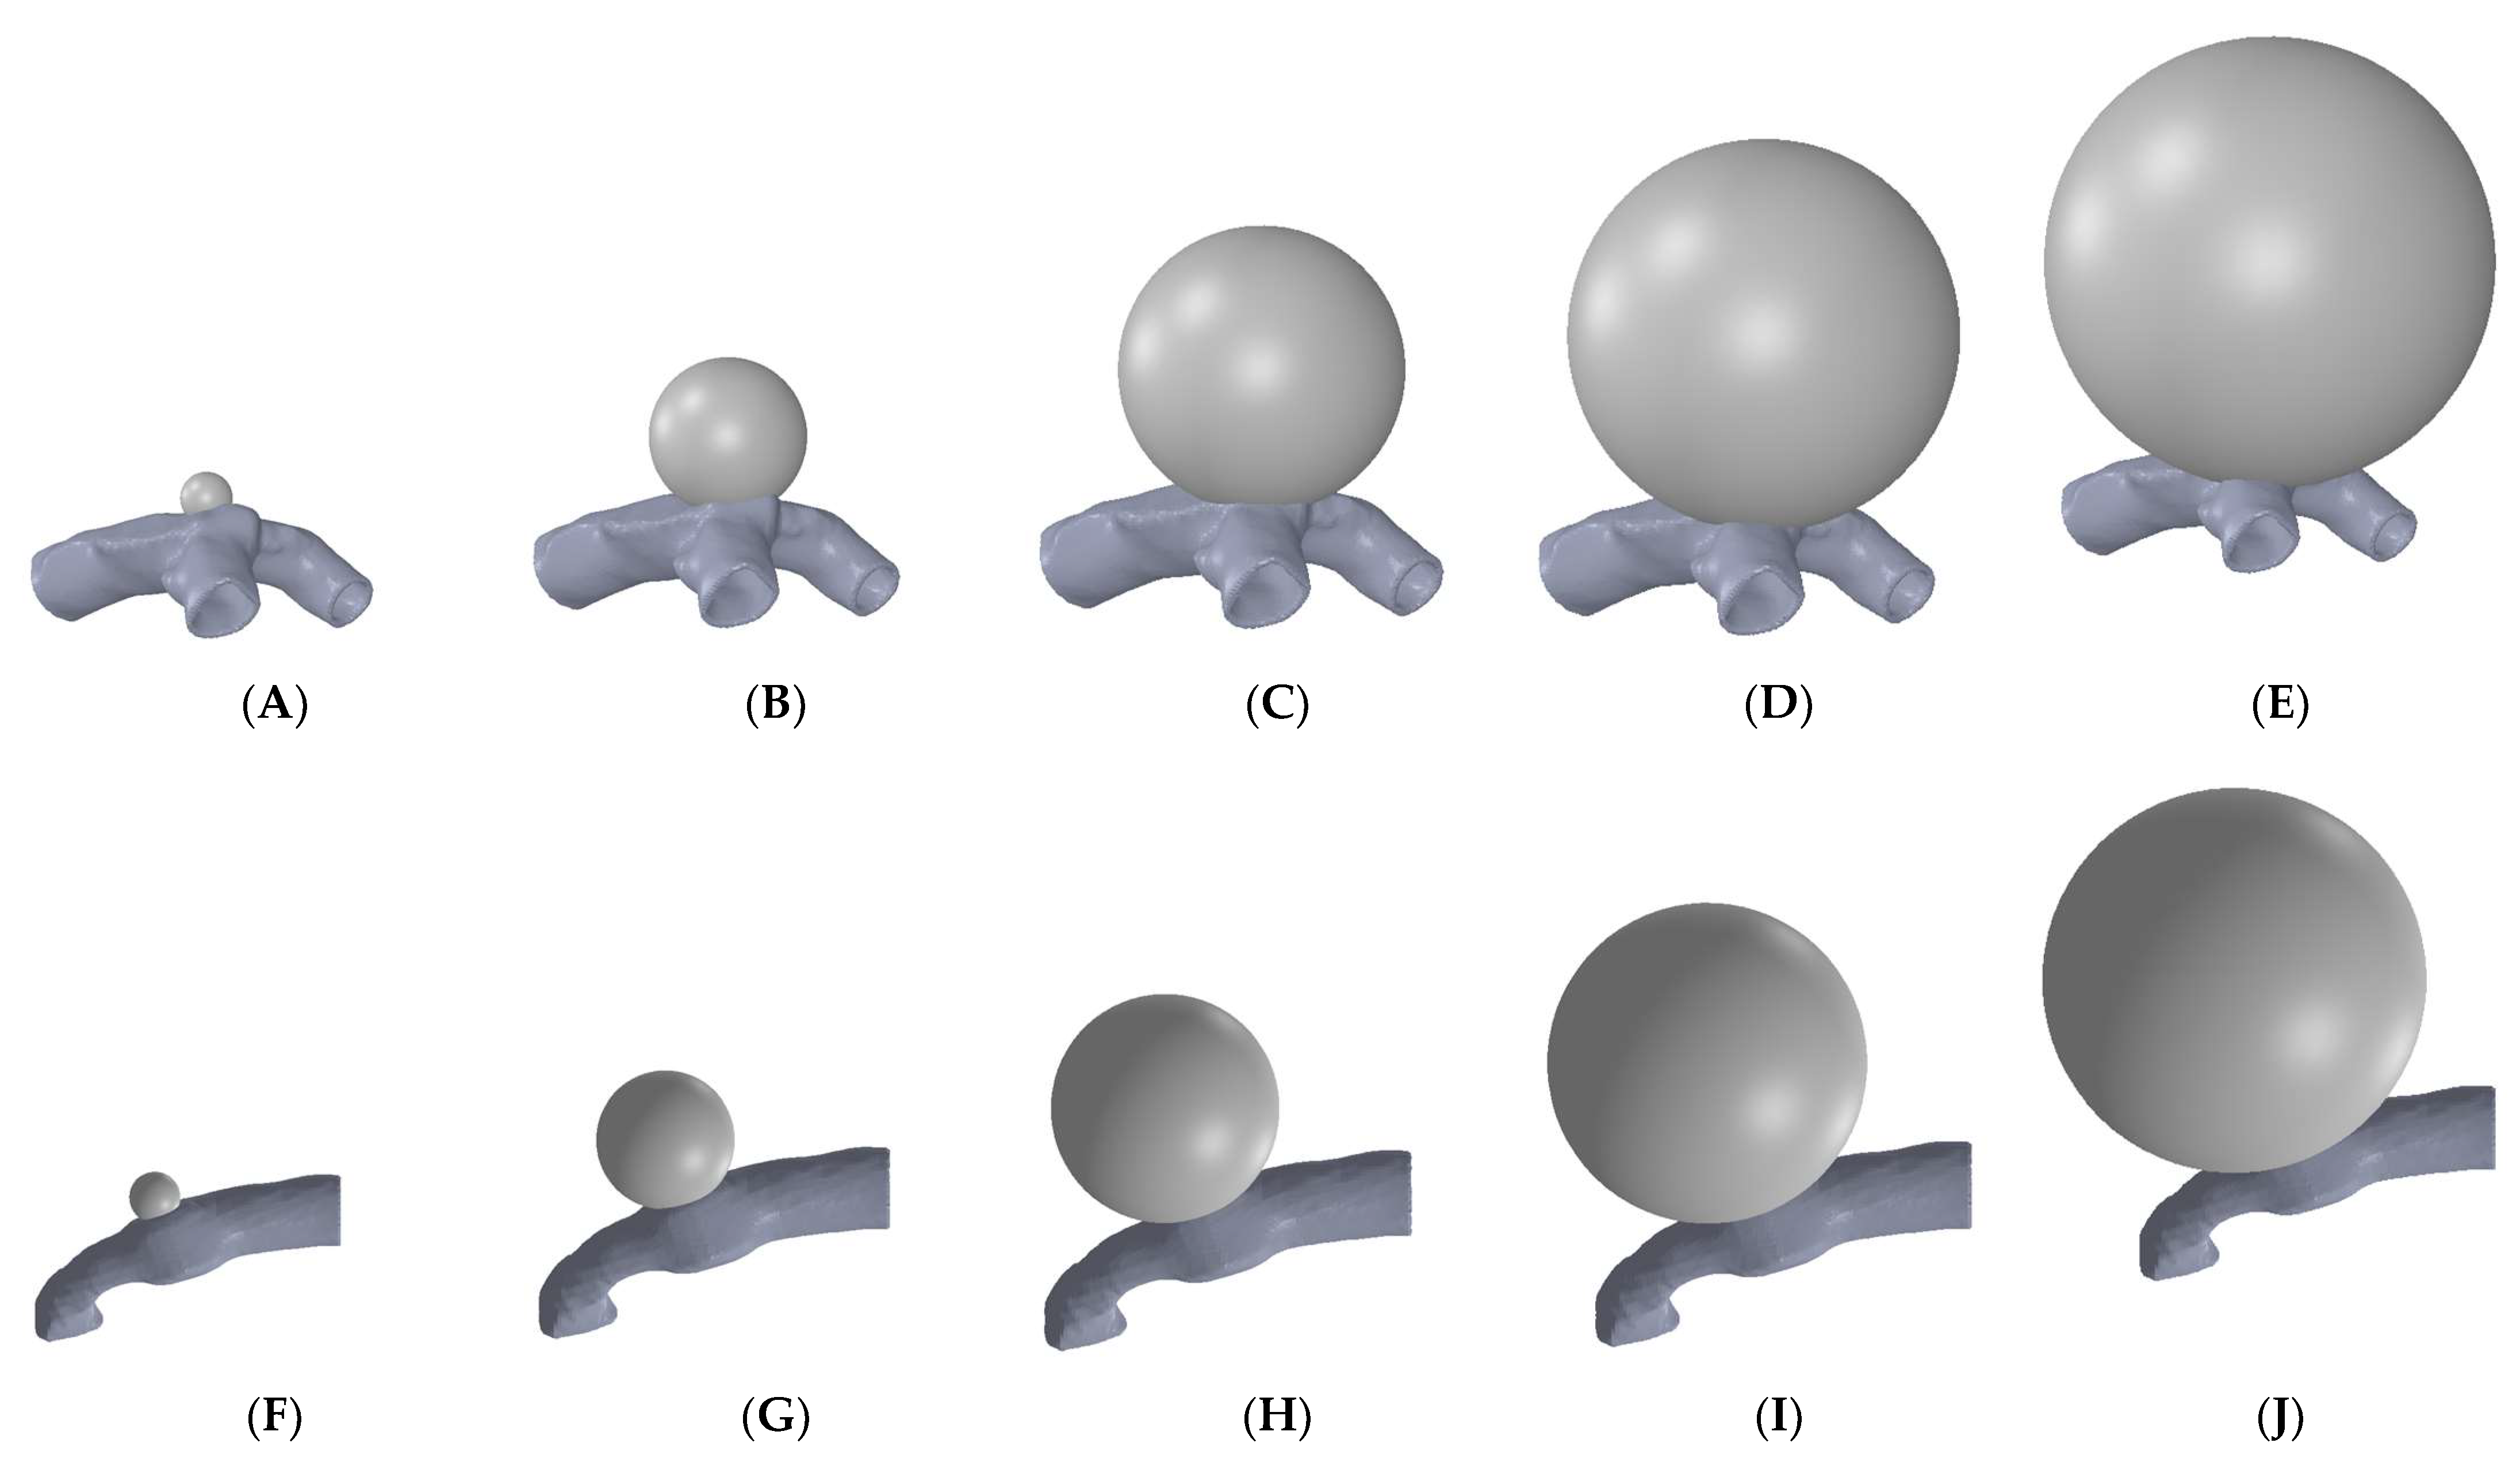
The spherical aneurysm is one of the most commonly occurring aneurysm shapes [17], and this shape was developed computationally. Based on the literature on aneurysm progression in the middle cerebral artery [18], five aneurysm sizes were selected and modeled for both MCA models (Table 1). The wall thickness of the aneurysms was reported to be within the range of 0.016–0.216 mm [19]. Accordingly, this work considered two aneurysm thicknesses of 0.1 mm and 0.2 mm for the arterial sections. The ratio of aneurysm diameter to neck width was kept constant, with a value of 1.9 used throughout the aneurysm modeling [20].
Modeling of aneurysms on the artery sections was carried out using SolidWorks (Dassault Systèmes, Vélizy-Villacoublay, France) through a series of modeling steps. The complete model of an artery with an aneurysm was exported as a STEP file type for further processing. Aneurysms of five different sizes and two different thicknesses for both of the MCA sections with bifurcation and curvature were generated to obtain ten models of the aneurysm-mounted artery for each artery section. Figure 2 shows the models of various aneurysms developed on the sectioned bifurcation- and curvature-based middle cerebral arteries.
2.2. Finite Element Modeling
2.2.1. Meshing and Mesh Convergence Study
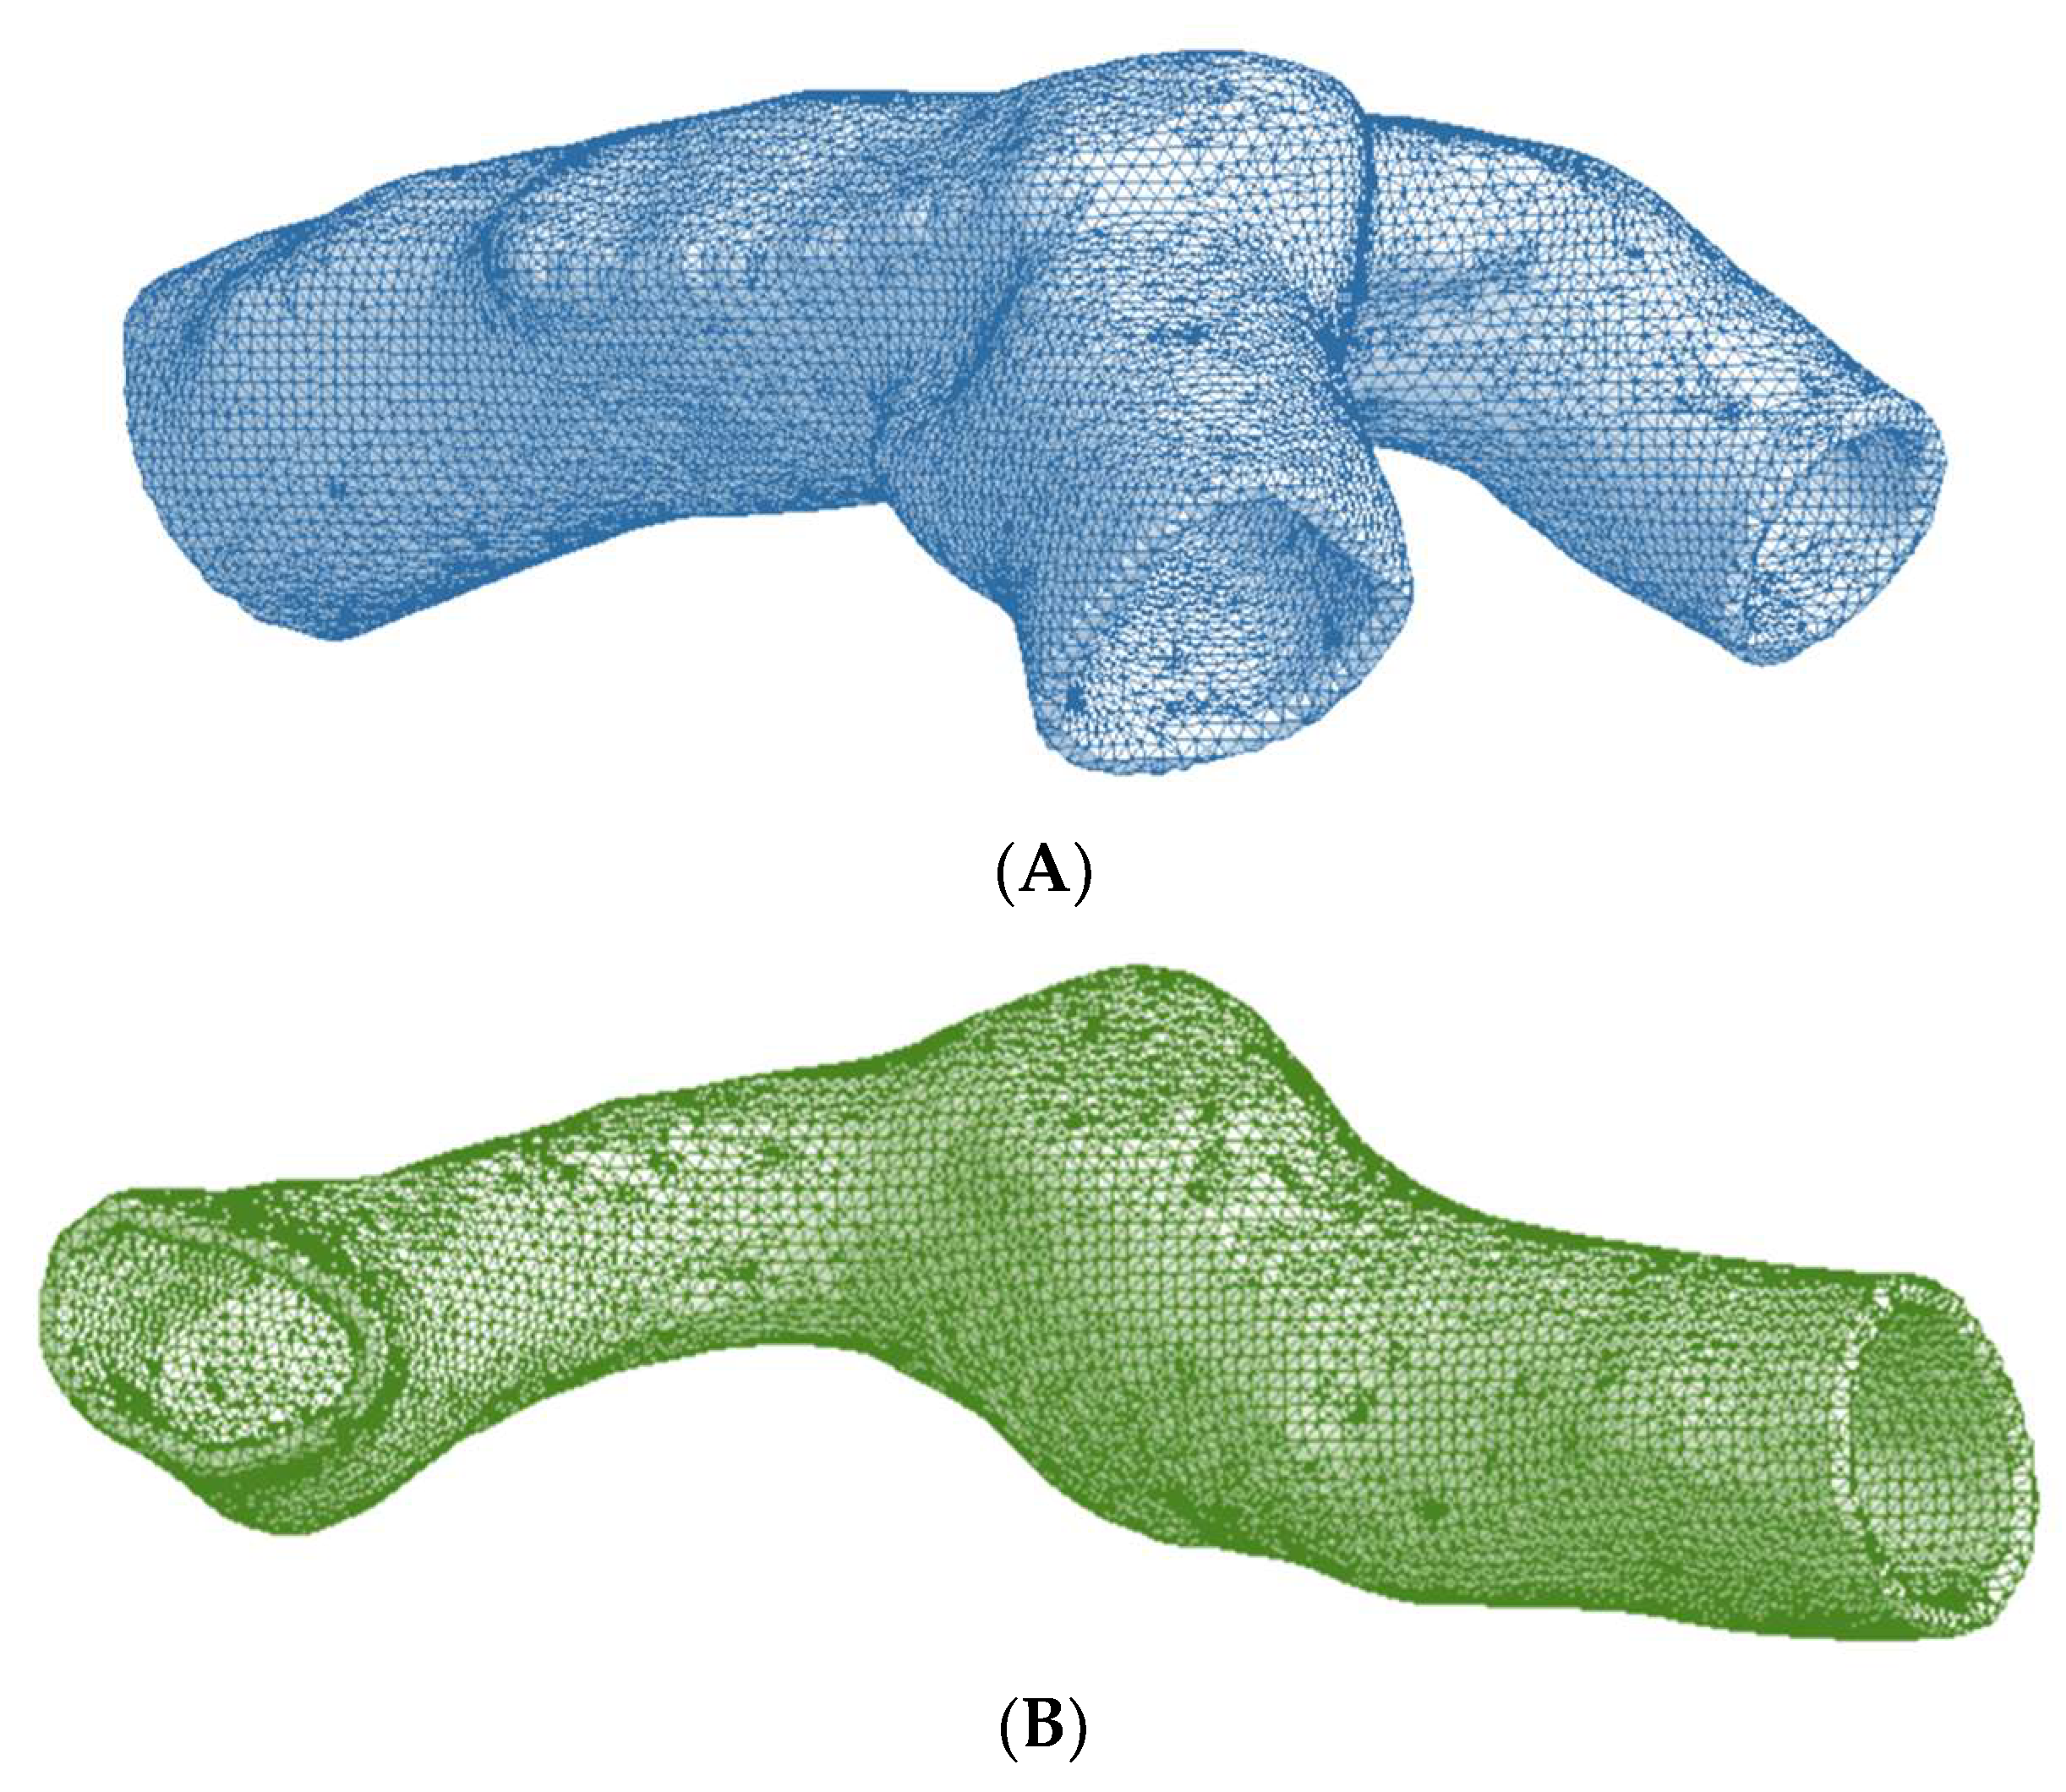
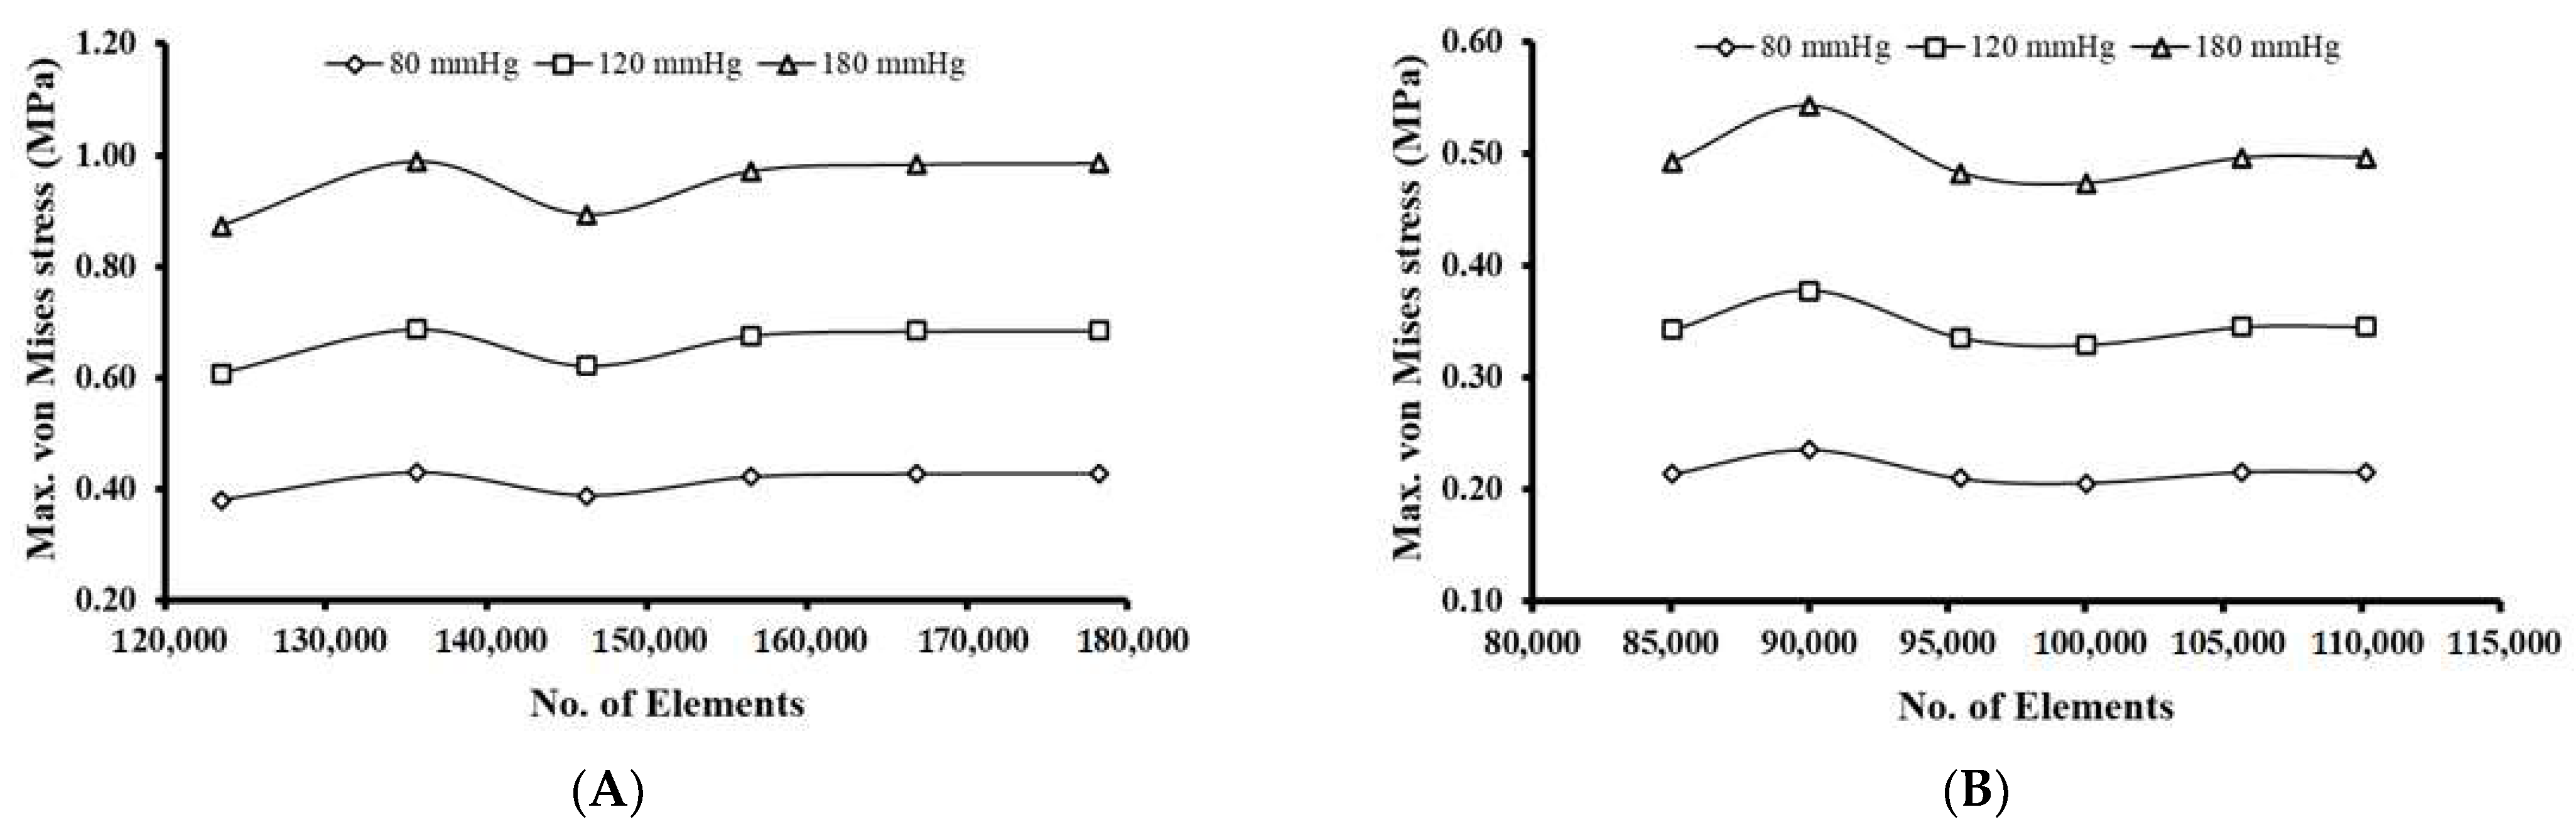
ANSYS Workbench 2019R2 was used to develop the artery–aneurysm models, and finite element analysis was performed using Solid-187 element type. The selected element type is a 10-node higher-order 3D element type and has been used extensively for irregular meshes [21,22]. The artery and aneurysm models were subjected to a contact pair of “bonded always” with initial penetration of excluding everything [23,24,25]. An optimal meshing was achieved by conducting a detailed mesh convergence study on the arterial models. Six meshes were generated for each MCA section by varying the element size and keeping a regular spacing between the number of elements in successive meshes. Total numbers of mesh elements for the six meshes of the bifurcated MCA section were 123,470, 135,624, 146,267, 156,484, 166,868, and 178,258. For the curved MCA section, the total numbers of mesh elements were 90,012, 95,467, 100,018, 105,649, 110,147, and 115,139. Figure 3 shows the representative meshed models for the middle cerebral artery with bifurcation and curvature. Three different pressure loads of 0.01 MPa, 0.016 MPa, and 0.023 MPa were selected for the mesh convergence study. These pressure loads were chosen to simulate the diastolic (80 mmHg), systolic (120 mmHg), and hypertensive (180 mmHg) pressures that occur during the cardiac cycle.
2.2.2. Material Properties
The elastic modulus and Poisson’s ratio values for the artery–aneurysm models were considered from the literature. The elastic modulus and Poisson’s ratio values were considered to be 0.4 MPa and 0.45 [26,27], respectively, for the arterial models, and values of 0.89 MPa and 0.45 [27,28] created an aneurysm. The breaking stress of intracranial saccular aneurysms has been reported to be 2 to 3 MPa [29].
2.2.3. Loads and Boundary Conditions
Arteries transport blood throughout the body and primarily withstand the blood pressure load. Thereby, pressure loads (0.01 MPa and 0.016 MPa) equivalent to the normal diastolic pressure (80 mmHg) and systolic pressure (120 mmHg) of the human cardiac cycle were applied to the inner walls of the modeled artery and aneurysm. In addition, a pressure load of 0.023 MPa, equivalent to 180 mmHg, was applied to imitate hypertension pressure conditions. For the finite element analysis, the ends of the artery sections were constrained in all degrees of freedom.
3. Results and Discussion
3.1. Mesh Convergence Results
For the mesh convergence study, three pressure loads of 0.01 MPa (80 mmHg), 0.016 MPa (120 mmHg), and 0.023 MPa (180 mmHg) were considered for the generated meshes. The maximum von Mises stress values induced in the meshed models were compared across successive meshes to identify the optimal meshing. For the bifurcated MCA section, the mesh convergence study showed maximum von Mises stress variation within an acceptable range (<5%) for all the pressure conditions once the number of mesh elements exceeded 156,484 (Figure 4A). The element size corresponding to this mesh was chosen for performing the FE analysis on all the aneurysm models of this arterial section.
Across all the pressure conditions, there were significant variations in the maximum von Mises stress for the curved MCA section, when the number of mesh elements was below 95,000. With an increase in the number of mesh elements beyond 105,649, the change in maximum von Mises stress for successive meshes decreased and was estimated to be within 5% for all three pressure conditions (Figure 4B). The element size corresponding to this mesh was chosen for the FE analysis on all the models of aneurysms of this arterial section.
3.2. Stress Distribution with Aneurysm Growth
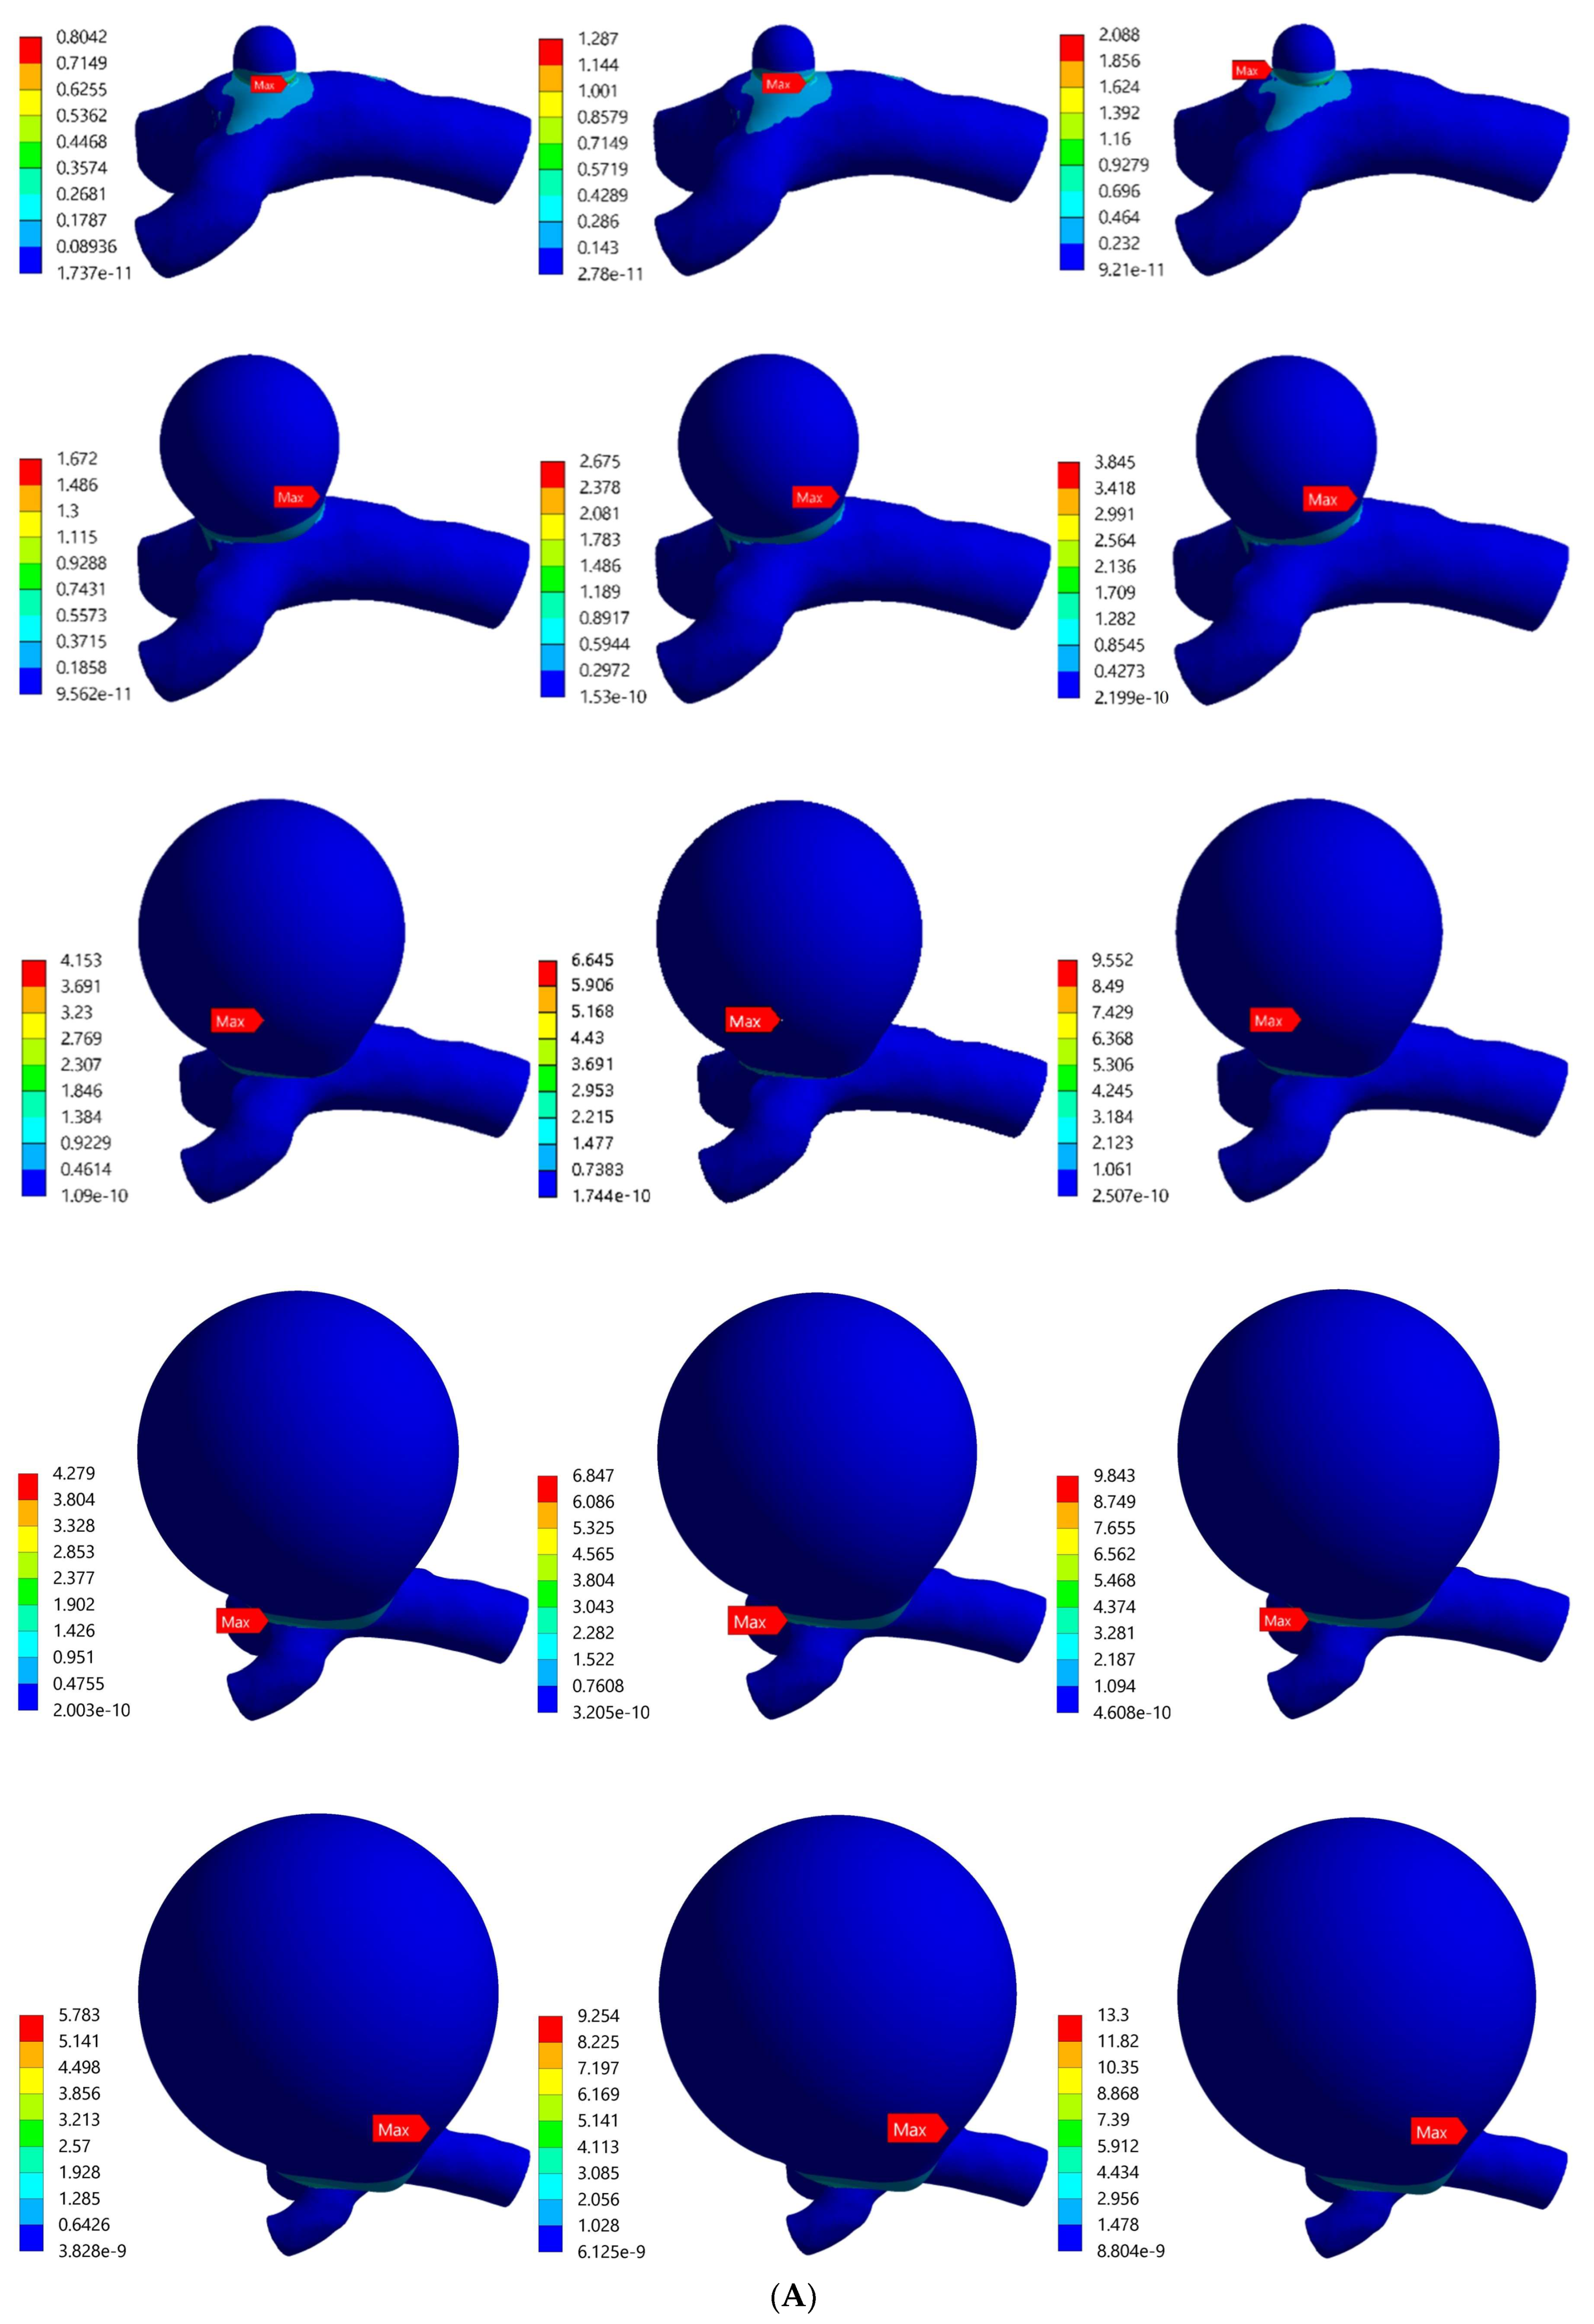
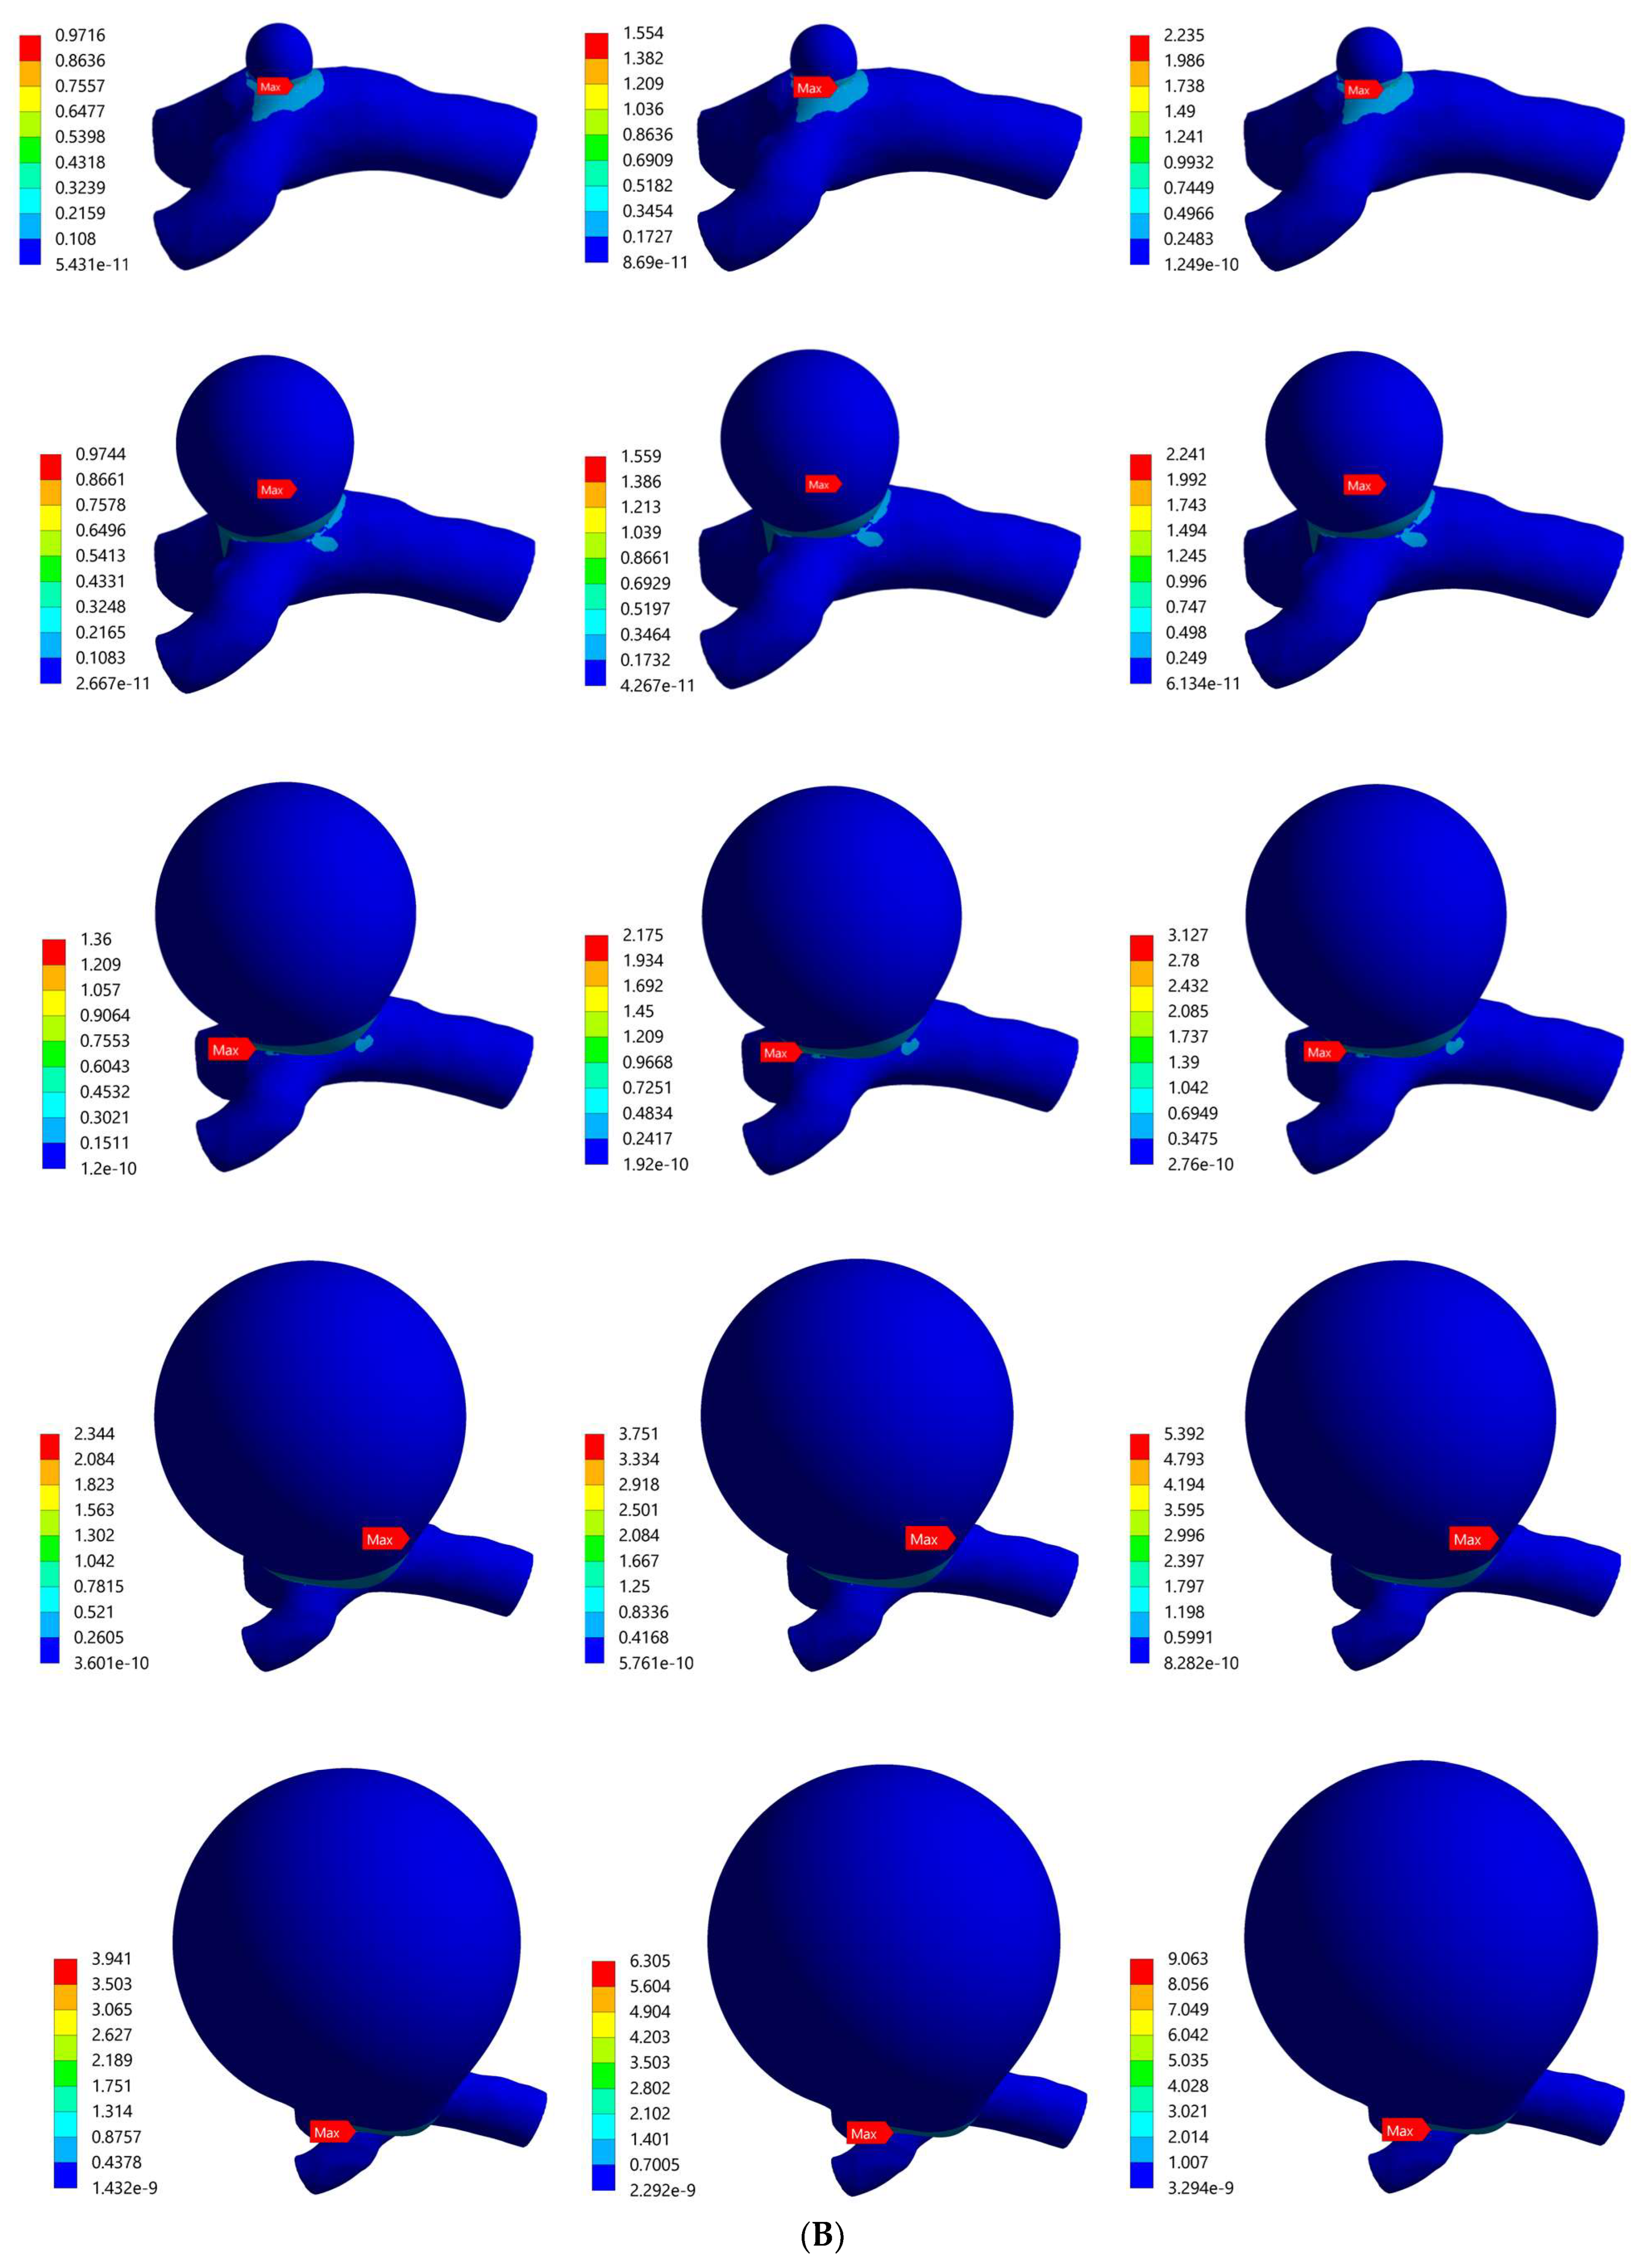
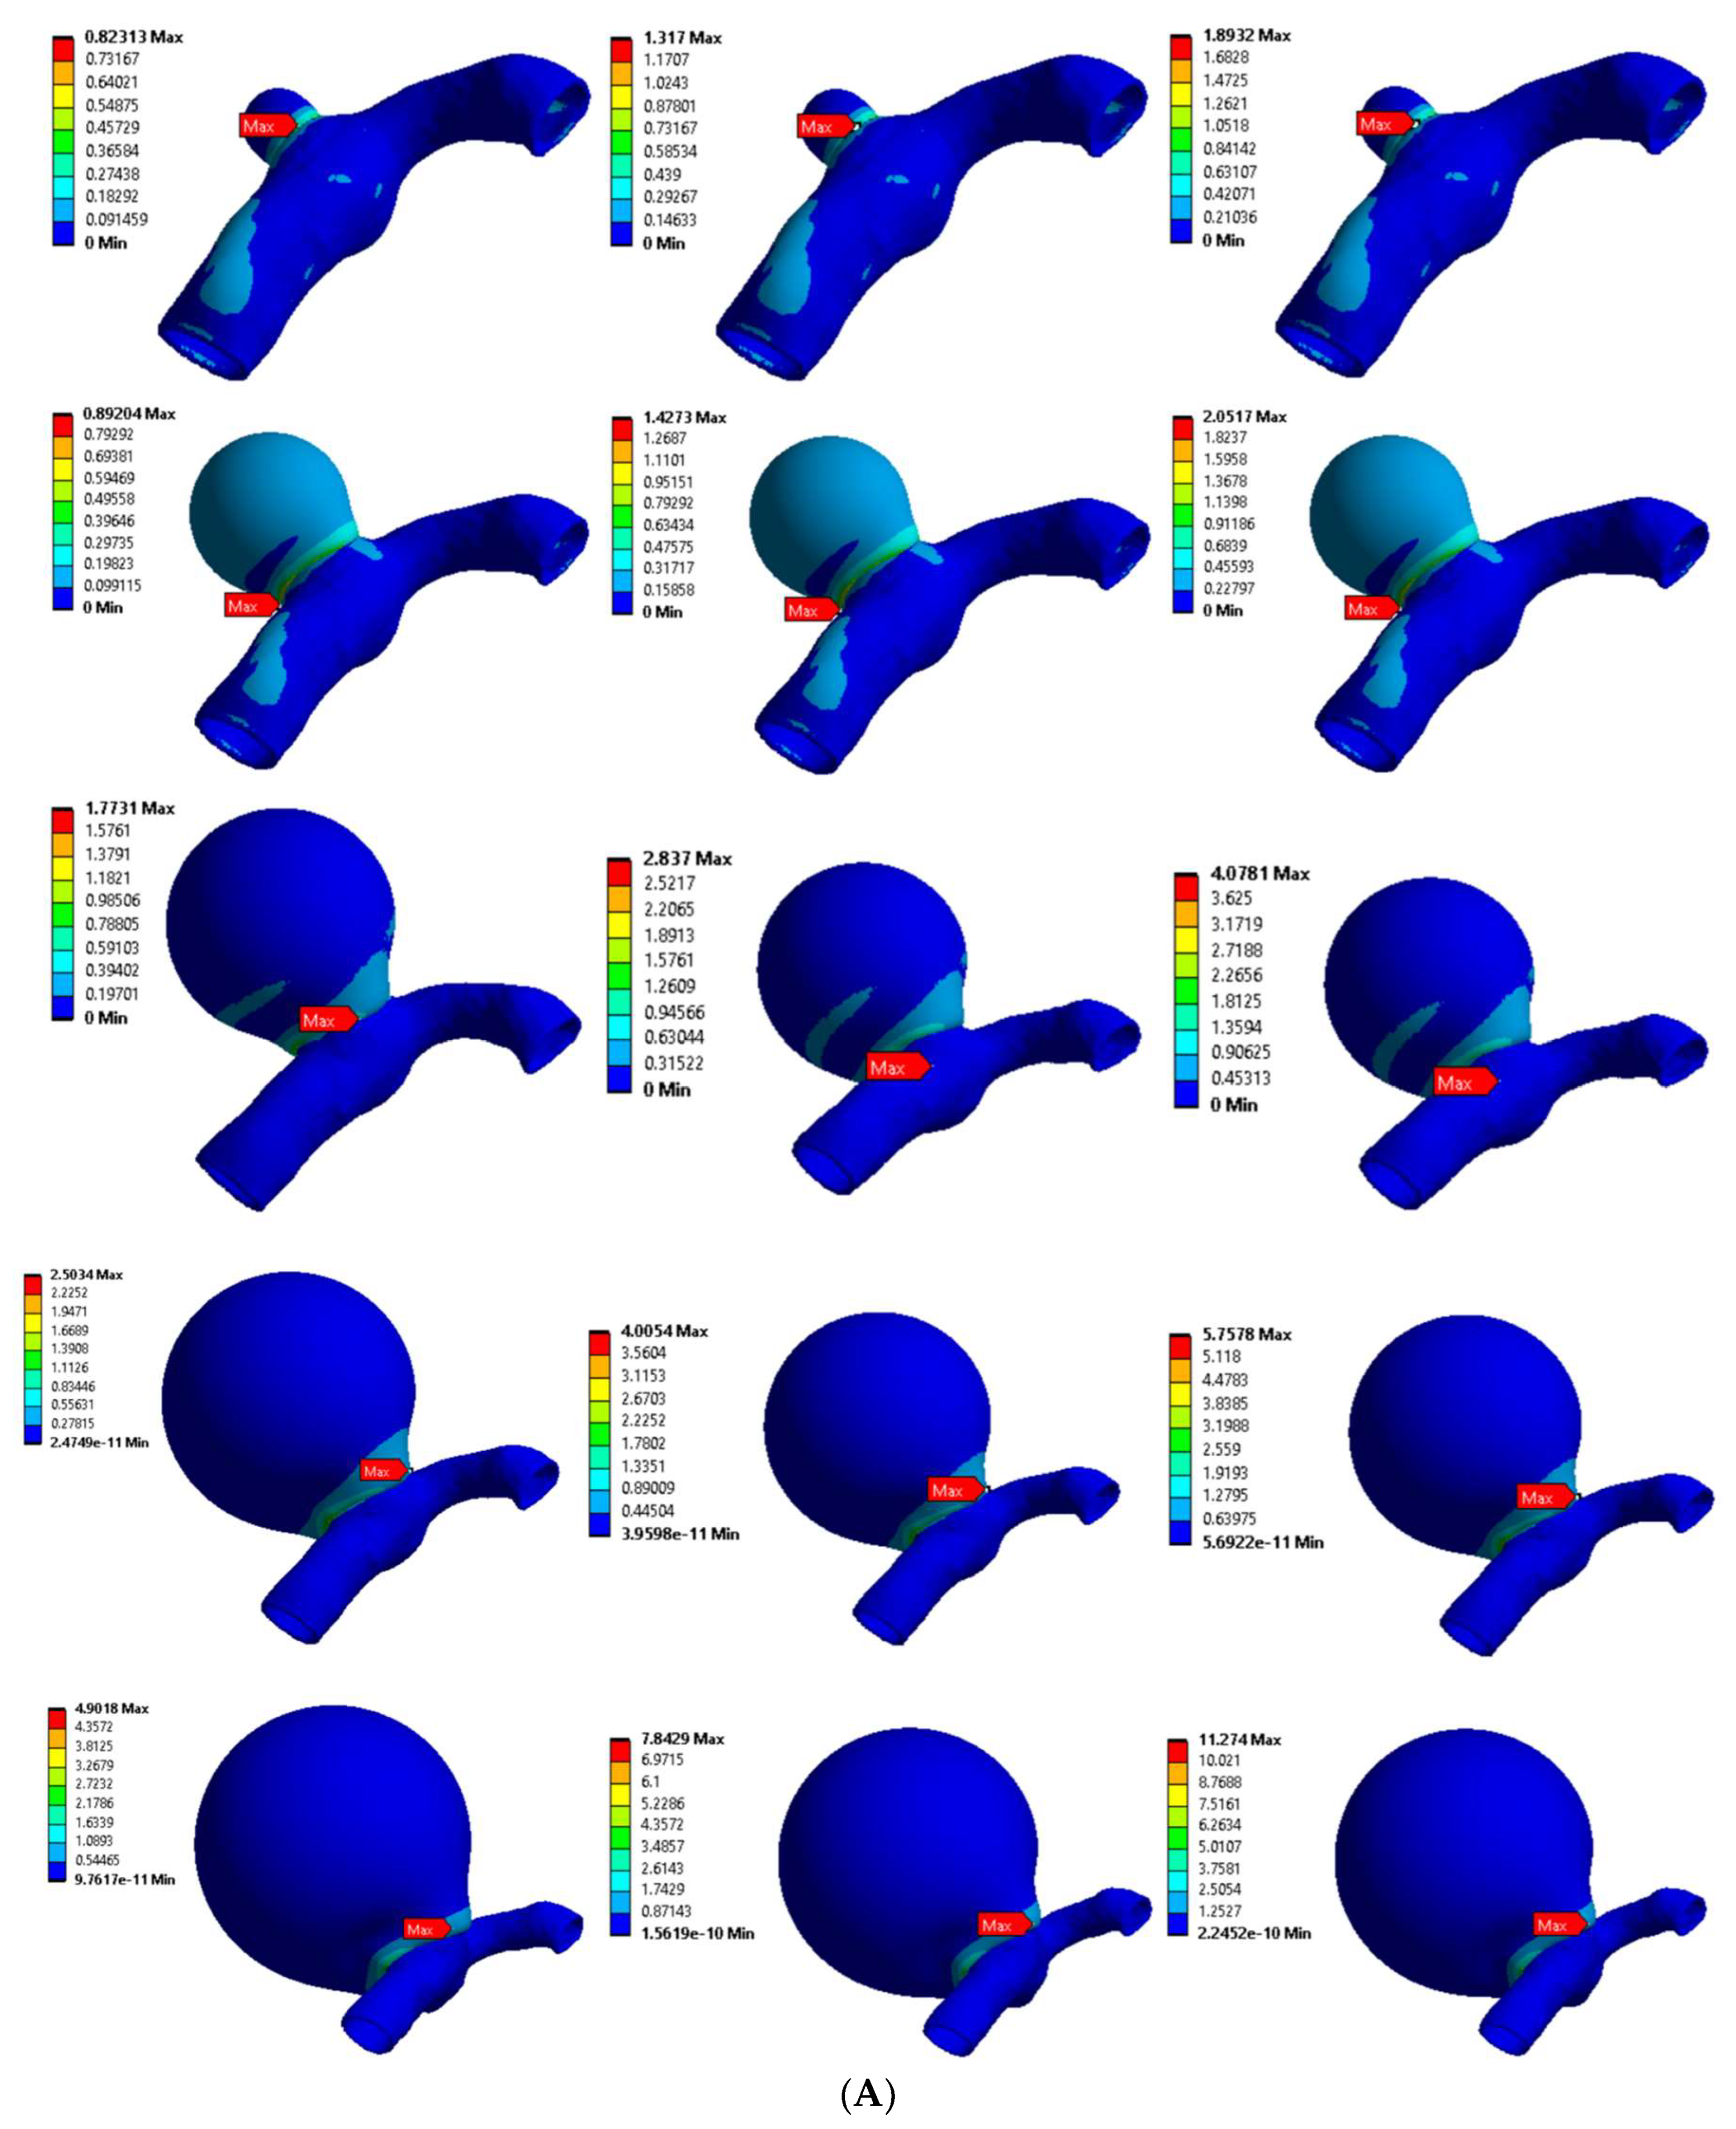
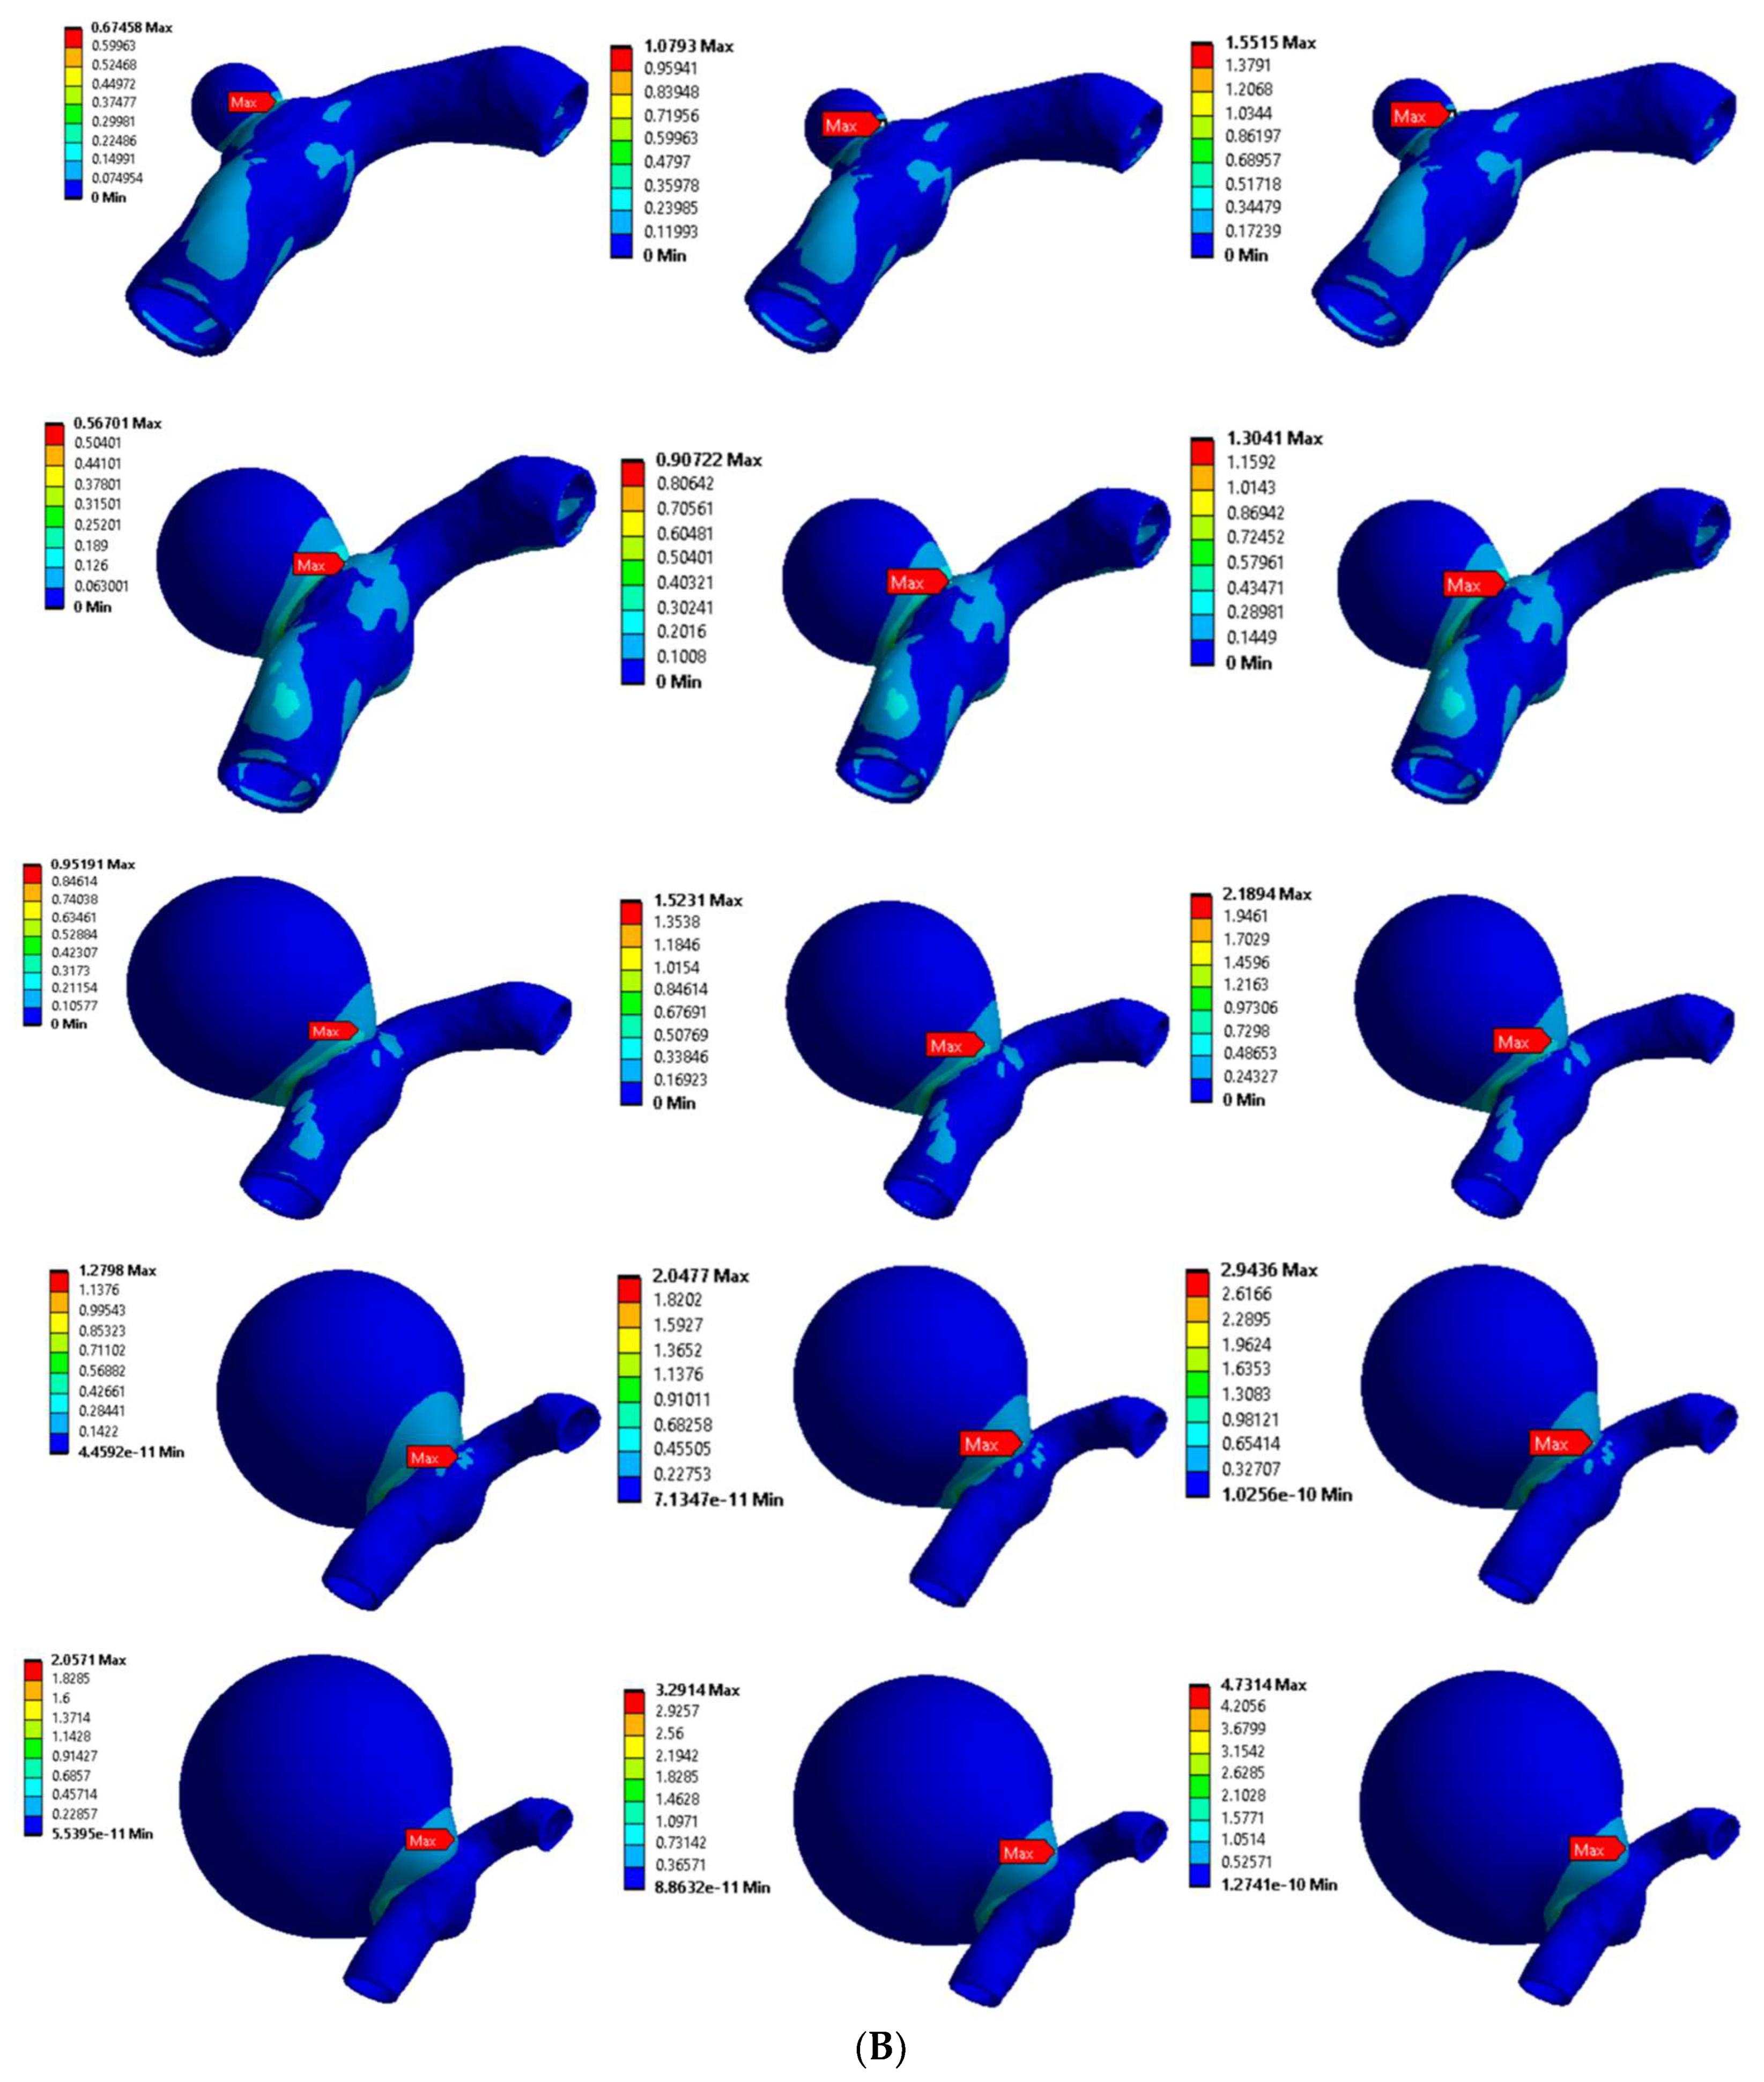
Simulations were conducted for five aneurysm sizes and two thicknesses for each of the arterial sections (i.e., bifurcated and curved MCA). A total of 60 simulations were conducted with 20 artery–aneurysm models (2 MCA × 5 sizes × 2 thicknesses) and under three varying pressure load conditions (diastolic, systolic, and hypertensive). The stress distribution was computationally estimated in terms of von Mises stress across the different locations of the artery–aneurysm models, and the correlation with varying aneurysm size (i.e., increasing size simulating growth) was studied. Across all bifurcated MCA models, the highest von Mises stress value was recorded around the neck of the aneurysm, and the overall stress concentration was detected in the region around the artery–aneurysm junction. The maximum von Mises stress for different models with varying aneurysm sizes and 0.1 mm wall thickness ranged from 0.804 MPa to 13.3 MPa, while corresponding values for models with a 0.2 mm wall thickness ranged from 0.972 MPa to 9.063 MPa. The stress distribution of the curved MCA section was found to be similar to the stress distribution of the bifurcated MCA section, where high stresses were concentrated around the junction of the artery–aneurysm model. For the curved MCA section, the maximum von Mises stress values ranged from 0.823 MPa to 11.274 MPa for different artery–aneurysm models with varying aneurysm sizes and 0.1 mm wall thickness, and from 0.674 MPa to 4.73 MPa for artery–aneurysm models with a 0.2 mm wall thickness.
3.2.1. Bifurcated MCA Section
The von Mises stress distributions for the bifurcated MCA with aneurysm thicknesses of 0.1 mm and 0.2 mm are shown in Figure 5A,B, respectively. Across all the models, the stress distribution was observed to be similar and uniform on the artery and aneurysm. Higher stresses were concentrated in the region around the artery–aneurysm junction and the maximum von Mises stress was observed at the neck of the aneurysm. The values of maximum von Mises stress for various models with 0.1 mm wall thickness was from 0.804 MPa to 13.3 MPa, and the same values for models with 0.2 mm wall thickness were from 0.972 MPa to 9.063 MPa. The maximum stress values were compared, which indicated significant variation in the maximum stress with changes in pressure, aneurysm diameter, and aneurysm wall thickness. Overall, the results indicated some dependence of the induced stresses on blood pressure and structural parameters of the aneurysm, i.e., diameter and thickness. It was found that the value of maximum von Mises stress for certain aneurysms (such as models with large diameters and lower thicknesses under high pressure loads) exceeded the range of breaking stress for aneurysms, indicating a risk of rupturing.
3.2.2. Curved MCA Section
Figure 6A,B shows the von Mises stress distributions for the curved MCA section with aneurysm wall thicknesses of 0.1 mm and 0.2 mm, respectively. Five different aneurysm diameters of 2 mm, 5 mm, 8 mm, 11 mm, and 14 mm were considered to model the aneurysm growth for both wall thicknesses (0.1 mm, 0.2 mm). The curved MCA section results were similar to the results of the bifurcated MCA section, where high stresses were concentrated around the junction of the artery–aneurysm model. The maximum stress was observed at the neck of the aneurysm in all of the models. The values of maximum von Mises stress for various models with 0.1 mm wall thickness were from 0.823 MPa to 11.274 MPa, and the values for models with 0.2 mm wall thickness were from 0.674 MPa to 4.73 MPa. On comparing the maximum stress values across all the models, the aneurysm diameter, aneurysm thickness, and pressure load were significant factors affecting the simulation results. In the following sections, the rupture risk of the artery–aneurysm models was recorded for induced stresses exceeding the range of aneurysm breaking stress, i.e., 2 to 3 MPa.
3.3. Effect of Structural Parameters on the Induced Stresses in Aneurysm Wall
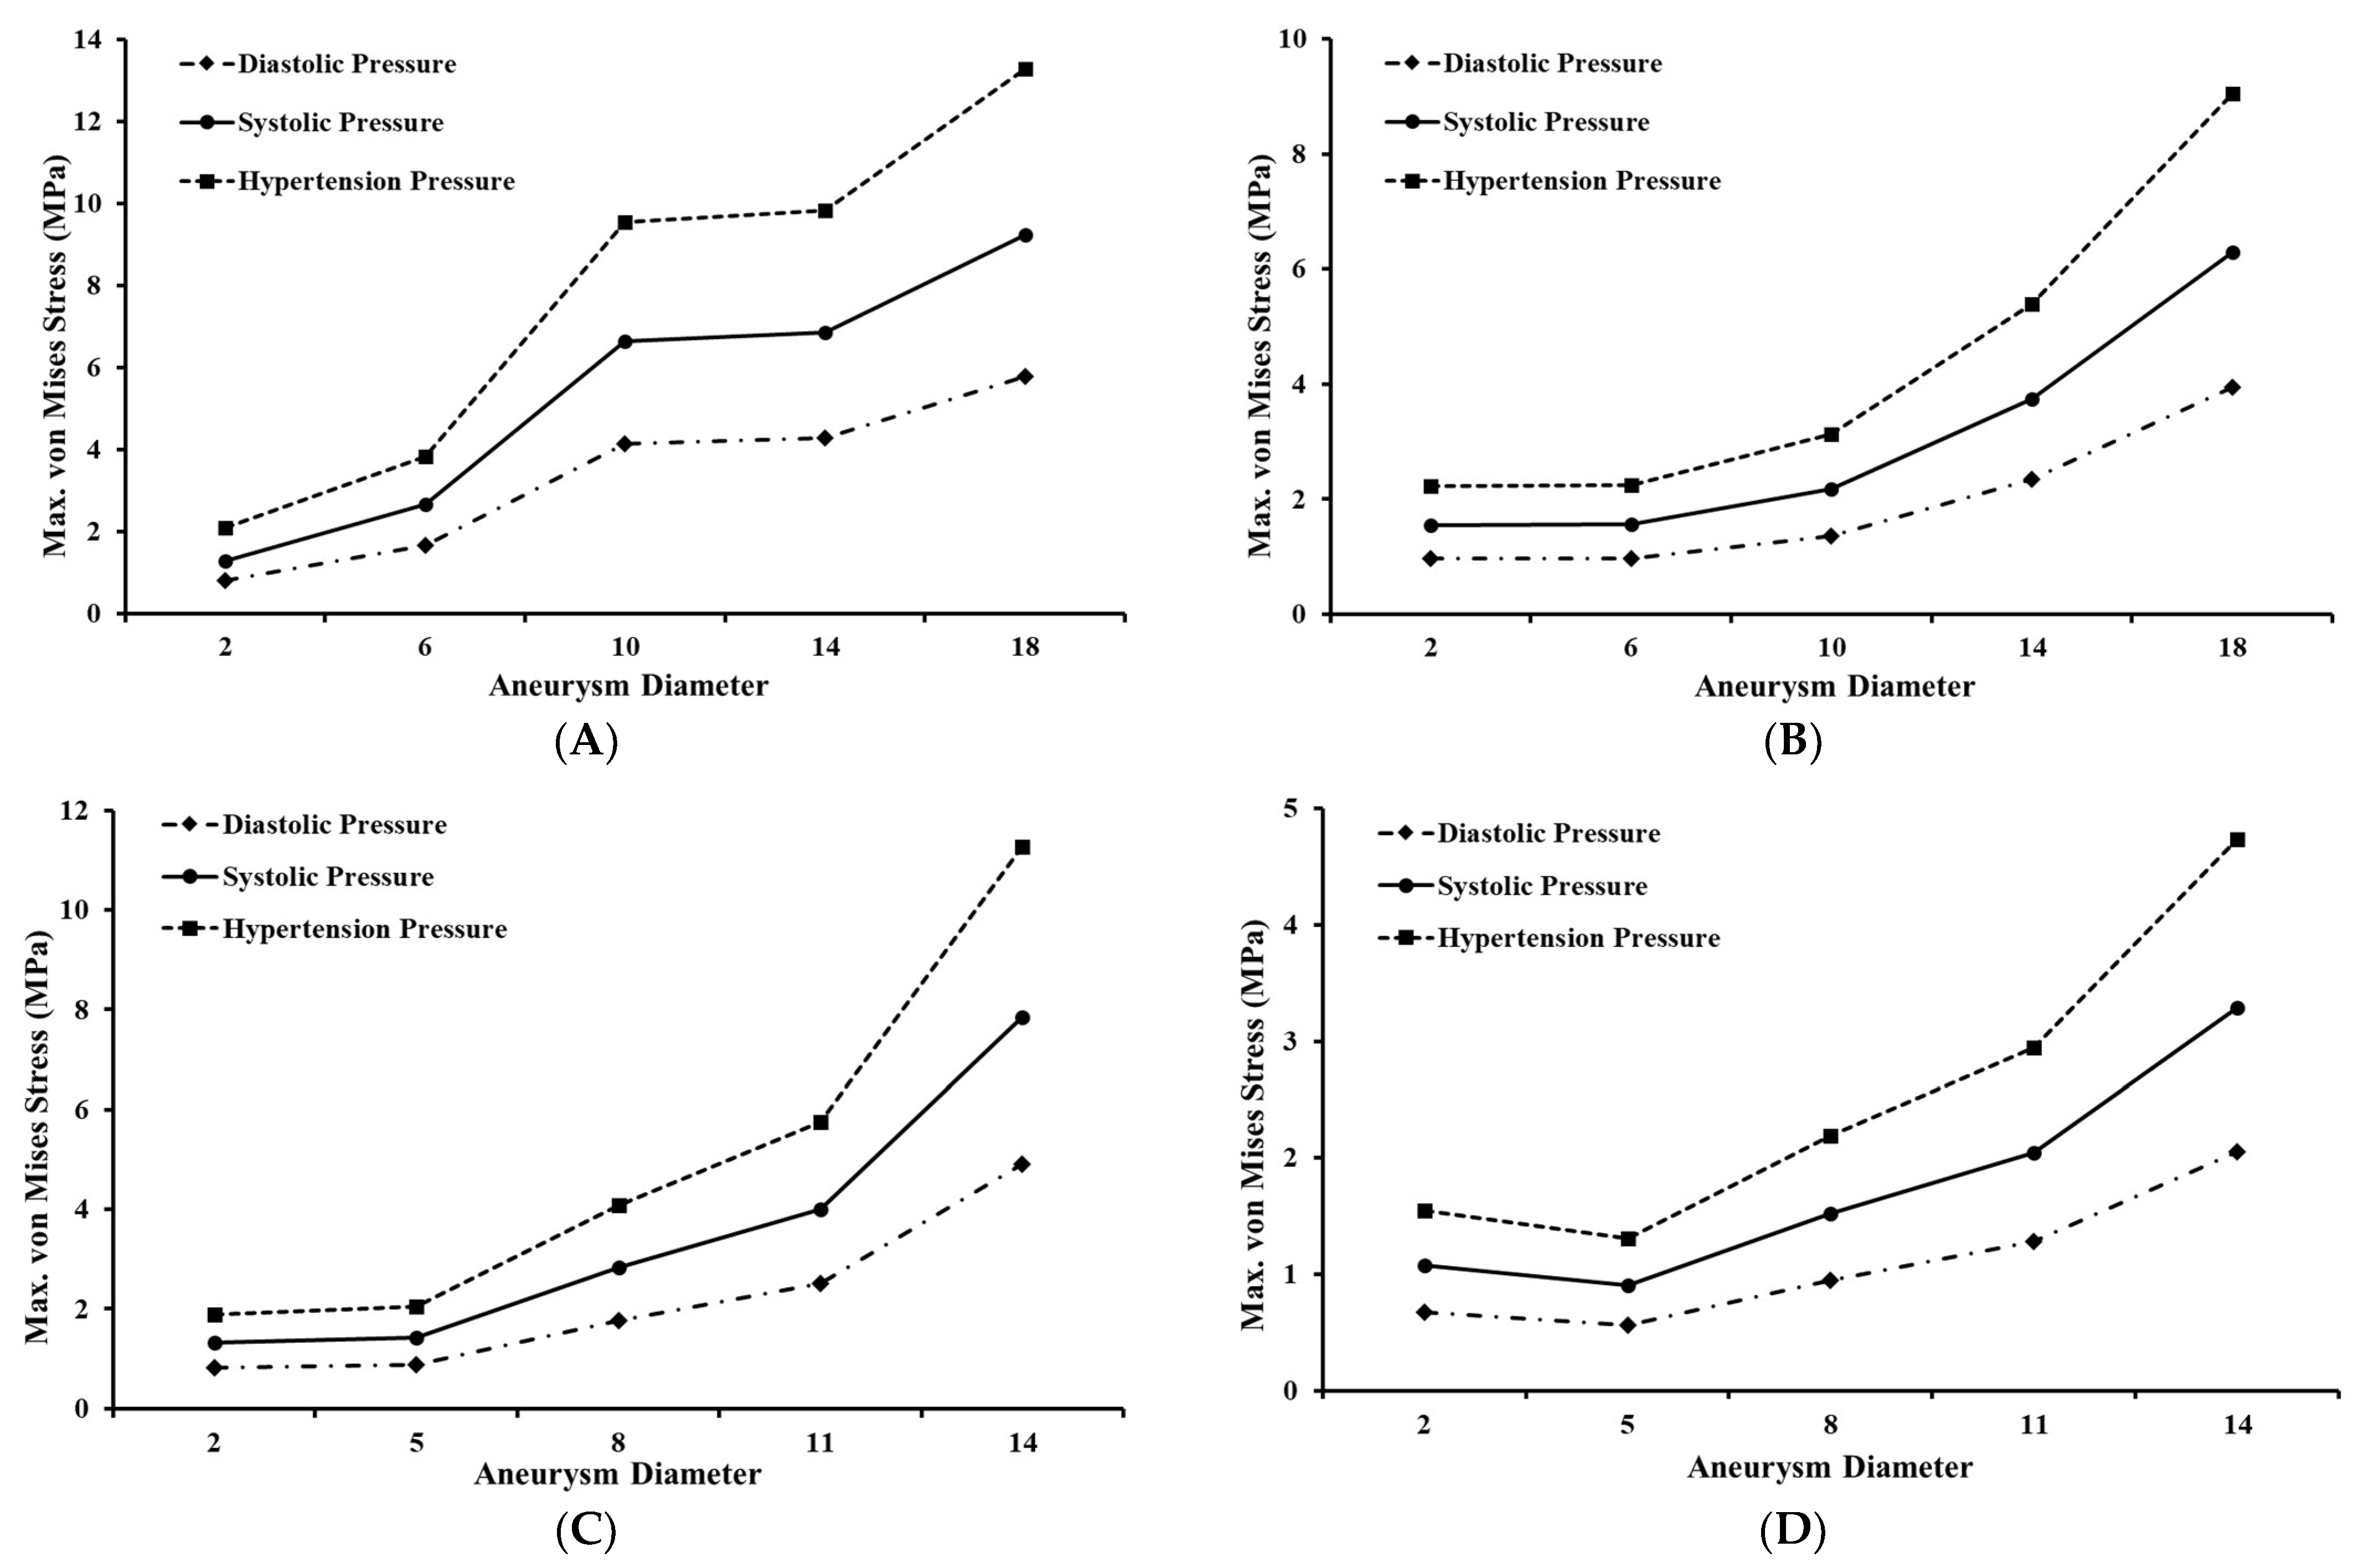
The values for maximum von Mises stress were analyzed with respect to the aneurysm diameters across each thickness. Figure 7A,B shows the maximum von Mises stress versus aneurysm diameter for three pressure conditions for the models of the bifurcated MCA section with 0.1 mm and 0.2 mm thick aneurysm walls, respectively. In general, the maximum von Mises stress was estimated to increase with an increase in aneurysm diameter. For the 0.1 mm thick aneurysm, the initial increase in the maximum stress value was rapid with an increase in diameter from 2 mm to 10 mm, followed by a plateau with an increase in diameter from 10 mm to 14 mm, and a further rise with an increase in diameter from 14 mm to 18 mm for all three pressure conditions. Across all three pressure conditions, the maximum stress value for 0.2 mm thick aneurysm increased gradually and later rapidly (i.e., increasing slope) with an increase in the aneurysm diameter. For both aneurysm thicknesses and under each pressure load, the value of maximum von Mises stress was highest for the aneurysms with the largest diameter. The value of maximum stress was higher for aneurysms with thinner walls. For models with 2 mm aneurysm diameter, maximum stress for both thicknesses lied in the breaking stress range when pressure was hypertensive. For models with 6 mm aneurysm diameter, the breaking stress range was reached for 0.1 mm thick aneurysms when the pressure became systolic, and the same happened for 0.2 mm thick aneurysms when pressure was hypertensive. For models with 10 mm aneurysm diameter, maximum stress for 0.1 mm wall thickness was well beyond the breaking stress range even for diastolic pressure, and it lied within the breaking stress range for 0.2 mm wall thickness when pressure was systolic. For other models with a diameter beyond 14 mm and of both thicknesses, maximum stress easily reached the breaking stress for diastolic pressure, which is the lowest possible pressure load. It was concluded that the likelihood of aneurysm rupture increases with increasing diameter, but a higher aneurysm wall thickness is able to offset this effect of increasing diameter.
Figure 7C,D shows the maximum von Mises stress versus aneurysm diameter for three pressure conditions for the model of the curved MCA section with 0.1 mm and 0.2 mm thick aneurysm walls, respectively. Similar to the bifurcated MCA, it was found that the maximum von Mises stress increases with aneurysm diameter. For 0.1 mm thick aneurysms, the maximum stress value initially increased gradually, then rapidly (i.e., increasing slope) with an increase in the aneurysm diameter for all three pressure conditions. However, for 0.2 mm thick aneurysms, the maximum stress value initially decreased slightly with an increase in diameter from 2 mm to 5 mm before increasing rapidly with an increase in diameter from 5 mm to 14 mm for all three pressure conditions. The value of maximum stress was more than double for aneurysms with thinner walls compared to that of aneurysms with thicker walls. For aneurysm models with 2 mm and 5 mm diameter, maximum stress for both thicknesses either remained below or just touched the breaking stress range. For models with 8 mm diameter, the breaking stress range was reached for aneurysms with 0.1 mm thick walls when the pressure became systolic, and the same happened for aneurysms with 0.2 mm thick walls when pressure was hypertensive. For aneurysm models with 11 mm diameter, maximum stress for 0.1 mm wall thickness was within the breaking stress range when pressure was diastolic, and for aneurysms with 0.2 mm wall thickness when pressure was systolic. For aneurysm models with a diameter of 14 mm and both wall thicknesses, maximum stress reached the breaking stress range for even the lowest load of diastolic pressure. It was also established for the curved MCA section that while the chance of aneurysm rupture increases with increasing diameter, this impact is less for aneurysms with walls of greater thickness.
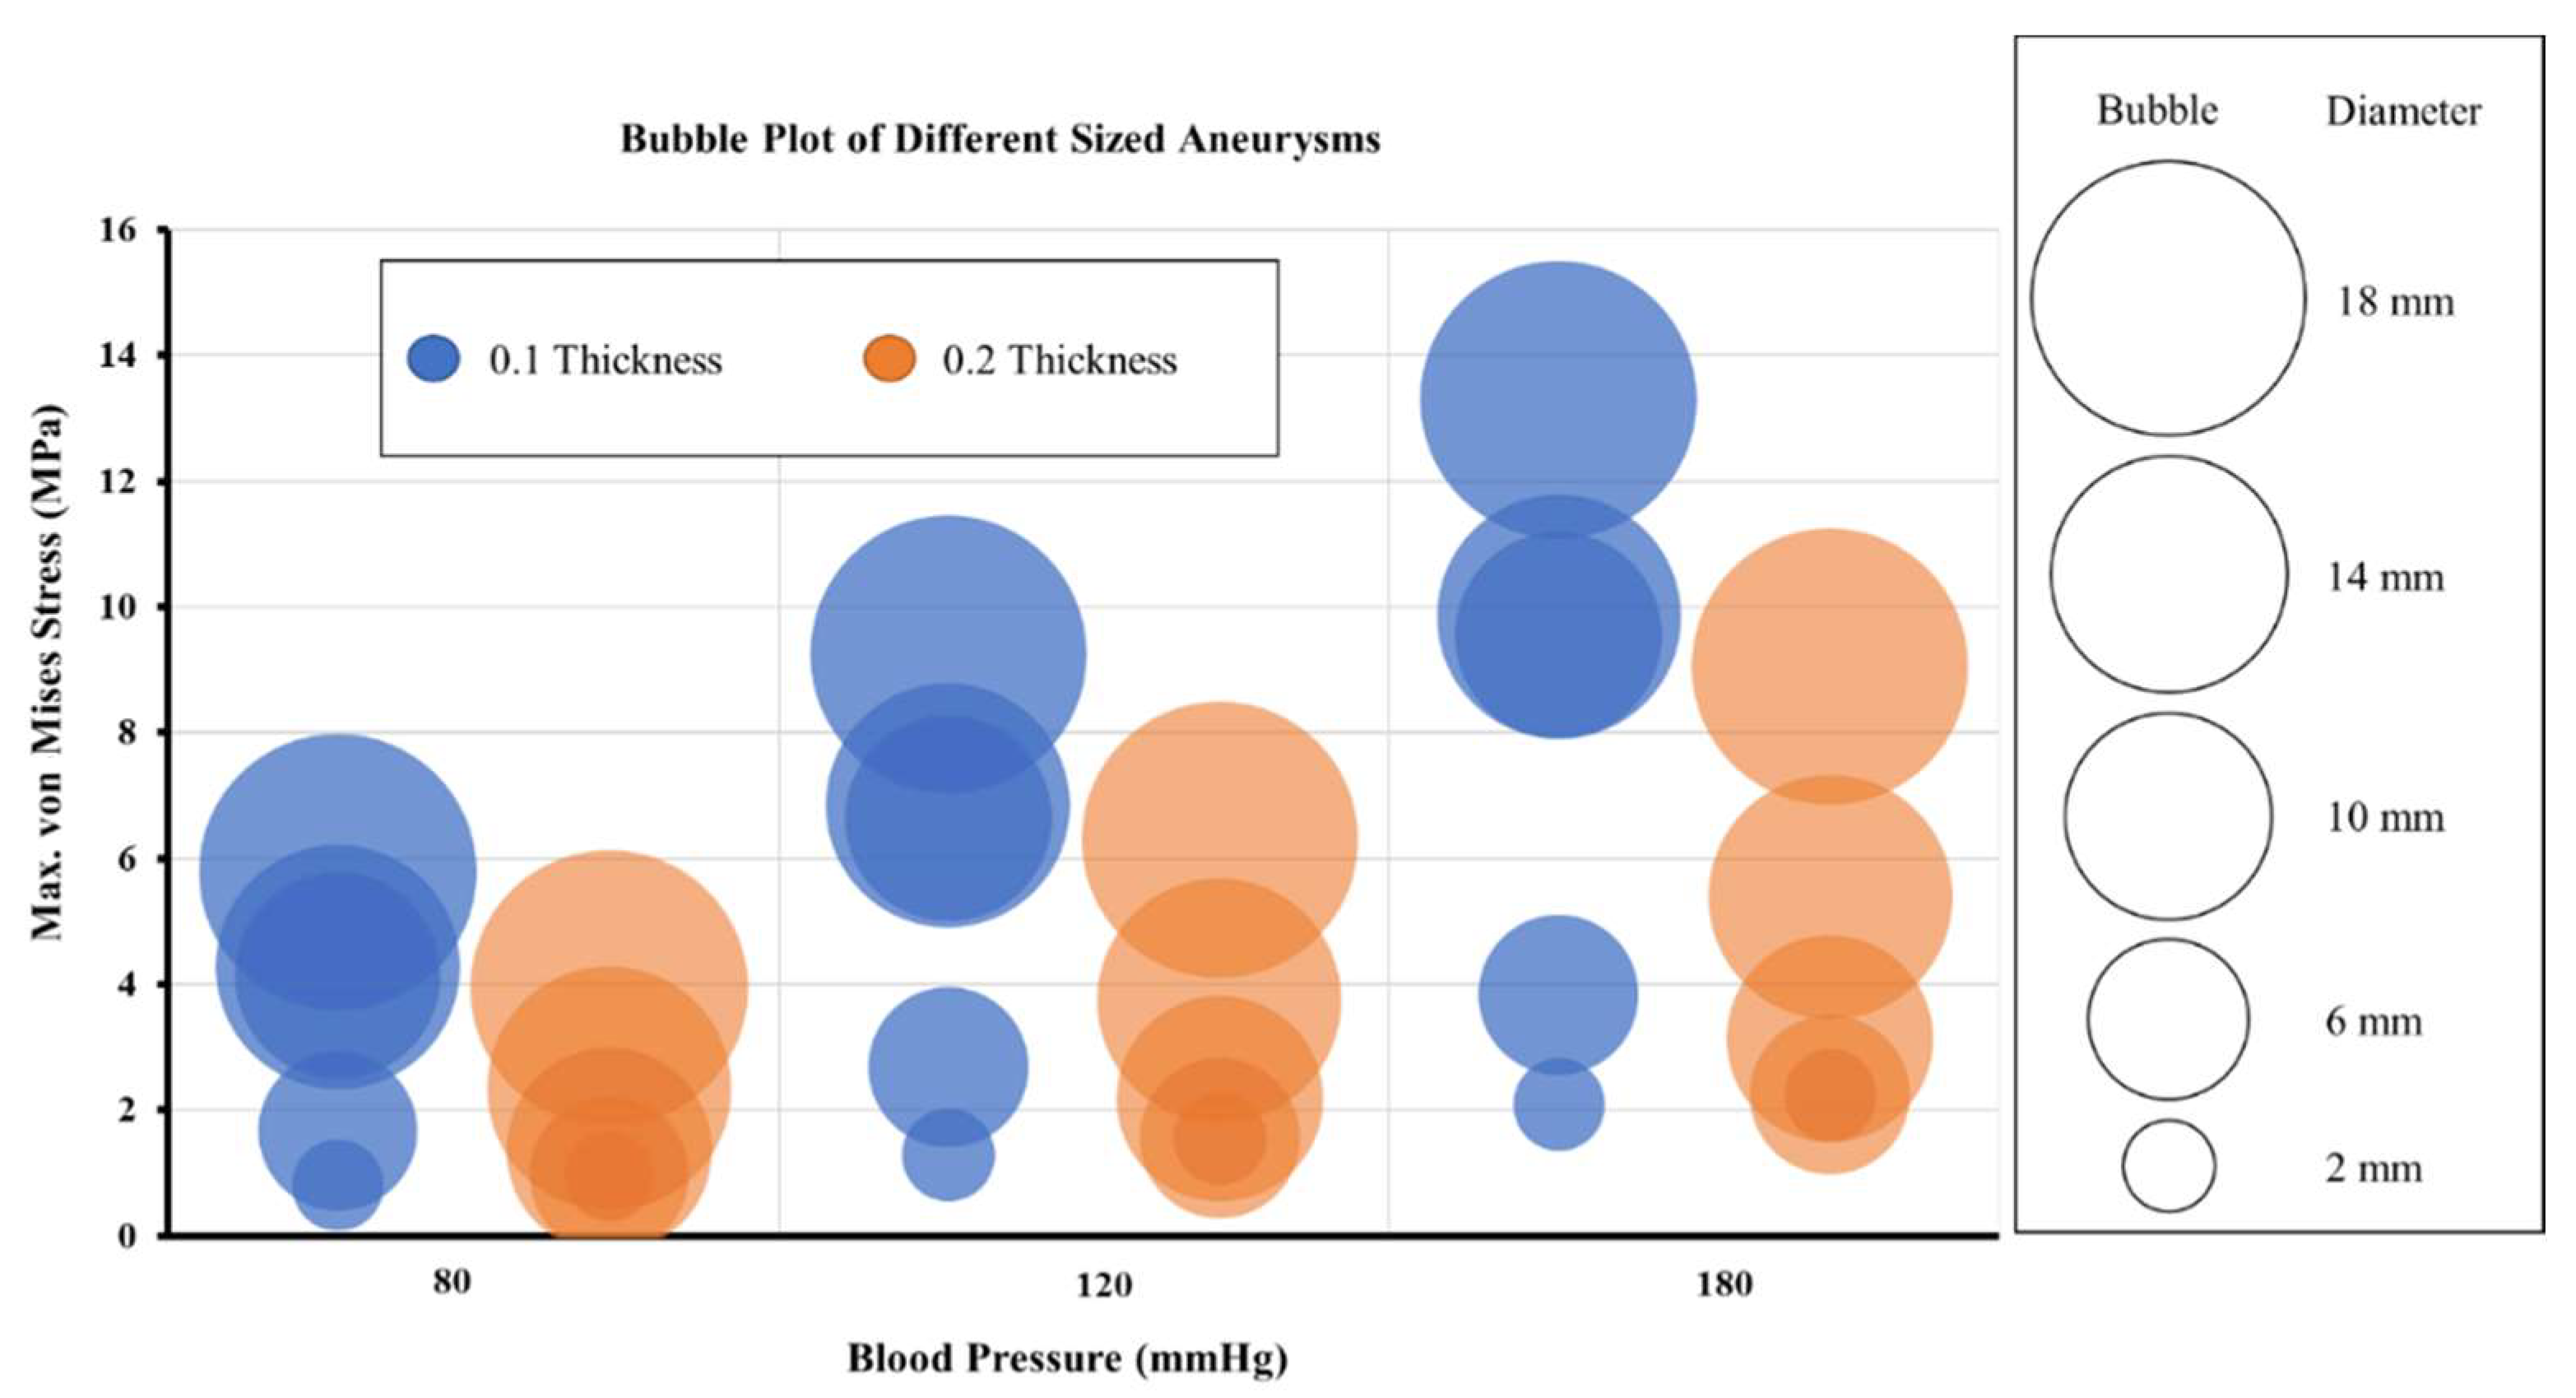
3.4. Effect of Varying Blood Pressure on Aneurysm Wall Stresses
The effect of three pressure loading conditions was evaluated for the artery–aneurysm models and bubble plots were used to compare the maximum von Mises stress values across the three pressure loads, i.e., diastolic, systolic, and hypertensive. The bubbles in the plot represent various aneurysm models with varying diameters and wall thicknesses. Figure 8 shows the bubble plot for various models of the bifurcated MCA section. It was found that the maximum von Mises stress rises with an increase in pressure load for all models with the same aneurysm diameter and wall thickness. For all of the models, the maximum stress value increased up to 60% when pressure changed from diastolic to systolic. The maximum stress value again increased by 43% with a change in pressure condition from systolic to hypertensive. However, for artery–aneurysm models with an initial diameter of 2 mm, the maximum stress value increased by 20% when pressure changed from diastolic to systolic, and by another 7% when pressure changed to hypertensive. On increasing the aneurysm wall thickness from 0.1 mm to 0.2 mm, the maximum von Mises stress decreased. Across all the pressure loads, the decrease in the von Mises stress was 41% for 6 mm aneurysm diameter, 67% for 10 mm aneurysm diameter, 45% for 14 mm aneurysm diameter, and 31% for 18 mm aneurysm diameter. Under the diastolic pressure condition in the bifurcated MCA section, for aneurysms with 0.1 mm wall thickness, the maximum stress was beyond the range of breaking stress (2–3 MPa) when the diameter became 10 mm, and for 0.2 mm wall thickness, it was in the breaking stress range when the diameter reached 14 mm. Under systolic pressure conditions, for aneurysms with 0.1 mm wall thickness, the maximum stress reached the breaking stress range when the diameter was 6 mm, and for 0.2 mm wall thickness, the same occurred when the diameter was 10 mm. Under hypertensive pressure conditions, the maximum stress was within the breaking stress range for an initial diameter of 2 mm for both wall thicknesses. These observations indicated that increasing pressure load might have an adverse impact on aneurysms with increased chances of rupture. The most vulnerable aneurysm model across all the models was found to be the one with 18 mm diameter and 0.1 mm wall thickness.
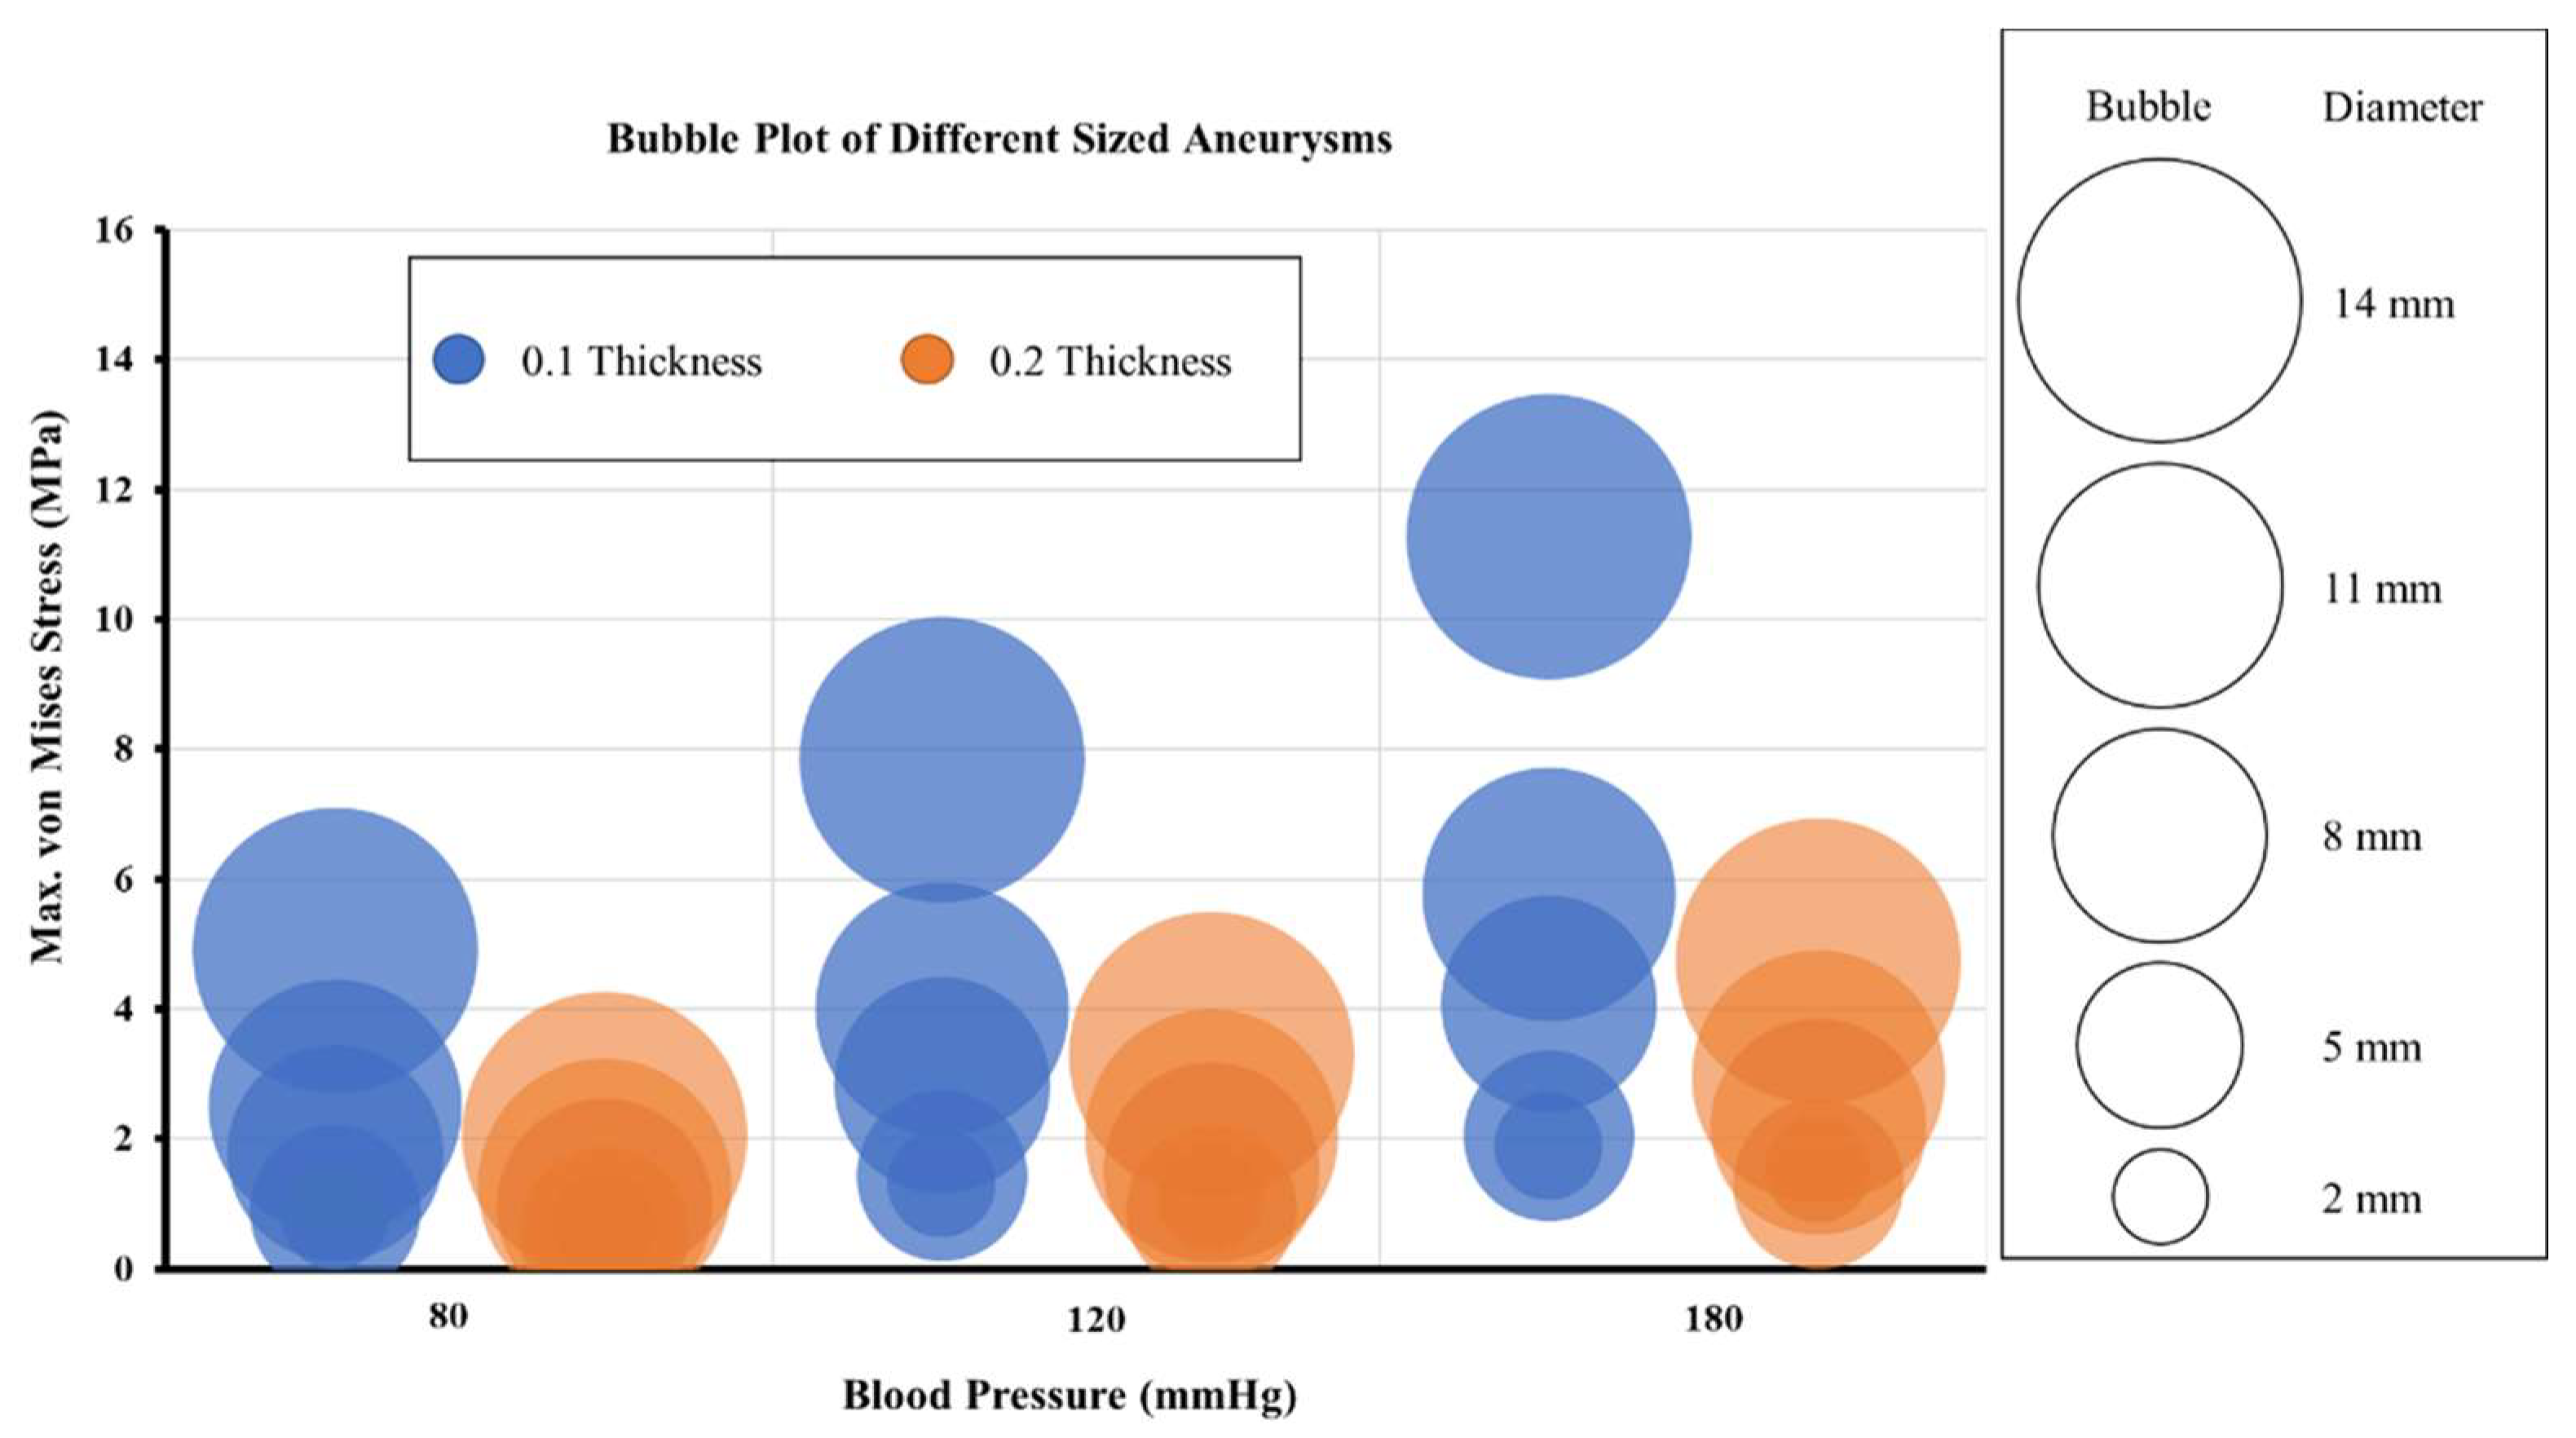
Figure 9 shows the bubble plot for various models of the curved MCA section. Similar patterns were seen for the curved MCA section when compared to the bifurcated section models. The maximum von Mises stress increased with an increase in the pressure for all the models with the same aneurysm diameter and wall thickness. For all the models, the maximum stress value increased up to 61% when pressure increased from diastolic to systolic, and it further increased by 45% when pressure increased from systolic to hypertensive. The maximum von Mises stress decreased as the aneurysm wall thickness increased from 0.1 mm to 0.2 mm for all aneurysm diameters. The estimated decrease in the maximum stress value on increasing the aneurysm wall thickness was 18% for 2 mm aneurysm diameter, 36% for 5 mm aneurysm diameter, 46% for 8 mm aneurysm diameter, 49% for 11 mm aneurysm diameter, and 58% for 14 mm aneurysm diameter models. Under diastolic pressure conditions in the curved MCA section, for aneurysms with 0.1 mm wall thickness, the maximum stress was in the range of breaking stress (2–3 MPa) when the diameter became 11 mm, and for 0.2 mm wall thickness, this happened when the diameter reached 14 mm. Under systolic pressure conditions, for aneurysms with 0.1 mm wall thickness, the maximum stress fell within the breaking stress range when the diameter was 8 mm, and for 0.2 mm wall thickness, the same happened when the diameter was 11 mm. Under hypertensive pressure conditions, for aneurysms with 0.1 mm wall thickness, the maximum stress reached breaking stress range at 5 mm diameter, and for 0.2 mm wall thickness, it reached the breaking stress range when the diameter was 8 mm. These observations validated the conclusion that increasing pressure load may have an adverse impact on aneurysms with increased chances of rupture. The aneurysm with 14 mm diameter and 0.1 mm wall thickness showed the highest maximum von Mises stress.
4. Conclusions
This work presented a novel framework for modeling cerebral aneurysm progression and assessing rupture risk. Two realistic and common arterial sections, namely a bifurcated middle cerebral artery and a curved middle cerebral artery, were modeled, and aneurysm progression (i.e., varying aneurysm diameter and wall thickness) was simulated. The effect of aneurysm size, wall thickness, and change in blood pressure value was characterized and the induced stresses were evaluated. It was found that high-stress values were generated with an increase in the aneurysm diameter, increased pressure loads, and decreasing thickness of the aneurysm wall, consequently leading to an increase in aneurysm rupture risk. Across all bifurcated MCA models, the highest von Mises stress value was recorded around the neck of the aneurysm, and the overall stress concentration was detected in the region around the artery–aneurysm junction. The stress distribution of the curved MCA section was found to be similar to the stress distribution of the bifurcated MCA section, where high stresses were concentrated around the junction of the artery–aneurysm model. Such an extensive investigation has not been conducted for cerebral aneurysms. The results of such an investigation can help determine a patient’s aneurysm rupture risks from the study of the aneurysm’s structural parameters through imaging and from measuring of maximum possible blood pressures. This information would be indispensable for doctors and surgeons to plan timely corrective measures to mitigate aneurysm ruptures.
There are some limitations of the reported work which should be acknowledged. In this study, the thickness of the aneurysm wall was considered to be uniform. However, the wall thickness varies across different locations of an aneurysm. Furthermore, a spherical geometry was assumed for the aneurysm, which is an ideal case among a wide range of aneurysm geometries typically observed. The arteries were also simulated with isotropic material properties, instead of anisotropic properties due to fibers in their layers. Additionally, this study was purely an engineering simulation-based work to determine structural parameters of an ideal aneurysm, which may lead to rupture due to excess pressure, and was not based on a neurosurgical or clinical approach. In future, more realistic aneurysm geometries, wall thicknesses, and anisotropic material models, along with a neurosurgical or clinical approach will be adopted to improve the accuracy of the results. This work considered static pressure loads on the aneurysm walls. Although the current modelling technique was economical and the results were comparable with the previous studies [19,20,21,23,24,25], future studies including a detailed computational fluid dynamics study can increase the overall accuracy of the cerebral flow model. In addition to this, a pulsating flow simulating the diastolic and systolic pressures can be used to further enhance the model. These techniques may increase the overall computational cost and will require extra computational refinement.
Author Contributions
Conceptualization, A.C.; methodology, P.N.Y., G.S. and A.C.; software, P.N.Y. and G.S.; validation, P.N.Y. and G.S.; formal analysis, P.N.Y., G.S. and S.G.; investigation, P.N.Y., G.S. and S.G.; data curation, P.N.Y., G.S. and S.G.; writing—original draft preparation, P.N.Y.; writing—review and editing, P.N.Y., G.S. and S.G.; supervision, A.C. All authors have read and agreed to the published version of the manuscript.
Funding
This research received no external funding.
Institutional Review Board Statement
Not Applicable.
Informed Consent Statement
Not Applicable.
Data Availability Statement
The datasets generated during and/or analyzed during the current study are not publicly available due to large dataset, but are available from the corresponding author upon reasonable request.
Acknowledgments
Gurpreet Singh is grateful to the Ministry of Education, Government of India, for awarding the Prime Minister’s Research Fellowship (Ref: IITD/Admission/Ph.D./PMRF/2020-21/4062) for pursuing his doctoral research program at IIT-Delhi, India.
Conflicts of Interest
The authors declare no conflict of interest.
References
- Ferrari, G. Cerebral Aneurysm and Complications: Diagnosis and Treatment. Riv. Di Neuroradiol. 2002, 15, 501–506. [Google Scholar] [CrossRef]
- Seok, J.H.; Seok, C.J.H. Current Science Management of Cerebral Aneurysm, Comment. J. Mol. Pathophysiol. 2021, 10, 1–2. [Google Scholar]
- Fennell, V.S.; Kalani, M.Y.S.; Atwal, G.; Martirosyan, N.L.; Spetzler, R.F. Biology of Saccular Cerebral Aneurysms: A Review of Current Understanding and Future Directions. Front. Surg. 2016, 3, 43. [Google Scholar] [CrossRef] [Green Version]
- Li, D.; Robertson, A.M. A structural multi-mechanism damage model for cerebral arterial tissue. J. Biomech. Eng. 2009, 14–15, 2920–2928. [Google Scholar] [CrossRef] [PubMed]
- Miyata, H.; Koseki, H.; Takizawa, K.; Kasuya, H.; Nozaki, K.; Narumiya, S.; Aoki, T. T cell function is dispensable for intracranial aneurysm formation and progression. PLoS ONE 2017, 12, e0175421. [Google Scholar] [CrossRef] [Green Version]
- Revilla-Pacheco, F.; Escalante-Seyffert, M.C.; Herrada-Pineda, T.; Manrique-Guzman, S.; Perez-Zuniga, I.; Rangel-Suarez, S.; Rubalcava-Ortega, J.; Loyo-Varela, M. Prevalence of Incidental Clinoid Segment Saccular Aneurysms. World Neurosurg. 2018, 115, e244–e251. [Google Scholar] [CrossRef]
- Chalouhi, N.; Hoh, B.L.; Hasan, D. Review of cerebral aneurysm formation, growth, and rupture. Stroke 2013, 44, 3613–3622. [Google Scholar] [CrossRef]
- Rinkel, G.J.E.; Djibuti, M.; Algra, A.; Van Gijn, J. Prevalence and Risk of Rupture of Intracranial Aneurysms. Stroke 1998, 29, 251–256. [Google Scholar] [CrossRef] [Green Version]
- Kroon, M. Simulation of cerebral aneurysm growth and prediction of evolving rupture risk. Model. Simul. Eng. 2011, 2011, 289523. [Google Scholar] [CrossRef]
- Jiang, B.; Paff, M.; Colby, G.P.; Coon, A.L.; Lin, L.-M. Cerebral aneurysm treatment: Modern neurovascular techniques. Stroke Vasc. Neurol. 2016, 1, 93–100. [Google Scholar] [CrossRef] [Green Version]
- Vol, M.-J.; Drake, C.G. Progress in cerebrovascular disease. Management of cerebral aneurysm. Stroke 1981, 12, 273–283. [Google Scholar] [CrossRef]
- De Gelidi, S.; Bucchi, A. Comparative finite element modelling of aneurysm formation and physiologic inflation in the descending aorta. Comput. Methods Biomech. Biomed. Eng. 2019, 22, 1197–1208. [Google Scholar] [CrossRef] [PubMed]
- Cebral, J.R.; Castro, M.A.; Burgess, J.E.; Pergolizzi, R.S.; Sheridan, M.J.; Putman, C.M. Characterization of cerebral aneurysms for assessing risk of rupture by using patient-specific computational hemodynamics models. Am. J. Neuroradiol. 2005, 26, 2550–2559. [Google Scholar] [CrossRef] [PubMed]
- John, E.; Ziema-Davis, M.; Edwards, G.; Brom, G.; Shah, K. Anterior communicating artery complex aneurysms: Anatomic characteristics as predictors of surgical outcome in 300 cases. World Neurosurg. 2019, 122, e896–e906. [Google Scholar]
- Jeong, W.; Rhee, K. Hemodynamics of cerebral aneurysms: Computational analyses of aneurysm progress and treatment. Comput. Math. Methods Med. 2012, 2012, 782801. [Google Scholar] [CrossRef] [PubMed] [Green Version]
- Valencia, A.; Burdiles, P.; Ignat, M.; Mura, J.; Bravo, E.; Rivera, R.; Sordo, J. Fluid structural analysis of human cerebral aneurysm using their own wall mechanical properties. Comput. Math. Methods Med. 2013, 2013, 293128. [Google Scholar] [CrossRef] [PubMed]
- You, S.H.; Kong, D.S.; Kim, J.S.; Jeon, P.; Kim, K.H.; Roh, H.K.; Kim, G.M.; Lee, K.H.; Hong, S.C. Characteristic features of unruptured intracranial aneurysms: Predictive risk factors for aneurysm rupture. J. Neurol. Neurosurg. Psychiatry 2010, 81, 479–484. [Google Scholar] [CrossRef]
- Korja, M.; Kivisaari, R.; Jahromi, B.R.; Lehto, H. Size and location of ruptured intracranial aneurysms: Consecutive series of 1993 hospital-admitted patients. J. Neurosurg. 2017, 127, 748–753. [Google Scholar] [CrossRef]
- Macdonald, D.J.; Finlay, H.M.; Canham, P.B. Directional Wall Strength in Saccular Brain Aneurysms from Polarized Light Microscopy. Ann. Biomed. Eng. 2000, 28, 533–542. [Google Scholar] [CrossRef]
- Parlea, L.; Fahrig, R.; Holdsworth, D.W.; Lownie, S.P. An analysis of the geometry of saccular intracranial aneurysms. Am. J. Neuroradiol. 1999, 20, 1079–1089. [Google Scholar]
- Paz, C.; Suarez, E.; Cabarcos, A.; Pinto, S.I.S. FSI modeling on the effect of artery-aneurysm thickness and coil embolization in patient cases. Comp. Meth. Prog. Biomed. 2021, 206, 106148. [Google Scholar] [CrossRef] [PubMed]
- Muhib, F.; Islam, M.D.; Arafat, M.T. A study on the computational hemodynamic and mechanical parameters for understanding intracranial aneurysms of patients with hypertension and atrial fibrillation. Inform. Med. Unlocked 2022, 32, 101031. [Google Scholar] [CrossRef]
- Xu, L.; Liang, F.; Zhao, B.; Wan, J.; Liu, H. Influence of aging-induced flow waveform variation on hemodynamics in aneurysms present at the internal carotid artery: A computational model-based study. Comp. Biol. Med. 2018, 101, 51–60. [Google Scholar] [CrossRef] [PubMed]
- Dubey, A.; Vasu, B.; Beg, O.A.; Gorla, R.S.R. Finite element computation of magneto-hemodynamic flow and heat transfer in a bifurcated artery with saccular aneurysm using the Carreau-Yasuda biorheological model. Microvasc. Res. 2021, 138, 104221. [Google Scholar] [CrossRef]
- Liu, J.; Chen, Y.; Xiong, Y.; Chen, X.; Duan, Y.; Yang, Y. Computational hemodynamics study of anterior communicating artery aneurysm associated with fenestration: A case report. Interdiscip. Neurosurg. 2020, 19, 100563. [Google Scholar] [CrossRef]
- Ebrahimi, A.P. Mechanical properties of normal and diseased cerebrovascular system. J. Vasc. Interv. Neurol. 2009, 2, 155–162. [Google Scholar]
- Isaksen, J.G.; Bazilevs, Y.; Kvamsdal, T.; Zhang, Y.; Kaspersen, J.H.; Waterloo, K.; Romner, B.; Ingebrigtsen, T. Determination of wall tension in cerebral artery aneurysms by numerical simulation. Stroke 2008, 39, 3172–3178. [Google Scholar] [CrossRef] [Green Version]
- Frolov, S.V.; Potlov, A.Y.; Proskurin, S.G.; Frolova, T.A. Young’s Modulus Evaluation of the Walls of Cerebral Arteries with Aneurysms. In Proceedings of the 2020 Medical Technologies Congress (TIPTEKNO), Antalya, Turkey, 19–20 November 2020; pp. 31–34. [Google Scholar] [CrossRef]
- Humphrey, J.D.; Canham, P.B. Structure, Mechanical Properties, and Mechanics of Intracranial Saccular Aneurysms. J. Elast. 2000, 61, 49–81. [Google Scholar] [CrossRef]
Figure 1.
Model of the cerebral arteries in (A), MCA section with bifurcation in (B), and MCA section with curvature in (C).
Figure 1.
Model of the cerebral arteries in (A), MCA section with bifurcation in (B), and MCA section with curvature in (C).

Figure 2.
Aneurysms of different sizes (diameter) simulating progression in bifurcation MCA: (A) 2 mm, (B) 6 mm, (C) 10 mm, (D) 14 mm, (E) 18 mm; and in curved MCA: (F) 2 mm, (G) 5 mm, (H) 8 mm, (I) 11 mm, and (J) 14 mm.
Figure 2.
Aneurysms of different sizes (diameter) simulating progression in bifurcation MCA: (A) 2 mm, (B) 6 mm, (C) 10 mm, (D) 14 mm, (E) 18 mm; and in curved MCA: (F) 2 mm, (G) 5 mm, (H) 8 mm, (I) 11 mm, and (J) 14 mm.

Figure 3.
Meshed artery models of (A) Bifurcated MCA section and (B) Curved MCA section.

Figure 4.
Mesh convergence results for: (A) Bifurcated MCA and (B) Curved MCA.

Figure 5.
von Mises stress distribution in bifurcated MCA section with wall thickness of: (A) 0.1 mm and (B) 0.2 mm. Here, the columns represent the aneurysm diameters and rows correspond to the pressure loads (0.01 MPa, 0.016 MPa, and 0.023 MPa).
Figure 5.
von Mises stress distribution in bifurcated MCA section with wall thickness of: (A) 0.1 mm and (B) 0.2 mm. Here, the columns represent the aneurysm diameters and rows correspond to the pressure loads (0.01 MPa, 0.016 MPa, and 0.023 MPa).


Figure 6.
von Mises stress distribution in curved MCA section with wall thickness of: (A) 0.1 mm and (B) 0.2 mm. Here, the columns represent the aneurysm diameters (as per Figure 2) and rows correspond to the pressure loads (0.01 MPa, 0.016 MPa, and 0.023 MPa).
Figure 6.
von Mises stress distribution in curved MCA section with wall thickness of: (A) 0.1 mm and (B) 0.2 mm. Here, the columns represent the aneurysm diameters (as per Figure 2) and rows correspond to the pressure loads (0.01 MPa, 0.016 MPa, and 0.023 MPa).


Figure 7.
Maximum von Mises stress variation for bifurcated MCA section with wall thickness of: (A) 0.1 mm and (B) 0.2 mm; and for curved MCA section with wall thickness of: (C) 0.1 mm and (D) 0.2 mm.
Figure 7.
Maximum von Mises stress variation for bifurcated MCA section with wall thickness of: (A) 0.1 mm and (B) 0.2 mm; and for curved MCA section with wall thickness of: (C) 0.1 mm and (D) 0.2 mm.

Figure 8.
Maximum von Mises stress variation with aneurysm diameters for three pressure conditions for models of bifurcated MCA section.
Figure 8.
Maximum von Mises stress variation with aneurysm diameters for three pressure conditions for models of bifurcated MCA section.

Figure 9.
Maximum von Mises stress variation with aneurysm diameters for three pressure conditions for models of curved MCA section.
Figure 9.
Maximum von Mises stress variation with aneurysm diameters for three pressure conditions for models of curved MCA section.


Table 1.
Aneurysm sizes for modeling the artery–aneurysm models.
| MCA Section | Aneurysm Diameter (mm) | ||||
|---|---|---|---|---|---|
| Bifurcated | 2 | 6 | 10 | 14 | 18 |
| Curvature | 2 | 5 | 8 | 11 | 14 |
Disclaimer/Publisher’s Note: The statements, opinions and data contained in all publications are solely those of the individual author(s) and contributor(s) and not of MDPI and/or the editor(s). MDPI and/or the editor(s) disclaim responsibility for any injury to people or property resulting from any ideas, methods, instructions or products referred to in the content. |
© 2023 by the authors. Licensee MDPI, Basel, Switzerland. This article is an open access article distributed under the terms and conditions of the Creative Commons Attribution (CC BY) license (https://creativecommons.org/licenses/by/4.0/).
Share and Cite
MDPI and ACS Style
Yadav, P.N.; Singh, G.; Gupta, S.; Chanda, A. Biomechanical Modeling of Cerebral Aneurysm Progression to Estimate Rupture Risk. Biomechanics 2023, 3, 13-28. https://doi.org/10.3390/biomechanics3010002
AMA Style
Yadav PN, Singh G, Gupta S, Chanda A. Biomechanical Modeling of Cerebral Aneurysm Progression to Estimate Rupture Risk. Biomechanics. 2023; 3(1):13-28. https://doi.org/10.3390/biomechanics3010002
Chicago/Turabian StyleYadav, Prem Nath, Gurpreet Singh, Shubham Gupta, and Arnab Chanda. 2023. "Biomechanical Modeling of Cerebral Aneurysm Progression to Estimate Rupture Risk" Biomechanics 3, no. 1: 13-28. https://doi.org/10.3390/biomechanics3010002