
Biomechanical Characteristics of Long Stair Climbing in Healthy Young Individuals in a Real-World Study Using a Wearable Motion Analysis System
 , , , , ,
Abstract
:1. Introduction
2. Materials and Methods
3. Results
4. Discussion
5. Conclusions
Author Contributions
Funding
Institutional Review Board Statement
Informed Consent Statement
Data Availability Statement
Acknowledgments
Conflicts of Interest
References
- Teh, K.C.; Aziz, A.R. Heart rate, oxygen uptake, and energy cost of ascending and descending the stairs. Med. Sci. Sports Exerc. 2002, 34, 695–699. [Google Scholar] [CrossRef] [PubMed]
- Silverman, A.K.; Neptune, R.R.; Sinitski, E.H.; Wilken, J.M. Whole-body angular momentum during stair ascent and descent. Gait Posture 2014, 39, 1109–1114. [Google Scholar] [CrossRef] [PubMed]
- Verghese, J.; Wang, C.; Xue, X.; Holtzer, R. Self-reported difficulty in climbing up or down stairs in nondisabled elderly. Arch. Phys. Med. Rehabil. 2008, 89, 100–104. [Google Scholar] [CrossRef] [PubMed] [Green Version]
- Hensor, E.M.; Dube, B.; Kingsbury, S.R.; Tennant, A.; Conaghan, P.G. Toward a clinical definition of early osteoarthritis: Onset of patient-reported knee pain begins on stairs. Data from the osteoarthritis initiative. Arthritis Care Res. (Hoboken) 2015, 67, 40–47. [Google Scholar] [CrossRef] [PubMed] [Green Version]
- Della Croce, U.; Bonato, P. A novel design for an instrumented stairway. J. Biomech. 2007, 40, 702–704. [Google Scholar] [CrossRef]
- Singhal, K.; Kim, J.; Casebolt, J.; Lee, S.; Han, K.H.; Kwon, Y.H. Gender difference in older adult’s utilization of gravitational and ground reaction force in regulation of angular momentum during stair descent. Hum. Mov. Sci. 2015, 41, 230–239. [Google Scholar] [CrossRef] [PubMed]
- Hsue, B.J.; Su, F.C. Effects of age and gender on dynamic stability during stair descent. Arch. Phys. Med. Rehabil. 2014, 95, 1860–1869. [Google Scholar] [CrossRef]
- Barbieri, F.A.; Santos, P.C.; Lirani-Silva, E.; Vitorio, R.; Gobbi, L.T.; van Dieen, J.H. Systematic review of the effects of fatigue on spatiotemporal gait parameters. J. Back Musculoskelet. Rehabil. 2013, 26, 125–131. [Google Scholar] [CrossRef] [Green Version]
- Chambers, A.J.; Haney, J.M.; Huppert, T.; Redfern, M.S. The Effect of Prolonged Walking With Intermittent Standing on Erector Spinae and Soleus Muscle Oxygenation and Discomfort. J. Sports Sci. Med. 2019, 18, 337–343. [Google Scholar] [PubMed]
- Yoshino, K.; Motoshige, T.; Araki, T.; Matsuoka, K. Effect of prolonged free-walking fatigue on gait and physiological rhythm. J. Biomech. 2004, 37, 1271–1280. [Google Scholar] [CrossRef]
- Kretz, T.; Grunebohm, A.; Kessel, A.; Klupfel, H.; Meyer-Konig, T.; Schreckenberg, M. Upstairs walking speed distributions on a long stairway. Saf. Sci. 2008, 46, 72–78. [Google Scholar] [CrossRef]
- Teufl, W.; Miezal, M.; Taetz, B.; Frohlich, M.; Bleser, G. Validity, Test-Retest Reliability and Long-Term Stability of Magnetometer Free Inertial Sensor Based 3D Joint Kinematics. Sensors 2018, 18, 1980. [Google Scholar] [CrossRef] [Green Version]
- Park, S.; Yoon, S. Validity Evaluation of an Inertial Measurement Unit (IMU) in Gait Analysis Using Statistical Parametric Mapping (SPM). Sensors 2021, 21, 3667. [Google Scholar] [CrossRef] [PubMed]
- Ghattas, J.; Jarvis, D.N. Validity of inertial measurement units for tracking human motion: A systematic review. Sports Biomech. 2021, 26, 1–14. [Google Scholar] [CrossRef]
- Poitras, I.; Dupuis, F.; Bielmann, M.; Campeau-Lecours, A.; Mercier, C.; Bouyer, L.J.; Roy, J.S. Validity and Reliability of Wearable Sensors for Joint Angle Estimation: A Systematic Review. Sensors 2019, 19, 1555. [Google Scholar] [CrossRef] [PubMed] [Green Version]
- Hindle, B.R.; Keogh, J.W.L.; Lorimer, A.V. Validation of Spatiotemporal and Kinematic Measures in Functional Exercises Using a Minimal Modeling Inertial Sensor Methodology. Sensors 2020, 20, 4586. [Google Scholar] [CrossRef] [PubMed]
- Grimmer, M.; Zeiss, J.; Weigand, F.; Zhao, G.; Lamm, S.; Steil, M.; Heller, A. Lower limb joint biomechanics-based identification of gait transitions in between level walking and stair ambulation. PLoS ONE 2020, 15, e0239148. [Google Scholar] [CrossRef]
- Verlaan, L.; Boekesteijn, R.J.; Oomen, P.W.; Liu, W.Y.; Peters, M.J.M.; Emans, P.J.; van Rhijn, L.W.; Meijer, K. Knee adduction moments are not increased in obese knee osteoarthritis patients during stair negotiation. Gait Posture 2019, 73, 154–160. [Google Scholar] [CrossRef]
- Harper, N.G.; Wilken, J.M.; Neptune, R.R. Muscle Function and Coordination of Stair Ascent. J. Biomech. Eng. 2018, 140, 011001. [Google Scholar] [CrossRef] [PubMed]
- Vallabhajosula, S.; Tan, C.W.; Mukherjee, M.; Davidson, A.J.; Stergiou, N. Biomechanical analyses of stair-climbing while dual-tasking. J. Biomech. 2015, 48, 921–929. [Google Scholar] [CrossRef]
- Rouhani, H.; Favre, J.; Crevoisier, X.; Aminian, K. Ambulatory assessment of 3D ground reaction force using plantar pressure distribution. Gait Posture 2010, 32, 311–316. [Google Scholar] [CrossRef]
- Fong, D.T.; Chan, Y.Y.; Hong, Y.; Yung, P.S.; Fung, K.Y.; Chan, K.M. Estimating the complete ground reaction forces with pressure insoles in walking. J. Biomech. 2008, 41, 2597–2601. [Google Scholar] [CrossRef] [PubMed] [Green Version]
- Jacobs, D.A.; Ferris, D.P. Evaluation of a Low-Cost Pneumatic Plantar Pressure Insole for Predicting Ground Contact Kinetics. J. Appl. Biomech. 2016, 32, 215–220. [Google Scholar] [CrossRef] [PubMed]
- Fukushi, K.; Sekiguchi, Y.; Honda, K.; Yaguchi, H.; Izumi, S.I. Three-dimensional GRF and CoP Estimation during Stair and Slope Ascent/Descent with Wearable IMUs and Foot Pressure Sensors. In Proceedings of the 2019 41st Annual International Conference of the IEEE Engineering in Medicine and Biology Society (EMBC), Berlin, Germany, 23–27 July 2019; pp. 6401–6404. [Google Scholar]
- Hellmers, S.; Lau, S.; Diekmann, R.; Dasenbrock, L.; Kromke, T.; Bauer, J.M.; Fudickar, S.; Hein, A. Evaluation of Power-Based Stair Climb Performance via Inertial Measurement Units. In Biomedical Engineering Systems and Technologies; Communications in Computer and Information Science; Springer International Publishing: Cham, Switzerland, 2019; pp. 238–261. [Google Scholar]
- Riener, R.; Rabuffetti, M.; Frigo, C. Stair ascent and descent at different inclinations. Gait Posture 2002, 15, 32–44. [Google Scholar] [CrossRef]
- Protopapadaki, A.; Drechsler, W.I.; Cramp, M.C.; Coutts, F.J.; Scott, O.M. Hip, knee, ankle kinematics and kinetics during stair ascent and descent in healthy young individuals. Clin. Biomech. 2007, 22, 203–210. [Google Scholar] [CrossRef] [PubMed]
- Delp, S.L.; Anderson, F.C.; Arnold, A.S.; Loan, P.; Habib, A.; John, C.T.; Guendelman, E.; Thelen, D.G. OpenSim: Open-source software to create and analyze dynamic simulations of movement. IEEE Trans. Biomed. Eng. 2007, 54, 1940–1950. [Google Scholar] [CrossRef] [Green Version]
- Roth, N.; Kuderle, A.; Prossel, D.; Gassner, H.; Eskofier, B.M.; Kluge, F. An Inertial Sensor-Based Gait Analysis Pipeline for the Assessment of Real-World Stair Ambulation Parameters. Sensors 2021, 21, 6559. [Google Scholar] [CrossRef]
- Ojeda, L.V.; Zaferiou, A.M.; Cain, S.M.; Vitali, R.V.; Davidson, S.P.; Stirling, L.A.; Perkins, N.C. Estimating Stair Running Performance Using Inertial Sensors. Sensors 2017, 17, 2647. [Google Scholar] [CrossRef] [Green Version]
- Hammond, C.A.; Hatfield, G.L.; Gilbart, M.K.; Garland, S.J.; Hunt, M.A. Trunk and lower limb biomechanics during stair climbing in people with and without symptomatic femoroacetabular impingement. Clin. Biomech. 2017, 42, 108–114. [Google Scholar] [CrossRef]
- Novak, A.C.; Brouwer, B. Sagittal and frontal lower limb joint moments during stair ascent and descent in young and older adults. Gait Posture 2011, 33, 54–60. [Google Scholar] [CrossRef]
- Farrag, A. Comparison of stair walking mechanics between adult males and females. Bull. Fac. Phys. Ther. 2016, 21, 88–93. [Google Scholar] [CrossRef]
- Antonio, P.J.; Perry, S.D. Quantifying stair gait stability in young and older adults, with modifications to insole hardness. Gait Posture 2014, 40, 429–434. [Google Scholar] [CrossRef] [PubMed]
- Cham, R.; Redfern, M.S. Changes in gait when anticipating slippery floors. Gait Posture 2002, 15, 159–171. [Google Scholar] [CrossRef]


| Stair Climbing Speed (Steps/min) | |||
|---|---|---|---|
| Mean | SD | p-Value | |
| The beginning phase of stair climbing | 81.6 | 6.9 | 0.557 |
| The end phase of stair climbing | 82.3 | 6.3 | |
| Pulse Rate (bpm) | |||
|---|---|---|---|
| Before Stair Climbing | After Stair Climbing | p-Value | |
| Mean | 83.9 | 143.9 | <0.001 |
| SD | 11.9 | 18.3 | |
| ID | Hip Joint Angle (Degree) | |||
|---|---|---|---|---|
| Maximum | Minimum | |||
| Beginning Phase | End Phase | Beginning Phase | End Phase | |
| 1 | 58.94 | 55.53 | −2.14 | −2.43 |
| 2 | 70.70 | 69.62 | −5.80 | −4.94 |
| 4 | 64.87 | 65.16 | −6.74 | −6.60 |
| 5 | 59.56 | 60.93 | −6.06 | −4.02 |
| 6 | 51.38 | 47.60 | −4.88 | −8.06 |
| 7 | 61.56 | 60.69 | −2.86 | −1.45 |
| 8 | 77.45 | 76.95 | 8.10 | 11.08 |
| 9 | 69.67 | 70.34 | −1.66 | −0.01 |
| Mean | 64.26 | 63.35 | −2.75 | −2.06 |
| SD | 7.66 | 8.65 | 4.47 | 5.55 |
| 95% CI | −2.46, 0.63 | −0.88, 2.27 | ||
| p-value | 0.21 | 0.31 | ||
| ID | Knee Joint Angle (Degree) | |||
| Maximum | Minimum | |||
| Beginning Phase | End Phase | Beginning Phase | End Phase | |
| 1 | 71.96 | 67.09 | 19.38 | 19.21 |
| 2 | 78.75 | 77.96 | 20.66 | 22.73 |
| 4 | 86.00 | 87.47 | 12.11 | 16.87 |
| 5 | 82.70 | 79.27 | 15.80 | 15.05 |
| 6 | 89.61 | 88.00 | 21.18 | 20.93 |
| 7 | 90.67 | 89.57 | 23.63 | 26.32 |
| 8 | 98.29 | 99.90 | 27.02 | 35.01 |
| 9 | 100.73 | 99.64 | 28.64 | 26.02 |
| Mean | 87.34 | 86.11 | 21.05 | 22.77 |
| SD | 9.01 | 10.40 | 5.13 | 5.95 |
| 95% CI | −3.06, 0.61 | −1.15, 4.57 | ||
| p-value | 0.16 | 0.20 | ||
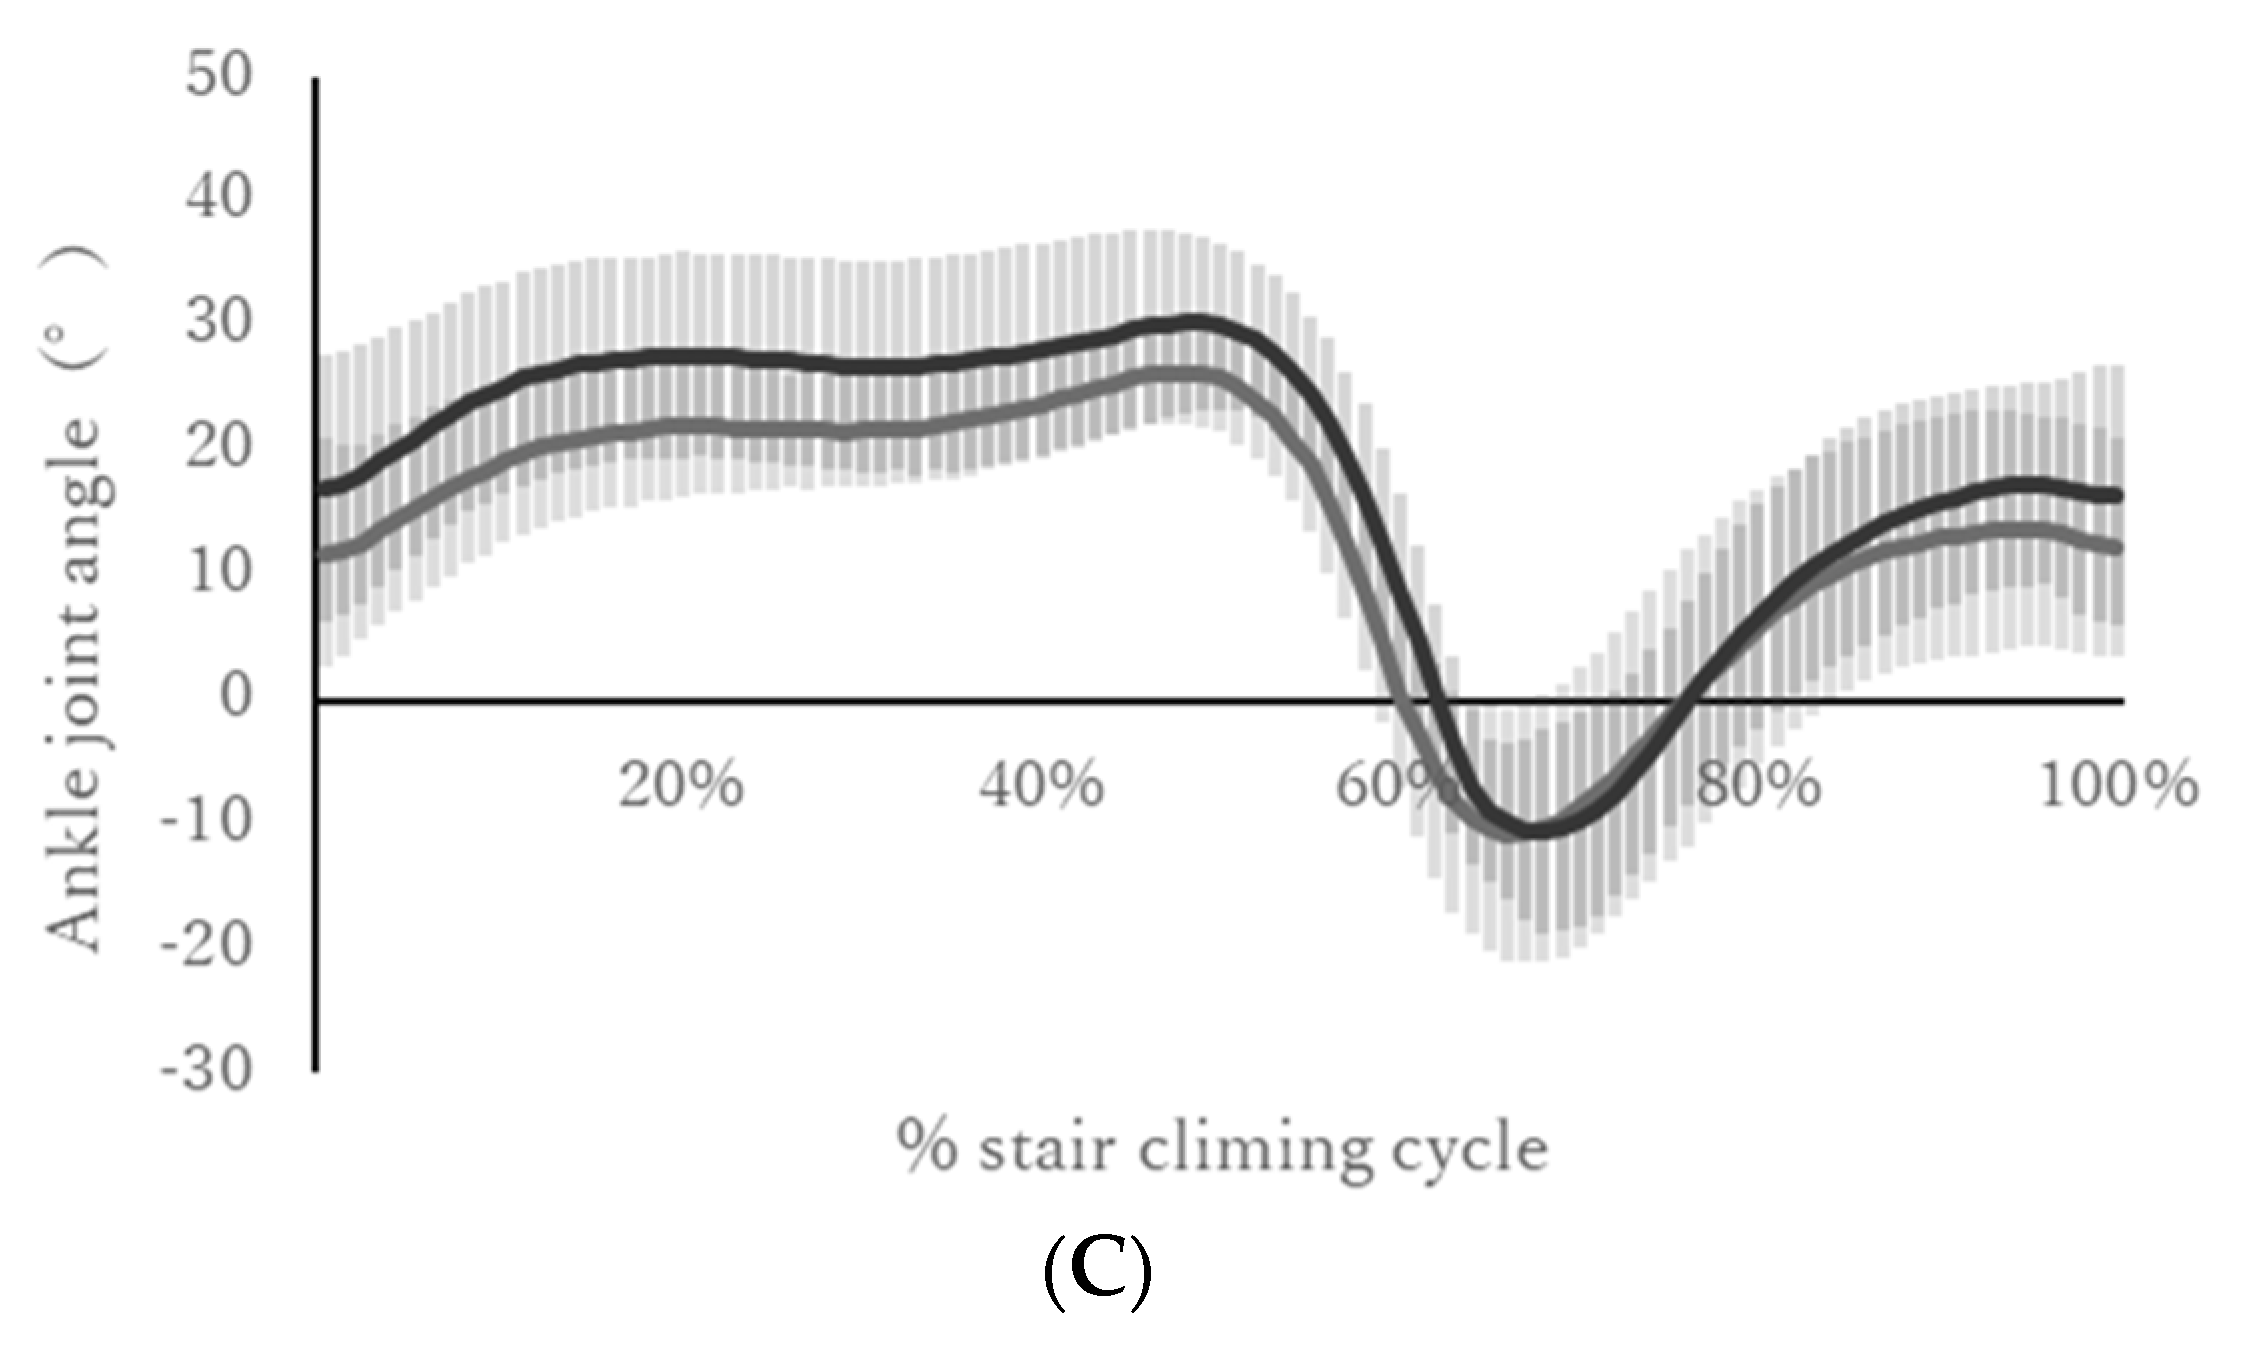
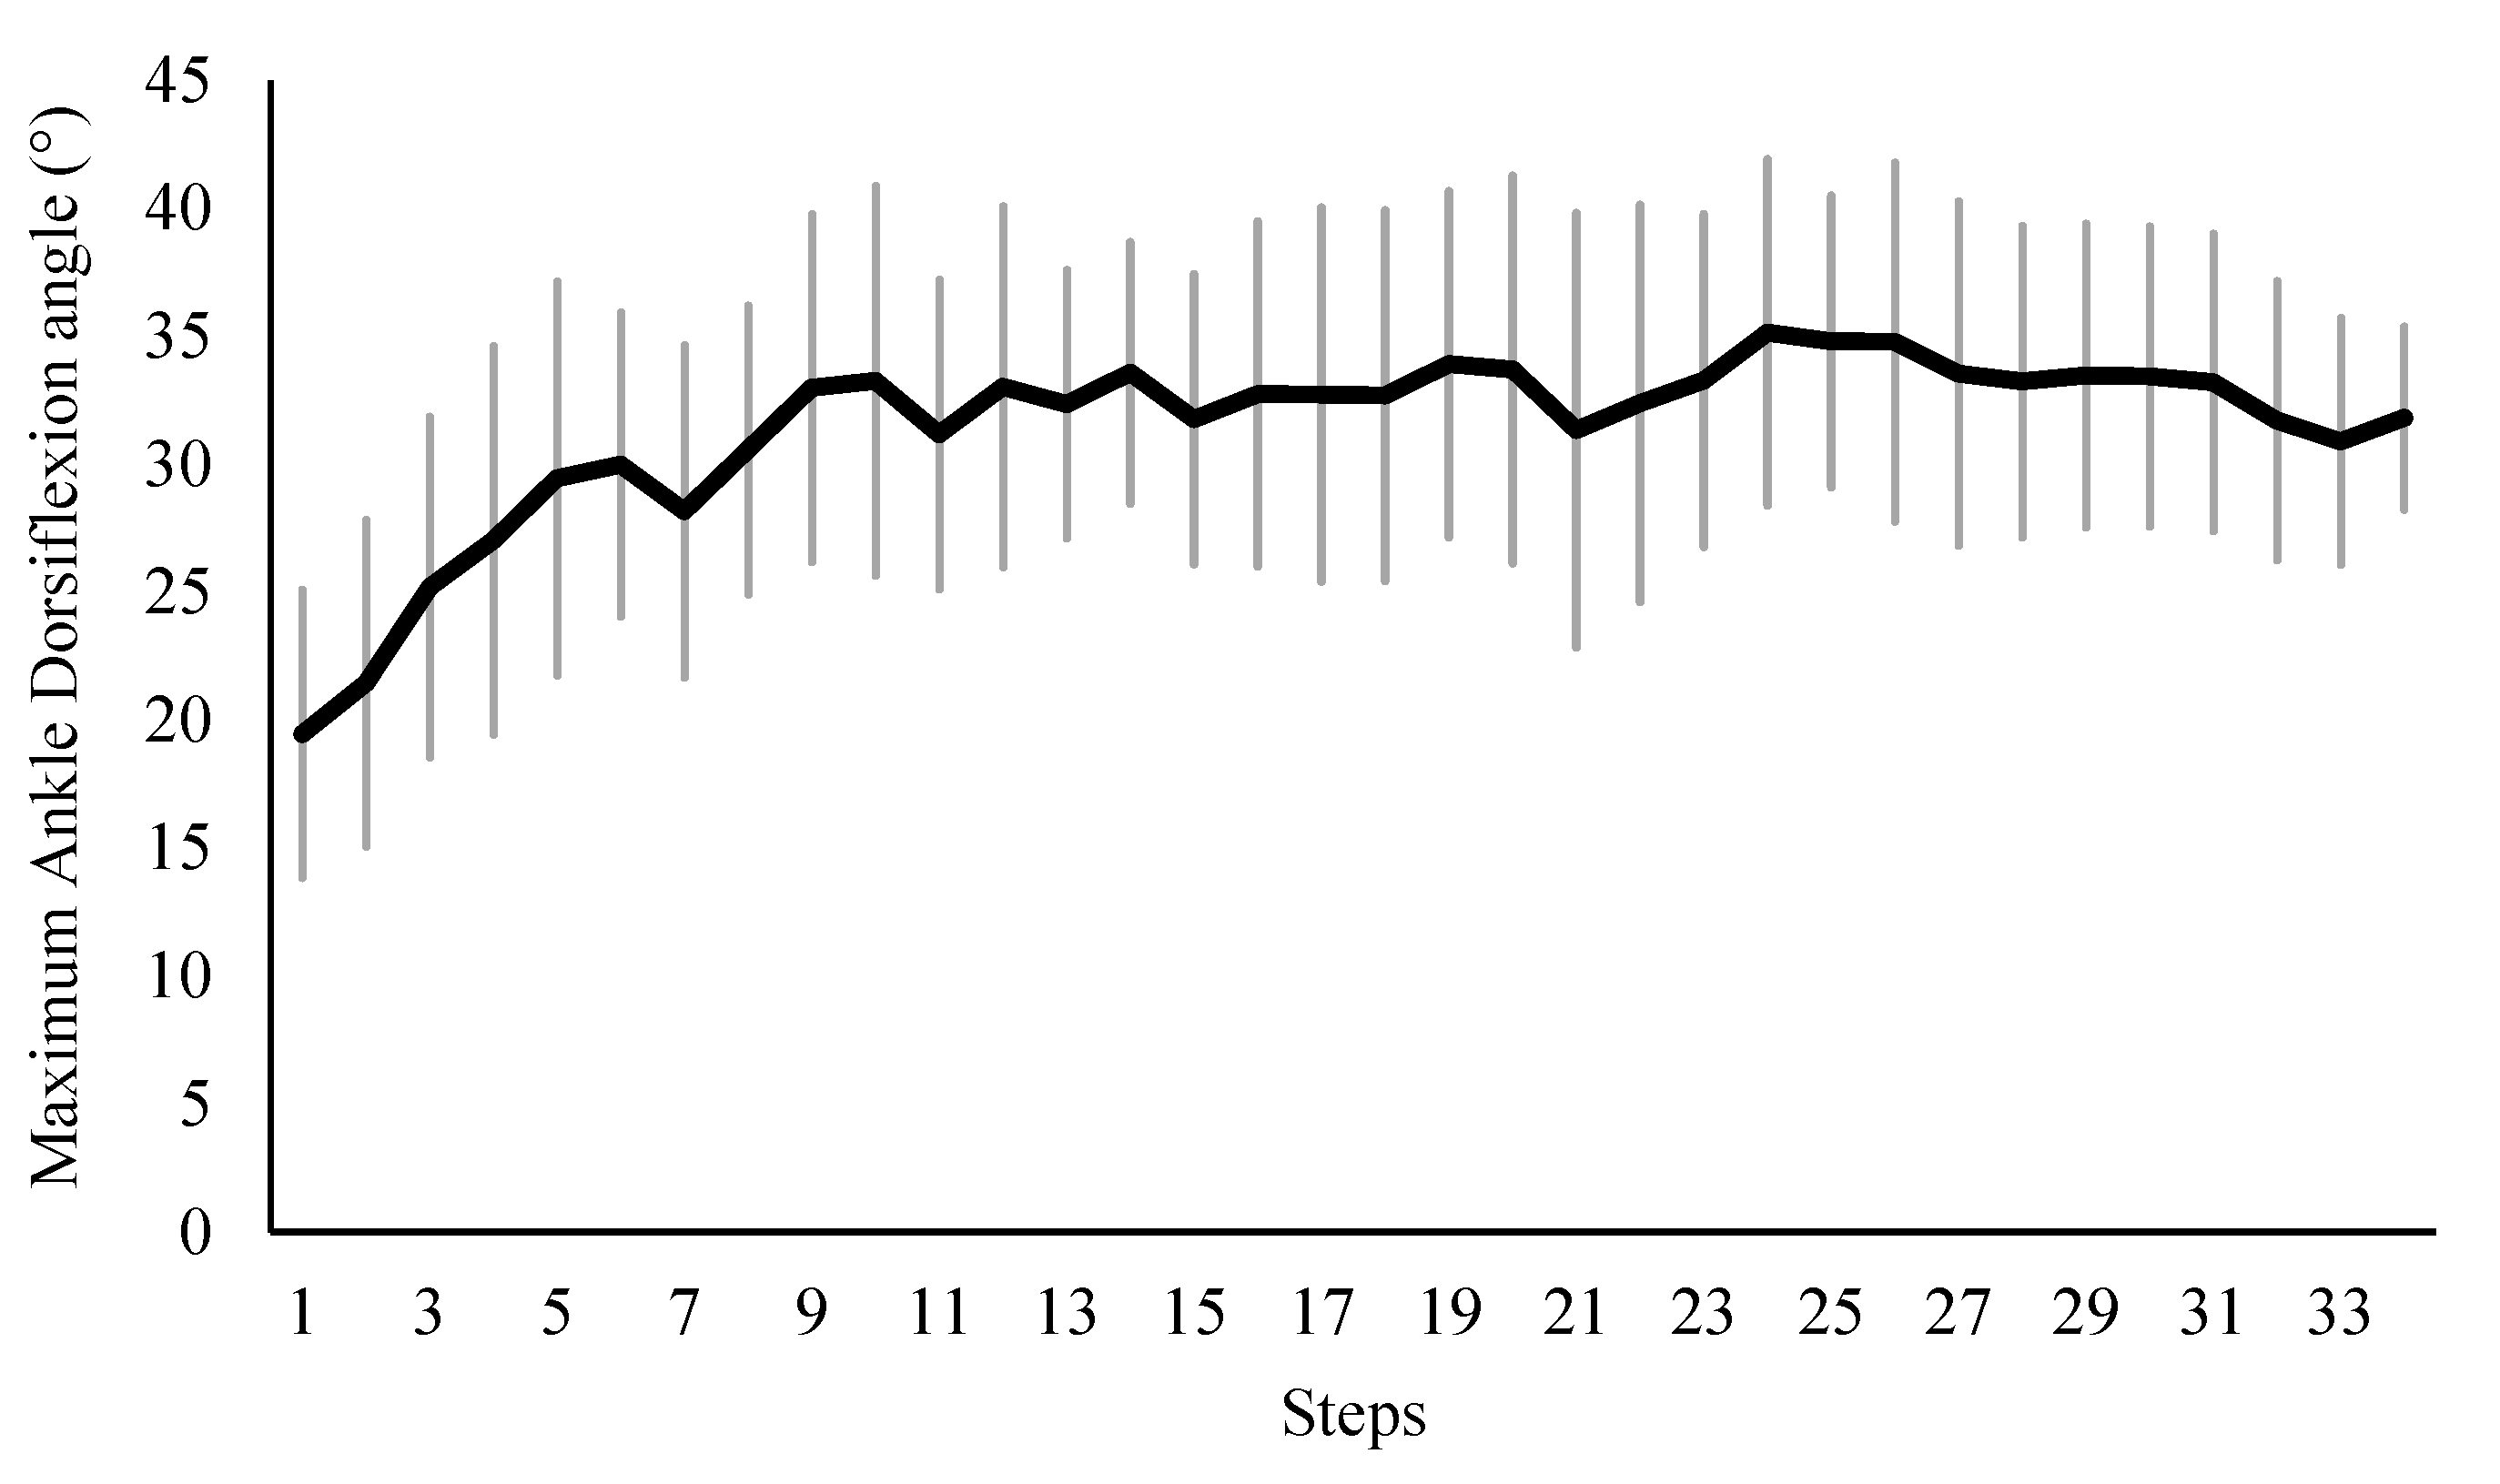
| ID | Ankle Joint Angle (Degree) | |||
| Maximum | Minimum | |||
| Beginning Phase | End Phase | Beginning Phase | End Phase | |
| 1 | 18.77 | 21.03 | −32.18 | −23.96 |
| 2 | 31.54 | 36.82 | −18.62 | −13.50 |
| 4 | 22.78 | 28.26 | −21.25 | −16.95 |
| 5 | 24.97 | 25.69 | −27.45 | −29.99 |
| 6 | 31.99 | 38.22 | −6.04 | −7.09 |
| 7 | 28.12 | 34.73 | −14.90 | −15.30 |
| 8 | 27.46 | 36.14 | −7.84 | −6.85 |
| 9 | 37.49 | 42.16 | −6.64 | −2.30 |
| Mean | 27.89 | 32.88 | −16.86 | −14.49 |
| SD | 5.48 | 6.69 | 9.19 | 8.65 |
| 95% CI | 2.90, 7.08 | −0.71, 5.45 | ||
| p-value | <0.001 | 0.11 | ||
| ID | Hip Joint Moment (Nm/kg) | |||
| Maximum Flexion | Maximum Extension | |||
| Beginning Phase | End Phase | Beginning Phase | End Phase | |
| 1 | −1.40 | −1.29 | 1.47 | 1.29 |
| 2 | −0.63 | −0.70 | 1.05 | 1.04 |
| 4 | −0.67 | −0.61 | 1.52 | 1.49 |
| 5 | −0.52 | −0.52 | 1.39 | 1.48 |
| 6 | −0.64 | −0.56 | 1.13 | 1.08 |
| 7 | −0.55 | −0.51 | 1.02 | 1.07 |
| 8 | −0.42 | −0.40 | 1.33 | 1.23 |
| 9 | −0.62 | −0.56 | 1.24 | 1.43 |
| Mean | −0.68 | −0.64 | 1.27 | 1.26 |
| SD | 0.30 | 0.27 | 0.19 | 0.19 |
| 95% CI | −0.10, 0.093 | −0.01, 0.085 | ||
| p-value | 0.15 | 0.93 | ||
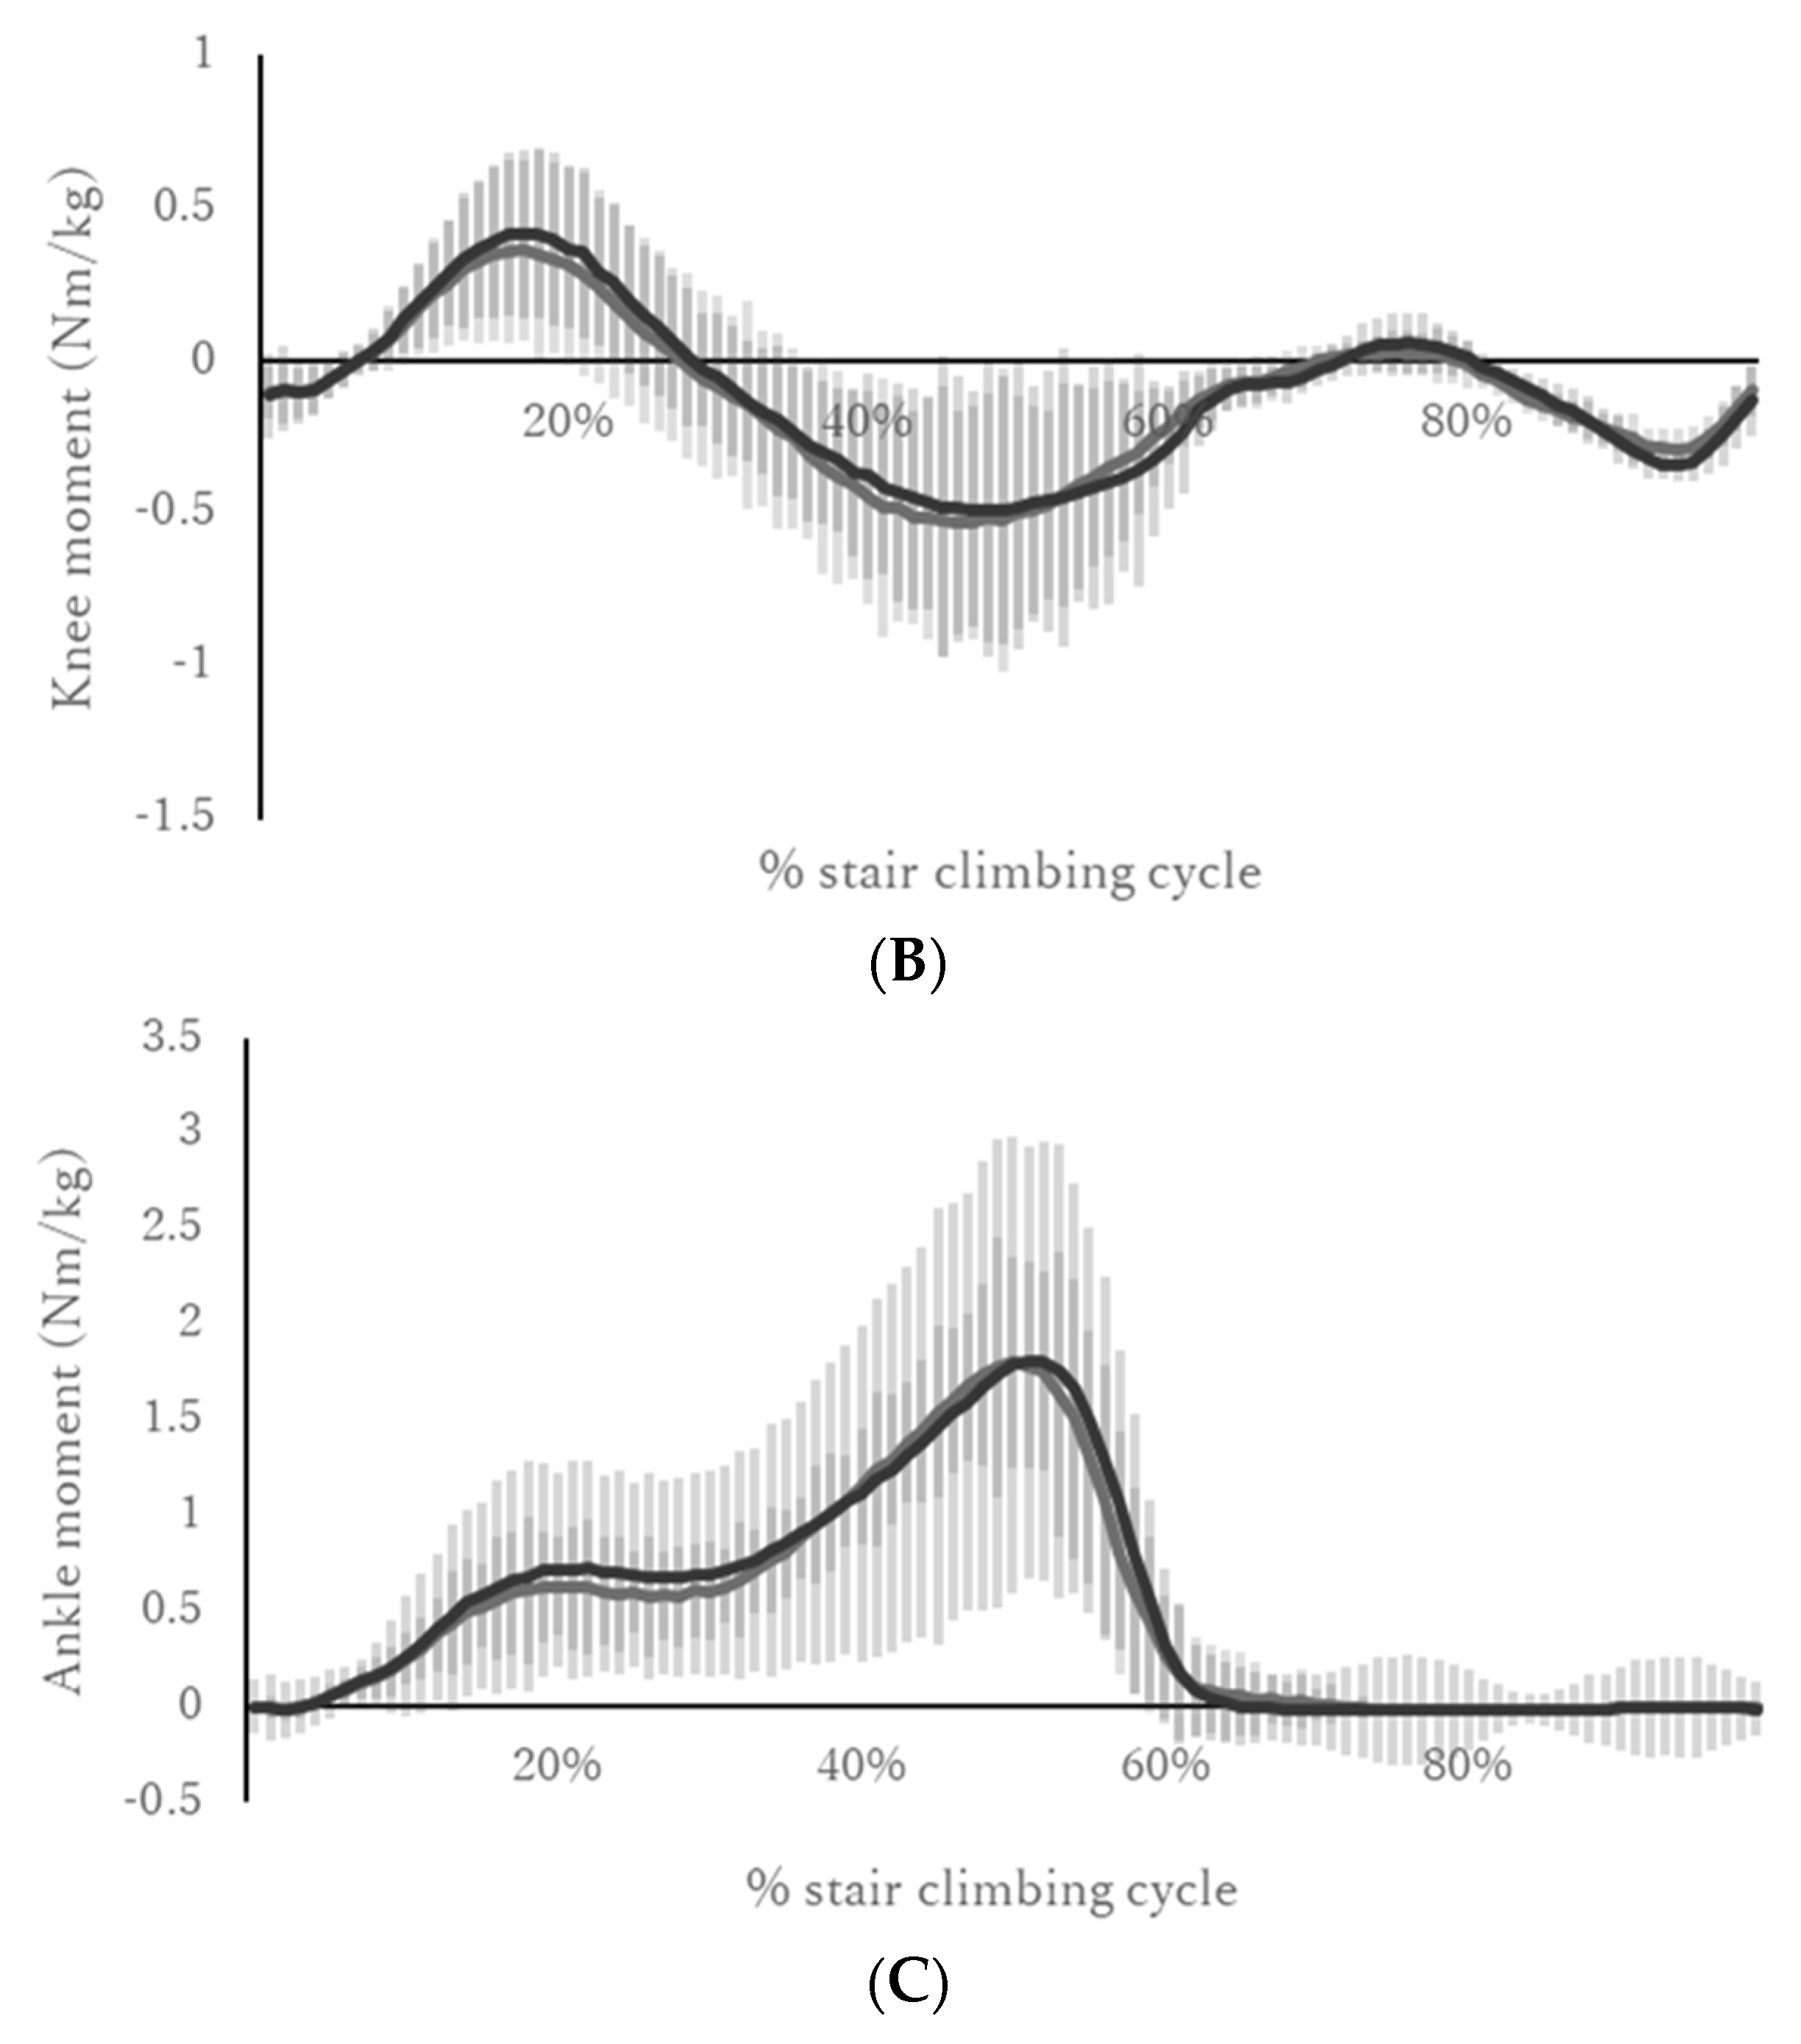
| ID | Knee Joint Moment (Nm/kg) | |||
| Maximum Extension | Maximum Flexion | |||
| Beginning Phase | End Phase | Beginning Phase | End Phase | |
| 1 | 0.57 | 0.48 | −0.84 | −0.80 |
| 2 | 0.51 | 0.52 | −0.58 | −0.58 |
| 4 | 0.14 | 0.15 | −0.90 | −0.78 |
| 5 | 0.18 | 0.26 | −0.77 | −0.79 |
| 6 | 0.74 | 0.82 | −0.66 | −0.61 |
| 7 | 0.75 | 0.77 | −0.57 | −0.55 |
| 8 | 0.12 | 0.21 | −0.48 | −0.39 |
| 9 | 0.71 | 0.51 | −0.36 | −0.52 |
| Mean | 0.46 | 0.47 | −0.65 | −0.63 |
| SD | 0.28 | 0.25 | 0.18 | 0.15 |
| 95% CI | −0.08, 0.082 | −0.05, 0.09 | ||
| p-value | 0.98 | 0.55 | ||
| ID | Ankle Joint Moment (Nm/kg) | |||
| Maximum Dorsiflexion | Maximum Plantarflexion | |||
| Beginning Phase | End Phase | Beginning Phase | End Phase | |
| 1 | −0.06 | −0.05 | 1.88 | 1.91 |
| 2 | −0.13 | −0.16 | 2.02 | 1.92 |
| 4 | −0.08 | −0.11 | 1.90 | 1.93 |
| 5 | −0.05 | −0.06 | 2.00 | 1.87 |
| 6 | −0.07 | −0.07 | 1.97 | 1.86 |
| 7 | −0.24 | −0.23 | 1.90 | 1.82 |
| 8 | −0.18 | −0.23 | 1.65 | 1.69 |
| 9 | −0.10 | −0.17 | 2.11 | 2.01 |
| Mean | −0.11 | −0.13 | 1.93 | 1.87 |
| SD | 0.07 | 0.07 | 0.14 | 0.09 |
| 95% CI | −0.12, 0.01 | −0.04, 0.001 | ||
| p-value | 0.06 | 0.07 | ||
Publisher’s Note: MDPI stays neutral with regard to jurisdictional claims in published maps and institutional affiliations. |
© 2022 by the authors. Licensee MDPI, Basel, Switzerland. This article is an open access article distributed under the terms and conditions of the Creative Commons Attribution (CC BY) license (https://creativecommons.org/licenses/by/4.0/).
Share and Cite
Yaguchi, H.; Sekiguchi, Y.; Honda, K.; Fukushi, K.; Huang, C.; Nakahara, K.; Zhenzhao, C.; Izumi, S.-I. Biomechanical Characteristics of Long Stair Climbing in Healthy Young Individuals in a Real-World Study Using a Wearable Motion Analysis System. Biomechanics 2022, 2, 601-612. https://doi.org/10.3390/biomechanics2040047
Yaguchi H, Sekiguchi Y, Honda K, Fukushi K, Huang C, Nakahara K, Zhenzhao C, Izumi S-I. Biomechanical Characteristics of Long Stair Climbing in Healthy Young Individuals in a Real-World Study Using a Wearable Motion Analysis System. Biomechanics. 2022; 2(4):601-612. https://doi.org/10.3390/biomechanics2040047
Chicago/Turabian StyleYaguchi, Haruki, Yusuke Sekiguchi, Keita Honda, Kenichiro Fukushi, Chenhui Huang, Kentaro Nakahara, Cheng Zhenzhao, and Shin-Ichi Izumi. 2022. "Biomechanical Characteristics of Long Stair Climbing in Healthy Young Individuals in a Real-World Study Using a Wearable Motion Analysis System" Biomechanics 2, no. 4: 601-612. https://doi.org/10.3390/biomechanics2040047