
Comparison of Three Single Leg Weightbearing Tasks with Statistical Parametric Mapping
 , ,
, , 
Abstract
:1. Introduction
2. Materials and Methods
2.1. Participants
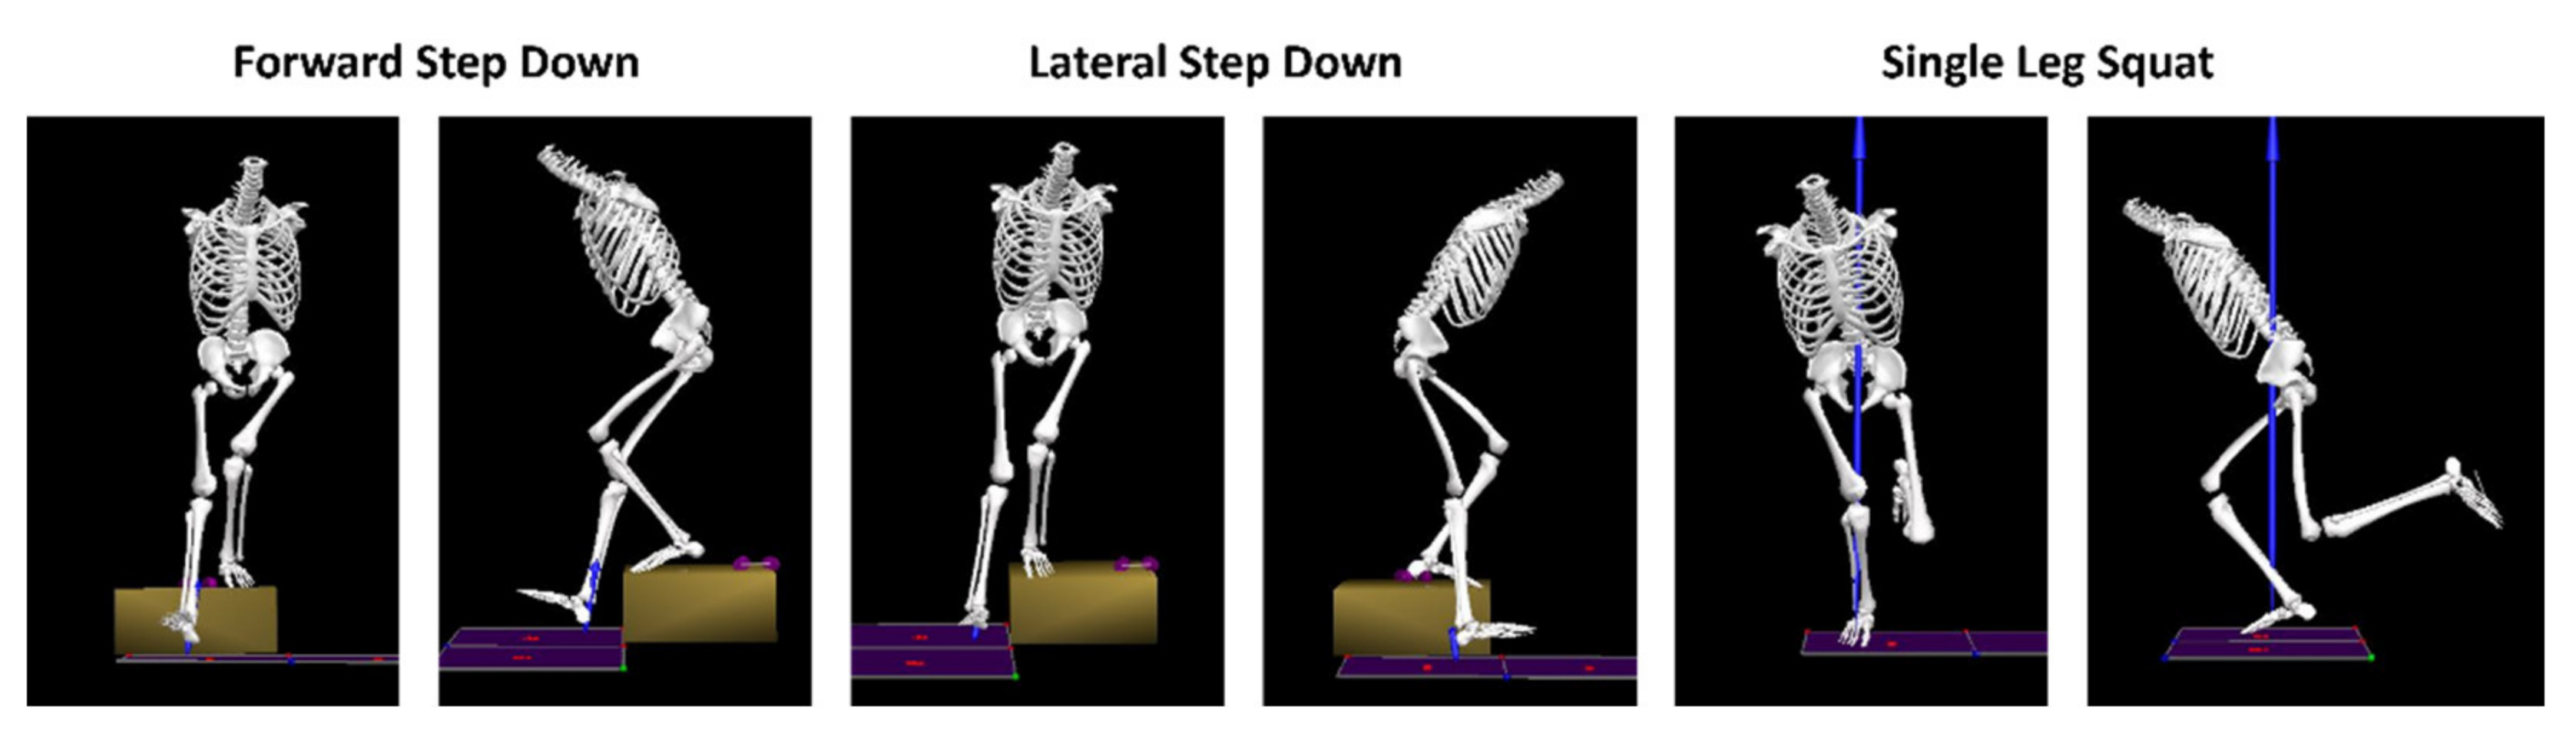
2.2. Procedures
2.3. Data Analysis
2.4. Statistical Analysis
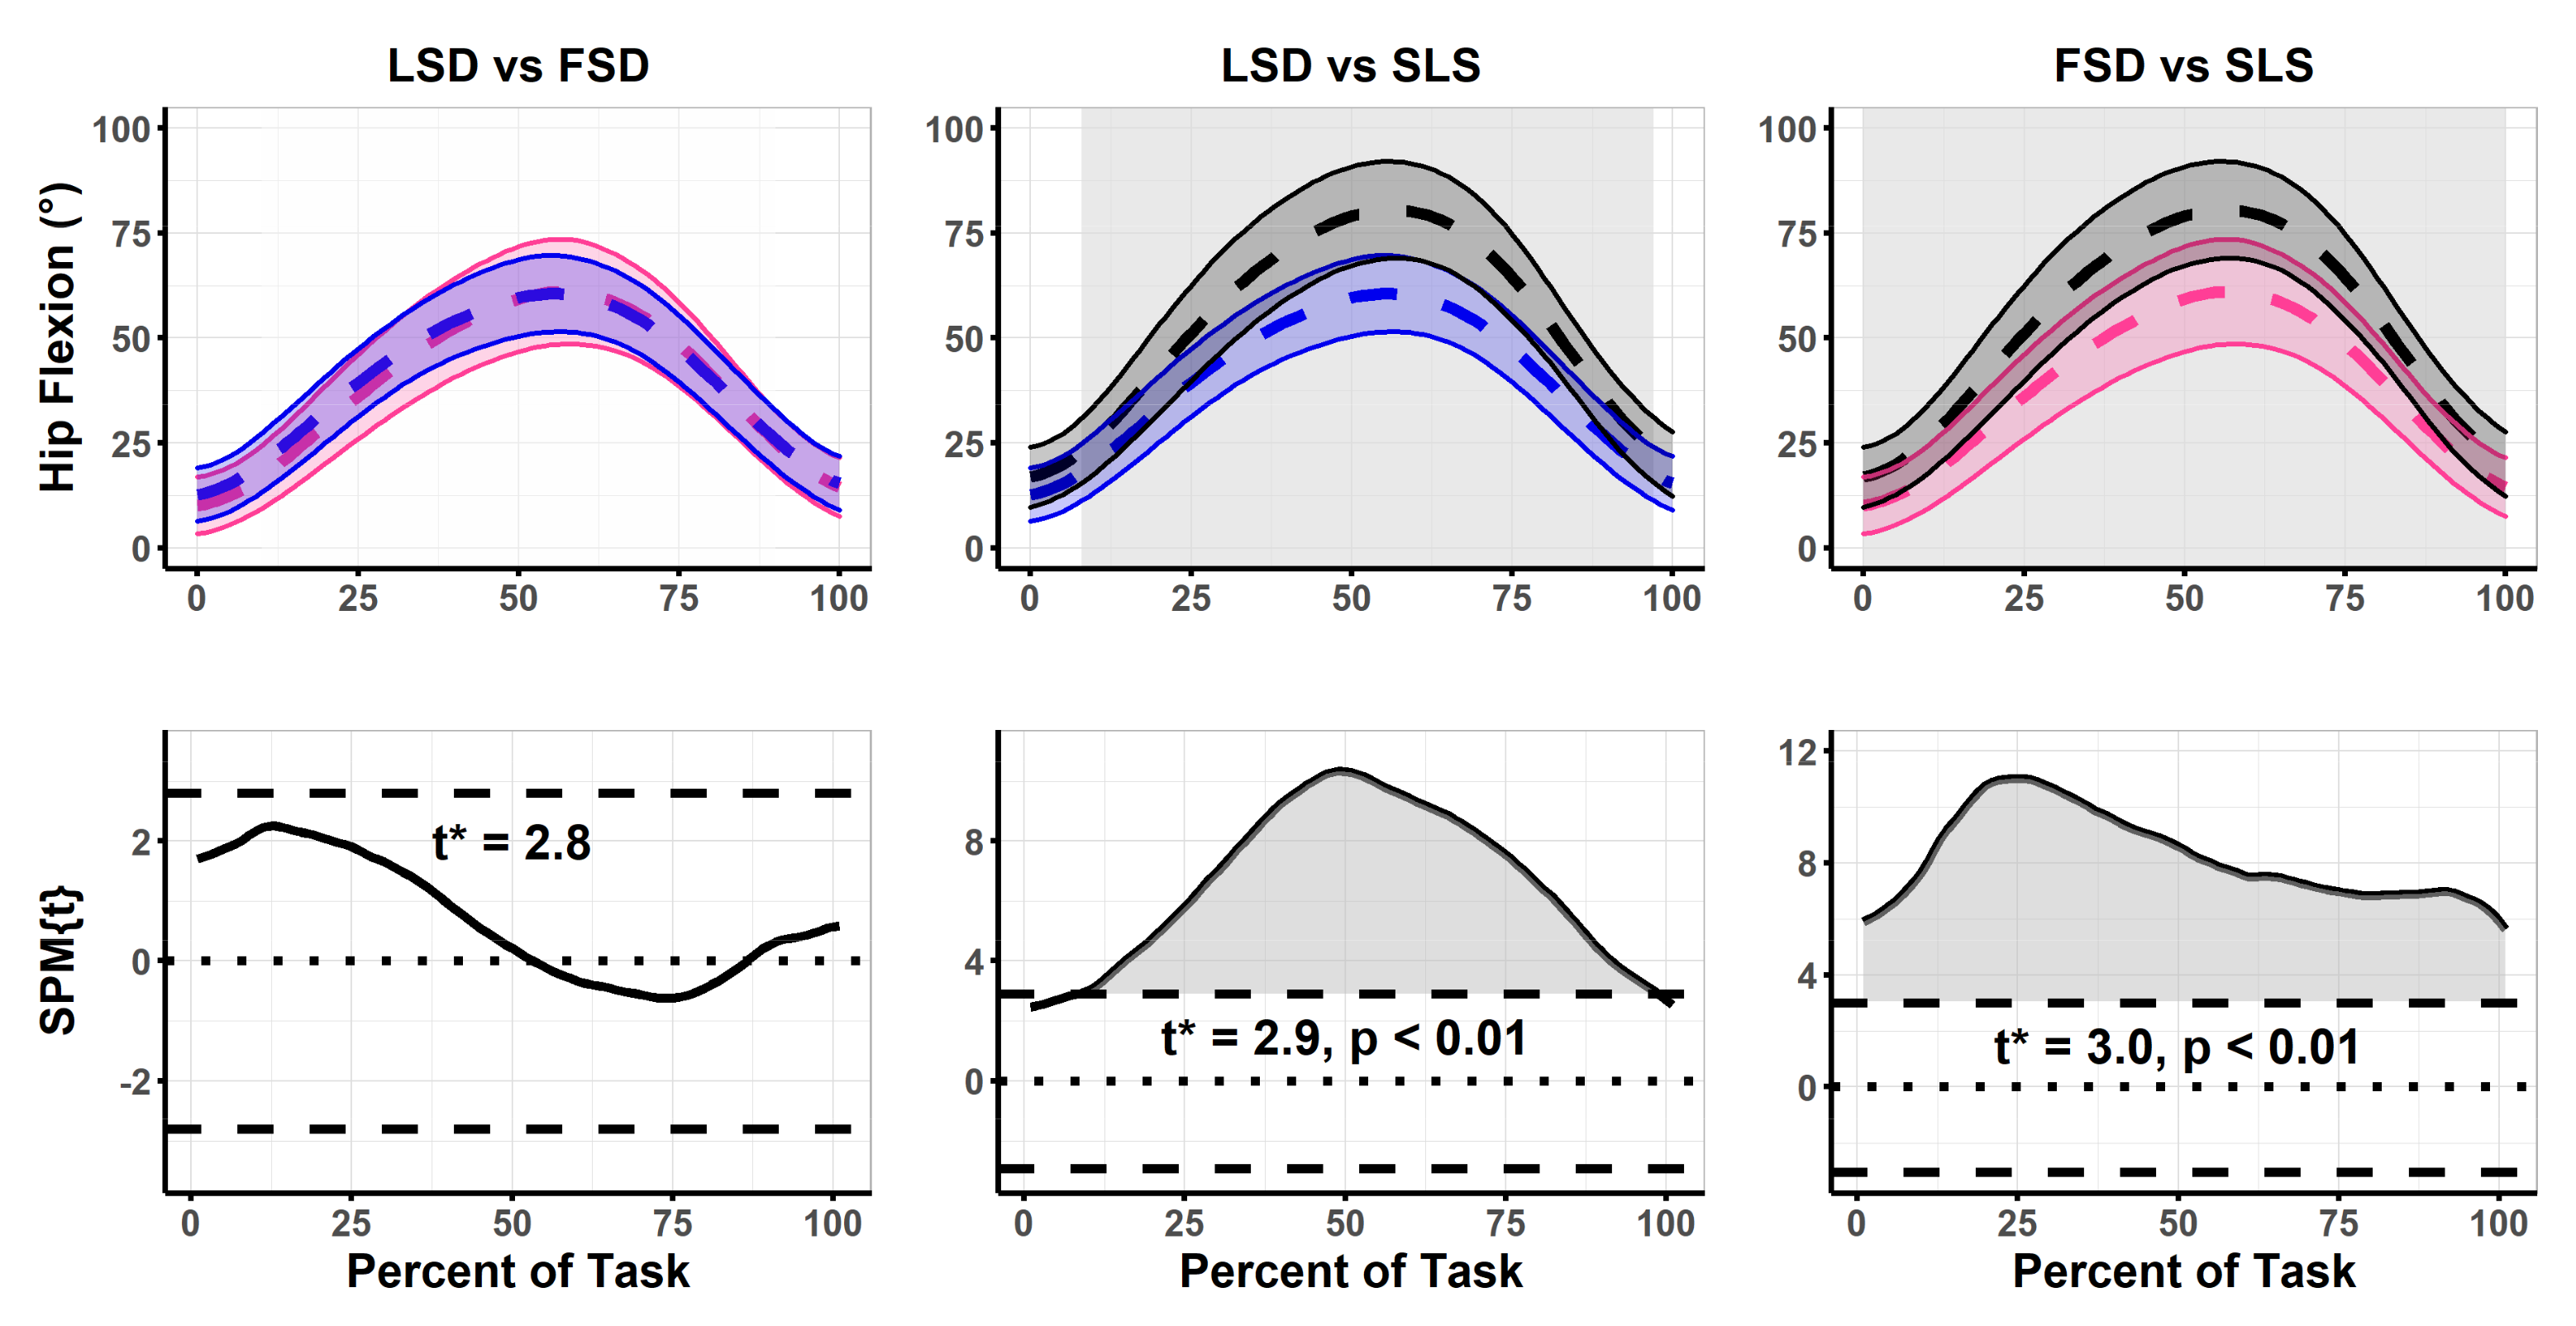
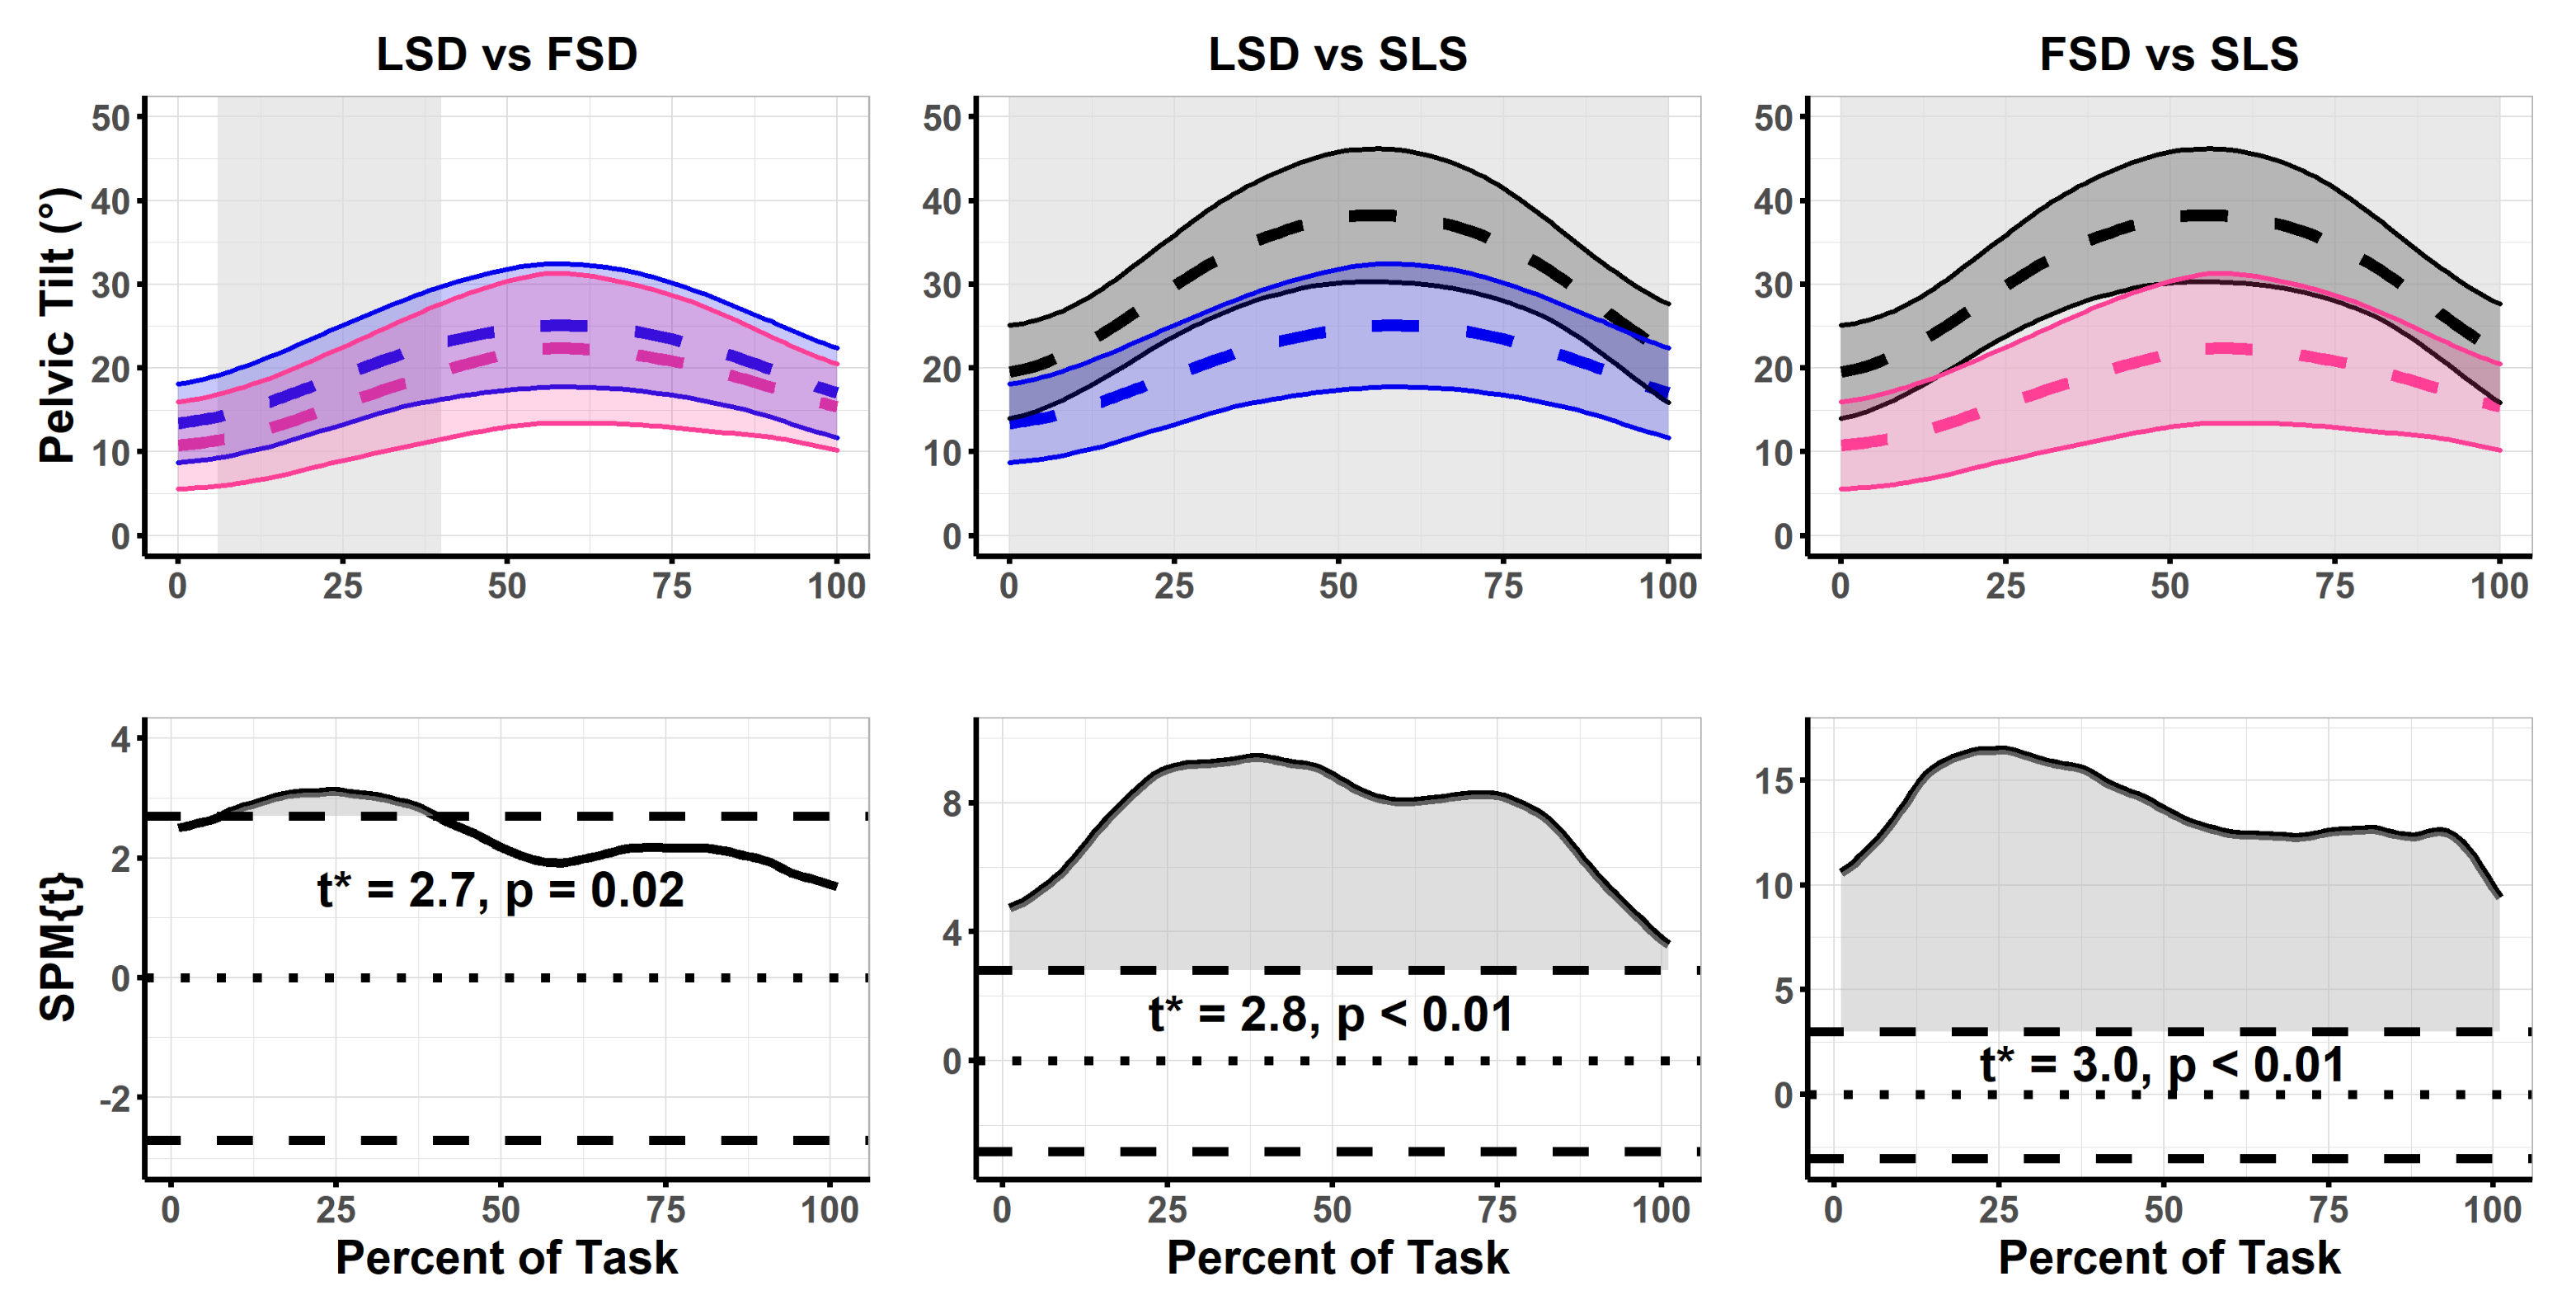
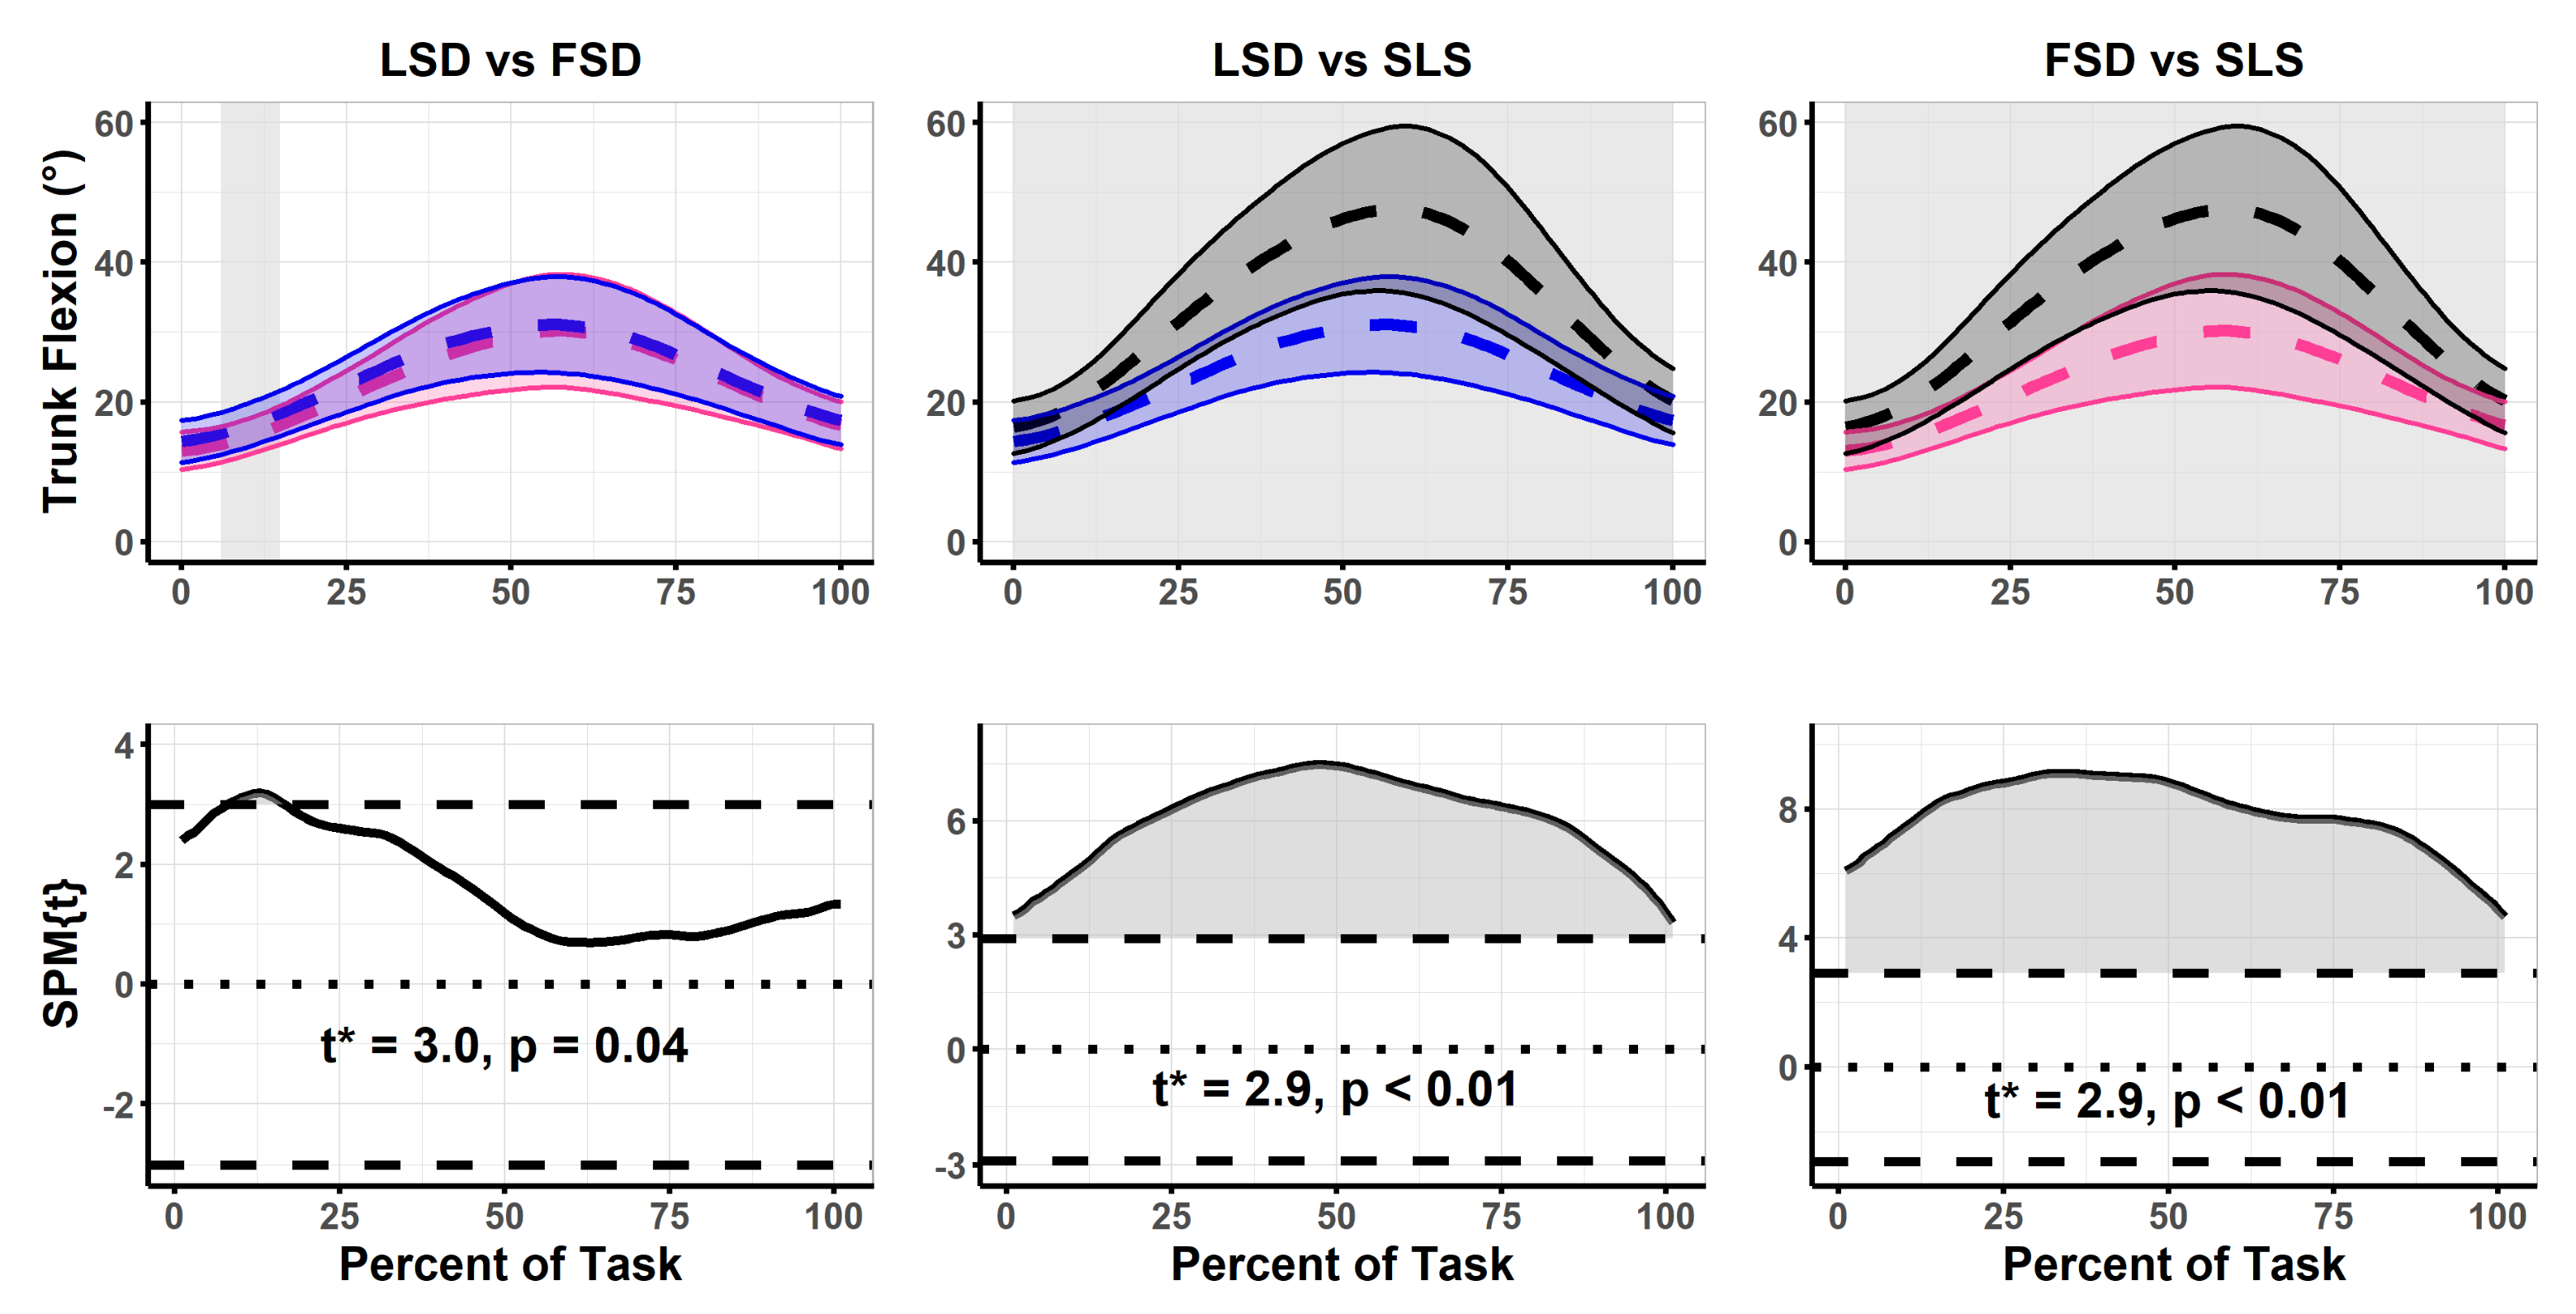
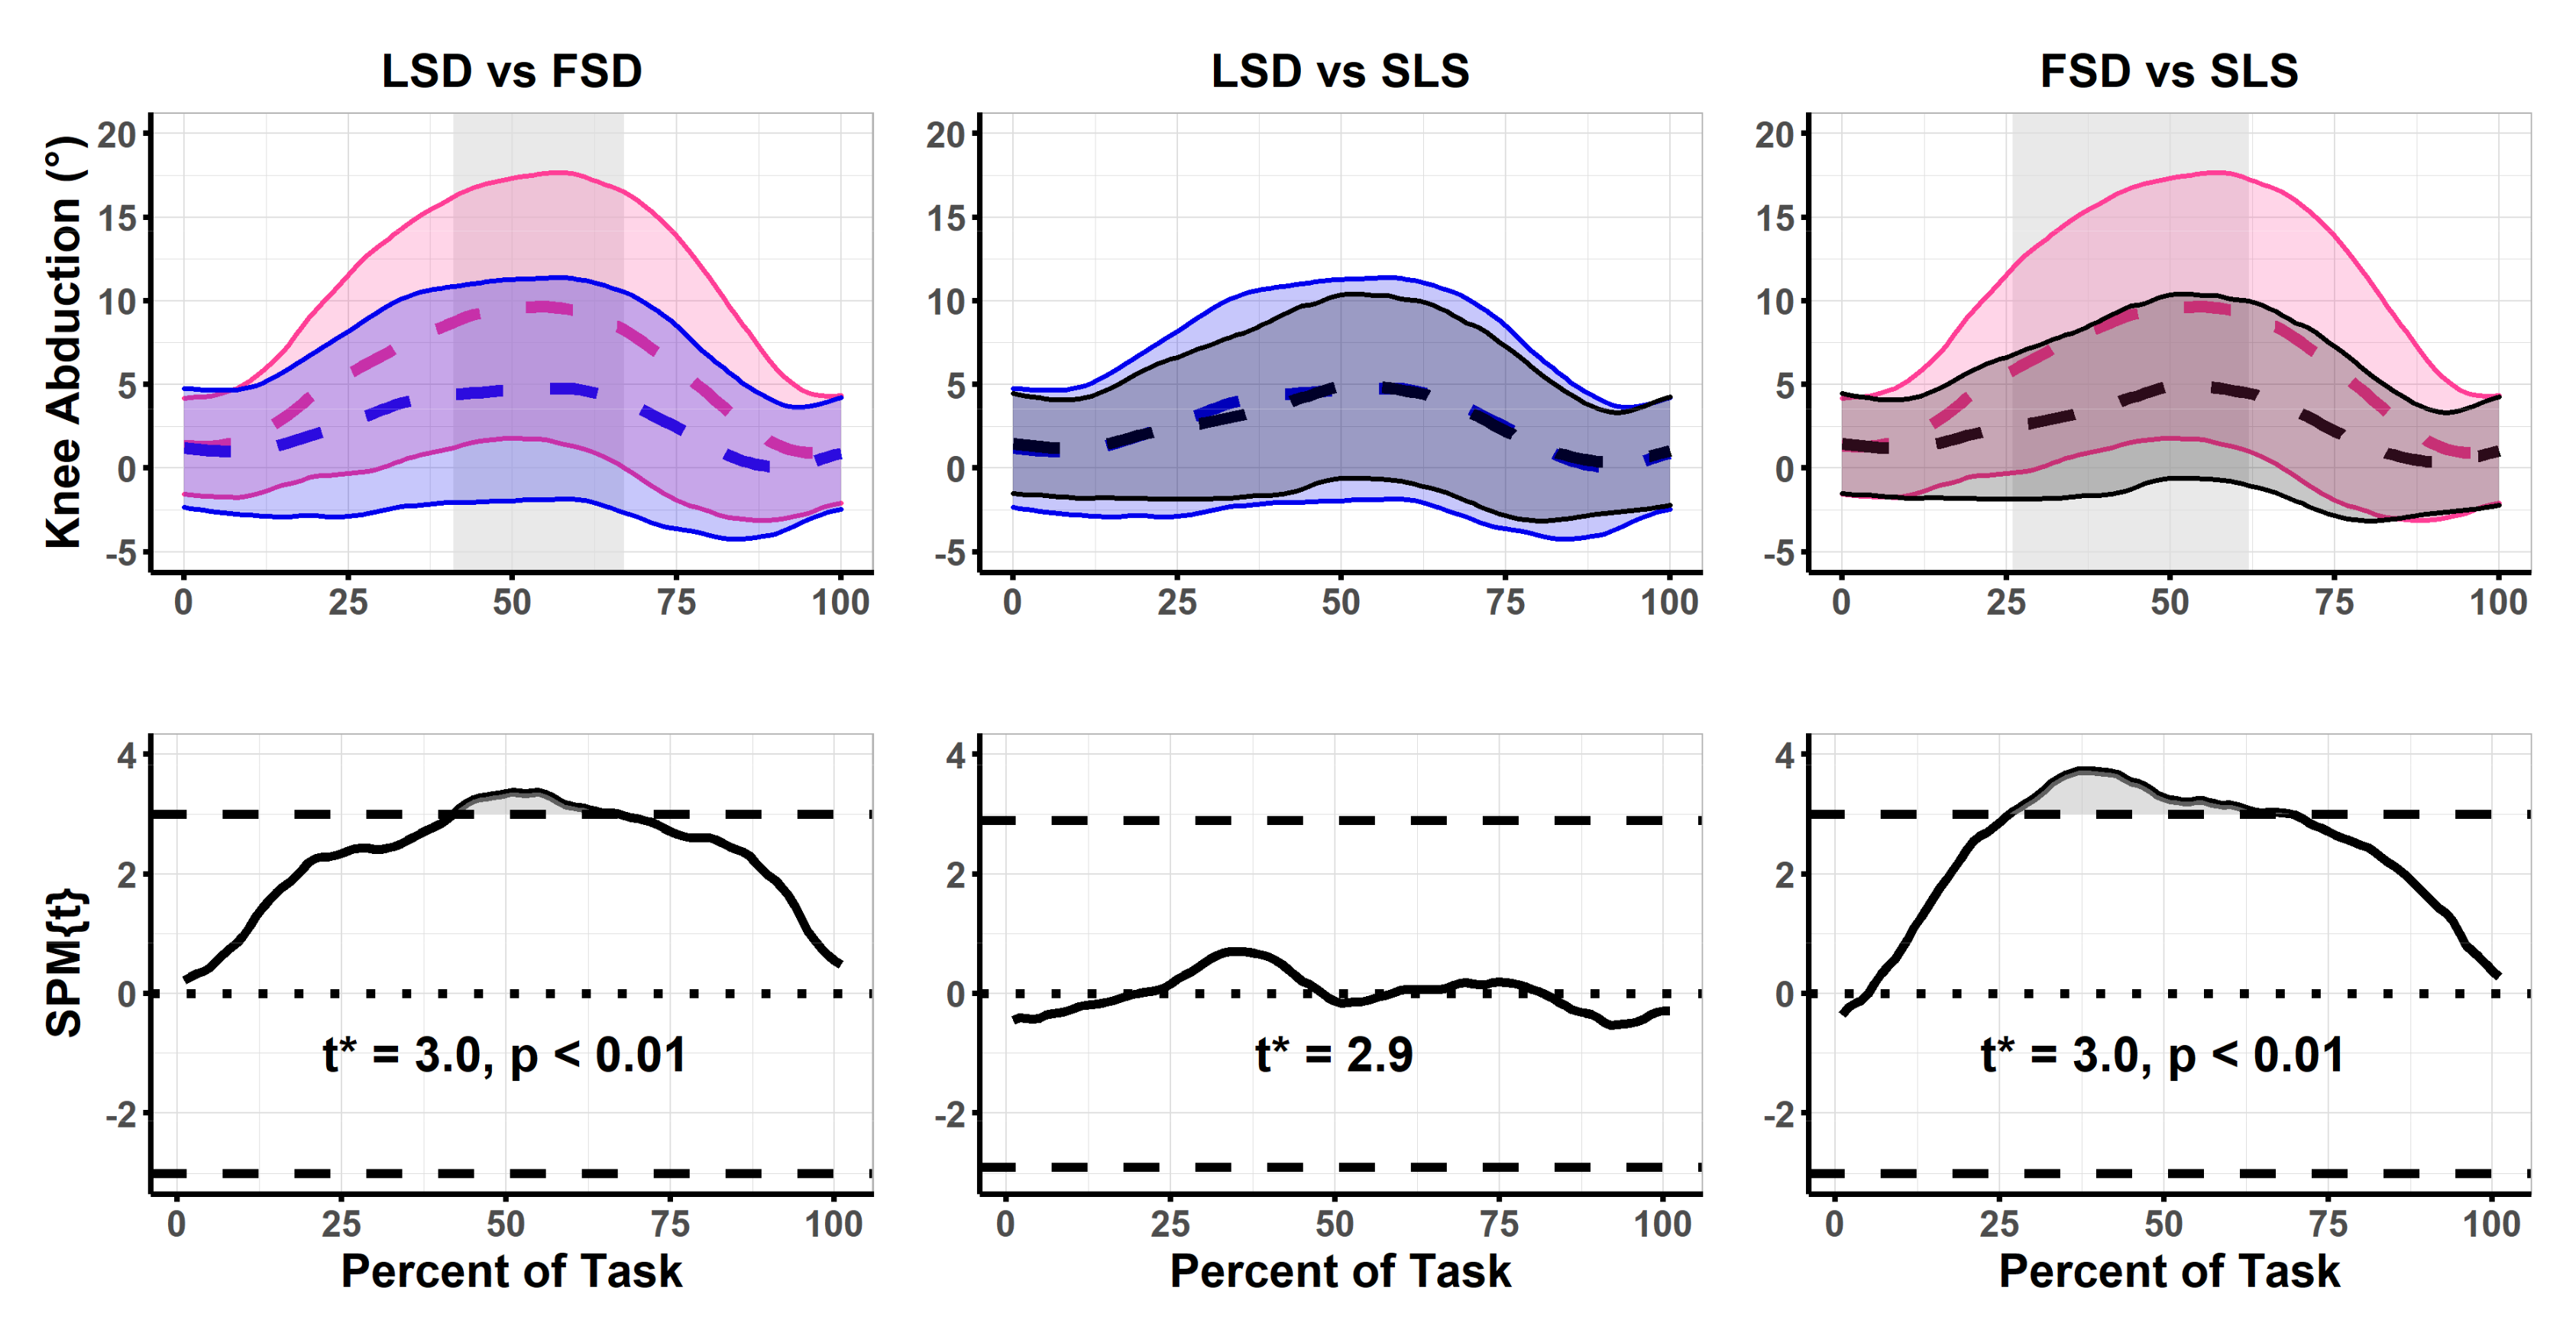
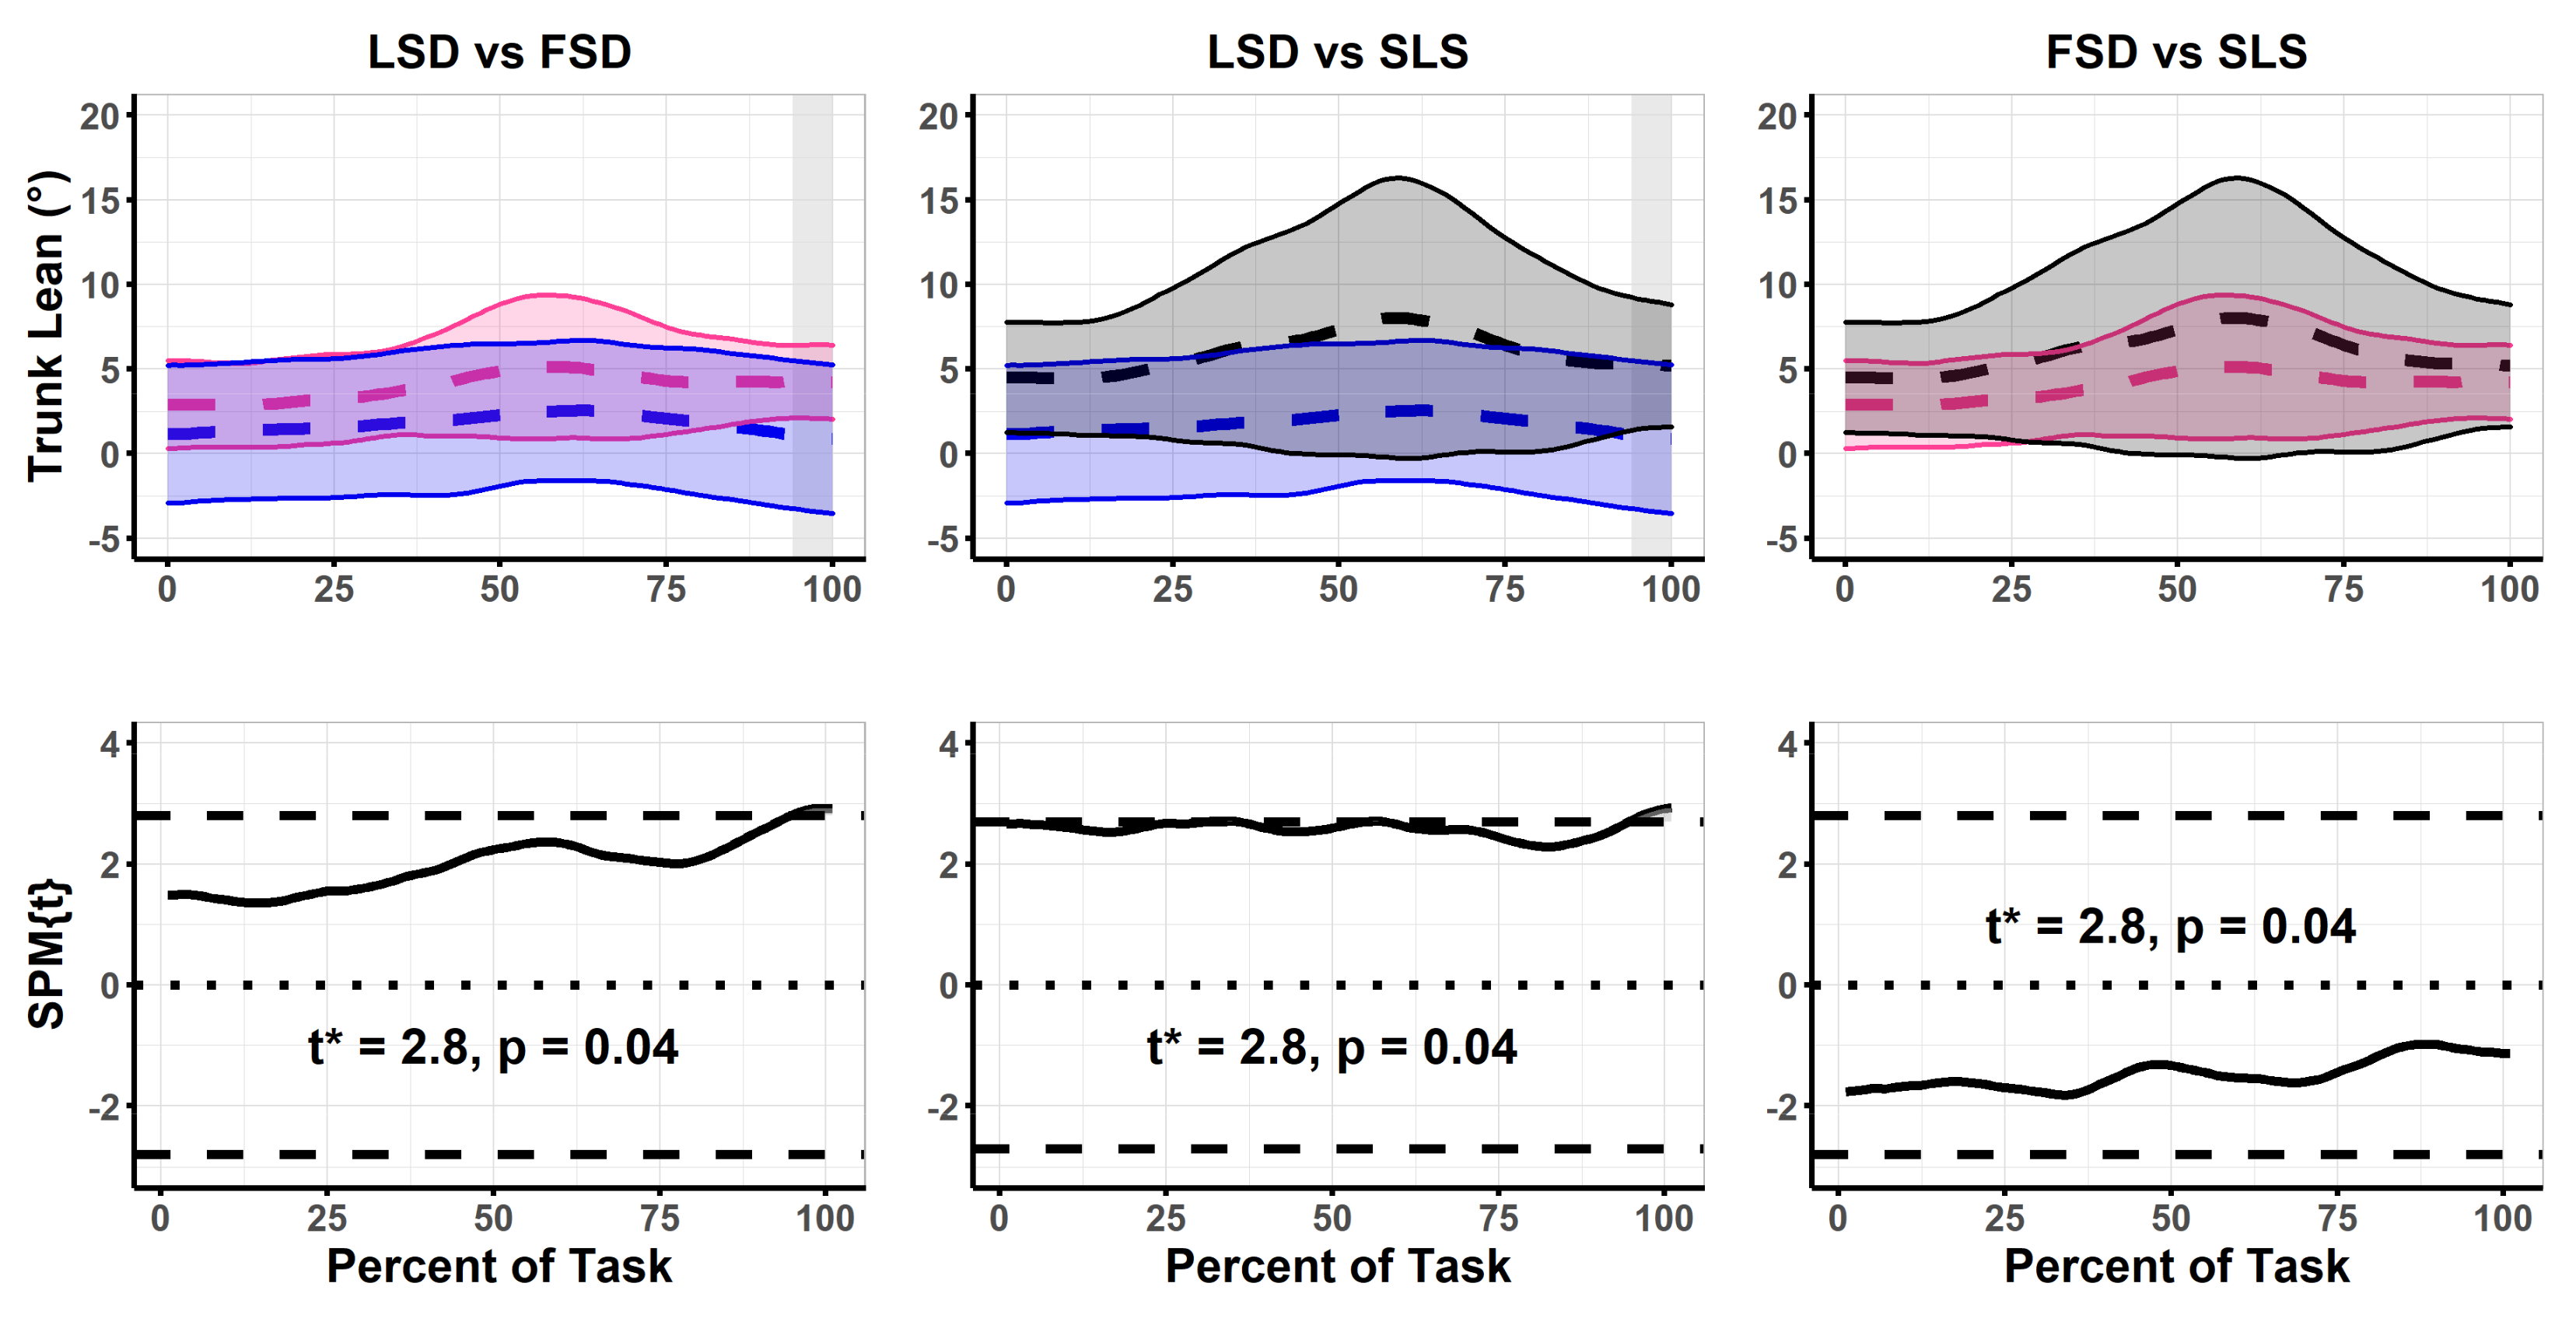
3. Results
4. Discussion
5. Conclusions
Author Contributions
Funding
Institutional Review Board Statement
Informed Consent Statement
Data Availability Statement
Conflicts of Interest
References
- Ressman, J.; Grooten, W.J.A.; Rasmussen Barr, E. Visual Assessment of Movement Quality in the Single Leg Squat Test: A Review and Meta-Analysis of Inter-Rater and Intrarater Reliability. BMJ Open Sport Exerc. Med. 2019, 5, e000541. [Google Scholar] [CrossRef]
- Rabin, A.; Portnoy, S.; Kozol, Z. The Association Between Visual Assessment of Quality of Movement and Three-Dimensional Analysis of Pelvis, Hip, and Knee Kinematics During a Lateral Step Down Test. Strength Cond. J. 2016, 30, 3204–3211. [Google Scholar] [CrossRef]
- Park, K.M.; Cynn, H.S.; Choung, S.D. Musculoskeletal Predictors of Movement Quality for the Forward Step-down Test in Asymptomatic Women. J. Orthop. Sports Phys. Ther. 2013, 43, 504–510. [Google Scholar] [CrossRef] [Green Version]
- Rabin, A.; Kozol, Z. Measures of range of motion and strength among healthy women with differing quality of lower extremity movement during the lateral step-down test. J. Orthop. Sports Phys. Ther. 2010, 40, 792–800. [Google Scholar] [CrossRef] [PubMed] [Green Version]
- Khuu, A.; Lewis, C.L. Position of the Non-Stance Leg During the Single Leg Squat Affects Females and Males Differently. Hum. Mov. Sci. 2019, 67, 102506. [Google Scholar] [CrossRef] [PubMed]
- Lewis, C.L.; Foch, E.; Luko, M.M.; Loverro, K.L.; Khuu, A. Differences in lower extremity and trunk kinematics between single leg squat and step down tasks. PLoS ONE 2015, 10, e0126258. [Google Scholar] [CrossRef] [PubMed]
- Werner, D.M.; Davis, R.W.; Hinton, A.; Price, S.K.; Rowland, J.L.; Barrios, J.A. Three-Dimensional Joint Kinematic and Two-Dimensional Quality of Movement Comparison Between Lateral and Forward Step-Downs. Phys. Ther. Sport 2021, 52, 162–167. [Google Scholar] [CrossRef]
- Olivier, B.; Quinn, S.L.; Benjamin, N.; Green, A.C.; Chiu, J.; Wang, W. Single-Leg Squat Delicacies-the Position of the Nonstance Limb is an Important Consideration. J. Sport Rehabil. 2019, 28, 318–324. [Google Scholar] [CrossRef] [PubMed] [Green Version]
- Khuu, A.; Foch, E.; Lewis, C.L. Not All Single Leg Squats Are Equal: A Biomechanical Comparison of Three Variations. Int. J. Sports Phys. Ther. 2016, 11, 201–211. [Google Scholar]
- Chen, S.; Chang, W.D.; Wu, J.Y.; Fong, Y.C. Electromyographic Analysis of Hip and Knee Muscles During Specific Exercise Movements in Females with Patellofemoral Pain Syndrome an Observational Study. Medicine 2018, 97, e11424. [Google Scholar] [CrossRef]
- Kulas, A.S.; Hortobágyi, T.; Devita, P. Trunk Position Modulates Anterior Cruciate Ligament Forces and Strains During a Single-leg Squat. Clin. Biomech. 2012, 27, 16–21. [Google Scholar] [CrossRef]
- Boden, B.P.; Sheehan, F.T.; Torg, J.S.; Hewett, T.E. Non-Contact ACL Injuries: Mechanisms and Risk Factors. J. Am. Acad. Orthop. Surg. 2010, 18, 520–527. [Google Scholar] [CrossRef] [Green Version]
- Ford, K.R.; Myer, G.D.; Hewett, T.E. Valgus knee motion during landing in high school female and male basketball players. Med. Sci. Sports Exerc. 2003, 35, 1745–1750. [Google Scholar] [CrossRef] [PubMed] [Green Version]
- Hollman, J.H.; Galardi, C.M.; Lin, I.H.; Voth, B.C.; Whitmarsh, C.L. Frontal and transverse plane hip kinematics and gluteus maximus recruitment correlate with frontal plane knee kinematics during single-leg squat tests in women. Clin. Biomech. 2014, 29, 468–474. [Google Scholar] [CrossRef] [PubMed]
- Claiborne, T.L.; Armstrong, C.W.; Gandhi, V.; Pincivero, D.M. Relationship Between Hip and Knee Strength and Knee Valgus During a Single Leg Squat. J. Appl. Biomech. 2006, 22, 41–50. [Google Scholar] [CrossRef] [PubMed] [Green Version]
- Pataky, T.C.; Robinson, M.A.; Vanrenterghem, J. Vector Field Statistical Analysis of Kinematic and Force Trajectories. J. Biomech. 2013, 46, 2394–2401. [Google Scholar] [CrossRef] [PubMed] [Green Version]
- Pataky, T.C.; Robinson, M.A.; Vanrenterghem, J. Region-of-interest analyses of one-dimensional biomechanical trajectories: Bridging 0D and 1D theory, augmenting statistical power. PeerJ 2016, 4, e2652. [Google Scholar] [CrossRef] [PubMed] [Green Version]
- Pataky, T.C.; Vanrenterghem, J.; Robinson, M.A. The Probability of False Positives in Zero-Dimensional Analyses of One-Dimensional Kinematic, Force and EMG Trajectories. J. Biomech. 2016, 49, 1468–1476. [Google Scholar] [CrossRef] [Green Version]
- Pataky, T.C. Generalized N-dimensional Biomechanical Field Analysis Using Statistical Parametric Mapping. J. Biomech. 2010, 43, 1976–1982. [Google Scholar] [CrossRef]
- Papi, E.; Bull, A.M.J.; McGregor, A.H. Alteration of Movement Patterns In Low Back Pain Assessed by Statistical Parametric Mapping. J. Biomech. 2020, 100, 109597. [Google Scholar] [CrossRef]
- Carcia, C.R.; Cacolice, P.A.; McGeary, S. Defining Lower Extremity Dominance: The Relationship Between Preferred Lower Extremity and two Functional Tasks. Int. J. Sports Phys. Ther. 2019, 14, 188–191. [Google Scholar] [CrossRef] [PubMed]
- Van Melick, N.; Meddeler, B.M.; Hoogeboom, T.J.; Nijhuis-van der Sanden, M.W.G.; van Cingel, R.E.H. How to Determine Leg Dominance: The Agreement Between Self-reported and Observed Performance in Healthy Adults. PLoS ONE 2017, 12, e0189876. [Google Scholar] [CrossRef] [PubMed] [Green Version]
- Pohl, M.B.; Lloyd, C.; Ferber, R. Can the Reliability of Three-Dimensional Running Kinematics be Improved Using Functional Joint Methodology? Gait Posture 2010, 32, 559–563. [Google Scholar] [CrossRef] [PubMed]
- Lopes Ferreira, C.; Barton, G.; Delgado Borges, L.; dos Anjos Rabelo, N.D.; Politti, F.; Garcia Lucareli, P.R. Step Down Tests are the Tasks That Most Differentiate the Kinematics of Women With Patellofemoral Pain Compared to Asymptomatic Controls. Gait Posture 2019, 72, 129–134. [Google Scholar] [CrossRef]
- Baker, R. Pelvic Angles: A Mathematically Rigorous Definition Which is Consistent With a Conventional Clinical Understanding of the Terms. Gait Posture 2001, 13, 1–6. [Google Scholar] [CrossRef]
- Pataky, T.C. One-dimensional Statistical Parametric Mapping in Python. Comput. Methods Biomech. Biomed. Eng. 2012, 15, 295–301. [Google Scholar] [CrossRef]
- Pataky, T.C.; Vanrenterghem, J.; Robinson, M.A. Zero- vs. One-dimensional, Parametric vs. Non-parametric, and Confidence Interval vs. Hypothesis Testing Procedures in One-dimensional Biomechanical Trajectory Analysis. J. Biomech. 2015, 48, 1277–1285. [Google Scholar] [CrossRef] [Green Version]
- Ugalde, V.; Brockman, C.; Bailowitz, Z.; Pollard, C.D. Single Leg Squat Test and Its Relationship to Dynamic KneeValgus and Injury Risk Screening. PM R 2015, 7, 229–235. [Google Scholar] [CrossRef]
- Crossley, K.M.; Zhang, W.J.; Schache, A.G.; Bryant, A.; Cowan, S.M. Performance on the Single-leg Squat Task Indicates Hip Abductor Muscle Function. Am. J. Sport Med. 2011, 39, 866–873. [Google Scholar] [CrossRef]
- Harris-Hayes, M.; Hillen, T.J.; Commean, P.K.; Harris, M.D.; Mueller, M.J.; Clohisy, J.C.; Salsich, G.B. Hip Kinematics during Single Leg Tasks in People with and without Hip-Related Groin Pain and the Association among Kinematics, Hip Muscle Strength and Bony Morphology. J. Orthop. Sport. Phys. Ther. 2020, 50, 243–251. [Google Scholar] [CrossRef]
- Hatfield, G.L.; Charlton, J.M.; Cochrane, C.K.; Hammond, C.A.; Napier, C.; Takacs, J.; Krowchuk, N.M.; Hunt, M.A. The Biomechanical Demands on the Hip During Progressive Stepping Tasks. J. Strength Cond. 2016, 31, 3444–3453. [Google Scholar] [CrossRef] [PubMed]
- Clohisy, J.C.; Knaus, E.R.; Hunt, D.M.; Lesher, J.M.; Harris-Hayes, M.; Prather, H. Clinical Presentation of Patients With Symptomatic Anterior Hip Impingement. In Clinical Orthopaedics and Related Research; Springer: New York, NY, USA, 2009; Volume 467, pp. 638–644. [Google Scholar]
- Hartmann, H.; Wirth, K.; Klusemann, M.; Dalic, J.; Matuschek, C.; Schmidtbleicher, D. Influence of Squatting Depth on Jumping Performance. J. Strength Cond. Res. 2012, 26, 3243–3261. [Google Scholar] [CrossRef] [PubMed] [Green Version]
- McGovern, R.P.; Martin, R.L.; Christoforetti, J.J.; Kivlan, B.R. Evidence-Based Procedures for Performing the Sinigle Leg Squat and Step-Down Tests in Evaluation of Non-Arthritic Hip Pain: A Literature Review. Int. J. Sports Phys. Ther. 2018, 13, 526–536. [Google Scholar] [CrossRef]
- Da Costa, G.V.; de Castro, M.P.; Sanchotene, C.G.; Ribeiro, D.C.; de Brito Fontana, H.; Ruschel, C. Relationship Between Passive Ankle Dorsiflexion Range, Dynamic Ankle Dorsiflexion Range and Lower Limb and Trunk Kinematics During the Single-leg Squat. Gait Posture 2021, 86, 106–111. [Google Scholar] [CrossRef] [PubMed]
- Kluger, D.; Major, M.J.; Fatone, S.; Gard, S.A. The Effect of Trunk Flexion on Lower-Limb Kinetics of Able-bodied Gait. Hum. Mov. Sci. 2014, 33, 395–403. [Google Scholar] [CrossRef]
- Mitchell, K.; Porter, M.; Anderson, L.; Phillips, C.; Arceo, G.; Montz, B.; Levy, S.; Gombatto, S.P. Differences in Lumbar Spine and Lower Extremity Kinematics in People with and Without Low Back Pain During a Step-up Task: A cross-sectional study. BMC Musculoskelet. Disord. 2017, 18, 369. [Google Scholar] [CrossRef] [PubMed]
- Takacs, J.; Hunt, M.A. The Effect of Contralateral Pelvic Drop and Trunk Lean on Frontal Plane Knee Biomechanics during Single Limb Standing. J. Biomech. 2012, 45, 2791–2796. [Google Scholar] [CrossRef] [PubMed]
- Pompeo, K.D.; da Rocha, E.S.; Morales, A.B.; Klein, K.D.; Vaz, M.A. Does Forward Step-down Task Frontal Kinematics Differ in Women with and Without Patellofemoral pain? A Cross-sectional Study. Sport Sci. Health 2021, 18. [Google Scholar] [CrossRef]
- Martonick, N.J.P.; Chun, Y.; Krumpl, L.; Bailey, J. Lower Extremity Kinematic Waveform Analysis During a Single Leg Drop Task—A Single Subject Approach. J. Sports Phys Ther. in press. [CrossRef]
- Leardini, A.; Biagi, F.; Merlo, A.; Belvedere, C.; Benedetti, M.G. Multi-Segment Trunk Kinematics During Locomotion and Elementary Exercises. Clin Biomech. 2011, 26, 562–571. [Google Scholar] [CrossRef] [PubMed]


Publisher’s Note: MDPI stays neutral with regard to jurisdictional claims in published maps and institutional affiliations. |
© 2022 by the authors. Licensee MDPI, Basel, Switzerland. This article is an open access article distributed under the terms and conditions of the Creative Commons Attribution (CC BY) license (https://creativecommons.org/licenses/by/4.0/).
Share and Cite
Martonick, N.J.P.; McGowan, C.P.; Baker, R.T.; Larkins, L.W.; Seegmiller, J.G.; Bailey, J.P. Comparison of Three Single Leg Weightbearing Tasks with Statistical Parametric Mapping. Biomechanics 2022, 2, 591-600. https://doi.org/10.3390/biomechanics2040046
Martonick NJP, McGowan CP, Baker RT, Larkins LW, Seegmiller JG, Bailey JP. Comparison of Three Single Leg Weightbearing Tasks with Statistical Parametric Mapping. Biomechanics. 2022; 2(4):591-600. https://doi.org/10.3390/biomechanics2040046
Chicago/Turabian StyleMartonick, Nickolai J. P., Craig P. McGowan, Russell T. Baker, Lindsay W. Larkins, Jeff G. Seegmiller, and Joshua P. Bailey. 2022. "Comparison of Three Single Leg Weightbearing Tasks with Statistical Parametric Mapping" Biomechanics 2, no. 4: 591-600. https://doi.org/10.3390/biomechanics2040046