Article

Optimization of a Solid-Phase Extraction Procedure for the Separation of Picrocrocin and Crocins from Saffron Extract

by
Panagiota-Kyriaki Revelou
1,2,
Eleni Kougianou
1,
Marinos Xagoraris
1,
Haralambos Evangelaras
3,
George K. Papadopoulos
4,
Charalabos D. Kanakis
1,
Irini F. Strati
2,
Christos S. Pappas
1 and
Petros A. Tarantilis
1,*
1
Laboratory of Chemistry, Department of Food Science and Human Nutrition, Agricultural University of Athens EU-CONEXUS European University, 11855 Athens, Greece
2
Department of Food Science and Technology, University of West Attica, Ag. Spyridonos str, Egaleo, 12243 Athens, Greece
3
Department of Statistics and Insurance Science, University of Piraeus, 80 Karaoli & Dimitriou st., 18534 Piraeus, Greece
4
Institute for Design and Analysis of Experiments, University Research Center, Agricultural University of Athens EU-CONEXUS European University, Iera Odos 75, 11855 Athens, Greece
*
Author to whom correspondence should be addressed.
Compounds 2023, 3(1), 233-243; https://doi.org/10.3390/compounds3010019
Submission received: 31 January 2023 / Revised: 25 February 2023 / Accepted: 6 March 2023 / Published: 9 March 2023

Abstract

:
Saffron is a spice derived from the flower of Crocus sativus used as a flavoring and coloring agent in the food industry which also possesses medicinal properties. In the current study, the optimum Solid Phase Extraction (SPE) conditions for separating picrocrocin and crocins from aqueous saffron extracts were investigated, using Rotatable-Central Composite Design (RCCD) in combination with Response Surface Methodology (RSM). The optimized factors were volume of saffron extract (3 mL), elution solvent (15% v/v ACN/water for picrocrocin; and 50% v/v ACN/water for crocins), and volume of elution solvent (ACN/water) (10 mL). The response factor measured was the UV-Vis absorbance. The presence of picrocrocin and crocins in the solutions obtained from SPE was confirmed using Ultra-Performance Liquid Chromatography Quadrupole Time-of-Flight Mass Spectrometry (UPLC-QToF-MS). The above optimized SPE procedure provides economy in reagents and consumables.

1. Introduction

Saffron is derived from the dried stigmas of Crocus sativus L., a perennial herb, that belongs to the Iridaceae family [1]. It is mainly used as a natural flavoring and coloring agent in the food sector. The key ingredients in saffron are crocins (water-soluble coloring pigments), picrocrocin (a colorless monoterpene glycoside that produces the bitter taste of saffron), and safranal (a cyclical monoterpene aldehyde that produces the saffron aroma) [2,3]. Many studies have investigated the medicinal properties of saffron, and have been found to include cancer-preventive properties [4], nervous system improvements [5,6], cardioprotective qualities [7], and anti-aging effects [8].
The international standard ISO 3632-1:2011 [9] states that the quality of saffron can be evaluated by the absorbance of a 1% aqueous saffron solution at 257 nm for picrocrocin, 330 nm for safranal, and 440 nm for crocins. Crocins are glycosyl and gentiobiosyl esters of crocetin [2]. The quality of saffron’s color is largely determined by the crocins content [10]. Consequently, strongly colored saffron samples tend to contain higher levels of crocins, which suggests strong absorption at 440 nm.
Similarly, the strength of saffron’s flavor depends on its picrocrocin content. The higher the picrocrocin absorbance at 257 nm, the stronger the saffron flavor [3]. Various analytical processes have been developed for the examination of the primary components of saffron, in addition to the colorimetric approach suggested by ISO 3632-1:2011. These include the use of high-performance liquid chromatography [11,12], liquid chromatography coupled with mass spectrometric detection [13,14], high-resolution mass spectrometry [15], thin-layer chromatography [16], gas chromatography [17], near-infrared spectroscopy [18], and capillary electrophoresis [19].
Several analytical methodologies have been developed to separate the key constituents of saffron, the most commonly used being solvents such as water, diethyl ether, ethanol, and methanol [15,16,20,21]. Extraction techniques include supercritical fluid extraction [22], microwave-assisted extraction [23], ultrasonic solvent extraction [24], hydrodistillation [24], subcritical water extraction [25], vacuum headspace [11], and microsimultaneous hydrodistillation [26]. The key bioactive elements of saffron must be purified and identified when the extract is obtained. Solid Phase Extraction (SPE) is an effective sample purification technique that targets analytes of interest and results in a cleaner sample. Additionally, it allows for the processing of multiple samples simultaneously [27]. Nonetheless, despite these advantages, the application of SPE in saffron samples is limited to the extraction of flavonoids [28] and picrocrocin [29]. RSM, which considers and assesses the interacting impacts of variables, can be used to optimize SPE parameters. This approach is largely based on the use of mathematics and statistics to determine the ideal response conditions while also minimizing the time required for the analysis [30,31,32].
Based on the information presented above, this work aims to establish the optimized conditions for separating and simultaneously obtaining the highest UV-Vis absorbance for picrocrocin and crocins from a saffron extract. In line with this, an RCCD was applied alongside RSM. Moreover, Ultra-Performance Liquid Chromatography Quadrupole Time-of-Flight Mass Spectrometry (UPLC-QToF-MS) was used to confirm the presence of picrocrocin and crocins in the obtained SPE solutions.

2. Materials and Methods

2.1. Samples

Dried red stigmas from saffron (21 samples) were offered by the “Cooperative of Saffron producers, Kozani Greece” and collected from 2018 to 2020. The saffron stigmas were gently ground with a mortar and pestle. One sample was used for the design of experiments and twenty samples were used for the confirmation of the models.

2.2. Reagents and Materials

Acetonitrile (ACN) of HPLC-grade and LC-MS grade was purchased from Fisher Scientific Co. (Chicago, IL, USA). Ultra-high purity water was produced using a Genie Water System from RephiLe Bioscience Ltd. (Shanghai, China). C18 SPE cartridges (Isolute® C18(EC), 2 g/15 mL) were supplied by Biotage (Uppsala, Sweden).

2.3. Preparation of Extracts

An aqueous extract was prepared by adding 20 mg of ground stigmas in 8 mL of distilled water in a centrifuge tube and sonicated for 10 min in an ultrasound water bath (Bandelin Electronic, RK 255H, Berlin, Germany) at an operating frequency of 35 kHz. Subsequently, the extract was centrifuged for 25 min using a Sigma 3K 18 centrifuge (5000 rpm, T = 4 °C). The supernatant was loaded directly onto the SPE cartridge, which was previously conditioned with 8 mL of ACN and 15 mL of distilled water. After extract loading, the SPE cartridge was washed with 10 mL of distilled water and an appropriate volume of solvent (% v/v ACN/water) was used to elute picrocrocin and crocins from the cartridge.

2.4. Experimental Design

The experimental design was performed using the Design-Expert trial version 13 software (Stat-Ease, Inc., Minneapolis, MN, USA). A five-level RCCD combined with RSM was selected for the experimental design. Two RCCD-RSM models were developed with the response variables; absorbance of solutions obtained from SPE, at 257 nm (for picrocrocin) and 440 nm (for crocins), respectively. Moreover, three quantitative factors, A: volume of saffron extract (mL), B: % v/v ACN/water, and C: volume of aqueous ACN (mL), were used.
A total of twenty experimental runs in each model were analyzed by a quadratic design domain using a randomly selected saffron sample. The coefficient of determination (R2) and the Analysis Of Variance (ANOVA) were utilized for testing the model’s fit. Twenty samples were used as a test set to confirm the robustness of the RSM models. The absorbance at 257 nm and 440 nm was measured using 1.0 cm light path quartz cuvettes in a Cary 60 UV-Vis spectrophotometer (Agilent Technologies, Santa Clara, CA, USA). A dilution with the appropriate solvent ratio of ACN/water (% v/v) was performed when the absorbance units of the eluted picrocrocin and crocins were above the linear range of Agilent Cary 60 UV-Vis spectrophotometer.

2.5. UPLC-QToF-MS

The mass spectra were recorded on an Agilent 6530 Quadrupole Time of Flight LC-MS system, with an Electrospray Ionization (ESI) source, coupled with Agilent 1290 Infinity UHPLC system and an autosampler (Agilent Technologies, Santa Clara, CA, USA). Compound identification was performed at negative ESI mode. The following QToF conditions were used: drying gas, 10 L/min; gas temperature, 300 °C; fragmentor, 150 V; skimmer, 65 V; capillary voltage, 4000 V; nebulizer gas, 45 psi; acquisition rate, 1 spectra/s (threshold 200 Abs, 0.01% rel.); MS scan range, 50–1500. Nitrogen was used as the collision gas. The QToF-MS system was calibrated before each analysis using a reference solution for scanning up to m/z 1500, and a constant infusion of a reference mass solution in negative ESI mode, with the reference ions 112.9856 and 1033.9881 was also applied during the analysis. The Agilent MassHunter Data Acquisition software (version B.06.00, Santa Clara, CA, USA) was used for data acquisition, whereas the raw data files were processed with Agilent MassHunter Qualitative Analysis software (version B.07.00).
A chromatographic study was performed with a Nucleosil EC C18 (250 mm × 4.6 mm, 5 μm) column (Macherey-Nagel GmbH & Co., Düren, Germany). The mobile phase was (A) ultrapure water–formic acid 0.25% and (B) ACN, with the following gradient: 0 min: 20% B; 5 min: 20% B; 15 min: 80% B; 20 min: 20% B; 30 min: 20% B. The total run time including column equilibration was 30 min. The injection volume was 2 μL and the flow rate was 0.8 mL min−1. The column oven temperature was set at 30 °C.

3. Results and Discussion

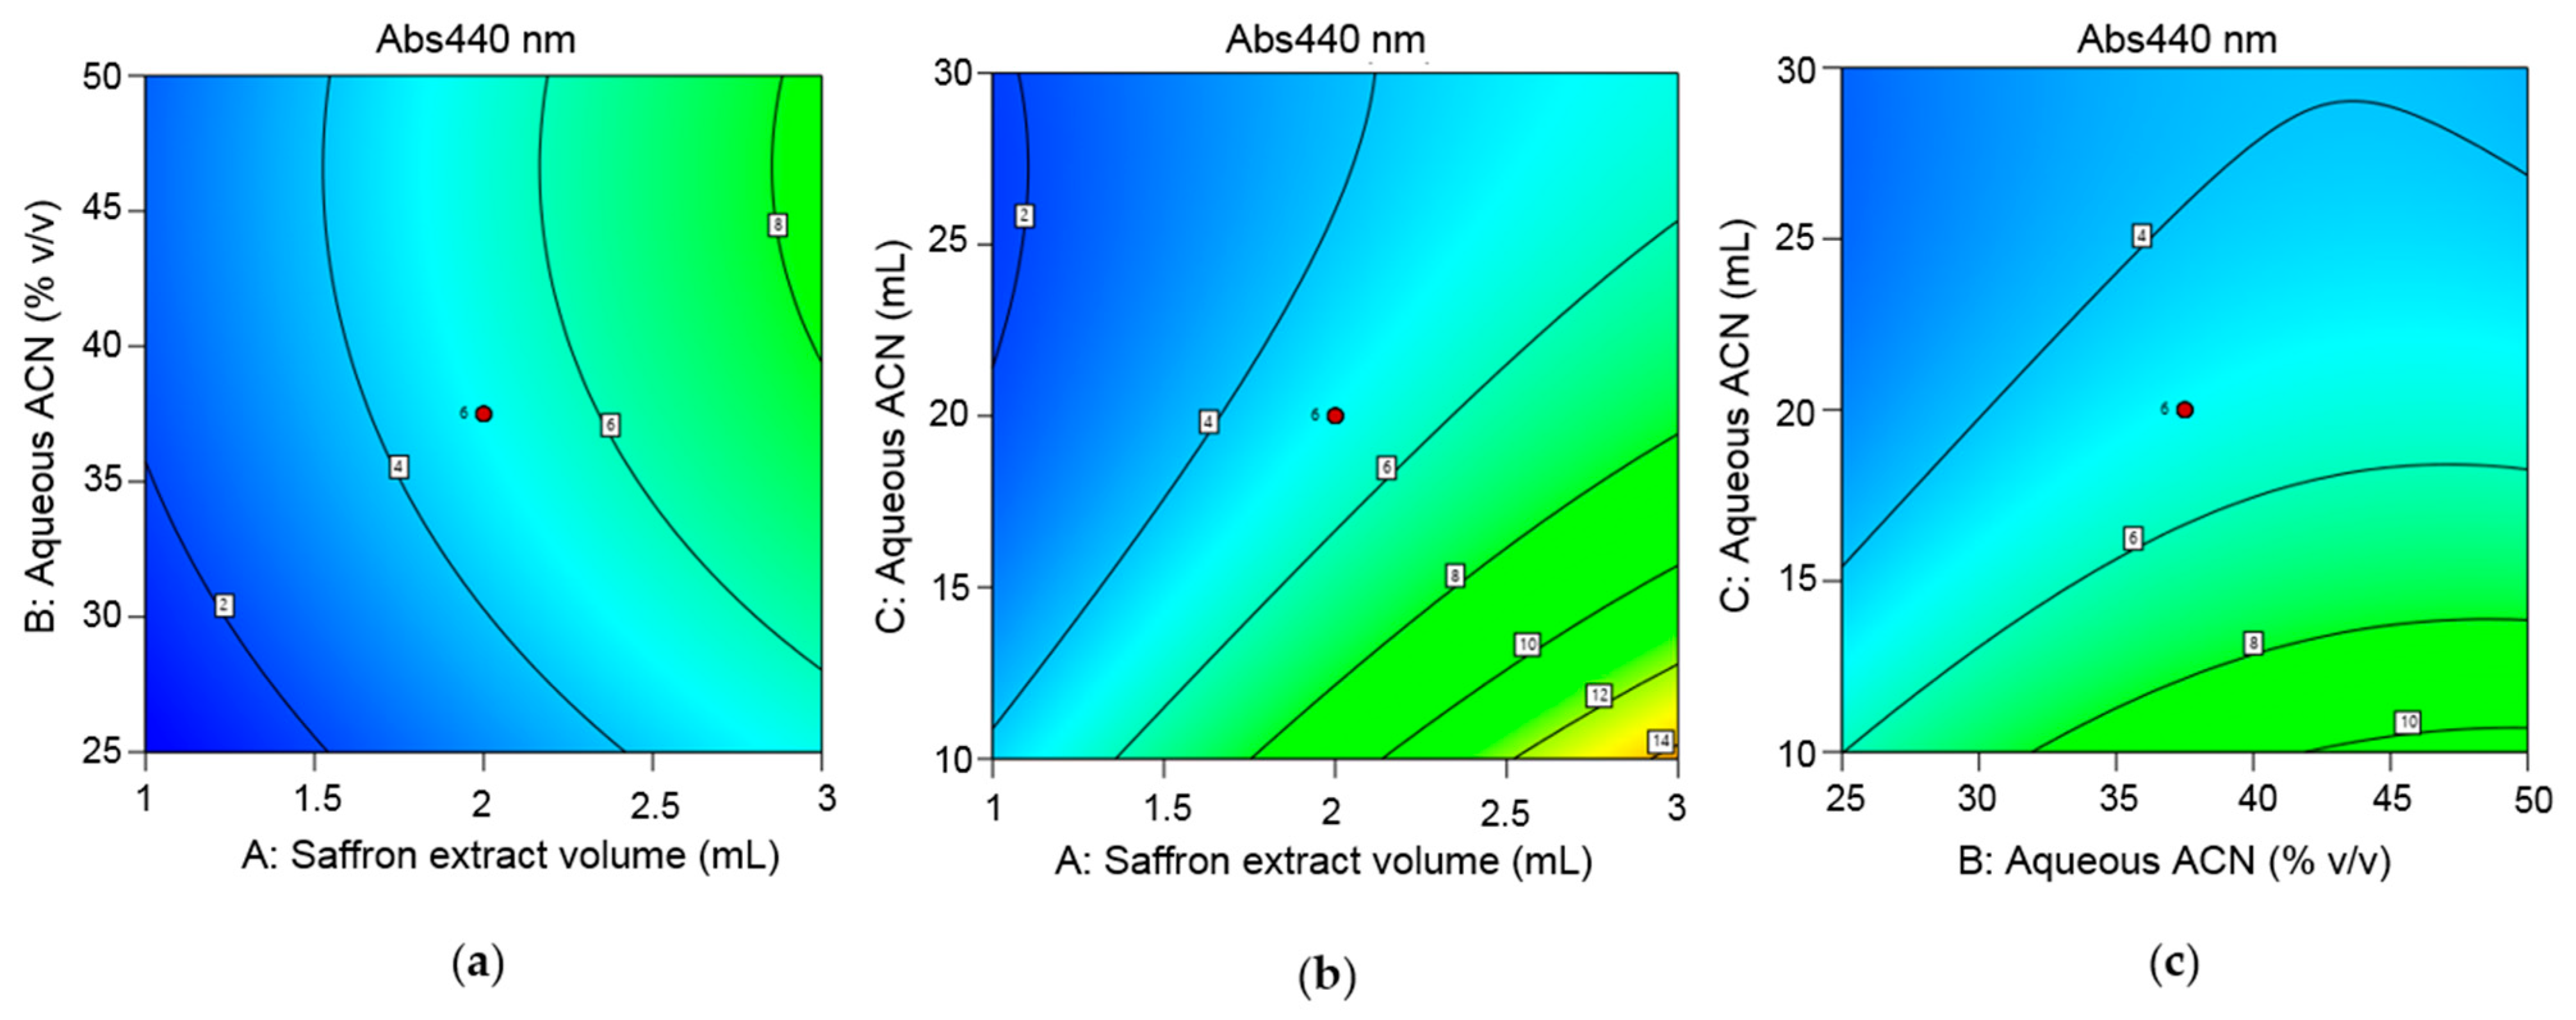
3.1. RCCD-RSM Models

RCCD are usually preferred over other designs such as Face-Centered Central Composite Designs or Box-Behnken designs, as they can provide a consistent prediction of variation at all points that are equidistant from the center point. Consequently, RCCD was the preferred choice in the current study. Combined with RSM, RCCD can provide useful information about the relationship between experimental factors and responses and also optimize the response [33,34]. In order to optimize the SPE conditions of picrocrocin and crocins, two five-level RCCD-RSM were performed with twenty experimental runs (Tables S1 and S2). SPE optimization studies on other matrices have identified that the sample volume and the volume of solvent used for the elution of compounds from the SPE cartridge were considered significant factors [35,36]. Additionally, the ratio of ACN/water (% v/v) was considered important in this study based on preliminary experiments and a previous report on picrocrocin extraction [29]. Therefore, the chosen parameters for optimization in the current study were A: volume of saffron extract (mL), B: % v/v ACN/water, and C: volume of ACN/water (mL).
To optimize the extraction conditions of picrocrocin, the sample volume of aqueous saffron extract was set from 1 to 3 mL (factor A), the (% v/v) ACN/water from 10 to 15% (factor B), and the volume of aqueous ACN from 10 to 30 mL (factor C). For crocins, factor B ranged from 25 to 50% (v/v) ACN/water. The RCCD design resulted in twenty different experiments which included eight factorial points, six axial points, and six center points with the value of α = 1.68 (Tables S1 and S2).
Upon completion of the experiments, it was observed that the ratio of the maximum value to the minimum value of the responses was greater than ten, indicating that a transformation of the response values should be applied [37]. Therefore, inverse square root and square root transformations of the responses were applied for picrocrocin and crocins, respectively, as suggested by the Box-Cox method [37,38]. After the transformation of the responses, the residuals in the normal probability plot followed a regular distribution (Figure 1).
The data acquired by the RCCD were generated into a response function quadratic model expressed by the coded equation (1) for picrocrocin, and (2) for crocins:
Y1 = 0.9299 − 0.3066 A − 0.2216 B + 0.0474 C + 0.0863 AB + 0.0695 AC + 0.1212 BC + 0.0834 A2 + 0.0941 B2 + 0.0319 C2
Y2 = 2.2256 + 0.6687 A + 0.2943 B − 0.5523 C + 0.0015 AB − 0.1935 AC − 0.1064 BC − 0.1143 A2 − 0.2027 B2 + 0.2611 C2
where Y1 is the 1/Sqrt (Abs257 nm), Y2 is the Sqrt (Abs440 nm), whereas A, B, and C are the coded values of volume of aqueous saffron extract (mL), (% v/v) ACN/water, and volume of aqueous ACN (mL) used for the elution, respectively. The inspection of the residual plots of both models did not reveal any suspicious pattern that would put the results of the analysis into question.
Analysis of Variance (ANOVA) was applied to confirm the adequacy of the quadratic models (Tables S3 and S4). Both models were significant, with a p-value < 0.0001. The high values of the coefficients of determination (R2 = 0.962, R2(adj) = 0.927 and R2(pred) = 0.705 for the picrocrocin model and R2 = 0.967, R2(adj) = 0.937 and R2(pred) = 0.793 for the crocin model) suggest that the models fit the data well. However, differences were observed in the effects of the factors on the responses. Factors A: saffron extract volume (mL) and B: % v/v ACN/water had a significant effect (p-value < 0.0001) on the absorbance of picrocrocin SPE solutions at 257 nm. In addition, interactions AB, BC, and quadratic A2 and B2 were significant terms (Table S3). For the crocins model, all three factors had a significant effect on the response with interaction AC, and quadratic terms B2 and C2 were also significant (Table S4). Based on the ANOVA results, factors A: saffron extract volume (mL) and B: % v/v ACN/water were important with a significant effect on the responses of both models. Meanwhile, factor C: elution volume was significant only for the crocins model. Research studies regarding the optimization of SPE conditions by RSM are limited [35,36,39]. In an SPE optimization study for the pretreatment of estrogens in sewage [35], the elution volume was reported as the most important factor for the optimization. The sample volume has also been evaluated as a significant parameter in the SPE optimization for the determination of ibuprofen in water [36]. The shape of each response surface is useful when identifying the optimal settings of the factors in order to maximize the response of interest, and can be revealed from the contour plots. This is presented in Figure 2 for the picrocrocin model (absorbance at 257 nm), and in Figure 3 for the crocins model (absorbance at 440 nm).
It is evident from Figure 2 that the absorbance of picrocrocin at 257 nm increases when saffron extract volume increases to 3 mL, % v/v ACN/water increases to 15%, and the volume of aqueous ACN necessary for the elution of picrocrocin from the SPE cartridge is close to 10 mL. An increase in the volume of aqueous ACN above 10 mL results in a gradual decrease in the response.
Similarly, for crocins, Figure 3 shows that the absorbance increases as the volume of aqueous ACN used for the elution of crocins decreases to 10 mL. The absorbance also increases with an increasing extract volume close to 3 mL and when the % v/v ACN/water reaches 50%.
Therefore, the optimum SPE conditions suggested by the models were A: 3 mL, B: 15% ACN/water (v/v) for picrocrocin and 50% ACN/water (v/v) for crocins, and C: 10 mL (the same conclusions were reached after fitting several models using a different but acceptable transformation of the response). The above-optimized formulation reduces the use of reagents and consumables since it is performed in a single SPE cartridge, using the minimum volume of ACN/water solvent to separate and obtain picrocrocin and crocins.
After establishing the optimum SPE conditions, a test set comprised of 20 saffron samples was used for the validation of both models. According to the above-optimized conditions, 3 mL of the saffron aqueous extract was loaded onto a previously conditioned SPE cartridge. Picrocrocin was eluted from the cartridge using 10 mL of 15% ACN/water (v/v), and its presence was confirmed with a UV-Vis spectrophotometer (Figure 4a). Subsequently, 10 mL of 50% ACN/water (v/v) was used for the elution of crocins from the SPE cartridge (Figure 4b). The obtained absorbance of the picrocrocin and crocin SPE solutions is presented in Table 1.

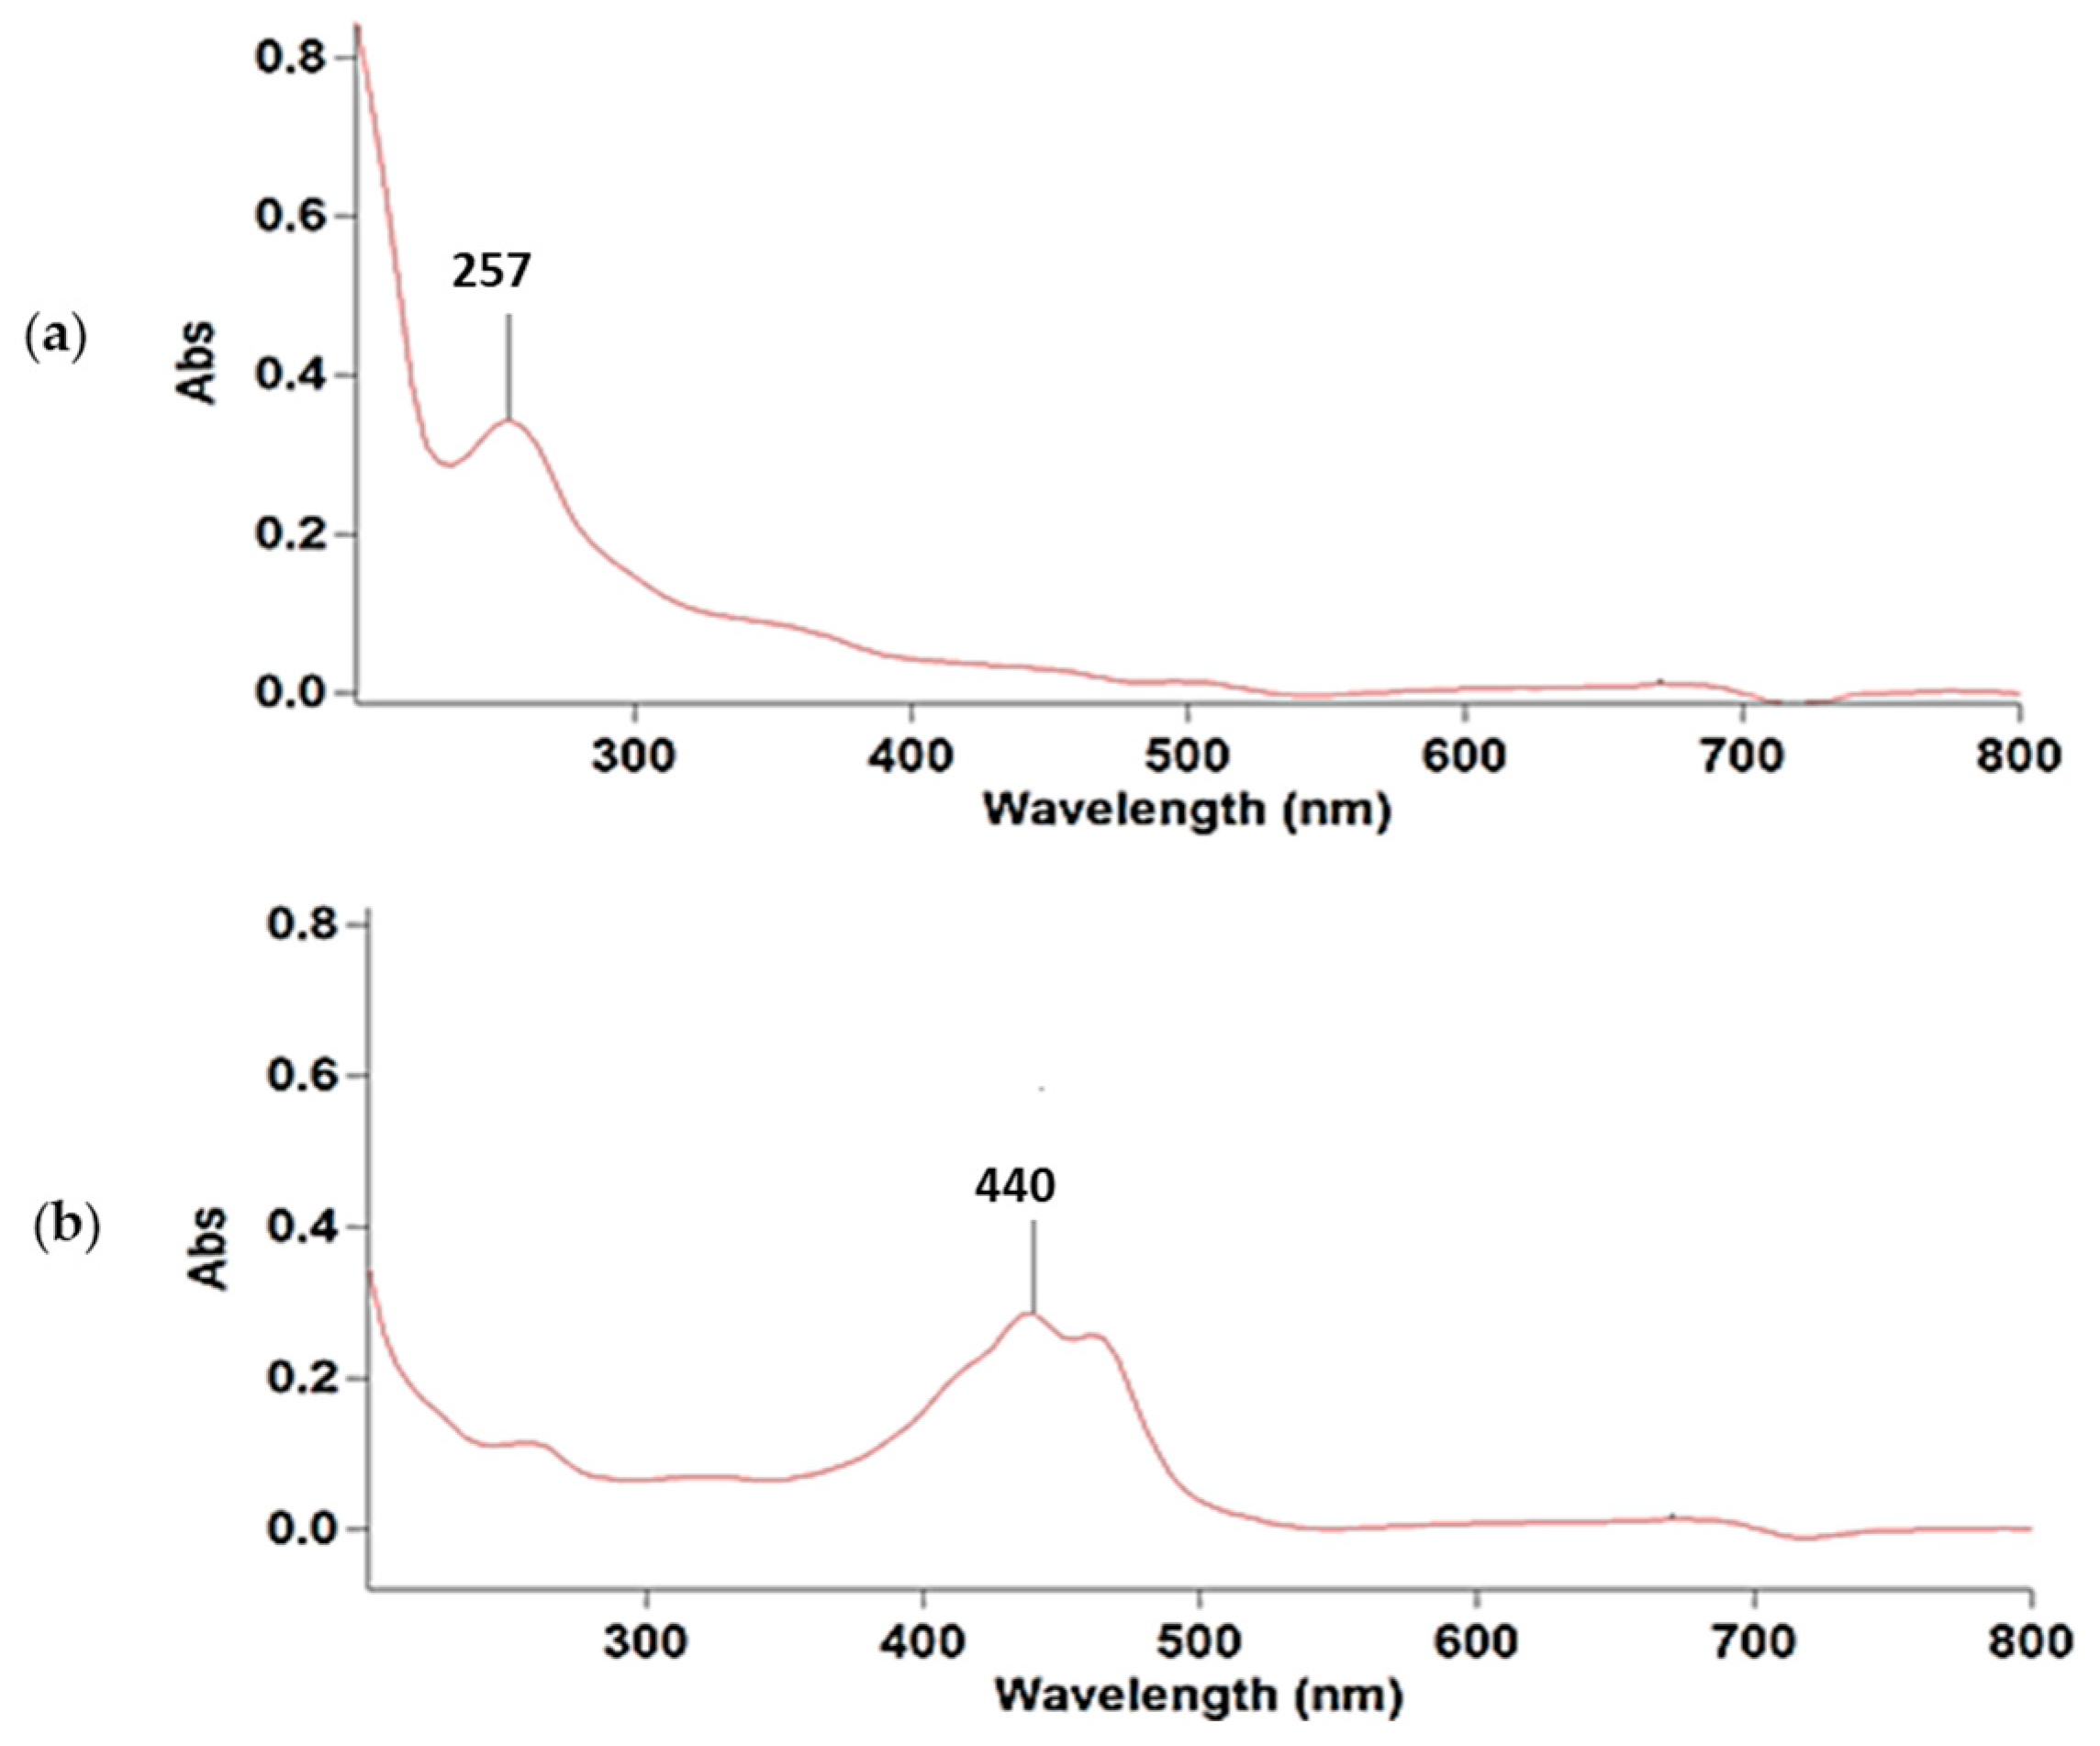
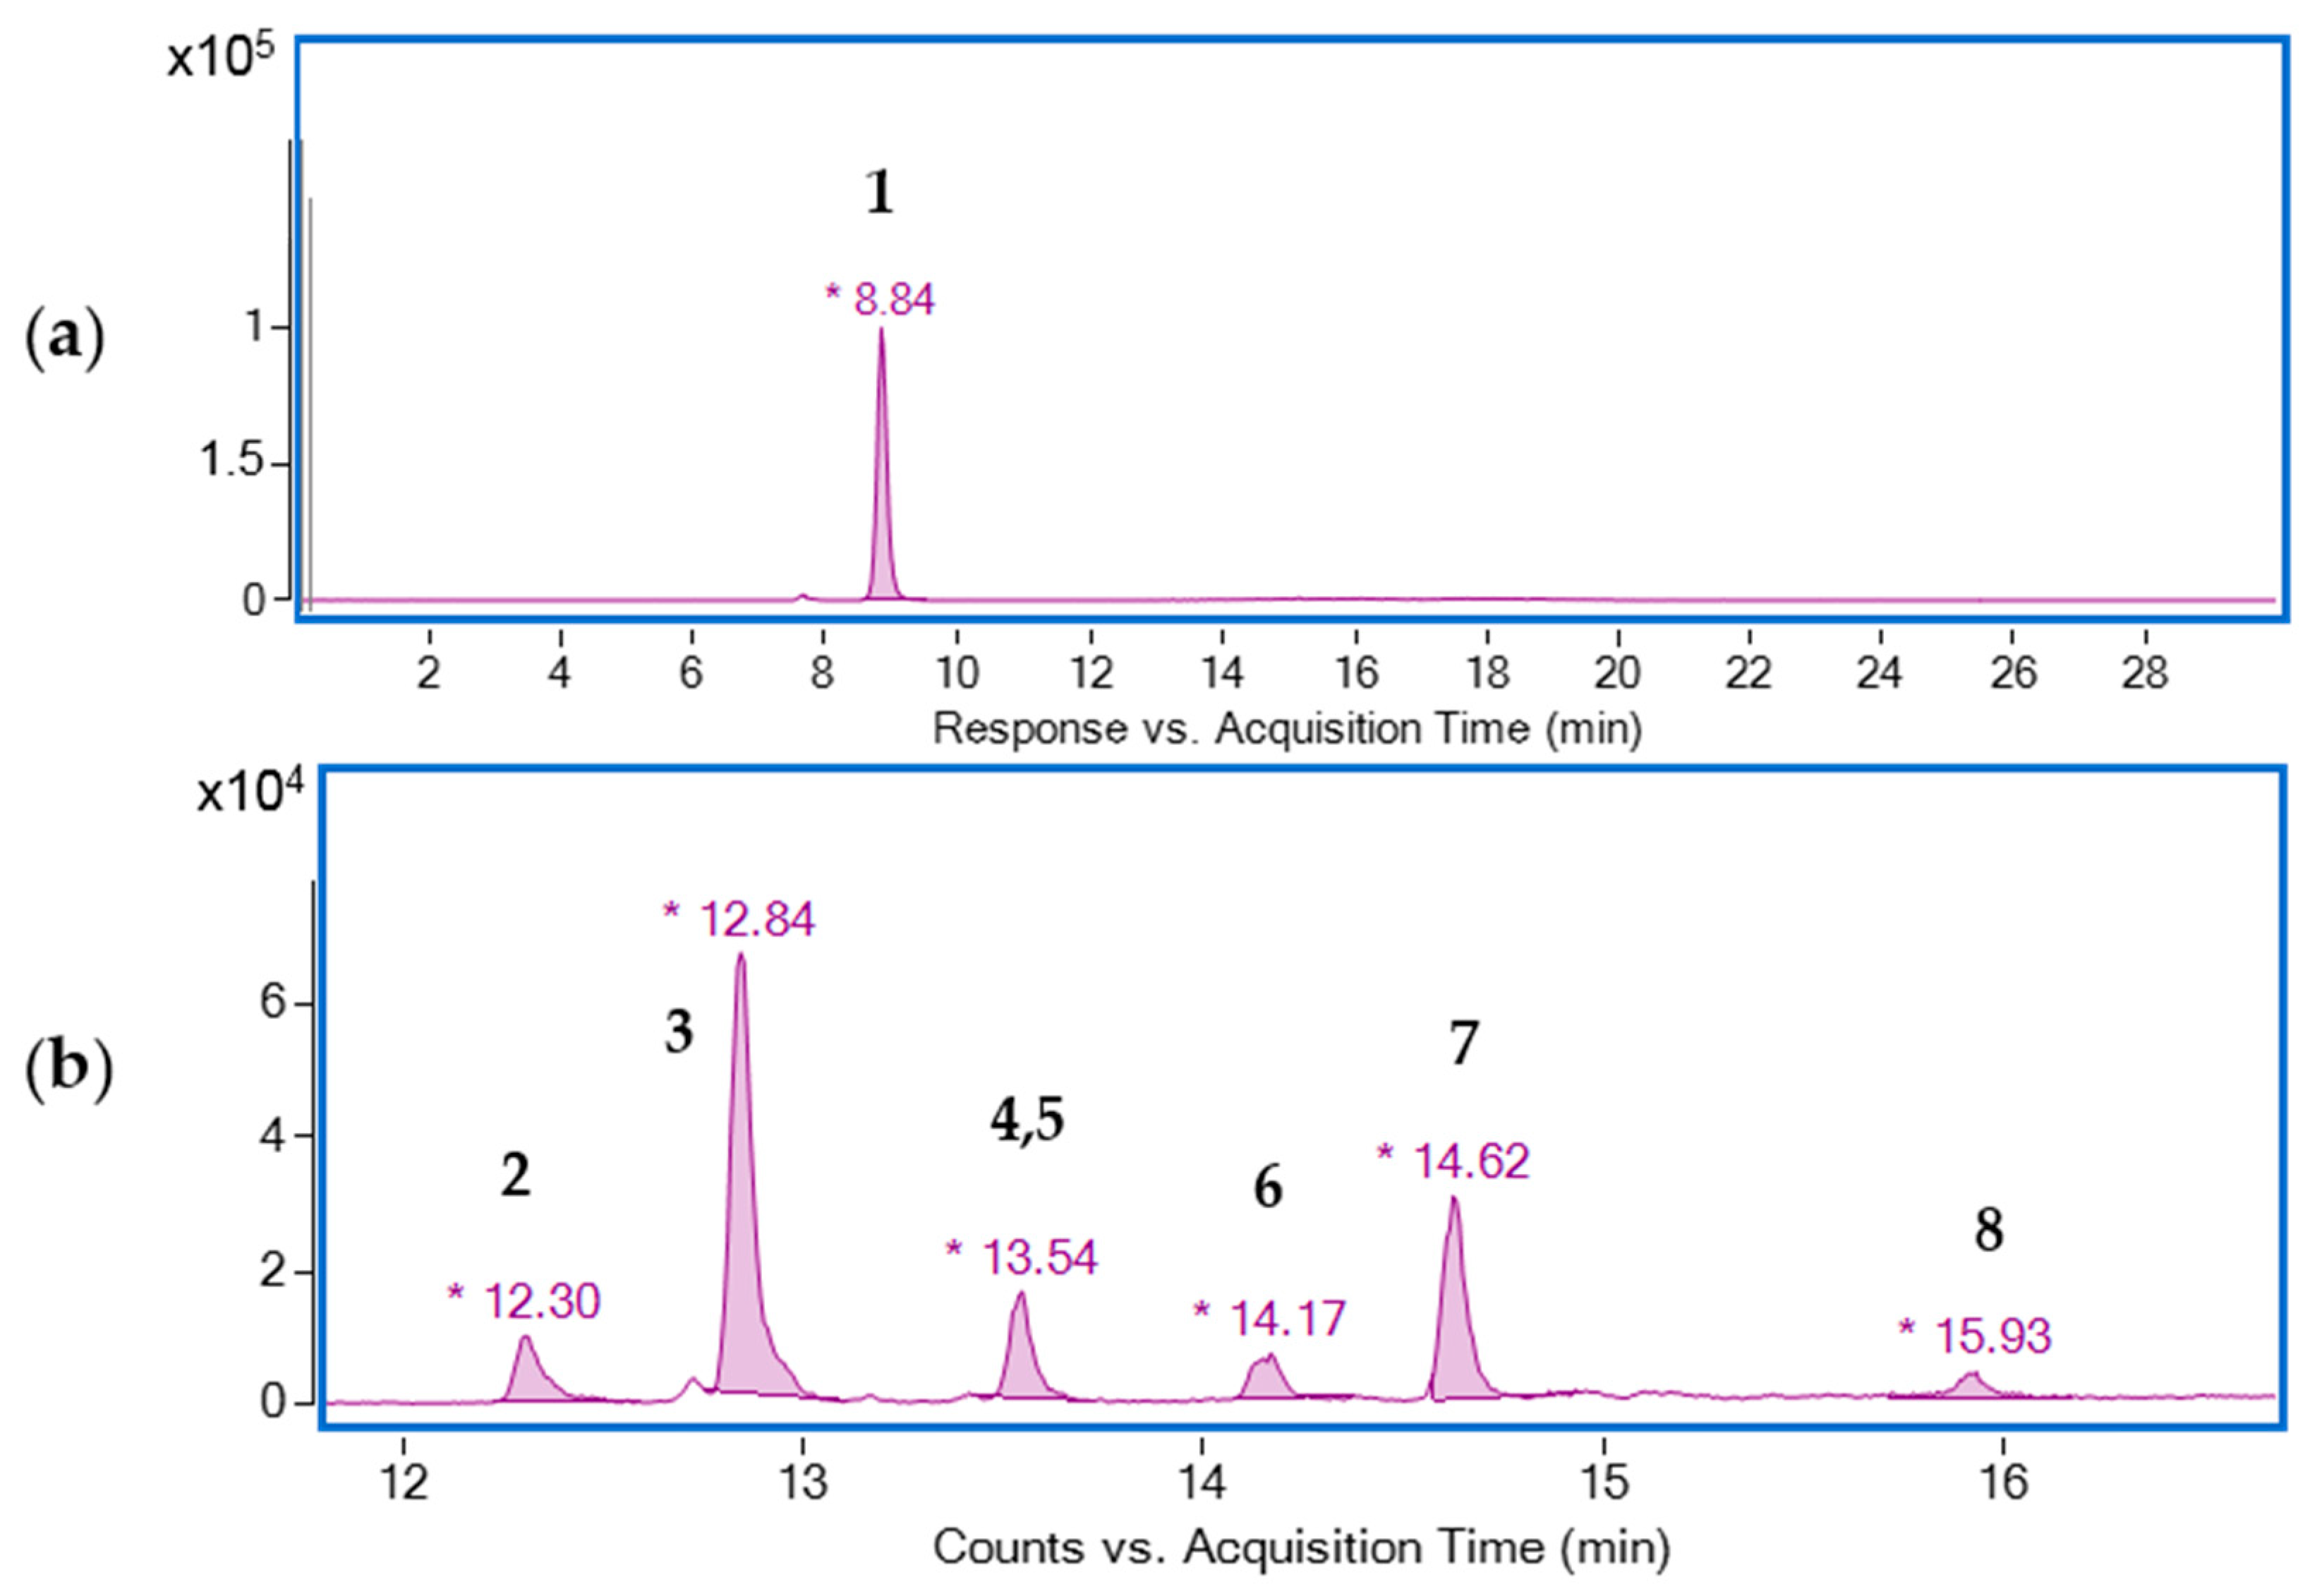
3.2. UPLC-QToF-MS Analysis

Solutions obtained by SPE were further analyzed by UPLC-QToF-MS. High-resolution time-of-flight mass spectrometry is widely acknowledged to enable accurate target analysis and screening of phytoconstituents. The main advantage of this technique is that it is extremely selective because it measures the exact mass of a compound, allowing even minor structural alterations to be identified [40]. Analysis of SPE solutions was performed in negative ion electronspray ionization. From the analysis of the SPE solution obtained with 15% ACN/water (v/v), picrocrocin was tentatively identified as [M − H + HFA] adduct. This compound was observed at retention time (r.t.) 8.84 min (Figure 5a) with an m/z 375.1653 (Δ −0.53 ppm) (Figure S1).
Crocins are carotenoid pigments that are classified as diterpenoids, a class of natural products formed by four C5 isoprene units. Seven crocins, including cis and trans isomers, were tentatively identified in the present study from the UPLC-QToF-MS analysis of the SPE solution obtained with 50% ACN/water (v/v). Tarantilis et al. [12] reported that the cis isomers of crocins display an absorption band at 325 nm which is attributed to the cis double bonds of the polyene-conjugated system of crocins. The cis isomers also display an absorption band in the visible region at 440 nm. However, the trans isomers of crocins only exhibit an absorption band at 440 nm, which is typical of all-trans-carotenoids. In general, trans isomers are more polar than cis isomers. Therefore, the isomers of crocins in the current study were identified based on their high-resolution mass spectra, their r.t., and the UV-Vis information provided by the diode-array detector of the UPLC-QToF-MS operated at three wavelengths (257, 330, 440 nm).
From the study of the obtained high-resolution mass spectra, it was observed that crocins formed [M − H + HFA] adducts (Table 2 and Figure S1), confirming previous literature reports [13,41].
Table 2. Compounds identified by LC-Q-TOF/MS in picrocrocin and crocin solutions obtained from SPE.
Peak
Number
Compound 1Chemical
Formula
Retention Time
(min)
Theoretical Mass (m/z)
[M − H + HFA]
Observed Mass (m/z)
[M − H + HFA]
Mass Error (ppm)
1PicrocrocinC16H26O78.84375.1661375.1653−0.53
2Crocin 4 (trans 4GG)C44H64O2412.301021.37691021.3771−0.20
3Crocin 3 (trans 3Gg)C38H54O1912.84859.3241859.32301.28
4Crocin 2 (trans 2G)C32H44O1413.54697.2713697.27080.72
5Crocin 4 (cis 4GG)C44H64O2413.551021.37691021.3798−2.30
6Crocin 3 (cis 3Gg)C38H54O1914.17859.3241859.3244−0.35
7Crocin 2 (cis 2G)C32H44O1414.62697.2713697.27021.58
8Crocin 1 (cis 1g)C26H34O915.93535.2184535.21840
1 Nomenclature of crocins is according to literature [42]. (G) corresponds to gentiobiose and (g) to glucose.
Crocin 4 is crocetin esterified with one unit of the disaccharide gentiobiose at each end of the molecule. Two isomers of crocin 4 (crocetin di(β-D-gentiobiosyl)ester) were detected. The trans isomer of crocin 4 was identified at r.t. 12.30 min with an absorption band at 440 nm and an m/z 1021.3771 (Δ −0.20 ppm). The cis isomer of crocin 4 was detected at r.t. 13.55 with a UV-Vis absorption band at 325 nm and 440 nm and m/z 1021.3798 (Δ −2.30 ppm). The trans isomer of crocin 4 has demonstrated a potent effect in suppressing key molecular pathways of Alzheimer’s disease pathogenesis [43].
Crocin 3 is crocetin which is esterified at one end with one unit of gentiobiose and one unit of glucose at the other end. Two isomers of crocin 3 (crocetin (β-D-glucosyl)-(β-D-gentiobiosyl)ester) were identified. The trans isomer was detected at r.t. 12.84 min with an m/z 859.3230 (Δ 1.28 ppm) and an absorption band at 440 nm, whereas the cis isomer of crocin 3 was found at r.t. 14.17 with an m/z 859.3244 (Δ −0.35 ppm). The cis isomer showed a UV-Vis absorption band at 325 nm and 440 nm.
Crocin 2 (crocetin (β-D-gentiobiosyl)ester) is crocetin which is esterified at one end with one unit of the disaccharide gentiobiose and a carboxylic group at the other. The trans isomer of crocin 2 was detected at r.t. 13.54 min with an m/z 697.2708 (Δ 0.72 ppm). Crocins trans 2G and cis 4GG were co-eluted in one chromatographic peak (peaks 4, 5 in Figure 5b) at a retention time of 13.54, which has been also reported by Lech et al. [13]. The cis isomer of crocin 2 was detected at r.t. 14.62 with an m/z 697.2702 (Δ 1.58 ppm) and a UV-Vis absorption band at 325 nm and 440 nm.
Crocin 1 (crocetin (β-D-glucosyl)ester), is crocetin esterified at one end with one unit of glucose and a free carboxylic group at the other. The cis isomer of crocin 1 was detected at r.t. 15.93 min with an m/z 535.2184 (Δ 0 ppm) and a UV-Vis absorption band at 325 nm and 440 nm.
It was observed that the trans isomer of crocin 3 was the most abundant followed by the cis isomer of crocin 2 (Figure 5b). The crocins profile was in accordance with previous studies [12,44,45]. In a study of Greek saffron originating from the Kozani prefecture, it was reported that the cis isomer of crocin 3 was the most abundant [15], whereas in Iranian saffron, the trans isomers of crocin 4 and crocin 3 had the highest concentrations [46]. This diversity could be attributed to the differences in geographical and bioclimatic distribution [47].

4. Conclusions

The optimum SPE conditions for the separation of picrocrocin and crocins from saffron aqueous extract were established, considering as response factor the UV-Vis absorbance of the specific compounds (257 nm and 440 nm, for picrocrocin and crocins, respectively). For the optimization, a central composite design-response surface methodology was applied with the following factors: A: volume of aqueous saffron extract (mL), B: elution solvent (% v/v ACN/H2O), and C: volume of elution solvent (mL). The optimum SPE conditions suggested by the models were A: 3 mL, B: 15% for picrocrocin and 50% for crocins, and C: 10 mL. UPLC-QToF-MS analysis of SPE solutions obtained under the optimized conditions confirmed the presence of picrocrocin and crocins trans 4GG, trans 3Gg, trans 2G, cis 4GG, cis 3Gg, cis 2G, and cis 1g. The suggested optimized SPE procedure can be considered cost-effective for obtaining picrocrocin and crocins for the qualitative evaluation of saffron.

Supplementary Materials

The following supporting information can be downloaded at: https://www.mdpi.com/article/10.3390/compounds3010019/s1, Figure S1: Mass spectra of (a) trans 4GG; (b) trans 3Gg; (c) trans 2G; (d) cis 4GG; (e) cis 3Gg; (f) cis 2G; (g) cis 1g; (h) picrocrocin. Table S1: Rotatable central composite design for the three independent experimental factors (A, B, and C) along with the experimental values of the response (absorbance of picrocrocin at 257 nm); Table S2: Rotatable central composite design for the three independent experimental factors (A, B, and C) along with the experimental values of the response (crocins absorbance at 440 nm); Table S3: Analysis of variance results for the experimental design of picrocrocin model; Table S4: Analysis of variance results for the experimental design of crocins model.

Author Contributions

Conceptualization, P.A.T.; methodology, P.A.T., P.-K.R., G.K.P. and H.E.; software, P.-K.R. and M.X.; validation, P.-K.R. and E.K.; formal analysis, E.K. and P.-K.R.; investigation, P.-K.R. and E.K.; resources, P.-K.R., C.D.K. and M.X.; data curation, E.K. and P.-K.R.; writing—original draft preparation, P.-K.R.; writing—review and editing, P.-K.R., E.K., M.X., H.E., C.D.K., G.K.P., I.F.S., C.S.P. and P.A.T.; visualization P.-K.R. and M.X.; supervision, P.A.T.; project administration, P.A.T. All authors have read and agreed to the published version of the manuscript.

Funding

This research received no external funding.

Institutional Review Board Statement

Not applicable.

Informed Consent Statement

Not applicable.

Data Availability Statement

Not available.

Conflicts of Interest

The authors declare no conflict of interest.

References

  1. Mohtashami, L.; Amiri, M.S.; Ramezani, M.; Emami, S.A.; Simal-Gandara, J. The Genus Crocus L.: A Review of Ethnobotanical Uses, Phytochemistry and Pharmacology. Ind. Crops Prod. 2021, 171, 113923. [Google Scholar] [CrossRef]
  2. Alavizadeh, S.H.; Hosseinzadeh, H. Bioactivity Assessment and Toxicity of Crocin: A Comprehensive Review. Food Chem. Toxicol. 2014, 64, 65–80. [Google Scholar] [CrossRef]
  3. Jafari, S.-M.; Tsimidou, M.Z.; Rajabi, H.; Kyriakoudi, A. Chapter 16—Bioactive Ingredients of Saffron: Extraction, Analysis, Applications. In Saffron; Koocheki, A., Khajeh-Hosseini, M., Eds.; Woodhead Publishing: Sawston, UK, 2020; pp. 261–290. ISBN 978-0-12-818638-1. [Google Scholar]
  4. Colapietro, A.; Mancini, A.; D’Alessandro, A.M.; Festuccia, C. Crocetin and Crocin from Saffron in Cancer Chemotherapy and Chemoprevention. Anti-Cancer Agents Med. Chem. 2019, 19, 38–47. [Google Scholar] [CrossRef]
  5. Khazdair, M.R.; Boskabady, M.H.; Hosseini, M.; Rezaee, R.; Tsatsakis, A.M. The Effects of Crocus sativus (Saffron) and Its Constituents on Nervous System: A Review. Avicenna J. Phytomed. 2015, 5, 376–391. [Google Scholar]
  6. Nassiri-Asl, M.; Hosseinzadeh, H. Chapter 3—Neuropharmacology Effects of Saffron (Crocus sativus) and Its Active Constituents. In Bioactive Nutraceuticals and Dietary Supplements in Neurological and Brain Disease; Watson, R.R., Preedy, V.R., Eds.; Academic Press: San Diego, CA, USA, 2015; pp. 29–39. ISBN 978-0-12-411462-3. [Google Scholar]
  7. Kamalipour, M.; Akhondzadeh, S. Cardiovascular Effects of Saffron: An Evidence-Based Review. J. Tehran Heart Cent. 2011, 6, 59–61. [Google Scholar]
  8. Fagot, D.; Pham, D.M.; Laboureau, J.; Planel, E.; Guerin, L.; Nègre, C.; Donovan, M.; Bernard, B.A. Crocin, a Natural Molecule with Potentially Beneficial Effects against Skin Ageing. Int. J. Cosmet. Sci. 2018, 40, 388–400. [Google Scholar] [CrossRef] [PubMed]
  9. ISO. ISO 3632-1:2011. Available online: https://www.iso.org/cms/render/live/en/sites/isoorg/contents/data/standard/04/45/44523.html (accessed on 27 December 2021).
  10. Orfanou, O.; Tsimidou, M. Evaluation of the Colouring Strength of Saffron Spice by UV—Vis Spectrometry. Food Chem. 1996, 57, 463–469. [Google Scholar] [CrossRef]
  11. Tarantilis, P.A.; Polissiou, M.G. Isolation and Identification of the Aroma Components from Saffron (Crocus sativus). J. Agric. Food Chem. 1997, 45, 459–462. [Google Scholar] [CrossRef]
  12. Tarantilis, P.A.; Tsoupras, G.; Polissiou, M. Determination of Saffron (Crocus sativus L.) Components in Crude Plant Extract Using High-Performance Liquid Chromatography-UV-Visible Photodiode-Array Detection-Mass Spectrometry. J. Chromatogr. A 1995, 699, 107–118. [Google Scholar] [CrossRef]
  13. Lech, K.; Witowska-Jarosz, J.; Jarosz, M. Saffron Yellow: Characterization of Carotenoids by High Performance Liquid Chromatography with Electrospray Mass Spectrometric Detection. J. Mass Spectrom. 2009, 44, 1661–1667. [Google Scholar] [CrossRef] [PubMed]
  14. Moras, B.; Loffredo, L.; Rey, S. Quality Assessment of Saffron (Crocus sativus L.) Extracts via UHPLC-DAD-MS Analysis and Detection of Adulteration Using Gardenia Fruit Extract (Gardenia jasminoides Ellis). Food Chem. 2018, 257, 325–332. [Google Scholar] [CrossRef] [PubMed]
  15. Kakouri, E.; Agalou, A.; Kanakis, C.; Beis, D.; Tarantilis, P.A. Crocins from Crocus sativus L. in the Management of Hyperglycemia. In Vivo Evidence from Zebrafish. Molecules 2020, 25, 5223. [Google Scholar] [CrossRef] [PubMed]
  16. Iborra, J.L.; Castelar, M.R.; Cánovas, M.; Manjón, A. TLC Preparative Purification of Picrocrocin, HTCC and Crocin from Saffron. J. Food Sci. 1992, 57, 714–716. [Google Scholar] [CrossRef]
  17. Sujata, V.; Ravishankar, G.A.; Venkataraman, L.V. Methods for the Analysis of the Saffron Metabolites Crocin, Crocetins, Picrocrocin and Safranal for the Determination of the Quality of the Spice Using Thin-Layer Chromatography, High-Performance Liquid Chromatography and Gas Chromatography. J. Chromatogr. A 1992, 624, 497–502. [Google Scholar] [CrossRef]
  18. Zalacain, A.; Ordoudi, S.A.; Díaz-Plaza, E.M.; Carmona, M.; Blázquez, I.; Tsimidou, M.Z.; Alonso, G.L. Near-Infrared Spectroscopy in Saffron Quality Control: Determination of Chemical Composition and Geographical Origin. J. Agric. Food Chem. 2005, 53, 9337–9341. [Google Scholar] [CrossRef] [PubMed]
  19. Zougagh, M.; Simonet, B.M.; Ríos, A.; Valcárcel, M. Use of Non-Aqueous Capillary Electrophoresis for the Quality Control of Commercial Saffron Samples. J. Chromatogr. A 2005, 1085, 293–298. [Google Scholar] [CrossRef] [PubMed]
  20. Pitsikas, N.; Zisopoulou, S.; Tarantilis, P.A.; Kanakis, C.D.; Polissiou, M.G.; Sakellaridis, N. Effects of the Active Constituents of Crocus sativus L., Crocins on Recognition and Spatial Rats’ Memory. Behav. Brain Res. 2007, 183, 141–146. [Google Scholar] [CrossRef] [PubMed]
  21. Hadizadeh, F.; Mohajeri, S.A.; Seifi, M. Extraction and Purification of Crocin from Saffron Stigmas Employing a Simple and Efficient Crystallization Method. Pak. J. Biol. Sci. 2010, 13, 691–698. [Google Scholar] [CrossRef]
  22. Nerome, H.; Ito, M.; Machmudah, S.; Wahyudiono; Kanda, H.; Goto, M. Extraction of Phytochemicals from Saffron by Supercritical Carbon Dioxide with Water and Methanol as Entrainer. J. Supercrit. Fluids 2016, 107, 377–383. [Google Scholar] [CrossRef]
  23. Jafari, S.M.; Mahdavee Khazaei, K.; Assadpour, E. Production of a Natural Color through Microwave-Assisted Extraction of Saffron Tepal’s Anthocyanins. Food Sci. Nutr. 2019, 7, 1438–1445. [Google Scholar] [CrossRef]
  24. Maggi, L.; Sánchez, A.M.; Carmona, M.; Kanakis, C.D.; Anastasaki, E.; Tarantilis, P.A.; Polissiou, M.G.; Alonso, G.L. Rapid Determination of Safranal in the Quality Control of Saffron Spice (Crocus sativus L.). Food Chem. 2011, 127, 369–373. [Google Scholar] [CrossRef]
  25. Sarfarazi, M.; Jafari, S.M.; Rajabzadeh, G.; Feizi, J. Development of an Environmentally-Friendly Solvent-Free Extraction of Saffron Bioactives Using Subcritical Water. LWT 2019, 114, 108428. [Google Scholar] [CrossRef]
  26. Rödel, W.; Petrzika, M. Analysis of the Volatile Components of Saffron. J. High Resolut. Chromatogr. 1991, 14, 771–774. [Google Scholar] [CrossRef]
  27. Buszewski, B.; Szultka, M. Past, Present, and Future of Solid Phase Extraction: A Review. Crit. Rev. Anal. Chem. 2012, 42, 198–213. [Google Scholar] [CrossRef]
  28. Carmona, M.; Sánchez, A.M.; Ferreres, F.; Zalacain, A.; Tomás-Barberán, F.; Alonso, G.L. Identification of the Flavonoid Fraction in Saffron Spice by LC/DAD/MS/MS: Comparative Study of Samples from Different Geographical Origins. Food Chem. 2007, 100, 445–450. [Google Scholar] [CrossRef]
  29. Sánchez, A.M.; Carmona, M.; del Campo, C.P.; Alonso, G.L. Solid-Phase Extraction for Picrocrocin Determination in the Quality Control of Saffron Spice (Crocus sativus L.). Food Chem. 2009, 116, 792–798. [Google Scholar] [CrossRef]
  30. Yasin, S.; Sun, D.; Memon, H.; Zhu, F.; Jian, H.; Bin, Y.; Mingbo, M.; Hussain, M. Optimization of Mechanical and Thermal Properties of IPP and LMPP Blend Fibres by Surface Response Methodology. Polymers 2018, 10, 1135. [Google Scholar] [CrossRef] [PubMed] [Green Version]
  31. Yasin, S.; Curti, M.; Behary, N.; Perwuelz, A.; Giraud, S.; Rovero, G.; Guan, J.; Chen, G. Process Optimization of Eco-Friendly Flame Retardant Finish for Cotton Fabric: A Response Surface Methodology Approach. Surf. Rev. Lett. 2017, 24, 1750114. [Google Scholar] [CrossRef]
  32. Sohail, Y.; Parag, B.; Nemeshwaree, B.; Giorgio, R. Optimizing Organophosphorus Fire Resistant Finish for Cotton Fabric Using Box-Behnken Design. Int. J. Environ. Res. 2016, 10, 313–320. [Google Scholar] [CrossRef]
  33. Box, G.E.P.; Wilson, K.B. On the Experimental Attainment of Optimum Conditions. J. R. Stat. Soc. Ser. B 1951, 13, 1–38. [Google Scholar] [CrossRef]
  34. Box, G.E.P.; Norman, D.; Variance-Optimal, D. Response Surfaces, Mixtures, and Ridge Analyses; John Wiley & Sons, Ltd.: Hoboken, NJ, USA, 2007; pp. 461–481. ISBN 978-0-470-07276-9. [Google Scholar]
  35. Yang, X.L.; Xia, M.Q.; Chen, M.; Shen, D.Q.; Fu, D.F.; Song, H.L. Optimization of Solid-Phase Extraction for Pretreatment of Selected Estrogens in Sewage by Response Surface Methodology. Pol. J. Environ. Stud. 2014, 23, 2287–2294. [Google Scholar]
  36. Paíga, P.; Delerue-Matos, C. Response Surface Methodology Applied to SPE for the Determination of Ibuprofen in Various Types of Water Samples. J. Sep. Sci. 2013, 36, 3220–3225. [Google Scholar] [CrossRef] [PubMed] [Green Version]
  37. Anderson, M.J.; Whitcomb, P.J. RSM Simplified: Optimizing Processes Using Response Surface Methods for Design of Experiments, 2nd ed.; Productivity Press: New York, NY, USA, 2016. [Google Scholar]
  38. Montgomery, D.C. Design and Analysis of Experiments, 8th ed.; Wiley: New York, NY, USA, 2012. [Google Scholar]
  39. Mirzaei, R.; Yunesian, M.; Nasseri, S.; Gholami, M.; Jalilzadeh, E.; Shoeibi, S.; Bidshahi, H.S.; Mesdaghinia, A. An Optimized SPE-LC-MS/MS Method for Antibiotics Residue Analysis in Ground, Surface and Treated Water Samples by Response Surface Methodology- Central Composite Design. J. Environ. Health Sci. Eng. 2017, 15, 21. [Google Scholar] [CrossRef] [PubMed]
  40. Krauss, M.; Singer, H.; Hollender, J. LC–High Resolution MS in Environmental Analysis: From Target Screening to the Identification of Unknowns. Anal. Bioanal. Chem. 2010, 397, 943–951. [Google Scholar] [CrossRef] [PubMed] [Green Version]
  41. Jarukas, L.; Vitkevicius, K.; Mykhailenko, O.; Bezruk, I.; Georgiyants, V.; Ivanauskas, L. Effective Isolation of Picrocrocin and Crocins from Saffron: From HPTLC to Working Standard Obtaining. Molecules 2022, 27, 4286. [Google Scholar] [CrossRef] [PubMed]
  42. Carmona, M.; Zalacain, A.; Sánchez, A.M.; Novella, J.L.; Alonso, G.L. Crocetin Esters, Picrocrocin and Its Related Compounds Present in Crocus sativus Stigmas and Gardenia Jasminoides Fruits. Tentative Identification of Seven New Compounds by LC-ESI-MS. J. Agric. Food Chem. 2006, 54, 973–979. [Google Scholar] [CrossRef]
  43. Chalatsa, I.; Arvanitis, D.A.; Koulakiotis, N.S.; Giagini, A.; Skaltsounis, A.L.; Papadopoulou-Daifoti, Z.; Tsarbopoulos, A.; Sanoudou, D. The Crocus sativus Compounds Trans-Crocin 4 and Trans-Crocetin Modulate the Amyloidogenic Pathway and Tau Misprocessing in Alzheimer Disease Neuronal Cell Culture Models. Front. Neurosci. 2019, 13, 249. [Google Scholar] [CrossRef] [Green Version]
  44. Predieri, S.; Magli, M.; Gatti, E.; Camilli, F.; Vignolini, P.; Romani, A. Chemical Composition and Sensory Evaluation of Saffron. Foods 2021, 10, 2604. [Google Scholar] [CrossRef]
  45. D’Archivio, A.A.; Di Donato, F.; Foschi, M.; Maggi, M.A.; Ruggieri, F. UHPLC Analysis of Saffron (Crocus sativus L.): Optimization of Separation Using Chemometrics and Detection of Minor Crocetin Esters. Molecules 2018, 23, 1851. [Google Scholar] [CrossRef] [Green Version]
  46. Najafi, Z.; Zahran, H.A.; Yeşilçubuk, N.Ş.; Gürbüz, H. Effect of Different Extraction Methods on Saffron Antioxidant Activity, Total Phenolic and Crocin Contents and the Protective Effect of Saffron Extract on the Oxidative Stability of Common Vegetable Oils. Grasas Aceites 2022, 73, e480. [Google Scholar] [CrossRef]
  47. Vahedi, M.; Kabiri, M.; Salami, S.A.; Rezadoost, H.; Mirzaie, M.; Kanani, M.R. Quantitative HPLC-Based Metabolomics of Some Iranian Saffron (Crocus sativus L.) Accessions. Ind. Crops Prod. 2018, 118, 26–29. [Google Scholar] [CrossRef]
Figure 1. Normal plot of residuals for (a) picrocrocin and (b) crocins.
Compounds 03 00019 g001
Figure 2. Contour plots of (a) volume of saffron extract (mL) and % v/v aqueous ACN, (b) volume of saffron extract (mL) and aqueous ACN volume (mL), (c) % v/v aqueous ACN and aqueous ACN volume (mL), for picrocrocin model.
Compounds 03 00019 g002
Figure 3. Contour plots of (a) volume of saffron extract (mL) and % v/v aqueous can, (b) volume of saffron extract (mL) and aqueous ACN volume (mL), (c) % v/v aqueous ACN and aqueous ACN volume (mL), for crocins model.
Compounds 03 00019 g003
Figure 4. UV-Vis spectra of (a) picrocrocin solution obtained from SPE with 15% ACN/water (v/v), (b) crocins solution obtained from SPE with 50% ACN/water (v/v).
Compounds 03 00019 g004
Figure 5. Extracted ion chromatograms of (a) picrocrocin, (b) crocins, in negative (−ESI) mode. Peak numbers correspond to compounds of Table 2. * retention time.
Compounds 03 00019 g005
Table 1. Absorbance values of picrocrocin at 257 nm and crocin solutions at 440 nm, obtained under the optimized SPE conditions from twenty saffron samples.
SampleSample CodeHarvest YearAbsorbance at 257 nm 1Absorbance at 440 nm 2
1Standard 2420181.0850.771
2Standard 2020181.0310.658
3Extra 2520181.1810.759
4Extra 2020180.6540.748
5Extra 2120181.4950.713
6Extra 2220181.4490.618
7Extra 2320180.6350.720
8Bio EU 420181.8370.538
9Extra Bio EU 720180.6400.618
10Extra Bio EU 1720181.2790.671
11Bio EU 1120190.7680.870
12Standard 1420190.8160.575
13Extra Bio EU 920190.7970.853
14Bio EU 1020190.7550.872
15Extra Bio EU 620190.6140.667
16Standard 1020191.0470.834
17Bio Suisse 1120191.2840.756
18Standard 720190.8560.660
19Extra Bio EU 1320190.9640.795
20Extra 1220190.5780.748
1 A dilution factor of 5 has been applied; 2 A dilution factor of 20 has been applied.
Disclaimer/Publisher’s Note: The statements, opinions and data contained in all publications are solely those of the individual author(s) and contributor(s) and not of MDPI and/or the editor(s). MDPI and/or the editor(s) disclaim responsibility for any injury to people or property resulting from any ideas, methods, instructions or products referred to in the content.

