Article

Rheology and Phase Behavior of Surfactant–Oil–Water Systems and Their Relationship with O/W Nano-Emulsion’s Characteristics Obtained by Dilution

1
Laboratorio FIRP, Universidad de Los Andes, Mérida 5101, Venezuela
2
Grupo de Investigación en Fenómenos Interfaciales, Reologia y Simulacion de Transporte (FIRST), Universidad Industrial de Santander, Bucaramanga 680002, Colombia
*
Authors to whom correspondence should be addressed.
Nanomanufacturing 2023, 3(1), 20-35; https://doi.org/10.3390/nanomanufacturing3010002
Submission received: 23 December 2022 / Revised: 12 January 2023 / Accepted: 15 January 2023 / Published: 19 January 2023

Abstract

:
In order to study the relationship between the rheology of a surfactant’s concentrated dispersions and the oil and water liquid crystals from which O/W nanoemulsions (NEs) can be produced by water dilution, the phase diagram of a model SOW (surfactant–oil–water) system was constructed. The dispersion’s compositions to be characterized by rheology were chosen in the diagram’s regions that contain liquid crystal phases. For this, the dilution lines S/O = 25/75, 55/45, and 70/30 with a water content of 20 and 40 wt% (corresponding to surfactant concentrations between 15 and 55 wt%) were chosen. By adding these dispersions to a water pool, NEs were obtained, and it was shown that droplet size distribution depends on the amount of the liquid crystal phase in the initial dispersion and its rheology. The study of the oscillatory amplitude of the dispersion showed a linear viscoelastic plateau (G’ > G”) and a softening deformation region (G” > G’), indicating a viscoelastic behavior of the dispersions. The study was carried out at a constant temperature of 30 °C, and the results show that rheological characterization by itself is not enough to predict that monomodal droplet distributions are obtained. However, the presence and quantity of lamellar liquid crystal phase are important to obtain monodisperse and kinetically stable NEs.

1. Introduction

Nano-emulsions, NEs, are thermodynamically unstable systems that have a droplet size between 20 and 200 nm [1,2,3]. The main physicochemical properties that determine the role of NE in different applications are their nanometric range droplet size and their high kinetic stability, which can be obtained for lower surfactant concentrations than those required to obtain a microemulsion. These characteristics are defined by the formulation and composition of surfactant–water–oil (SOW) systems. NEs are used in enhanced oil recovery [4,5,6]; in the pharmaceutical industry to encapsulate nutrients, vitamins, medicines, colors, etc.; in cosmetics [2,7] and food [8]; as pesticides [2,9,10]; and in miniemulsion polymerization systems [11].
Due to their applications, great interest has been generated in studying the factors that influence the formation of NE and their physicochemical properties. There are basically two methods to obtain them: the high-energy method and the low-energy method [1,12,13,14,15,16,17,18]. Low energy methods were introduced in the 1970s by Lin T. J. [19], and a mixture of two of these methods is used in this study. This method consists of generating a concentrate composed of water–oil and surfactant [20], which, by adding an appropriate amount of aqueous phase with gentle agitation and low rpm at a constant temperature [3,14,17,20,21,22,23,24], forms an emulsion with small droplet size. Sagitani [3] established that, in order to obtain an O/W emulsion with a small droplet size and low polydispersity, the formation of a lamellar liquid crystal phase during the dilution process is essential to produce a nanoemulsified system. However, other studies conclude that the morphological evolution of the system during the emulsification process by phase inversion is still not entirely clear [16], and they maintain that the mechanism for NE formation is related to the homogeneous nucleation of droplets of oil during emulsification [20].
Because the physicochemical properties of NEs depend on their composition, distribution, and the nanometric size of the droplets (which gives these systems high kinetic stability), it is important to study not only the phase behavior of the initial concentrated system but also the rheology of the different phases formed during the emulsification process. Numerous studies on the rheological behavior of the different lamellar, hexagonal, and cubic liquid crystal phases show viscoelastic and non-Newtonian behavior [24,25,26,27,28,29]. Biradar et al. [30,31] consider that the analysis of the rheological properties of the liquid crystal phases is useful to evaluate their effect on the performance of self-emulsification. Additionally, they conclude that nanometer-sized droplets are obtained if the liquid crystal phase is slightly viscous since the resistance against deformation is lower. On the other hand, if the liquid crystal is very elastic, the resistance to deformation is greater, and therefore, larger drops would be formed.
This study’s objective is to relate the rheological properties of dispersions containing liquid crystals, water, and oil with the formation and characteristics of NEs obtained by diluting them in water at a constant temperature and with gentle agitation. For this study, a non-ionic surfactant mixture, (S)/liquid paraffin (O)/water (W), was chosen as a model system. The hydrophilic–lipophilic balance, HLB, of the non-ionic surfactant mixture is 12.

2. Materials and Methods

2.1. Materials

Two non-ionic surfactants, Span 20 (S20) and Tween 80 (T80), were used. Span 20 are sorbitan esters of the monolaurate type with a molecular weight of 346.52 g/gmol, a density of 0.95 g/mL at 25 °C, and an HLB of 8.6. Tween 80, also known as Polysorbate 80, is made up of sorbitan rings of the monooleate type and polyethylene oxide with an HLB of 15. Sigma Aldrich supplied both surfactants. For this study, the surfactants were mixed to attain an HLB of 12. The oil phase was liquid paraffin supplied by Científica Andina (Merida, Venezuela) with EACN 14 and Milli-Q grade water used.

2.2. Methods

2.2.1. Phase Diagram

The phase diagram was made by weighing different relations of surfactant/paraffin (S/O), being the surfactant a mixture of T80 and S20 with an HLB of 12. Water (W) was added to these previously weighed mixtures of surfactant and paraffin until changes in system’s appearance were observed, such as turbidity or birefringence after each water addition. Then, for different S/O ratios, various systems were prepared with different amounts of water; each sample was weighed in a flame-sealed glass ampule. These ampules with the S/O/W mixture were mixed and homogenized using vibration equipment (VORTEX), and the samples were subjected to ultrasound for 3 min to eliminate the foam. After that, the samples were stored on a stove at 30 °C. The samples were left at constant temperature until equilibrium was reached. The number of phases and their volume were determined for each studied composition. The type of liquid crystal was identified using a Nikon optical microscope; model Eclipse E600 Pol with crossed polarizers.

2.2.2. Emulsion Formation

The initial concentrated dispersions to be diluted in a determined water amount to obtain O/W NE were chosen according to the type of phases identified from the phase diagram constructed. In this way, the initial systems to be diluted had a liquid crystal phase with one or two liquid phases in different proportions (Table 1). Three dilution lines were chosen, S/O = 25/75, 55/45, and 70/30, and two different initial amounts of water for each dilution line.
The method consisted of: I) an initial dispersion was formed when oil and surfactant were stirred at 250 rpm with an RW 20DZM propeller (IKA Labotekchnic, Germany) for one minute until homogenization. Then, water was added dropwise until dispersion’s initial water content of 20 or 40 wt.% by weight was reached. II) The homogenized system was diluted in a pool of water to obtain NEs at a surfactant concentration of 5 wt%. The process was carried out at a constant temperature of 30 °C, and the NEs were characterized by droplet size distribution and kinetic stability.

2.2.3. Electrical Conductivity

The system’s conductivity was measured using a Tacussel model CD 6N conductmeter, with conductivity cell constant of 1.02 cm−1 calibrated using standard KCl solutions. The cell was immersed in the dispersed system (Table 1) and stirred at 250 rpm, taking care that the magnet (stirrer) did not touch the conductivity cell. The conductivity measurements were carried out along the NE formation pathway by adding aqueous solution of 10−2 M NaCl instead of pure water because the surfactants are of the non-ionic type [32,33,34]. Each conductivity measurement reported is the average value of three measurements made for each chosen composition. The conductivities were determined at a temperature of 30 ± 0.5 °C.

2.2.4. Droplet Size and Stability

The NE’s droplet size and distribution were measured by laser light diffraction in a Malvern Hydro 2000 MU particle size analyzer. The stability was visually monitored at T = 30 °C for six months.

2.2.5. Rheology of Initial Dispersions

The rheological tests were performed using a control stress rheometer, model AR-G2 from TA Instruments with a cone and plate geometry (cone angle 1°59′26′’, cone diameter 60 mm, and truncation 55 μm). Oscillatory measurements were made to determine the linear viscoelasticity region; the measurements were made at 30 °C at a constant frequency of 1 Hz. For this amplitude sweep, the shear stress was varied from 0.0001 to 100 Pa. Then, frequency sweeps were performed at a constant shear stress, and angular frequency was varied from 0.00015 to 100 Hz. All samples were measured after a certain time after being obtained (10 min) and were left for 15 min in the sensor system before making any measurement at a constant temperature of 30 °C.
The rheological behavior was studied in those dispersed systems that contain the liquid crystal phase in the dilution lines S/O = 25/75, S/O = 55/45, and S/O = 70/30 (Table 1), and water concentrations of 20 and 40% wt. In addition, to study the crystal liquid’s phase rheology of the systems with 20 and 40 wt% water (S/O = 25/75), they were put in sealed glass bulbs at constant temperature of 30 °C until equilibrium was obtained and the phases were separated. Once this happened, the liquid crystal phase was extracted and measured.

3. Results and Discussion
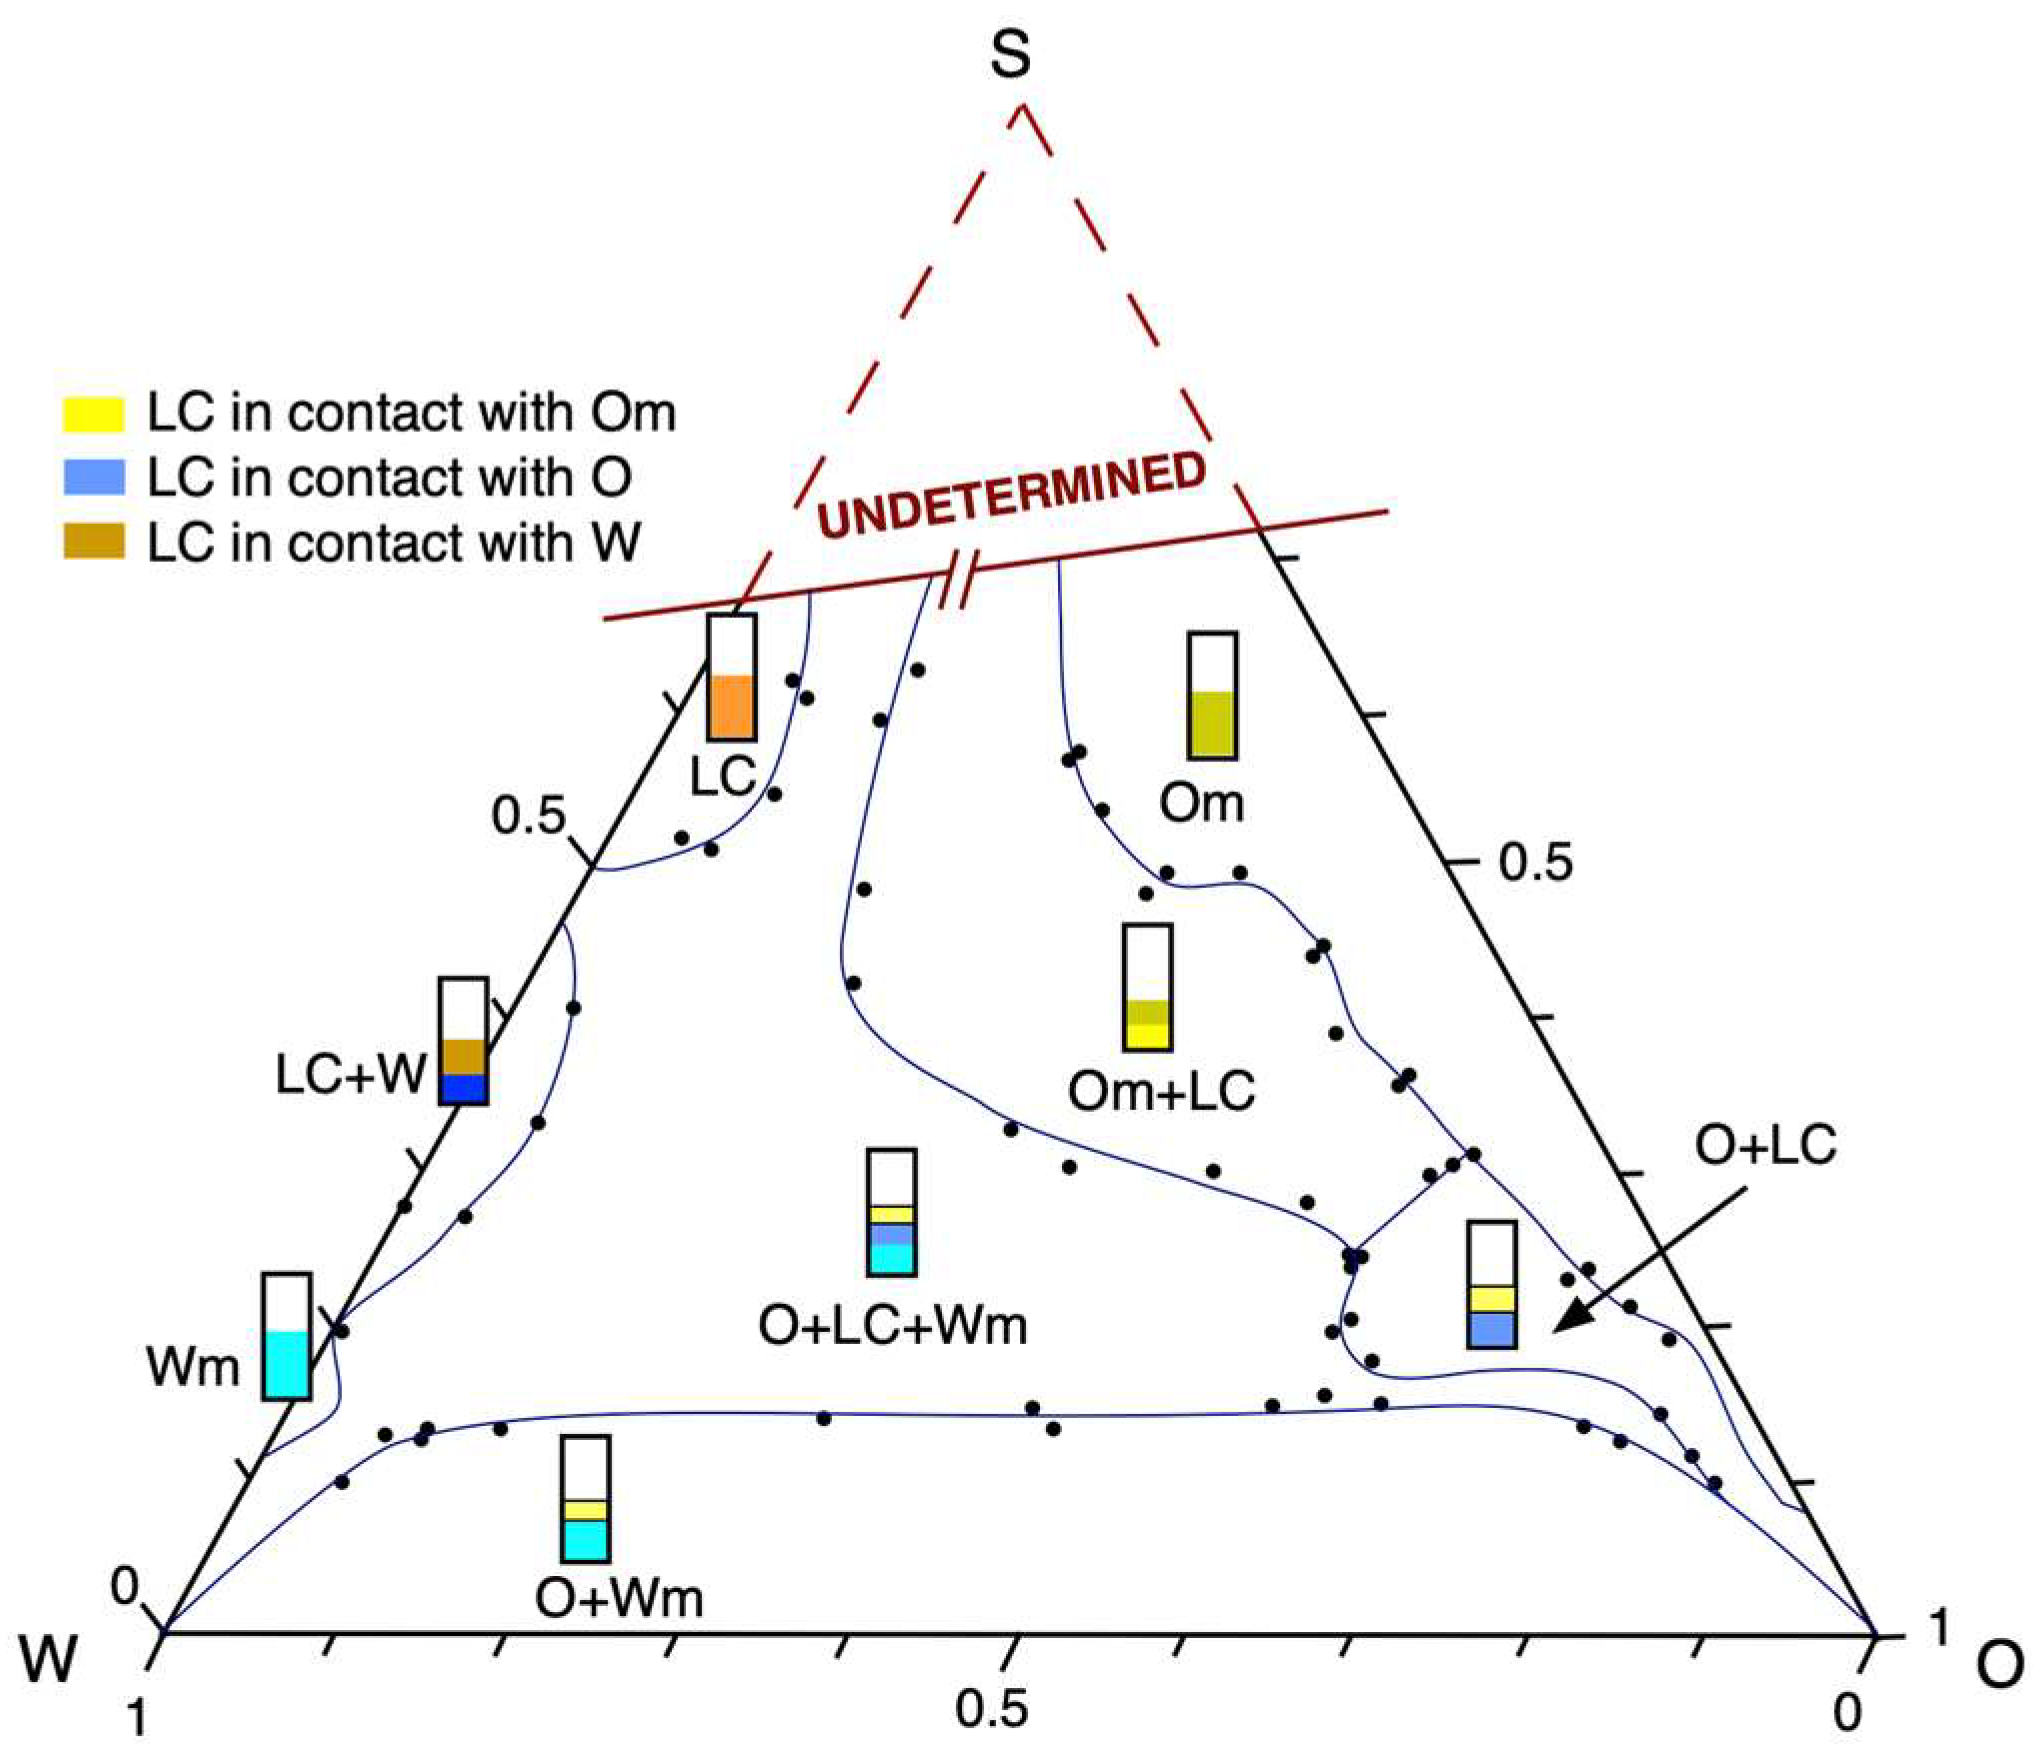
3.1. Phase Diagram

The phase type existing in a surfactant–oil–water system in equilibrium was determined. This means that by obtaining a complete phase separation, we can know not only the number of phases present in the different compositions but also their volume fraction [35]. Figure 1 shows the phase proportions in a qualitative way to illustrate the different systems.
The phase diagram of the pseudo-ternary system of water (W) non-ionic surfactant mixture with an HLB of 12 (S) and liquid paraffin (O) at 30 °C is presented in Figure 1. The diagram shows three one-phase regions, of which two are isotopic: Om (W/O microemulsion) and Wm (O/W microemulsion), and one lamellar liquid crystal LC. According to the literature, the Om oily region corresponds to inverse micelle structures or W/O discrete microemulsions [36,37,38]. This phase is located practically along the surfactant–liquid paraffin axis.
On the S/W axis, with a water content greater than 75% w/w, there is a small Wm region that corresponds to an O/W microemulsion or normal micellar solution [36,39,40]. On the same axis, there is another monophasic region that corresponds to lamellar liquid crystal LC that contains approximately up to 10% w/w of oil. The remainder of the diagram presents two- and three-phase regions in equilibrium.
For S/O ratios between 5/95 and 35/65, a biphasic zone is located in which an oily phase O and LC coexist. For higher dilution lines than 35/65, another region formed by the Om and LC phases is observed.
The colors shown in the diagram (Figure 1) pretend to be similar to those observed in the SOW pseudo-ternary system at 30 °C. In those regions where the oily phase is in contact with the LC, the coloration of the latter turns bluish, and when it is in contact with the isotropic phase Om, the LC takes a yellow–transparent appearance. This can be strongly influenced by the existence of a birefringent to the movement phase at the beginning of the O + LC biphasic zone. In the region of the two phases O + LC, with water amounts between 10 and 20 wt%, the liquid crystal phase exhibits birefringence to movement. This behavior of some mesophases were studied and could correspond to a phase with a bicontinuous or sponge-like structure [41,42,43,44].
As expected, the biphasic region (O + Wm) is located at the bottom of the diagram along the W/O axis; the surfactant in this region goes to the aqueous phase because a bluish color is observed in the aqueous phase (Wm), which implies a Winsor I system, and within this region, all the NE were obtained. Toward the W/S axis, near the W vertex, another biphasic zone with a liquid crystal in equilibrium with water (LC + W) is found. Finally, at higher surfactant concentrations, a three-phase zone (O + LC + Wm) is found over the oil (O +Wm) biphasic zone.

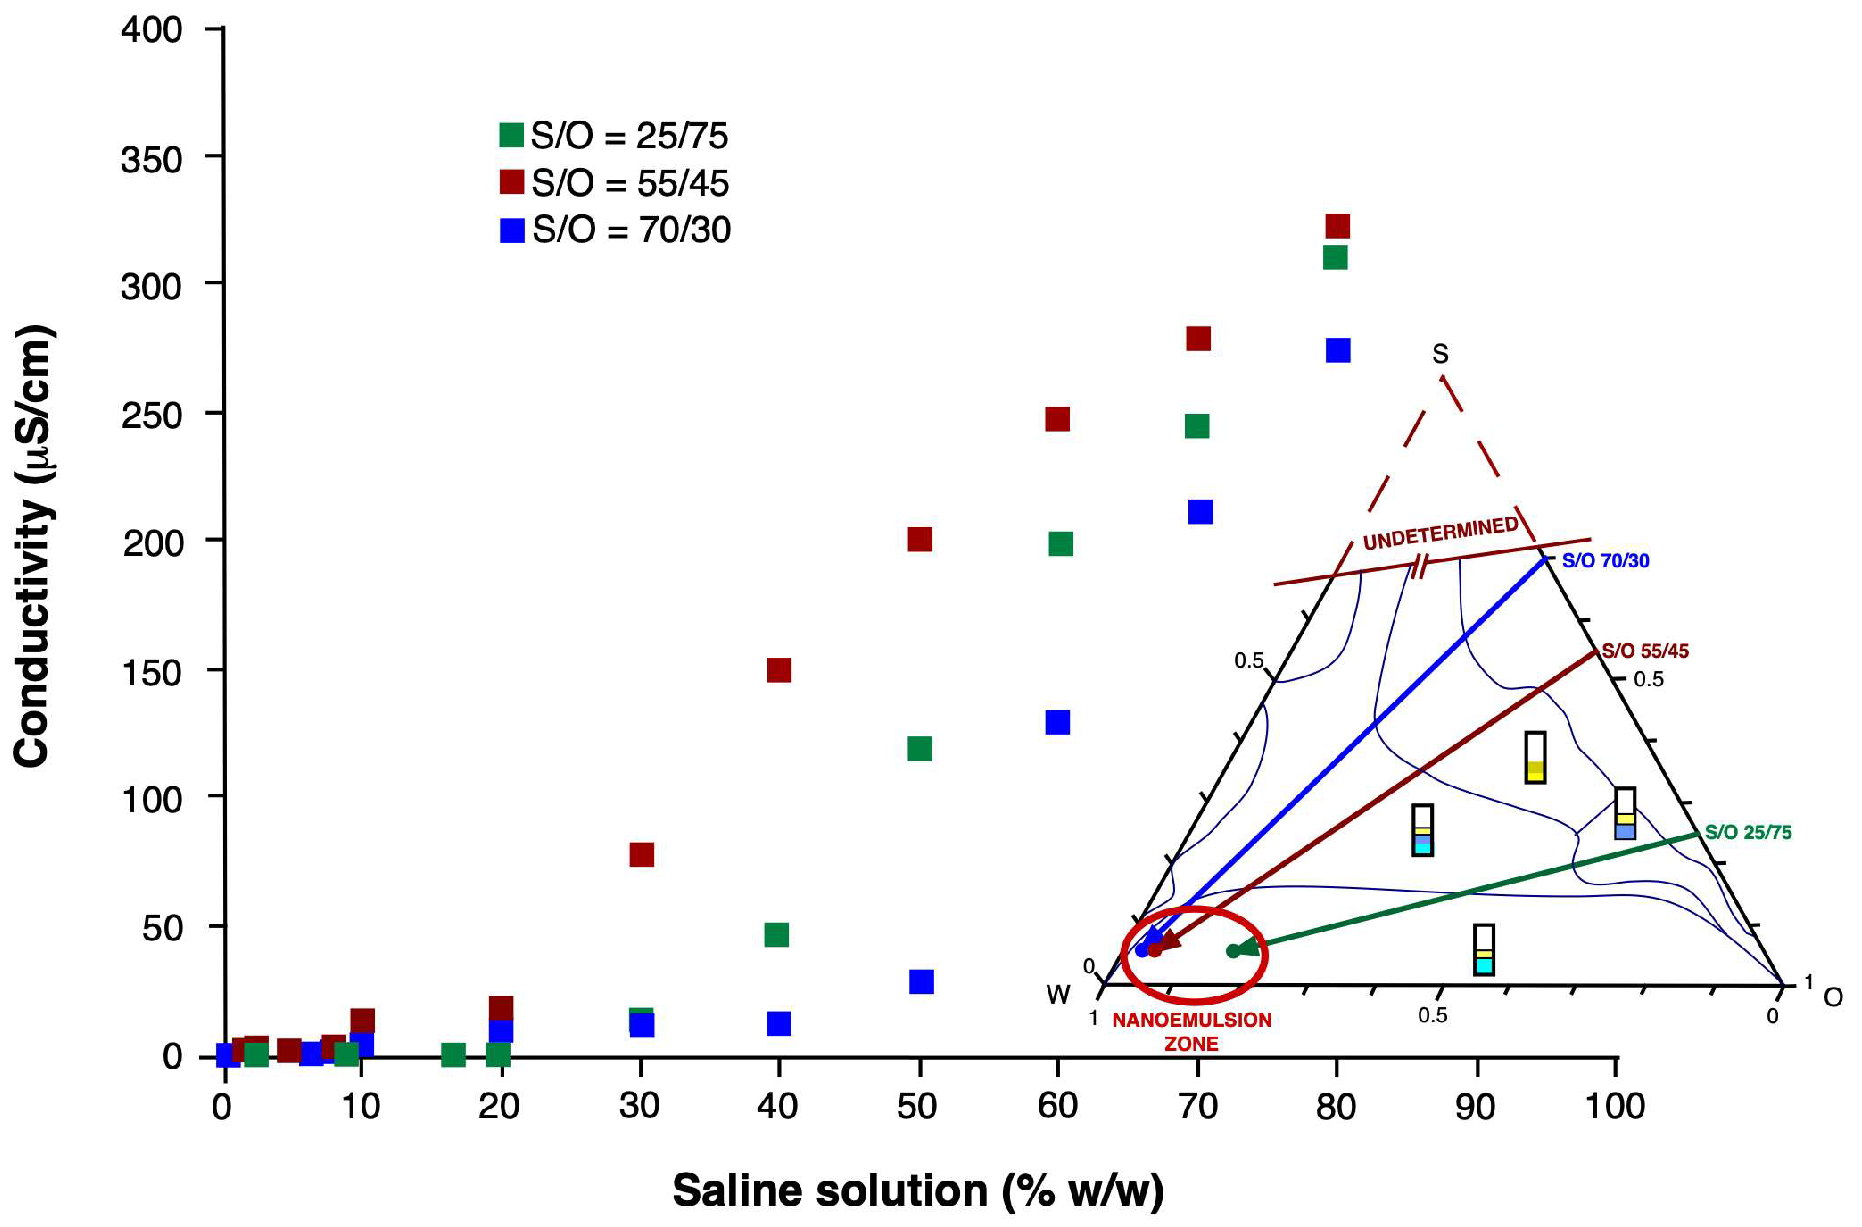
3.2. Electrical Conductivity
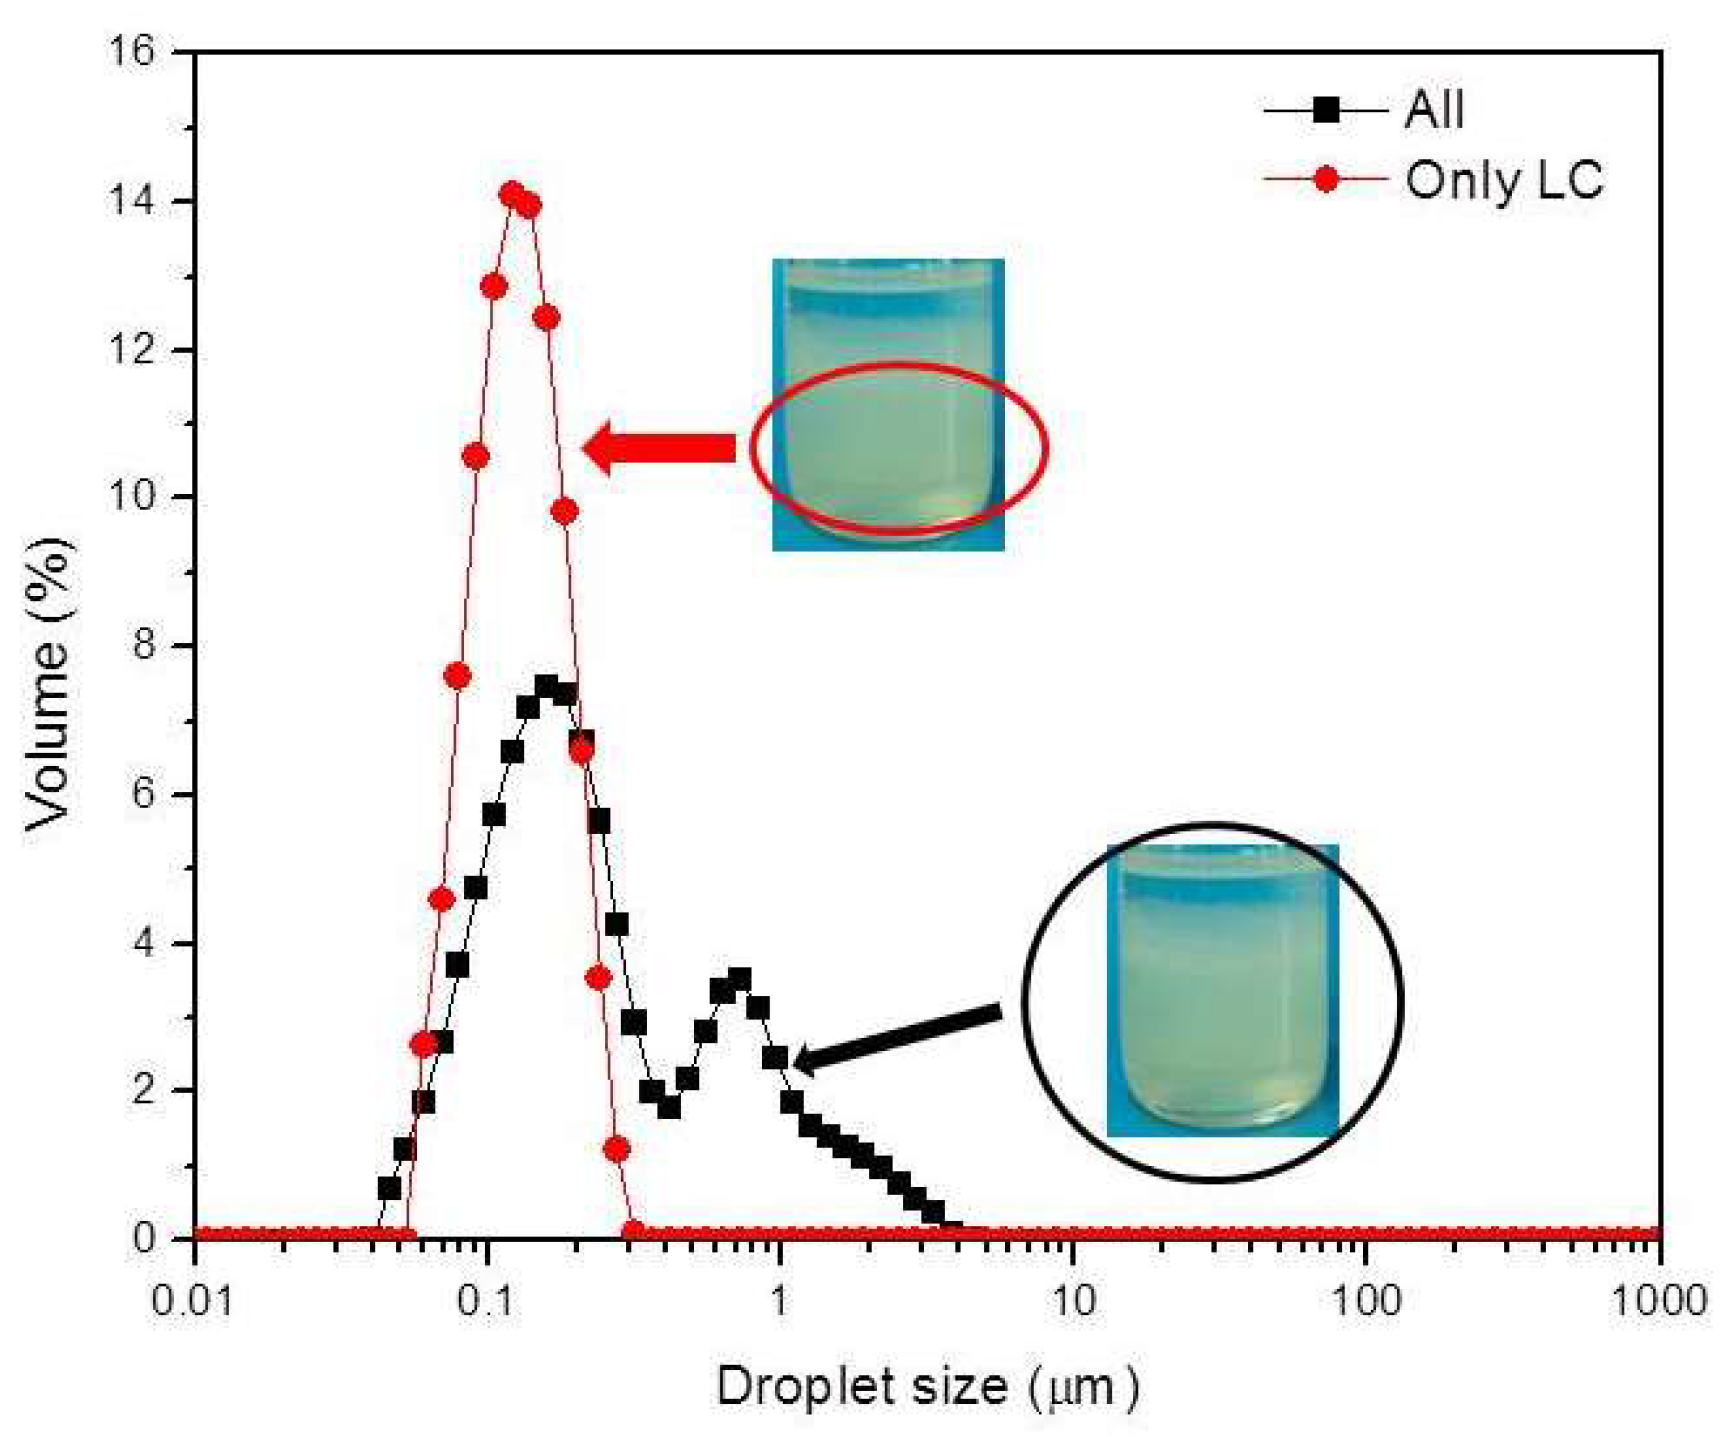
Figure 2 shows the electrical conductivity of the dispersions. The electrical conductivity was measured for different amounts of an aqueous phase in the dilution lines studied, S/O = 25/75, 55/45, and 70/30, at a constant temperature (30 °C). As expected, adding an aqueous phase to the dispersions where S/O = 25/75 increases the conductivity when the system leaves the zone (O + LC) and arrives to (Om + LC + Wm) with a water amount of 21 wt% and, finally, to the (O + Wm) regions with water amount of 42 wt%. Consequently, when the water increases from 40 to 80 wt%, the electrical conductivity increases linearly because the external phase of the dispersion is the aqueous phase.
When water is added to the dilution line where the ratio S/O is the highest and S/O = 70/30, it is observed that the conductivity is constant (20 μS.cm−1) from 20 to 40 wt% in the biphasic region (Om + LC). When the amount of water reaches 50 wt%, the dispersion is inside the area (O + LC + W), and the conductivity increases linearly as a function of the amount of added water, which confirms that the water is the external phase of the dispersion.
In the 55/45 dilution line, the highest conductivity values are obtained during the addition of water to the system. This means that the inversion point occurs at lower amounts of water and could be related to the structure that the system acquires when it is dispersed. The inversion of the dispersed system occurs around 10 wt% of the aqueous phase in the zone (Om + LC). It was studied that dispersed systems exhibit sudden changes in electrical conductivity when the composition varies at a fixed temperature. Some authors interpreted it as a process similar to percolation [32], while others argued that the change in conductivity is caused by a reversal of dispersion that occurs independently of the volume fraction of the conducting phase [45].

3.3. Droplet Size

Figure 3 shows the NE’s distribution of the droplet size obtained in the line S/O 25/75 as a function of the water content in the initial dispersed system. By increasing the aqueous concentration in the initial dispersions, the proportion of bigger droplets increases, and its effect is observed in the bimodal distribution of the droplet size of the final NE. This behavior is also observed in the S/O 70/30 dilution line (Figure 4), where the bimodality of the NE is also present.
Figure 5 shows the droplet size distribution of the NE formed in the S/O 55/45 dilution line, and in this case, it only presents one mode, resulting in an NE with a smaller average droplet size and greater kinetic stability.
Table 2 shows the droplet sizes D(0.5) in µm for each of the NE formed in each dilution line.
Figure 6 shows the droplet size distribution of the NE obtained by diluting the dispersion in the line S/O = 25/75 containing 20% water. The NEs were prepared from 1) the liquid crystal together with the oily phase (O + LC) (All) and 2) the liquid crystal separated from the oily phase (Only LC). The figure shows that when the NE is formed with only the liquid crystal separated from the system, the droplet size distribution of the NE has a single mode and droplet size D (0.5) 0.117 µm. When the entire system (liquid crystal plus oil phase) is used to form the NE, the droplet size distribution is bimodal and D(0.5) is 0.185 µm. This seems to show that if the oil phase is completely integrated into the liquid crystal, smaller droplet sizes and more stable NE can be obtained since the largest droplets come from the separated oil and are not integrated into the liquid crystal.

3.4. Type of Liquid Crystal

Figure 7a shows the oily lines, which are named from their appearance, of the dispersed S/O 25/75 system whose initial water content corresponds to 20%. This texture is due to defects that subdivide the ideal structure composed of flat and parallel layers into domains and appears as long bands with a complex internal structure [46].
Figure 7b shows the lamellar liquid crystals’ texture, a mosaic, very fine and without a very regular texture which is clearly noticeable. Moreover, it shows the extinction crosses of the negative uniaxic liquid crystals for the same sample in Figure 7a.

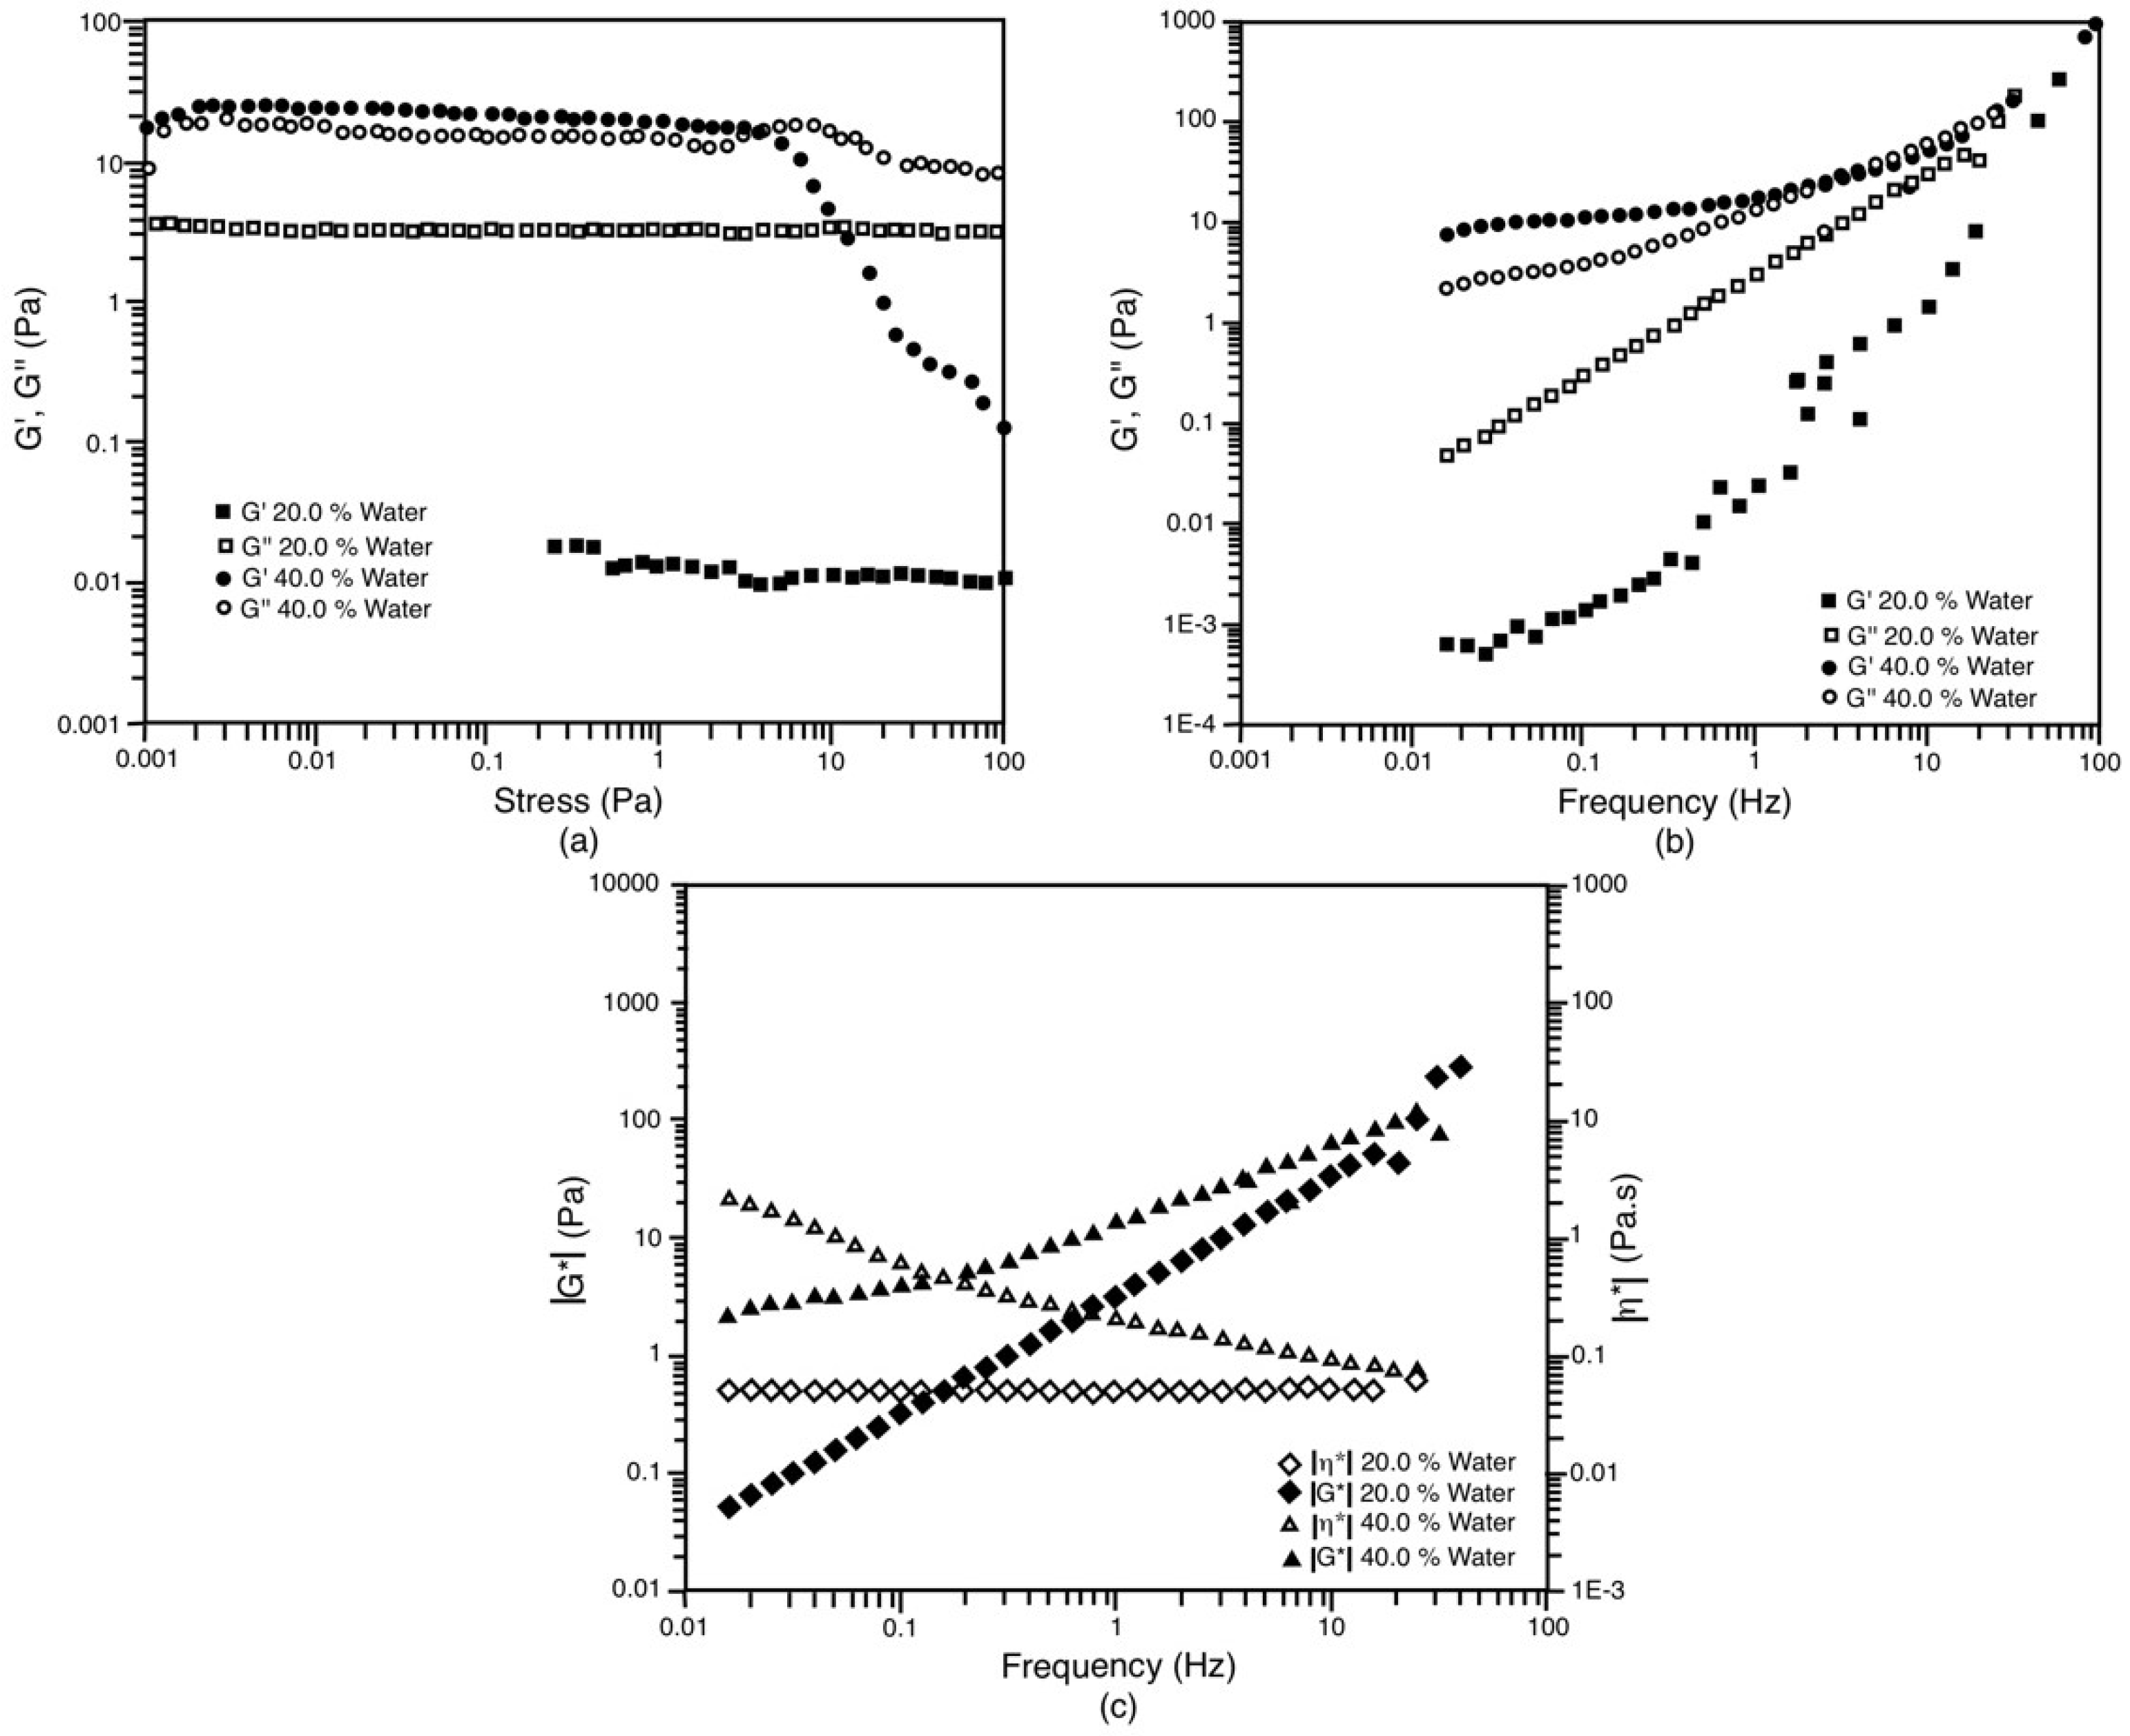
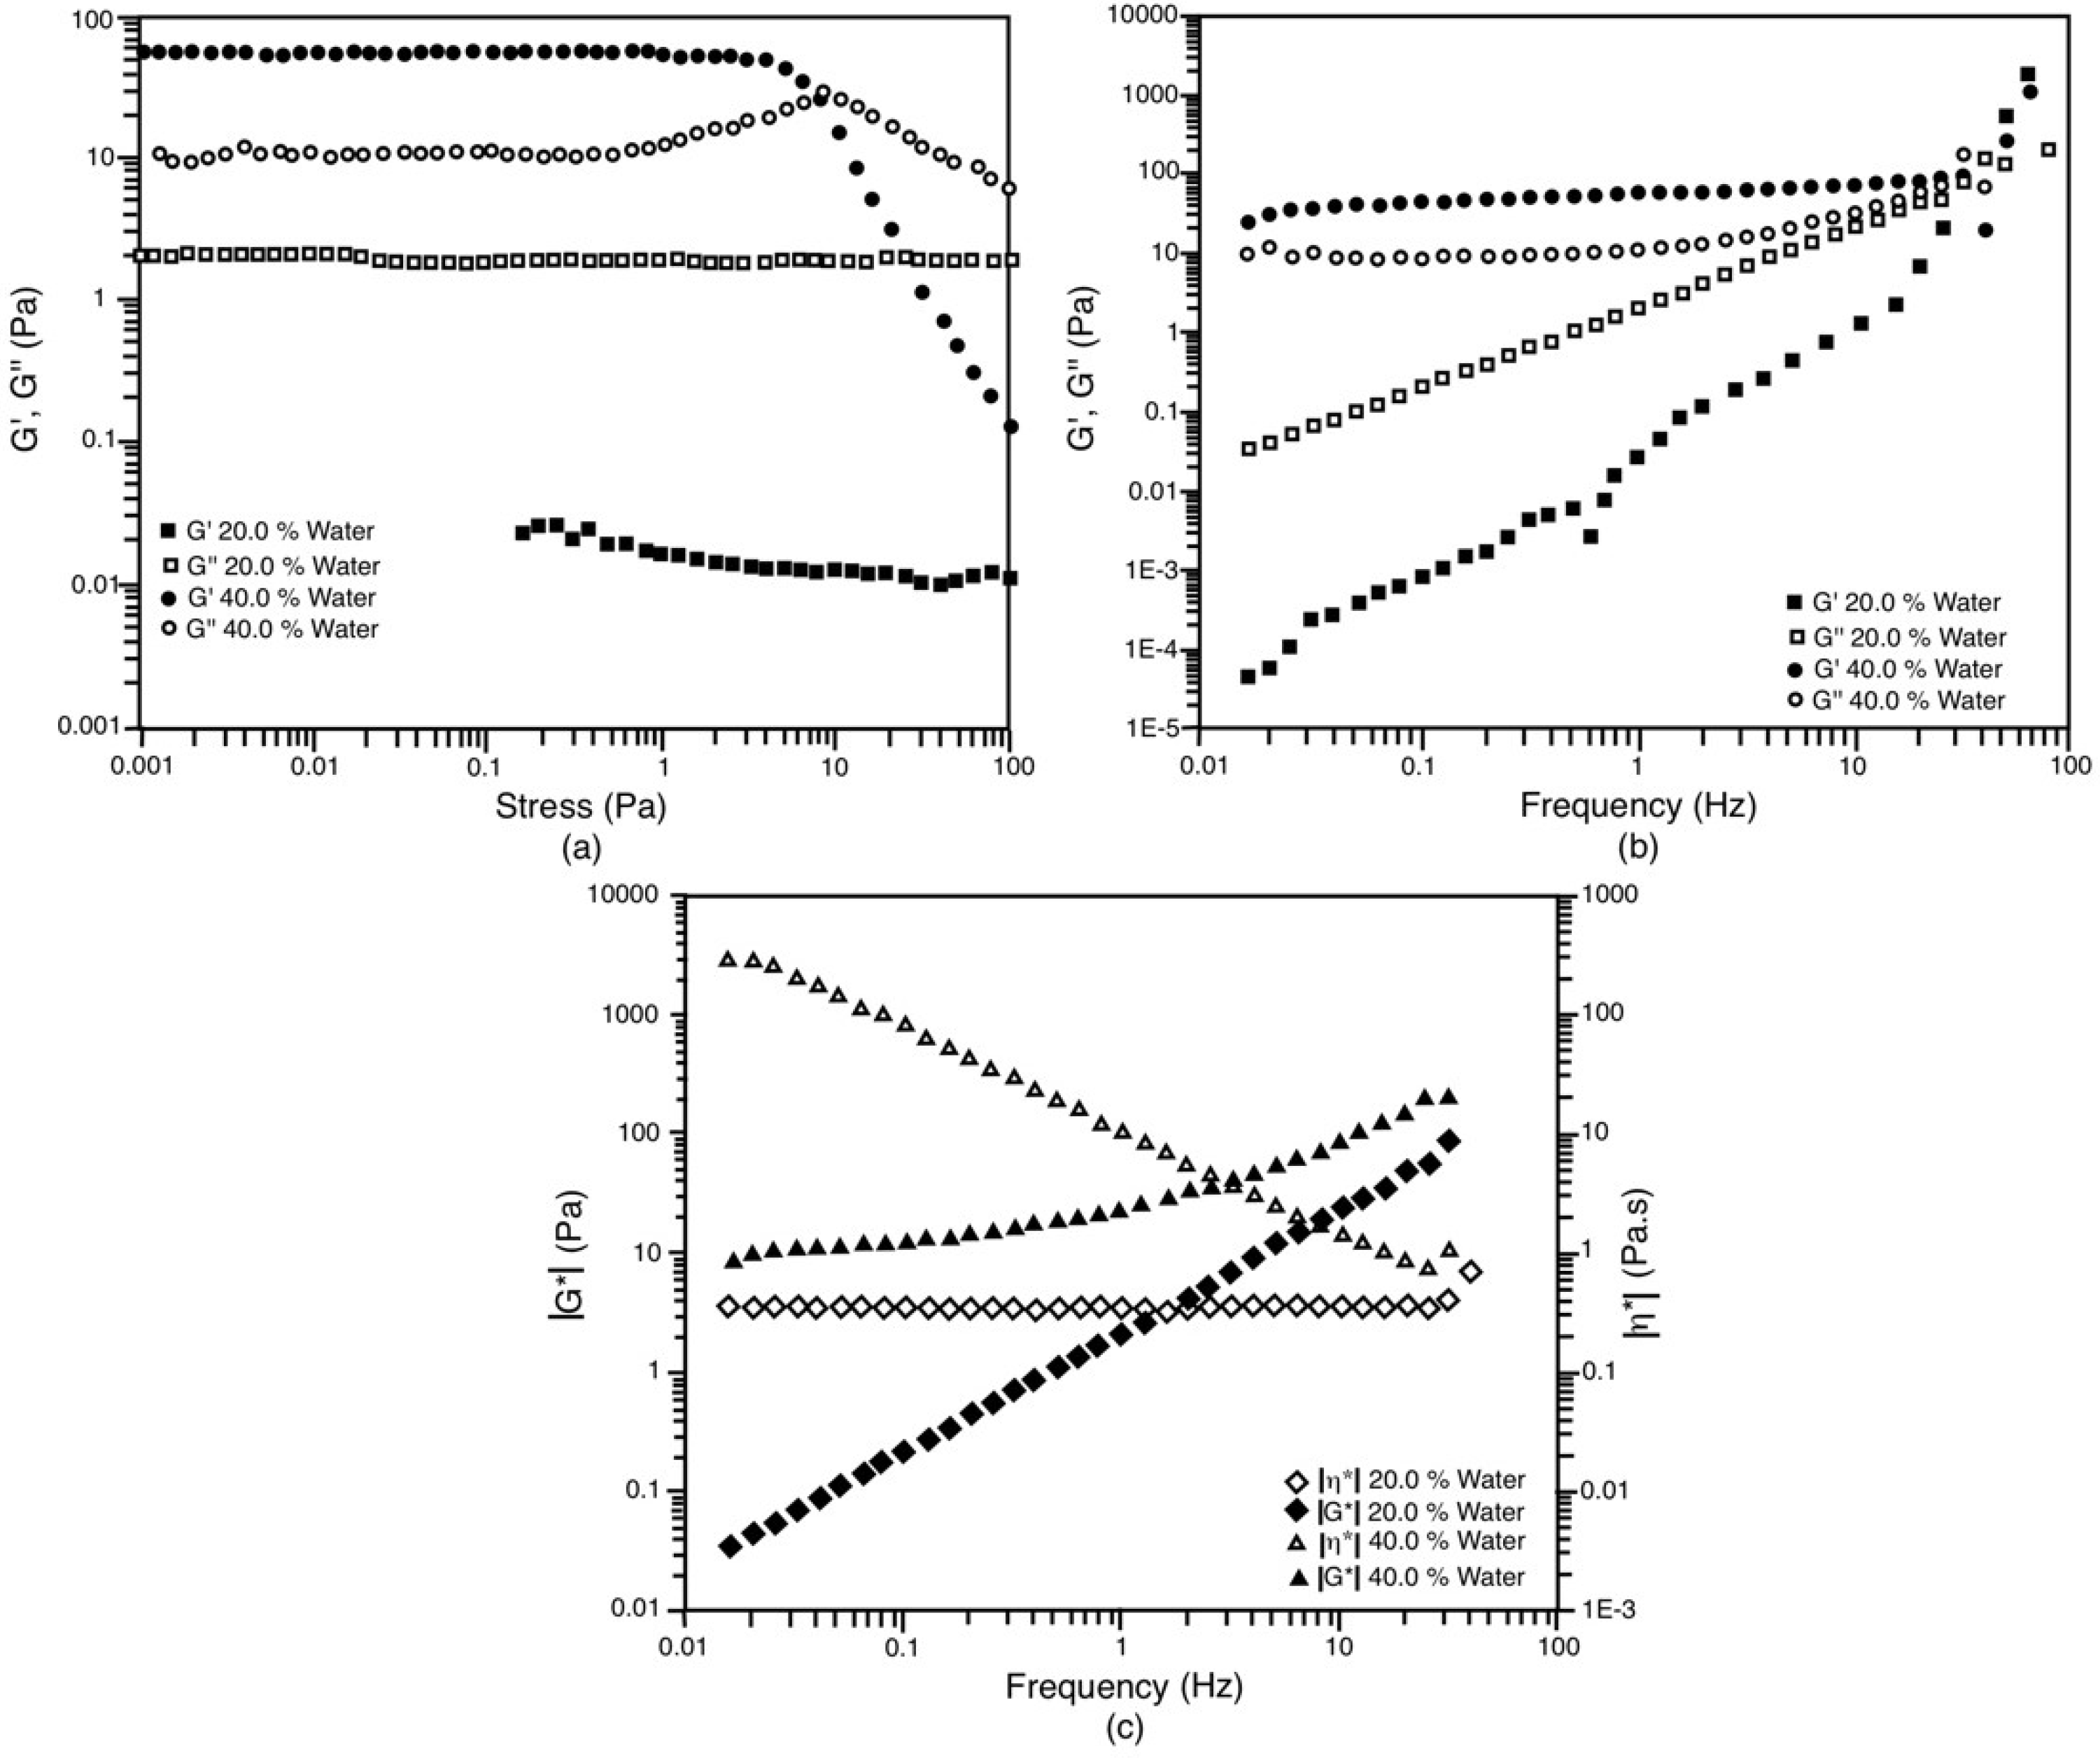
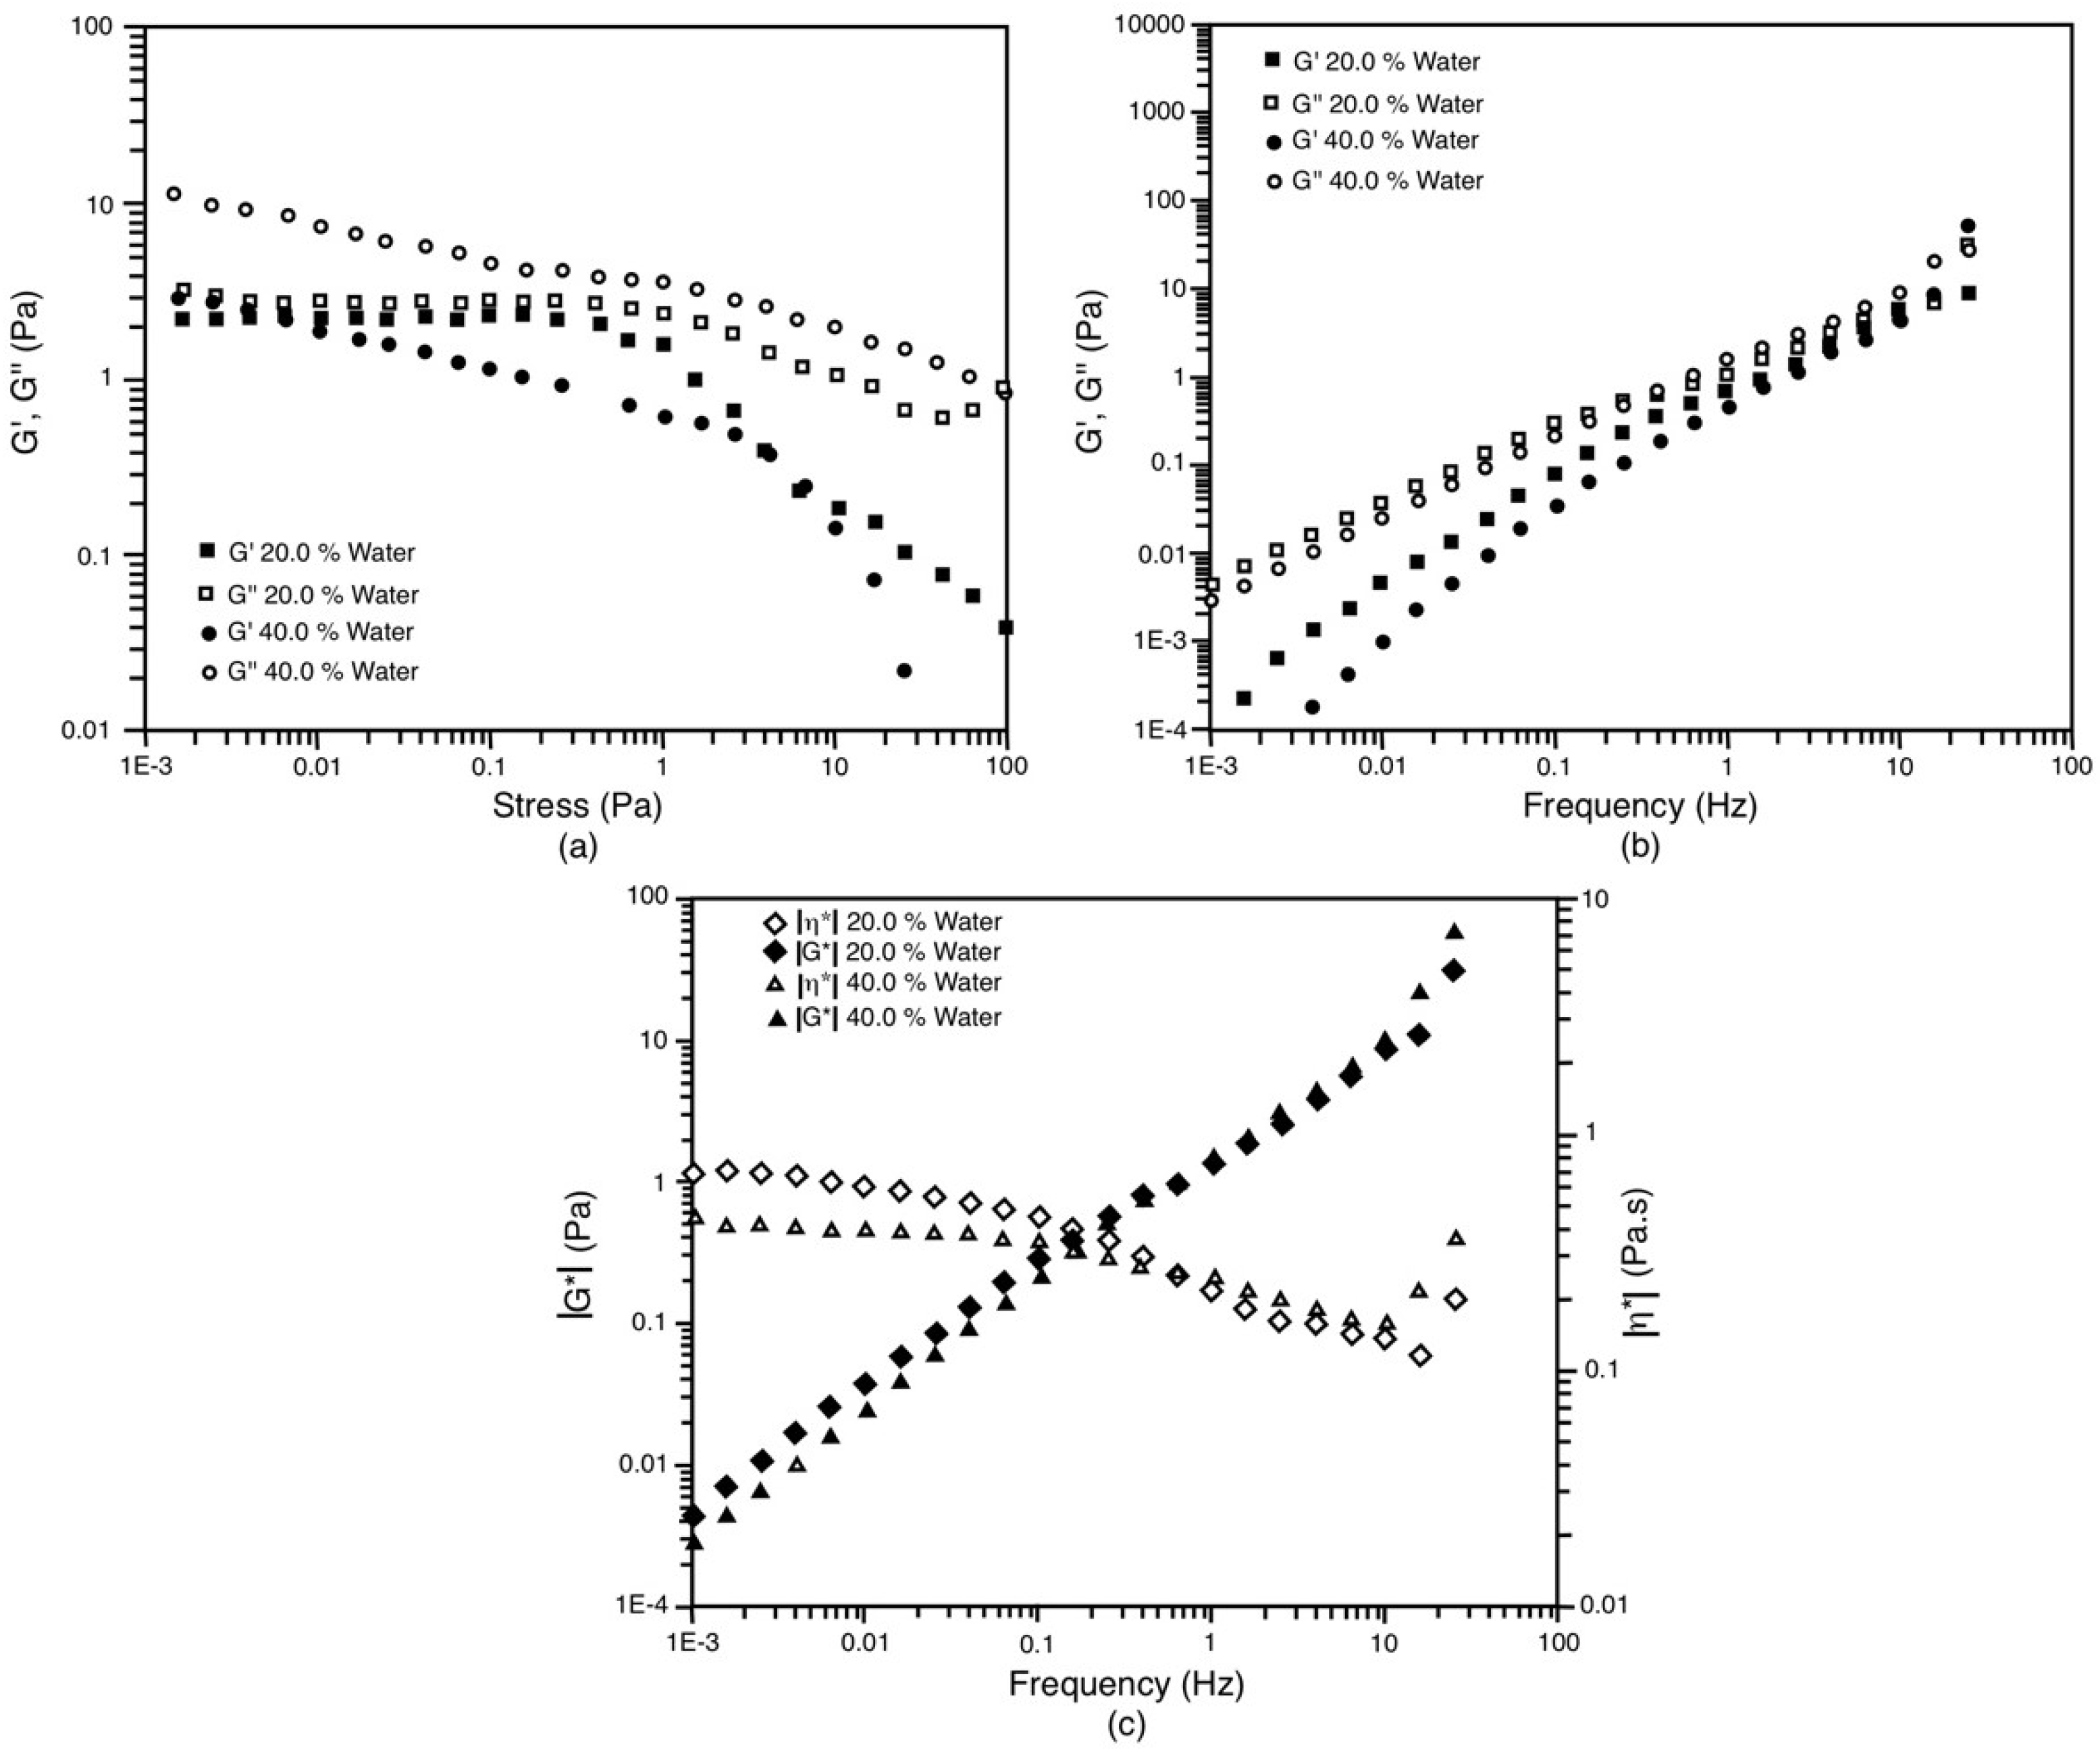
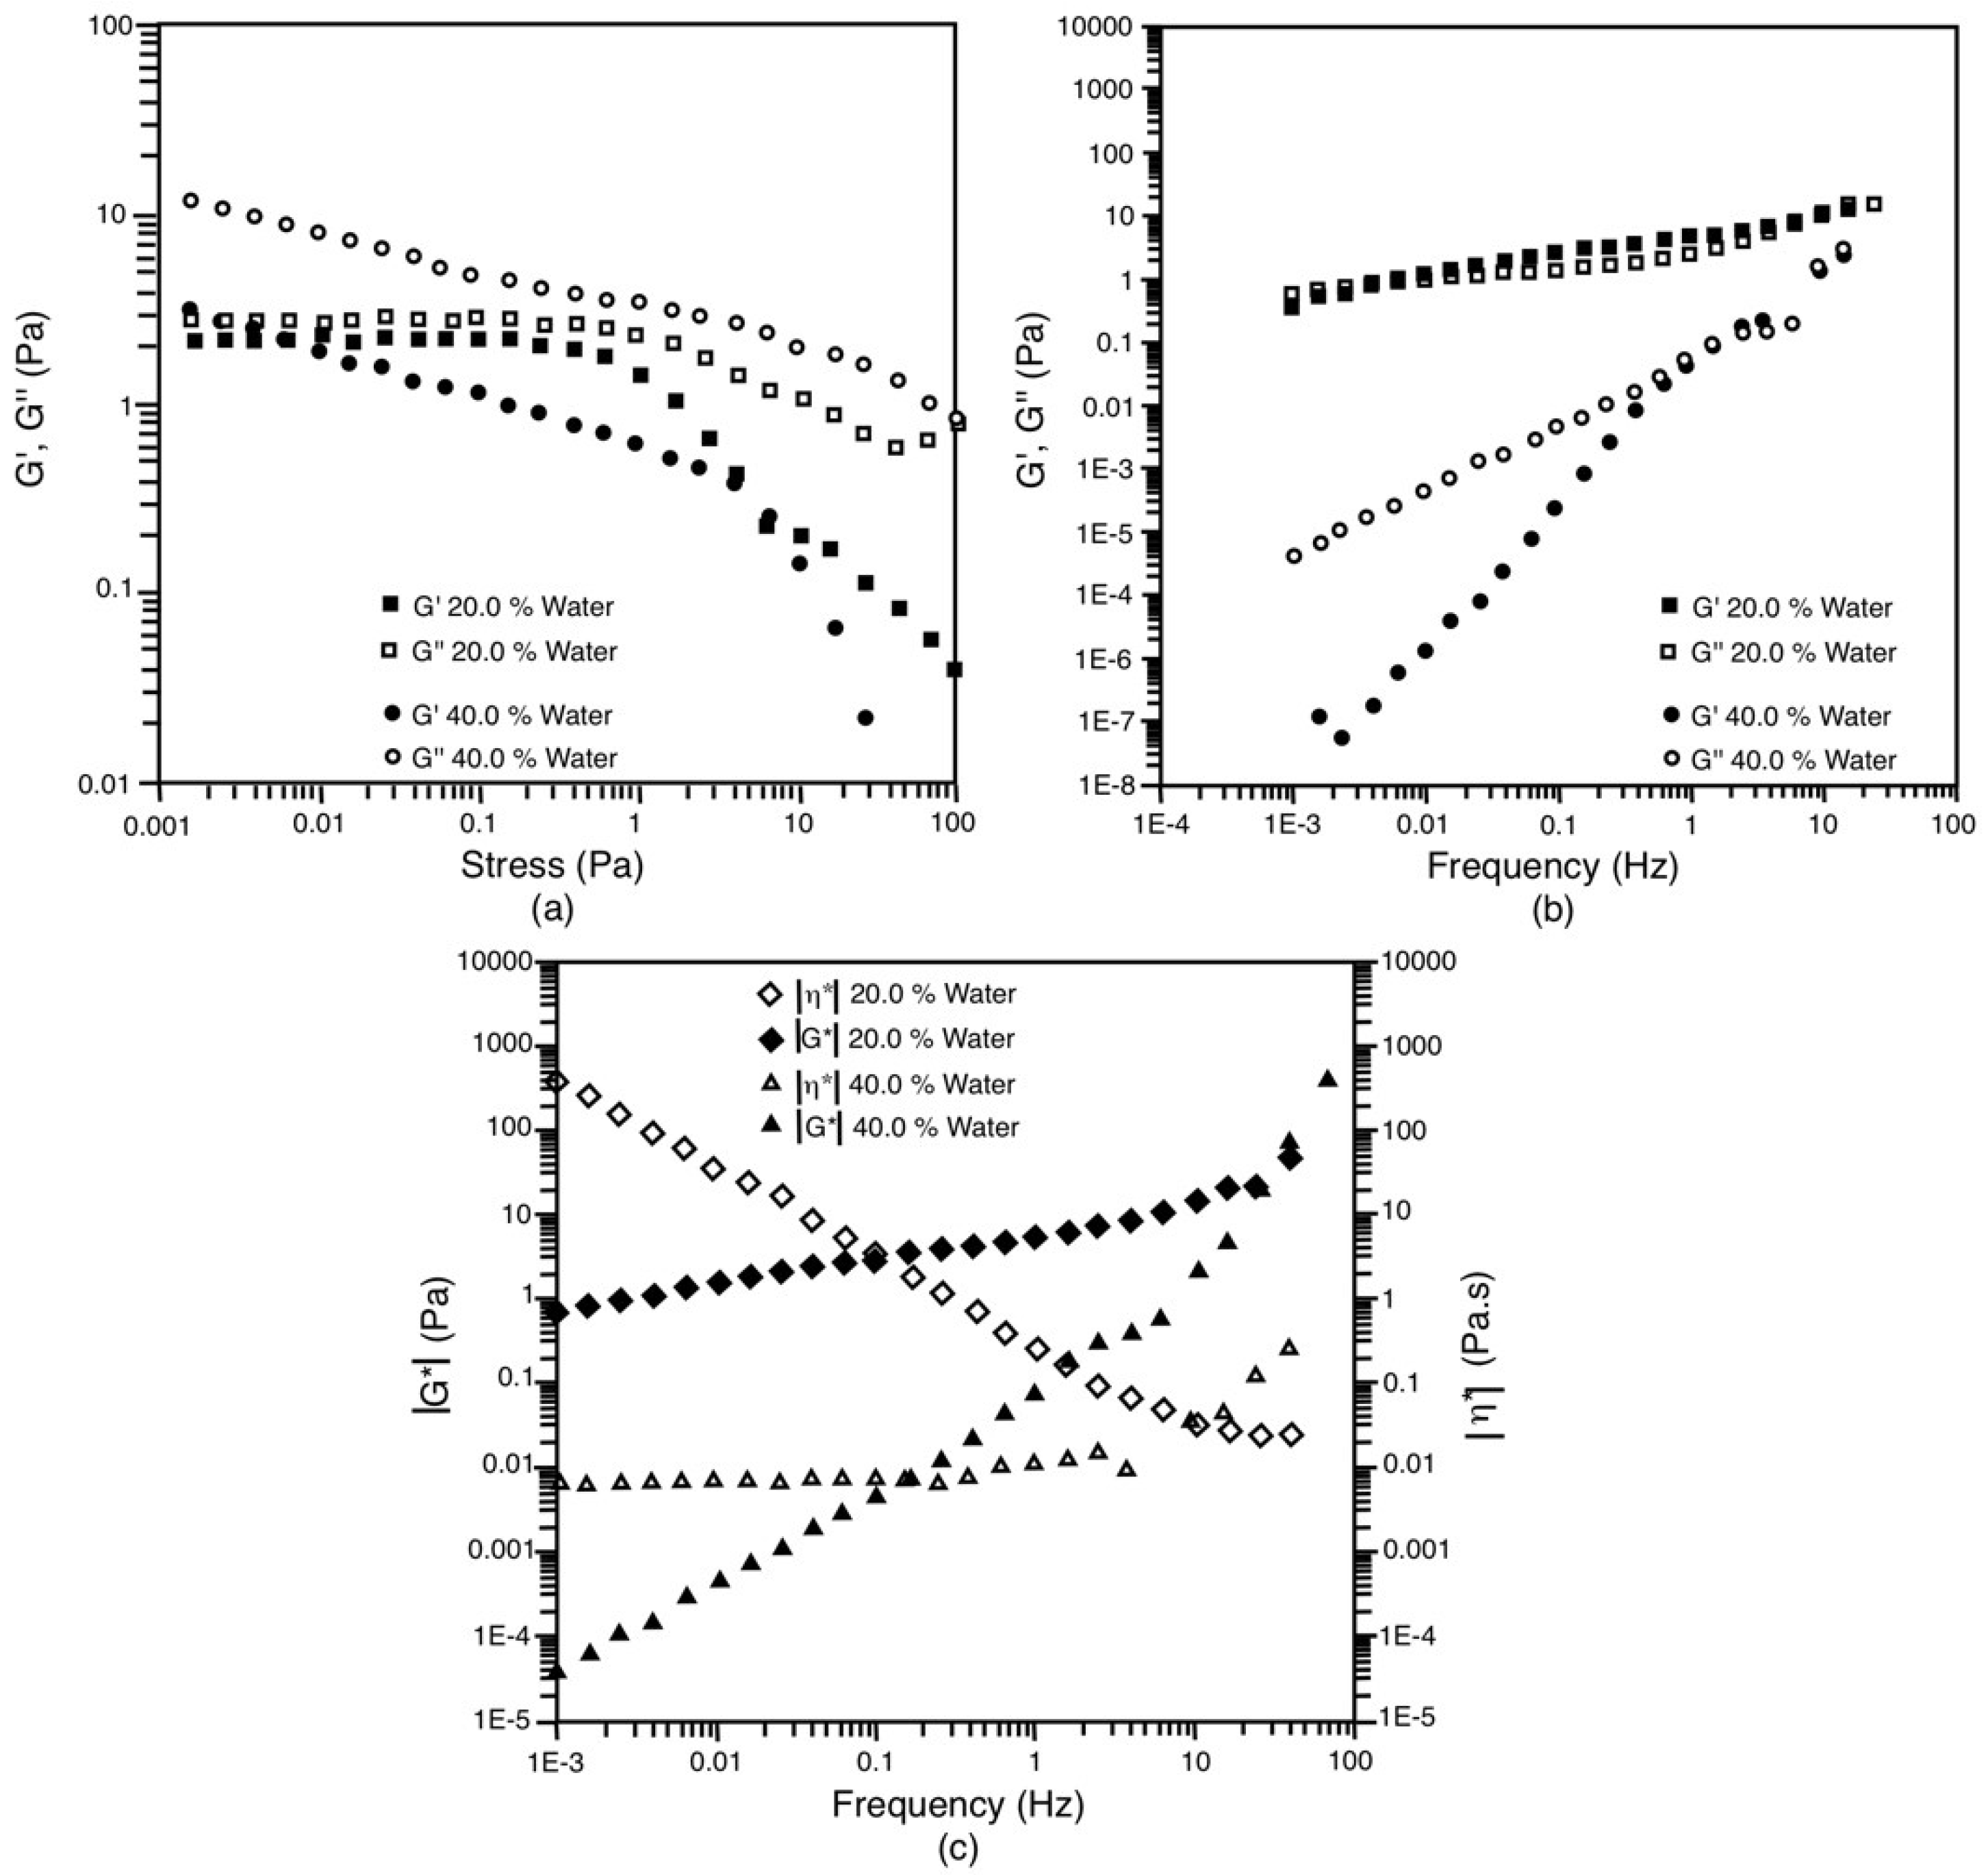
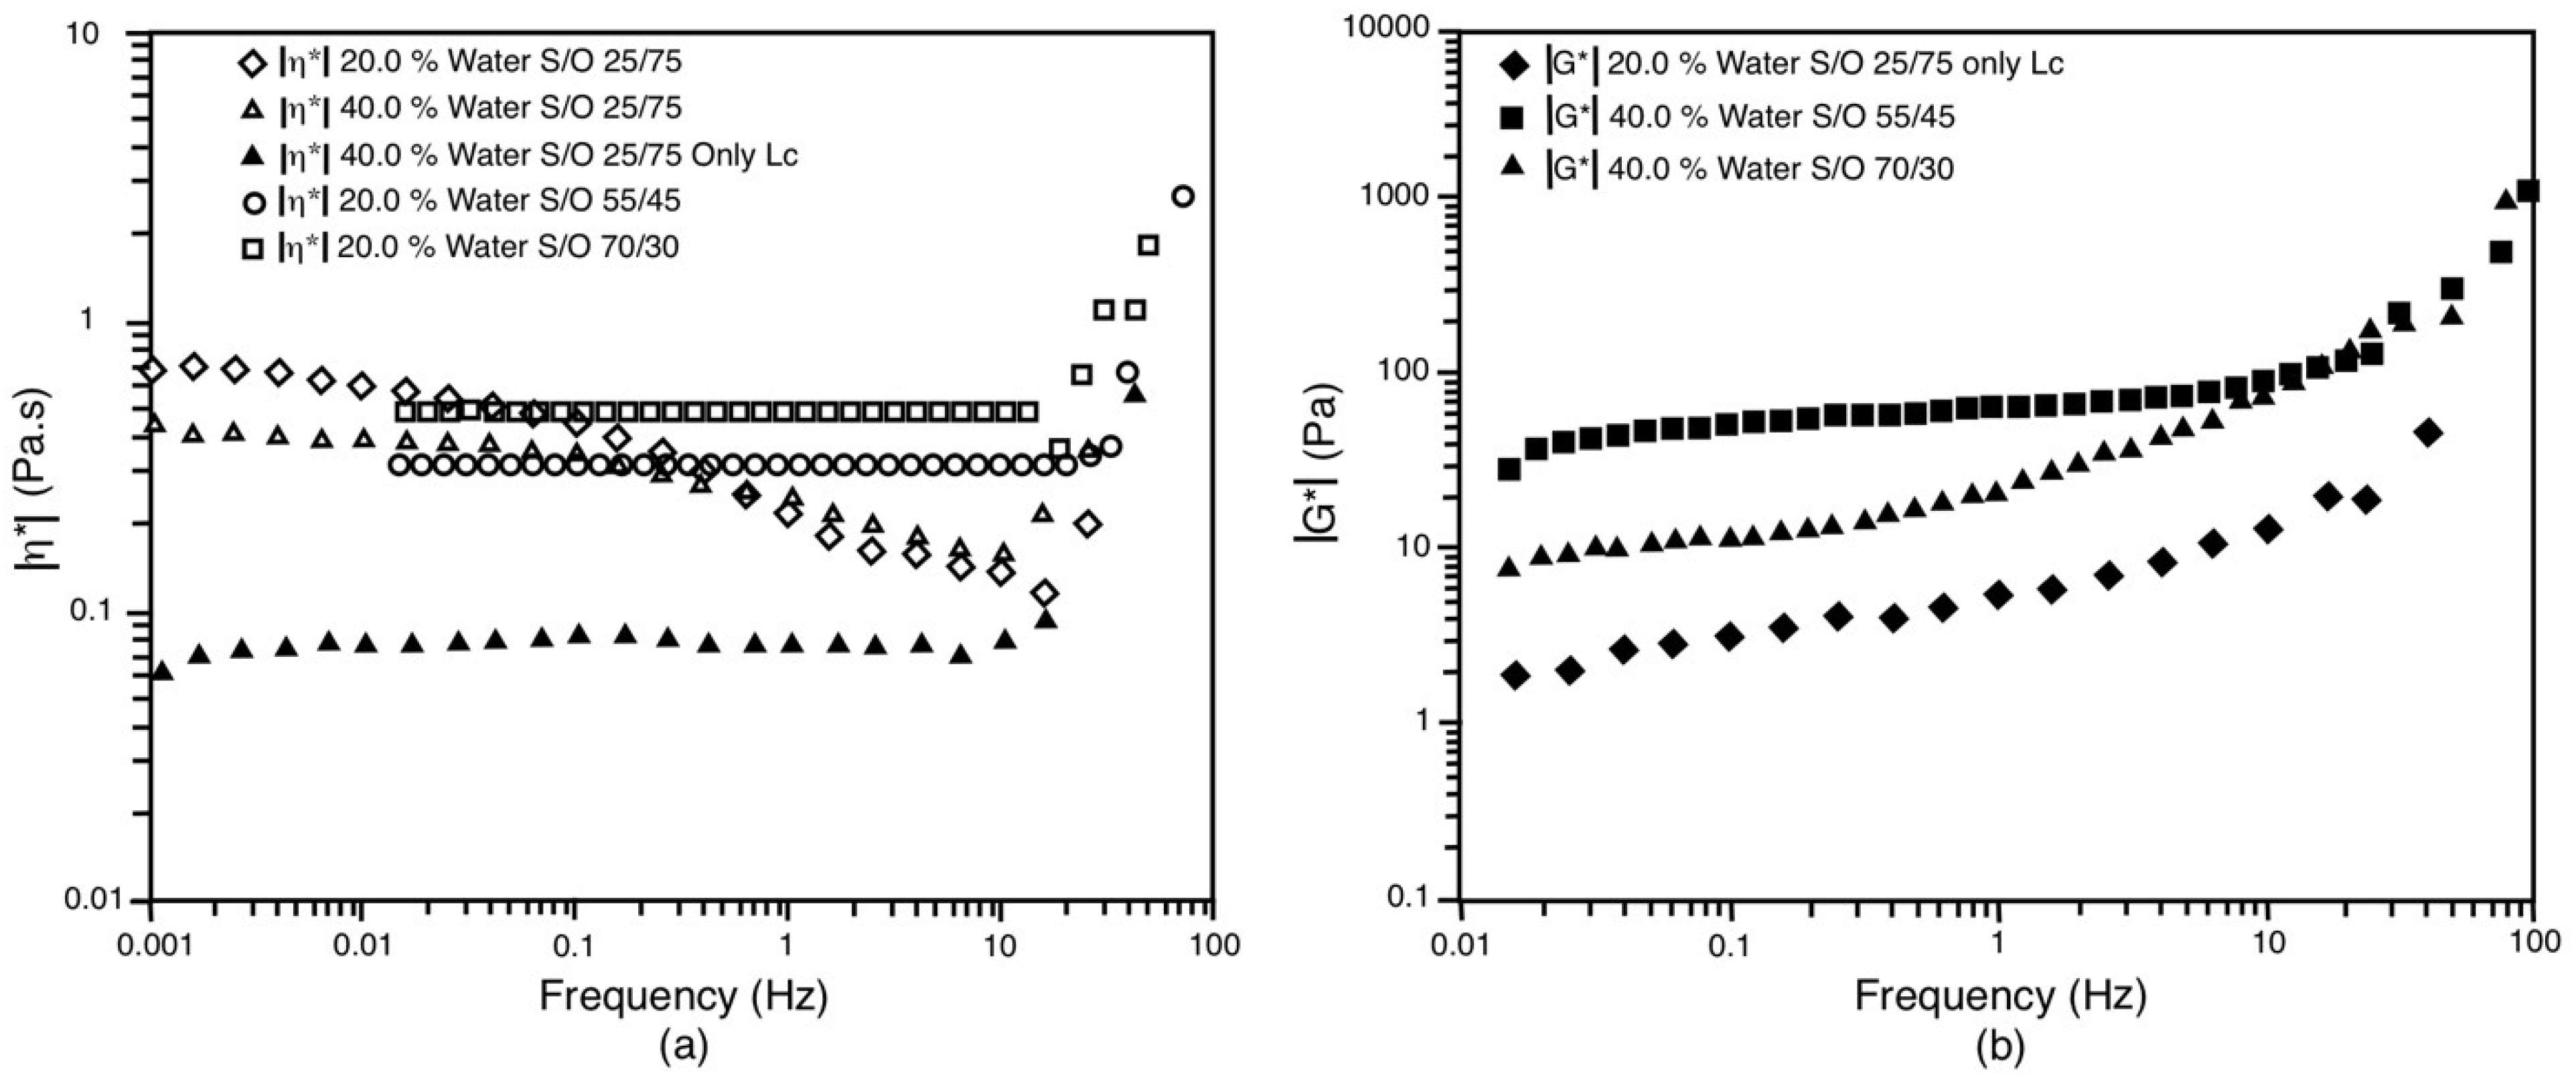
3.5. Rheological Behavior

The case of the S/O 70/30 dilution line is presented to begin the description of the rheological behavior. When this system contains 20% water, it behaves like a liquid with very little viscoelasticity. In the amplitude scan (Figure 8a), it can be seen that the viscous component (G’’) remains above the value of the elastic component (G’) throughout the range studied. Likewise, in Figure 8b, G’’ is greater than G’ in almost the entire frequency range studied; the elastic, viscous component and, therefore, the complex modulus (G*, see Figure 8c) increase with the frequency, similar to the behavior of very dilute solutions of water-soluble polymers [47]. The little viscoelasticity of this system can be reiterated in Figure 8c, where it can be seen that the complex viscosity maintains a constant value of around 51 mPa.s. The latter shows that, in a steady-state test, the viscosity curve would remain constant as the shear rate increases; that is, the system exhibits very little deviation from Newton’s law. In fact, the viscoelastic component (G*) is only appreciable (greater than 1 Pa) at very high deformation frequencies (above 1 Hz). Using this system composed of LC + Om, a bimodal NE with a mean droplet diameter of around 173 nm was obtained.
On the other hand, the system in the same S/O 70/30 dilution line, but now with 40% water content, behaves like a viscoelastic solid [48]. In the amplitude scan (Figure 8a), it is observed that, in the linear viscoelasticity zone, the elastic modulus is slightly greater than the viscous modulus. This elastic zone is up to a shear stress of 2.5 Pa; then, the viscous modulus begins to increase, which indicates that the destruction of the structures formed in the system (LC + O + Wm) begins and, subsequently, the crossing with the elastic modulus at a stress of 3.9 Pa (flow point or flow stress) is attained. In other words, this system exhibits dimensional stability like plastic fluids [24,30,31,48,49,50], where a yield stress (τy) of 3.9 Pa must be exceeded for it to begin to deform. The rupture of the structures is accentuated (G’ decreases very quickly), and above 3.9 Pa, the viscous behavior prevails. It is important to clarify that, despite the dimensional stability of this system, the behavior differs from that of a gel since the magnitudes of G’ and G’’ are similar. In the frequency sweep (Figure 8b), it can be seen that between 0.01 and 1 Hz, the viscous and elastic moduli remain constant, with G’ predominating over G’’. However, at frequencies above 1 Hz, the viscous component reaches the same magnitude as the elastic component. Finally, Figure 8c shows a decrease in the complex viscosity (|η*|) of this system as the strain frequency increases. In other words, this system would present rheofluidization in a permanent regime. Furthermore, as the frequency decreases, the complex viscosity tends to increase, which suggests a plastic behavior, as mentioned above. We could then describe the behavior of this system as that of a viscoelastic solid but with very similar elastic and viscous components. When this system is used, a bimodal NE with a mean droplet diameter of around 170 nm is obtained (as in the previous case). In other words, these first two systems, where LC + Om and LC + O + Wm are used for 20% and 40% water, respectively, produce two NE with very similar droplet size distribution despite their different behavior rheology.
The S/O 55/45 dilution line system produces monomodal emulsions with both 20% and 40% water. These two systems also exhibit different rheological characteristics. As in the previous case, the system with 20% water can be considered a viscoelastic liquid. In Figure 9a, an amplitude sweep is observed where G” predominates over G’ throughout the range of measured stress, which is characteristic of viscous fluids [24,26,27,48,49,51]. In the frequency sweep, the behavior is similar to that of the S/O 70/30 system with 20% water; that is, G’ and G’’ increase as the cutoff frequency increases (Figure 9b). Only at very high frequencies greater than 10 Hz can it be seen that the magnitude of the elastic component is equal to the viscous component, which denotes a mainly viscous behavior where G’’ > G’ [27,48,49]. The complex viscosity (Figure 9c) also shows similar behavior to the previous case; this parameter does not change throughout the measured frequency range, which allows us to affirm that in a stationary state, the viscosity would remain constant as a function of the rate of change applied cut (small deviations from Newton’s law). The most notable difference with respect to the 70/30 dilution line (20% water) lies in the complex viscosity value of 350 mPa.s, which, although constant, is almost an order of magnitude higher. However, as described above, this system that starts with two phases (LC + Om) is capable of producing a monomodal NE with an average diameter of 118 nm.
On the other hand, the S/O 55/45 system with 40% water exhibits very elastic behavior. In the amplitude scan, it can be seen that the elastic region is below 0.5 Pa, and in it, the G’ modulus is almost one order of magnitude greater than the viscous component (Figure 9a). From 0.5 Pa, G’’ increases and passes through a maximum where it coincides and intersects with G’, at a deformation of 7.9 Pa (τy). This yield stress establishes the stress where the rupture of the structures is important and the viscous component begins to predominate. Figure 9b shows that G’ and G’’ remain almost constant in almost the entire frequency range. From 3 Hz, G’’ begins to increase until it coincides with the magnitude of G’ at around 30 Hz. Finally, in Figure 9c, it can be established that the complex viscosity of this system increases with frequency decrease in a much more important way if compared to the 70/30, 40% water system. This is where the biggest difference between these two systems lies, for which we can conclude that the system in the 55/45 dilution line with 40% water is more elastic. Despite this, the NE obtained with this triphasic system (LC + O + Wm) is monodisperse. This leads us to think that the use of a three-phase system that behaves like an elastic solid does not have an evident relationship with the production of this type of monomodal NE. At least, the results obtained for this system support this statement.
We will now focus on the 25/75 S/O dilution line (lower surfactant/oil ratio compared to the previous two) to continue this discussion. The two systems studied (20% and 40% water) offer some viscoelasticity, but in both, the viscous component is greater than the elastic component. It is observed in the stress sweep (Figure 10a) that for both systems, the viscous component predominates. However, for the system with 20% water, the parameters G’ and G’’ have very similar magnitudes; that is to say, despite the fact that the viscous component is greater, the system maintains a certain elasticity, which is lost after a stress of 0.25 Pa, where the intermolecular interactions in the LC begin to be minimized (the system is composed of LC + O). For its part, the system with 40% water, G’’ is around three times greater than G’; that is, the viscous component predominates more significantly than in the case of 20% water. In addition, both G’ and G’’ decrease progressively as the effort increases. This particularity reflects that this system is less stable in the face of shearing and there is a decrease in intermolecular interactions in the LC (system composed of LC + O + Wm) as soon as there is shearing, regardless of its magnitude. Despite this, in the frequency sweep (Figure 10b), very similar behavior of both systems is observed. In the entire frequency range, G’’ prevails over G’. Both parameters increase with frequency, and it is from 1 Hz that their magnitudes are similar. There is a slight difference in the magnitudes of G’ and G’’ of these systems, which are higher for the case of 20% water, which allows us to deduce that it has slightly higher viscoelasticity, which can also be observed in the values of the complex modulus (|G*|) in Figure 10c. In this figure, this slight difference in the value of the complex viscosity (|η*|) at zero shear rate (ηo) can also be perceived. In the case of 20% water, this parameter has a value of 800 mPa.s, while for 40% water, it is 400 mPa.s. This viscosity is very important because it is supposed to be the value that the system has when the NE is being prepared with the established procedure (see materials and methods). Now, with these two systems, the bimodal NEs of 185 nm and 151 nm, respectively, were obtained for 20% and 40% water. If we compare the complex viscosity of these two systems with the S/O 55/45 system with 20% water (ηo = 350 mPa.s), we can affirm that the difference is not significant, especially with the 40% solution of water (ηo = 500 mPa). However, as described above, the S/O 55/45 system is capable of producing monodisperse NEs. The only remarkable difference between these three systems is that from a frequency of around 0.02 Hz, the S/O 25/75 systems exhibit a decrease in complex viscosity. That is, in a rotary test, these solutions will exhibit rheofluidization while the 55/45 system behaves basically like a Newtonian fluid.
Additionally, the rheological analysis of the LC system of the S/O 25/75 dilution line at 20% and 40% water is presented. These systems are very interesting since the liquid crystal is separated from the oily phase (case 20% water) and from the Wm and oily phases (case 40% water). As described in the methods section, from these liquid crystals, two monomodal NE with a droplet diameter of 117 nm and 121 nm, respectively, are obtained for 20 and 40% water content. However, these two LCs exhibit very different rheological behaviors. The liquid crystal at 20% water behaves like a viscoelastic solid, while the liquid crystal at 40% water behaves like a viscoelastic liquid. In Figure 11a (stress sweep), it is observed that for 20% water, G’’ is slightly higher than G’ in the linear viscoelastic range (up to 0.2 Pa), while G’’ is basically an order of magnitude higher than G’ in the case of 40% water. From the frequency sweep (Figure 11b), it can be inferred that the system at 20% water has a very particular viscous/elastic duality. Both modules have a similar value throughout the studied frequency range. However, in most of the frequency ranges studied, it can be observed that G’ > G’’, which corroborates that the crystal type (LC) is lamellar, in agreement with other works [26,27]. This system is said to be more like a viscoelastic solid than a liquid because its complex viscosity tends to infinity as the frequency decreases (Figure 11c). In other words, this system must present a yield stress, which must be exceeded in order for it to yield a deformation, despite the fact that G’’ > G’ and no cutoff between these parameters is observed in Figure 11a. For its part, the system with 40% water exhibits values of G’’ greater than G’ in the frequency sweep, and its complex viscosity remains constant (see Figure 11b,c, respectively) and equal to 7 mPa.s. The behavior is predominantly viscous; G’’ is greater than G’ [27,48]. The complex modulus (|G*|) rises up to four orders of magnitude over the entire frequency range studied. In short, these two systems are very different from the rheological point of view.
Finally, it can be affirmed that there is no evident relationship between the rheological behavior of the starting systems to obtain the NE of a monomodal distribution of the nano-droplets, at least for the systems presented in this work. In this sense, it was possible to obtain monomodal NE starting from very elastic systems (viscoelastic solids), which need to exceed yield stress to flow and gives them dimensional stability in the absence of stress, as well as from viscous systems (Newtonian liquids). In Figure 12, one can see a summary of these behaviors. Figure 12a shows the complex viscosity as a function of frequency for systems that are more viscous than elastic, while Figure 12b shows the complex modulus (|G*|) for systems that are more elastic than viscous. When comparing the most viscous systems, it is observed that the systems in the S/O 25/75 dilution line exhibit a plateau and then a decrease in complex viscosity as the frequency increases; bimodal NE are obtained from them. On the other hand, the other three systems present a constant complex viscosity, which reflects that, in them, there are minor deviations from Newtonian behavior. However, two of them were able to produce a single droplet size distribution. Likewise, when comparing the most elastic systems, it is observed that there are two very similar behaviors in terms of the exhibited viscoelasticity (summarized in the |G*| values); it is the behavior of the LC 25/75 system at 20% of water content and the 70/30 system with 40% water content. Despite their similarity, from these systems, a monomodal NE and a bimodal NE are obtained.
Table 3 shows a summary of the values obtained of G’, G’’, |G*| and |η*| for the disperse systems measured at 0.1 Pa of effort at a frequency of 1 Hz; additionally, the droplet diameter D (0.5) of the NE formed for each disperse system is shown. The table shows that the smallest droplet particle size of the NE, when the entire disperse system is used, is reached when the S/O ratio is 55/45.

4. Conclusions

The studied pseudo-ternary system composed of a mixture of T80 and S20 surfactants, liquid paraffin, and water, following three dilution lines (S/O 25/75 and 55/45 and 70/30), produces a lamellar liquid crystal phase (LC). When these systems are subjected to water dilution, they produce NE with an almost average droplet size of 100 nm. Results show that bimodal NE can be obtained when the liquid crystal is with other phases, water, and oil. Finally, if the initial system to be diluted contains the liquid crystal (LC) and presents a more viscous than elastic behavior, the droplet size of the NE obtained is greater compared to those initial liquid crystal systems in which an elastic behavior predominates over a viscous one. There is no clear relationship between the rheological behavior and the droplet size distribution of NEs. However, regardless of the number of phases and rheological behavior of the initial dispersion, those NE obtained in the S/O 55/45 line are all of the monodisperse type and of high kinetic stability. For that reason, further studies should be performed to clarify the relationship, if any, between rheology and phase behavior in obtaining an NE with a narrow droplet size distribution.

Author Contributions

Conceptualization: A.F.; methodology: M.G., R.M., K.V. and A.C.; validation: M.G.; formal analysis: M.G., R.M. and A.C.; investigation: A.F., M.G., R.M., K.V. and A.C.; writing-original draft preparation: M.G., A.F. and R.M.; writing-review and editing: A.C., visualization: A.F.; supervision: A.F.; project administration: A.F. All authors have read and agreed to the published version of the manuscript.

Funding

This research received no external funding.

Institutional Review Board Statement

Not applicable.

Informed Consent Statement

Not applicable.

Data Availability Statement

For any research data you can contact the corresponding author.

Conflicts of Interest

The authors declare no conflict of interest.

References

  1. Forgiarini, A.; Esquena, J.; González, C.; Solans, C. Studies of the Relation between Phase Behavior and Emulsification Methods with NE Formation. In Trends in Colloid and Interface Science XIV; Buckin, V., Ed.; Progress in Colloid and Polymer Science; Springer Berlin Heidelberg: Berlin/Heidelberg, Germany, 2000; Volume 115, pp. 36–39. ISBN 978-3-540-67128-2. [Google Scholar]
  2. Jafari, S.M.; McClements, D.J. (Eds.) NE. Formulation, Applications, and Characterization; Academic Press: London, UK, 2018; ISBN 978-0-12-811838-2. [Google Scholar]
  3. Sagitani, H. Making Homogeneous and Fine Droplet O/W Emulsions Using Nonionic Surfactants. J. Am. Oil Chem. Soc. 1981, 58, 738–743. [Google Scholar] [CrossRef]
  4. Kumar, N.; Verma, A.; Mandal, A. Formation, Characteristics and Oil Industry Applications of NE: A Review. J. Pet. Sci. Eng. 2021, 206, 109042. [Google Scholar] [CrossRef]
  5. Mariyate, J.; Bera, A. A Critical Review on Selection of Microemulsions or NE for Enhanced Oil Recovery. J. Mol. Liq. 2022, 353, 118791. [Google Scholar] [CrossRef]
  6. Pal, N.; Mandal, A. Enhanced Oil Recovery Performance of Gemini Surfactant-Stabilized NE Functionalized with Partially Hydrolyzed Polymer/Silica Nanoparticles. Chem. Eng. Sci. 2020, 226, 115887. [Google Scholar] [CrossRef]
  7. Singh, R.D.; Kapila, S.; Ganesan, N.G.; Rangarajan, V. A Review on Green NE for Cosmetic Applications with Special Emphasis on Microbial Surfactants as Impending Emulsifying Agents. J. Surfactants Deterg. 2022, 25, 303–319. [Google Scholar] [CrossRef]
  8. de Oca-Ávalos, J.M.M.; Candal, R.J.; Herrera, M.L. NE: Stability and Physical Properties. Curr. Opin. Food Sci. 2017, 16, 1–6. [Google Scholar] [CrossRef]
  9. Azmi, N.A.N.; Elgharbawy, A.A.M.; Motlagh, S.R.; Samsudin, N.; Salleh, H.M. NE: Factory for Food, Pharmaceutical and Cosmetics. Processes 2019, 7, 617. [Google Scholar] [CrossRef] [Green Version]
  10. Ashaolu, T.J. NE for Health, Food, and Cosmetics: A Review. Environ. Chem. Lett. 2021, 19, 3381–3395. [Google Scholar] [CrossRef]
  11. El-Aasser, M.S.; Miller, C.M. Preparation of Latexes Using Miniemulsions. In Polymeric Dispersions: Principles and Applications; Asua, J.M., Ed.; Springer Netherlands: Dordrecht, The Netherlands, 1997; pp. 109–126. ISBN 978-94-010-6321-0. [Google Scholar]
  12. Lovell, P.A.; El-Aasser, M.S. (Eds.) Emulsion Polymerization and Emulsion Polymers; Wiley: New York, NY, USA, 1997; ISBN 978-0-471-96746-0. [Google Scholar]
  13. da Silva, L.J.; Alves, F.C.; de França, F.P. A Review of the Technological Solutions for the Treatment of Oily Sludges from Petroleum Refineries. Waste Manag. Res. 2012, 30, 1016–1030. [Google Scholar] [CrossRef]
  14. Solè, I.; Solans, C.; Maestro, A.; González, C.; Gutiérrez, J.M. Study of Nano-Emulsion Formation by Dilution of Microemulsions. J. Colloid Interface Sci. 2012, 376, 133–139. [Google Scholar] [CrossRef]
  15. Ostertag, F.; Weiss, J.; McClements, D.J. Low-Energy Formation of Edible NE: Factors Influencing Droplet Size Produced by Emulsion Phase Inversion. J. Colloid Interface Sci. 2012, 388, 95–102. [Google Scholar] [CrossRef] [PubMed]
  16. Perazzo, A.; Preziosi, V.; Guido, S. Phase Inversion Emulsification: Current Understanding and Applications. Adv. Colloid Interface Sci. 2015, 222, 581–599. [Google Scholar] [CrossRef] [PubMed]
  17. Roger, K.; Cabane, B.; Olsson, U. Emulsification through Surfactant Hydration: The PIC Process Revisited. Langmuir 2011, 27, 604–611. [Google Scholar] [CrossRef] [PubMed]
  18. Sonneville-Aubrun, O.; Babayan, D.; Bordeaux, D.; Lindner, P.; Rata, G.; Cabane, B. Phase Transition Pathways for the Production of 100 Nm Oil-in-Water Emulsions. Phys. Chem. Chem. Phys. 2009, 11, 101–110. [Google Scholar] [CrossRef]
  19. Lin, T.J. Low-Energy Emulsification—I—Principles and Applications. J. Soc. Cosmet. Chem. 1978, 29, 117–125. [Google Scholar]
  20. Wang, L.; Mutch, K.J.; Eastoe, J.; Heenan, R.K.; Dong, J. NE Prepared by a Two-Step Low-Energy Process. Langmuir 2008, 24, 6092–6099. [Google Scholar] [CrossRef]
  21. Sagitani, H. Formation of O/W Emulsions by Surfactant Phase Emulsification and the Solution Behavior of Nonionic Surfactant System in the Emulsification Process. J. Dispers. Sci. Technol. 1988, 9, 115–129. [Google Scholar] [CrossRef]
  22. Sagitani, H.; Friberg, S.E. Microemulsion Systems with a Nonionic Cosurfactant. J. Dispers. Sci. Technol. 1980, 1, 151–164. [Google Scholar] [CrossRef]
  23. Sagitani, H.; Hirai, Y.; Nabeta, K.; Nagai, M. Effect of Types Polyols on Surfactant Phase Emulsification. J. Jpn. Oil Chem. Soc. 1986, 35, 102–107. [Google Scholar] [CrossRef]
  24. Lim, C.J.; Lim, C.K.; Ee, G.C.L.; Basri, M. Formation of Liquid Crystal/Gel Emulsions to Nano-Emulsions Constructed by Polyalkoxylated Fatty Alcohol (PAFA)-Based Mixed Surfactant Systems. J. Dispers. Sci. Technol. 2019, 40, 1009–1022. [Google Scholar] [CrossRef]
  25. Liu, J.; Wang, Z.; Wang, M.; Liu, X. The Effects of Some Factors on the Rheological Properties of the Lyotropic Liquid Crystals Formed in Brij97/NaDC/IPM/Water System: Compositions, Temperature and Polyphenols. J. Dispers. Sci. Technol. 2019, 40, 103–111. [Google Scholar] [CrossRef]
  26. Montalvo, G.; Valiente, M.; Rodenas, E. Rheological Properties of the L Phase and the Hexagonal, Lamellar, and Cubic Liquid Crystals of the CTAB/Benzyl Alcohol/Water System. Langmuir 1996, 12, 5202–5208. [Google Scholar] [CrossRef]
  27. Mezzenga, R.; Meyer, C.; Servais, C.; Romoscanu, A.I.; Sagalowicz, L.; Hayward, R.C. Shear Rheology of Lyotropic Liquid Crystals: A Case Study. Langmuir 2005, 21, 3322–3333. [Google Scholar] [CrossRef]
  28. Cordobés, F.; Franco, J.M.; Gallegos, C. Rheology of the Lamellar Liquid-Crystalline Phase in Polyethoxylated Alcohol/Water/Heptane Systems. Grasas Y Aceites 2005, 56, 96–105. [Google Scholar] [CrossRef]
  29. Mislan, A.A.; Foong, J.L.N.; Saharin, S.M.; Zahid, N.I. Rheological Behaviour of Thermotropic and Lyotropic Liquid Crystalline Phases of Guerbet Branched Chain Glycolipids. Fluid Phase Equilibria 2019, 502, 112305. [Google Scholar] [CrossRef]
  30. Biradar, S.V.; Dhumal, R.S.; Paradkar, A. Rheological Investigation of Self-Emulsification Process. J. Pharm. Pharm. Sci. 2009, 12, 17–31. [Google Scholar] [CrossRef]
  31. Biradar, S.V.; Dhumal, R.S.; Paradkar, A.R. Rheological Investigation of Self-Emulsification Process: Effect of Co-Surfactant. J Pharm. Pharm. Sci. 2009, 12, 164. [Google Scholar] [CrossRef] [Green Version]
  32. Fanun, M.; Al-Diyn, W.S. Structural Transitions in the System Water/Mixed Nonionic Surfactants/R (+)-Limonene Studied by Electrical Conductivity and Self-Diffusion-NMR. J. Dispers. Sci. Technol. 2007, 28, 165–174. [Google Scholar] [CrossRef]
  33. Lidich, N.; Aserin, A.; Garti, N. Structural Characteristics of Oil-Poor Dilutable Fish Oil Omega-3 Microemulsions for Ophthalmic Applications. J. Colloid Interface Sci. 2016, 463, 83–92. [Google Scholar] [CrossRef]
  34. Feng, J.; Esquena, J.; Rodriguez-Abreu, C.; Solans, C. Key Features of Nano-Emulsion Formation by the Phase Inversion Temperature Method. J. Dispers. Sci. Technol. 2021, 42, 1073–1081. [Google Scholar] [CrossRef]
  35. Rodriguez, C.; Kunieda, H. Phase Behavior and Microstructure of Liquid Crystals in Mixed Surfactant Systems. In Mixed Surfactant Systems; CRC Press: Boca Raton, FL, USA, 2004; ISBN 978-0-429-12030-5. [Google Scholar]
  36. Forgiarini, A.; Esquena, J.; González, C.; Solans, C. Formation of Nano-Emulsions by Low-Energy Emulsification Methods at Constant Temperature. Langmuir 2001, 17, 2076–2083. [Google Scholar] [CrossRef]
  37. Tong, K.; Zhao, C.; Sun, Z.; Sun, D. Formation of Concentrated NE by W/O Microemulsion Dilution Method: Biodiesel, Tween 80, and Water System. ACS Sustain. Chem. Eng. 2015, 3, 3299–3306. [Google Scholar] [CrossRef]
  38. Mittal, K.L.; Shah, D.O. Adsorption and Aggregation of Surfactants in Solution; CRC Press: Boca Raton, FL, USA, 2002; ISBN 978-0-203-91057-3. [Google Scholar]
  39. Solè, I.; Maestro, A.; González, C.; Solans, C.; Gutiérrez, J.M. Optimization of Nano-Emulsion Preparation by Low-Energy Methods in an Ionic Surfactant System. Langmuir 2006, 22, 8326–8332. [Google Scholar] [CrossRef] [PubMed]
  40. Alam, M.M.; Hoshida, S.; Arima, S.; Aramaki, K. Lyotropic Behavior of Nonionic Sugar Surfactant and Rheology of the Liquid Crystal. J. Dispers. Sci. Technol. 2013, 34, 1629–1634. [Google Scholar] [CrossRef]
  41. Shah, D.O.; Hamlin, R.M. Structure of Water in Microemulsions: Electrical, Birefringence, and Nuclear Magnetic Resonance Studies. Science 1971, 171, 483–485. [Google Scholar] [CrossRef]
  42. Strey, R.; Schomäcker, R.; Roux, D.; Nallet, F.; Olsson, U. Dilute Lamellar and L3 Phases in the Binary Water–C12E5 System. J. Chem. Soc. Faraday Trans. 1990, 86, 2253–2261. [Google Scholar] [CrossRef]
  43. Kayali, I.; Karaein, M.; Qamhieh, K.; Wadaah, S.; Ahmad, W.; Olsson, U. Phase Behavior of Bicontinuous and Water/Diesel Fuel Microemulsions Using Nonionic Surfactants Combined with Hydrophilic Alcohol Ethoxylates. J. Dispers. Sci. Technol. 2015, 36, 10–17. [Google Scholar] [CrossRef]
  44. Prasert, W.; Gohtani, S. Effect of Temperature on Low-Energy Nano-Emulsification and Phase Behavior in Water/Polyoxyethylene Sorbitan Fatty Acid Ester (Tweens®)/Vegetable Oil Systems. J. Food Eng. 2016, 180, 101–109. [Google Scholar] [CrossRef]
  45. Kahlweit, M.; Busse, G.; Winkler, J. Electric Conductivity in Microemulsions. J. Chem. Phys. 1993, 99, 5605–5614. [Google Scholar] [CrossRef]
  46. Pasquali, R.C.; Bregni, C.; Serrao, R. Características e identificación de los cristales líquidos liotrópicos. Rev. Mex. De Cienc. Farm. 2006, 37, 38–53. [Google Scholar]
  47. Ouaer, H.; Gareche, M. The Rheological Behaviour of a Water-Soluble Polymer (HEC) Used in Drilling Fluids. J. Braz. Soc. Mech. Sci. Eng. 2018, 40, 380. [Google Scholar] [CrossRef]
  48. Macosko, C.w. Rheology Principles; Wiley VCH: Hoboken, NJ, USA, 1994; ISBN 1-56081-579-5. [Google Scholar]
  49. Barnes, H.A. An Introduction to Rheology, 1st ed.; Elsevier: London, UK, 2000; Volume 3, ISBN 0-9538032-0-1. [Google Scholar]
  50. Barnes, H.A. Rheology of Emulsions—A Review. Colloids Surf. A Physicochem. Eng. Asp. 1994, 91, 89–95. [Google Scholar] [CrossRef]
  51. Berni, M.G.; Lawrence, C.J.; Machin, D. A Review of the Rheology of the Lamellar Phase in Surfactant Systems. Adv. Colloid Interface Sci. 2002, 98, 217–243. [Google Scholar] [CrossRef] [PubMed]
Figure 1. Diagram of phase behavior for the pseudo-ternary system of non-ionic surfactants with HLB of 12 (S), liquid paraffin (O), and water (W) at 30 °C. The systems were drawn according to their densities (the most dense phase at the bottom of the tube).
Nanomanufacturing 03 00002 g001
Figure 2. Conductivity as a function of the weight percent of 0.01 M NaCl aqueous solution for HLB = 12 emulsions with an S/O relation of 25/75, 55/45, and 70/30 at 30 °C.
Nanomanufacturing 03 00002 g002
Figure 3. NE’s drop size distribution as a function of water content for the dilution line S/O 25/75.
Nanomanufacturing 03 00002 g003
Figure 4. NE’s drop size distribution as a function of water content for the dilution line S/O 70/30.
Nanomanufacturing 03 00002 g004
Figure 5. NE’s droplet size distribution as a function of water content for the dilution line S/O 55/45.
Nanomanufacturing 03 00002 g005
Figure 6. Droplet size distribution for a water content of 20.0% in the dilution line S/O 25/75 at 30 °C. All refers to the whole dispersed system (O + LC) and Only LC to the liquid crystal phase only.
Nanomanufacturing 03 00002 g006
Figure 7. (a) oily streaks and (b) mosaic texture for the dispersed system in the S/O 25/75 dilution line with 20% of water content.
Nanomanufacturing 03 00002 g007
Figure 8. Oscillatory tests for the system with the dilution line S/O = 70/30 at 30 °C. The liquid crystal is in equilibrium with the Om phase and the Om and Wm phases in the case of 20% and 40% of water, respectively. (a) Amplitude shear stress sweep at 1 Hz; (b) Frequency sweep at 0.1 Pa; (c) Evolution of |G*| and |η*| against frequency.
Nanomanufacturing 03 00002 g008
Figure 9. Oscillatory tests for the system with the dilution line S/O = 55/45 at 30 °C. The liquid crystal is in equilibrium with the Om phase and the Om and Wm phases in the case of 20% and 40 wt.% of water, respectively. (a) Amplitude shear stress sweep at 1 Hz; (b) Frequency sweep at 0.1 Pa; (c) Evolution of |G*| and |η*| against frequency.
Nanomanufacturing 03 00002 g009
Figure 10. Oscillatory tests for the system with the dilution line S/O = 25/75 at 30 °C. The liquid crystal is in equilibrium with the oil phase and the Om and Wm phases in the case of 20% and 40% of water, respectively. (a) Amplitude shear stress sweep at 1 Hz; (b) Frequency sweep at 0.1 Pa; (c) Evolution of |G*| and |η*| against frequency.
Nanomanufacturing 03 00002 g010
Figure 11. Oscillatory tests for the liquid crystal extracted from the system on the dilution line S/O = 25/75 at 30 °C. (a) Amplitude shear stress sweep at 1 Hz; (b) Frequency sweep at 0.1 Pa; (c) Evolution of |G*| and |η*| against frequency.
Nanomanufacturing 03 00002 g011
Figure 12. (a) shows the complex viscosity (|η*|) as a function of frequency for systems that are more viscous than elastic; (b) shows the complex modulus (|G*|) for systems that are more elastic than viscous.
Nanomanufacturing 03 00002 g012
Table 1. Composition of initial concentrated system to be diluted with water to obtain the final NE at 5 wt% surfactant. Dilution lines studied S/O = 25/75, 55/45, and 70/30.
Water Amount in the Initial System (wt.%) S/O = 25/75
20%40%
Phases at equilibriumO + Liquid Crystal (LC)
Nanomanufacturing 03 00002 i001
O + LC + O/W microemulsion (Wm)
Nanomanufacturing 03 00002 i002
Water amount in the initial system (wt.%) S/O = 55/45
20%40%
Phases at equilibriumW/O microemulsion (Om) + LC
Nanomanufacturing 03 00002 i003
O + LC + Wm
Nanomanufacturing 03 00002 i004
Water amount in the initial system (wt.%) S/O = 70/30
20%40%
Phases at equilibriumOm + LC
Nanomanufacturing 03 00002 i005
O + LC + Wm
Nanomanufacturing 03 00002 i006
Nanomanufacturing 03 00002 i007
Table 2. Droplet size D(0.5) of the NE obtained.
S/O%wt. WaterD(0.5) µm
25/75200.185
25/75400.151
55/45200.118
55/45400.111
70/30200.173
70/30400.170
Table 3. Values of G’, G’’, |G*|, and |η*| and mean droplet size for the disperse systems measured at 0.1 Pa and 1 Hz frequency. The orange are monomodal systems and black are bimodal systems.
S/OWater (%wt)G’ (Pa)G’’ (Pa)|G*| (Pa)|η*| (Pa.s)D (0.5) (μm)
25/75 (only Lc)204.7722.5615.4160.8620.117
25/75 (only Lc)400.0530.0520.0740.0120.121
25/75 (All)200.4361.0051.0950.1740.185
25/75 (All)400.4871.4281.5090.2400.151
55/45200.0022.1092.1090.3340.118
55/454060.8111.0961.819.7960.111
70/30200.0243.2583.2580.5160.173
70/304017.8613.3422.293.5330.173
Disclaimer/Publisher’s Note: The statements, opinions and data contained in all publications are solely those of the individual author(s) and contributor(s) and not of MDPI and/or the editor(s). MDPI and/or the editor(s) disclaim responsibility for any injury to people or property resulting from any ideas, methods, instructions or products referred to in the content.

