Article

Pyrethroid-Resistant and Susceptible Triatoma infestans (Klug, 1834) (Hemiptera, Triatominae): Analysis of Their Vectorial Characteristics by Metacyclogenesis, Feeding/Defecation Patterns, and Parasite Load

by
Andrea Paola Guanuco
1,
Carolina Davies
2,
Hugo Ramiro Poma
3,
Alberto Gerónimo Gentile
1 and
Rubén Marino Cardozo
1,4,*
1
Ministerio de Salud Pública de la Provincia de Salta, Salta 4400, Argentina
2
Instituto de Patología Experimental (IPE), Universidad Nacional de Salta (UNSa)—Consejo Nacional de Investigaciones Científicas y Técnicas (CONICET), Salta 4400, Argentina
3
Instituto para la Investigación Química (INIQUI), Universidad Nacional de Salta (UNSa)—Consejo Nacional de Investigaciones Científicas y Técnicas (CONICET), Salta 4400, Argentina
4
Facultad de Ciencias Naturales, Universidad Nacional de Salta (UNSa)—Consejo Nacional de Investigaciones Científicas y Técnicas (CONICET), Salta 4400, Argentina
*
Author to whom correspondence should be addressed.
Parasitologia 2022, 2(4), 255-265; https://doi.org/10.3390/parasitologia2040022
Submission received: 13 August 2022 / Revised: 26 September 2022 / Accepted: 28 September 2022 / Published: 2 October 2022
(This article belongs to the Topic Host–Parasite Interactions)

Abstract

:
Populations of Triatomas infestans with different susceptibility to pyrethroid insecticides were reported to have distinct evolutionary and epidemiological characteristics. We aimed at evaluating metacyclogenesis and parasite load as measures of vector competence and feeding/defecation patterns as vectorial capacity estimates of a group of resistant (“R”) and susceptible (“S”) T. infestans. Third instar nymphs of each group were fed on mice infected with Trypanosoma cruzi (Tulahuén strain, DTU VI). Parasite concentration in blood was quantified by real-time PCR (qPCR) for each mouse. The time at which feeding started, the span of feeding, the volume of blood consumed, and the time taken to defecate were measured. At 30 days post-feeding, feces were analyzed in parallel by optical microscopy (percentage of metacyclic trypomastigotes, % MT), and qPCR (total T. cruzi DNA). The ratio of parasites consumed/defecated by nymphs of each group was used to estimate the parasites’ survival and multiplication inside the triatomines’ gut. It was estimated that for each blood trypomastigote consumed, 6.6 parasites were obtained in the feces of “R” nymphs, and 7.9 in “S”. “R” nymphs consumed a higher volume of blood, had lower % MT in their feces (lower vectorial competence), and took longer to defecate (lower vectorial capacity) than “S”.

1. Introduction

Triatoma infestans (Klug, 1834) (Hemiptera, Triatominae) is the main insect vector of Trypanosoma cruzi (Chagas, 1909) (Kinetoplastida, Trypanosomatidae), the causative agent of Chagas disease [1]. The biological cycle of T. cruzi is complex, with different stages during its development that allow it to survive, and alternate between a vertebrate and an invertebrate host [2]. While feeding on a mammal infected with T. cruzi, the reduvid acquires blood trypomastigotes that differentiate in its stomach into epimastigotes (the main replicative form), some spheromastigotes, and amastigotes. Epimastigotes repeatedly divide as they pass through the insect’s small intestine and rectum, where they attach to the wax layer of the rectal cuticle by hydrophobic interactions [3,4]. At this point, epimastigotes transform into metacyclic trypomastigotes, a process called metacyclogenesis [5,6]. The population growth of T. cruzi depends on many interactions in the digestive tract of the insect vector [7]. Even though all parasite stages are eliminated with the feces of the triatomines, only trypomastigotes can infect mammals [8,9].
The vectorial capacity of T. infestans populations is defined by the number of metacyclic trypomastigotes released in the insect’s feces during or immediately after feeding on a susceptible mammalian host [10]. Thus, the vectorial capacity will be affected by the interactions between insect-parasite-host and by vectorial density, longevity, behavior, feeding preferences, and vectorial competence [11]. Zeledón (2010) [10] suggests that triatomine prey will be infected with the parasites present in the feces if defecation occurs during the first 10 min after feeding. In turn, vectorial competence is defined as an intrinsic factor related to the triatomine’s physiological ability to be infected and subsequently transmit T. cruzi to its susceptible host. This process is affected by the conditions for parasite survival and multiplication inside the insect’s gut. This definition of vectorial competence also considers the efficiency of transmission and the period comprised between the absorption of the blood meal until the moment the parasite is transmitted [11,12,13].
Population control of T. infestans has been carried out by pyrethroid insecticides sprayed on infested houses [14]. However, the rise of pyrethroid resistance in triatomine populations along South America poses a threat to pyrethroid-based vectorial control of Chagas disease [15,16,17]. Studies performed on pyrethroid-resistant (“R”) T. infestans populations in Salvador Mazza, Argentina, have shown that groups of these insects need less time to develop from egg to adult, and consume significantly more blood than another group of susceptible (“S”) T. infestans from the Chaco region in the same province [18]. These groups of “R” and “S” insects showed differences in their karyotype [19] as well as in cuticle thickness [20]. Thus parasite load quantification in pyrethroid-resistant T. infestans could be an important contribution to inferring its vectorial capacity and competence, it being a valuable element to design control strategies [21,22]. The vectorial capacity is usually monitored by microscopic observation of feces in the search for infective trypomastigotes. Although this method is inexpensive and widely used, it has limited sensitivity in samples with few parasites [23]. It is well known that PCR detection from insect feces and mammalian host blood samples is one of the most cost-effective techniques. For this reason, real-time quantitative PCR (qPCR) has been proposed as an alternative for T. cruzi detection in insect vectors [24]. Recent studies indicate that with this technique it is possible to quantify ≤ 2 parasite equivalents/mL [25,26].
Data from entomological surveillance, collected by the Primary Health Care program of the Ministry of Public Health of Salta (MPH), reported a high-density infestation of “R” T. infestans in the Salvador Mazza and Aguaray localities between the years 2000 and 2009. Despite these demographic explosions of the insect vector, the last case of acute, vectorial-transmitted Chagas disease was documented in 2007 by the epidemiological surveillance system of the MPH. In this context, the aim of the present work was to evaluate feeding and defecation times as variables that estimate vectorial capacity in populations of T. infestans that are both resistant to and susceptible to insecticides. We also estimated metacyclogenesis and parasite load as measures of vectorial competence.

2. Results

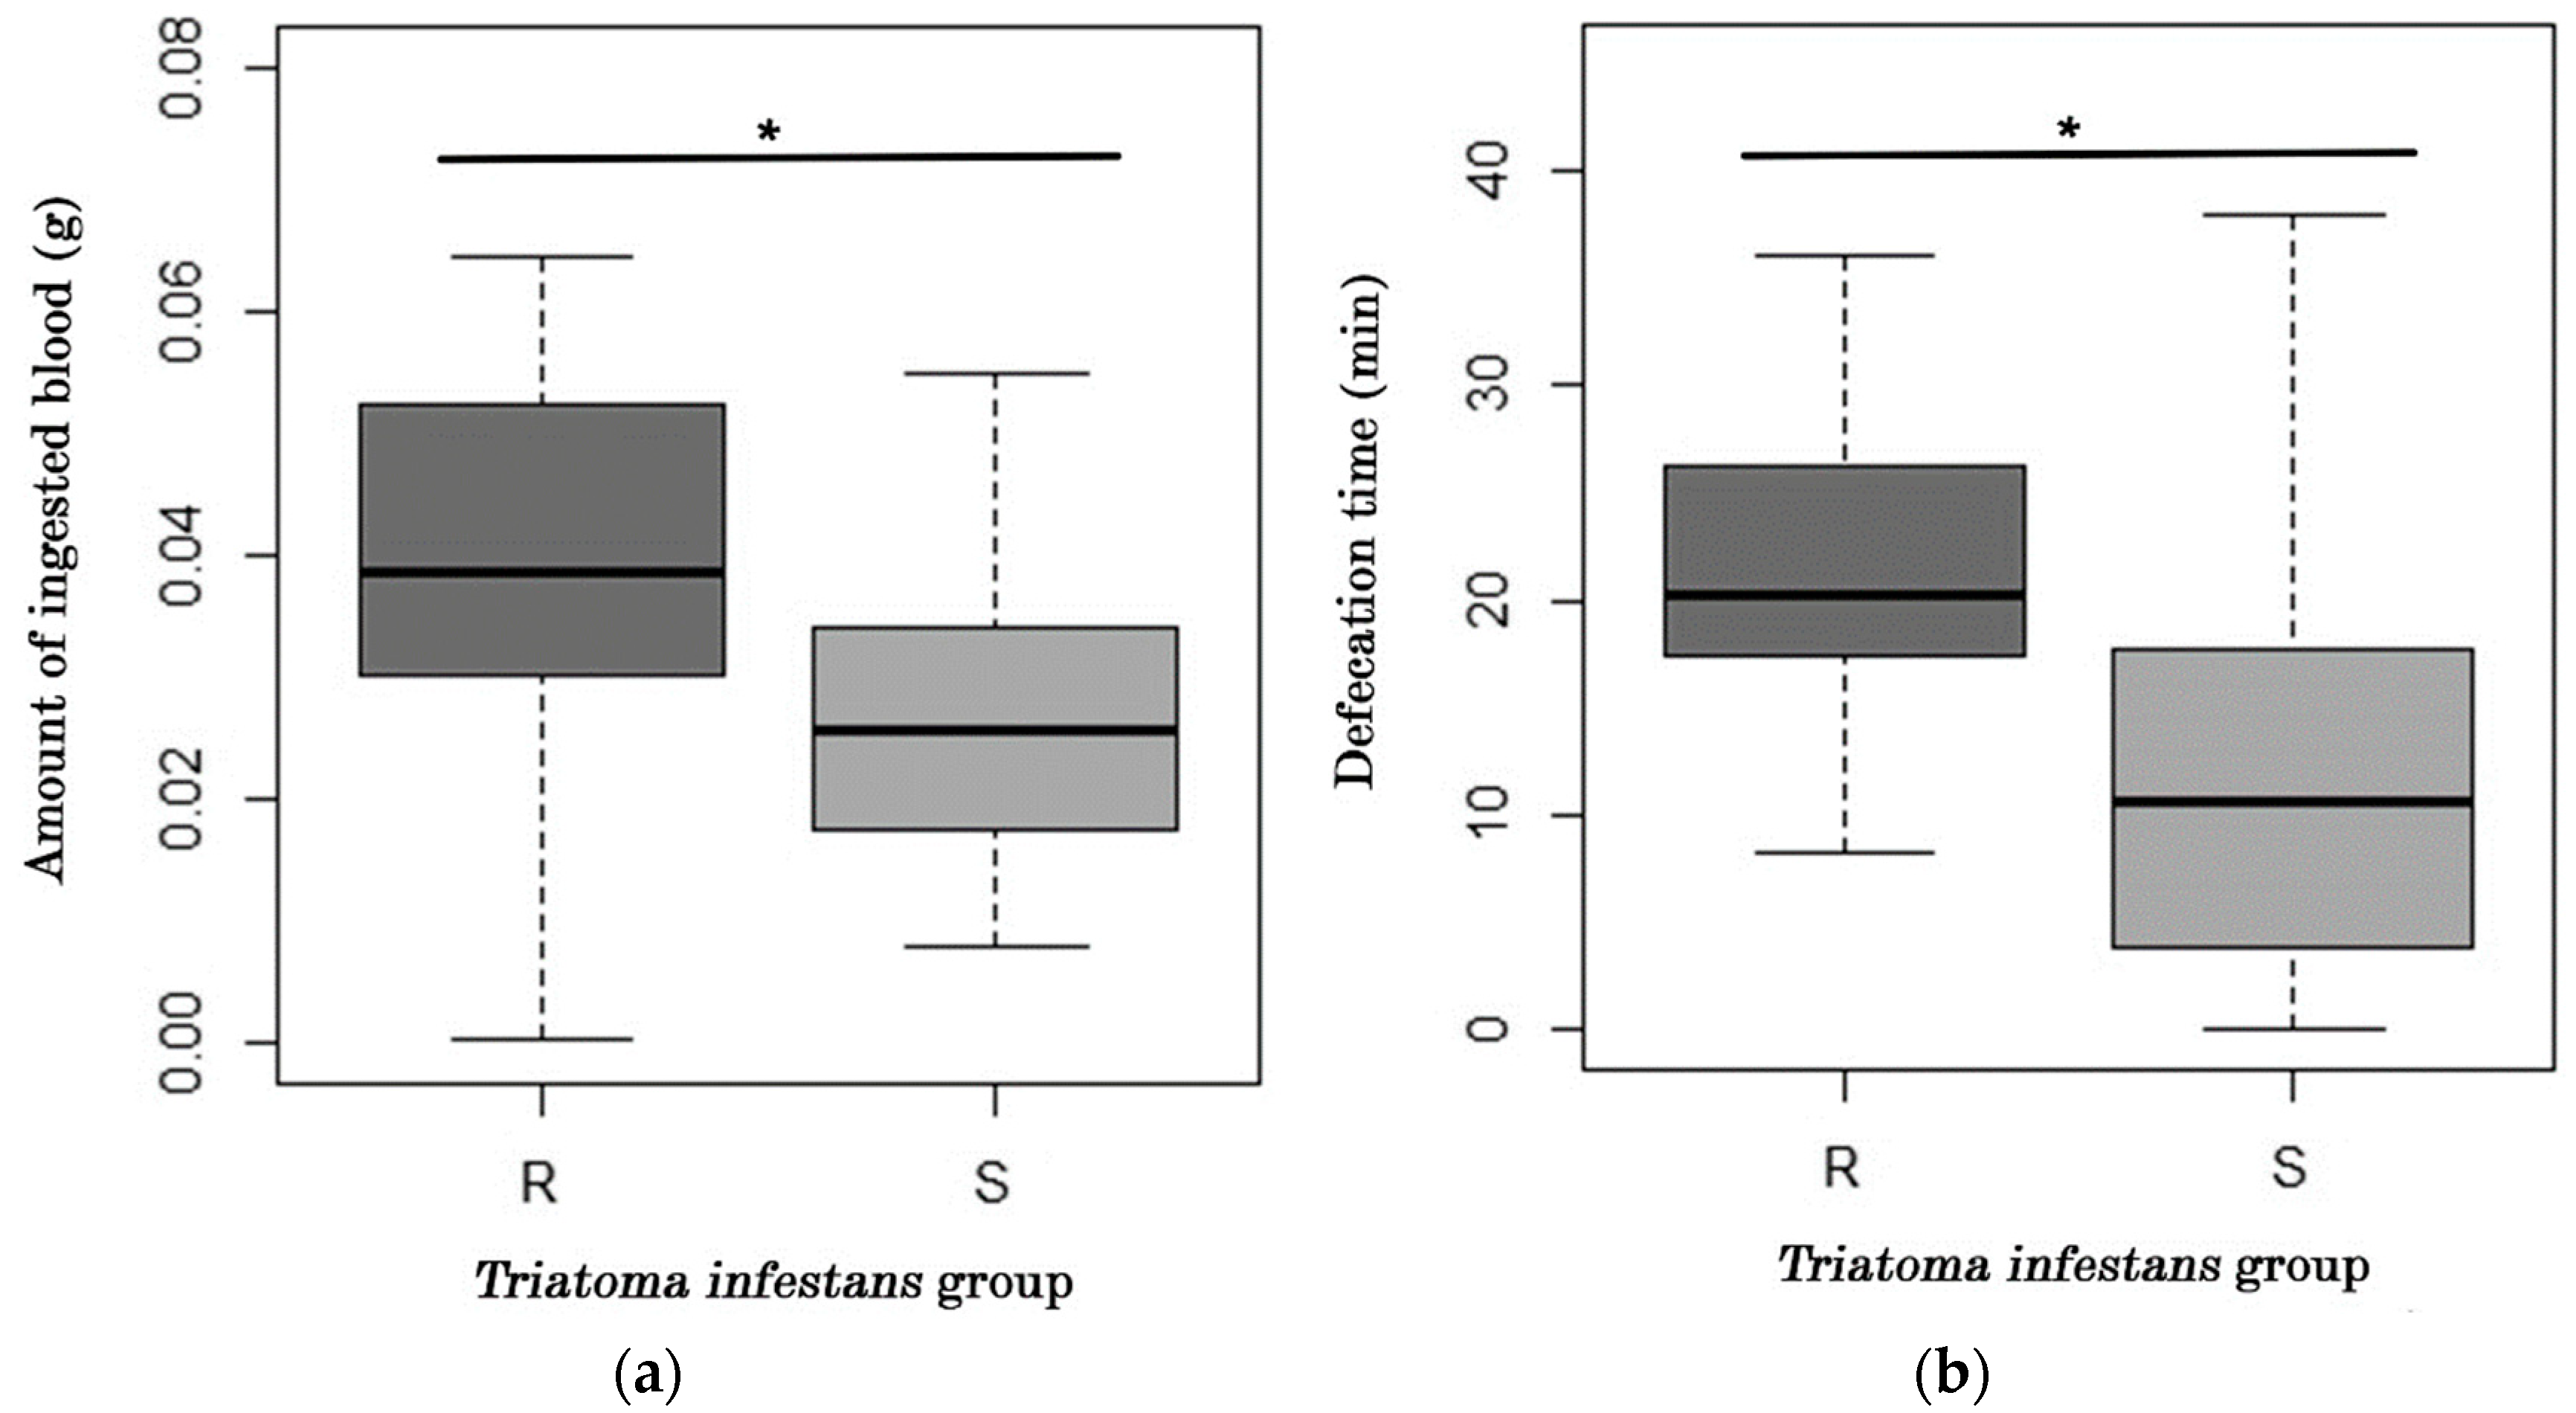
2.1. Analysis of Feeding and Defecation Behavior

The initial weight of the “R” nymphs was significantly higher than that of the “S” (p = 0.007). In contrast, there were no statistically significant differences between “R” and ”S” nymphs either in the onset feeding time, or the total feeding time (p = 0.771, and 0.34, respectively). These results are summarized in Table 1.
Regarding the amount of blood ingested, “R” nymphs consumed 0.039 ± 0.004 g, which was significantly higher than the 0.026 ± 0.003 g consumed by “S” nymphs (p = 0.02), as shown in Figure 1a. Similarly, Figure 1b shows the statistically significant differences observed at the time of the first defecation. The “R” nymphs took an average of 20.90 ± 1.9 min to defecate, while the “S” nymphs took 11.9 ± 2.7 min (p = 0.008). It was also observed that “R” nymphs never defecated during the feeding process.

2.2. Metacyclogenesis

The average percentage of metacyclic tripomastigotes (MT) in the feces of “R” nymphs was 32.80 ± 5.8%, a value significantly lower than the 72.5 ± 6.77% found in “S” nymphs (p = 0.001). Statistically significant differences were also observed in the total average length of epimastigotes present in “R” and “S” feces (p = 0.017). The average length of epimastigotes found in feces of “R” nymphs was 31.8 ± 1.40 μm, in contrast to the 25 ± 2.17 μm of epimastigotes detected in the feces of “S” nymphs. No statistically significant differences were observed in the average length of metacyclic trypomastigotes present in the feces of either “R” or “S” nymphs, as shown in Table 2.

2.3. Molecular Analysis

The percentage efficiency (Eff) of the standard curve for T. cruzi was 91.69%, −3.54 slope (Y), with an average threshold cycle (Ct) of 33.92, and a correlation coefficient (R2) of 0.99. On the other hand, the calibration curve of P22 for blood samples had an efficiency of 98.50%, a slope of −3.36, Ct of 33.70, and R2 of 0.98, confirming the good performance of the assay, indicating precision within each experimental run. The T. cruzi fragment presented an average melting temperature (Tm) of 84.52 °C.
These concentration curves allowed us to estimate the concentration of T. cruzi present in the blood that “R” and “S” nymphs consumed by feeding on the infected mice, as well as in the feces defecated 30 days after feeding. An analysis of linear regression through the origin allowed us to determine that the amount of T. cruzi defecated depends on the number of trypomastigotes consumed (p < 0.0001), as shown in Figure 2.
It was observed that the “R” (pyrethroid-resistant) nymphs consumed on average 2.1 × 10⁴ parasite-equivalents/mL, and defecated on average 3.8 × 10⁷ parasite-equivalents/mL. In contrast, the “S” nymphs (susceptible to pyrethroids) consumed on average a significantly lower amount of blood trypomastigotes than “R” nymphs (3.9 × 10³ parasite-equivalents/mL), and defecated a lower amount of parasites (2.1 × 10⁶ parasite-equivalents/mL), as shown in Table 3. However, taking into account that the mathematical model applied in this analysis is:
y = m × x
where “y” is the number of consumed T. cruzi and “x” is the number of parasites defecated, the value of the slope (“m”) of each curve represents the number of parasites that would be eliminated per each parasite ingested by an individual of the population. In other words, with the value of the slope it is possible to estimate the efficiency of parasite multiplication in the gut of a triatomine. The slope for the “R” nymphs is 6.6, whereas the slope for the “S” is 7.9. Therefore, even though the susceptible population ingested and defecated a lower number of parasites, the fewer parasites ingested produced new parasites more efficiently than the pyrethroid-resistant group.

3. Discussion

This study demonstrated that pyrethroid-resistant T. infestans nymphs fed on mice experimentally infected with T. cruzi had different parasite loads, feeding, and defecation patterns than the pyrethroid-susceptible nymphs. It was observed that the “R” nymphs were heavier than the “S” nymphs. In the context of the experiment, a biological difference between both groups of insects was demonstrated. Although no differences were observed at the onset time and duration of feeding, it was possible to determine that the pyrethroid-resistant nymphs ingested a larger volume of blood and took longer to defecate than the susceptible ones (Table 1, Figure 1 and Figure 2), but they never defecated during the feeding process. Similarly, it was observed that the amount of blood ingested had a direct relationship with the corresponding size of the nymph. This relationship size-amount of blood ingested has also been observed within T. dimidiate (Latreille, 1811), which is larger than both T. infestans, and Rhodnius prolixus Stål, 1859 [10]. The quantity and quality of food ingested are important for the development of triatomines because the number of eggs produced by females is directly related to the amount of blood ingested [27,28]. Regarding “R” T. infestans, it was published that females had reduced fertility as they consumed less blood and have lower fitness than susceptible conspecifics [29,30]. In contrast, Casimiro et al. [18] obtained different results, since they observed that “R” nymphs consumed a significantly larger volume of blood. This behavior had an impact on the reproduction and fertility rate because these females laid a greater number of eggs in a shorter time than “S” females. In turn, the eggs laid by “R” females were heavier, and the post-embryonic development was shorter compared to “S” females.
Our results on defecation patterns showed that the amount of blood ingested was not correlated with the defecation time in any of the groups studied. In contrast, Lobbia et al. [29] showed that pyrethroid-resistant T. infestans ingested less blood, and for that reason took longer than the susceptible ones to defecate. The importance of defecation patterns lies in the fact that T. cruzi transmission is dependent on the time of defecation. The vectors with the greatest vectorial capacity are those that defecate during or shortly after feeding, while the vector is still in contact with its prey [10]. Based on the shorter average defecation time observed in the present study, we propose that the “S” could be a vector with a greater capacity to transmit T. cruzi than the “R” nymphs. These data are in agreement with Lobbia et al. [29] who, likewise, observed that pyrethroid-resistant triatomines took a longer time than the susceptible ones to defecate. However, the direct relationship between the higher blood consumption and the delayed defecation reflex observed in “R” nymphs could involve other physiological factors. Quinlan et al. [31] proposed that “R” T. infestans has not developed a high-performance excretory system, with the Malpighian tubules having a low secretion rate, thus the release of serotonin and the diuretic hormone is not fast enough, or that such release is delayed by a high concentration of cyclic GMP (guanosine monophosphate). It is worth mentioning that other publications proposed that the character of resistance is polygenic [32], and the genes that confer resistance can have pleiotropic effects with important consequences in the evolution of the populations.
Metacyclogenesis may also be an important factor affecting vector competence in these triatomines. The results obtained in the present study showed that “R” nymphs had a lower percentage of metacyclic trypomastigotes in their feces, with bigger epimastigotes in comparison with “S” nymphs. According to Figueiredo et al. [33] and Avendaño et al. [34], there is a close relationship between nutritional stress, nutrient endocytosis, substrate adhesion, and cell differentiation from epimastigotes to trypomastigotes in T. cruzi. Metacyclogenesis occurs when epimastigotes adhere to the perimicrovilliary membrane of the rectum as a consequence of nutritional stress and the accumulated proteins in the parasite’s reservosomes that are used as a source of energy during the differentiation process. The incidence of nutritional stress on metacyclogenesis was also proposed by Vanrell et al. [35] through the regulation of autophagy that differentially affects T. cruzi metacyclogenesis. Autophagy is a cellular process required for the removal of aged organelles and cytosolic components through lysosomal degradation. The most frequent stimulus for autophagy is starvation and the result, in this case, is the rapid generation of usable food (e.g., amino acids, and basic nutrients) to maintain vital biological processes. It is known that metacyclogenesis also stimulates autophagy, which through a positive feedback mechanism stimulates parasite differentiation. In addition, according to Días et al., the major process of cell multiplication and differentiation occurs in the rectum (hindgut) of the vector. Cell multiplication is mainly observed within 5 days post-infection (pi), while metacyclogenesis begins to appear and increases from day 7 pi in a strain of R. prolixus. Therefore, the difference in the proportion of trypomastigotes observed between pyrethroid-resistant and susceptible T. infestans in our work may be directly related to feeding behavior factors that cause higher nutritional stress in the “S” strains, and greater adherence of epimastigotes to the perimicrovilli membrane, resulting in differences in the process of metacyclogenesis of the “R” and “S” groups studied [36].
The parasite load determined by qPCR demonstrated that “R” nymphs consumed and defecated significantly more parasites than “S” nymphs. The number of parasites in the feces of triatomines calculated from the initial amount of parasites in the ingested blood allowed us to estimate the parasites’ survival and multiplication inside the insects’ gut. Even though one resistant and three susceptible nymphs were dead by day 30 post-feeding, the p value was significant either including or excluding them from the analysis, thus indicating that the method was robust enough to support small variations in the number of individuals and still detect biological differences. The linear regression through the origin analysis allowed us to determine that for each blood trypomastigote consumed, 6.6 parasites could be obtained in the feces of pyrethroid-resistant nymphs, and 7.9 in the feces of susceptible ones. Thus, resistance to insecticide did not enhance the vectorial competence of the nymphs since they produce a lower number of parasites after feeding. On the contrary, the pyrethroid-susceptible nymphs had a higher vectorial competence than the “R” nymphs because they defecated more parasites per ingested ones. The difference in parasite burden and length of epimastigotes in both T. infestans populations could be explained by considering each triatomine gut as a different micro-environment that influences T. cruzi multiplication. During its development inside the triatomine’s gut, the parasites must adjust to a hostile environment [29] and to the insect’s immunity, both acting as selection factors of parasite subpopulations [3,5,36,37].

4. Materials and Methods

4.1. Triatomine Nymphs

We worked with a F6 “R” (pyrethroid-resistant) population of T. infestans from Salvador Mazza (Salta, Argentina), and a F3 “S” (susceptible to insecticide) population from La Estrella, Morillo (Salta, Argentina). A subgroup of stage I nymphs from the “R” progeny showed 100% survival when subjected to a discriminating dose of deltamethrin (2 ng/insect applied on the dorsal part of the abdomen), while a subgroup of the same stage from the “S” progeny showed a survival of 0 to 10% for the same dose of the insecticide (Cardozo et al., unpublished data). These populations were maintained separately under laboratory conditions (12:12 h photoperiod, 26 ± 3 °C, and 60 ± 10% humidity) and were subjected to inbred mating to keep their susceptibility traits to their offspring. Nymphs were reared since hatching and maintained under the same laboratory conditions through the experiments. Each nymph was individualized with a white-ink mark on the thorax. These experiments were carried out in the animal facility at the Natural Sciences Faculty, National University of Salta, Salta City, Argentina.

4.2. Parasites

The parasites employed in all the assays were T. cruzi, Tulahuén strain, DTU VI [38]. Axenic cultures were maintained by successive passages in LIT medium (liver infusion-tryptose, pH 7.2: 2.5% liver infusion broth (w/v); 0.5% tryptose (w/v); 0.4% NaCl (w/v); 0.8% Na2HPO4 anhydrous (w/v), 0.04% KCl (w/v); 0.2% anhydrous dextrose (w/v)), grown in an incubator (Numak) at 28 °C. Blood trypomastigotes were obtained from the regular passage mice-to-mice carried out in the mice facility at the Instituto de Patología Experimental, UNSa-CONICET (Salta, Argentina).

4.3. Mice

Male Swiss mice (n = 10), 6 weeks old, were intraperitoneally infected with 300 T. cruzi blood trypomastigotes. The infection of mice was carried out synchronically with the nymphs when the latter were molting from stage II and moving to stage III. This synchronicity was needed in order to have the parasitemia peak in mice at the same time the nymphs were ready to feed. Before exposure to nymphs, mice were anesthetized with a mixture of 50% ketamine—20% xylazine at a dose of 0.025 mL per 10 g body weight. A sample of their blood was taken to quantify the number of parasites by qPCR (described below). This protocol was approved by the Ethics Committee of the Faculty of Natural Sciences, National University of Salta (R-DNAT-2018-1361 & R-DNAT-2019-0387).

4.4. Study Design

The experiment was designed assuming significant biological differences between the T. infestans populations under study. For this reason, a big-sample size effect (d = 0.9) was considered, with a potency of 80% and 5% significance for the statistical test. Under these assumptions, the estimated sample size was 15 insects per group. These calculations were carried out using G*Power 3.1.9.7 software (Franz Faul, University Kiel, Kiel, Germany), applying the statistical test “Means: difference between two independent means (two groups)” with the a priori analysis “compute required simple size-given alfa-power, and effect size”. Stage III “R” and “S” T. infestans nymphs were used as observation units (N = 15 for each group). They were experimentally infected as follows: (i) mice were infected with T. cruzi as described above, and at 12 days post-infection each mouse was anesthetized and exposed to groups of three nymphs; (ii) the volume of blood ingested was estimated by the weight difference of the nymphs before and after feeding. Thus, insects were weighed on a precision scale immediately before and after feeding on mice.

4.5. Feeding and Defecation Patterns

The onset feeding time, time of feeding and time of defecation were measured (in minutes). The feeding onset time is defined as the time span since a nymph exposed to a mouse makes the first bite. The time of feeding is the period spent by a nymph from the first bite until it moves away from the mouse. The defecation time was measured between the end of the feeding and the first drop of feces. All nymphs that defecated during the feeding process were assigned a time value of 0 [39]. After these observations, the nymphs were left to starve for 30 days.

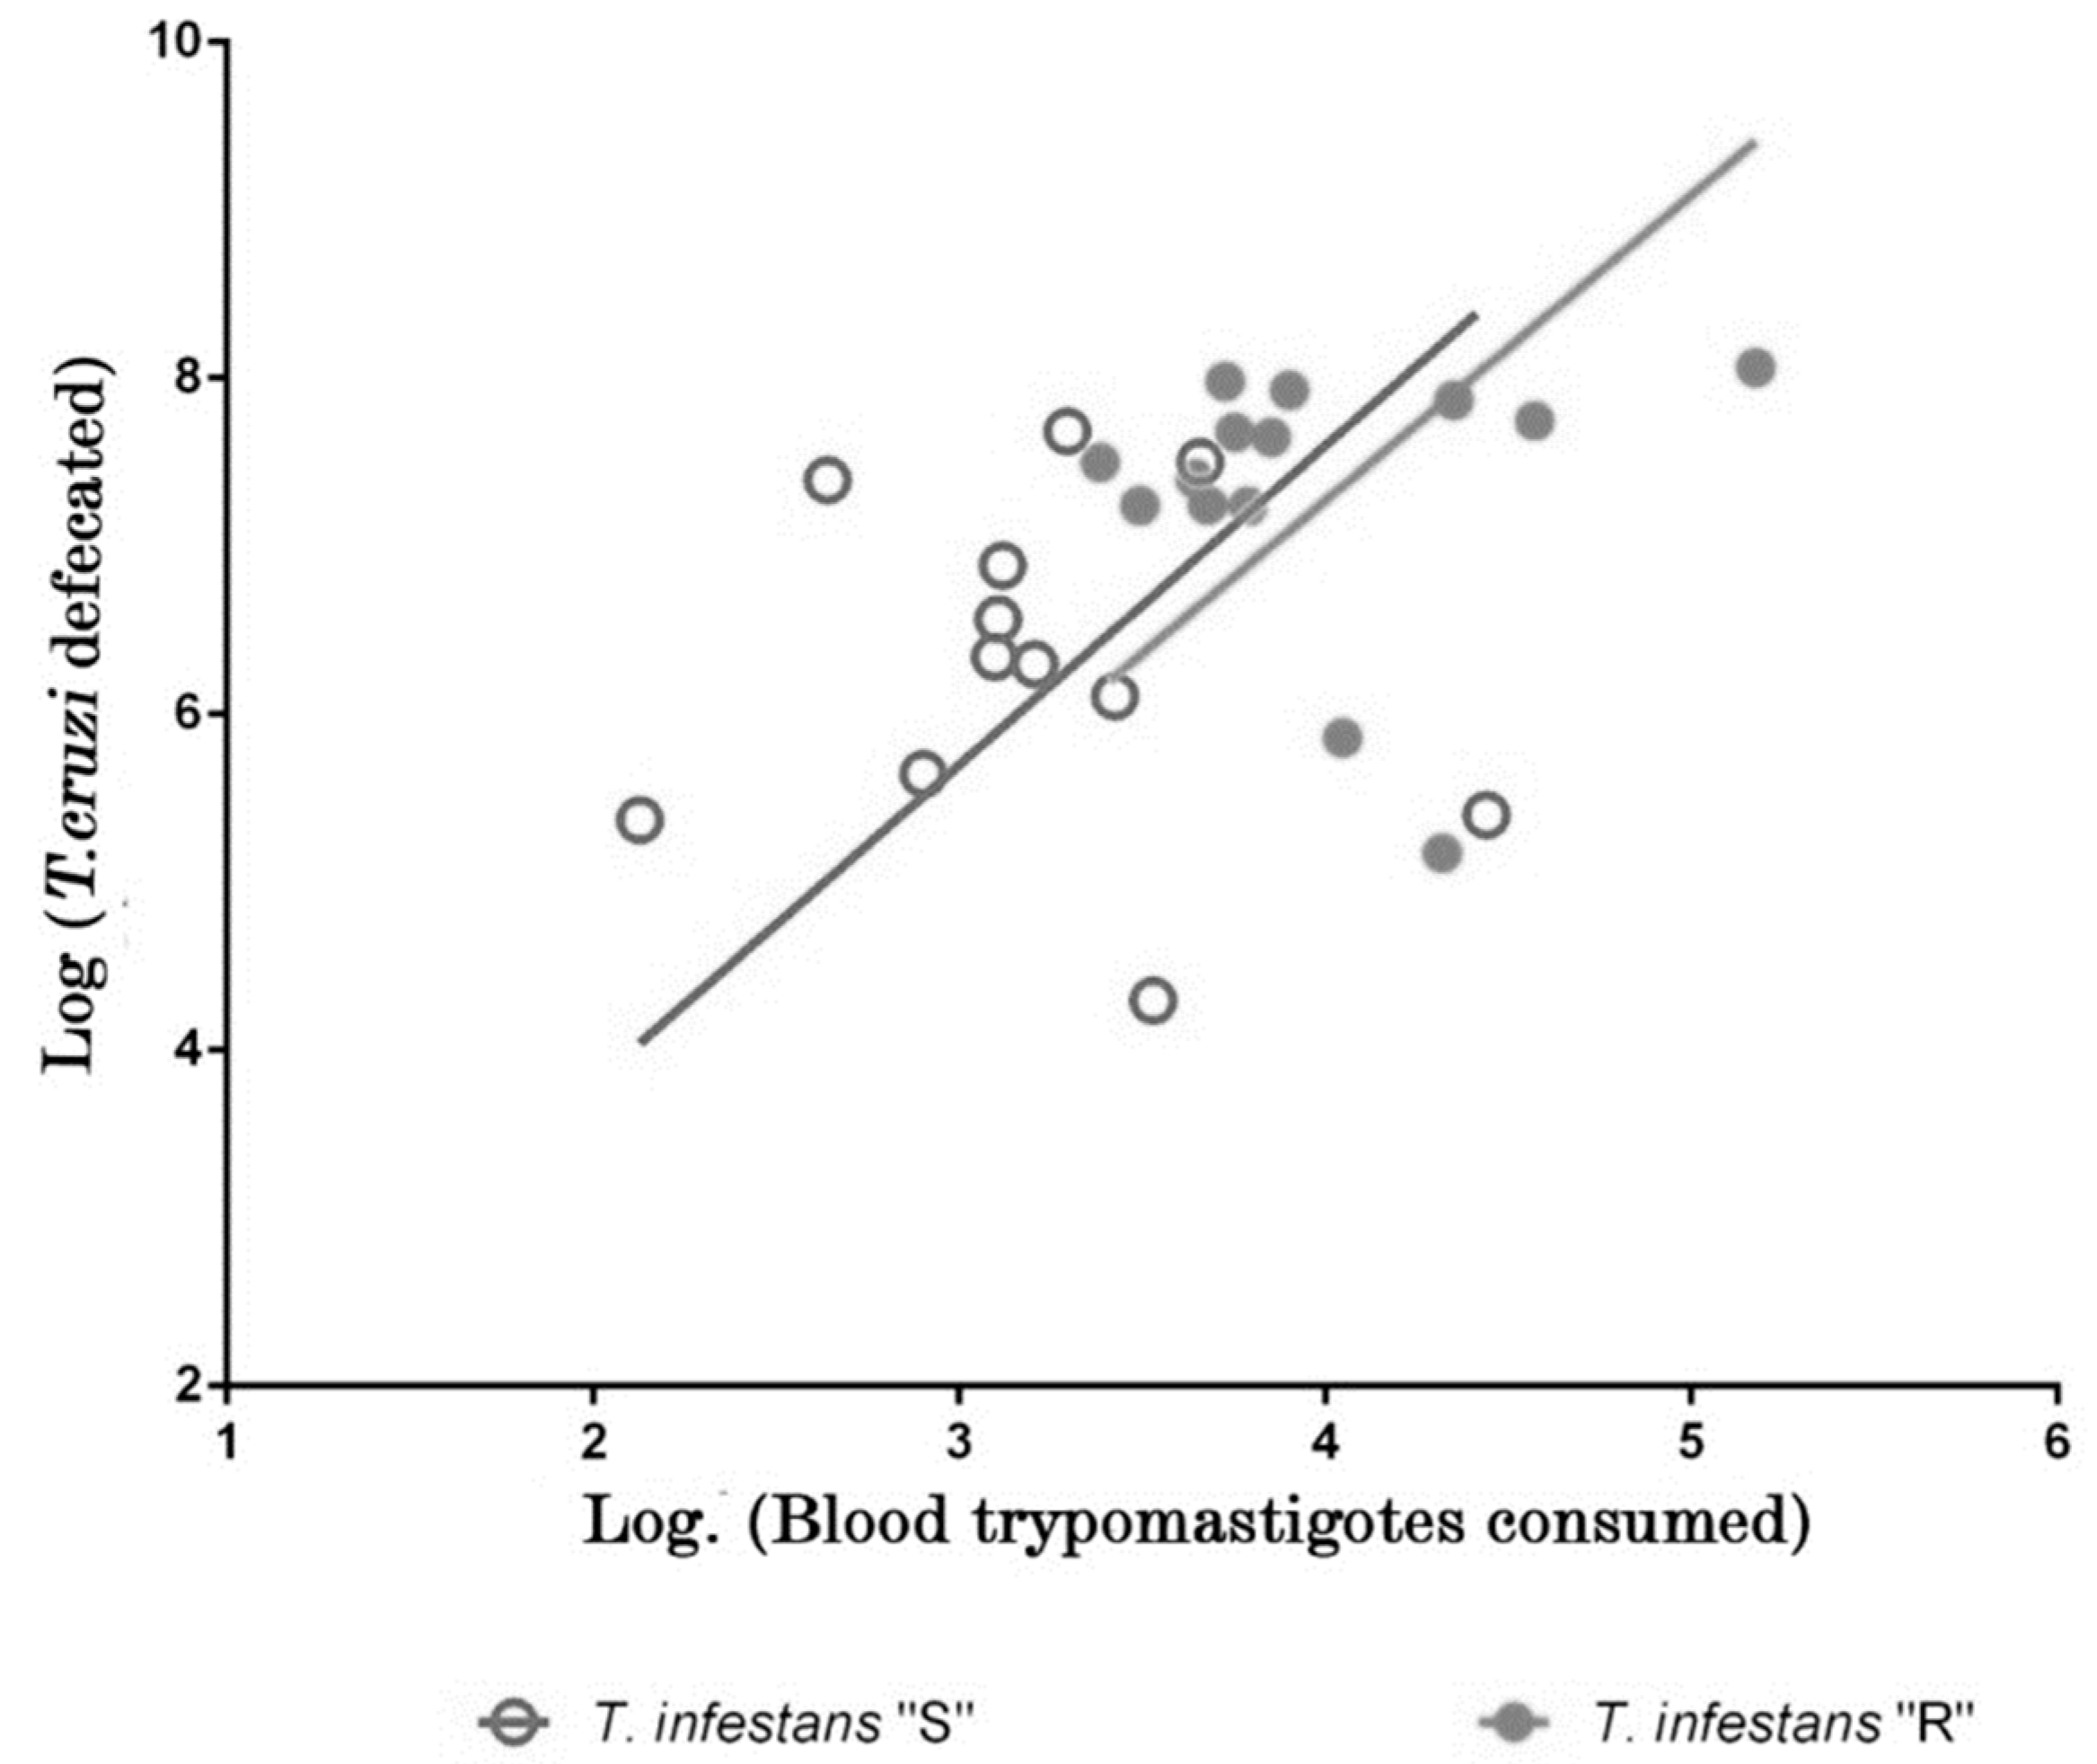
4.6. Metacyclogenesis and Parasite Load in Feces of Nymphs

The feces of the nymphs of both groups were sampled by abdominal compression at the end of the 30 days of fasting. One nymph was dead in the “R” group and three were dead in the “S” group. A volume of 30 μL of feces was added to 20 μL of physiological solution and then divided into two tubes of 25 μL each. One tube was centrifuged at 1500 rpm for 5 min. The supernatant was discarded and the pellet was treated with a mixture of 15 μL of absolute ethanol and 15 μL Giemsa, mixed briefly by vortexing, and then mounted on a slide. The amount of T. cruzi metacyclic trypomastigotes (MT) and epimastigotes (E) in the slide was quantified at 1000× magnification under a Zeiss optical microscope [38]. The percentage of MT (% MT) per nymph was calculated as:
% MT = (MT × 1OO) ÷ (MT + E)
The length (in μm) of the parasites was also measured. To this aim, two or three trypomastigotes and epimastigotes per smear were randomly selected, and their length was measured with the micrometer eyepiece of the microscope used.
The remaining tube (with 25 μL of the feces’ suspension) was used to measure the concentration of parasites defecated by each nymph at 30 days post-feeding by qPCR, and then stored at −20 °C until use.

4.7. Quantification of Parasite Load by PCR

At 12 days post-infection, a total volume of 350 μL of peripheral blood from each mouse was collected in a microtube with 1400 μL of guanidine buffer (6 M guanidine-HCl, 200 mM EDTA, pH 8.0). The following day the samples were boiled for 10 min to lyse the cells and prevent clot formation and then stored until processing. A DNA aliquot (20 μL) of phage P22 was added to every blood sample before the DNA extraction. It was used as an internal control to determine the efficiency of the DNA extraction and PCR reaction. A P22 fragment was amplified with the specific primers forward 5′-CTTAACAAGCTCTCTGACTGCTCATCA-3′ and reverse 5′-CCATCGCCTGTGACTGGAT-3′. A phage calibration curve was performed to determine the optimal dilution to be used in the assays with murine blood samples. No internal control was used in the DNA extraction of triatomine feces. DNA extraction of all samples (murine blood, and triatomine feces) was performed with the commercial Easy Pure Genomic DNA Kit (TransGen Biotech Co., Beijing, China) following the protocol for mammalian cells.

4.8. Calibration Curves

Blood from a healthy mouse without T. cruzi infection, was extracted as previously described, and a volume of an axenic culture of T. cruzi epimastigotes was added to obtain a final concentration of 106 parasites/mL. To this end, the concentration of the culture was measured by counting the parasites in a hemocytometer. DNA extraction was performed as described above, and serial 1/10 dilutions of DNA were performed, ranging from 106 to 10−2 parasites/mL. The number of parasite-equivalents per milliliter of blood was calculated by linear regression of the Ct and the logarithm of the parasite concentration for each dilution. A similar calibration curve was performed to determine the number of parasites in T. infestans feces. For this purpose, feces from an uninfected T. infestans were extracted as described above, and an aliquot of T. cruzi axenic culture was added at a final concentration of 1.5 × 10⁷ parasites/mL. After DNA extraction, serial 1/10 dilutions of DNA were performed, ranging from 107 to 10−2 parasites/mL.

4.9. qPCR

The primers Sat-forward 5′-GCAGTCGTCGGCKGATCGTTTTCG-3′ and Sat-reverse 5′-TTCAGRGTTGTTGTTTGGTGGTGTCCAGTG-3′ [40] were used to determine the presence of T. cruzi DNA in murine blood from mice and in T. infestans feces. These primers amplified a 146-bp genomic satellite fragment repeated approximately 104 times in the Tulahuén strain of T. cruzi [41].
The concentration of each reagent was used as suggested by the manufacturer of iTaqTM Universal SYBR Green SuperMix (BioRad): 1× Master Mix, 600 nM of each primer (Sigma St. Louis, MO, USA), 5 μL of DNA, and nuclease-free water to reach a final volume of 25 μL per reaction. Amplification and quantification were performed on a Step One Plus™ Real-Time PCR System thermal cycler (Applied Biosystems, Marsiling, Singapore), with the following cycling protocol: 5 min at 95 °C, 40 cycles of 15 s at 95 °C, and 30 s at 60 °C. After the PCR, a melting curve protocol starting at 60 °C was added to verify the specificity of the fragments. The peak obtained corresponds to the melting temperature of the fragment, and its height is proportional to the concentration [41,42,43,44]. In addition to the calibration curve points and the samples, a reagent control (blank) and a negative control (mouse blood, or triatomine feces without parasites) were included in the PCR plates. All assays were performed per duplicate.

4.10. Data Analysis

Data on feeding, defecation, metacyclogenesis, and parasite load was analyzed using the statistical language R Studio version 3.6.1, using the packages dplyr, ggplot2, and plotrix. The data were analyzed with a Shapiro-Wilk test to determine their distribution, and the variables with normal distribution were compared with a Student’s t-test. When variables did not pass the normality test, they were compared with the Wilcoxon test. Graphs were performed with RStudio and GraphPad Prism. For qPCR data, OnePlus version 2.3 software (Applied Biosystems) was used for the dissociation curve analysis and Excel 2016 for the graphs of the calibration curves.
To evaluate the relationship between the amounts of T. cruzi consumed/defecated, we used linear regression analysis through the origin because this method diminishes the standard error of the regression slope (σb), increases the value of the statistical test, and reduces the probability of type I error [45]. This analysis was carried out using GraphPad Prism 8.0 and R Studio software, applying a double logarithmic transformation to the data in order increase the R2-fit measure. The number of parasites consumed was considered the independent variable, while the number of parasites defecated was the dependent variable.

5. Conclusions

The highest vectorial capacity and risk of parasite transmission rely on specimens with the maximum possibility of contact with a vertebrate host, and the shortest time to eliminate a great amount of infective parasites [46]. In this sense, the vectorial capacity of pyrethroid-resistant nymphs was lower than susceptible ones, because the former required more time to defecate. Likewise, by releasing a lower number of parasites in their feces, the pyrethroid-resistant triatomines had a lower vectorial competence than their susceptible counterparts. Therefore, it can be concluded that the pyrethroid-resistant triatomines used in the present work had a lower potential for transmission of T. cruzi compared with the susceptible ones. In other words, pyrethroid-susceptible T. infestans are vectors with a greater capacity to transmit the parasite. These results have epidemiological relevance in an area with an endemic presence of T. infestans. We also hope that our results will contribute to the understanding of the evolutionary relationship of T. infestans with T. cruzi.

Author Contributions

Conceptualization, C.D., A.G.G. and R.M.C.; Data curation, A.P.G.; Formal analysis, A.P.G., H.R.P. and R.M.C.; Funding acquisition, A.G.G. and R.M.C.; Methodology, A.P.G. and H.R.P.; Project administration, A.G.G. and R.M.C.; Resources, H.R.P., A.G.G. and R.M.C.; Supervision, C.D., H.R.P. and R.M.C.; Writing—original draft, A.P.G.; Writing—review & editing, C.D. and R.M.C. All authors have read and agreed to the published version of the manuscript.

Funding

This research received no external funding.

Institutional Review Board Statement

The protocols used in this work, including the animal study protocol, were approved by Institutional Review Board of Natural Sciences Faculty of Salta National University (R-DNAT-2018-1361, dated 10 October 2018).

Data Availability Statement

Not applicable.

Acknowledgments

The authors wish to thank to the Ministry of Public Health of Salta Province, Argentina for providing the PCR reagents, to Verónica Rajal for having lent the facilities and equipment of his laboratory, to Sarita Isabel Reyes and Vanesa Baldiviezo for expert assistance in the laboratory, and to Dury Frizza for language revision.

Conflicts of Interest

The authors declare that they have no conflict of interest.

References

  1. Sherlock, I. Vetores. In Trypanosoma cruzi e Doença de Chagas; Brener, Z., Andrade, Z., Barral Neto, M., Eds.; Guanabara Kooga: Rio de Janeiro, Brazil, 2000; Volume 21. [Google Scholar]
  2. Garcia, E.S.; Azambuja, P. Development and interactions of Trypanosoma cruzi within the insect vector. Parasitol. Today 1991, 7, 240–244. [Google Scholar] [CrossRef]
  3. Garcia, E.S.; Genta, F.A.; de Azambuja, P.; Schaub, G.A. Interactions between intestinal compounds of triatomines and Trypanosoma cruzi. Trends Parasitol. 2010, 26, 499–505. [Google Scholar] [CrossRef]
  4. Kollien, A.H.; Schaub, G.A. The development of Trypanosoma cruzi in triatominae. Parasitol. Today 2000, 16, 381–387. [Google Scholar] [CrossRef]
  5. Garcia, E.S.; Ratcliffe, N.A.; Whitten, M.M.; Gonzalez, M.S.; Azambuja, P. Exploring the role of insect host factors in the dynamics of Trypanosoma cruzi–Rhodnius prolixus interactions. J. Insect Physiol. 2007, 53, 11–21. [Google Scholar] [CrossRef] [PubMed]
  6. Azambuja, P.; RatcliffeII, N.A.; Garcia, E.S. Towards an understanding of the interactions of Trypanosoma cruzi and Trypanosoma rangeli with in the reduviid insect host Rhodnius prolixus. An. Acad. Bras. Cienc. 2005, 77, 397–404. [Google Scholar] [CrossRef] [PubMed] [Green Version]
  7. Gonçalves, C.S.; Ávila, A.R.; de Souza, W.; Motta, M.C.M.; Cavalcanti, D.P. Revisiting the Trypanosoma cruzi metacyclogenesis: Morphological and ultrastructural analyses during cell differentiation. Parasites Vectors 2018, 11, 83. [Google Scholar] [CrossRef] [Green Version]
  8. Schuster, J.P.; Schaub, G.A. Trypanosoma cruzi: Skin penetration kinetics of vector-derived metacyclic trypomastigotes. Int. J. Parasitol. 2000, 30, 1475–1479. [Google Scholar] [CrossRef]
  9. Dujardin, J.P.; Schofield, C.J.; Panzera, F. Los Vectores de la Enfermedad de Chagas; Academie Royale des Sciences d’Outre-Mer: Brussels, Belgium, 2002; Volume 25, pp. 17–23. [Google Scholar]
  10. Zeledón, R.; Alvarado, R.; Jiron, L.F. Observations on the feeding and defecation patterns of three triatomin especies (Hemiptera: Reduviidae). Actatropica 1977, 34, 65–77. [Google Scholar]
  11. Higgs, S.; Beaty, B.J. Natural cycles of vector-borne pathogens. In Biology of Disease Vectors, 2nd ed.; Marquardt, W.C., Ed.; Elsevier: Amsterdam, The Netherlands, 2005; pp. 167–185. [Google Scholar]
  12. Vieira, C.B.; Praça, Y.R.; Bentes, K.; Santiago, P.B.; Silva, S.; Silva, G.; Motta, F.N.; Bastos, I.; de Santana, J.M.; de Araújo, C.N. Triatominos: Tripanosomátidos, bacterias y vectores potenciales de virus? Front. Microbiol. Cel. Infecc. 2018, 8, 405. [Google Scholar] [CrossRef]
  13. Quintero Gil, D.C.; Osorio Benitez, J.E.; Martinez Gutierrez, M. Competencia vectorial: Consideraciones entomológicas y su influencia sobre la epidemiología del dengue. Iatreia 2010, 23, 137–145. [Google Scholar]
  14. Zerba, E.N. Past and Present of Chagas Vector Control and Future Needs. 1999. Available online: https://www.who.int/publications/i/item/who-cds-whopes-cgdpp-99.1 (accessed on 12 August 2022).
  15. Lardeux, F.; Depickère, S.; Duchon, S.; Chavez, T. Insecticide resistance of Triatoma infestans (Hemiptera, Reduviidae) vector of Chagas disease in Bolivia. Tropical medicine & international health: TM IH 2010, 15, 1037–1048. [Google Scholar]
  16. Picollo, M.I.; Vassena, C.; Santo Orihuela, P.; Barrios, S.; Zaidemberg, M.; Zerba, E. High resistance to pyrethroid insecticides associated with ineffective field treatments in Triatoma infestans (Hemiptera: Reduviidae) from Northern Argentina. J. Med. Entomol. 2005, 42, 637–642. [Google Scholar] [CrossRef] [Green Version]
  17. Depickere, S.; Buitrago, R.; Sinani, E.; Baune, M.; Monje, M.; Lopez, R.; Waleckx, E.; Chavez, T.; Breniere, S.F. Susceptibility and resistance to deltamethrin of wild and domestic populations of Triatoma infestans (Reduviidae: Triatominae) in Bolivia: New discoveries. Mem. Inst. Oswaldo Cruz 2012, 107, 1042–1047. [Google Scholar] [CrossRef]
  18. Casimiro, G. Efecto de la Resistencia a Insecticidas Piretroides sobre Algunos Parámetros del Desarrollo de Triatoma infestans; Facultad de Ciencias Naturales, Universidad Nacional de Salta: Salta, Argentina, 2012. [Google Scholar]
  19. Panzera, F.; Ferreiro, M.J.; Pita, S.; Calleros, L.; Perez, R.; Basmadjian, Y.; Guevara, Y.; Breniere, S.F.; Panzera, Y. Evolutionary and dispersal history of Triatoma infestans, main vector of Chagas disease, by chromosomal markers. Infect. Genet. Evol. 2014, 27, 105–113. [Google Scholar] [CrossRef]
  20. Pedrini, N.; Mijailovsky, S.J.; Girotti, J.R.; Stariolo, R.; Cardozo, R.M.; Gentile, A.; Juarez, M.P. Control of pyrethroid-resistant Chagas disease vectors with entomopathogenic fungi. PLoS Negl. Trop. Dis. 2009, 3, e434. [Google Scholar] [CrossRef] [Green Version]
  21. Cohen, J.E.; Gürtler, R.E. Modeling household transmission of American trypanosomiasis. Science 2001, 293, 694–698. [Google Scholar] [CrossRef] [Green Version]
  22. Dias, J.C.; Silveira, A.C.; Schofield, C.J. The impact of Chagas disease control in Latin America: A review. Mem. Inst. Oswaldo Cruz 2002, 97, 603–612. [Google Scholar] [CrossRef] [Green Version]
  23. Lardeux, F.; Aliaga, C.; Depickère, S. Bias due to methods of parasite detection when estimating prevalence of infection of Triatoma infestans by Trypanosoma cruzi. J. Vector Ecol. 2016, 41, 285–291. [Google Scholar] [CrossRef]
  24. Moser, D.R.; Kirchhoff, L.V.; Donelson, J.E. Detection of Trypanosoma cruzi by DNA amplification using the polymerase chain reaction. J. Clin. Microbiol. 1989, 27, 1477–1482. [Google Scholar] [CrossRef] [Green Version]
  25. De Freitas, V.L.; da Silva, S.C.; Sartori, A.M.; Bezerra, R.C.; Westphalen, E.V.; Molina, T.D.; Teixeira, A.R.; Ibrahim, K.Y.; Shikanai-Yasuda, M.A. Real-time PCR in HIV/Trypanosoma cruzi coinfection with and without Chagas disease reactivation: Association with HIV viral load and CD4 level. PLoS Negl. Trop. Dis. 2011, 5, e1277. [Google Scholar] [CrossRef] [Green Version]
  26. Moreira, O.C.; Ramírez, J.D.; Velázquez, E.; Melo, M.F.; Lima-Ferreira, C.; Guhl, F.; Sosa-Estani, S.; Marin-Neto, J.A.; Morillo, C.A.; Britto, C. Towards the establishment of a consensus real-time qPCR to monitor Trypanosoma cruzi parasitemia in patients with chronic Chagas disease cardiomyopathy: A substudy from the BENEFIT trial. Acta Trop. 2013, 125, 23–31. [Google Scholar] [CrossRef]
  27. Crocco, L.B.; Catalá, S.S. Feeding and defaecation patterns in Triatoma sordida. Mem. Inst. Oswaldo Cruz 1996, 91, 409–413. [Google Scholar] [CrossRef] [Green Version]
  28. Regis, L. The role of the blood meal in egg-laying periodicity and fecundity in Triatoma infestans. Int. J. Invertebr. Reprod. 1979, 1, 187–195. [Google Scholar] [CrossRef]
  29. Lobbia, P.; Calcagno, J.; Mougabure-Cueto, G. Excretion/defecation patterns in Triatoma infestans populations that are, respectively, susceptible and resistant to deltamethrin. Med. Vet. Entomol. 2018, 32, 311–322. [Google Scholar] [CrossRef]
  30. Germano, M.D.; Inés Picollo, M. Reproductive and developmental costs of deltamethrin resistance in the Chagas disease vector Triatoma infestans. Journal of vector ecology: J. Soc. Vector Ecol. 2015, 40, 59–65. [Google Scholar] [CrossRef] [PubMed]
  31. Quinlan, M.C.; Tublitz, N.J.; O’Donnell, M.J. Anti-diuresis in the blood-feeding insect Rhodnius prolixus Stål: The peptide CAP2b and cyclic GMP inhibit Malpighian tubule fluid secretion. J. Exp. Biol. 1997, 200, 2363–2367. [Google Scholar] [CrossRef] [PubMed]
  32. Cardozo, R.M.; Panzera, F.; Gentile, A.G.; Segura, M.A.; Pérez, R.; Díaz, R.A.; Basombrío, M.A. Inheritance of resistance to pyrethroids in Triatoma infestans, the main Chagas disease vector in South America. Infect. Genet. Evol. J. Mol. Epidemiol. Evol. Genet. Infect. Dis. 2010, 10, 1174–1178. [Google Scholar] [CrossRef] [PubMed]
  33. Figueiredo, R.C.; Rosa, D.S.; Soares, M.J. Differentiation of Trypanosoma cruzi epimastigotes: Metacyclogenesis and adhesion to substrate are triggered by nutritional stress. J. Parasitol. 2000, 86, 1213–1218. [Google Scholar] [CrossRef]
  34. Avendaño, A.; Calderón-Arguedas, O.; Valerio, I.; Chinchilla, M. Heterogenity in the in vitro metacyclogenesis of clones derive from a Costa Rica strain of Trypanosoma cruzi (Kinetoplastida: Trypanosomatidae). Parasitol. Latinoam. 2006, 61, 12–16. [Google Scholar] [CrossRef] [Green Version]
  35. Vanrell, M.C.; Losinno, A.D.; Cueto, J.A.; Balcazar, D.; Fraccaroli, L.V.; Carrillo, C.; Romano, P.S. The regulation of autophagy differentially affects Trypanosoma cruzi metacyclogenesis. PLoS Negl. Trop. Dis. 2017, 11, e0006049. [Google Scholar] [CrossRef] [PubMed] [Green Version]
  36. Dias, F.; Guerra, B.; Vieira, L.R.; Perdomo, H.D.; Gandara, A.C.; Amaral, R.J.; Vollú, R.E.; Gomes, S.A.; Lara, F.A.; Sorgine, M.H.; et al. Monitoring of the Parasite Load in the Digestive Tract of Rhodnius prolixus by Combined qPCR Analysis and Imaging Techniques Provides New Insights into the Trypanosome Life Cycle. PLoS Negl. Trop. Dis. 2015, 9, e0004186. [Google Scholar] [CrossRef] [Green Version]
  37. Azambuja, P.; Garcia, E.S.; Ratcliffe, N.A. Gut microbiota and parasite transmission by insect vectors. Trends Parasitol. 2005, 21, 568–572. [Google Scholar] [CrossRef]
  38. Zingales, B.; Andrade, S.G.; Briones, M.R.; Campbell, D.A.; Chiari, E.; Fernandes, O.; Guhl, F.; Lages-Silva, E.; Macedo, A.M.; Machado, C.R.; et al. Second Satellite Meeting. A new consensus for Trypanosoma cruzi intraspecific nomenclature: Second revision meeting recommends TcI to TcVI. Mem. Inst. Oswaldo Cruz 2009, 104, 1051–1054. [Google Scholar] [CrossRef]
  39. Loza-Murguía, M.; Noireau, F. Vectorial capacity of Triatoma guasayana (Wygodzinsky & Abalos) (Hemiptera: Reduviidae) compared with two other species of epidemic importance. Neotrop. Entomol. 2010, 39, 799–809. [Google Scholar]
  40. Duffy, T.; Bisio, M.; Altcheh, J.; Burgos, J.M.; Diez, M.; Levin, M.J.; Favaloro, R.R.; Freilij, H.; Schijman, A.G. Accurate real-time PCR strategy for monitoring bloodstream parasitic loads in chagas disease patients. PLoS Negl. Trop. Dis. 2009, 3, e419. [Google Scholar] [CrossRef]
  41. Elias, M.C.; Vargas, N.S.; Zingales, B.; Schenkman, S. Organization of satellite DNA in the genome of Trypanosoma cruzi. Mol. Biochem. Parasitol. 2003, 129, 1–9. [Google Scholar] [CrossRef]
  42. Davies, C.; Poma, R.H.; Cardozo, R.M.; Mora, M.C.; Ramos, F.; Rajal, V.B.; Basombrío, M.A. Detección de Trypanosoma cruzi en tejido y sangre murina por PCR convencional y en tiempo real. Acta Bioquím. Clín. Latinoam. 2014, 48, 421–428. [Google Scholar]
  43. Enriquez, G.F.; Bua, J.; Orozco, M.M.; Wirth, S.; Schijman, A.G.; Gürtler, R.E.; Cardinal, M.V. High levels of Trypanosoma cruzi DNA determined by qPCR and infectiousness to Triatoma infestans support dogs and cats are major sources of parasites for domestic transmission. Infect. Genet. Evol. J. Mol. Epidemiol. Evol. Genet. Infect. Dis. 2014, 25, 36–43. [Google Scholar] [CrossRef]
  44. Gonzalez, A.; Prediger, E.; Huecas, M.E.; Nogueira, N.; Lizardi, P.M. Minichromosomal repetitive DNA in Trypanosoma cruzi: Its use in a high-sensitivity parasite detection assay. Proc. Natl. Acad. Sci. USA 1984, 81, 3356–3360. [Google Scholar] [CrossRef] [PubMed] [Green Version]
  45. Eisenhauer, J.G. Regression through the origin. Teach. Stat. 2003, 25, 76–80. [Google Scholar] [CrossRef]
  46. Rabinovich, J.E.; Leal, J.A.; Feliciangeli de Piñero, D. Domiciliary biting frequency and blood ingestion of the Chagas’s disease vector Rhodnius prolixus Ståhl (Hemiptera: Reduviidae), in Venezuela. Trans. R. Soc. Trop. Med. Hyg. 1979, 73, 272–283. [Google Scholar] [CrossRef]
Figure 1. Feeding and defecation patterns of “R” (pyrethroid-resistant) and “S” (pyrethroid-susceptible) third instar T. infestans nymphs. The median is shown as a solid line inside the box. (a) Volume of blood ingested (* p = 0.021); (b) time of defecation (* p = 0.01).
Parasitologia 02 00022 g001
Figure 2. Linear regression through the origin of the concentration of blood trypomastigotes consumed during feeding and the parasites excreted in the feces of “R” (solid circle) and “S” (hollow circle) nymphs. Logarithmic transformation was applied to the data of both axes.
Parasitologia 02 00022 g002
Table 1. Mean and standard error of the variables measured as estimates of feeding behavior in “R” and “S” T. infestans.
Parameter“R”“S”p (α = 0.05)
Initial weight (g)0.010 ± 0.0010.0084 ± 0.0010.007
Final weight (g)0.050 ± 0.0040.031 ± 0.0030.0014
Feeding onset (min)3.51 ± 1.023.24 ± 0.7720.771
Feeding time (min)12.6 ± 2.1712.6 ± 0.9940.34
Table 2. Mean and standard error of the percentage of metacyclic trypomastigotes (MT), length of epimastigotes (E) and MT in the feces of “R” and “S” T. infestans after fasting for 30 days.
Parameters“R”“S”p (α = 0.05)
% TM32.80 ± 5.872.5 ± 6.770.001
E (μm)31.8 ± 1.4025 ± 2.170.017
MT (μm)27.6 ± 1.1727.1 ± 3.060.693
Table 3. Estimation of parasites ingested and defecated based on qPCR data. Values are shown as mean ± experimental error.
“R”“S”
Parasite consumption
(parasite-equivalents/mL of blood)
2.1 × 10⁴ ± 1.0 × 1043.9 × 103 ± 2.2 × 10³
Parasite elimination
(parasite-equivalents/mL of feces)
3.8 × 10⁷ ± 9.7 × 1062.1 × 106 ± 4.6 × 10⁶
Slope6.6 ± 0.127.9 ± 0.14
p (α = 0.05)<0.0001<0.0001
Publisher’s Note: MDPI stays neutral with regard to jurisdictional claims in published maps and institutional affiliations.

