Article

Utility of Osteoarthritis as an Indicator of Age in Human Skeletal Remains: Validating the Winburn and Stock (2019) Method

by
Ariana N. Strasheim
1,*,
Allysha P. Winburn
2 and
Michala K. Stock
3
1
Grouse Mountain Environmental Consultants, Buffalo, WY 82834, USA
2
Anthropology Department, University of West Florida, Pensacola, FL 32514, USA
3
Sociology & Anthropology Department, Metropolitan State University of Denver, Denver, CO 80204, USA
*
Author to whom correspondence should be addressed.
Forensic Sci. 2023, 3(2), 205-230; https://doi.org/10.3390/forensicsci3020016
Submission received: 29 January 2023 / Revised: 19 March 2023 / Accepted: 22 March 2023 / Published: 29 March 2023
(This article belongs to the Special Issue Estimating Age in Forensic Anthropology)

Abstract

:
In forensic anthropology, and biological anthropology more broadly, age estimation is a crucial element of the biological profile. The development of osteoarthritis (OA) is correlated with age and, in 2019, Winburn and Stock published a method of estimating age in a sample of 408 white American individuals using OA presence/absence. The current study expanded the original study by testing its accuracy on a more diverse sample, including black, indigenous, and people of color (BIPOC). This served to test whether embodied inequity from lived experiences may preclude the ability of the OA presence/absence method to estimate age at death. This study’s results demonstrated both that the original methodology was validated, and that the approach was accurate at estimating the age of death of BIPOC individuals. Furthermore, this study revealed that the hip and shoulder were highly consistent and reliable and are recommended for use as the strongest indicators of age at death, while the TMJ and ankle performed poorly and should not be used for age estimation.

1. Introduction

Biological anthropologists estimate age at death as part of an approach known as the biological profile—analysis of the skeletal and dental evidence of a deceased individual’s age, sex, population affinity, and stature. Forensic anthropologists apply this approach to the analysis of medicolegal case decedents in an effort to guide their case investigations and ultimately enable decedent identifications. These forensic case decedents disproportionately originate from communities that experience social marginalization [1,2,3], meaning that their lives may have included experiences of poverty, housing insecurity, classism, racism, and/or the social and economic stresses leading to migration. Particularly, in the U.S. and many other sociocultural contexts, the lived experience of whiteness conveys a degree of social privilege often systematically denied to people of color. As such, people of color living in racialized societies may undergo disproportionate stressors that, in addition to larger-scale health disparities, can cause their bodies and bodily systems to age prematurely [4,5] via the embodiment of experiences of inequity [6,7]. We use “stressors” here as a general term, but there are numerous specific mechanisms linking inequity with biological consequences [8]. The development of osteoporosis, for example, has been linked not with chronic stress but with inequities in access to critical resources (e.g., healthcare) produced by structural racism and sexism [9,10]. While thoroughly investigated in living individuals, the potential impact of accelerated aging due to social adversity has rarely been investigated in skeletal remains cf. [11].
Yet, disregarding the possibility that lived experiences of marginalization may impact the rate of aging of skeletal tissues could translate to the methodological failure of current age-estimation methods. If so, the age estimates generated by forensic anthropologists could be the most inaccurate for the very individuals their casework most frequently serves. The current study tests the validity and applicability of an osteoarthritis-based age-estimation method to more diverse individuals than the white American skeletal sample on which it was originally created.

A Brief Review of Osteoarthritis

Osteoarthritis (OA; Figure 1) is a multifactorial disease process with both anabolic and catabolic components and risk factors, including age, sex, obesity, bone density, joint malformation, trauma, heredity, epigenetics, and environmental impacts [12,13,14]. It is caused by the interruption of regular function in the complex joint organs that consist not only of articulating skeletal elements but also synovial fluid, ligaments, and hyaline cartilage [15,16,17,18]. Cartilage is an avascular tissue and is thus unable to repair itself if damaged or degraded [19]—a characteristic that does not bode well for a tissue that repeatedly withstands significant mechanical stress. Like healthy bone, healthy cartilage exists in a state of homeostasis, wherein anabolic processes and catabolic processes remain in equilibrium. However, factors such as repeated abnormal mechanical stress or even enzymatic activity can trigger disequilibrium, as catabolic processes outpace anabolic ones [20]. When anabolic activity cannot catch up, homeostasis within a joint is disrupted, often resulting in the development of OA [16,20].
In living individuals, an OA diagnosis may be indicated by radiographic evidence of joint space narrowing, sclerotic joint margins, and lesions in subchondral bone marrow, as well as a patient’s reported experiences of pain [21,22,23,24]. In skeletal decedents, however, the identification of OA typically relies on the macroscopic observation of joint changes (see Figure 1), including the formation of osteophytes on and around articular surfaces and the eburnation or polishing of articulating bones in absence of cartilage [25,26,27,28].
While it has long been known to be age-correlated, the degree to which OA could be used to predict the age of skeletal remains—without being significantly influenced by variables such as heritability, obesity, repeated activity, or injury—remained unclear until relatively recently. Within the past five years, however, biological anthropologists have consistently found that OA has a statistically significant relationship with age, indicating its age-estimation potential [14,29,30,31,32,33]. Accordingly, the literature on skeletal age estimation has expanded beyond frequently used indicators like the pubic symphysis to explore a variety of osteoarthritic changes to more mobile, synovial joints, like the clavicle [34], shoulder [29,30], and acetabulum [14].
In 2019, Winburn and Stock demonstrated that even the basic presence or absence of OA can aid in estimating age [33]. Using a sample of 408 white U.S. skeletal donors from the region of eastern Tennessee, they highlighted that age correlates more strongly with the development of OA than contributing factors like physical activity and obesity, proposing a method to estimate age based on the presence or absence of OA via age cut-offs generated by transition analysis (TA) [35,36]. However, the Winburn and Stock [33] method remains unvalidated. Furthermore, because of the dearth of ethically sourced donors of color in U.S. skeletal collections [3], the original authors only examined the remains of donors who identified as white, meaning that the method’s applicability to decedents of color is, as of yet, unexplored. It has been proven that stress (specifically oxidative stress) can shorten telomere length and result in accelerated or premature aging processes [37] and, recently, the shortening of telomeres from oxidative stress was discovered in the chondrocytes and subchondral bone of individuals with OA [38]. If the stress of the lived experience of marginalization is impacting the skeletal tissues of the joints, then OA-based age-estimation methods may lead to overaging decedents of color. The current study fills these gaps in the literature, using a sample of 298 skeletal donors to investigate whether OA incidence and patterning differs among decedents with differing identities vis à vis racial privilege and, therefore, likely different lived experiences of race.

2. Materials and Methods

2.1. The Hypothesis and Study Sample

This study tests the hypothesis that, due to the embodied effects of racialized social inequity, skeletal remains from black, indigenous, and people of color (BIPOC) will display a different pattern of OA than the remains of white donors, potentially developing more (severe) OA at earlier ages. To investigate this question, this validation study applied the Winburn and Stock [33] method to 298 skeletal donors from the University of Tennessee’s Donated Skeletal Collection.
Every available donor in the UTK Donated Skeletal Collection who identified as BIPOC was included in this study (n = 60; Figure 2). While we acknowledge that the term BIPOC has been critiqued as exclusive [39], 73% of our sample (44 of 60 donors) reported some component of black or American Indian identity (it should be noted that “American Indian” is the census-based terminology used by the UTK Donated Skeletal Collection, and it is reported here accordingly). As such, we feel that a term centering these identities is appropriate for the current study. Additional self-reported social races within our BIPOC subsample included Asian and Hispanic. The fact that individuals with diverse experiences of social race were grouped together in this subsample was a result of the small sample size and will be discussed further in Study Limitations.
The remainder of the sample (n = 215) consisted of individuals who: (1) identified as white; and (2) were not examined previously by Winburn and Stock [33]. A quota sampling strategy was selected for the white group, wherein the population was divided into subgroups based on age, and then a subsample was created by selecting random individuals from that age category to represent each subgroup. This sampling strategy guaranteed that the results were representative of the collection and that they adequately illustrated the progression of OA over time. An additional 23 previously analyzed donors were chosen specifically to duplicate the analyses of Winburn and Stock [33] in order to enable the calculation of interobserver error. This subsample was selected using a systematic random sampling strategy, where the entire population of individuals considered in the Winburn and Stock [33] study (n = 408) was organized randomly, and then every 16th individual selected from that list until 23 had been reached.
The project aim was to include 30 members from each 10-year age category (e.g., 20–29 years of age at death, and 30–39 years of age at death). However, due to the demographic makeup of the UTK Donated Skeletal Collection, in which disproportionate numbers of donors have ages at death in their 60s and 70s [40], it proved difficult to achieve the goal of 30 individuals per category for the younger age categories even in the larger, white subsample (Table 1; Figure 3). The average age at death for the white female subsample was 62.6 years, and 62.2 for the males (see Table 1). A fully age-balanced sample was impossible for the smaller sample of donors of color (see Table 1; Figure 4). The average age at death for the BIPOC female subsample was 62.3 years, and 52.6 for the males. Since the BIPOC and white subsamples had distinctly different sample sizes and age distributions (Figure 5; also see Table 1; Figure 3 and Figure 4), the white subsample was repeatedly and iteratively sampled by the sample size of the BIPOC subsample in order to address the risk of bias from larger sample sizes in the white subsamples, and allow for comparison with the same subsamples in the age categories of the white subsample.

2.2. Data Collection

The methodology utilized in the original study of Winburn and Stock [33] involved scoring each appendicular joint (aside from the hands and feet) and the temporomandibular joint, or TMJ, by severity of OA based on the four-score approach of [41]. The hands and feet were evaluated merely for presence/absence of OA, rather than severity. Each component of a joint was scored individually, and then all elements were combined and divided by the total number of elements to create a comprehensive score for that joint as a whole [33]. The left and right scores were combined, averaged, and then dichotomized to either “OA present” or “OA absent”, given that a presence/absence methodology for OA-based age estimation is preferable to one based on degree of severity in cases of fragmentary or incomplete remains—both archaeologically and forensically common. After establishing that OA in each of the joints correlated with age, the study authors used transition analysis to generate age estimates from these combined-side binary scores [33]. To apply their method, analysts assess whether OA is present or absent in individual joints. In this binary system, any evidence of OA (i.e., osteophytes and eburnation), regardless of the severity, qualifies a joint for the “OA present” category. The pattern of OA presence/absence is then compared with a chart presenting the ages at which 90% and 95% of their sample transitioned to “OA present” in order to assign minimum/maximum ages at death or broad age-estimation intervals.
This study followed the Winburn and Stock binary scoring methodology, with the first author examining and categorizing each sampled individual’s joints (TMJ, shoulder, elbow, wrist, hand, hip, knee, ankle, and foot) as either “OA present” or “OA absent” without knowledge of the donor’s demographic data. In the case that a joint surface was missing or unobservable (e.g., due to postmortem damage), it was marked as such and excluded from the study. When present and observable, joint surfaces on both the left and right sides of the body were included, since each joint is addressed at an individual level using the method of Winburn and Stock [33]. For example, if the left hip demonstrated OA while the corresponding right hip did not, then the left was marked as “OA present” and the right as “OA absent”.
All statistical analyses were performed in R (Version: 4.1.0; [42]). The alpha levels were set at p = 0.05 for all the analyses, with the exception of the Bonferroni-corrected chi-square tests (p = 0.025; see below). First, summary statistics were calculated, and Kaplan-Meier survivorship curves were also generated to illustrate the similarities/differences between the age distributions of this study’s subsamples (see Figure 5). Binomial generalized linear model (GLM) probit link function analyses [43] were then applied to the white subsample (n = 215), as well as the BIPOC subsample (n = 60)—the results of which enabled a comparison with the age-at-transition categories generated from Winburn and Stock’s [33] study. The “VGAM” package [44] in RStudio5 enabled the probit link function of the binomial GLMs to use log-scaled age to generate the estimates of the ages at which 90% and 95% of the population will have transitioned to the state of “OA present” for males and females. The GLM probit link function analyses were set up so that the dependent variable was the presence/absence of OA at a given joint and the independent variable was the log-transformed age. The ages-at-transition were generated directly from the log-scaled probit model. The probit’s assumption of normally distributed errors was tested using the Lagrange multiplier specification test for each sex- and population-specific sample, following Bera and colleagues [45] and Johnson’s [46] methods. The R code to perform these tests was adapted from Dr. Lyle Konigsberg’s transition analysis tutorial webpage (http://faculty.las.illinois.edu/lylek/TransAna/TransAna.html accessed on 7 March 2023; [47]).
The white subsample was large enough for direct comparison with Winburn and Stock [33], but the BIPOC subsample required additional steps. Bootstrapping (1500 iterations per sub-category of repeated resampling with replacement) of Winburn and Stock’s [33] data, as well as the white subsample of the current study, allowed for a direct comparison with the corresponding subcategories from the BIPOC subsample. The downside of comparing a relatively small sample to a larger one is that there are inherent limitations in the smaller sample. Although bootstrapping promotes stability of the estimators of a large sample, the small subsample is left as is, with all of its outliers and potential risk of not capturing the true scope of variation. If the smaller subsample has limited variation, which is more likely to occur than in a large sample, there is no way to work around this. While bootstrapping the larger samples repeatedly down to the smaller sample’s size does not do anything to address the reduced variance in the small subsample, doing so allows direct comparison, i.e., mitigates the potential for unequal sample sizes to obscure the true difference or similarity between the samples. For example, to compare the age at transition at which 90% of the sample transitioned to OA present in the shoulder in females between the datasets, the number of BIPOC females in this study (n = 29) was randomly sampled from the total number of females (n = 198) in Winburn and Stock [33]. The ages at which 90% and 95% of the sample had transitioned to OA present were taken from each randomly chosen set of individuals for each of the 1500 iterations. The grand mean from all 1500 iterations was the age at transition used to compare the larger, white datasets to the smaller in a direct fashion.
To ascertain if the ages at transition generated in this study for both the white and BIPOC subsamples were significantly different from those published in Winburn and Stock [33], chi-square tests were utilized to compare the relationship between the expected and the observed variables. In addition, rates of interobserver error were tested on 23 individuals from the skeletal sample in Winburn and Stock [33] to highlight any differences between the researchers. Overall agreement was also calculated for 10 individuals tested at the beginning and then again at the end of data collection to determine internal consistency within the study (intraobserver error). For both inter- and intraobserver error analyses, agreement was calculated by joint, as well as by individual.
Standard tests for interobserver error, such as Cohen’s kappa [48,49], were not applicable to these datasets, as the binary nature of the dataset and the frequency of “OA present” designations did not provide enough variation to test the variance between observers. The presence of ‘NAs’, which were scored when a joint was either absent (amputated, missing, or artificially replaced) or unobservable, acted as a third variable. In addition to the presence and absence of data, the NAs complicated calculation of interobserver error, as when one rater scored a joint surface as unobservable, or NA, but the other rater did not, then the conventional formulas did not allow for the comparison of the two scores. It is critical for a standardized methodology that practitioners are able to consistently determine when a joint surface is too fragmentary to assess, or alternately, when there is an adequate joint surface present to make an OA determination. Therefore, since the NA values were valuable data, with implications for method replicability, the study drew from statistical tests utilized in ecology to ensure that the NA values were included in the calculations of interobserver error. Specifically, the formula used to calculate the pseudoturnover in Morrison [50] proved applicable to the current dataset after a slight modification. The equation in the paper is:
(A + B/Sa + Sb) × 100
where A and B represent the unique plant species observed in group 1 and group 2, and Sa and Sb represent the total amount of plant species observed. By modifying this formula slightly, it becomes effective at calculating interobserver error that accounts for the NA values. The new formula is:
(A + B/(Sa − NA) + (Sb − NA)) × 100 = X 100 − X = IOE
where A and B represent the observation of OA presence from reviewer one and reviewer two, Sa and Sb represent the total observable joint surfaces, and the number of NA values are subtracted from Sa and Sb. The same formula used for the calculation of interobserver error was used to calculate intraobserver error, with the two observers representing the first trial and the second trial. For both the interobserver and intraobserver error, the calculation was applied by joint as well as by all joints within each individual tested.
Finally, the ages of the 275 individuals from this study were estimated utilizing Table 9 of Winburn and Stock ([33], p. 468), which provides the ages at which 90% and 95% of the original sample transitioned to having OA present. Following Winburn and Stock (Table 9 of [33]), the female ankle and male TMJ models were not used to estimate age; likewise, the female knee model was only used when necessary.
In individuals who demonstrated OA in every joint, a conservative approach was taken, and the youngest age at transition (the hip) acted as the minimum age, with the age range designated as anything above the minimum age. For individuals with a mixture of osteoarthritic joints and joints without OA, the presence of OA in a joint created a minimum age, and its absence in another joint created the maximum age. For a female that had OA in the hip but not in the TMJ, for example, the age range generated by the ages at which 90% of females transitioned to exhibiting OA would be 37–77 years (with the lower bound informed by the presence of OA in the hip and the upper bound informed by the lack of OA in the TMJ). In instances where OA presence in one joint conflicted with its absence in another (i.e., the observed pattern of OA did not match the pattern of ages at transition reported by Winburn and Stock), the absence of OA was preferenced, with the age at transition for the joint with OA absence used as an age maximum.
For each sampled individual, accuracies of the estimated age ranges based on the ages at which 90% and 95% of the sample transitioned to “OA present” were calculated by comparing whether the documented age of the individual fell within those age ranges.

3. Results

3.1. Age Distributions

The age at death distributions were markedly similar among this study’s subsamples, with the exception of the BIPOC male age distribution (see Figure 5). The mean age at death for the white female subsample was 62.6 years, and 62.2 for the males (see Table 1). The mean age at death for the BIPOC female subsample was 62.3 years, and 52.6 for the males. The comparatively young ages of the BIPOC males were the driving factor in the subsample differences. The oldest average age at death occurred in the American Indian female group, at 65.5 years, but the subsample size was only four individuals. The youngest age at death was the BIPOC male group, with an age of 52.6 years.

3.2. GLM-Probit Analyses

The GLM-probit analyses generated the age at transition at which 90% and 95% of the individuals in the current study transitioned from “OA absent” to “OA present”. For the BIPOC subsample (Table 2), the ages at transition for 90% of the population ranged from 18.1 years (male elbow) to 68.5 years (male wrist). At 95%, the ages ranged from 29.3 years (pooled-sex elbow) to 90.3 years (male wrist). For the female BIPOC subsample (n = 29), there were multiple joints where the model was unable to resolve, resulting in either “inf” (infinity) or “NaN” (not a number; see Table 2). The joints that were able to provide a mean age were the TMJ, hand, wrist, and foot, and they all were similar in age, clustering in the 40s and 50s. The BIPOC male and pooled-sex subsamples had better success with the model than the female subgroup. With the males, the hip, TMJ, and elbow were the first joints to transition, followed by the shoulder and knee, and finally the ankle, wrist, hand, and foot. In the pooled-sex subsample, the first joints to transition from “OA absent” to “OA present” were the shoulder, elbow, hip, and knee, whereas the TMJ, hand, wrist, ankle, and foot did not transition until later in life. For the males, the TMJ, elbow, hip, and knee were the first joints to transition, whereas the shoulder, wrist, hand, ankle, and foot transitioned at older ages. Note that several of the BIPOC female GLMs (wrist and hand) and BIPOC male GLMs (elbow and hip) violated the assumption of normally distributed errors when using the probit link (see asterisks in Table 2). However, the ‘VGAM’ package uses the iteratively reweighted least squares method for filling the GLMs, which is robust to perturbations caused by violating the normality assumption as compared to the standard maximum likelihood estimation [51].
For the white subsample (see Table 3), the youngest age at which 90% of the sample transitioned to OA present was 21.7 years (male elbow) and the oldest was 62.8 years (female ankle). At 95%, the ages of transition ranged from 29.8 years (female elbow and hip) to 133.2 years (female ankle). Regardless of sex, the hip and the elbow were the first joints to develop OA, and the female ankle was the last. Note that several of the white female GLMs (elbow, hip, and knee) and white male GLMs (elbow and hip) violated the assumption of normally distributed errors when using the probit link (see asterisks in Table 3). Again, see the previous paragraph’s discussion of the model-fitting methods in ‘VGAM,’ which overcomes the need to satisfy the normality assumption [51].
The ages in Table 3 can be directly compared to those in Winburn and Stock [33] due to similar sample sizes and age distributions. However, to enable a comparison with the smaller BIPOC subsample, the white subsample was repeatedly iteratively resampled (Table 4). Although each joint underwent 1500 iterations, the ages of transition that were either unable to resolve (NaNs) or older than 120 years were excluded. The resulting number of iterations contributing to the mean 90% or 95% transition age for each joint, therefore, varied, with a minimum of 386 iterations and a maximum of 1497. After repeated iterative resampling, the youngest mean age at which 90% of the white subsample after repeated iterative sampling had transitioned from “no OA” to “OA present” occurred in the pooled-sex elbow (28.6 years), while the oldest occurred in the female ankle (60.9 years). The youngest joint’s 95% mean transition age was the female elbow, at 33.0 years, and the oldest was the female ankle at 77.4 years. The first joints to transition were the elbow, hip, and knee, while the TMJ and the ankle were the last to transition.
The ages at transition generated from the Winburn and Stock [33] method were also repeatedly iteratively resampled (Table 5) prior to comparison with the BIPOC subsample. Each joint underwent 1500 iterations, and after the removal of transitional ages from individual iterations that did not meet the criteria (NaNs or older than 120 years), the total number of iterations varied between 109 and 1499. The youngest mean age at transition generated for 90% of the population was 32.7 years (male hip), and the oldest was 89.8 years (female ankle). At 95%, the mean ages ranged from 35.4 years (male hip) to 97.6 years (pooled TMJ). The first joints to transition were the hip, shoulder, and elbow, while the last were the wrist, hand, foot, ankle, and TMJ.
A chi-square test of independence looked for significant differences between the various groups of ages at transition generated. The alpha levels were subjected to a Bonferroni correction for multiple comparisons and were, therefore, set at p = 0.025. The first datasets compared were the BIPOC subsample and the white subsample (after repeated iterative sampling) of the current study (Table 6). The results of the chi-square test demonstrated that for many of the joint surfaces tested, there were no significant differences between the ages at transition. Only the males demonstrated values that were significantly different, as the pooled-sex and female categories showed no significant differences in any joint. However, the N/As in the female column indicate that a chi-square test could not be run for these joints because the values generated for the age at transition in the BIPOC subsample were not numeric values (inf or NaN). The male wrist and knee showed significant differences from the iterated white subsample, with the BIPOC males transitioning at an older age than the white male subsample (see Table 3 and Table 5).
The next set of ages at transition tested were the BIPOC subsample and the iteratively resampled Winburn and Stock [33] data (Table 7). The chi-square tests indicated that the TMJ, elbow, wrist, and ankle all showed significant differences. Regardless of sex, none of the TMJ values were similar to those from Winburn and Stock’s [33] data. At 90% of the sample’s transition to OA present, the elbow was significantly different for both males and the pooled-sex group but was similar at the 95% level. For the wrist, both male values were significantly different, and the pooled-sex ankle showed significant differences at both the 90 and 95% levels as well. All other joint surfaces showed no significant differences. The TMJ (regardless of sex), the male and pooled-sex elbow, and the combined-sex ankle in the BIPOC subsample transitioned at much earlier ages than in Winburn and Stock [33] (see Table 3 and Table 7). The male wrist, in contrast, transitioned later.
The results of the chi-square tests between the white subsample of the current study and Winburn and Stock [33] are presented in Table 8. Since these two samples were similar in size and demographics, no repeated iterative sampling was needed to compare ages at transition between the two, and, instead, the values from Winburn and Stock’s Table 9 ([33], p. 468) were directly compared to the ages in Table 3 of the current paper. Joints that were significantly different between the two studies included the TMJ, elbow, hand, knee, ankle, and foot, whereas there were no significant differences in the shoulder, wrist, or hip. Values of N/A in Table 8 represent the joints that Winburn and Stock [33] advised against using for age estimation and which, therefore, did not have an age at transition to compare with the current sample. Aside from the ankle, all the male joints showed no significant differences from Winburn and Stock’s data. The female TMJ, 95% female elbow, 90% female hand, 95% female knee, male ankle, and 95% female foot in the white subsample all transitioned at an earlier age than they did in Winburn and Stock (see Table 3). For the age at which both 90% and 95% of the sample had transitioned to OA present, all of the eligible pooled-sex joints had p-values greater than 0.025, indicating no significant differences from Winburn and Stock’s [33] data.

3.3. Estimation of Age at Death: Applying the Winburn and Stock [33] Method

For each of the 275 individuals, the unique pattern of OA presence or absence was used to estimate an age at death. The ages at which 90% and 95% of the original, published sample transitioned to OA presence were used to create age ranges, which were then compared with the actual ages at death to determine if the age ranges were correct (Table 9). Many individuals had OA in every joint, in which case their age range was a minimum with no upper age terminus. Overall, the agreement between the estimated age ranges and actual ages was high. Using the published ages at which 90% of the original sample transitioned to OA presence (Table 9 of [33], p. 468), there was a 91.64% agreement rate between the age range estimated from OA and the actual age at death. Using the ages at which 95% of Winburn and Stock’s individuals transitioned to OA presence, the accuracy was 87.27% (see Table 9 of the current paper). Of the 23 individuals who were incorrectly aged using the 90% ages at transition, and the 35 who were incorrectly aged using the 95% ages, the majority were younger than 40 years (74% for both; n = 17 and 26, respectively).
A comparison of the accuracy rates for the various subsamples shows that the Winburn and Stock method yields age estimates that are equivalent for all the subsamples (see Table 9). Comparing BIPOC with white individuals, the accuracies are 92% (BIPOC) and 93% (white) using the ages at which 90% of the Winburn and Stock sample transitioned to OA presence, and 85% (BIPOC) and 88% (white) for the 95% ages.

3.4. Interobserver Error

When calculated by joint, the rates of overall error for the 23 reassessed individuals averaged 9.41% for the left joints and 9.42% for the right (Table 10). This reflects a moderate agreement between the researchers in the current study and those in the original OA study conducted by Winburn and Stock [33]. The joint surfaces that showed the most discordance between the two were the left and right TMJ, with an error rate of 19.57% (see Table 10). The joint surface with the highest agreement was the right elbow, with an error rate of 2.17%. In addition to joint, the agreement was also calculated by individual (Table 11). These comparisons looked at the overall error of all of the joints in an individual skeleton between both observers. The average error by individual was 9.14%. The highest error on an individual was 62.86%, while the lowest was 0.00% (see Table 11).

3.5. Intraobserver Error

The first ten individuals sampled for OA were sampled again at the end of the data collection in order to provide an indication of internal consistency. The rates of overall error, when calculated by joint, averaged 5.61% on the left and 9.07% on the right (Table 12). The highest error by joint occurred in the right wrist, at 21.05%, while the lowest was 0% (see Table 12). When calculated by individual, the error averaged 7.72% (Table 12). The highest error by individual was 35.48%, while the lowest was 0%.

4. Discussion

The study of Winburn and Stock [33] used transition analysis to generate ages at which 90% and 95% of their sample transitioned to exhibiting OA in the TMJ and all appendicular joints. The current study generated similar ages at transition using a more diverse skeletal sample. For the BIPOC subsample, the pooled-sex ages at which 95% of this sample transitioned to having OA in the shoulder, elbow, wrist, hand, hip, knee, and foot were not significantly different from those reported in Winburn and Stock [33] (See Table 7). For the white subsample, the pooled-sex ages at which 95% of this sample transitioned to having OA in the shoulder, elbow, wrist, hand, hip, knee, and foot were not significantly different from those reported in Winburn and Stock [33] (See Table 8). Therefore, both subsamples from the current study confirm the general pattern of age-correlated OA development reported in the earlier study.
The BIPOC subsample did yield significantly different results in the TMJ and ankle for the 95% transition comparison. The original study also identified issues with the ability of the TMJ and the ankle to correctly predict age—even recommending that the TMJ not be used to estimate age in male individuals, that the ankle not be used for females, and that neither joint be used when combined-sex models are employed [33]. As such, it is not surprising that these two inconsistent joints, in which correlations between OA and age are more tenuous, produced values that were significantly different between the two studies.
This study also confirmed other patterns discovered by the original study authors. For example, the tendency for the proximally placed appendicular joints to develop OA before the more distally placed joints was generally upheld in the white subsample—aside from a few outliers, such as the male elbow (see Table 4 and Table 5). Although certain joints showed earlier transition ages than in Winburn and Stock [33], the pattern of which joints were the first and last to transition—regardless of age—was very similar to that reported by Winburn and Stock. For the white subsample, what this confirms is that in contrast to the long-held belief that OA is too multifactorial to inform age, OA development in appendicular joints is even more strictly controlled by age than previously thought. Furthermore, if, as once believed, OA were a result of regular “wear and tear” to the joint surfaces, it may be expected that those joint surfaces that undergo the highest biomechanical stresses, such as the knee, would be the first in the body to develop OA. However, this is not the case. Instead, in samples of white Americans, appendicular OA follows a consistent pattern, where the hip is one of the first joints to develop OA and the hand is one of the last. Using OA as an indicator of activity patterns, a traditional approach in the discipline of bioarchaeology, e.g., refs. [52,53,54,55,56,57,58], is, therefore, unwise for forensic populations. For purposes of forensic age estimation, however, this is excellent news. As posited in the original study, the pattern of ages at which OA develops throughout the body can help to refine other aging methods in forensic anthropology. Existing age-estimation methods for middle- to older-aged adults are limited by their broad ranges, but the additional information provided by joint OA can narrow these ranges. The hips are informative for younger individuals, whereas the hands, feet, and female TMJ can provide information to refine the age ranges for older individuals.
The BIPOC subsample followed the “proximal to distal” pattern of OA development more loosely. The hip was often the first joint to transition, but the elbow and knee sometimes transitioned before the shoulder, and the wrist and ankles sometimes transitioned after the hands and feet (see Table 2). In addition, the TMJ, which was one of the very last joints to transition in Winburn and Stock [33], was commonly the second or third joint to transition in the BIPOC subsample. The ankle also transitioned much earlier. However, given the tenuous age-OA correlation in the male TMJ and female ankle, the unexpectedly early transition of these joints in this study is not overly concerning—particularly since the original study authors recommended against using these joints to estimate age.
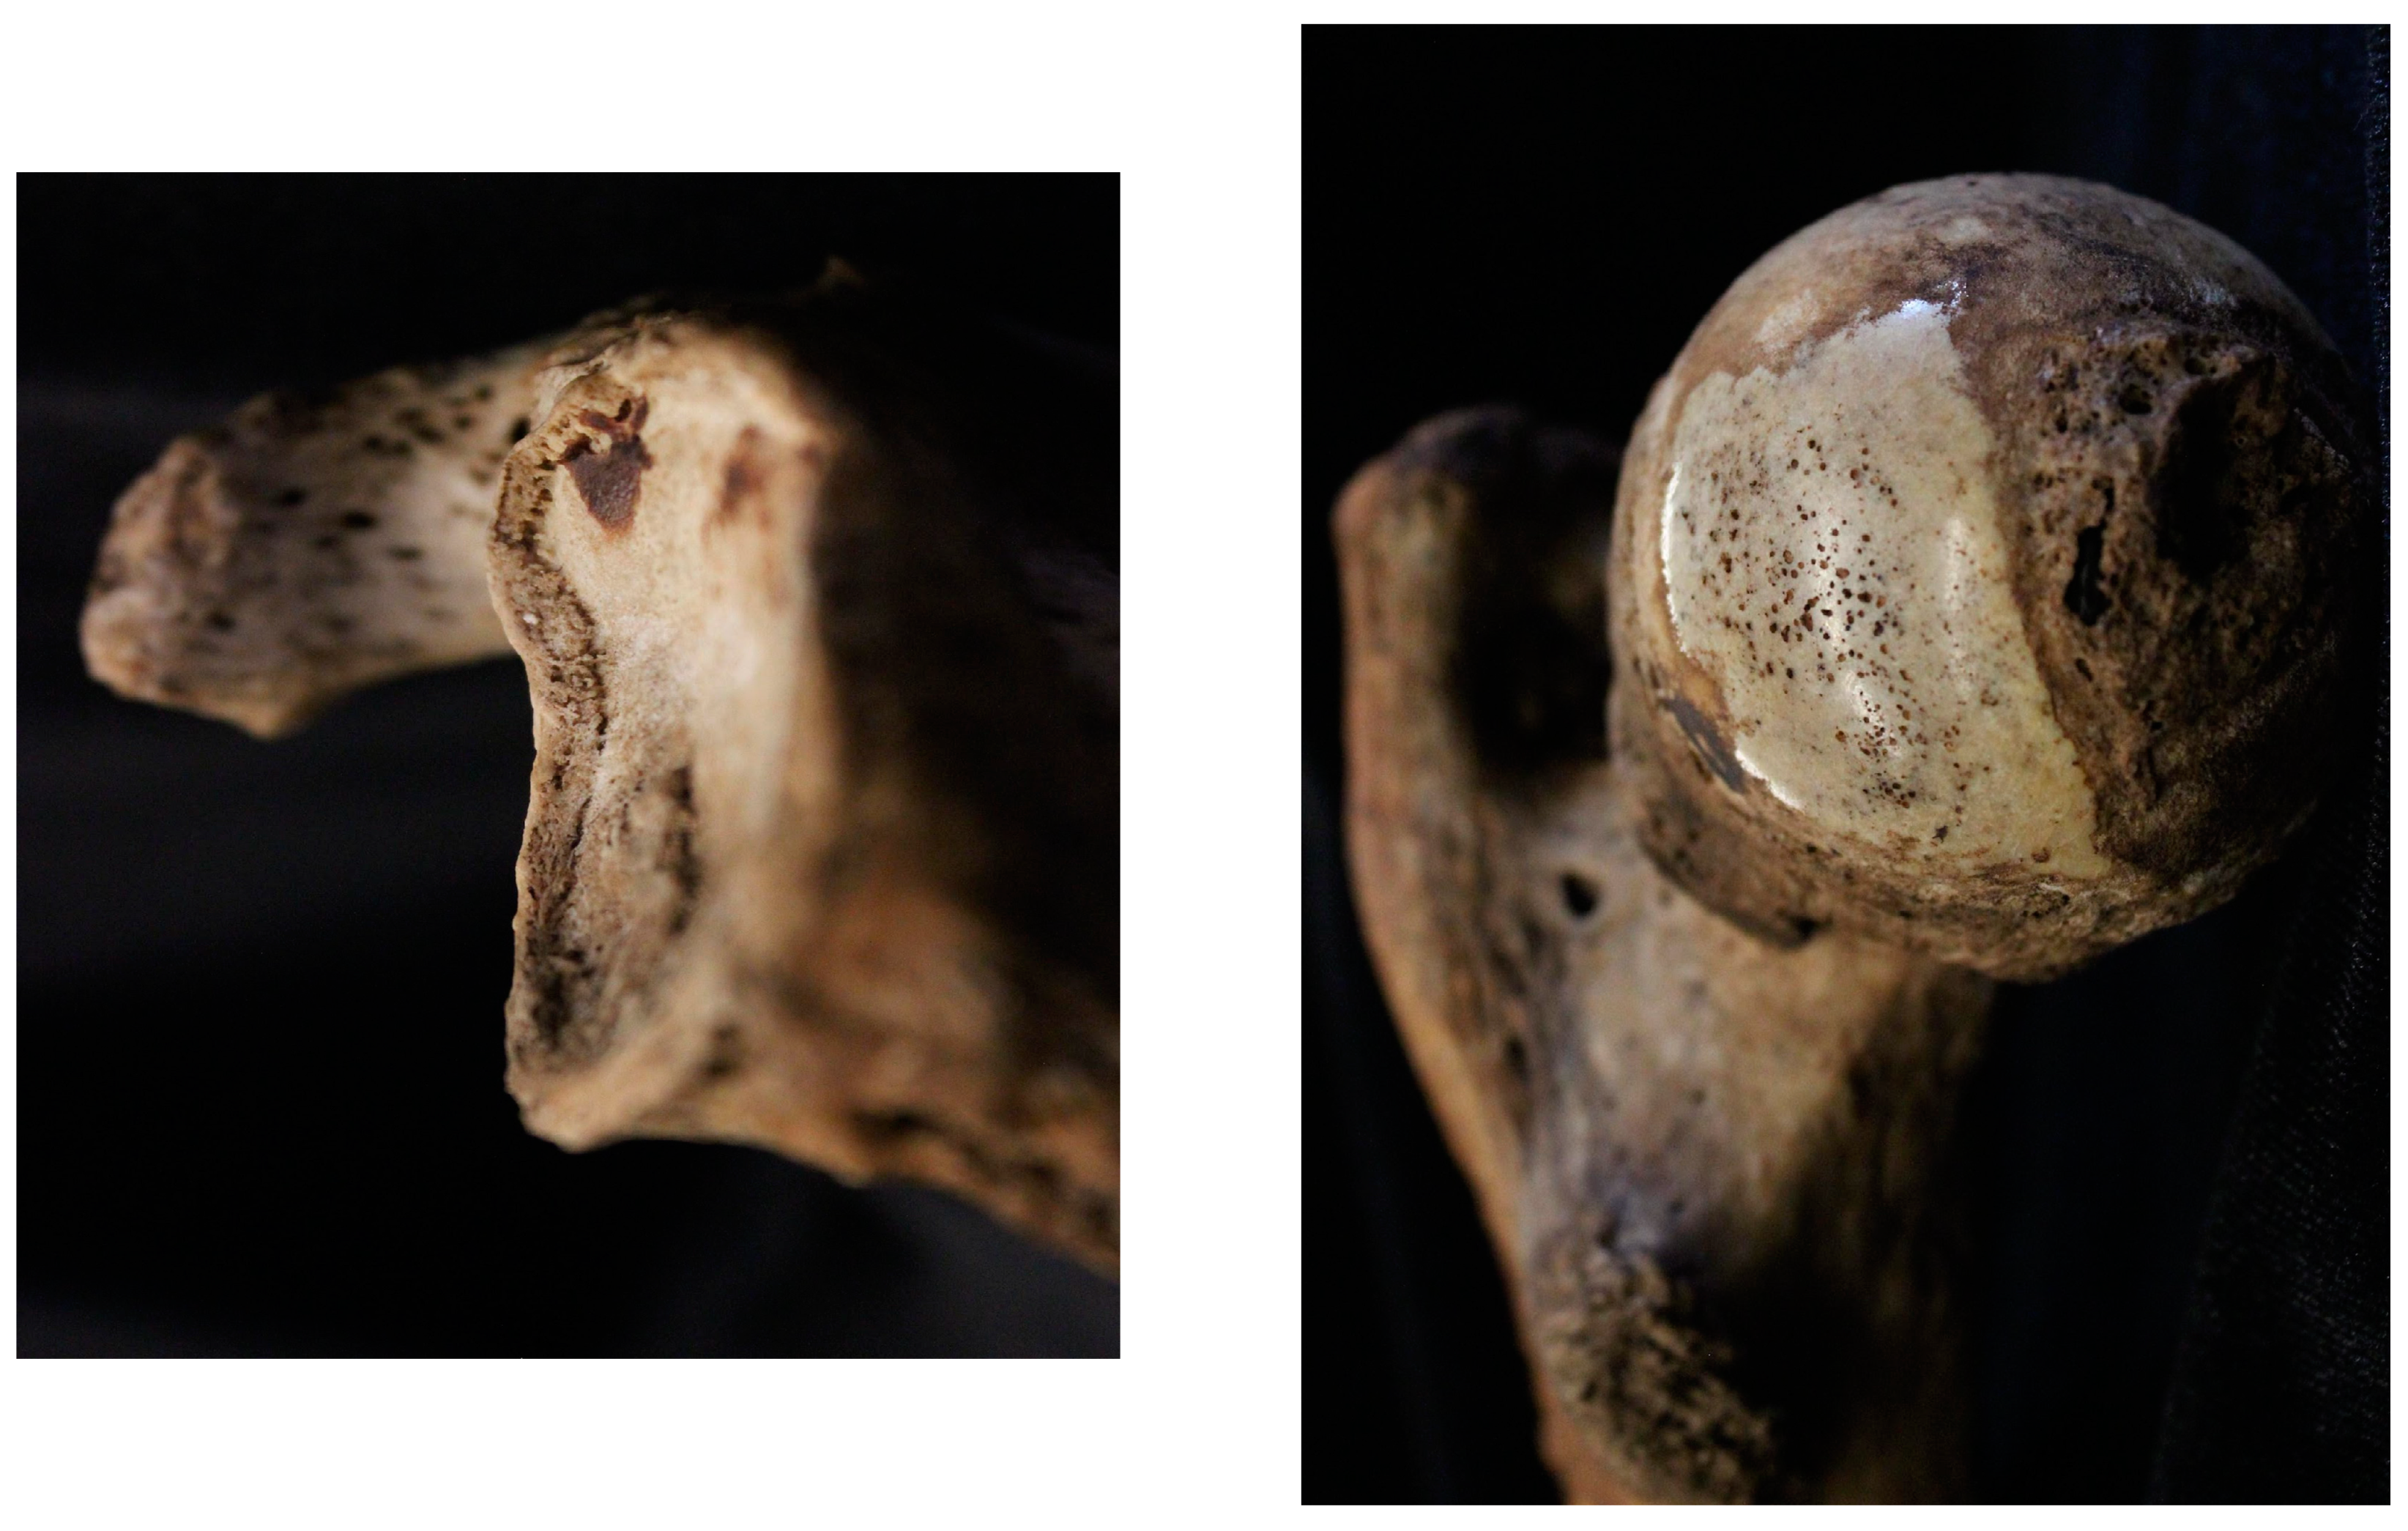
The earlier transition age of the elbow (significant in the BIPOC male and pooled-sex samples) and the later transition age of the wrist (significantly different in the BIPOC male sample) are noteworthy, however. There are several reasons why OA might be observed earlier in the elbow of BIPOC individuals. It is possible that the first author’s difficulty in recognizing OA in the elbow contributed to these differences. Yet, the elbow joint showed good agreement between the researchers in the interobserver error sample (see Table 10). An alternate explanation could be that the elbow experienced additional abnormal stressors from occupation-related movements. Since the UTK Donated Skeletal Collection asks donors about their profession as part of their demographic data, this information is often available. Indeed, many of the individuals in the BIPOC subsample for this study reported working as a “laborer”, and other individuals reported jobs such as “knife maker”, “textile worker”, “baker”, or “welder”. In each of these careers, it is possible that these individuals participated in activities causing them to experience repeated abnormal loading of the elbow joint during either flexion and extension and/or pronation and supination. Injurious physical labor could initiate the breakdown of homeostasis in the cartilage of the joint, thereby setting the stage for the osteoarthritic effects of aging. It is important to remember that age, though a primary risk factor for OA, is not the sole risk factor. Age fluidly interacts with lived experiences and genetic predispositions to create a unique combination of OA risk factors for any given individual, but these additional factors do not preclude the ability of age to predict OA development.
Furthermore, it must be noted that the white subsample also included numerous individuals with listed occupations of “welder” and “laborer” (alongside a variety of frequently listed occupations such as “electrician”, “homemaker”, and “disabled”). Additionally, several individuals in both subsamples reported either having no job or “white-collar” jobs without intense physical labor. Thus, it is not possible to rely on occupation as an explanation for the earlier development of OA in the elbow of BIPOC males and pooled-sex individuals—especially given the limitations of a 60-person subsample. Beyond simply looking at career, however, it is certainly possible that the embodiment of a diverse set of life experiences could be responsible for an earlier age at transition of the elbow if the elbow happens to be a joint surface that is more susceptible to the influence of lived experiences. Although it seems improbable that stress from living as BIPOC in a racialized society would manifest only in a single joint, it cannot be entirely ruled out without a deeper understanding of the way that stress interacts specifically with the elbow joint at a cellular level, for example. The internalization of external stressors can interact with epigenetics to produce different biological results in various individuals, so it would not be surprising if embodiment-related OA presented itself via different channels. Indeed, the activation of the hypothalamic-pituitary-adrenal (HPA) axis from acute or chronic stress can trigger biological disruptions from stress hormone release, which facilitate disease processes, but social stressors can also trigger changes in behavior that can have biological consequences (e.g., smoking, drinking, and exercise) [8]. On a cellular level, social adversity can contribute to changes in cell structure and sensitivity to stimuli [8], which larger-scale factors such as differential access to health care (and health insurance; [9]) can further exacerbate or mitigate. The biological pathways through which social stressors are linked to biological consequences are many, and future research is needed to investigate the specific relationship between OA (specifically in the elbow joint) and social adversity.
In contrast to the elbow, the wrist demonstrated an older age at transition in the BIPOC subsample than in Winburn and Stock [33] (see Table 7). A possible explanation as to why the wrist was delayed in transitioning from “OA absent” to “present” could be related to the earlier age at transition of the elbow. To elaborate, if more strain is diverted to the elbow joint rather than the wrist, then perhaps the wrist experienced more protection from injurious loading in these individuals. Alternatively, the wrist may naturally be more resistant to homeostatic disruption, which would explain why it is one of the later joints to transition to “OA present” in all three groups (this study’s BIPOC and white subsamples, as well as the original white American sample studied by Winburn and Stock).
In this study’s white subsample (see Table 3), the 90% ages of transition were younger than those reported in Winburn and Stock [33] for the female TMJ, female hand, and male ankle, and the ages at which 95% of the samples transitioned were younger for the female TMJ, female elbow, female knee, female foot, and male ankle. There were no significant differences in the pooled-sex category. Like the BIPOC subsample, it is possible that the injurious loading of these joints contributed to earlier OA development. A few of these significant differences can also potentially be explained by interobserver error discrepancies—particularly in the female hand. The hand showed one of the lowest interobserver agreement rates of all the joints, so if the two studies did not agree on when OA in the hand was present or absent, then this could explain the significantly different ages at transition. It is also noteworthy that for the white subsample (the only cohort as of yet investigated for interobserver error), in each of the joint surfaces that showed disagreement, a younger age at transition was generated in the current study than in the original. This indicates that in the current study, OA was marked more often as “present” in younger individuals in these joints, whereas it was marked as “absent” by Winburn and Stock [33]. Greater standardization, or stricter adherence to the descriptions of OA in the various joints provided in Winburn and Stock’s [33] and Table 3, may be necessary to ensure replicable results in future applications.
In addition to being compared with the ages at transition generated from the Winburn and Stock [33] data, the BIPOC and iteratively resampled white subsamples were also compared to each other (see Table 6). The only significant differences were in the ages at which 90% and 95% of BIPOC males transitioned to exhibiting wrist OA and the ages at which 95% of BIPOC males transitioned to exhibiting knee OA. In all three cases, the BIPOC males transitioned at a later age than the iteratively resampled white male subsample. These significant differences in the wrist and knee are notable. As in the above comparisons, the older age at transition of the wrist could indicate its resistance to homeostatic disruption. The knee is interesting, as it is most definitely not an area of the body prone to natural OA resistance. On the contrary, the knee is one of the joints in which OA is most common [59] and one that commonly undergoes total joint arthroplasty [60]. Yet, the age at transition is older in the knee of the BIPOC subsample. Since the knee is one of the weight-bearing joints, it is possible that obesity is a risk factor influencing the differing ages at transition, where excess weight is responsible for earlier OA development in the white subsample. Despite significant differences in the joints discussed, however, the BIPOC and white subsamples overall demonstrated clearly similar results. Particularly when the sexes were pooled, significant differences were rare between BIPOC and white individuals from the original study (see Table 7) and nonexistent between BIPOC and white individuals in the current sample (see Table 6).
While the TMJ and ankle were consistently poor indicators of age, the shoulder and the hip performed consistently well. In all the samples tested, there were no significant differences involving these two joints. One explanation for this pattern could be the fact that both the hip and the shoulder are ball-and-socket joints that are relatively well protected by soft tissue. This could mean that the presence of OA and, therefore, the ages at transition generated by these joints, result more directly from age-related homeostatic disruptions and are less influenced by outside factors than other joints. Not only are these strong indicators of age, but the hip also had particularly low rates of interobserver error and intraobserver error (between 0 and 5%; see Table 10), indicating that hip OA can be reliably assessed.
That the shoulder and the hip are well-protected, ball-and-socket joints and yet are some of the first to demonstrate OA is a seeming contradiction. If the well-developed joint capsules and surrounding musculature do provide a buffer to external, injurious forces, why would these joints then display OA at an earlier age compared to more distal ones? Perhaps the driving factor is not perturbation by confounding factors, nor an extreme amount of use, but rather the type of use at the joint. The shoulder and hip are capable of abduction and adduction, flexion and extension, or rotational movement [61]. The wide range of movement permitted at these joints may work in combination with the built-in protection of the muscle and ligaments encasing the joints to produce an age at transition that is truly reflective of age at death.

4.1. Validating Winburn and Stock [33]

In addition to confirming several patterns outlined in Winburn and Stock [33], this study also validated its application to BIPOC. For both the white and the BIPOC subsamples, the method was able to successfully predict the age at death of a large proportion of all subsamples using both 90% and 95% ages of transition (>88%). Furthermore, accuracies were comparable between the BIPOC and white individuals—ranging from 88 to 92% and 88 to 93%, respectively. These numbers indicate that there are no discrepancies in OA development by social race that would preclude the use of estimating age at death with appendicular OA presence or absence.
It was predicted that the lived experiences and historic inequities faced by BIPOC, which have been demonstrated to accelerate aging and cause other health disparities among the living, would impact the ability of OA to correctly predict age in these individuals or to necessitate a population-specific set of standards for using OA for age estimation. This does not seem to be the case in the current sample. Not only were ages estimated with equivalent accuracy in BIPOC and white individuals, but also there were few significant differences between the BIPOC and iteratively resampled white subsamples, with younger ages at transition for BIPOC only observed in one joint. Interestingly, of the three samples compared—the BIPOC subsample, white subsample, and Winburn and Stock’s [33] white sample—it was the two white subsamples that showed the most significant differences. The idea that embodied experiences of social inequity are driving the slight differences noted in the BIPOC subsample is inconsistent with the observed pattern, in which the elbow is the only area in the body where advanced aging is observed, and only when the BIPOC subsample is compared with the original Winburn and Stock sample (not when this study’s subsamples are compared with each other). Rather, if embodied inequity were the driving factor, many—or all—of the joints would be expected to produce lower ages at transition in more of a systemic pattern, consistently throughout the body. Instead, the results of this study indicate that the ability of OA to predict age at death among U.S. residents of eastern Tennessee is not significantly impacted by differing lived experiences in individuals of differing self-reported social races. This is not to say that OA development is not affected by experiences of living as BIPOC in a racialized society, but rather that the variations that do occur are localized rather than systemic and, therefore, do not prevent OA from accurately assessing age at death. Additionally, the average age at death is an important factor to consider when comparing multiple populations. The mortality curve (age distribution) of BIPOC males was the only group that indicated a lower average age at death in this subsample than the white subsample, and this younger age at death has the potential to artificially drive the ages at transition down. Even if the mortality curve did drive the ages at transition down to an earlier age, they were still not systematically younger, which further reinforces the conclusion that lived experiences of social race did not impact OA development in this sample, or suggests that any existing experiences of inequity were tempered by resilience [
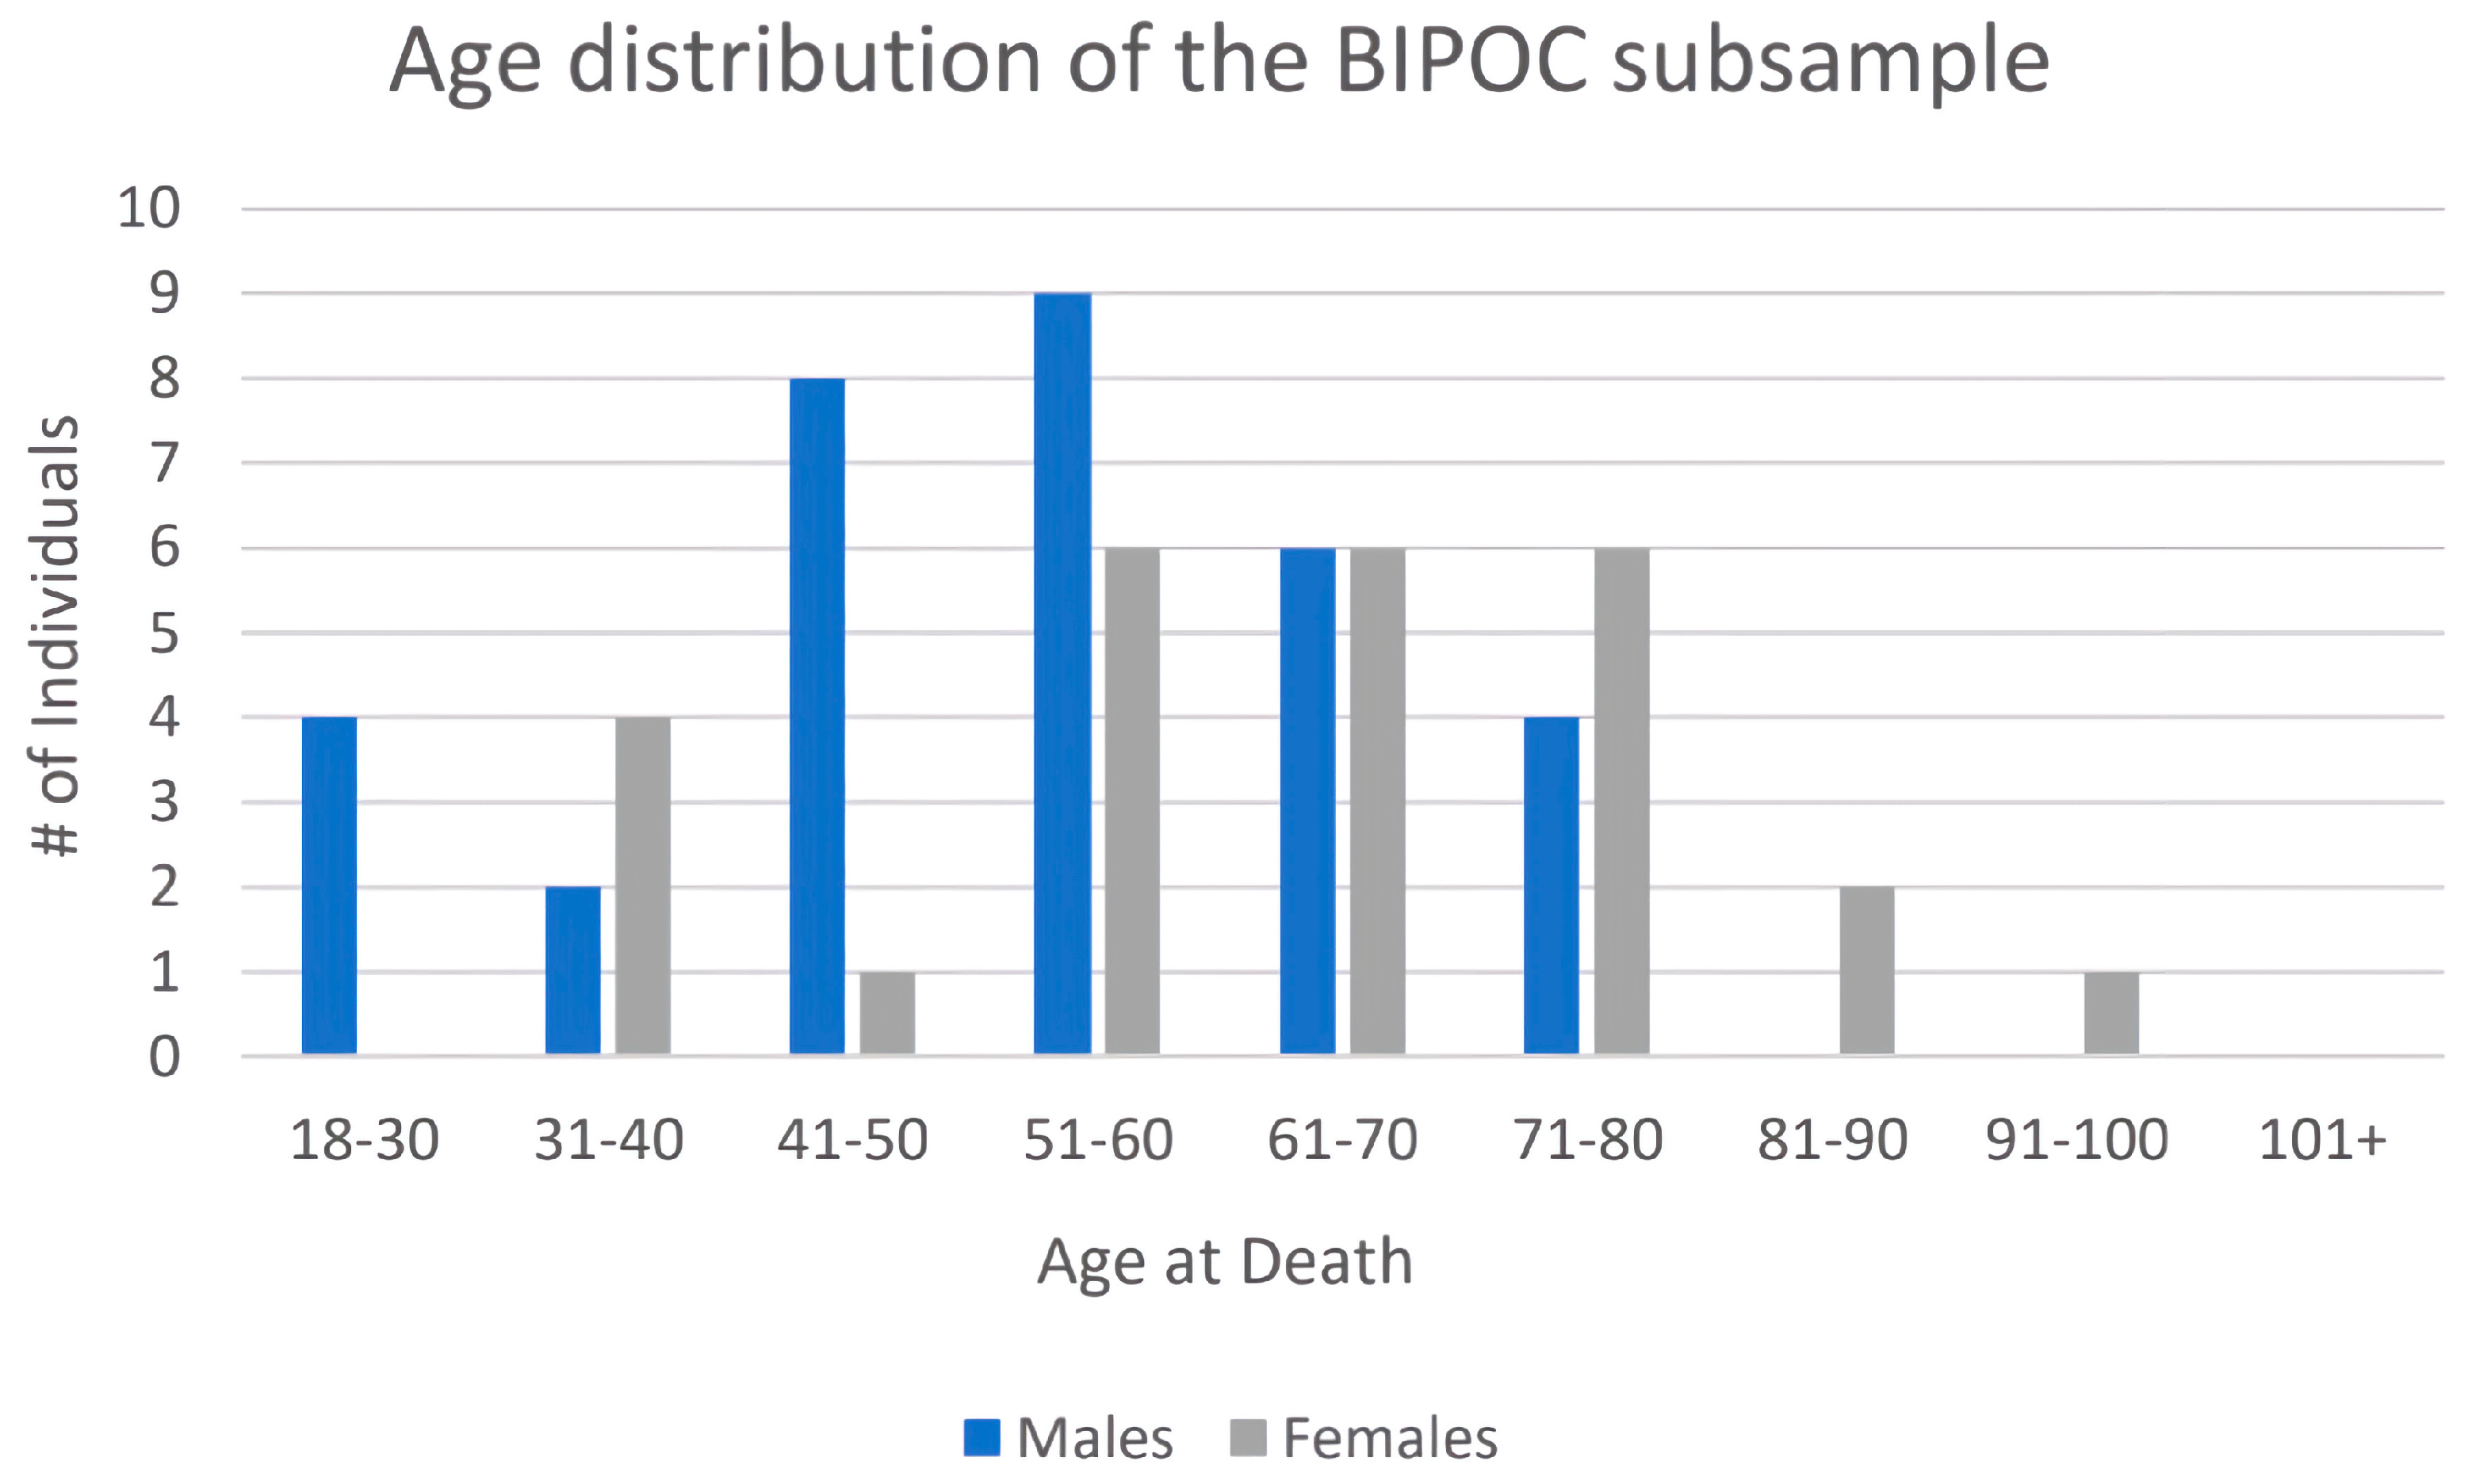
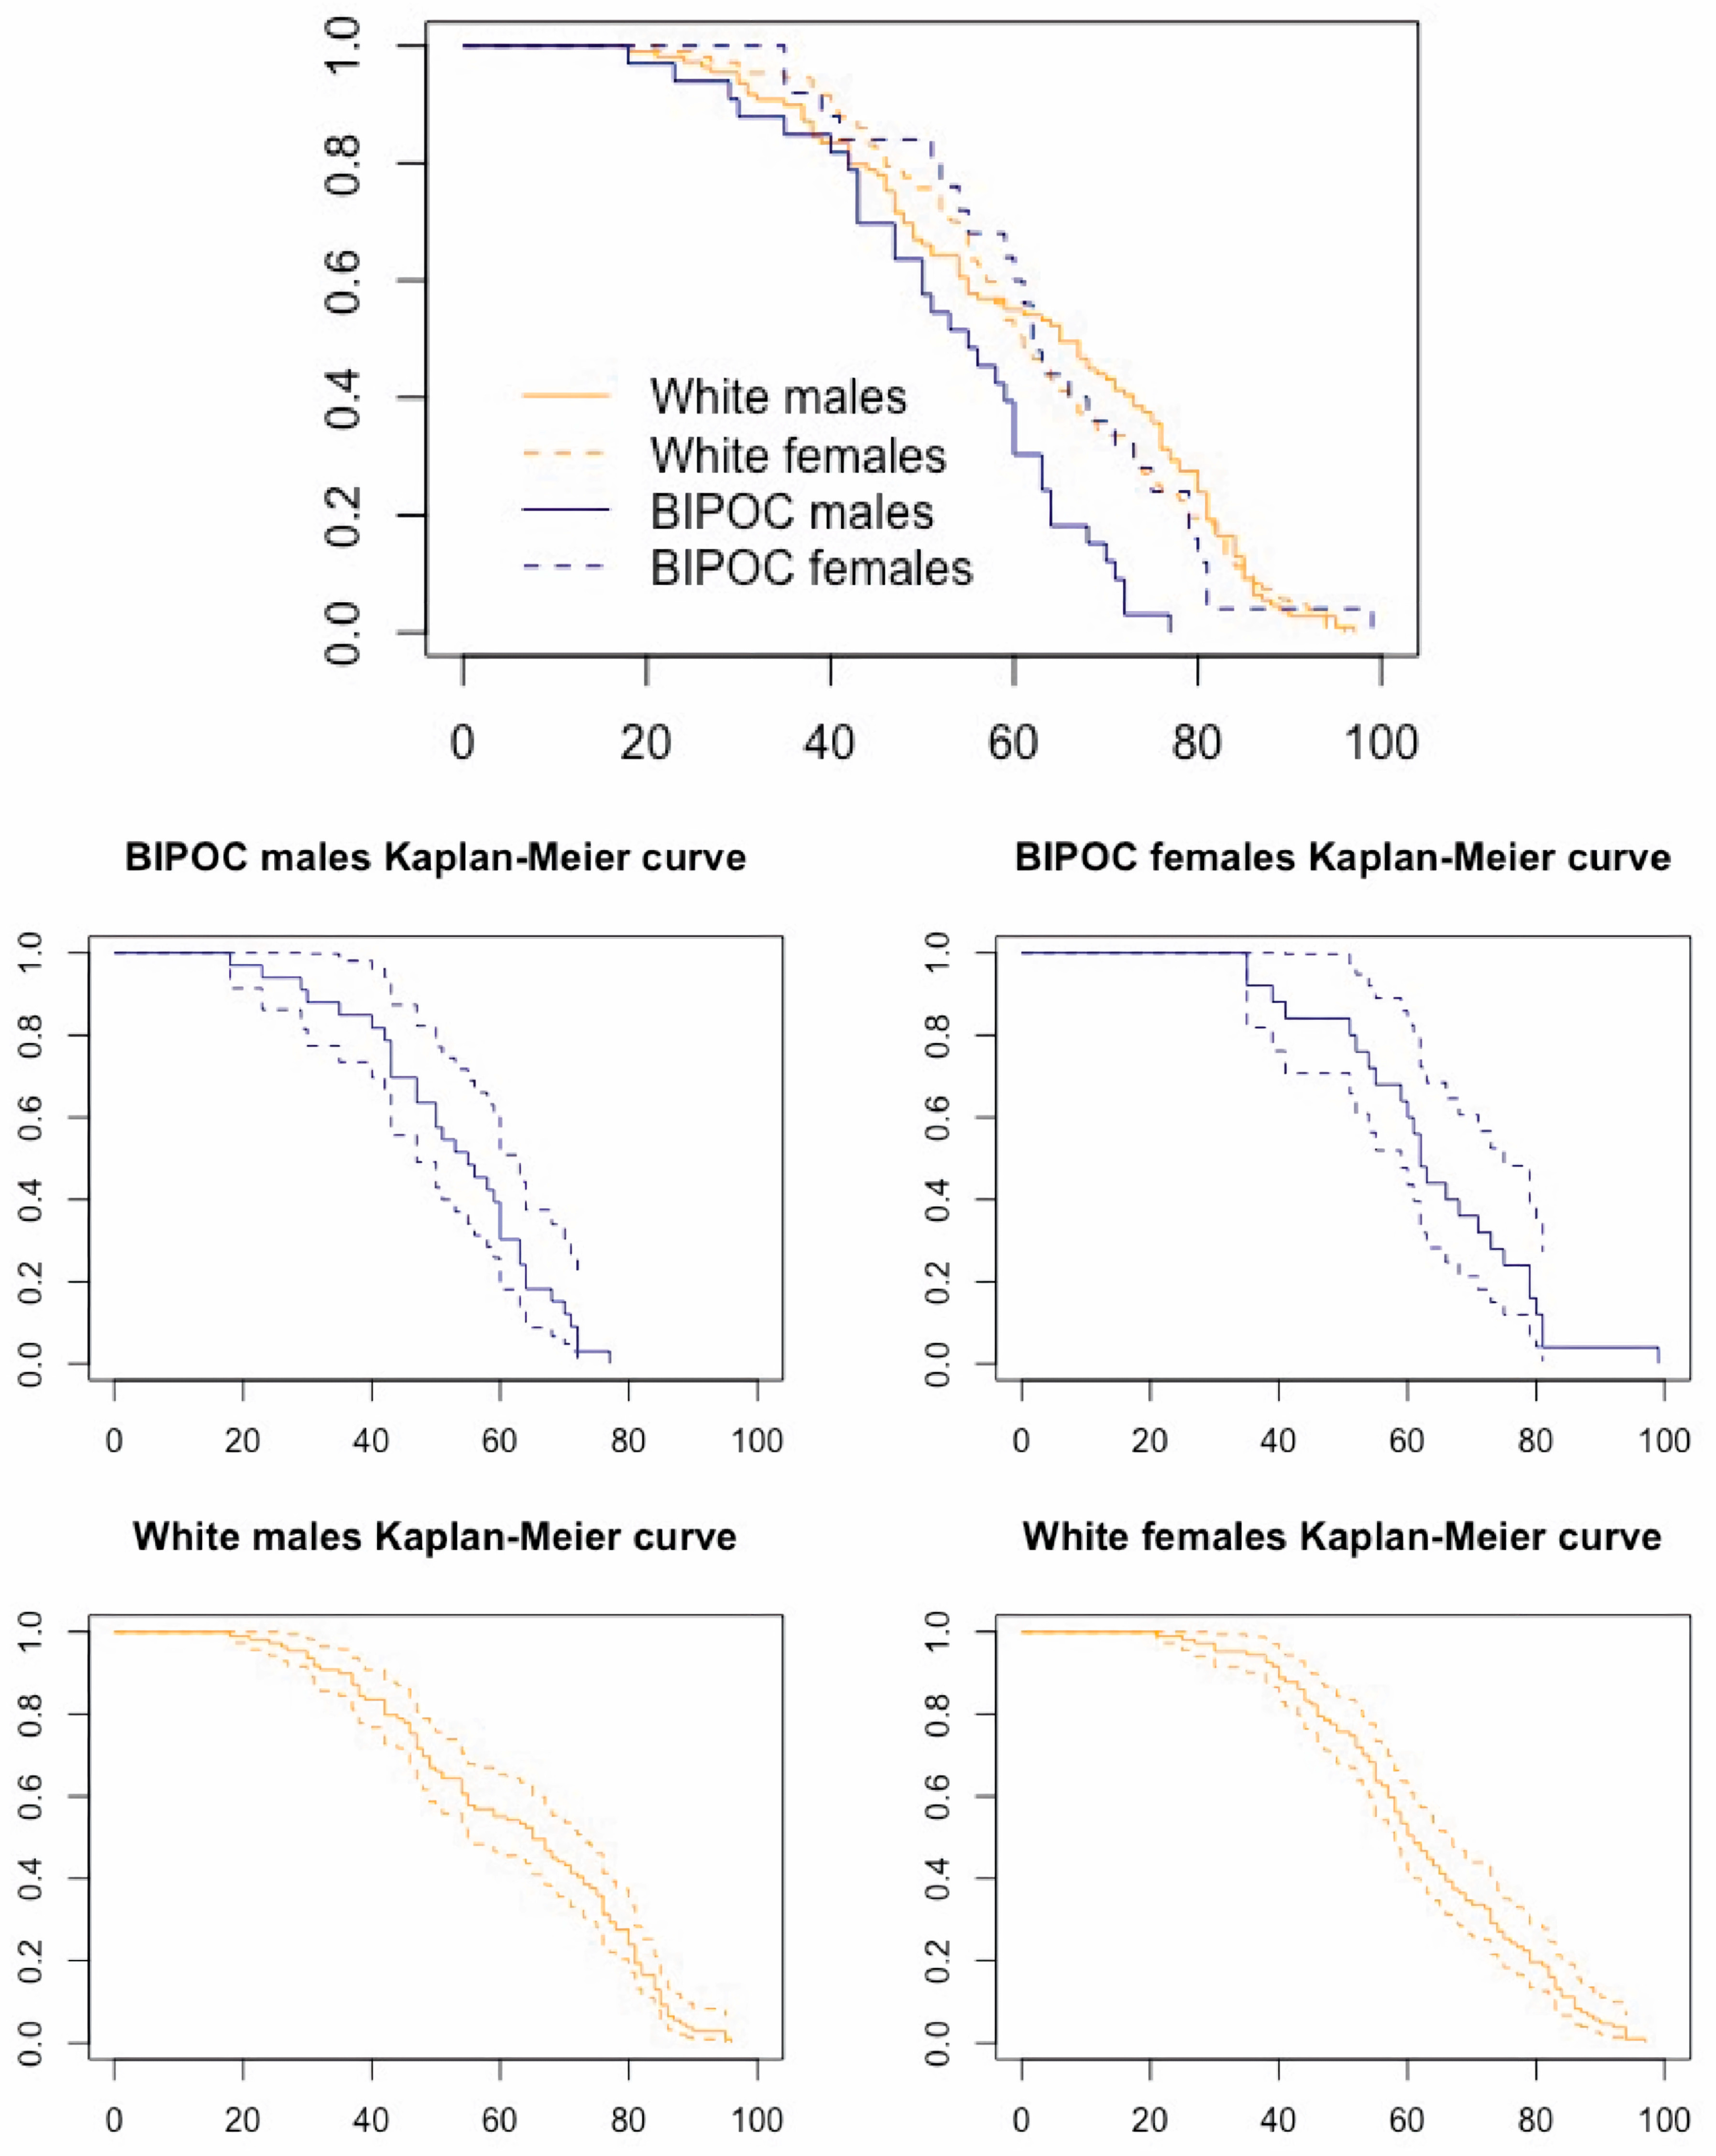
62].
An alternate explanation of the unexpectedly similar results between the BIPOC and white subsamples explored the topic of a shared sociocultural environment. In the Southern/Central U.S., communities of color and white populations alike are exposed to a combination of stressors, including infection (e.g., whipworm), environmental toxins, and the effects of extreme poverty, with a resulting higher mortality rate than the rest of the nation [63]. One of the assumptions in this study was that the white subsample would be afforded a degree of biological buffering from living in a racialized society where “whiteness” is privileged. If this was not the case for this study’s white subsample because the donors were from the Southern/Central U.S., it stands to reason that similar exposure to inequities by both the white and BIPOC subsamples may provide an explanation for the similar age-at-transition results. However, although the white subsample in this study may very well have experienced atypical levels of hardship, the concept of intersectionality [64] argues that the BIPOC subsample would face the same universal stressors from the shared environment in addition to the potential strain associated with structural violence and systemic racism [65,66]. Thus, similar experiences of inequity, such as poverty, are not a satisfactory explanation for similarities in the age-at-transition between BIPOC and white subsamples, unless differing mechanisms that are protective of joint health were at work during the lives of the BIPOC subsample (e.g., greater resilience [67] or more non-injurious physical activity). Otherwise, it seems that any intersectional inequity experienced by this sample’s BIPOC donors did not translate to earlier or more advanced joint aging in the form of OA.

4.2. Inter- and Intraobserver Error

Though the overall rates of inter- and intraobserver agreement range from good (11–20% error) to excellent (0–10% error), for certain joints and individuals, they were poor (21%+). This can be attributed to several different factors. For the intraobserver error, changes in opinion from the beginning to the end of the data collection can be attributed to increasing familiarity with the method. As time goes on and a researcher sees more variation, it would make sense that their comfort with classifying OA into one category or the other would increase over time. This is likely what happened with the shoulder joint. The left shoulder had an error rate of 15%, while the right had a rate of 25%. An initial difficulty in recognizing shoulder OA, which was later clarified as more variation was observed, is definitely possible.
Aside from the right shoulder, the right wrist demonstrated the highest rate of intraobserver error, at 21.05% (see Table 10). This value is difficult to explain, as the left wrist has a much lower error rate, at 10.53% (see Table 10). Values that were initially marked as absent were more often marked as present during the second round of observations, which could reflect a greater familiarity with identifying true OA absence toward the end of the study. The high intraobserver error rate of the right wrist stands as a cautionary tale, which reminds practitioners that OA can present differently on various joint surfaces. Familiarity with the detailed descriptions of OA in each joint surface presented in Winburn and Stock (Table 3 of [33]) is essential but, in terms of application, there still appear to be certain joint surfaces (such as the wrist) that researchers become more familiar with over time. The range of variation observed throughout the entire sample helped to solidify examples of true OA absence, which is likely why the values were different at the beginning and the end of the study.
The individuals who had the highest overall percentage of interobserver agreement were older individuals, whereas the individual with the lowest interobserver error score (35.48%; see Table 11) was a younger individual. This could indicate high interobserver agreement about OA when present, but more difficulty identifying and agreeing on instances where it is entirely absent. The shoulder could be one of these cases, as the interobserver error was fairly high for this joint surface—10.87% for the left and 13.04% for the right (see Table 10). This is also consistent with the age-at-transition findings for this study, as OA was marked more often as “present” in younger individuals in a number of joints, whereas it was marked as “absent” by Winburn and Stock [33], creating younger ages-at-transition overall. A final line of evidence supporting this finding is when the OA-aging method was applied to the current sample to estimate age at death, roughly 75% of the individuals that were incorrectly aged were “young” individuals (under 40 years old). Therefore, it is likely that deciding on the “absence” of OA is an aspect of this methodology with considerable interobserver disagreement. For OA to be marked “OA absent”, every single surface of bone had to be present and intact enough for observation; otherwise, it would be marked as “NA”. If two researchers had differing opinions on when bone was too fragmentary, eroded, or otherwise damaged to evaluate it for OA, then this could also explain some discrepancies. Finally, the level of osteological experience could also have played a role in the discrepancies.
In addition to being poor indicators of age, the ankle and the TMJ both demonstrated poor interobserver agreement. The left and right TMJ had the highest interobserver error rate of any joint surface, at 19.57% (see Table 10). The ankle was close behind, at 18.60% error for the left and 15.38% for the right (see Table 10). Beyond the fact that these joints provide poor age estimates, their high error values reinforce that the ankle and TMJ are problematic joints for this method, further supporting recommendations for their use only as a last resort.

4.3. Methodological Recommendations

This study confirmed that OA is effective in estimating age of BIPOC and white individuals from eastern Tennessee and that the Winburn and Stock [33] OA-aging method can essentially be applied without modification. However, one issue identified by the current study was the difficulty in applying the method to individuals with patterns of OA development that did not fit the ages at transition reported by Winburn and Stock (Table 9 of [33]). To elaborate, the appendicular joints and the TMJ transition from “no OA” to “OA present” in a somewhat regular pattern. The hip should transition before the hand, according to this pattern—a finding first reported by Winburn and Stock [33] and confirmed in the current study. Yet, when trying to predict age at death based on the OA of the individuals in the current study, some individuals showed a contradictory patterning of OA. For example, some individuals were coded “OA present” in the hand (a region typically slow to develop OA), but “OA absent” in the hip (a region where OA typically develops early). In these instances, the joints provide conflicting age estimates, with one providing a relatively young maximum age and the other providing a much older minimum age. Obviously, both cannot be correct, but it is the recommendation of the current study—following the approach of Winburn and Stock [33]—that the absence of OA should be preferenced. Emphasizing absence over presence is a more conservative methodology because, while it is possible (due to occupational injury, for example) for a joint to develop OA prior to the age at which 90% of the population has transitioned, it is less likely that OA will be absent after that age. In other words, it is possible that a 26-year-old has slight OA developing in their hands while still having no OA in the hip. Therefore, in instances where OA development does not follow the generalized pattern of development presented in Winburn and Stock (Table 9 of [33]), the best practice is to rely on the absence of OA rather than the presence as the indicator of age.
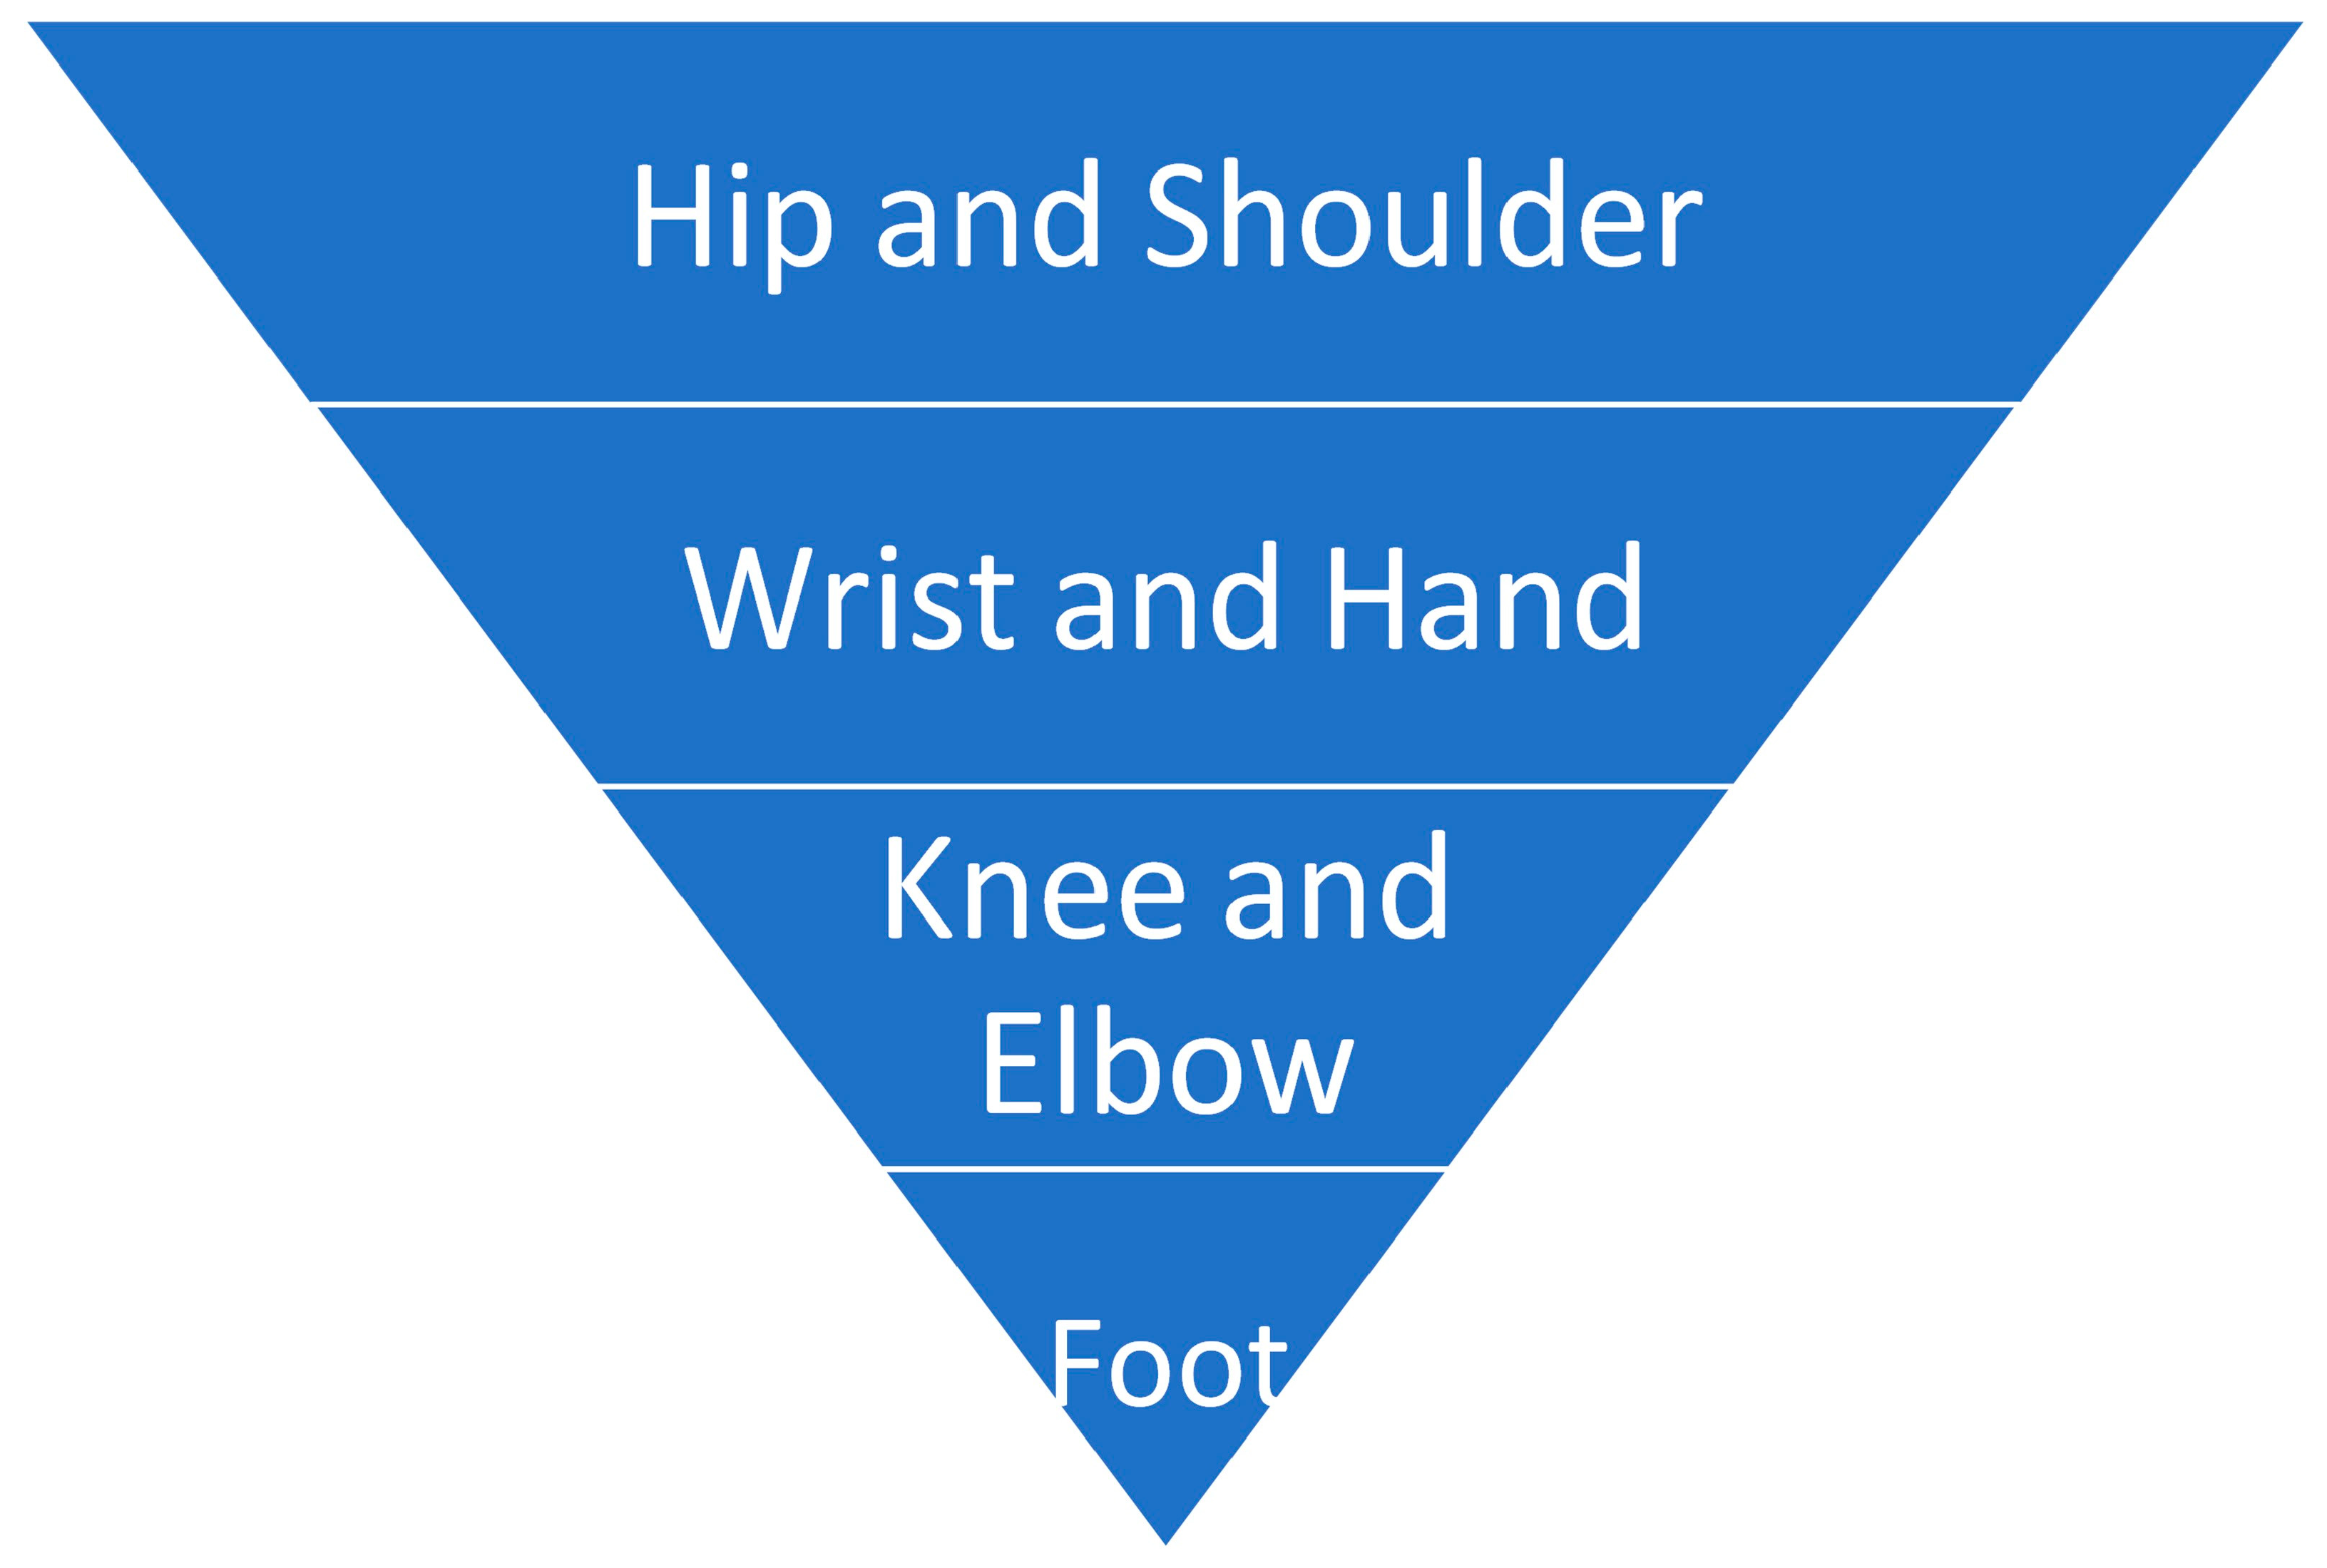
This study’s findings indicate a hierarchy of joints in terms of their age-estimation utility and the reliability of their assessment (Figure 6). The TMJ and the ankle should not be used for age estimation. In contrast, the hip and the shoulder are strong age indicators that, if present in a case, should be given preference over the other joints in a case where OA patterning is unexpected. Methodologically, this is significant, as if even a single, complete femoral head is present in a case assemblage, this can refine an age estimate generated from other indicators (e.g., pubic symphysis) in a meaningful way. It is recommended that if all the joint surfaces in a skeleton are present, they are used to estimate age in the order in which they are presented in Figure 6.
Furthermore, users of this method must thoroughly understand the traits indicative of OA in the various joints, as its appearance is not uniform. In the original paper, Winburn and Stock (Table 3 of [33]) provide extensive descriptions detailing the appearance and characteristics of OA in the various joints. Familiarity with the contents of this table is essential to the effective application of this method. Along those lines, future research might standardize the percentage of the joint which needs to be present for the evaluation to proceed. If 80% of the joint is present and exhibits no OA but 20% of the margins are eroded, is it safe to say that the joint is free of OA, or does the entire joint surface need to be present? Is perfect preservation a realistic expectation, given the often fragmentary and damaged nature of bone in forensic cases? Each of these questions were outside the scope of the current study, but they deserve attention in future research.
Finally, while the method was accurate, this does not mean that it was precise. Rather, the estimates provided were always broad, often consisting merely of a lower or upper age terminus. For the individuals who have OA in every joint, for example, age estimates based on ages-at-transition for 90% of the original sample are 29.7+ years for males and 37.2+ years for females. While this is somewhat informative, other aging methods should be preferenced, or used in combination with OA, in a casework scenario where a decedent exhibits extensive OA. If a full skeleton is present, then this aging method alone is unlikely to produce a precise age interval. As the original authors noted, the method is most powerful in cases of few or fragmentary remains, where the application of traditional age-estimation methods is not possible.

4.4. Study Limitations

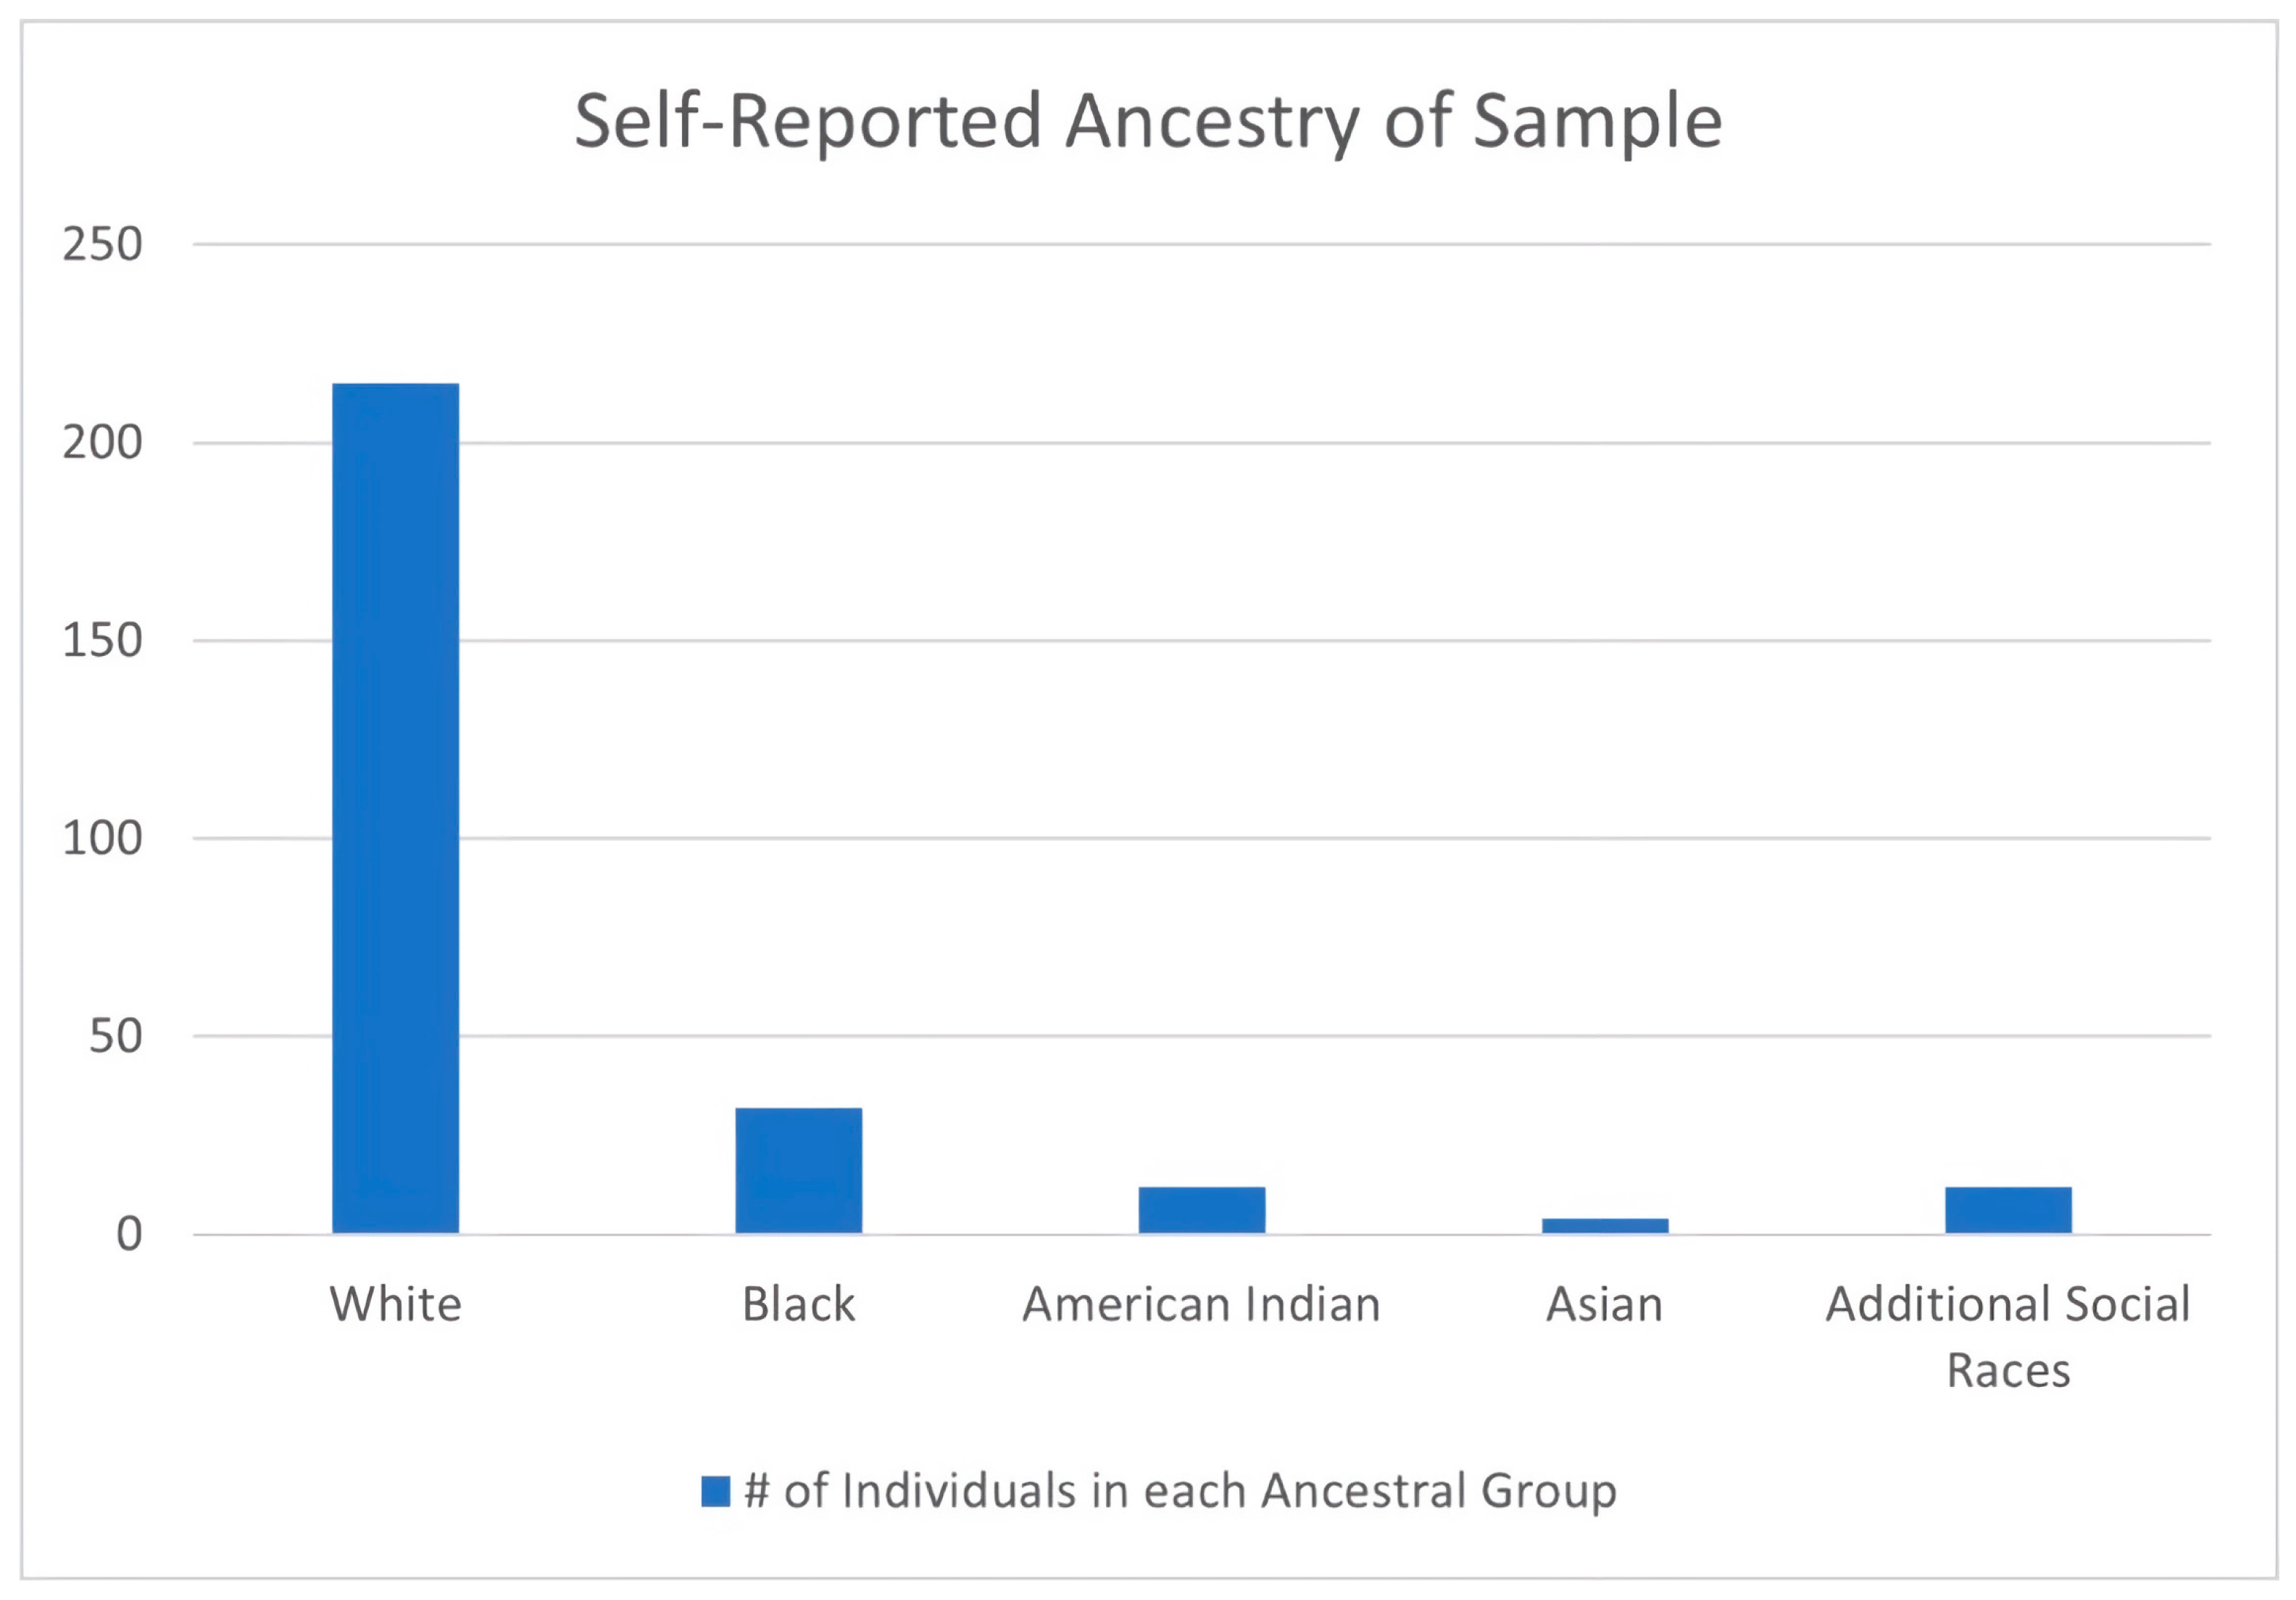
Although this study was the first to apply the OA aging method to donors of color, the small size of the BIPOC subsample (n = 60) was a limitation. Despite the ability of repeated iterative sampling (bootstrapping) to enable direct comparisons with this subsample, a larger sample size with greater variation would have been desirable and should be pursued in future research. Furthermore, in order to combat small sample sizes and to enable a statistical comparison, this study’s BIPOC subsample had to be treated as a singular category, despite being composed of individuals from numerous social races. It is unrealistic to assume that all social races have universal experiences with inequity or marginalization, and treating all communities of color as a single homogenous entity should be avoided. This small sample of BIPOC donors cannot be interpreted as representative of the diverse demographic makeup of the U.S., nor can it be assumed that their lived experiences were shared by other Americans of color. As such, it may be dangerous to extrapolate from this data and apply the OA-aging method to communities of color more broadly.
On the other hand, testing the method on large and diverse samples is currently precluded by the documented racial disparities in the demographics of modern U.S. donated skeletal collections [3]. In the UTK Donated Collection, for example, over 90% of curated donors identified as white [3,40]. The underrepresentation of people of color in donated skeletal collections may reflect cultural preferences (e.g., a desire for intact interment as a means of final disposition) or a lack of familiarity with body donation processes [68]. Reluctance on the part of potential donors of color may also be influenced by the long history of their non-consensual anatomization sensu [69] into the anatomical collections of the past [70]. Combined with other abuses enacted by the U.S. biomedical and scientific communities (e.g., The U.S. Public Health Service Syphilis Study at Tuskegee), these collection practices established a longstanding relationship of distrust between scientists/medical providers and, in particular, black Americans [71]. A combination of disinterest, lack of information, and distrust may thus interact with family wishes, religious ideals, and accessibility to result in the problematic dearth of donors of color in donated skeletal collections. Until these myriad issues begin to be addressed, the use of self-consented CT data from living individuals, or kin-consented imagery from deceased individuals e.g., [72], may represent avenues for future testing of the Winburn and Stock [33] aging method to large and diverse samples of individuals of color.
Regardless, the fact that the OA-based age estimation was confirmed to be effective in this small sample of BIPOC individuals is an improvement over the original method, which was only tested on a white sample—both limiting the method’s applicability and implicitly upholding the dangerous idea that there are inherent and meaningful differences between U.S. social races.

5. Conclusions

This study validated the OA-based age-estimation method of Winburn and Stock [33] and showed that it predicts age with equivalent accuracy in both BIPOC and white individuals from eastern Tennessee. These findings reject the hypothesis that the experience of living in a racialized society would lead to skeletally discernible differences in rates of osteoarthritis-based aging between the study’s two subsamples while acknowledging high poverty and mortality rates potentially contributed to the particular experience of social race in this region [11,63]. As such, this method can be used as published on the general U.S. population—although with caution, until supported by multiple additional regional studies.
The generalized progression of proximal-to-distal OA development reported in Winburn and Stock [33] was largely confirmed, with the elbow as an exception. The ages at transition for 90% and 95% of the population to convert from “OA absent” to “OA present” were also reproduced in the current study, despite certain joints that did demonstrate significant differences between the original and the current studies. The two problematic joints in the original OA study—the TMJ and the ankle—were similarly problematic in the current study, reinforcing the conclusion that they should not be used for age estimation.
There were also points of variation between the two studies. Where ages at transition generated by this study’s white and BIPOC subsamples were statistically different from those generated by Winburn and Stock [33], they were generally younger in the current study. Along with other lines of evidence, such as the poor intraobserver agreement for younger individuals, this led to the conclusion that OA absence is less likely to be agreed upon than OA presence. This has significant implications for the application of the OA-aging method, as it is essential that researchers agree on what constitutes the absence, not just the presence, of OA.
In cases of fragmentary or incomplete forensic remains, Winburn and Stock [33] is an age-estimation technique that can provide an accurate—albeit broad—age range if any appendicular joint is present. The method is easy to apply, requires no technology, equipment, or calculations, and does not require a population-specific approach. It can also be used in conjunction with other age-estimation methods to provide a minimum or maximum age to help narrow the overall range for an unknown decedent. If multiple joints are present, then they should be interpreted in tandem with one another but, in cases of conflicting conclusions, the hip and shoulder should be emphasized, and OA absence should be preferenced over OA presence.
Overall, this study confirmed that while OA is multifactorial, its strong age correlation renders it a suitable age indicator. It is hoped that future research will continue to illuminate the many ways in which OA can contribute to the estimation of age in skeletal individuals.

Author Contributions

Conceptualization, A.P.W., M.K.S. and A.N.S.; methodology, A.P.W.; software, M.K.S.; validation, M.K.S.; formal analysis, A.P.W., M.K.S. and A.N.S.; investigation, A.N.S.; writing—original draft preparation, A.N.S.; writing—review and editing, A.P.W. and M.K.S.; supervision, A.P.W. All authors have read and agreed to the published version of the manuscript.

Funding

This research received no external funding.

Institutional Review Board Statement

Not applicable.

Informed Consent Statement

Not applicable.

Data Availability Statement

The data presented in this study are available on request from the corresponding author. The data are not publicly available due to the confidentiality of donor information.

Acknowledgments

We thank the UTK Donated Skeletal Collection faculty and staff for their facilitation of this study, and we extend our deepest gratitude to the donors and their families for their enormous contribution. We also extend our appreciation to Katherine A. Miller Wolf for pointing us toward ecological interobserver error equations for our dataset, and to Benjamin R. Burgen for his insight on the early drafts of this paper.

Conflicts of Interest

The authors declare no conflict of interest.

References

  1. Goad, G. Expanding humanitarian forensic action: An approach to US cold cases. Forensic Anthropol. 2020, 3, 50. [Google Scholar] [CrossRef]
  2. Kimmerle, E.H.; Falsetti, A.; Ross, A.H. Immigrants, undocumented workers, runaways, transients and the homeless: Towards contextual identification among unidentified decedents. Forensic Sci. Policy Manag. 2010, 1, 178–186. [Google Scholar] [CrossRef]
  3. Winburn, A.; Jennings, A.; Steadman, D.; DiGangi, E. Ancestral diversity in skeletal collections: Perspectives on African American body donation. Forensic Anthropol. 2022, 5, 141–152. [Google Scholar] [CrossRef]
  4. Geronimus, A.T. The weathering hypothesis and the health of African-American women and infants: Evidence and speculations. Ethn. Dis. 1992, 2, 207–221. [Google Scholar]
  5. Simons, R.L.; Lei, M.K.; Klopack, E.; Beach, S.R.; Gibbons, F.X.; Philibert, R.A. The effects of social adversity, discrimination, and health risk behaviors on the accelerated aging of African Americans: Further support for the weathering hypothesis. Soc. Sci. Med. 2021, 282, 113169. [Google Scholar] [CrossRef]
  6. Gravlee, C.C. How race becomes biology: Embodiment of social inequality. Am. J. Phys. Anthropol. 2009, 139, 47–57. [Google Scholar] [CrossRef]
  7. Krieger, N. Embodiment: A conceptual glossary for epidemiology. J. Epidemiol. Community Health 2005, 59, 350–355. [Google Scholar] [CrossRef] [PubMed]
  8. Kubzansky, L.D.; Seeman, T.E.; Glymour, M.M. Biological pathways linking social conditions and health. Soc. Epidemiol. 2014, 14, 512–561. [Google Scholar]
  9. Godde, K.; Gough Courtney, M.; Roberts, J. Health Insurance Coverage as a Social Determinant of Osteoporosis Diagnosis in a Population-Based Cohort Study of Older American Adults. J. Appl. Gerontol. 2023, 42, 302–312. [Google Scholar] [CrossRef]
  10. Gough Courtney, M.; Quintero, Y.; Godde, K. Assessing the roles of demographic, social, economic, environmental, health-related, and political factors on risk of osteoporosis diagnosis among older adults. Arch. Osteoporos. 2021, 16, 177. [Google Scholar] [CrossRef]
  11. Walkup, T.N.; Winburn, A.P. Does structural violence impact forensic anthropological age estimation? Investigating Skeletal Indicators of Biological “Weathering” in Modern U.S. Individuals. In Proceedings of the American Academy of Forensic Sciences 74th Annual Scientific Conference, Seattle, WA, USA, 25 February 2022. [Google Scholar]
  12. Burt, N.M. Identification and Interpretation of Joint Disease in Paleopathology and Forensic Anthropology; Charles C Thomas: Springfield, IL, USA, 2013. [Google Scholar]
  13. Reynard, L.N.; Loughlin, J. Genetics and epigenetics of osteoarthritis. Maturitas 2012, 71, 200–204. [Google Scholar] [CrossRef]
  14. Winburn, A.P. Validation of the acetabulum as a skeletal indicator of age at death in modern European-Americans. J. Forensic Sci. 2019, 64, 989–1003. [Google Scholar] [CrossRef]
  15. Felson, D.T. An update on the pathogenesis and epidemiology of osteoarthritis. Radiol. Clin. North Am. 2004, 42, 1–9. [Google Scholar] [CrossRef]
  16. Hashimoto, M.; Nakasa, T.; Hikata, T.; Asahara, H. Molecular network of cartilage homeostasis and osteoarthritis. Med. Res. Rev. 2008, 28, 464–481. [Google Scholar] [CrossRef] [PubMed]
  17. Hunter, D.J.; Eckstein, F. Exercise and osteoarthritis. J. Anat. 2009, 214, 197–207. [Google Scholar] [CrossRef] [PubMed]
  18. Martel-Pelletier, J.; Lajeunesse, D.; Reboul, P.; Pelletier, J.P. The role of subchondral bone in osteoarthritis. In Osteoarthritis: A Companion to Rheumatology; Sharma, L., Berenbaum, F., Eds.; Mosby, Inc. Elsevier: Amsterdam, The Netherlands, 2007; pp. 15–32. [Google Scholar]
  19. Camarero-Espinosa, S.; Rothen-Rutishauser, B.; Foster, E.J.; Weder, C. Articular cartilage: From formation to tissue engineering. Biomater. Sci. 2016, 4, 734–767. [Google Scholar] [CrossRef] [PubMed]
  20. Aigner, T.; Soeder, S.; Haag, J. IL-1ß and BMPs-Interactive players of cartilage matrix degradation and regeneration. Eur. Cell. Mater. 2006, 12, 49–56. [Google Scholar] [CrossRef] [PubMed]
  21. Arden, N.; Nevitt, M.C. Osteoarthritis: Epidemiology. Best Practice and Research. Clin. Rheumatol. 2006, 20, 3–25. [Google Scholar]
  22. Hernigou, P.; Delambre, J.; Quiennec, S.; Poignard, A. Human bone marrow mesenchymal stem cell injection in subchondral lesions of knee osteoarthritis: A prospective randomized study versus contralateral arthroplasty at a mean fifteen year follow-up. Int. Orthop. 2021, 45, 365–373. [Google Scholar] [CrossRef]
  23. Kellgren, J.H.; Lawrence, J.S. Radiological assessment of osteo-arthrosis. Ann. Rheum. Dis. 1957, 16, 494–502. [Google Scholar] [CrossRef] [Green Version]
  24. Zhu, S.; Zhu, J.; Zhen, G.; Hu, Y.; An, S.; Li, Y.; Zheng, Q.; Chen, Z.; Yang, Y.; Wan, M.; et al. Subchondral bone osteoclasts induce sensory innervation and osteoarthritis. J. Clin. Investig. 2019, 129, 1076–1093. [Google Scholar] [CrossRef] [PubMed] [Green Version]
  25. Myszka, A.; Piontek, J.; Tomczyk, J.; Lisowska-Gaczorek, A.; Zalewska, M. Relationships between osteoarthritic changes (osteophytes, porosity, eburnation) based on historical skeletal material. Ann. Hum. Biol. 2020, 47, 263–272. [Google Scholar] [CrossRef]
  26. Rogers, J. The palaeopathology of joint disease. In Human Osteology in Archaeology and Forensic Science; Cambridge University Press: Cambridge, UK, 2000; pp. 163–182. [Google Scholar]
  27. Waldron, T.; Rogers, J. Inter-observer variation in coding osteoarthritis in human skeletal remains. Int. J. Osteoarchaeol. 1991, 1, 49–56. [Google Scholar] [CrossRef]
  28. Weiss, E. Reading the Bones: Activity, Biology, and Culture; University Press of Florida: Gainesville, FL, USA, 2017. [Google Scholar]
  29. Alves-Cardoso, F.; Assis, S. Can osteophytes be used as age at death estimators? Testing correlations in skeletonized human remains with known age at death. Forensic Sci. Int. 2018, 288, 59–66. [Google Scholar] [CrossRef] [PubMed]
  30. Brennaman, A.L.; Love, K.R.; Bethard, J.D.; Pokines, J.T. A bayesian approach to age-at-death estimation from osteoarthritis of the shoulder in modern North Americans. J. Forensic Sci. 2017, 62, 573–584. [Google Scholar] [CrossRef] [PubMed]
  31. Calce, S.E.; Kurki, H.K.; Weston, D.A.; Gould, L. The relationship of age, activity, and body size on osteoarthritis in weight-bearing skeletal regions. Int. J. Paleopathol. 2018, 22, 45–53. [Google Scholar] [CrossRef] [PubMed]
  32. Calce, S.E.; Kurki, H.K.; Weston, D.A.; Gould, L. Effects of osteoarthritis on age-at-death estimates from the human pelvis. Am. J. Phys. Anthropol. 2018, 167, 3–19. [Google Scholar] [CrossRef] [PubMed]
  33. Winburn, A.P.; Stock, M.K. Reconsidering osteoarthritis as a skeletal indicator of age at death. Am. J. Phys. Anthropol. 2019, 170, 459–473. [Google Scholar] [CrossRef]
  34. Falys, C.G.; Prangle, D. Estimating age of mature adults from the degeneration of the sternal end of the clavicle. Am. J. Phys. Anthropol. 2015, 156, 203–214. [Google Scholar] [CrossRef] [Green Version]
  35. Boldsen, J.L.; Milner, G.R.; Konigsberg, L.W.; Wood, J.W. Transition analysis: A new method for estimating age from skeletons. In Paleodemography: Age Distributions from Skeletal Samples; Hoppa, R.D., Vaupel, J.W., Eds.; Cambridge University Press: Cambridge, UK, 2002; pp. 73–106. [Google Scholar]
  36. Milner, G.R.; Boldsen, J.L. Transition analysis: A validation study with known-age modern American skeletons. Am. J. Phys. Anthropol. 2012, 148, 98–110. [Google Scholar] [CrossRef]
  37. Epel, E.S.; Blackburn, E.H.; Lin, J.; Dhabhar, F.S.; Adler, N.E.; Morrow, J.D.; Cawthon, R.M. Accelerated telomere shortening in response to life stress. Proc. Natl. Acad. Sci. USA 2004, 101, 17312–17315. [Google Scholar] [CrossRef] [PubMed] [Green Version]
  38. Kuszel, L.; Trzeciak, T.; Richter, M.; Czarny-Ratajczak, M. Osteoarthritis and telomere shortening. J. Appl. Genet. 2015, 56, 169–176. [Google Scholar] [CrossRef] [PubMed] [Green Version]
  39. Deo, M.E. Why BIPOC fails. Va. L. Rev. Online 2021, 107, 115. [Google Scholar]
  40. Vidoli, G.M.; Steadman, D.W.; Devlin, J.B.; Jantz, L.M. History and development of the first anthropology research facility, Knoxville, Tennessee. In Taphonomy of Human Remains: Forensic Analysis of the Dead and the Depositional Environment: Forensic Analysis of the Dead and the Depositional Environment; Wiley Online Library: Hoboken, NJ, USA, 2017; pp. 461–475. [Google Scholar]
  41. Jurmain, R. Paleoepidemiology of a central California prehistoric population from CA-ALA-329: II. Degenerative disease. Am. J. Phys. Anthropol. 1990, 83, 83–94. [Google Scholar] [CrossRef]
  42. R Core Team. R: A Language and Environment for Statistical Computing (Version 4.1.0, “Camp Pontanezen”). 2021. Available online: http://www.Rproject.org/ (accessed on 6 August 2021).
  43. Nelder, J.A.; Wedderburn, R.W.M. Generalized linear models. J. R. Stat. Soc. Ser. A Gen. 1972, 135, 370–384. [Google Scholar] [CrossRef]
  44. Yee, T.W. Vector Generalized Linear and Additive Models: With an Implementation in R; Springer: New York, NY, USA, 2015. [Google Scholar]
  45. Bera, A.K.; Jarque, C.M.; Lee, L.-F. Testing the normality assumption in limited dependent variable models. Int. Econ. Rev. 1984, 25, 563–578. [Google Scholar] [CrossRef]
  46. Johnson, P.A. A test of the normality assumption in the ordered probit model. Metron 1996, 54, 213–221. [Google Scholar]
  47. Konigsberg, L. Transition Analysis (& Other Stuff). Available online: http://faculty.las.illinois.edu/lylek/TransAna/TransAna.html (accessed on 7 March 2023).
  48. Cohen, J. A coefficient of agreement for nominal scales. Educ. Psychol. Meas. 1960, 20, 37–46. [Google Scholar] [CrossRef]
  49. Cohen, J. Weighted kappa: Nominal scale agreement provision for scaled disagreement or partial credit. Psychol. Bull. 1968, 70, 213–220. [Google Scholar] [CrossRef]
  50. Morrison, L.W. Observer error in vegetation surveys: A review. J. Plant Ecol. 2016, 9, 367–379. [Google Scholar] [CrossRef]
  51. Zhang, T. Iteratively reweighted least squares with random effects for maximum likelihood in generalized linear mixed effects models. J. Stat. Comput. Simul. 2021, 91, 3404–3425. [Google Scholar] [CrossRef]
  52. Becker, S.K.; Goldstein, P.S. Evidence of osteoarthritis in the Tiwanaku colony, Moquegua, Peru (AD 500–1100). Int. J. Osteoarchaeol. 2018, 28, 54–64. [Google Scholar] [CrossRef] [Green Version]
  53. Eng, J.T. A bioarchaeological study of osteoarthritis among populations of northern China and Mongolia during the Bronze Age to Iron Age transition to nomadic pastoralism. Quat. Int. 2016, 405, 172–185. [Google Scholar] [CrossRef]
  54. Klaus, H.D.; Spencer Larsen, C.; Tam, M.E. Economic intensification and degenerative joint disease: Life and labor on the postcontact north coast of Peru. Am. J. Phys. Anthropol. 2009, 139, 204–221. [Google Scholar] [CrossRef] [PubMed]
  55. Molnar, P.; Ahlstrom, T.P.; Leden, I. Osteoarthritis and activity—An analysis of the relationship between eburnation, Musculoskeletal Stress Markers (MSM) and age in two Neolithic hunter–gatherer populations from Gotland, Sweden. Int. J. Osteoarchaeol. 2011, 21, 283–291. [Google Scholar] [CrossRef]
  56. Palmer, J.L.; Hoogland, M.H.; Waters-Rist, A.L. Activity reconstruction of post- medieval Dutch rural villagers from upper limb osteoarthritis and entheseal changes. Int. J. Osteoarchaeol. 2016, 26, 78–92. [Google Scholar] [CrossRef]
  57. Schrader, S.A. Activity patterns in New Kingdom Nubia: An examination of entheseal remodeling and osteoarthritis at Tombos. Am. J. Phys. Anthropol. 2012, 149, 60–70. [Google Scholar] [CrossRef]
  58. Zhang, H.; Merrett, D.C.; Jing, Z.; Tang, J.; He, Y.; Yue, H.; Yue, Z.; Yang, D.Y. Osteoarthritis, labour division, and occupational specialization of the Late Shang China-insights from Yinxu (ca. 1250–1046 BC). PLoS ONE 2017, 12, e0176329. [Google Scholar]
  59. Heidari, B. Knee osteoarthritis prevalence, risk factors, pathogenesis and features: Part I. Casp. J. Intern. Med. 2011, 2, 205. [Google Scholar]
  60. Meehan, J.P.; Danielsen, B.; Tancredi, D.J.; Kim, S.; Jamali, A.A.; White, R.H. A population-based comparison of the incidence of adverse outcomes after simultaneous- bilateral and staged-bilateral total knee arthroplasty. JBJS 2011, 93, 2203–2213. [Google Scholar] [CrossRef] [Green Version]
  61. Jaffar, A.A.; Abass, S.J.; Ismael, M.Q. Biomechanical aspects of shoulder and hip articulations: A comparison of two ball and socket joints. Al-Khwarizmi Eng. J. 2006, 2, 1–14. [Google Scholar]
  62. Wood, J.W.; Milner, G.R.; Harpending, H.C.; Weiss, K.M.; Cohen, M.N.; Eisenberg, L.E.; Hutchinson, D.L.; Jankauskas, R.; Cesnys, G.; Česnys, G.; et al. The osteological paradox: Problems of inferring prehistoric health from skeletal samples [and comments and reply]. Curr. Anthropol. 1992, 33, 343–370. [Google Scholar] [CrossRef]
  63. Hens, S.M.; Godde, K. A Bayesian Approach to Estimating Age from the Auricular Surface of the Ilium in Modern American Skeletal Samples. Forensic Sci. 2022, 2, 682–695. [Google Scholar] [CrossRef]
  64. Bowleg, L. The problem with the phrase women and minorities: Intersectionality—An important theoretical framework for public health. Am. J. Public Health 2012, 102, 1267–1273. [Google Scholar] [CrossRef] [PubMed]
  65. Galtung, J. Violence, peace, and peace research. J. Peace Res. 1969, 6, 167–191. [Google Scholar] [CrossRef]
  66. Khanlou, N.; Vazquez, L.M.; Pashang, S.; Connolly, J.A.; Ahmad, F.; Ssawe, A. 2020 syndemic: Convergence of COVID-19, gender-based violence, and racism pandemics. J. Racial Ethn. Health Disparities 2021, 9, 2077–2089. [Google Scholar] [CrossRef]
  67. Panter-Brick, C. Health, risk, and resilience: Interdisciplinary concepts and applications. Annu. Rev. Anthropol. 2014, 43, 431–448. [Google Scholar] [CrossRef]
  68. Casagrande, K. Understanding Barriers to Whole-Body Donation to Forensic Anthropology Facilities: Implications for Criminal Investigations. Unpublished Thesis, Texas State University, San Marcos, TX, USA, 2020. [Google Scholar]
  69. de la Cova, C. Marginalized bodies and the construction of the Robert J. Terry Anatomical Skeletal Collection: A promised land lost. In Bioarchaeology of Marginalized People; Mant, M., Holland, A., Eds.; Elsevier Academic Press: Cambridge, MA, USA, 2019; pp. 133–155. [Google Scholar]
  70. Hunt, D.R.; Albanese, J. History and demographic composition of the Robert J. Terry anatomical collection. Am. J. Phys. Anthropol. 2005, 127, 406–417. [Google Scholar] [CrossRef]
  71. Brandon, D.T.; Isaac, L.A.; LaVeist, T.A. The legacy of Tuskegee and trust in medical care: Is Tuskegee responsible for race differences in mistrust of medical care? J. Natl. Med. Assoc. 2005, 97, 951. [Google Scholar]
  72. Edgar, H.J.; Berry, S.R. NMDID: A new research resource for biological anthropology. Am. J. Phys. Anthropol. Suppl. 2019, 168, 66. [Google Scholar]
Figure 1. Examples of osteoarthritis (OA) observed in the study sample, including osteophytic growth of the scapular glenoid fossa (left) and eburnation and porosity of the femoral head (right).
Forensicsci 03 00016 g001
Figure 2. Ancestry distribution of the sample. Note that “ancestry” is the term used by the UTK Donated Skeletal Collection to denote a skeletal donor’s U.S. social race. The UTK Donated Skeletal Collection also uses the census terminology “American Indian” (# = number).
Forensicsci 03 00016 g002
Figure 3. Age distribution of the white subsample (# = number).
Forensicsci 03 00016 g003
Figure 4. Age distribution of the BIPOC subsample (# = number).
Forensicsci 03 00016 g004
Figure 5. Kaplan-Meier survivorship curves comparing the age distributions of the current study’s subsamples. In the upper plot, note that the subsamples’ curves are largely overlapping, with the exception of the BIPOC males’ curve. The dotted lines in the lower four plots indicated 95% confidence intervals. In all the plots, abscissae indicate the age at death in years, and the ordinate axes indicate the proportion of the sample surviving to that age.
Forensicsci 03 00016 g005
Figure 6. A hierarchy of the joints that can be used for aging based on OA presence/absence. The graphic shows the joints in order of the most to the least relevant (top to bottom). Note that the TMJ and ankle are not presented here, as this study confirmed the work of Winburn and Stock [33], indicating their lack of utility for age estimation.
Forensicsci 03 00016 g006
Table 1. Age distribution of the study sample.
Age at Death# White Males# White Females# BIPOC Males# BIPOC Females
18–307540
31–4011624
41–50191481
51–60122796
61–70131866
71–80211547
81–90231602
91–1004501
TOTAL1091063327
Mean ages62.2 years62.6 years52.6 years62.3 years
Note that # = number.
Table 2. BIPOC subsample: age at transition (years). Please note that the percentages refer to the ages at which 90% and 95% of the sample transitioned to exhibiting evidence of OA, not to confidence intervals.
FemaleMalePooled Sex
Joint90%95%90%95%90%95%
TMJ45.046.932.050.135.747.2
ShoulderInfInf43.748.341.345.1
ElbowInfInf18.1 *31.5 *20.529.3
Wrist52.2 *56.9 *68.590.357.771.1
Hand44.6 *53.8 *54.265.550.459.8
HipInfInf38.4 *42.7 *37.140.9
KneeNaNNaN42.260.636.147.3
AnkleNaNNaN45.154.041.147.9
Foot44.653.850.761.348.357.6
Notes: NaN indicates not a number; Inf indicates infinity. * Asterisks indicate instances where the probit link GLM for that sex- and population-specific joint violates the assumption of normally distributed errors.
Table 3. White subsample: age at transition (years). Please note that the percentages refer to the ages at which 90% and 95% of the sample transitioned to exhibiting evidence of OA, not to confidence intervals.
FemaleMale Pooled Sex
Joint90%95%90%95%90%95%
TMJ34.849.147.883.040.063.3
Shoulder36.640.547.5 *56.3 *42.749.6
Elbow27.9 *29.8 *21.731.726.733.3
Wrist49.857.242.647.346.653.0
Hand35.744.344.554.841.050.2
Hip27.9 *29.8 *36.139.033.836.6
Knee28.6 *30.4 *32.337.231.235.1
Foot45.956.351.0 *63.6 *48.660.1
* Asterisks indicate instances where the probit link GLM for that sex- and population- specific joint violates the assumption of normally distributed errors.
Table 4. White subsample: mean ages at transition in years (after repeated iterative sampling). Please note that the percentages refer to the ages at which 90% and 95% of the sample transitioned to exhibiting evidence of OA, not to confidence intervals.
Female Male Pooled Sex
Joint90%95%90%95%90%95%
TMJ43.256.151.467.242.761.2
Shoulder37.441.145.252.740.446.8
Elbow31.233.032.743.828.635.5
Wrist47.855.840.845.045.651.5
Hand36.647.942.052.039.648.6
Hip31.133.136.438.633.836.3
Knee32.033.832.438.130.134.1
Ankle60.977.433.335.745.362.5
Foot45.357.049.059.247.359.2
Table 5. Winburn and Stock (2019) data: ages at transition in years (after repeated iterative sampling). Please note that the percentages refer to the ages at which 90% and 95% of the sample transitioned to exhibiting evidence of OA, not to confidence intervals.
FemaleMalePooled Sex
Joint90%95%90%95%90%95%
TMJ75.385.587.094.187.497.6
Shoulder42.247.739.142.340.244.3
Elbow45.154.334.537.437.745.0
Wrist54.467.543.252.247.961.4
Hand55.964.453.662.655.866.1
Hip41.247.132.735.433.538.5
Knee45.156.840.349.940.653.3
Ankle89.897.154.065.084.294.2
Foot59.673.449.559.954.271.5
Table 6. Chi-square p-values comparing the BIPOC and iteratively resampled white subsamples. Please note that the percentages refer to the ages at which 90% and 95% of the sample transitioned to exhibiting evidence of OA, not to confidence intervals.
FemaleMalePooled Sex
Joint90%95%90%95%90%95%
TMJ0.850.360.030.110.430.18
ShoulderN/AN/A0.870.660.920.86
ElbowN/AN/A0.040.160.250.44
Wrist0.660.920.01 *<0.01 *0.230.08
Hand0.370.560.210.210.250.28
HipN/AN/A0.820.650.700.60
KneeN/AN/A0.260.02 *0.460.14
AnkleN/AN/A0.180.050.650.16
Foot0.940.760.860.850.920.88
* Note: Significantly different values are in bold, with the Bonferroni correction applied for multiple tests and the alpha level set at p = 0.025. “N/A” = not applicable; chi-square tests could not be run for these joints because the values generated for the ages at transition in the BIPOC female subsample were not numeric values (inf or NaN).
Table 7. Chi-Square p-values comparing the BIPOC subsample and Winburn and Stock’s [33] iterated subsample. Please note that the percentages refer to the ages at which 90% and 95% of the sample transitioned to exhibiting evidence of OA, not to confidence intervals.
FemaleMalePooled Sex
Joint90%95%90%95%90%95%
TMJ<0.01 *<0.01 *<0.01 *<0.01 *<0.01 *<0.01 *
ShoulderN/AN/A0.620.530.910.93
ElbowN/AN/A0.02 *0.480.02 *0.07
Wrist0.830.340.02 *<0.01 *0.340.40
Hand0.260.330.950.800.600.57
HipN/AN/A0.500.410.660.79
KneeN/AN/A0.840.310.610.55
AnkleN/AN/A0.370.31<0.01 *<0.01 *
Foot0.140.080.900.900.560.22
* Note: Significantly different values are in bold, with the Bonferroni correction applied for multiple tests and the alpha level set at p = 0.025. “N/A” = not applicable; chi-square tests could not be run for these joints because the values generated for the ages at transition in the BIPOC female subsample were not numeric values (inf or NaN).
Table 8. Chi-Square p-values comparing the white subsample to Winburn and Stock [33]. Please note that the percentages refer to the ages at which 90% and 95% of the sample transitioned to exhibiting evidence of OA, not to confidence intervals.
FemaleMalePooled Sex
Joint90%95%90%95%90%95%
TMJ<0.01 *<0.01 *N/AN/AN/AN/A
Shoulder0.520.440.430.200.900.70
Elbow0.040.01 *0.120.560.120.13
Wrist0.720.270.890.480.850.39
Hand0.02 *0.040.280.350.120.14
Hip0.250.100.430.460.890.82
Knee0.860.01 *0.290.150.270.04
AnkleN/AN/A0.02 *<0.01 *N/AN/A
Foot0.18<0.01 *0.900.930.560.22
* Note: Significantly different values are in bold, with the Bonferroni correction applied for multiple tests and the alpha level set at p = 0.025. “N/A” = not applicable; these represent the joints that Winburn and Stock [33] advised against using for age estimation and which did not have an age at transition to compare with the current sample.
Table 9. Agreement between the estimated and actual ages by subsample.
SubsampleCorrect Age from 90%
Ages at Transition
Correct Age from 95%
Ages at Transition
Black (n = 32)97%88%
American Indian (n = 12)83%83%
White (n = 215)93%88%
BIPOC (n = 60)92%88%
All males (n = 143)92%89%
All females (n = 132)94%86%
American Indian female (n = 4)100%100%
American Indian male (n = 8)75%75%
Black female (n = 17)100%88%
Black male (n = 15)93%87%
White female (n = 103)90%83%
White male (n = 112)93%92%
Total93%88%
Table 10. Interobserver and intraobserver error by joint.
Interobserver Error by JointIntraobserver Error by Joint
Joint SurfaceError
(Left)
Error
(Right)
Error
(Left)
Error
(Right)
TMJ19.57%19.57%5.00%10.00%
Shoulder10.87%13.04%15.00%25.00%
Elbow6.52%2.17%0.00%0.00%
Wrist4.44%13.64%10.53%21.05%
Hand4.55%4.55%0.00%0.00%
Hip4.44%4.44%0.00%5.00%
Knee6.67%7.32%5.00%5.56%
Ankle18.60%15.38%5.00%5.00%
Foot9.09%4.55%10.00%10.00%
Average Error9.42%9.41%5.61%9.07%
Table 11. Interobserver error by individual.
IndividualError
15.56%
20.00%
362.86%
45.56%
512.12%
60.00%
70.00%
80.00%
90.00%
108.57%
112.78%
1230.56%
132.86%
140.00%
152.78%
1617.14%
175.71%
185.71%
192.78%
2013.89%
210.00%
2216.67%
2314.71%
Average Error9.14%
Table 12. Intraobserver error by individual.
IndividualError
10.00%
20.00%
30.00%
42.78%
522.22%
60.00%
72.78%
835.48%
913.89%
100.00%
Average Error7.72%
Disclaimer/Publisher’s Note: The statements, opinions and data contained in all publications are solely those of the individual author(s) and contributor(s) and not of MDPI and/or the editor(s). MDPI and/or the editor(s) disclaim responsibility for any injury to people or property resulting from any ideas, methods, instructions or products referred to in the content.

