Article

Evaluation of DNA Methylation-Based Age-Prediction Models from Saliva and Buccal Swab Samples Using Pyrosequencing Data

1
Institut de Recherche Criminelle de la Gendarmerie Nationale (IRCGN), 95000 Cergy-Pontoise, France
2
UPR CHROME—Université de Nîmes, CEDEX 1, 30021 Nîmes, France
3
Ecole de l’ADN, 30000 Nîmes, France
4
UMR7268—Anthropologie Bioculturelle Droit Ethique et Santé (ADES), Université Aix-Marseille, 13344 Marseille, France
*
Authors to whom correspondence should be addressed.
Forensic Sci. 2023, 3(2), 192-204; https://doi.org/10.3390/forensicsci3020015
Submission received: 27 February 2023 / Revised: 13 March 2023 / Accepted: 14 March 2023 / Published: 24 March 2023

Abstract

:
In forensic genetics, the identification of an individual is often carried out by comparing unknown DNA profiles obtained in a case against databases or references. When no match is found, investigators need new tools in order to obtain additional leads. The latest technical advances now make it possible to predict externally visible characteristics. With this objective, predicting the age of an individual through DNA methylation analysis remains one of the last challenges. The prediction models have to account for the specific constraints of this field, including tissue specificity and DNA availability (i.e., low DNA amounts or low-quality DNA). Jung and colleagues have recently produced models from blood, saliva and buccal cells by using a single base extension sequencing method. With the goal of evaluating these models in our own analytical conditions, saliva and buccal cell samples from 115 French individuals between the ages of 0 and 88 years old were collected and analyzed. After having determined the optimal analysis conditions, including the DNA quantity for bisulfite conversion (75 ng), some differences were highlighted in the measured methylation rates between the two studies. Despite these discrepancies, the prediction performance levels remain very similar, our study showing mean absolute errors of 3.5 years, 3.9 years and 3.2 years, respectively, for the saliva, buccal swab and multitissue model, with limitations observed for the oldest and youngest individuals. Furthermore, we propose the use of a prediction interval with an error dispersion and correct prediction rate at ±5 years and ±10 years, respectively.

1. Introduction

The identification of an individual from traces left in a crime scene or from human remains often requires the comparison of the DNA profile to a known reference or to a database. When this is feasible, forensic geneticists are able to provide evaluative evidence to the investigators and to the court. Despite the latest advances in the DNA-profiling domain (e.g., massive parallel sequencing) which allow the establishment of a DNA profile from low-quantity and low-quality DNA (i.e., degraded DNA), new approaches have to be developed in order to provide intelligence or to give priority to one lead instead of another when no match occurs in databases or when there is no suspect. This investigative DNA evidence is made possible thanks to the latest developments in genomics and DNA sequencing. It is now possible to infer the geographical ancestry and the externally visible features of an individual from the DNA extracted from a crime scene, thanks to analyses of single nucleotide polymorhism (SNP) [1]. The prediction of eye, skin and hair pigmentation can be very informative and even be a complement for facial reconstruction [2]. The discovery of other informative markers or the improvement of predictions is critical for the development of forensic DNA phenotyping (FDP).
Furthermore, recent progress in epigenomics is providing other opportunities to collect information from DNA, such as the tissue source of DNA evidence, the differentiation of monozygotic twins or the age estimation of an individual [3,4]. Several DNA-based approaches have been investigated for estimating the age of an individual in the forensic domain because of the limitations of solid tissue (e.g., bones, teeth) analysis [1,5]. The most promising age-estimation method turns out to be the analysis of DNA methylation [1,5].
Age prediction from DNA methylation relies on age-related hypomethylation or hypermethylation of CpG sites contained in CpG islands, called differentially methylated regions (DMR) [4,6]. One difficulty of age prediction using DNA methylation of age-related CpG markers, also called “clock CpGs”, is that changes in methylation are due not only to age but also to the tissue type or to exogenous factors [4,6]. Over the past few years, many forensic-focused age-prediction models have been developed on the basis of DNA methylation analysis using different analytical platforms, different statistical analysis methods and different tissue types [3]. The main approach used for CpG site methylation determination is the sequence analysis of bisulfite-converted DNA [1]. The bisulfite conversion of DNA involves the conversion of unmethylated cytosines to uraciles by means of a harsh chemical treatment while methylated cytosines remain intact. As a result, while conventional DNA profiling requires a low DNA amount (<250 pg) to obtain interpretable results, DNA methylation analysis determination needs a larger amount of template, usually greater than tens or hundreds of nanograms. Moreover, because this is a quantitative approach (determination of a methylation rate for a particular age-related CpG site), the DNA sample (i.e., sampled DNA strands converted and then amplified) needs to be representative in order to make a reliable prediction [7]. Another difficulty resides in the forensic sample that has to be single sourced. Very few forensic sample types can overcome these difficulties. This includes blood- or saliva-related samples (e.g., chewing gum), which can provide the largest DNA quantity from the crime scene and is derived mainly from one individual. One limitation of saliva-related samples is that the cell composition varies. To try to address this issue, some authors have used a buccal epithelial cell signature [8] or cell-type-specific CpGs [9]. Another approach involves the use of common age-associated markers among several sample types. It is with this objective that Jung et al. proposed tissue-specific models and a multitissue model for age prediction from blood, saliva and buccal swabs [10]. This study relies on CpG sites that have shown age association in blood and saliva from ELOVL2, KLF14, MIR29B2C and TRIM59 gene regions and from an additional region identified in blood age-prediction models [11,12]: FHL2. The produced models allowed age predictions with mean absolute errors (MAEs) of 3.5 years in blood, 3.6 years in saliva and 4.3 years in buccal swab samples for the tissue-specific models and 3.8 years for the combined tissue model. Moreover, the targeted CpGs in this study were situated in regions that were also used in a blood-specific model produced by Zbieć-Piekarska et al. [12] and tested in an independent study by Cho et al. [11], with similar MAEs (3.9 years, and 3.3 years, respectively).
The aim of this study was to adapt the age-prediction models produced by Jung and colleagues to and implement them under in-house analytical conditions. Indeed, disposing of a multitissue model or several tissue-specific models could enable us to predict age from extensive forensic sample types. Despite the advantage of the SNaPshot-sequencing method’s multiplexing ability and the differences in methylation rate measures obtained from one analysis to another [10,13], we chose to adapt the models to a pyrosequencing workflow, which allows access to several CpGs in the DNA sequence, conversely to the SNaPshot method. This choice aimed to dispose of the simplest analytical workflow by limiting the number of polymerase chain reaction (PCR) conditions and harmonizing the PCR and sequencing primer sets in order to access the different CpGs that could be used in the different models [10,12].

2. Materials and Methods

2.1. Study Design and Sample Collection

This study was approved by the ethics commission of the forensic institute of the French gendarmerie. It first involved the adaptation of the Jung et al. age-prediction models to the DNA methylation rate obtained through an optimized pyrosequencing assay. The assay, sensitivity and repeatability assessments were carried out by using the following standards of known methylation rate: human WGA methylated and non-methylated DNA sets (Zymo research, Irvine, CA, USA). The trueness of the DNA methylation rate measure was assessed by using the Epitect Control DNA Set (Qiagen, Hilden, Germany) in order to avoid any bias from bisulfite conversion. The model validation was carried out by using saliva and buccal swab samples obtained from 115 volunteers between the ages of 0 and 88. Each participant, or legal representative for minors, provided written free and informed consent prior to sample collection. For each individual, 1 mL of saliva was obtained in a sterile 40 mL sample flask (CEB, Beaucouzé, France), and two buccal swabs were obtained (Copan group, Brescia, Italy). Each volunteer provided relevant personal information, including birth date, sex and a general health declaration. Samples were conserved at −20 °C until analysis.

2.2. Workflow Validation

Because the age-prediction models from Jung et al. were produced by using a single base extension process [10], PCR primers, amplification conditions and pyrosequencing primers had to be adapted to a pyrosequencing process (Table 1). For the ELOVL2 and TRIM59 targets, primers from the Cho et al. [11] study were preferred thanks to their better trueness of the methylation rate measure (Supplementary Data S1). Additionally, two MgCl2 concentrations were selected for the PCR step: 1.5 mM for the FHL2 target and 2.5 mM for the other targets for the same reason. The hybridation temperature was fixed to 60 °C and primer concentration to 0.4 µM after optimization. Following the PCR and pyrosequencing primer selection, the sensitivity of the assay was assessed from the bisulfite conversion step by using the known methylation standards (100%, 0%) and a 1:1 mix (50% methylation) because the quantification of the DNA is performed only before the bisulfite conversion. The methylation rate was determined for each CpG included in the sequences (Table 1) for 300 ng, 150 ng, 75 ng and 37.5 ng DNA inputs, in triplicates. Subsequently, the repeatability was evaluated from the bisulfite conversion step determined as optimal, using a 1:1 mix of the 0% and 100% standards. The CpG methylation was assessed for 12 replicates for each CpG site included in the five targets.

2.3. DNA Extraction

For the cohort samples, the DNA was first extracted using the Crime Prep Adem-Kit (Ademtech, Pessac, France). The DNA was eluted in 80 µL in a 96-well DeepWell plate (Ademtech, Pessac, France). Samples were then immediately quantified by using the Investigator Quantiplex Pro qPCR kit (Qiagen, Hilden, Germany) and stored at −20 °C until further analysis.

2.4. Bisulfite Conversion

Bisulfite conversion was performed by using the EpiTect Fast Bisulfite Conversion kit (Qiagen, Hilden, Germany). The DNA input was determined in the sensitivity study. During this step, the DNA followed two cycles of denaturation: at 95 °C for 5 min and conversion at 60 °C for 20 min. After desulfonation and the washing steps, the DNA was obtained in 15 µL elution buffer. Samples were then stored at −20 °C, or they were stored at 4 °C if processed in less than 24 h. The DNA obtained from this step is estimated to be 50–60% of the initial amount [14].

2.5. Converted DNA PCR

Amplification of converted DNA was carried out using the Pyromark PCR kit (Qiagen, Hilden, Germany). PCR reactions were set in a 25 µL total volume, with 12.5 µL master mix, 2.5 µL loading buffer and 2 µL converted DNA. The primers (Eurofins Genomics, Ebersberg, Germany) and MgCl2 concentrations have previously been determined (Table 1 and Supplementary Data S1). PCR reactions involved a first step at 95 °C for 5 min, followed by 45 cycles at 94 °C for 30 s, 60 °C for 30 s, 72 °C for 30 s and a final step at 72 °C for 1 min. During the workflow validation, the presence of amplification products was checked by using 2% agarose gel electrophoresis using 5 µL of the PCR product (data not shown).

2.6. Purification and Pyrosequencing

The PCR products (10 µL) were then pyrosequenced by using the Pyromark Q24 platform using the Pyromark Q24 Advanced CpG reagents kit (Qiagen, Hilden, Germany). For this purpose, 0.4 µM of sequencing primers was added to the previously purified amplification products using Pyromark Q24 Vacuum Workstation (Qiagen, Hilden, Germany). Before pyrosequencing, the mixture underwent two incubation steps, one at 80 °C for 5 min and one at room temperature for 2 min.

2.7. Statistical Analysis

The sequence analysis and the determination of the methylation rate were performed using the Pyromark Q24 Software (Qiagen, Hilden, Germany). For each sequence, a conversion control was included in order to check the efficiency of the bisulfite conversion step. The statistical treatment was performed using MSO 2016, R (v4.0.3) and Rstudio (v1.4). The following packages were used: stats v4.0.3, tidyverse v1.3.1, ggplot2 v3.3.3, ggpubr v0.4.0 and car v3.0.10. Comparisons between sample sets were performed using Mann–Whitney–Wilcoxon tests and signed rank Wilcoxon tests if paired. Comparisons between several samples were carried out by using Kruskal–Wallis tests (Bonferonni correction). Each statistical test was carried out by using a 0.05 threshold. The performance of the models was assessed by calculating the adjusted R² and the mean absolute error (MAE). Finally, a 95% prediction interval was estimated for each model, and a correct prediction rate was determined at ±5 and ±10 years for the 10-year age classes.

3. Results

3.1. Trueness

Owing to differences between pyrosequencing and single base extension workflow, it was not possible to use the amplification and sequencing conditions described in Jung and colleagues’ previous work [10,15]. Therefore, we adapted and determined our proper amplification conditions by modifying the annealing temperature and the MgCl2 concentrations. In order to determine a single amplification condition, the most stringent condition (i.e., 62 °C and 1.5 mM MgCl2) was discarded for the failed amplification or the low sequencing template obtained for some targets. For example, MIR29B2C was the most difficult target to amplify and was not possible to amplify with 1.5 mM MgCl2 under the 60 °C and 62 °C conditions. The optimal amplification condition was determined as an annealing temperature of 60 °C and 2.5 mM MgCl2 for the ELOVL2, KLF14, MIR29B2C and TRIM59 targets. A special amplification condition (i.e., 60 °C and 1.5 mM) was determined for the FHL2 target as we observed a high bias in the methylation rate measure for the 2.5 mM MgCl2 conditions. This could be explained by a strand bias during the amplification [15,16,17,18,19]. Moreover, high variations in the methylation rates were observed for the ELOVL2 target using Jung and colleagues’ primer set. Those variations were due to low sequence quality while performing pyrosequencing and may be attributed to unspecific amplification or sequencing primer issues [15]. As a result, having better sequencing qualities and fewer variations in the methylation rates, the Cho and colleagues’ primer sets were preferred for the ELOVL2 and TRIM59 targets (see Table 1 and Table S1).

3.2. Sensitivity

The sensitivity was evaluated for the whole assay, from the bisulfite conversion step onward. For this purpose, three replicates of different quantities (300 ng, 150 ng, 75 ng and 37.5 ng) of 100%, 50% and 0% standard methylated DNA followed the whole DNA methylation measurement process. The standard deviation of the methylation rate obtained for each of the 32 CpG sites contained in the five targets (Table 1) was calculated for each condition. The sensitivity threshold was evaluated to determine the minimum input of DNA needed to achieve the assay and to describe the variability of methylation measure or inconsistencies occurring at low DNA inputs.
As shown in Figure 1, the 0% methylated DNA standard deviation was quite low and did not exceed 2%. This can be explained by an efficient conversion of unmethylated cytosines. The variability observed is in the range of the pyrosequencing step variability that was previously estimated at 1.3% in our analytical conditions (data not shown). For the different quantities, the mean standard deviation estimated was between 0.2% and 0.4%. The standard deviation (SD) obtained for the 50% and 100% methylated DNA presented the same evolutions with an increase in the observed standard deviation while decreasing the DNA input quantities. The maximum variability should be obtained for the 50% methylated DNA because it is expected to have a 50% chance of choosing either a methylated CpG site or an unmethylated CpG site. Interestingly, quite high standard deviations were also obtained for the 100% methylated DNA. This observation could be linked to the bisulfite conversion efficiency. In both cases, the mean standard deviation for the 300 ng condition did not exceed 1.3%, but this DNA amount is rarely reached when analyzing forensic samples. Both the 150 ng and 75 ng conditions showed acceptable results, with better accuracy for the first condition and with a mean SD of 3.2% and a third quartile under 5% SD for the second in the 50% and 100% methylated DNA conditions. As a result, the 75 ng condition was considered to be the best compromise. This choice was made by taking into account the low amount of DNA usually found in forensic samples. The 75 ng condition would allow us to measure the DNA methylation of samples with a DNA concentration of approximately 2 ng/µL. The methylation rates obtained for a sample with 37.5 ng converted DNA could not be considered as reliable, because the SD was able to reach or exceed 10% for certain triplicates and not others, thus highly impacting the precision of age predictions.

3.3. Repeatability

The methylation rate of the 32 CpG sites comprising the five targets was measured for 12 replicates from the bisulfite conversion step in the previously chosen condition for the 50% methylated DNA. As shown in Figure 2, the obtained SD ranged from 1% to 7% depending on the CpG site and the target itself. This can be due to the quality of the pyrosequencing and directly due to the sequence of the target itself. A general increase in the SD can be observed as the distance of the CpG from the beginning of the sequence increases. This can be partly explained by the increasing background signal in the sequence [15]. The large SD observed for the FHL2 target is caused by one replicate only, which was not removed from the analysis, because a good sequence quality was obtained. An error in preparation cannot be excluded. The minimum SD was obtained for the KLF14 target’s CpGs. Importantly, the observed methylation rate differs from 50%, and the difference varies according to each target. The methylation of ELOVL2 CpG sites can reach 20%, whereas the values obtained for the KLF14 target are above 40%. Each target presents a bias in the measured methylation rate. This contrasts with the results obtained in the primer selection (Supplementary Data S1). It might be partly explained by a different preparation of the methylation control, but this could not be checked.

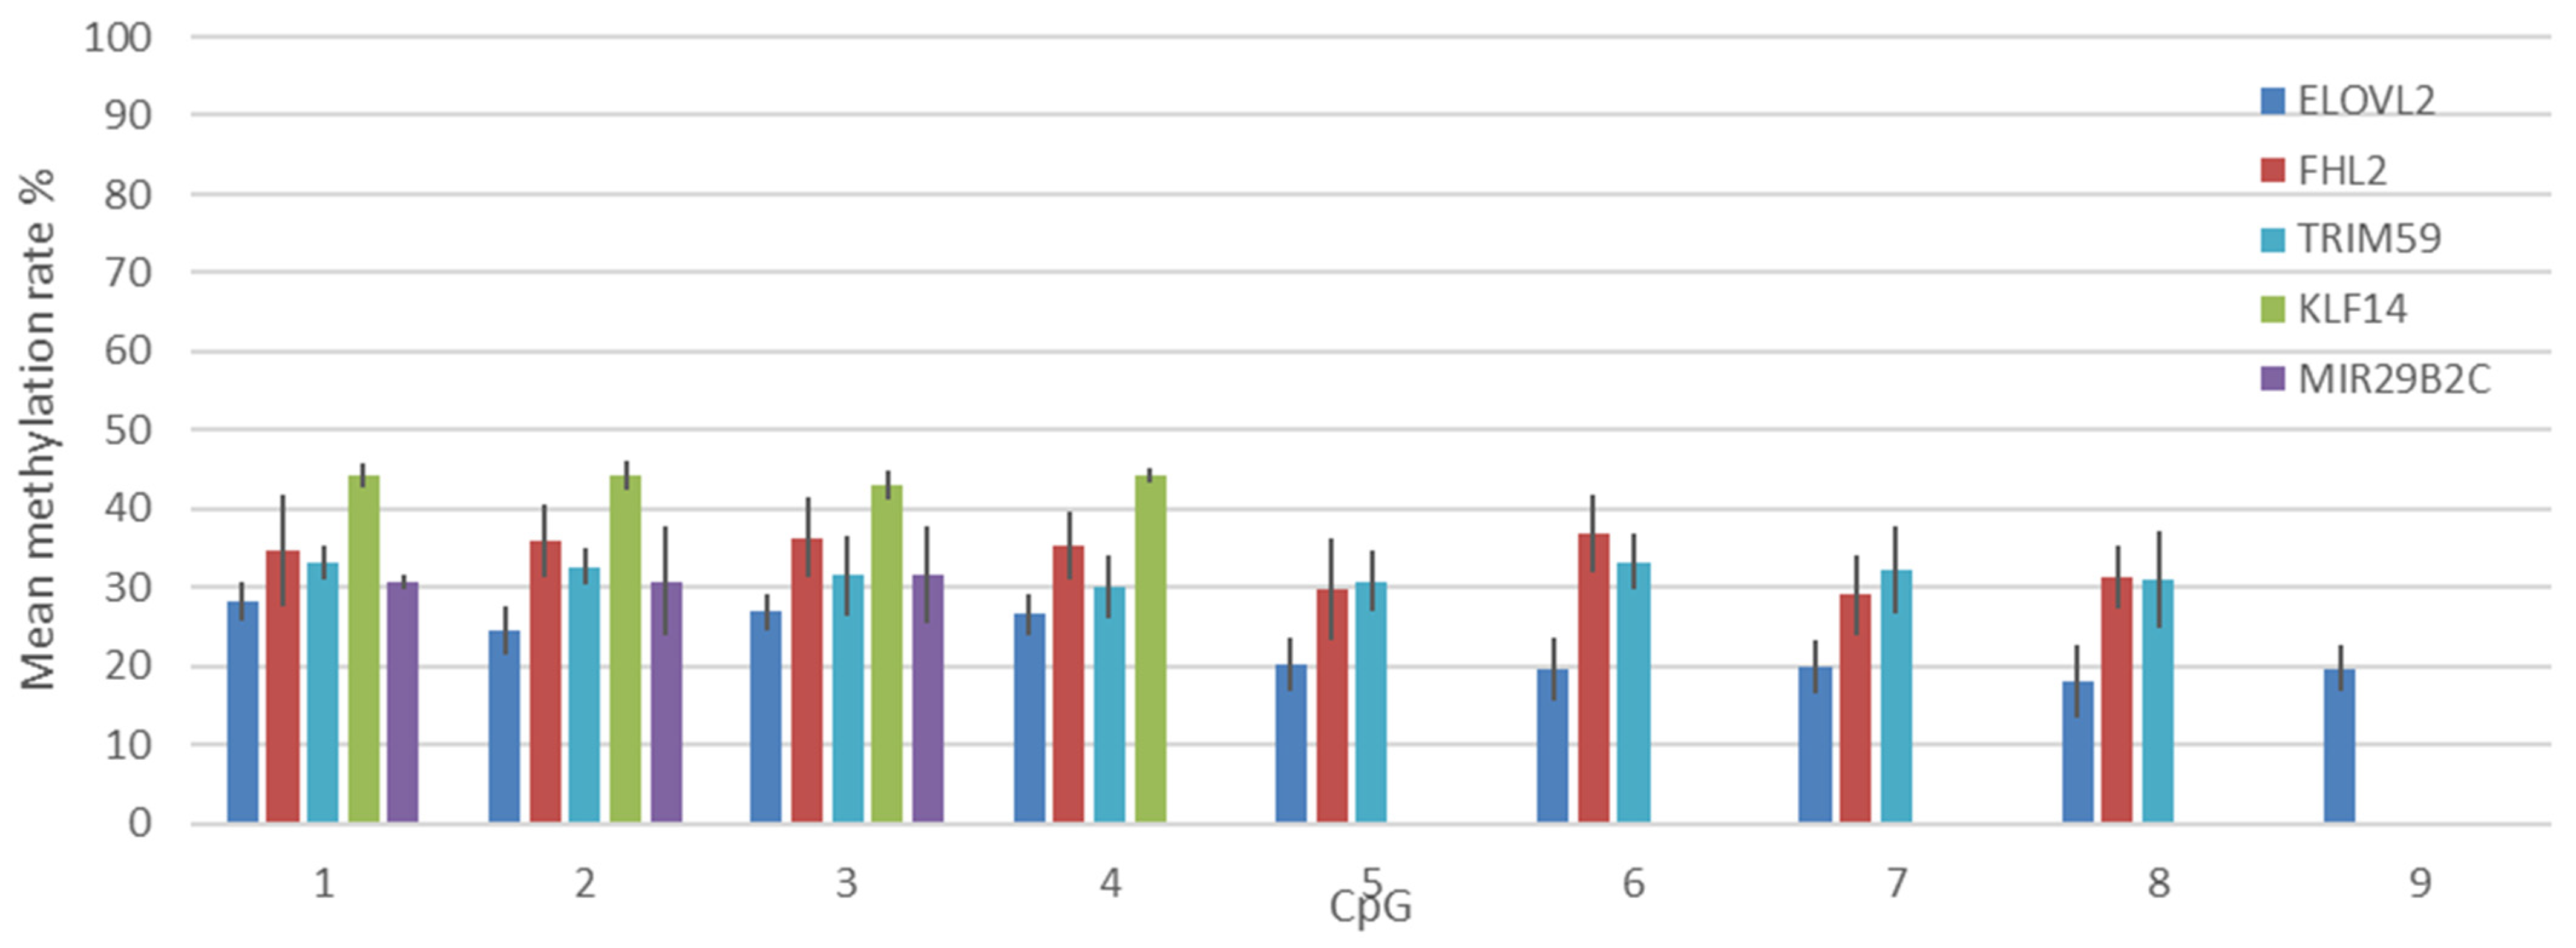
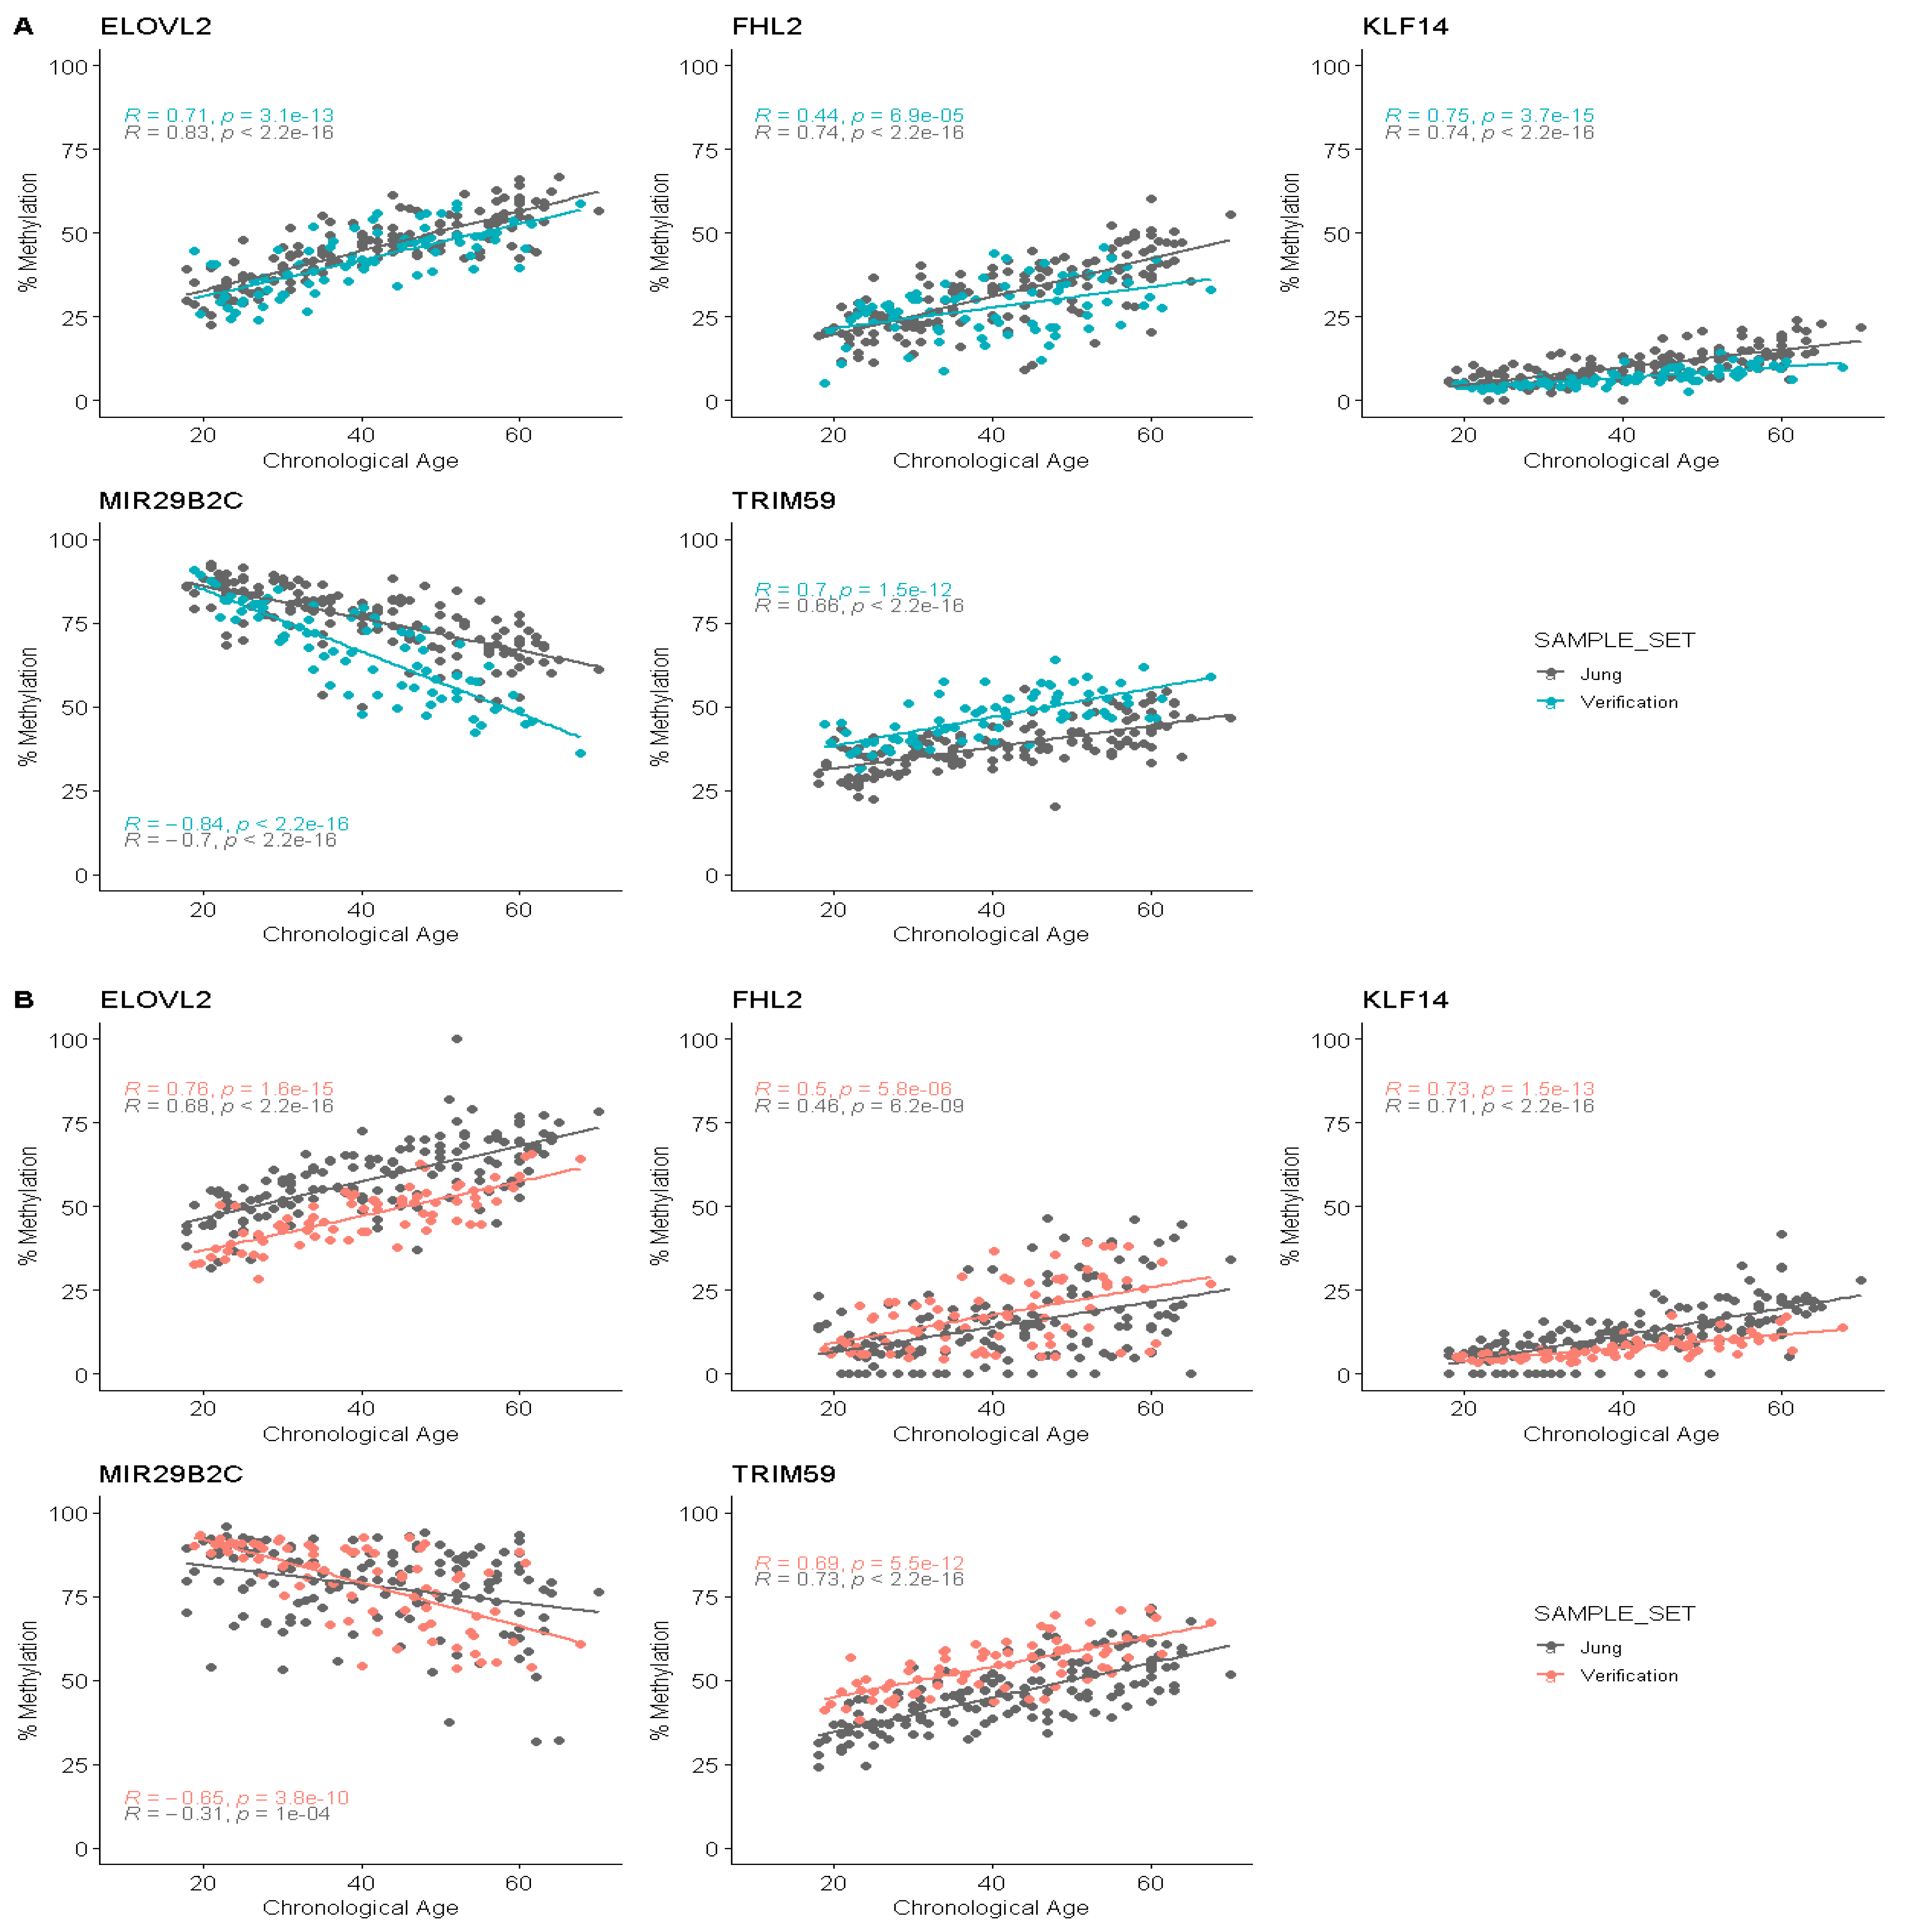
3.4. Correlation between Age and Methylation at Five CpG Sites Using Pyrosequencing

The methylation rate was able to be determined for the five CpG sites in the 115 saliva samples and in almost all the buccal swab samples, except for two, for which the methylation rate of all the CpG sites could not be determined (113 samples analyzed). The methylation rates observed for our sample set are concordant with the data obtained by Jung et al. but present differences. Discrepancies are also observed between sample types.
The data obtained from individuals between 0 and 18 years of age and from individuals between 70 and 88 years of age cannot be compared with the original study, because no data were provided for these individuals in the case of saliva and buccal swab samples. In our study, the use of minors under the age of 18 would require the use of a binding regulatory framework, so only people over 18 were accepted as volunteers. It is important to highlight that the linearity of the correlation for the youngest individuals can be lost, depending on the target and the sample type. This phenomenon can be observed for the TRIM59 target for the saliva samples and the ELOVL2 and TRIM59 targets for the buccal swab samples (Supplementary Data S2). This loss of linearity has already been observed in other studies [12,20,21]. Thus, the comparison of the data produced by using pyrosequencing data and the original data is performed only for individuals from 18 to 70 years of age (Figure 3).
The comparison of distributions from the two data sets was carried out using a Mann–Whitney U test (p-value = 0.05) and the Pearson’s r correlation coefficient (r). In the case of the saliva samples, we were able to detect a difference in the distributions for the five CpG sites (p-value < 0.05), confirmed by the different correlation coefficient values. The ELOVL2 CpG presented an r of 0.71 for our data and 0.83 for the initial data. FHL2 also presented a lower r in our case (0.44) than the one obtained in the original study (0.74). Higher correlation coefficients were observed for the TRIM59, MIR29B2C and KLF14 targets at respectively 0.70, −0.84 and 0.75 for our data, against 0.66, −0.70, and 0.74 for Jung and colleagues’ data, together with different slopes (Figure 3). The data point distributions seem particularly different for the FHL2, MIR29B2C and TRIM59 targets, with different slopes and offsets of the data points. In the case of buccal swab data, the Mann–Whitney U tests were significant for the ELOVL2, FHL2, KLF14 and TRIM59 targets (p-value for MIR29B2C of 0.46). Surprisingly, the observed differences between the two data sets were not the same between the two sample types. Here, the ELOVL2 CpG correlation gave a better r value, of 0.76, in our case, against 0.68 in the original data. Moreover, the two correlations seemed to be offset as for the TRIM59 target (r = 0.69 and r = 0.73, respectively). Here again, a small difference was observed for the KLF14 correlation with close r values of 0.73 and 0.71 (Figure 3). The r coefficients for the FHL2 targets were respectively 0.50 and 0.46, and the slope observed did not seem to be different. Finally, the MIR29B2C target again gave a better r, of −0.65, for our data, against −0.31 for Jung and colleagues’ data. As expected, we observed differences in correlations that can be caused by the analysis method as described in the Jung and colleagues’ study for the KLF14 target [10] but also an offset of data points and important changes in correlations for other targets. The most visible change is observed for MIR29B2C in the two sample types with a flared distribution of the data points, associated with a very tight distribution for the youngest individuals.
When comparing the data from saliva and buccal swabs in our data set (paired Wilcoxon tests on predicted ages, p-value = 0.05), differences were observed in the distributions for all the targets, especially for the FHL2, TRIM59 MIR29B2C targets (p-values of 1.36 × 10⁻¹³, 1.21 × 10⁻¹³ and 2.16 × 10⁻¹⁶, respectively). Even if differences in distributions had been observed for ELOVL2 and KLF14 (4.06 × 10⁻⁶ and 5.19 × 10⁻⁷, respectively), the data points would seem to be more superimposed. Moreover, in terms of correlation, the ELOVL2 and KLF14 targets present very close correlation coefficients, while FHL2 and MIR29B2C present high differences (Supplementary Data S2). Interestingly, the TRIM59 correlation coefficients are identical, but the data points seem to be offset, and the loss of linearity in the correlation seems to be greater for the buccal swab than for the saliva samples. This observation might be due to the different proportions of epithelial cells and white blood cells in the two sample types.

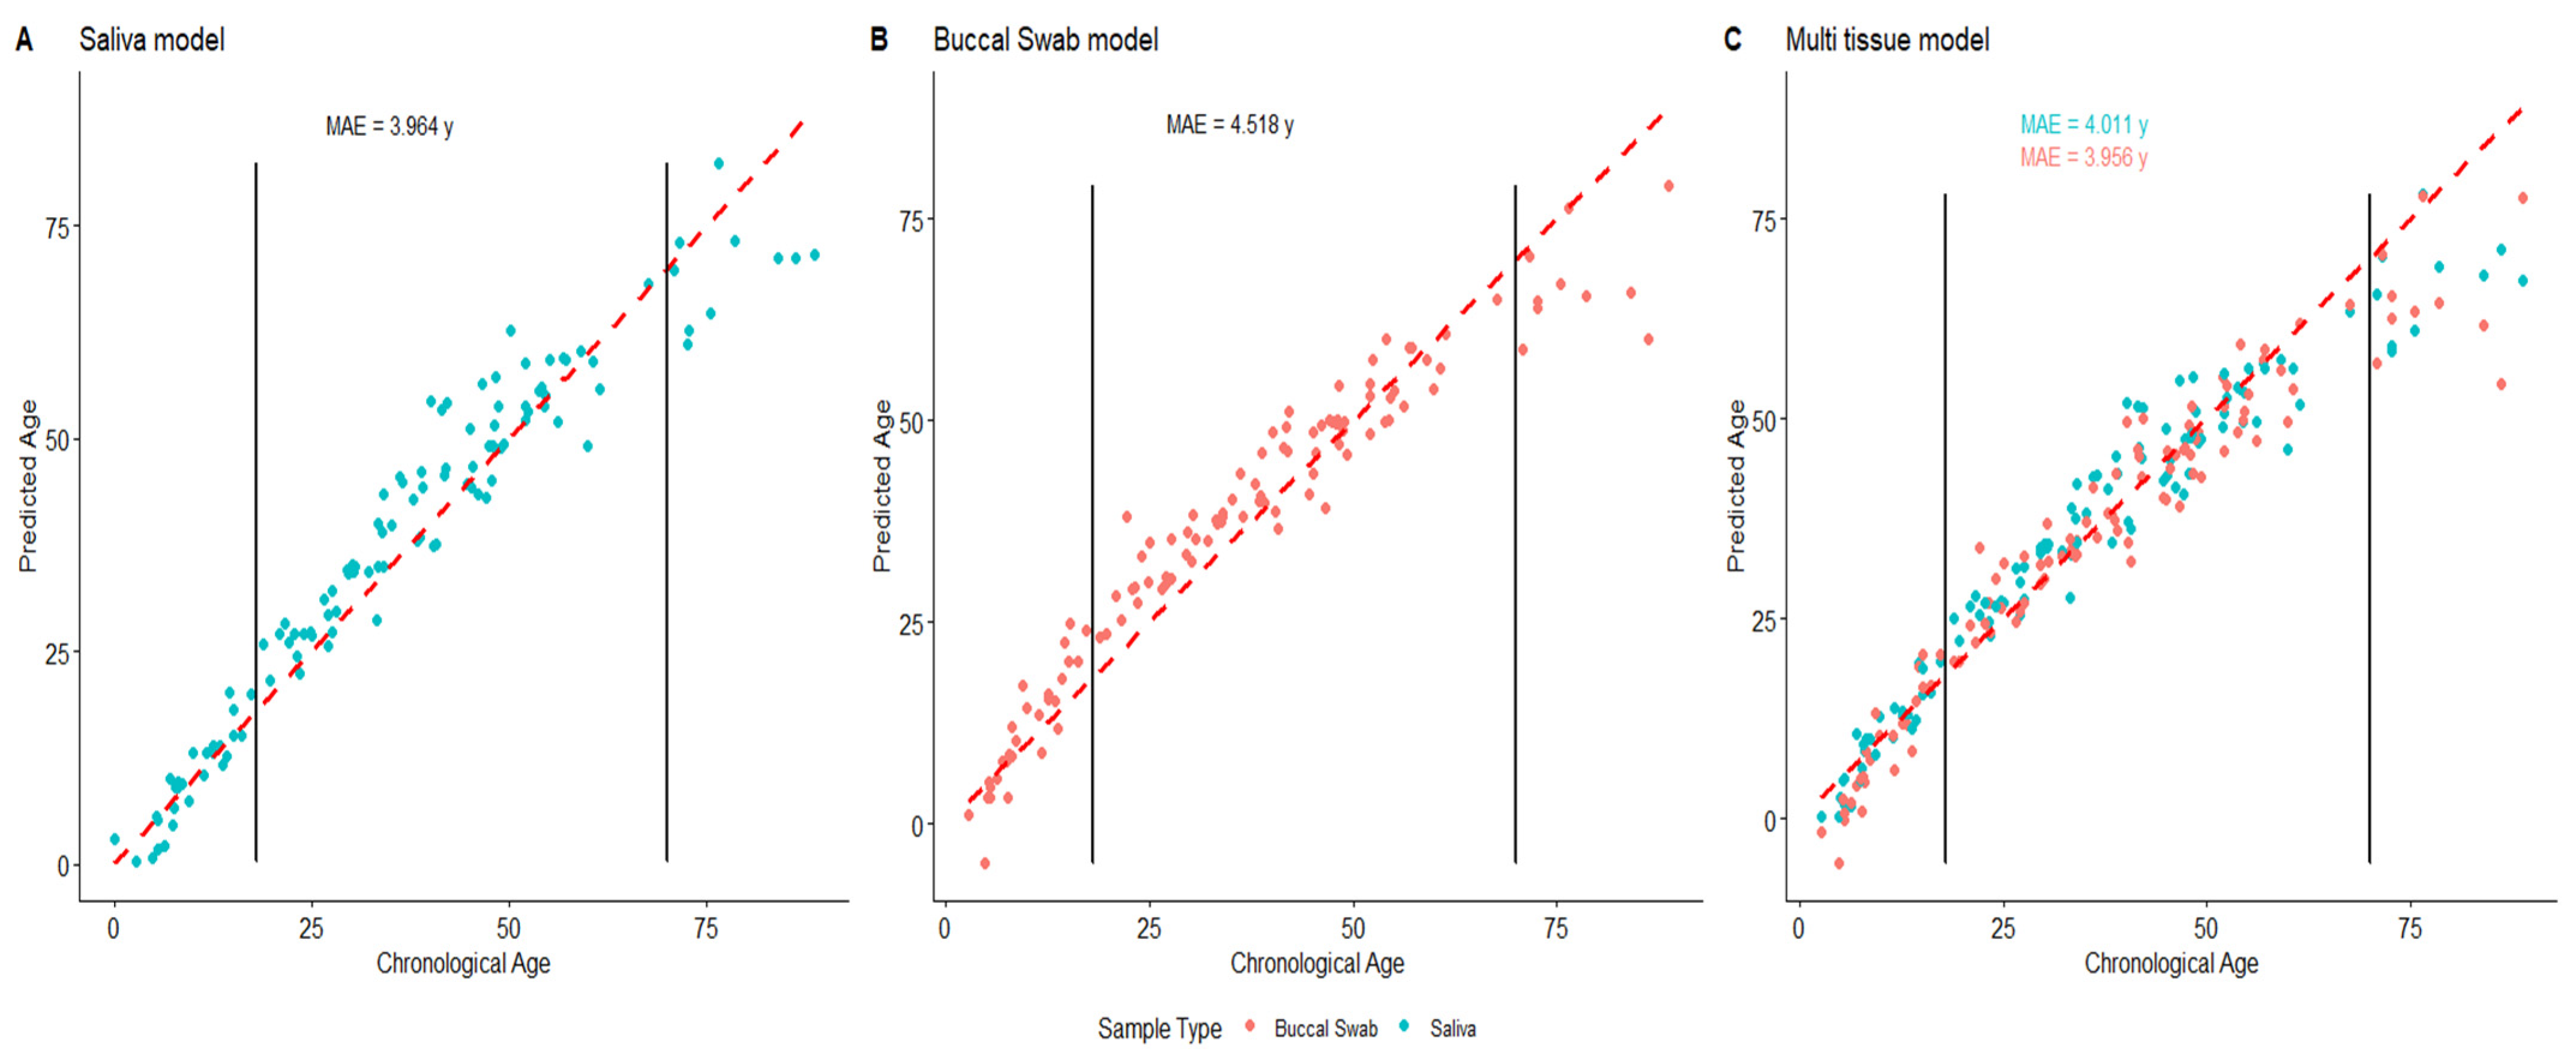
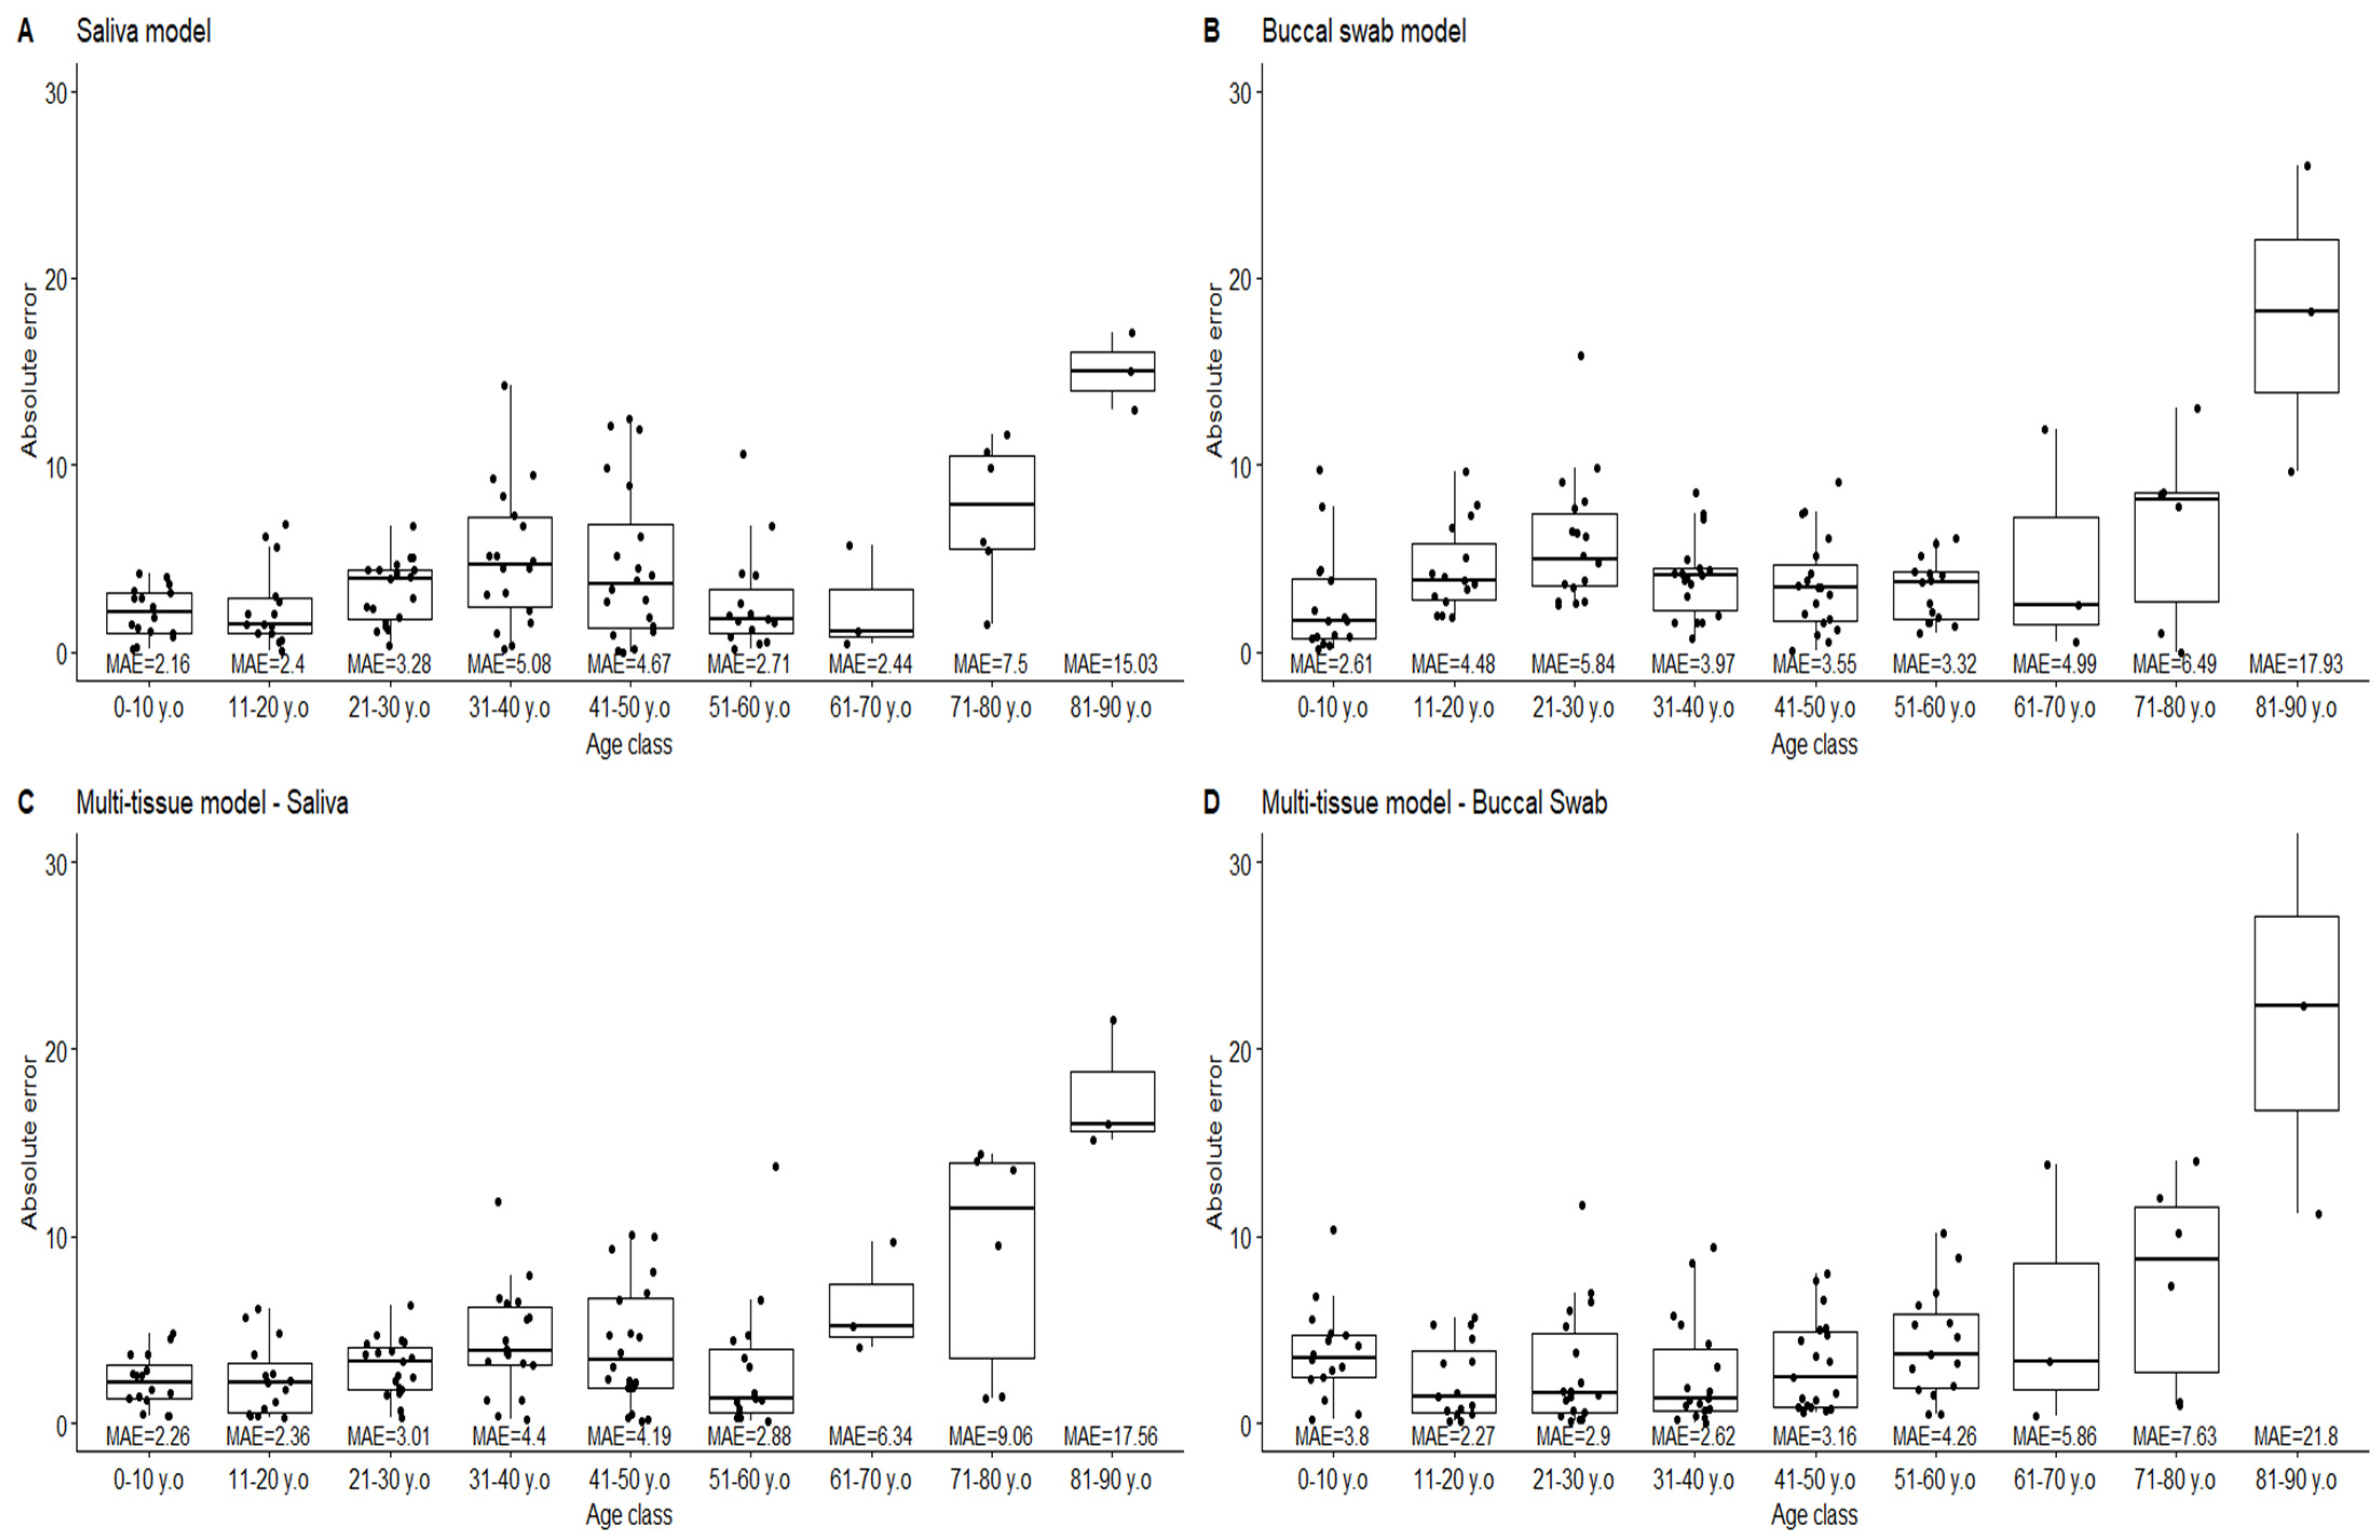
3.5. Age Prediction on Saliva and Buccal Swab Samples Using Tissue-Specific and Multitissue Models

Despite the differences observed between the data sets and the sample types, age prediction was performed by using the three models from the original study (Figure 4).
Several observations can be formulated when observing the age prediction for individuals from 0 to 88 years. The first one is the loss of linearity for the age prediction under age 18 for the different models, where the buccal swab model and the multitissue model are the most impacted. This might be caused by the loss of the linearity of the correlation for TRIM59 and ELOVL2. This induces an underestimation of the age of the youngest individuals (under 10 years of age). The same underestimation of age can be observed for the oldest subjects. Additionally, the error rates are largely increased for individuals over age 60. Notably, the increase in the error rate observed in our data implies a breach in the residuals hypothesis for linear regressions (Supplementary Data S3). Although it can be partly explained by the underrepresentation of elderly people, it is well known that the methylation rate of a particular CpG site can be modified by the environment [22,23]. Thus, even if the correlation of the methylation rate to the age is still true, the effect of such exogenous variations has to be taken into account when estimating the age of the oldest individuals, and the communication of the result has to be carefully carried out. Several solutions could be proposed to address this issue. One of them could be the determination of age-class (e.g., 5 or 10 years)-dependent statistical indicators, and another could use a threshold when predicting age (e.g., not providing results above age 60). On the other hand, the errors in predictions decrease for the youngest individuals thanks to a lower effect of the exogenous methylation modifications. This is particularly observed in the case of the saliva-specific model (Figure 5). Unfortunately, for the other models, the loss of the linearity of the predictions compensates for this decrease in errors with an underestimation of the age for the youngest individuals. Here again, predicting the age of young individuals would have to be carefully carried out given this issue. The use of a second threshold for the youngest individuals could represent one of the solutions despite the major importance of age estimation in the young individuals (e.g., migratory context). The loss of linearity in the correlation can also be addressed by using mathematical transformations while building an age-prediction model [24].
The comparison between sample sets was carried out only for individuals between 18 and 70 years old. No difference was found when comparing the errors obtained for the original data set to the obtained data (Mann–Whitney U test on errors, p-value = 0.05, Bonferonni corrected). Thus, excluding the extreme ages, the models produced by Jung and colleagues seem to be transposable to our analytical workflow.
Despite quite good mean absolute errors, prediction errors of 15 years were reached (see Figure 5). Moreover, looking at the error distribution for the 10-year age classes, we can observe large distributions. This suggests that the mean absolute error may not be the most relevant statistical indicator for the precision of the predictions, or at least, it needs to be completed. Given a normal distribution of the residuals, the prediction interval can be calculated for each new prediction. Further, 95% prediction intervals of ±8.8 years are obtained for the saliva model and ±10 years for both the buccal swab and multitissue models. The application of such large intervals contrasts with the use of mean absolute errors and lessens the usefulness of age predictions that use this model in forensic applications. The good prediction rates for the calculation of the 10-year age classes at ±5 years and ±10 years (Table 2) supports the use of the prediction intervals. The observation of such large errors is concordant with the study of Schwender and colleagues [21], who proposed an approach using 1 RMSE or 2 RMSE. Finally, when calculating the predication intervals from Jung and colleagues’ data, very close intervals are obtained: ±8.6 years, ±9.8 years and ±9.2 years.

4. Discussion

The estimation of an individual’s age from forensic samples is of major importance in the prediction of externally visible characteristics for providing intelligence from DNA and thus new leads to investigators. Over the past few years, several age-estimation models from DNA have been produced for this purpose. These models often use different techniques and different CpG markers. Moreover, they are developed for a particular sample type, e.g., blood, thanks to tissue-specific methylation rates. The aim of the present study was to test and adapt Jung and colleagues’ model to in-house analytical conditions in order to be able to predict age from several sample types.
Using pyrosequencing instead of SNaPshot, the PCR and pyrosequencing primers had to be adapted. This led us to the use of primers from two models [10,11] and a different amplification condition for the FHL2 target thanks to trueness issues in the methylation rate determination. Following workflow optimization, the sensitivity was assessed. The final selected DNA quantity for bisulfite conversion was 75 ng. This corresponds to a sample presenting a 2 ng/µL concentration after DNA extraction, which is concordant with the DNA concentration found in casework samples [11,21]. This compromise was chosen while taking into account the precision of the DNA methylation measure and the applicability of the model to forensic samples. The sensitivity assessment was performed for the DNA quantity before bisulfite conversion, as it is the last step when a reliable quantity of DNA is available. In this analytical condition, the PCR amount of DNA has been estimated at 5 ng [14]. The repeatability experiment revealed a maximum standard deviation of 7% for the FHL2 and MIRB29B2C CpGs and a lower standard deviation for the other targets (<5%). This is thought to be directly linked to the quality of the amplification and pyrosequencing assays, which can be very different, depending on the target and its sequence.
Certain correlations of methylation rates to age were the same as those in the original study, while others differed, especially for the MIR29B2C target. This is partly explained by technical differences between the pyrosequencing and SNaPshot techniques [10]. Despite the different correlations that were obtained by using pyrosequencing, age predictions were performed, and good predictions were obtained, according to the MAE obtained for each model.
Despite the low MAE observed, the correct prediction rates were low at ±5 years, and the error dispersion obtained led us to the use of a 95% prediction interval. This interval was calculated to ±9 years for the saliva model and ±10 years for the other models. These intervals are concordant with the correct prediction rates at ±10 years. Such intervals reduce the value of the prediction for investigators but may be a better statistical indicator than the MAE, which could give a false idea of the precision of the prediction. An alternative could be to present the results using the MAE and the associated standard deviation or to use lower intervals (e.g., 90% or 80% prediction intervals).
In addition, the predictions do not present the same errors for each age class. Importantly, the linearity of the prediction model is lost for the youngest individuals, giving an overall underestimation of age despite low errors. On the other hand, the errors are largely increased for the oldest individuals, thus not satisfying the homoscedasticity hypothesis of the residues. A cutoff for the predictions should be applied for age-prediction models or different statistical indicators for the highest age predictions. Nevertheless, it is important to underline the lack of data for the oldest age classes, which could lead to an over- or underestimation of the prediction errors.
Finally, the Jung and colleagues’ models were able to be adapted to our analytical conditions even if technical modifications had to be carried out. The use of such models is still limited by the large quantity of DNA needed and the relatively large age-prediction errors. With the advantage of pyrosequencing being the accessibility to several CpGs in the sequence and its principal drawback being the impossibility of multiplexing, models using the massively parallel sequencing techniques could be the best solution. Interestingly, the enhanced age-prediction tool developed by the VISAGE consortium [24] proposes reliable age prediction using only 40 ng of DNA, with a low MAE, addressing the DNA-quantity issue by using a model built on massive parallel sequencing.

5. Conclusions

In forensic science, age evaluations, using DNA, are carried out by the analyses of multiple methylation markers that provide information on chronological age. The aim of our study was to show that samples from saliva from buccal swabs could be used to evaluate the CpG methylated domain as a good strategy for age prediction. The obtained results confirm that the DNA methylation status analyzed from saliva from a buccal swab could be used as an age predictor in forensic applications, using tissue-specific or multitissue models and a different analytical workflow. Nevertheless, the prediction precision still needs to be improved through the use of other sequencing techniques or the discovery of new CpG markers.

Supplementary Materials

The following supporting information can be downloaded at https://www.mdpi.com/article/10.3390/forensicsci3020015/s1, Figure S1: Methylation rate measure of each CpG site contained in the five targets for a 50% methylation standard and for Jung et al. and Cho et al. primer sets under different amplification conditions (T °C and [MgCl2]). When no data are displayed for a particular condition, the amplification failed or no sequencing data could be obtained, because of the low amplification of the target. Figure S2: Correlations of the methylation rate to the chronological age for ELOVL2, FHL2, KLF14, MIR29B2C and TRIM59 CpGs in buccal swabs and saliva samples. Pearson’s r and its associated p-value are given for each correlation. Figure S3: (A) Residue analysis for the saliva model from 0- to 88-year-old individuals (up) and 18- to 75-year-old individuals (down). (B) Residue analysis for the buccal swab model from 0- to 88-year-old individuals (up) and 18- to 75-year-old individuals (down). (C) Residue analysis for the multitissue model from 0- to 88-year-old individuals (up) and 18- to 75-year-old individuals (down).

Author Contributions

Conceptualization, A.P. (Alexandre Poussard) and J.-Y.C.; methodology, A.P. (Alexandre Poussard); software, validation, and formal analysis, A.P. (Alexandre Poussard), J.-Y.C., F.H., A.P. (Amaury Pussiau) and H.S.-S.; investigation and resources, A.P. (Amaury Pussiau) and H.S.-S.; data curation, A.P. (Alexandre Poussard) and H.S.-S.; writing—original draft preparation, A.P. (Alexandre Poussard), J.-Y.C., C.S., F.H. and A.P. (Amaury Pussiau); writing—review and editing, A.P. (Alexandre Poussard) and C.S.; visualization, F.H. and A.P. (Amaury Pussiau); supervision, S.H.; project administration, S.H. All authors have read and agreed to the published version of the manuscript.

Funding

This research received no external funding.

Institutional Review Board Statement

Not applicable.

Informed Consent Statement

Informed consent was obtained from all subjects involved in the study.

Data Availability Statement

Not applicable.

Acknowledgments

The authors thank Frank Di Giacomo for his expert contribution to the English review during the preparation of this article.

Conflicts of Interest

The authors declare no conflict of interest.

References

  1. Parson, W. Age Estimation with DNA: From Forensic DNA Fingerprinting to Forensic (Epi)Genomics: A Mini-Review. Gerontology 2018, 64, 326–332. [Google Scholar] [CrossRef] [PubMed]
  2. Thiburce, N.; Nolot, F.; Pussiau, A.; Guyomarc’h, P.; Mazevet, M. Forensic Science and “The Duty of Memory”: The Face of Verdun. J. Forensic Identif. 2020, 70, 1–15. [Google Scholar]
  3. Vidaki, A.; Kayser, M. Recent progress, methods and perspectives in forensic epigenetics. Forensic Sci. Int. Genet. 2018, 37, 180–195. [Google Scholar] [CrossRef]
  4. Kader, F.; Ghai, M. DNA methylation and application in forensic sciences. Forensic Sci. Int. 2015, 249, 255–265. [Google Scholar] [CrossRef]
  5. Zubakov, D.; Liu, F.; Kokmeijer, I.; Choi, Y.; van Meurs, J.; van IJcken, W.; Uitterlinden, A.; Hofman, A.; Broer, L.; van Duijn, C.; et al. Human age estimation from blood using mRNA, DNA methylation, DNA rearrangement, and telomere length. Forensic Sci. Int. Genet. 2016, 24, 33–43. [Google Scholar] [CrossRef] [PubMed]
  6. Horvath, S. DNA methylation age of human tissues and cell types. Genome Biol. 2013, 14, R115. [Google Scholar] [CrossRef] [PubMed] [Green Version]
  7. Naue, J.; Hoefsloot, H.; Kloosterman, A.; Verschure, P. Forensic DNA methylation profiling from minimal traces: How low can we go? Forensic Sci. Int. Genet. 2018, 33, 17–23. [Google Scholar] [CrossRef]
  8. Eipel, M.; Mayer, F.; Arent, T.; Ferreira, M.; Birkhofer, C.; Gerstenmaier, U.; Costa, I.; Ritz-Timme, S.; Wagner, W. Epigenetic age predictions based on buccal swabs are more precise in combination with cell type-specific DNA methylation signatures. Aging 2016, 8, 1034–1048. [Google Scholar] [CrossRef] [Green Version]
  9. Hong, S.R.; Jung, S.-E.; Lee, S.E.; Shin, K.-J.; Yang, W.H.; Lee, H.Y. DNA methylation-based age prediction from saliva: High age predictability by combination of 7 CpG markers. Forensic Sci. Int. Genet. 2017, 29, 118–125. [Google Scholar] [CrossRef]
  10. Jung, S.-E.; Lim, S.M.; Hong, S.R.; Lee, E.H.; Shin, K.-J.; Lee, H.Y. DNA methylation of the ELOVL2, FHL2, KLF14, C1orf132/MIR29B2C, and TRIM59 genes for age prediction from blood, saliva, and buccal swab samples. Forensic Sci. Int. Genet. 2019, 38, 1–8. [Google Scholar] [CrossRef]
  11. Cho, S.; Jung, S.-E.; Hong, S.R.; Lee, E.H.; Lee, J.H.; Lee, S.D.; Lee, H.Y. Independent validation of DNA-based approaches for age prediction in blood. Forensic Sci. Int. Genet. 2017, 29, 250–256. [Google Scholar] [CrossRef] [PubMed]
  12. Zbieć-Piekarska, R.; Spólnicka, M.; Kupiec, T.; Parys-Proszek, A.; Makowska, Ż.; Pałeczka, A.; Kucharczyk, K.; Płoski, R.; Branicki, W. Development of a forensically useful age prediction method based on DNA methylation analysis. Forensic Sci. Int. Genet. 2015, 17, 173–179. [Google Scholar] [CrossRef] [PubMed]
  13. Hong, S.R.; Shin, K.-J.; Jung, S.-E.; Lee, E.H.; Lee, H.Y. Platform-independent models for age prediction using DNA methylation data. Forensic Sci. Int. Genet. 2019, 38, 39–47. [Google Scholar] [CrossRef]
  14. Kint, S.; De Spiegelaere, W.; De Kesel, J.; Vandekerckhove, L.; Van Criekinge, W. Evaluation of bisulfite kits for DNA methylation profiling in terms of DNA fragmentation and DNA recovery using digital PCR. PLoS ONE 2018, 13, e0199091. [Google Scholar] [CrossRef] [Green Version]
  15. Tost, J.; Gut, I.G. DNA methylation analysis by pyrosequencing. Nat. Protoc. 2007, 2, 2265–2275. [Google Scholar] [CrossRef] [PubMed]
  16. Candiloro, I.L.M.; Mikeska, T.; Dobrovic, A. Assessing alternative base substitutions at primer CpG sites to optimise unbiased PCR amplification of methylated sequences. Clin. Epigenet. 2017, 9, 31. [Google Scholar] [CrossRef]
  17. Wojdacz, T.K.; Borgbo, T.; Hansen, L.L. Primer design versus PCR bias in methylation independent PCR amplifications. Epigenetics 2009, 4, 231–234. [Google Scholar] [CrossRef] [Green Version]
  18. Shen, L.; Guo, Y.; Chen, X.; Ahmed, S.; Issa, J.-P.J. Optimizing annealing temperature overcomes bias in bisulfite PCR methylation analysis. BioTechniques 2007, 42, 48–58. [Google Scholar] [CrossRef]
  19. Warnecke, P.M.; Stirzaker, C.; Melki, J.R.; Millar, D.S.; Paul, C.L.; Clark, S.J. Detection and measurement of PCR bias in quantitative methylation analysis of bisulphite-treated DNA. Nucleic Acids Res. 1997, 25, 4422–4426. [Google Scholar] [CrossRef] [Green Version]
  20. Heidegger, A.; Xavier, C.; Niederstätter, H.; de la Puente, M.; Pośpiech, E.; Pisarek, A.; Kayser, M.; Branicki, W.; Parson, W. Development and optimization of the VISAGE basic prototype tool for forensic age estimation. Forensic Sci. Int. Genet. 2020, 48, 102322. [Google Scholar] [CrossRef]
  21. Schwender, K.; Holländer, O.; Klopfleisch, S.; Eveslage, M.; Danzer, M.F.; Pfeiffer, H.; Vennemann, M. Development of two age estimation models for buccal swab samples based on 3 CpG sites analyzed with pyrosequencing and minisequencing. Forensic Sci. Int. Genet. 2021, 53, 102521. [Google Scholar] [CrossRef] [PubMed]
  22. Ciccarone, F.; Tagliatesta, S.; Caiafa, P.; Zampieri, M. DNA methylation dynamics in aging: How far are we from understanding the mechanisms? Mech. Ageing Dev. 2018, 174, 3–17. [Google Scholar] [CrossRef] [PubMed]
  23. Lee, K.W.K.; Pausova, Z. Cigarette smoking and DNA methylation. Front. Genet. 2013, 4, 1–11. [Google Scholar] [CrossRef] [PubMed] [Green Version]
  24. Woźniak, A.; Heidegger, A.; Piniewska-Róg, D.; Pośpiech, E.; Xavier, C.; Pisarek, A.; Kartasińska, E.; Boroń, M.; Freire-Aradas, A.; Wojtas, M.; et al. Development of the VISAGE enhanced tool and statistical models for epigenetic age estimation in blood, buccal cells and bones. Aging 2021, 13, 6459–6484. [Google Scholar] [CrossRef] [PubMed]
Figure 1. Standard deviation of the measured methylation rate of the CpG sites comprised in the five targets, for three replicates of 100%, 50% and 0% methylated DNA standards. In each case, measures were performed for four different DNA quantities from the conversion bisulfite step (300 ng, 150 ng, 75 ng, 37.5 ng).
Forensicsci 03 00015 g001
Figure 2. Mean methylation rate and standard deviation obtained for each sequenced CpG in the different targets for 12 replicates. Dark blue: ELOVL2, red: FHL2, light blue: TRIM59, green: KLF14, purple: MIR29B2C.
Forensicsci 03 00015 g002
Figure 3. Comparison of the methylation rate correlations between Jung and colleagues’ data (grey) and pyrosequencing generated data for each target. (A): Saliva samples (blue). (B): Buccal swab samples (red). Pearson’s r and associated p-value are given for each correlation.
Forensicsci 03 00015 g003
Figure 4. Age prediction for the saliva (blue) and buccal swab (red) samples using tissue-specific models (A,B) and the multitissue model (C). Perfect predictions are represented by the dashed red line. Vertical black lines represent the 18- and 70-year-old limits from the original model.
Forensicsci 03 00015 g004
Figure 5. Distribution of absolute errors (years) for each model per 10-year age classes.
Forensicsci 03 00015 g005
Table 1. Age marker and genomic location of the targeted CpG, primer sequences, reference, strand, amplicon size, final PCR MgCl2 concentration and sequence to analyze.
TargetCpG position (GRCh38)Primers (5′-->3′)
F: Forward
R: Reverse
S: Sequencing
B: Biotin
Ref.StrandAmp. Size (bp)[MgCl2] (mM)Sequence to analyze (5′-->3′):
Y, R: Analyzed CpG
Y, R: Other CpGs
T or A: Conversion Control
ELOVL2Chr6: 11044628F: AGGGGAGTAGGGTAAGTGAGG
R: B-AACCATTTCCCCCTAATATATACTTCA
S: GGGAGGAGATTTGTAGGTTT
(2)-3032.5AGTYGGYGTYGGTTTYGYGYGGYGGTTTAAYGTTTAYGGAGTTTTAG
FHL2Chr2: 105399282F: GGGTTTTGGGAGTATAGTAGT
R: B-AAAATAACCCCCTCCTCC
S: GTTTTGGGAGTATAGTAGTTAT
(1)+1911.5TYGGGAGYGTYGTTTTYGGYGTGGGTTTTYGGGYGYGAGTTT
KLF14Chr7: 130734355F: B-AGGTTGTTGTAATTTAGAAGTTT
R:
ATATTTAACAACCTCAAAAATTATCTTATC
S:
TTAACAACCTCAAAAATTATCTTATCTCC
(1)+1142.5RCRTTCTTTCTTCTACCRACRAACCAAATAATAATAACAAAAC
MIR29B2CChr1: 207823681F: B-GGGTTAYGTTATTAAGTTTTGAAG
R: TAAAACCAAATTCTAAAACATTC
S: AAACCAAAATTTAAATCTAC
(1)+1162.5RCAAACRACRATAAATAATCC
TRIM59Chr3: 160450189F: TATGGTATAGGTGGTTTGGGGGAGA
R: B-
ATAAAAAACACTACCCTCCACAACATAAC
S: TTGGGGGAGAGGTTG
(2)+1462.5GGTTTGGYGYGGGAYGAGGYGAAGYGTYGGTGGTYGAYGGTTTTT
Table 2. Correct prediction rates at ±5 and ±10 years for the three models, according to the sample types for 10-year age classes.
Age Class
ModelInterval0–10
n = 16
11–20
n = 15
21–30
n = 19
31–40
n = 18
41–50
n = 20
51–60
n = 15
61–70
n = 3
71–80
n = 6
81–90
n = 3
Saliva±5 y100%80%84%56%65%87%67%17%0%
±10 y100%100%100%94%85%93%100%67%0%
Buccal swab±5 y88%67%50%83%74%80%67%33%0%
±10 y100%100%94%100%100%100%67%83%33%
Multi-tissue-Saliva±5 y100%87%95%61%70%87%33%33%0%
±10 y100%100%100%94%90%93%100%50%0%
Multi-tissue-Buccal swab±5 y81%80%72%78%74%60%67%33%0%
±10 y94%100%94%100%100%93%67%50%0%
Disclaimer/Publisher’s Note: The statements, opinions and data contained in all publications are solely those of the individual author(s) and contributor(s) and not of MDPI and/or the editor(s). MDPI and/or the editor(s) disclaim responsibility for any injury to people or property resulting from any ideas, methods, instructions or products referred to in the content.

