
Experimental Investigation of the Vibration-Induced Heating of Polyetheretherketone for High-Frequency Applications
 ,
,  ,
,  and
and
Abstract
:1. Introduction
2. Materials and Methods
2.1. Specimen Preparation
2.2. Experimental Setup and Procedure
- 1.
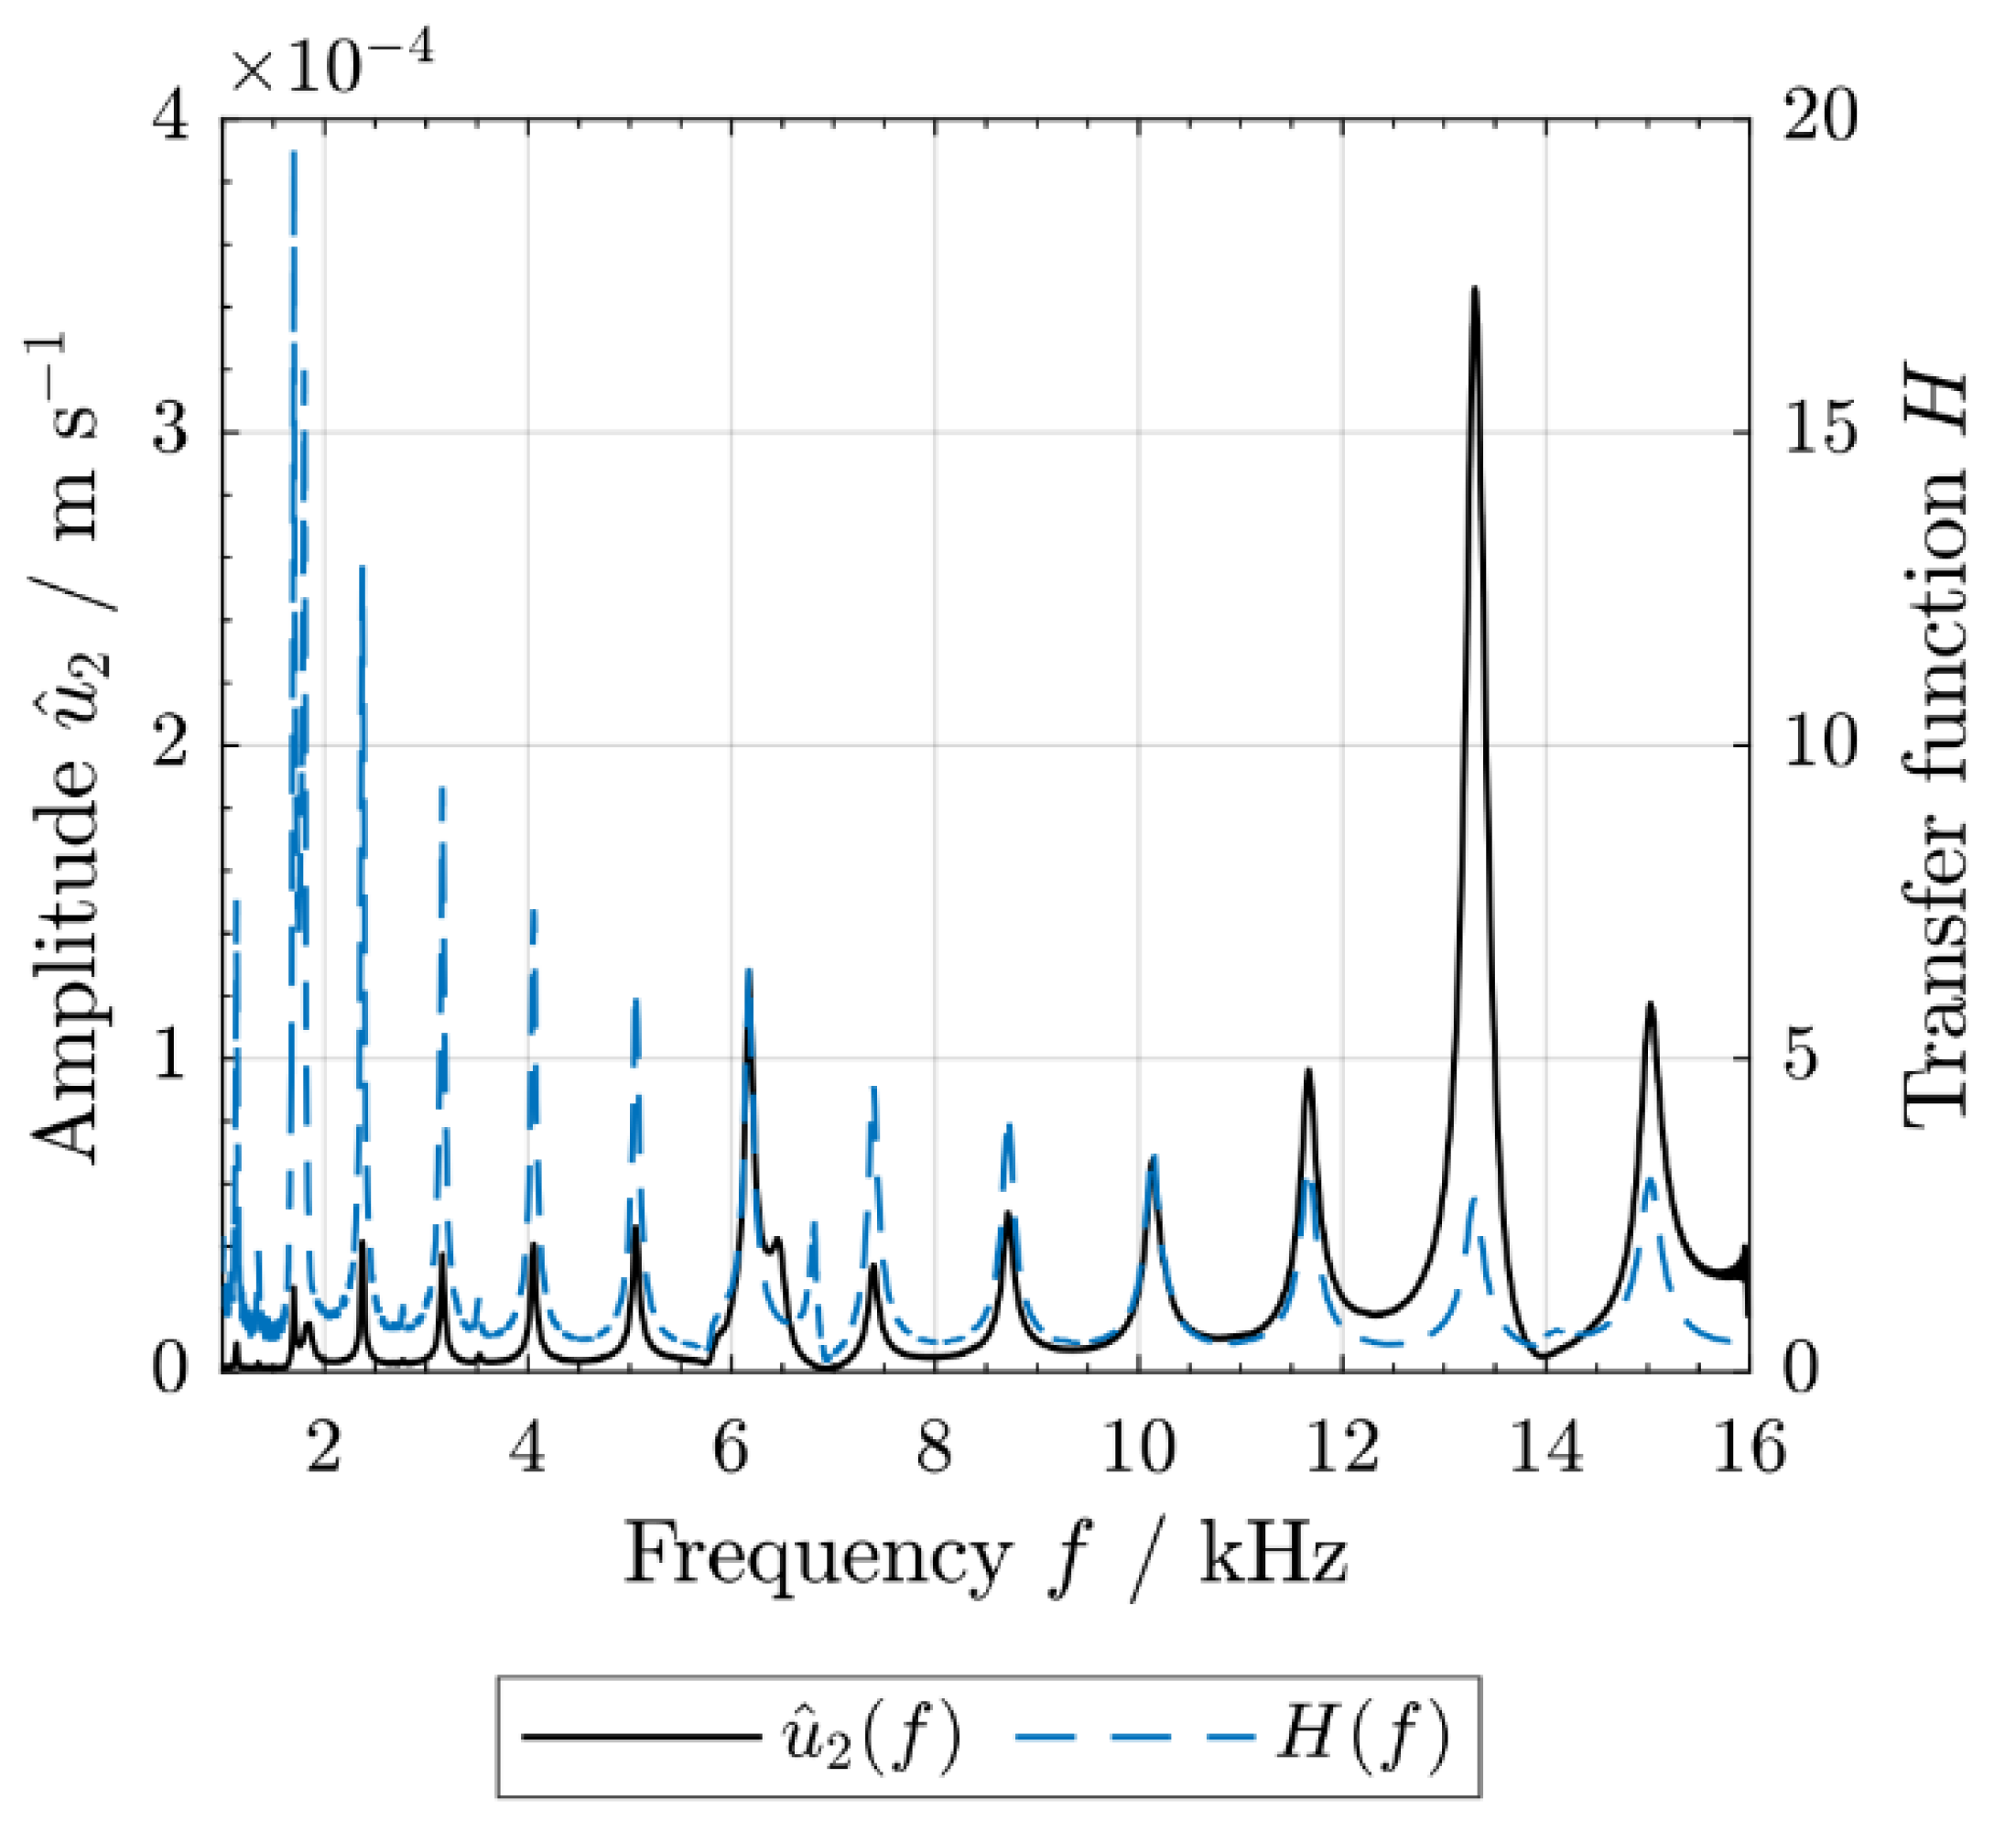
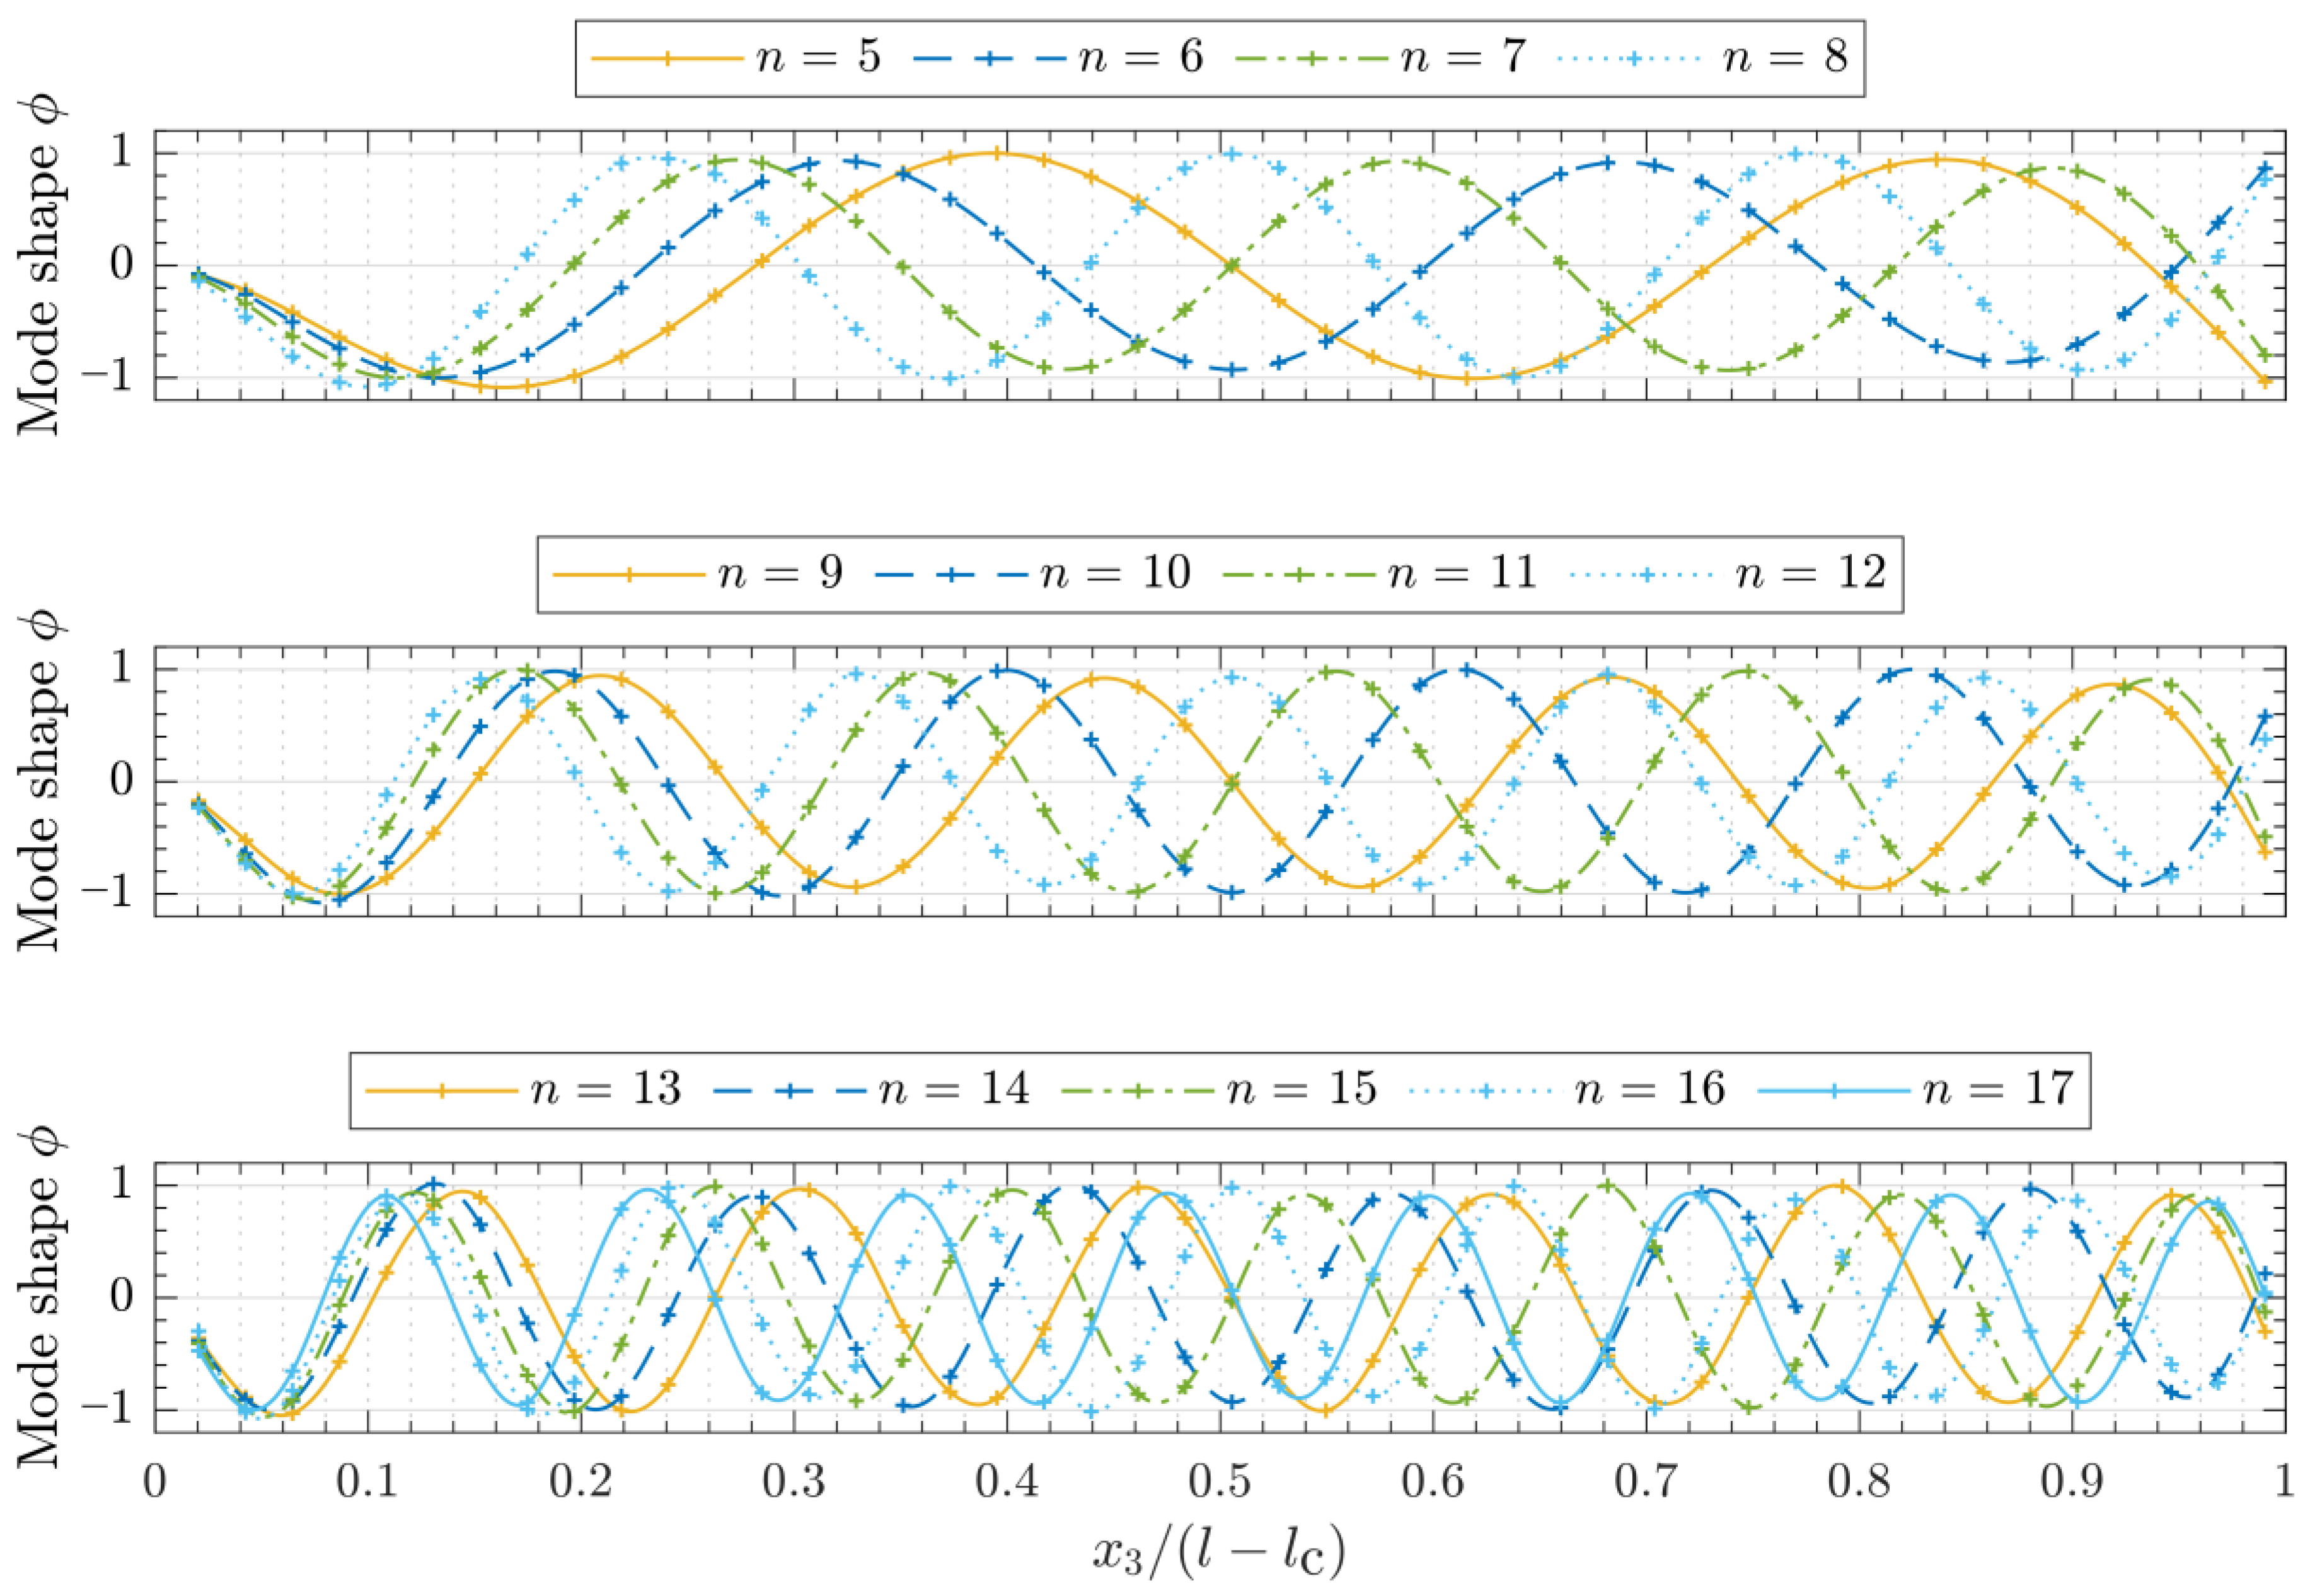
- For the beam’s vibrational behavior (natural frequencies , loss factors ), a voltage sweep according to Equation (2) with a duration of the sweep of = 12.8 s, a sampling frequency of 163.84 kHz, an initial sweep frequency of = 1 kHz, a final sweep frequency of = 16 kHz and a frequency resolution of 78.125 mHz was used as the actuator’s excitation signal . Fast Fourier transform (FFT) and a rectangular window function without filtering of the time signals were applied to obtain the average frequency spectrum and the transfer function , which represents the complex relationship between output signals and input signals as a function of frequency (Figure 2). Using this transfer function, the natural frequencies as well as the loss factors were determined. The loss factors were calculated by means of the half-power bandwidth method, where , and are the 3 dB bandwidth, the associated resonance frequency (see, e.g., [56]) and the corresponding mode shapes (see Figure 3), respectively.
- 2.
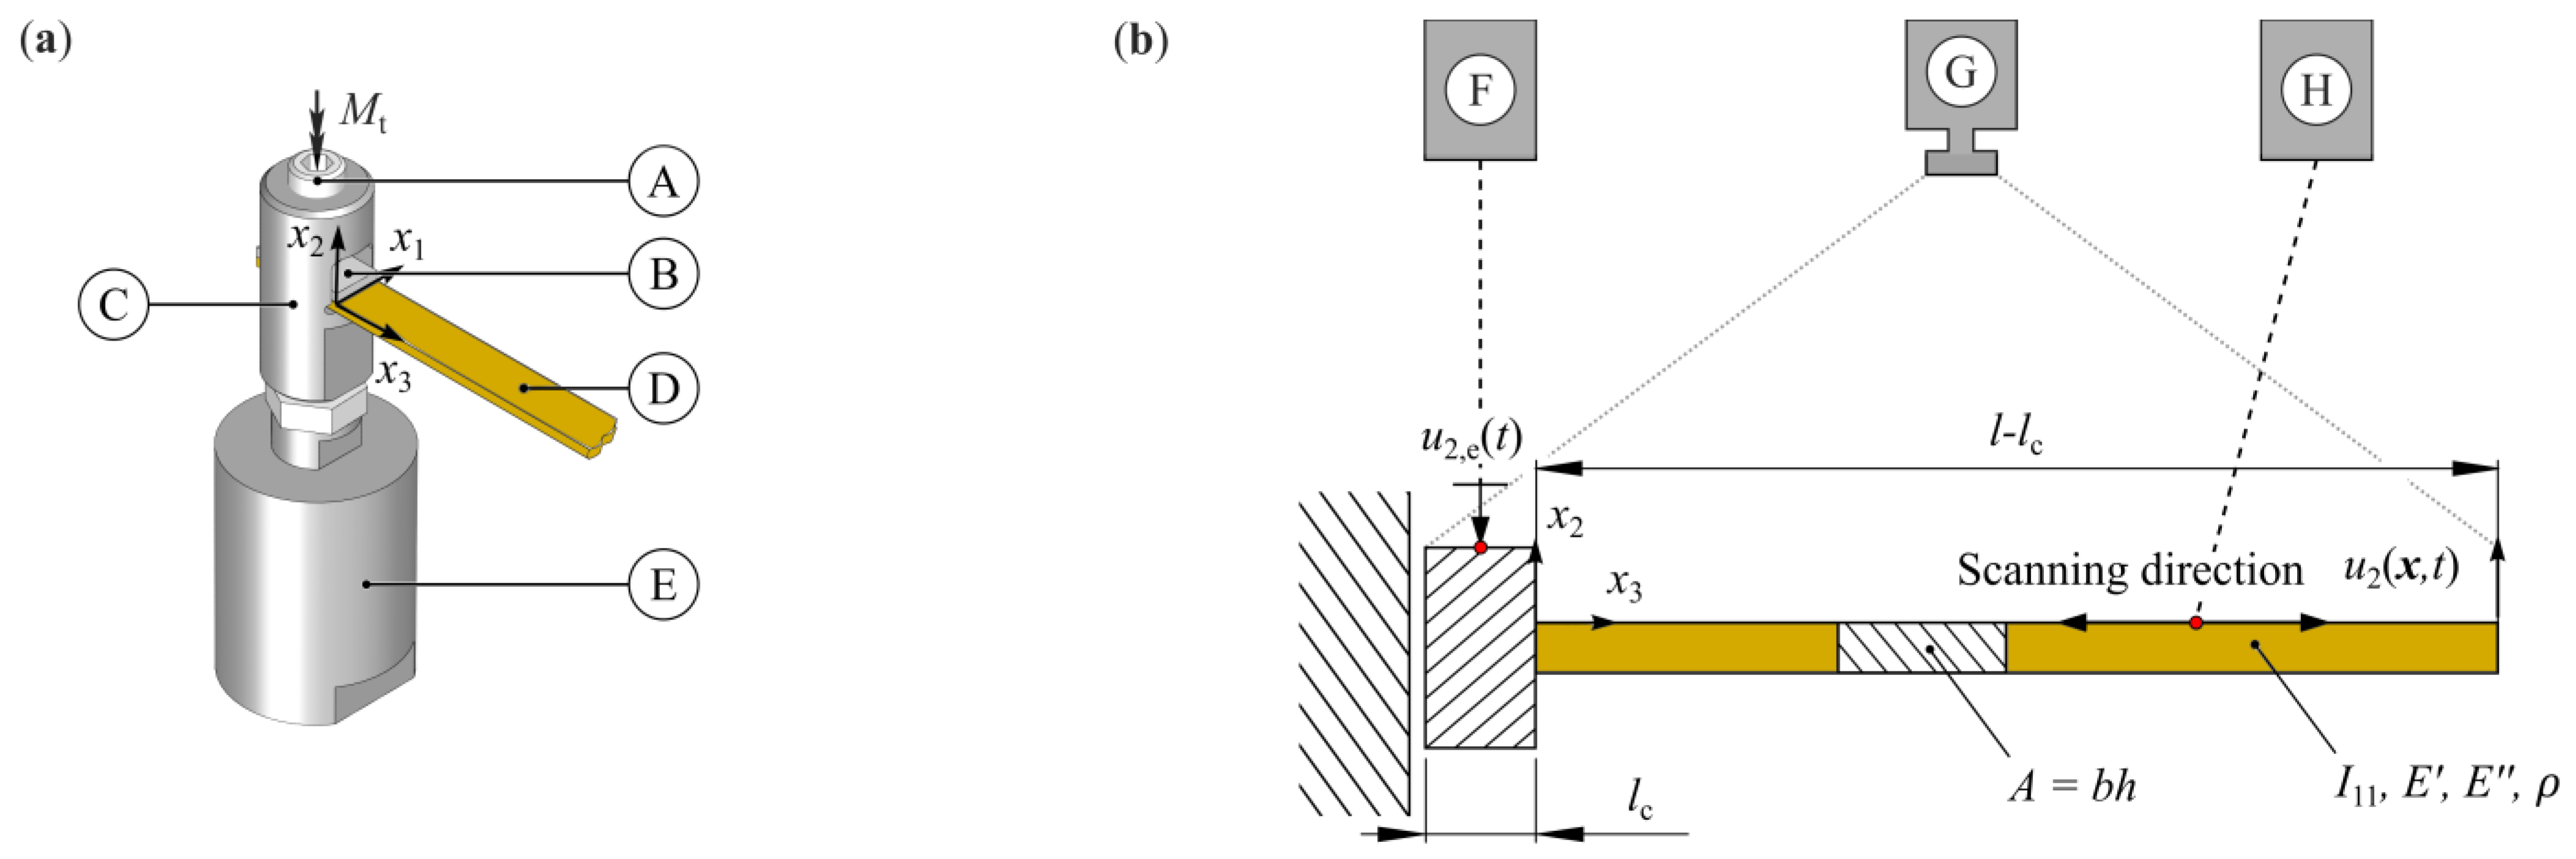
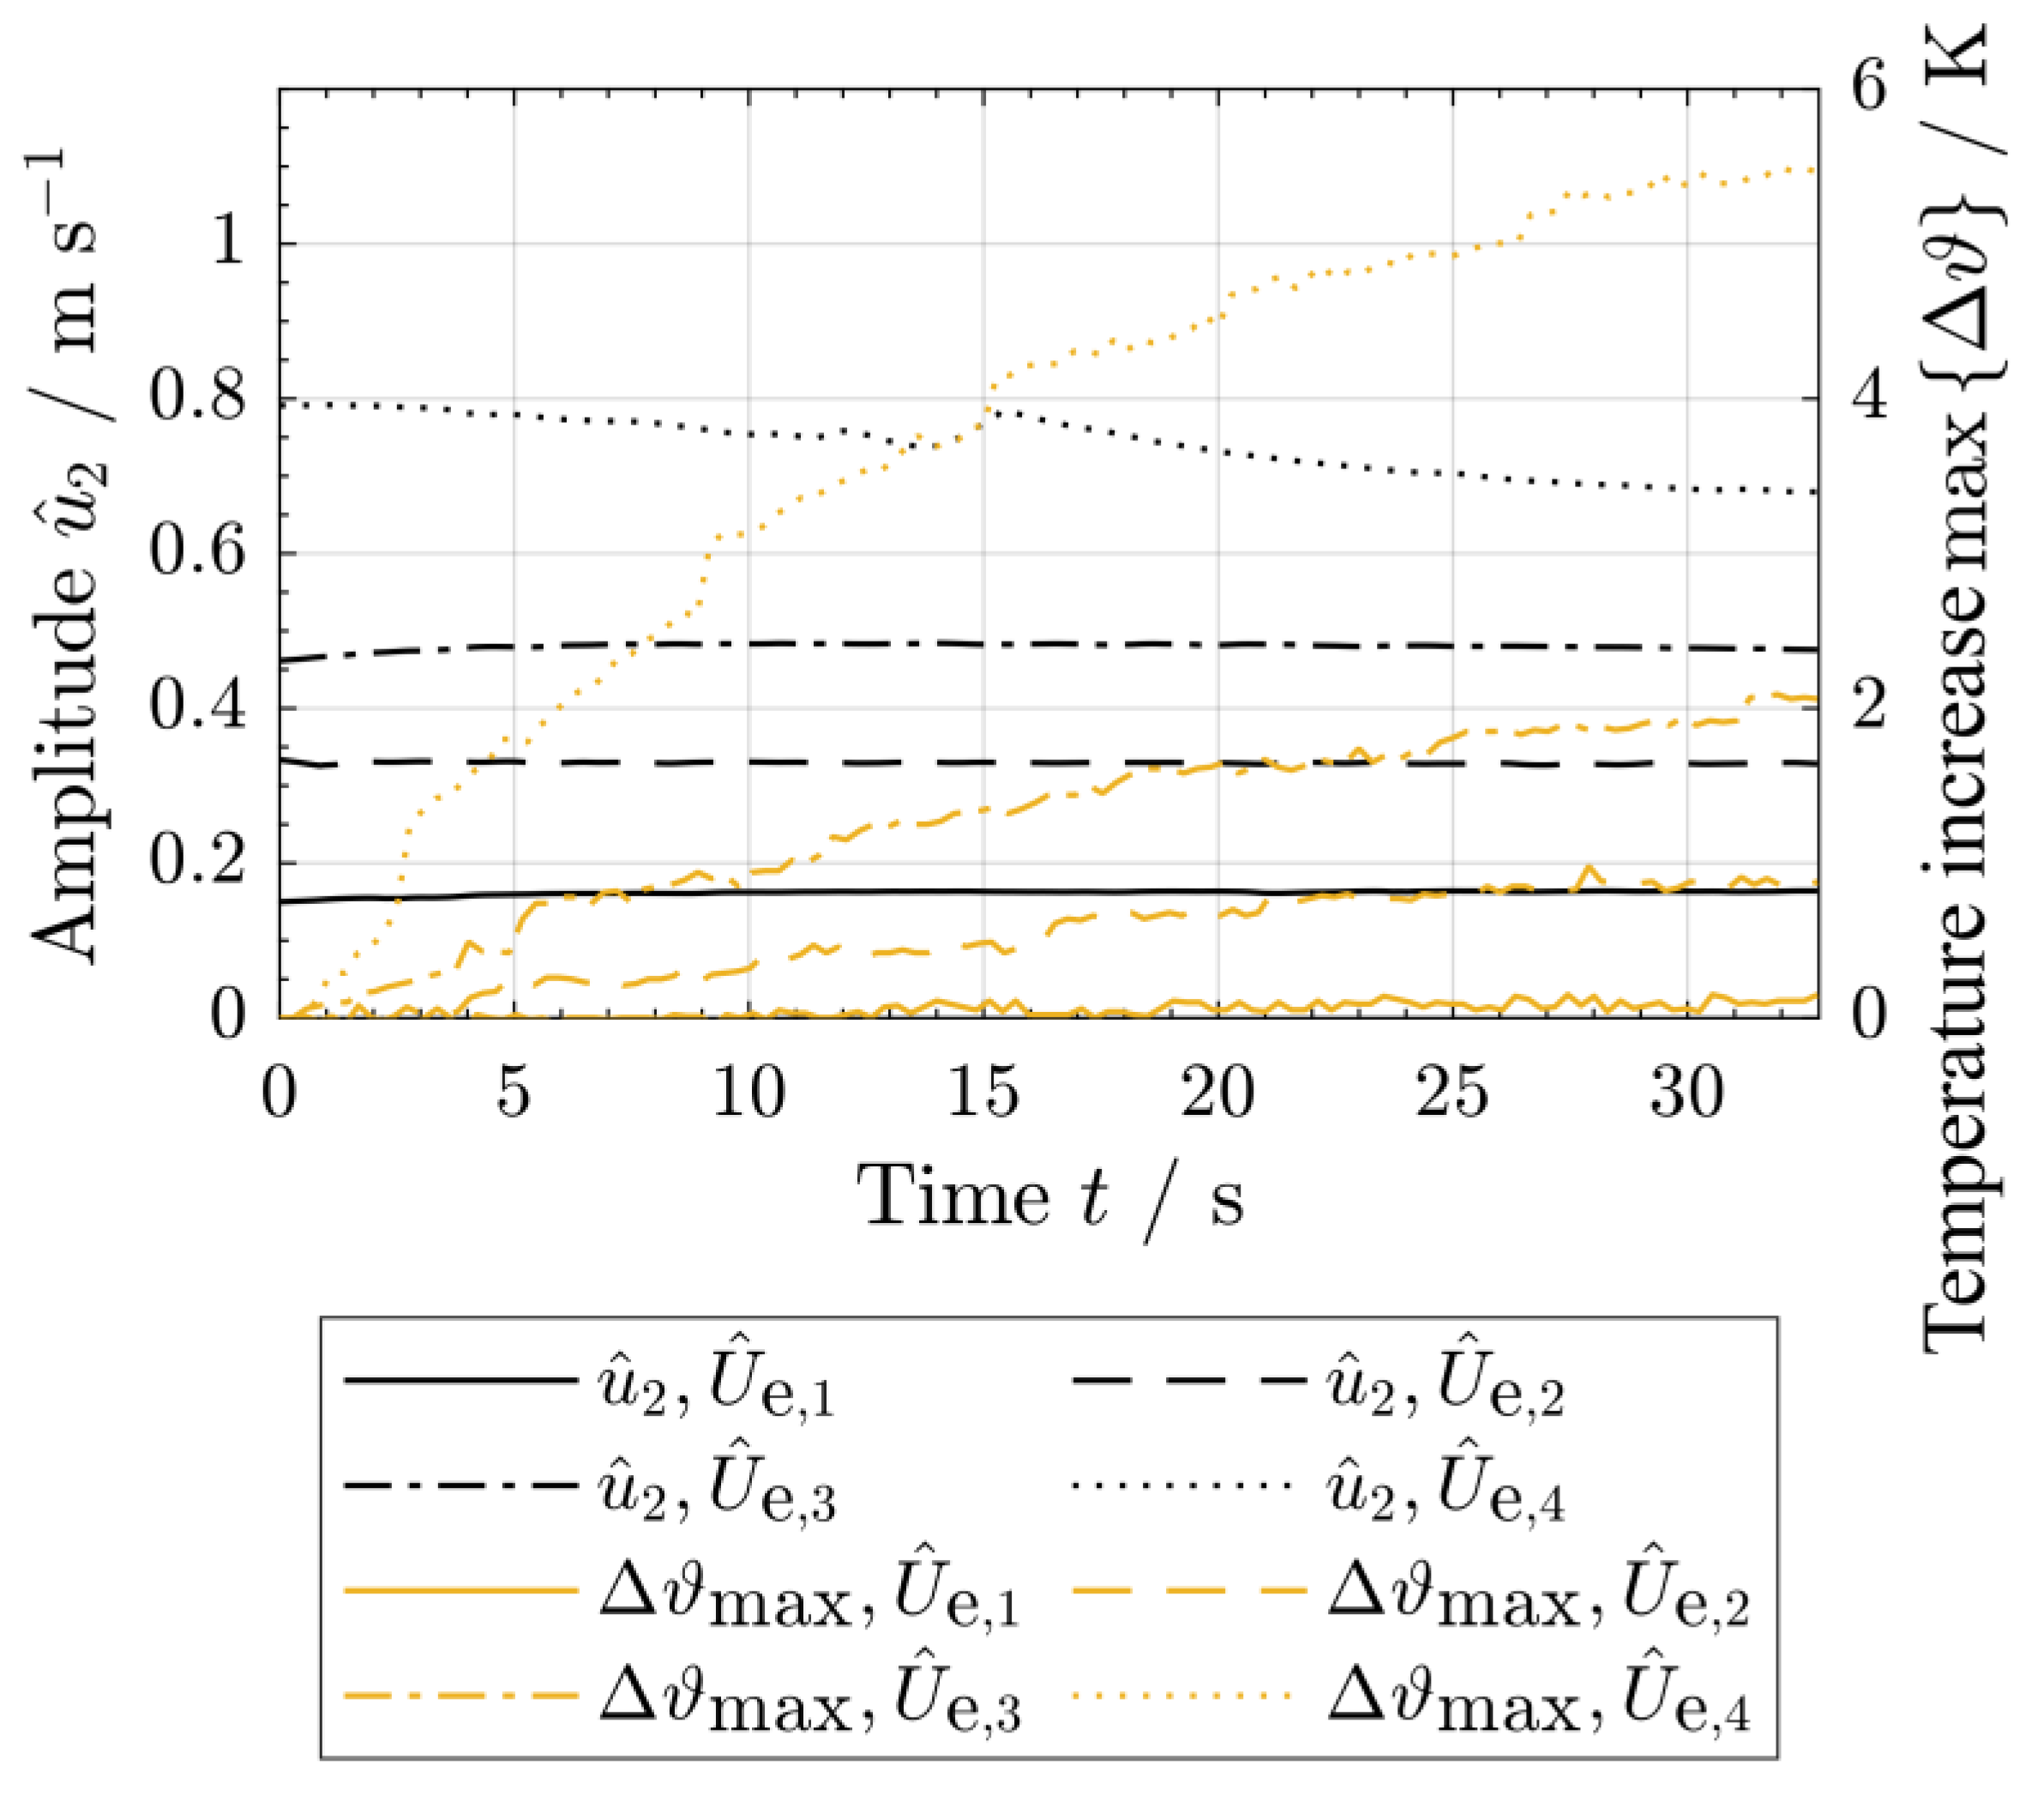
- To quantify changes in mechanical and the related thermal phenomena, the resulting temperature increase of the whole specimen and the change in the velocity amplitude at the position = [2.5 mm, 0, 4.7 mm] (sampling frequency 128 kHz, frequency resolution 7.8 mHz) were measured for different input voltage amplitudes of in the range between 11 V and 54 V (Figure 4). Therefore, the specimen was sinusoidally excited with a voltage signal as shown in Equation (1) and the natural frequencies were chosen for excitation so that the relationship was fulfilled.
- 3.
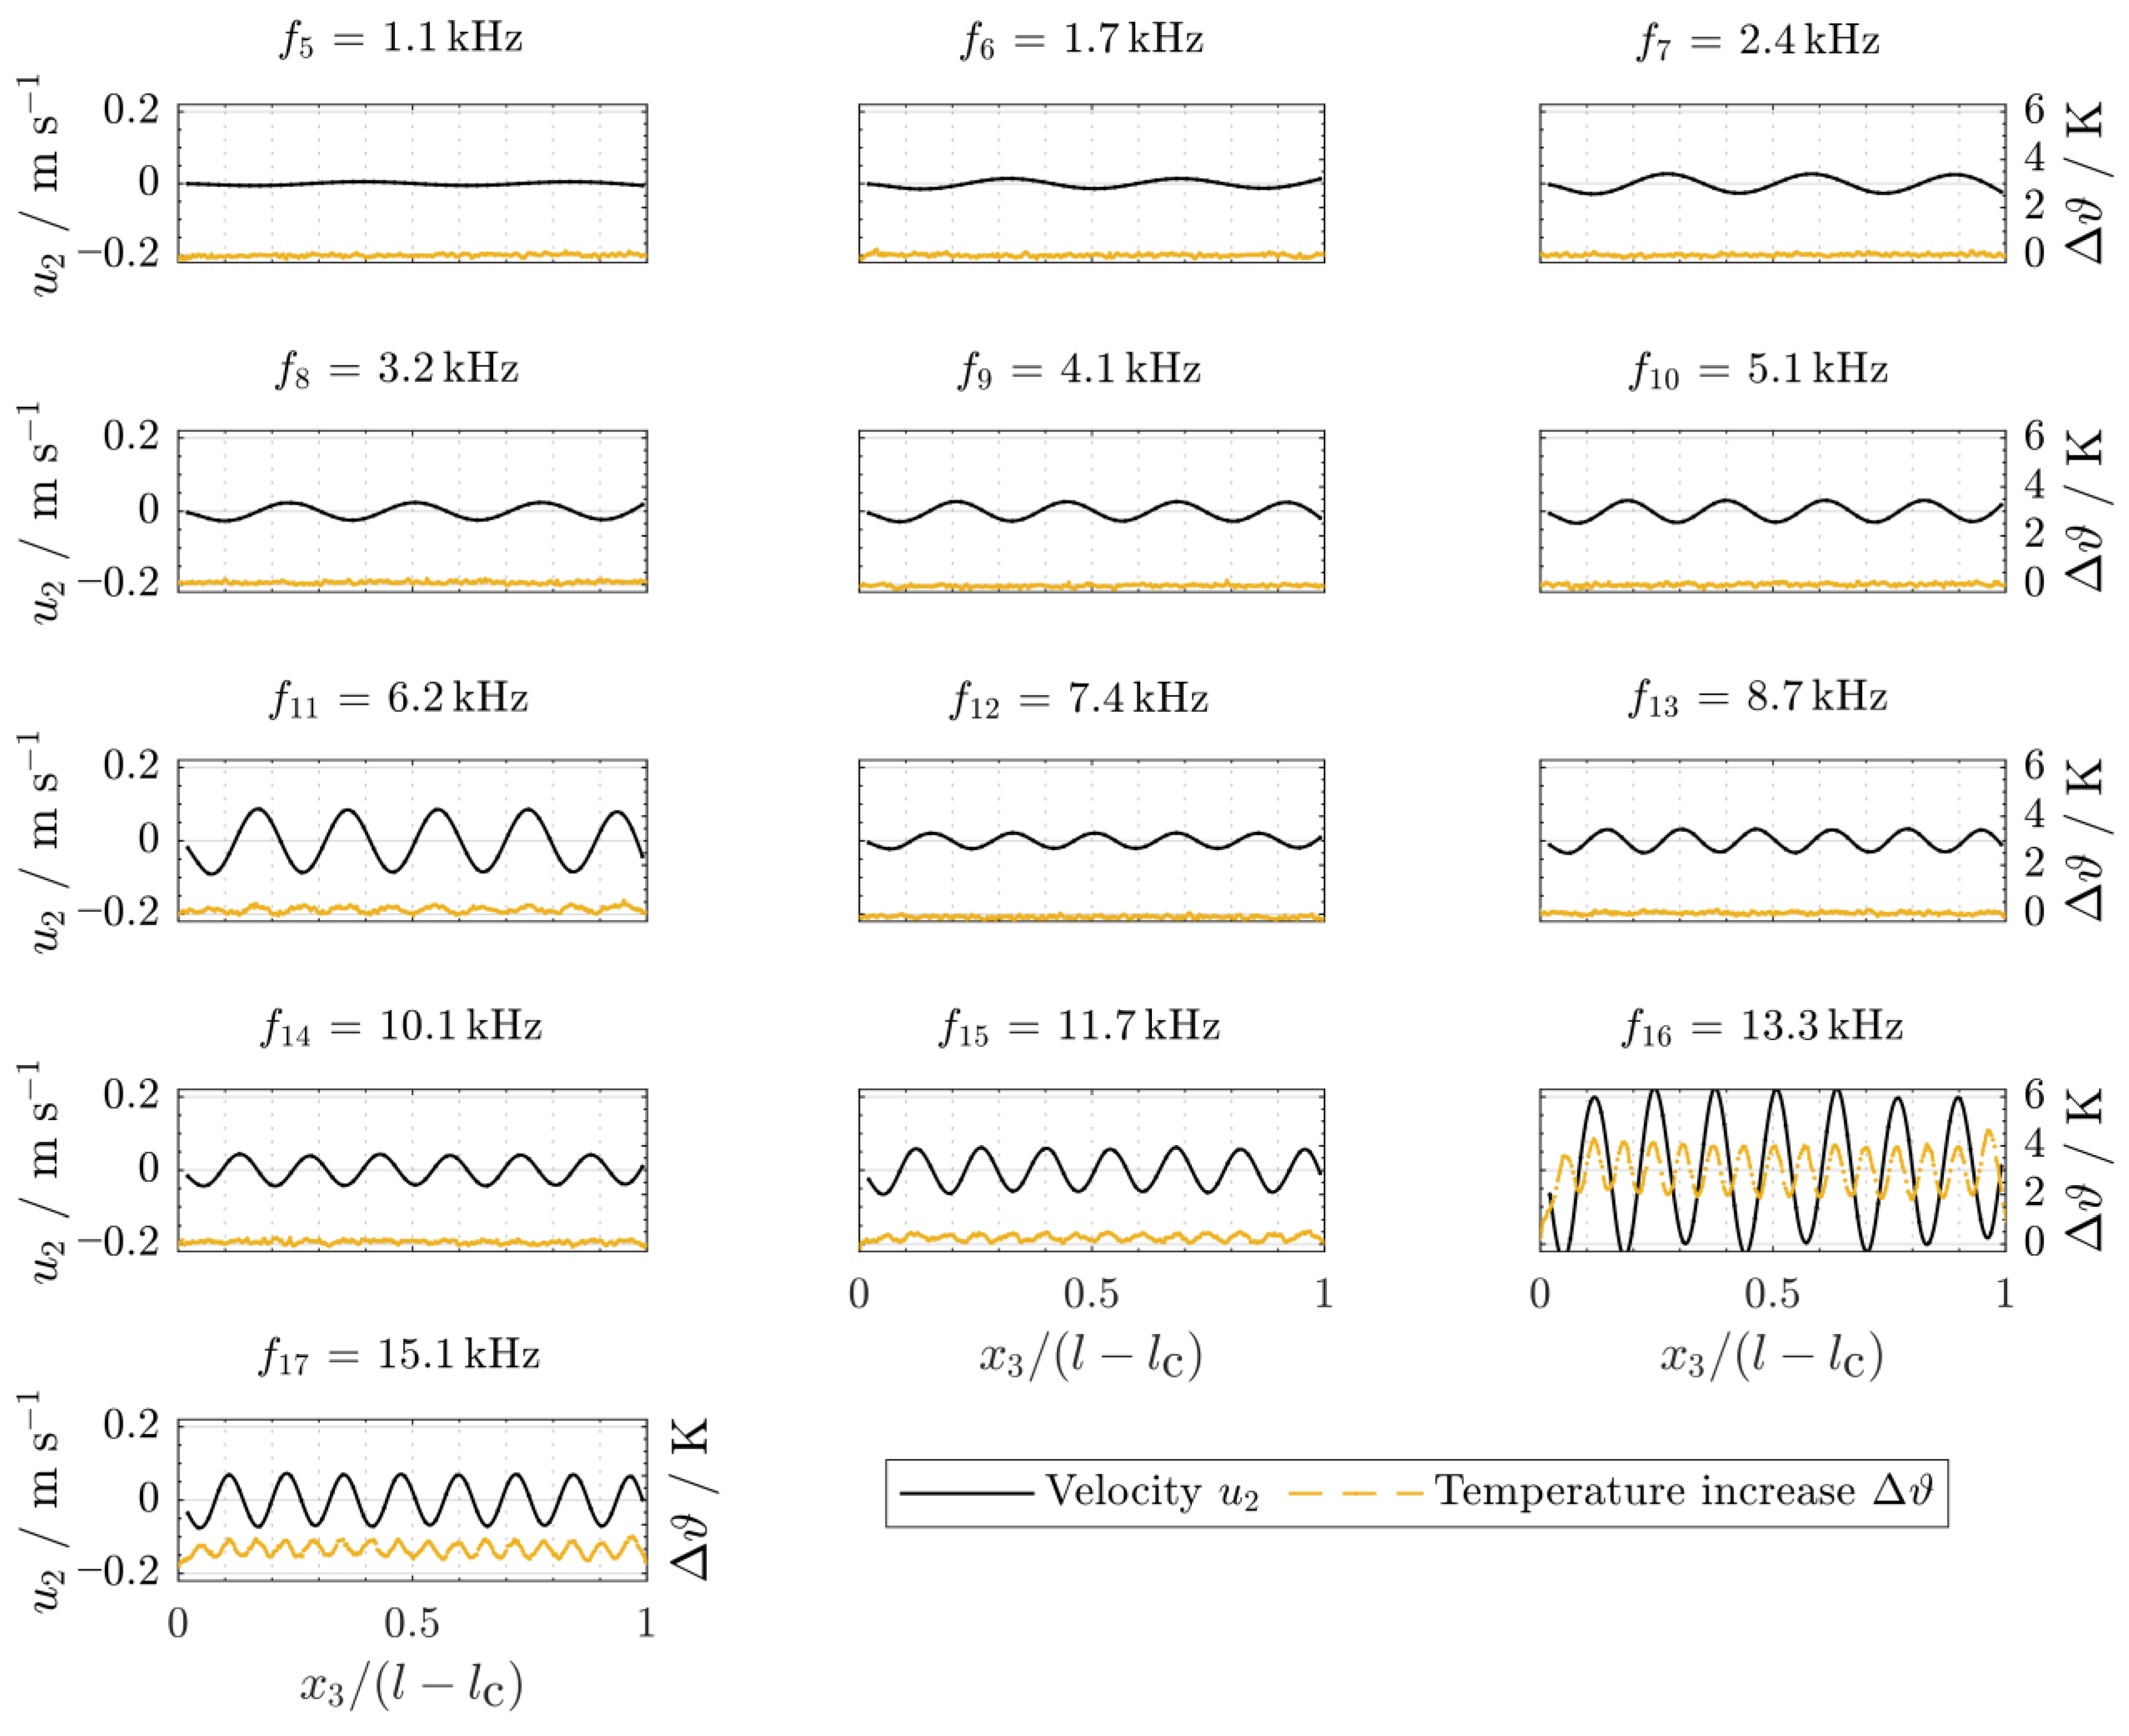
- The mode shapes (see Figure 3) and the beam’s real physical velocity distribution were determined by means of additional measurements with a mono-frequent sinusoidal voltage signal according to Equation (1) at the given natural frequencies . Therefore, a sinusoidal excitation with an input voltage amplitude of = 11 V was carried out with a sampling frequency of 128 kHz, a frequency resolution of 7.8 mHz and a measuring time of 512 ms.
- 4.
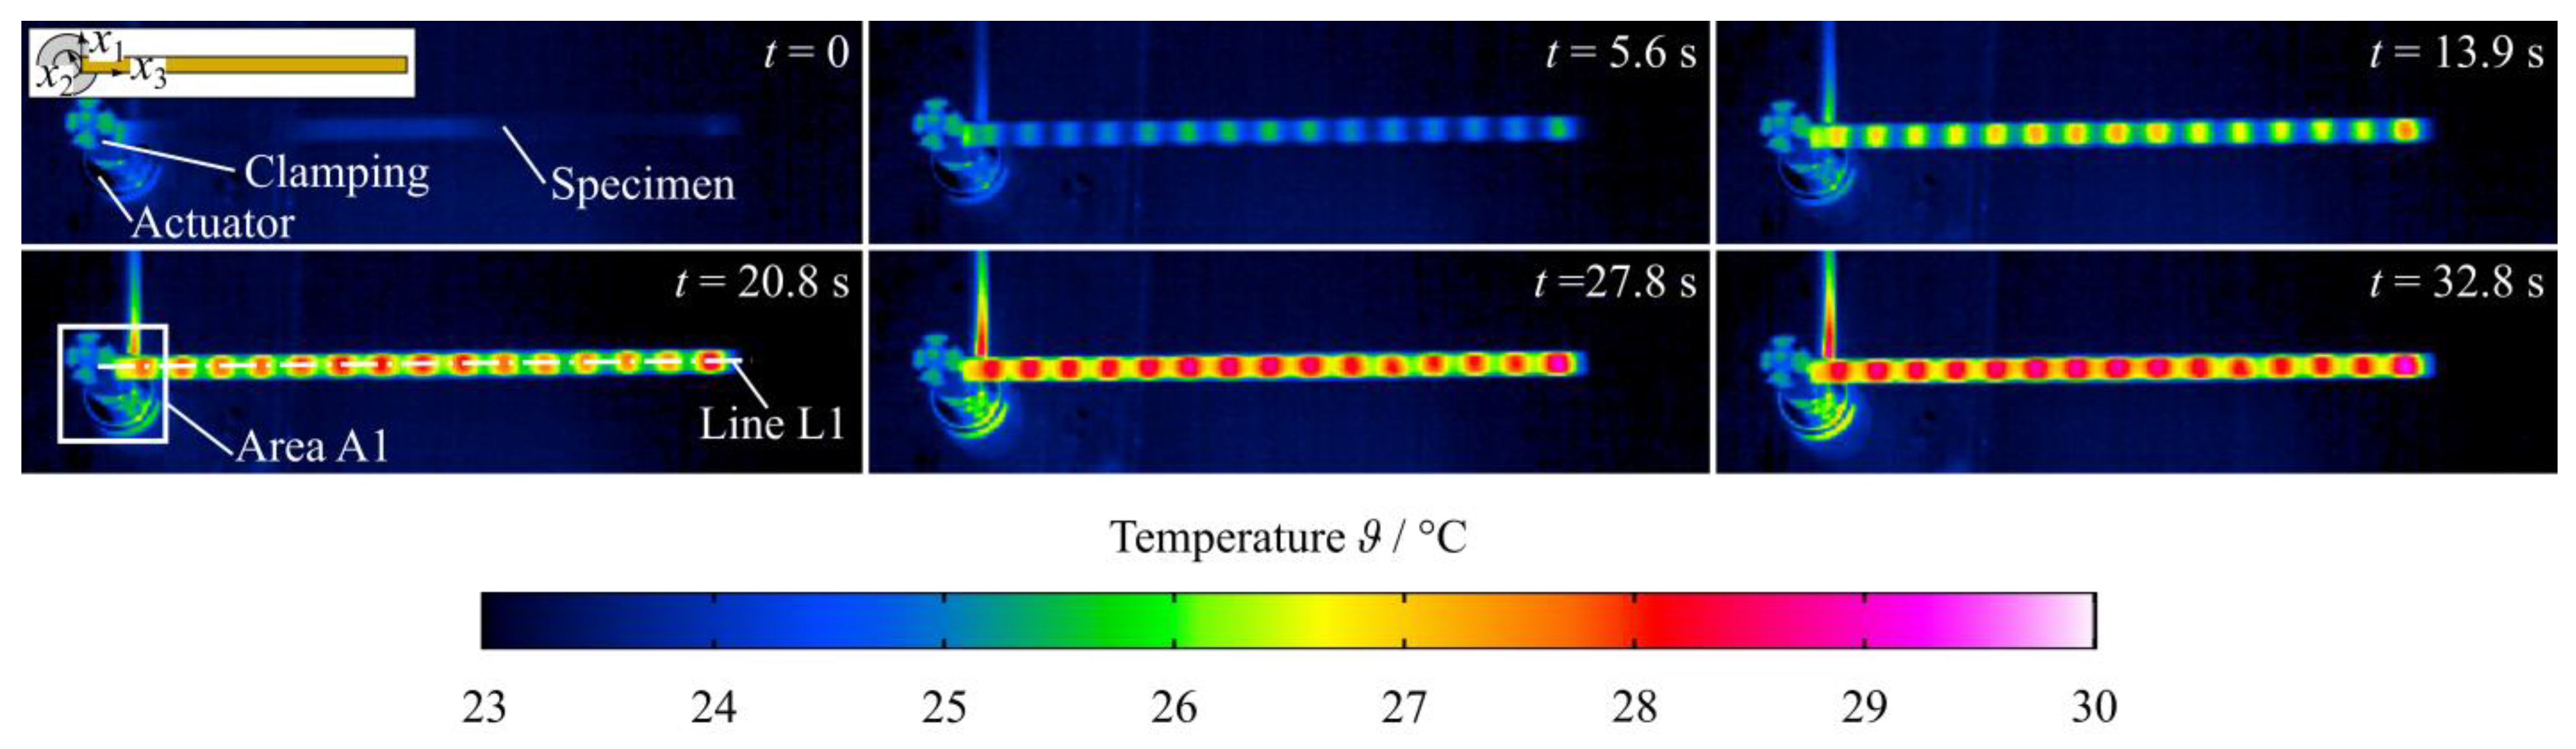
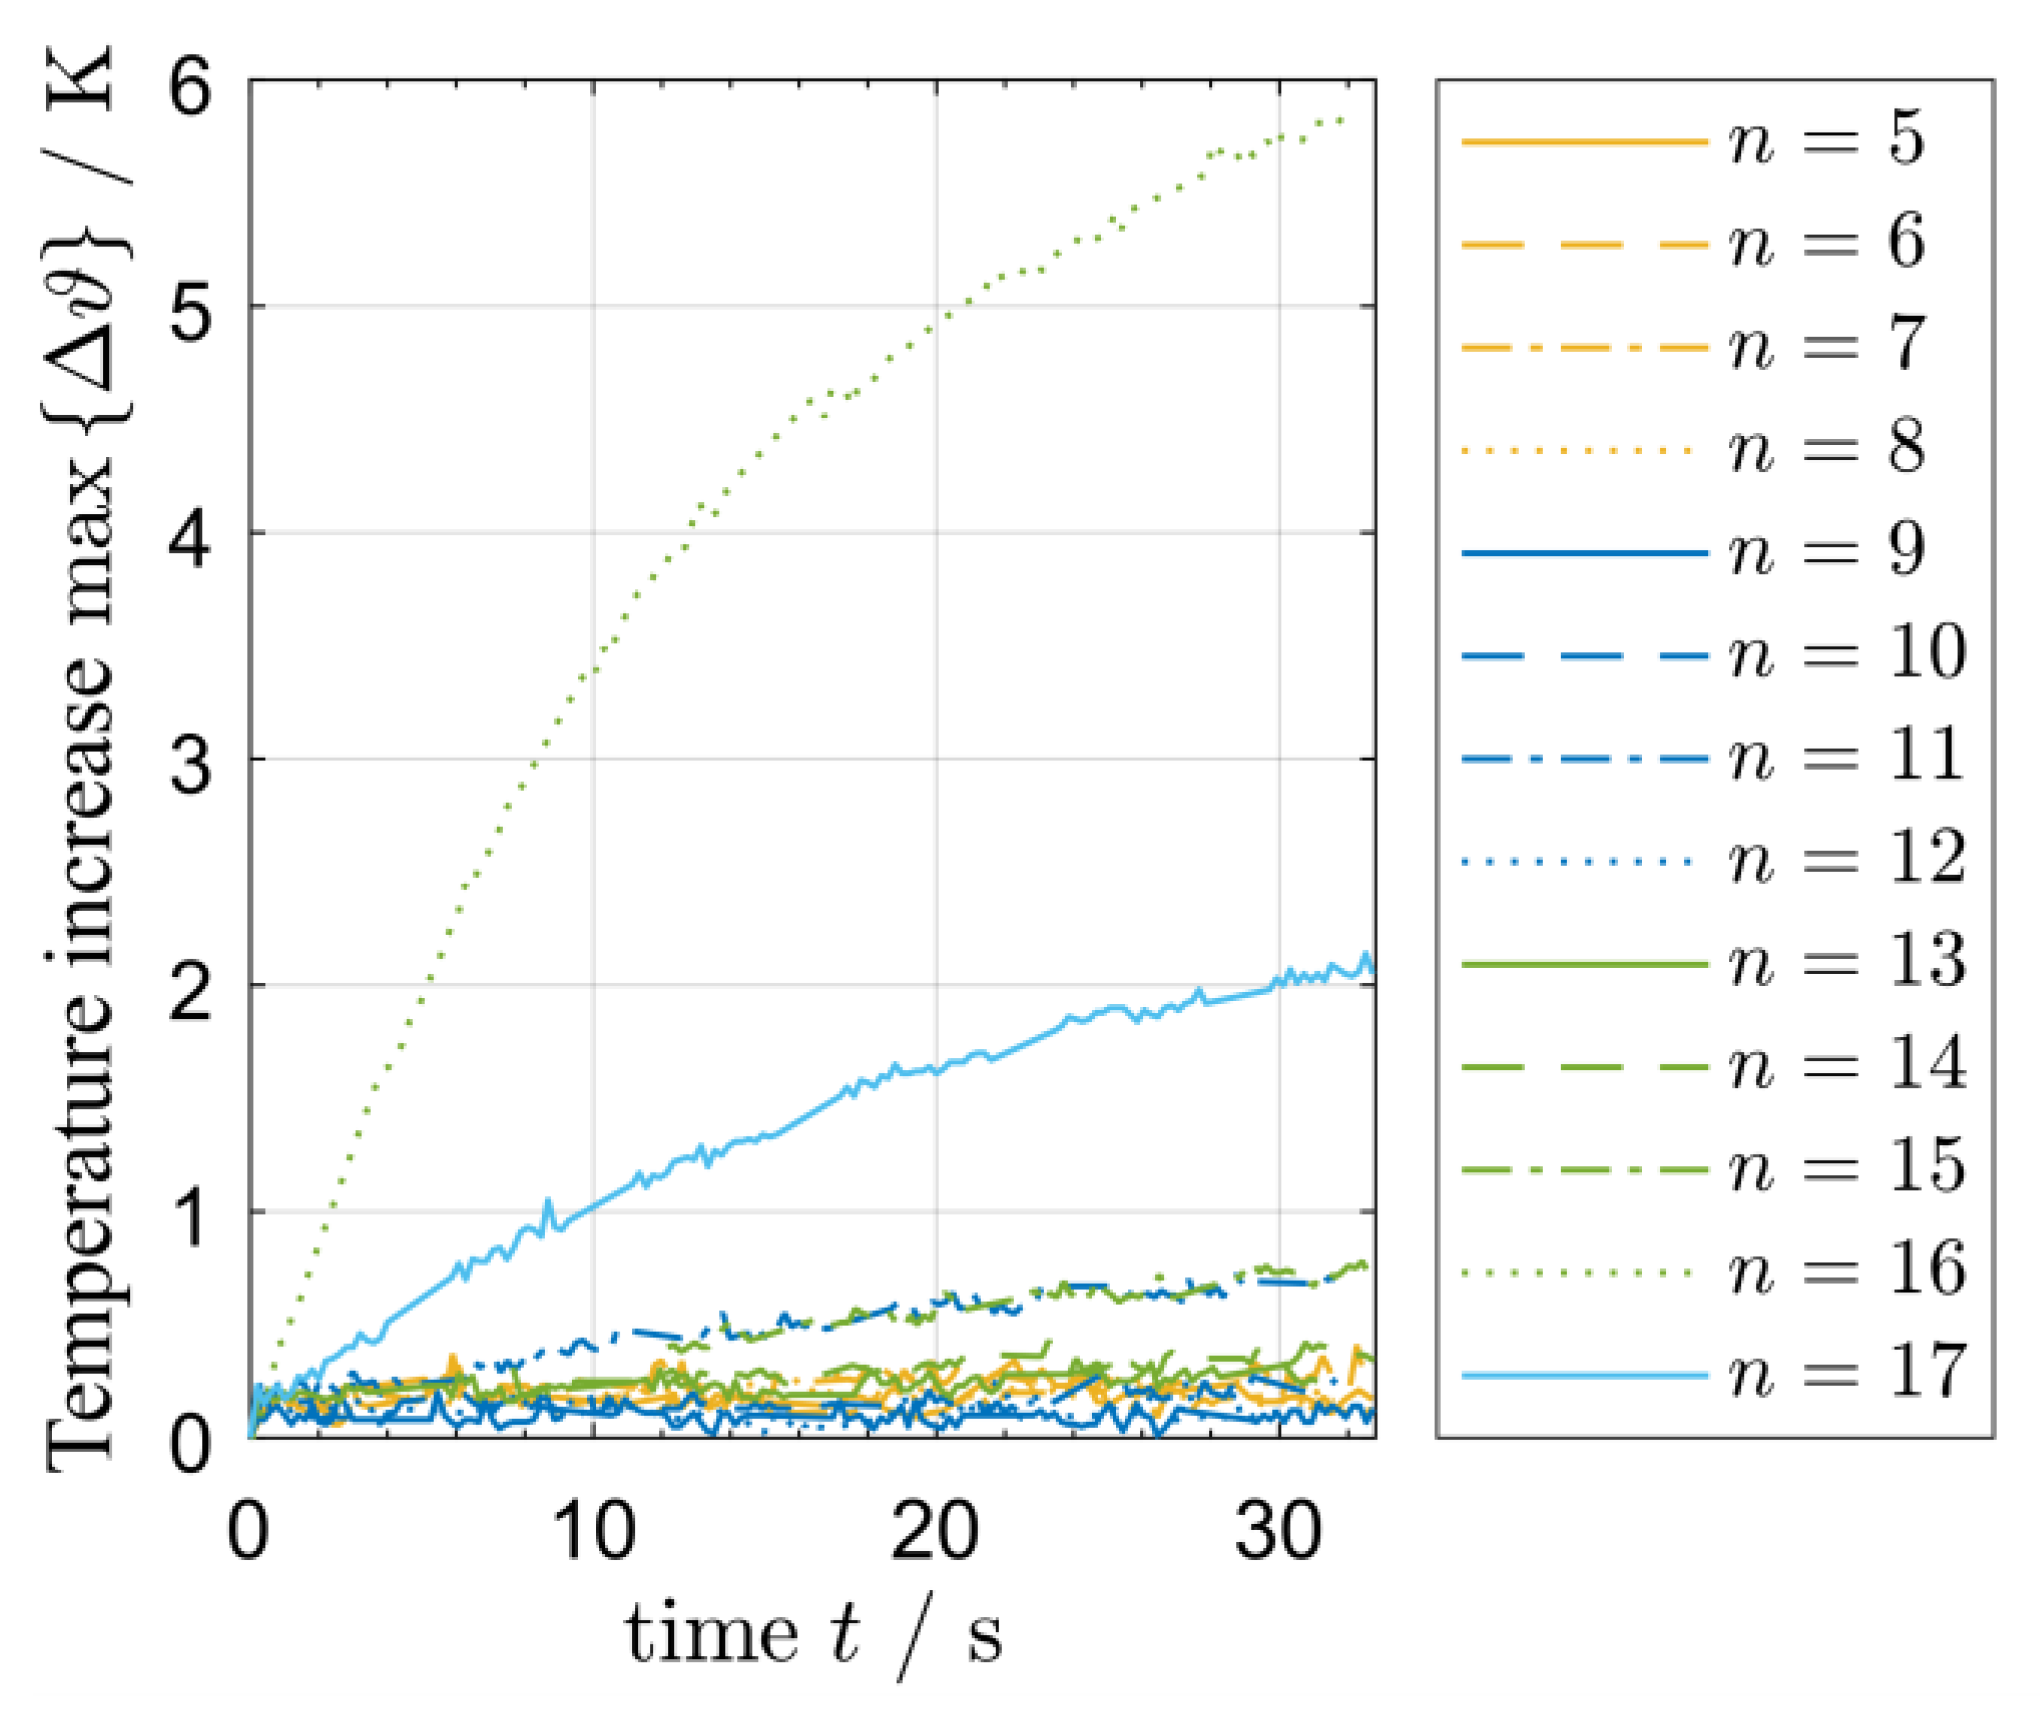
- Additional measurements of the temperature increase for a duration of = 32.8 s and the different natural frequencies were performed using an input voltage amplitude of = 54 V. Due to the application of the highest investigated voltage amplitude , sufficient heating should be generated.


3. Results and Discussion
3.1. Vibration Characteristic
3.2. Influence of Excitation Amplitude on Temperature Increase
3.3. Resulting Temperature Distribution and its Correlation with Vibrational Mode Shapes
3.4. Implications for the Design of Dynamically Loaded PEEK Structures
3.5. Limitations of the Experimental Approach
4. Conclusions
Author Contributions
Funding
Data Availability Statement
Conflicts of Interest
References
- Seyyed Monfared Zanjani, J.; Saner Okan, B.; Pappas, P.-N.; Galiotis, C.; Menceloglu, Y.Z.; Yildiz, M. Tailoring viscoelastic response, self-heating and deicing properties of carbon-fiber reinforced epoxy composites by graphene modification. Compos. Part A Appl. Sci. Manuf. 2018, 106, 1–10. [Google Scholar] [CrossRef]
- Kucher, M.; Dannemann, M.; Böhm, R.; Modler, N. An Experimental Approach for the Determination of the Mechanical Properties of Base-Excited Polymeric Specimens at Higher Frequency Modes. Vibration 2022, 5, 429–441. [Google Scholar] [CrossRef]
- Berer, M.; Major, Z.; Pinter, G.; Constantinescu, D.M.; Marsavina, L. Investigation of the dynamic mechanical behavior of polyetheretherketone (PEEK) in the high stress tensile regime. Mech. Time-Depend. Mater. 2014, 18, 663–684. [Google Scholar] [CrossRef]
- Lu, S.X.; Cebe, P.; Capel, M. Thermal stability and thermal expansion studies of PEEK and related polyimides. Polymer 1996, 37, 2999–3009. [Google Scholar] [CrossRef]
- Zhang, G.; Li, W.-Y.; Cherigui, M.; Zhang, C.; Liao, H.; Bordes, J.-M.; Coddet, C. Structures and tribological performances of PEEK (poly-ether-ether-ketone)-based coatings designed for tribological application. Prog. Org. Coat. 2007, 60, 39–44. [Google Scholar] [CrossRef]
- Kucher, M.; Dannemann, M.; Füßel, R.; Weber, M.-T.; Modler, N. Sliding friction and wear of human teeth against biocompatible polyether ether ketone (PEEK) under various wear conditions. Wear 2021, 486–487, 204110. [Google Scholar] [CrossRef]
- Kucher, M.; Dannemann, M.; Modler, N.; Hannig, C.; Weber, M.-T. Effects of Endodontic Irrigants on Material and Surface Properties of Biocompatible Thermoplastics. Dent. J. 2019, 7, 26. [Google Scholar] [CrossRef] [PubMed]
- Chang, D.-Y.; Lin, C.-H.; Wu, X.-Y.; Yang, C.-C.; Chou, S.-C. Cutting force, Vibration, and Temperature in Drilling on a Thermoplastic Material of PEEK. J. Thermoplast. Compos. Mater. 2023, 36, 1088–1112. [Google Scholar] [CrossRef]
- Hoskins, T.J.; Dearn, K.D.; Kukureka, S.N. Mechanical performance of PEEK produced by additive manufacturing. Polym. Test. 2018, 70, 511–519. [Google Scholar] [CrossRef]
- Yan, Y.; Mao, Y.; Li, B.; Zhou, P. Machinability of the Thermoplastic Polymers: PEEK, PI, and PMMA. Polymers 2020, 13, 69. [Google Scholar] [CrossRef]
- Sung, K.-H.; Park, T.-Y.; Hwang, H.-K.; Jo, H.-H. Comparison of various activation methods of root canal irrigants for soft-tissue removal. Oral Biol. Res. 2021, 45, 16–21. [Google Scholar] [CrossRef]
- Yadav, H.; Sharma, A.; Bhaskaran, S. Comparative evaluation of efficacy of different irrigation techniques on removal of calcium hydroxide from root canals: An in vitro study. IJSR 2018, 7, 65–67. [Google Scholar]
- Urwyler, P.; Schift, H.; Gobrecht, J.; Häfeli, O.; Altana, M.; Battiston, F.; Müller, B. Surface patterned polymer micro-cantilever arrays for sensing. Sens. Actuators A Phys. 2011, 172, 2–8. [Google Scholar] [CrossRef]
- Carlson, J.E.; van Deventer, J.; Scolan, A.; Carlander, C. Frequency and temperature dependence of acoustic properties of polymers used in pulse-echo systems. In Proceedings of the IEEE Symposium on Ultrasonics, Honolulu, HI, USA, 5–8 October 2003; pp. 885–888. [Google Scholar] [CrossRef]
- Kucher, M. Hochfrequent Beanspruchte Polymerstrukturen für den Einsatz als Endodontische Instrumente, 1st ed.; Institut für Leichtbau und Kunststofftechnik, Technische Universität Dresden: Dresden, Germany, 2023; ISBN 978-3-86780-730-2. [Google Scholar]
- Abdulfattah, N.; Schmidt, F.; Wang, Y.; Bötticher, N.; Konzack, N.; Giuliano, M.; Müller, W.-D.; Schwitalla, A.D. Ultrasonic welding of polyetheretherketone for dental applications. J. Mech. Behav. Biomed. Mater. 2022, 130, 105225. [Google Scholar] [CrossRef]
- Tutunjian, S.; Eroglu, O.; Dannemann, M.; Modler, N.; Fischer, F. A numerical analysis of an energy directing method through friction heating during the ultrasonic welding of thermoplastic composites. J. Thermoplast. Compos. Mater. 2020, 33, 1569–1587. [Google Scholar] [CrossRef]
- Tutunjian, S.; Dannemann, M.; Modler, N.; Kucher, M.; Fellermayer, A. A Numerical Analysis of the Temporal and Spatial Temperature Development during the Ultrasonic Spot Welding of Fibre-Reinforced Thermoplastics. JMMP 2020, 4, 30. [Google Scholar] [CrossRef]
- Song, Y.; Da, Q.; Wu, B.; Cao, H. Composite light ropes model-based dynamics force prediction model of high speed dry milling UD-CF/PEEK considering size effect. J. Manuf. Process. 2022, 76, 210–222. [Google Scholar] [CrossRef]
- Shou, Z.; Chen, F.; Yin, H. Self-heating of a polymeric particulate composite under mechanical excitations. Mech. Mater. 2018, 117, 116–125. [Google Scholar] [CrossRef]
- Shojaei, A.K.; Volgers, P. Fatigue damage assessment of unfilled polymers including self-heating effects. Int. J. Fatigue 2017, 100, 367–376. [Google Scholar] [CrossRef]
- Turczyn, R.; Krukiewicz, K.; Katunin, A. Spectroscopic evaluation of structural changes in composite materials subjected to self-heating effect. Compos. Struct. 2018, 204, 192–197. [Google Scholar] [CrossRef]
- Wronkowicz, A.; Katunin, A.; Wachla, D. Enhancement of damage identification in composite structures with self-heating based vibrothermography. Optik 2019, 181, 545–554. [Google Scholar] [CrossRef]
- Katunin, A.; Wachla, D. Determination of fatigue limit of polymeric composites in fully reversed bending loading mode using self-heating effect. J. Compos. Mater. 2019, 53, 83–91. [Google Scholar] [CrossRef]
- Abbasnezhad, N.; Khavandi, A.; Fitoussi, J.; Arabi, H.; Shirinbayan, M.; Tcharkhtchi, A. Influence of loading conditions on the overall mechanical behavior of polyether-ether-ketone (PEEK). Int. J. Fatigue 2018, 109, 83–92. [Google Scholar] [CrossRef]
- Shrestha, R.; Simsiriwong, J.; Shamsaei, N. Mean strain effects on cyclic deformation and fatigue behavior of polyether ether ketone (PEEK). Polym. Test. 2016, 55, 69–77. [Google Scholar] [CrossRef]
- Shrestha, R.; Simsiriwong, J.; Shamsaei, N. Load history and sequence effects on cyclic deformation and fatigue behavior of a thermoplastic polymer. Polym. Test. 2016, 56, 99–109. [Google Scholar] [CrossRef]
- Shrestha, R.; Simsiriwong, J.; Shamsaei, N.; Moser, R.D. Cyclic deformation and fatigue behavior of polyether ether ketone (PEEK). Int. J. Fatigue 2016, 82, 411–427. [Google Scholar] [CrossRef]
- Leveuf, L.; Marco, Y.; Le Saux, V.; Navrátil, L.; Leclercq, S.; Olhagaray, J. Fast screening of the fatigue properties of thermoplastics reinforced with short carbon fibers based on thermal measurements. Polym. Test. 2018, 68, 19–26. [Google Scholar] [CrossRef]
- Shrestha, R.; Simsiriwong, J.; Shamsaei, N. Fatigue modeling for a thermoplastic polymer under mean strain and variable amplitude loadings. Int. J. Fatigue 2017, 100, 429–443. [Google Scholar] [CrossRef]
- Curtis, D.C.; Moore, D.R.; Slater, B.; Zahlan, N. Fatigue testing of multi-angle laminates of CF/PEEK. Composites 1988, 19, 446–452. [Google Scholar] [CrossRef]
- Mortazavian, S.; Fatemi, A. Fatigue behavior and modeling of short fiber reinforced polymer composites: A literature review. Int. J. Fatigue 2015, 70, 297–321. [Google Scholar] [CrossRef]
- Mortazavian, S.; Fatemi, A. Effects of mean stress and stress concentration on fatigue behavior of short fiber reinforced polymer composites. Fatigue Fract. Eng. Mater. Struct. 2016, 39, 149–166. [Google Scholar] [CrossRef]
- Simsiriwong, J.; Shrestha, R.; Shamsaei, N.; Lugo, M.; Moser, R.D. Effects of microstructural inclusions on fatigue life of polyether ether ketone (PEEK). J. Mech. Behav. Biomed. Mater. 2015, 51, 388–397. [Google Scholar] [CrossRef] [PubMed]
- Fayerman, V.T. Heat generation in polymers by vibrations of ultrasonic frequency. Polym. Sci. USSR 1969, 11, 1300–1306. [Google Scholar] [CrossRef]
- Mignogna, R.B.; Green, R.E.; Duke, J.C.; Henneke, E.G.; Reifsnider, K.L. Thermographic investigation of high-power ultrasonic heating in materials. Ultrasonics 1981, 19, 159–163. [Google Scholar] [CrossRef]
- Backe, D.; Balle, F.; Eifler, D. Fatigue testing of CFRP in the very high cycle fatigue (VHCF) regime at ultrasonic frequencies. Compos. Sci. Technol. 2015, 106, 93–99. [Google Scholar] [CrossRef]
- Almaraz, G.M.D.; Gómez, E.C.; Juárez, J.C.V.; Ambriz, J.L.A. Crack initiation and propagation on the polymeric material ABS (Acrylonitrile Butadiene Styrene), under ultrasonic fatigue testing. Frat. Integr. Strutt. 2016, 34, 498–506. [Google Scholar] [CrossRef]
- Almaraz, G.D.; Martínez, A.G.; Sánchez, R.H.; Gómez, E.C.; Tapia, M.G.; Juárez, J.V. Ultrasonic Fatigue Testing on the Polymeric Material PMMA, Used in Odontology Applications. Proced. Struct. Integ. 2017, 3, 562–570. [Google Scholar] [CrossRef]
- Reifsnider, K.L.; Henneke, E.G.; Stinchcomb, W.W. The Mechanics of Vibrothermography. In Mechanics of Nondestructive Testing, 1st ed.; Stinchcomb, W.W., Ed.; Springer: New York, NY, USA, 1980; pp. 249–276. ISBN 978-0-306-40567-9. [Google Scholar]
- Katunin, A. A Concept of Thermographic Method for Non-Destructive Testing of Polymeric Composite Structures Using Self-Heating Effect. Sensors 2017, 18, 74. [Google Scholar] [CrossRef]
- Roozen, N.B.; Labelle, L.; Leclère, Q.; Ege, K.; Alvarado, S. Non-contact experimental assessment of apparent dynamic stiffness of constrained-layer damping sandwich plates in a broad frequency range using a Nd:YAG pump laser and a laser Doppler vibrometer. J. Sound Vib. 2017, 395, 90–101. [Google Scholar] [CrossRef]
- Segers, J.; Hedayatrasa, S.; Poelman, G.; van Paepegem, W.; Kersemans, M. Backside delamination detection in composites through local defect resonance induced nonlinear source behavior. J. Sound Vib. 2020, 479, 115360. [Google Scholar] [CrossRef]
- Zhang, E.; Chazot, J.D.; Antoni, J.; Hamdi, M. Bayesian characterization of Young’s modulus of viscoelastic materials in laminated structures. J. Sound Vib. 2013, 332, 3654–3666. [Google Scholar] [CrossRef]
- Liu, P.; Sohn, H. Damage detection using sideband peak count in spectral correlation domain. J. Sound Vib. 2017, 411, 20–33. [Google Scholar] [CrossRef]
- Holland, S.D. Thermographic signal reconstruction for vibrothermography. Infrared Phys. Technol. 2011, 54, 503–511. [Google Scholar] [CrossRef]
- Vaddi, J.S.; Holland, S.D.; Kessler, M.R. Absorptive viscoelastic coatings for full field vibration coverage measurement in vibrothermography. NDT E Int. 2016, 82, 56–61. [Google Scholar] [CrossRef]
- Mihalec, M.; Javh, J.; Cianetti, F.; Moretti, M.; Rossi, G.; Slavič, J.; Boltežar, M. Damping heat coefficient—Theoretical and experimental research on a vibrating beam. J. Sound Vib. 2017, 400, 13–21. [Google Scholar] [CrossRef]
- Montanini, R.; Freni, F. Correlation between vibrational mode shapes and viscoelastic heat generation in vibrothermography. NDT E Int. 2013, 58, 43–48. [Google Scholar] [CrossRef]
- Katunin, A. Criticality of the Self-Heating Effect in Polymers and Polymer Matrix Composites during Fatigue, and Their Application in Non-Destructive Testing. Polymers 2019, 11, 19. [Google Scholar] [CrossRef]
- Luo, W.; Yin, B.; Hu, X.; Zhou, Z.; Deng, Y.; Song, K. Modeling of the heat build-up of carbon black filled rubber. Polym. Test. 2018, 69, 116–124. [Google Scholar] [CrossRef]
- Segers, J.; Hedayatrasa, S.; Verboven, E.; Poelman, G.; van Paepegem, W.; Kersemans, M. In-plane local defect resonances for efficient vibrothermography of impacted carbon fiber-reinforced polymers (CFRP). NDT E Int. 2019, 102, 218–225. [Google Scholar] [CrossRef]
- Mevissen, F.; Meo, M. Ultrasonically stimulated thermography for crack detection of turbine blades. Infrared Phys. Technol. 2022, 122, 104061. [Google Scholar] [CrossRef]
- N.N. Technical Data Sheet SustaPEEK. Available online: https://www.roechling.com/de/industrial/werkstoffe/thermoplastische-kunststoffe/detail/sustapeek-196 (accessed on 1 January 2023).
- Muller, L.; Roche, J.-M.; Hurmane, A.; Pacou, D.; Bonnand, V.; Peyrac, C.; Gornet, L. Experimental monitoring of the self-heating properties of thermoplastic composite materials. Procedia Eng. 2018, 213, 183–191. [Google Scholar] [CrossRef]
- Dresig, H.; Holzweißig, F. Maschinendynamik, 10th ed.; Springer-Verlag: Berlin/Heidelberg, Germany, 2011; ISBN 978-3-642-16010-3. [Google Scholar]
- Johnsen, J.; Clausen, A.H.; Grytten, F.; Benallal, A.; Hopperstad, O.S. A thermo-elasto-viscoplastic constitutive model for polymers. J. Mech. Phys. Solids 2019, 124, 681–701. [Google Scholar] [CrossRef]
- Krairi, A.; Doghri, I.; Schalnat, J.; Robert, G.; van Paepegem, W. Thermo-mechanical coupling of a viscoelastic-viscoplastic model for thermoplastic polymers: Thermodynamical derivation and experimental assessment. Int. J. Plast. 2019, 115, 154–177. [Google Scholar] [CrossRef]
- Altenbach, H. Kontinuumsmechanik: Einführung in Die Materialunabhängigen und Materialabhängigen Gleichungen, 4th ed.; Springer Vieweg: Berlin, Germany, 2018. [Google Scholar]
- Mortazavian, S.; Fatemi, A.; Mellott, S.R.; Khosrovaneh, A. Effect of cycling frequency and self-heating on fatigue behavior of reinforced and unreinforced thermoplastic polymers. Polym. Eng. Sci. 2015, 55, 2355–2367. [Google Scholar] [CrossRef]
- Fatemi, A.; Mortazavian, S.; Khosrovaneh, A. Fatigue Behavior and Predictive Modeling of Short Fiber Thermoplastic Composites. Procedia Eng. 2015, 133, 5–20. [Google Scholar] [CrossRef]
- Rantala, J.; Wu, D.; Busse, G. Amplitude-Modulated Lock-In Vibrothermography for NDE of Polymers and Composites. Res. Nondestruct. Eval. 1995, 7, 215–228. [Google Scholar] [CrossRef]
- Ratner, S.B.; Korobov, V.I. Self-heating of plastics during cyclic deformation. Polym. Mech. 1966, 1, 63–68. [Google Scholar] [CrossRef]
- Katunin, A. Analytical model of the self-heating effect in polymeric laminated rectangular plates during bending harmonic loading. Maint. Reliab. 2010, 48, 91–101. [Google Scholar]
- Dimarogonas, A.D.; Syrimbeis, N.B. Thermal signatures of vibrating rectangular plates. J. Sound Vib. 1992, 157, 467–476. [Google Scholar] [CrossRef]


| Property | Test Method | Unit | Value |
|---|---|---|---|
| Density | DIN EN ISO 1183-1 | g cm−3 | 1.31 |
| Yield stress | DIN EN ISO 527 | MPa | 110 |
| Tensile modulus of elasticity | DIN EN ISO 527 | MPa | 4000 |
| Melting temperature | ISO 11357-3 | °C | 343 |
| Thermal conductivity | DIN 52612-1 | W m−1 K−1 | 0.25 |
| Thermal capacity | DIN 52612 | kJ kg−1 K−1 | 1.34 |
| Coefficient of linear thermal expansion | DIN 53752 | K−1 | 50 × 10−6 |
| Service temperature, long-term | - | °C | −60…250 |
| Service temperature, short-term | - | °C | 310 |
| Heat deflection temperature | DIN EN ISO 75 | °C | 152 |
| 5 | 6 | 7 | 8 | 9 | 10 | 11 | 12 | 13 | 14 | 15 | 16 | 17 | |
|---|---|---|---|---|---|---|---|---|---|---|---|---|---|
| 1.1 | 1.7 | 2.4 | 3.2 | 4.1 | 5.1 | 6.2 | 7.4 | 8.7 | 10.1 | 11.7 | 13.3 | 15.0 | |
| 0.011 | 0.014 | 0.009 | 0.010 | 0.010 | 0.010 | 0.011 | 0.011 | 0.011 | 0.012 | 0.012 | 0.012 | 0.013 |
| MTRS d in mK s−1 | VHR e in mK m−1 | ||||||||
|---|---|---|---|---|---|---|---|---|---|
| 5 | 1.1 | 0.006 | 0.018 | - | <0.2 | - | - | - | - |
| 6 | 1.7 | 0.015 | 0.046 | - | <0.2 | - | - | - | - |
| 7 | 2.4 | 0.029 | 0.088 | - | <0.2 | - | - | - | - |
| 8 | 3.2 | 0.026 | 0.080 | - | <0.2 | - | - | - | - |
| 9 | 4.1 | 0.028 | 0.089 | - | <0.2 | - | - | - | - |
| 10 | 5.1 | 0.032 | 0.103 | - | <0.2 | - | - | - | - |
| 11 | 6.2 | 0.091 | 0.300 | 10.6 | 0.7 | 21 | 70.2 | 0.2 | 0.6 |
| 12 | 7.4 | 0.022 | 0.076 | - | <0.2 | - | - | - | - |
| 13 | 8.7 | 0.034 | 0.120 | - | <0.2 | - | - | - | - |
| 14 | 10.1 | 0.044 | 0.164 | 7.9 | 0.4 | 11 | 65.7 | 0.1 | 0.5 |
| 15 | 11.7 | 0.066 | 0.261 | 21.4 | 0.9 | 29 | 110.6 | 0.2 | 0.7 |
| 16 | 13.3 | 0.241 | 1.047 | 13.2 | 6.4 | 194 | 185.3 | −0.1 | 0.7 |
| 17 | 15.1 | 0.076 | 0.347 | 18.7 | 2.5 | 77 | 221.1 | −0.1 | 0.8 |
Disclaimer/Publisher’s Note: The statements, opinions and data contained in all publications are solely those of the individual author(s) and contributor(s) and not of MDPI and/or the editor(s). MDPI and/or the editor(s) disclaim responsibility for any injury to people or property resulting from any ideas, methods, instructions or products referred to in the content. |
© 2023 by the authors. Licensee MDPI, Basel, Switzerland. This article is an open access article distributed under the terms and conditions of the Creative Commons Attribution (CC BY) license (https://creativecommons.org/licenses/by/4.0/).
Share and Cite
Kucher, M.; Dannemann, M.; Peyrow Hedayati, D.; Böhm, R.; Modler, N. Experimental Investigation of the Vibration-Induced Heating of Polyetheretherketone for High-Frequency Applications. Solids 2023, 4, 116-132. https://doi.org/10.3390/solids4020008
Kucher M, Dannemann M, Peyrow Hedayati D, Böhm R, Modler N. Experimental Investigation of the Vibration-Induced Heating of Polyetheretherketone for High-Frequency Applications. Solids. 2023; 4(2):116-132. https://doi.org/10.3390/solids4020008
Chicago/Turabian StyleKucher, Michael, Martin Dannemann, Davood Peyrow Hedayati, Robert Böhm, and Niels Modler. 2023. "Experimental Investigation of the Vibration-Induced Heating of Polyetheretherketone for High-Frequency Applications" Solids 4, no. 2: 116-132. https://doi.org/10.3390/solids4020008