Article

Modeling Deformation and Fracture of Boron-Based Ceramics with Nonuniform Grain and Phase Boundaries and Thermal-Residual Stress

Army Research Directorate, DEVCOM ARL, Aberdeen, MD 21005, USA
Solids 2022, 3(4), 643-664; https://doi.org/10.3390/solids3040040
Submission received: 9 October 2022 / Revised: 28 October 2022 / Accepted: 8 November 2022 / Published: 16 November 2022

Abstract

:
A phase field framework of elasticity, inelasticity, and fracture mechanics is invoked to study the behavior of ceramic materials. Mechanisms addressed by phase field theory include deformation twinning, dislocation slip, amorphization, and anisotropic cleavage fracture. Failure along grain and phase boundaries is resolved explicitly, whereWeibull statistics are used to characterize the surface energies of such boundaries. Residual stress incurred by mismatching coefficients of thermal expansion among phases is included. Polycrystalline materials of interest are the ultra-hard ceramics boron carbide (B4C) and boron carbide-titanium diboride (B4C-TiB2), the latter a dual-phase composite. Recent advancements in processing technology enable the production of these materials via spark-plasma sintering (SPS) at nearly full theoretical density. Numerical simulations invoking biaxial loading (e.g., pure shear) demonstrate how properties and mechanisms at the scale of the microstructure influence overall strength and ductility. In agreement with experimental inferences, simulations show that plasticity is more prevalent in the TiB2 phase of the composite and reduces the tendency for transgranular fracture. The composite demonstrates greater overall strength and ductility than monolithic B4C in both simulations and experiments. Toughening of the more brittle B4C phase from residual stress, in addition to crack mitigation from the stronger and more ductile TiB2 phase are deemed advantageous attributes of the composite.

1. Introduction

Polycrystalline ceramic solids typically demonstrate high hardness, a high elastic modulus, and a low mass density relative to engineering metals. These mechanical properties, as well as various thermal, electrical, and optical properties make ceramics attractive for use in numerous industrial applications. However, the intrinsic susceptibility to fracture limits the ductility of ceramic solids, and therefore, methods are continuously sought to inhibit cracking and thereby improve mechanical performance for applications requiring structural integrity.
One possible means of potentially improving mechanical properties involves mixing two or more crystalline phases of differing chemical compositions to produce a polycrystalline ceramic composite. Examples include diamond-silicon carbide [1,2,3], silicon carbide-titanium diboride [4], boron carbide-titanium diboride [5,6,7], boron carbide-silicon carbide [8], boron carbide-zirconium diboride [9], and alumina-zirconium dioxide [10]. Such ceramic blends feature a host of potentially beneficial microstructure features, such as grain and phase boundaries of various strengths, grains with contrasting mass densities and thermoelastic and plastic properties, and residual stress fields. The latter have been noted to improve fracture toughness in some cases [4,5]. Residual stresses often arise during cooling from higher processing temperatures as a result of differing thermal expansion coefficients of constituent phases. Hence, these stresses are referred to as thermal-residual stresses. Such residual stresses may also emerge in single-phase materials from the thermoelastic anisotropy of non-cubic grains [11], though the magnitudes tend to be smaller and are often ignored in the analysis of multi-phase ceramics [4]. The tendency of intergranular versus transgranular fracture is altered by additional phases, and grains of higher strength or ductility may block sharply propagating cracks.
The present work focuses on phase field modeling of the mechanical performance of polycrystalline boron carbide (B 4 C), with or without a second phase of titanium diboride (TiB 2 ). Numerical simulations explicitly resolve individual grains of each phase, as well as grain and phase boundaries. The finite element (FE) method is used, wherein constitutive models invoke phase field theory for elasticity, fracture, and other structural changes. Titanium diboride has a higher elastic modulus, lower Poisson’s ratio, higher fracture energy, lower hardness, and higher mass density than B 4 C. (Numerical values of physical properties, with supporting references, are given later in Section 3 of this work). They are also thought to be more ductile as evidenced by dislocation nucleation and motion [12,13], though both ceramics are brittle relative to typical metals at room temperature. The particular material of study is produced by spark-plasma sintering (SPS), where fabrication methods and material properties culled from physical experiments are discussed by Rubink et al. [6]. Polycrystalline ceramics synthesized in this way are nearly fully dense (≥99% theoretical density), with little to no graphitic inclusions and relatively uniform and small grains (e.g., mean sizes on the order of several microns). X-ray diffraction (XRD) and theoretical mechanics analyses show that residual stresses are tensile for TiB 2 grains and compressive for more brittle B 4 C grains [6]. Such residual stresses should prove beneficial for impeding cleavage fractures in the latter phase.
The particular phase field model used in the current research, which includes residual stresses from possibly different physical sources, was developed in several recent works [14,15]. State-of-the-art work implementing phase field fracture models accounts for elastic and fracture anisotropy [16,17,18,19], finite strains [19,20], and dynamic effects from material inertia [21]. Research closely related to the present study incorporates fracture or deformation twinning in a dissipative phase field framework applied to B 4 C single crystals [22]. Over the past decade within the mechanics research community, the phase field method seems to have overtaken in popularity the cohesive zone FE method of modeling fracture in crystalline solids [23,24,25]. The origins of the current variational phase field framework for deformation twinning and fracture are found in prior works: [26,27], respectively. Other recent applications to ceramics focus on the homogenized shock compression response of polycrystalline B 4 C and TiB 2 [14,28]. Generalizations incorporating geometric concepts are reviewed in a recent article [29]. The effects of high confining pressure, which can drastically increase resistance to fracture in ceramics, are not addressed in the current investigation. Advancements in three-dimensional (3D) computational methods at the scale of the microstructure are required to account for such effects, which have been modeled only in a one-dimensional (1D) context for uniaxial strain compression [14,28].
A recent work [15] interrogated the mechanical response of B 4 C and B 4 C-TiB 2 under primarily tensile stress states, which are directly relevant to the flexure experiments reported for these materials [6]. In the context of indentation experiments, tensile principal stress components may arise in biaxial stress fields near the surface outside the indentation region and along the contact perimeter, leading to radial cracking and/or ring cracking depending on the geometry, whereas lateral cracks may arise in the subsurface [30,31]. Surface crack length is used to quantify fracture toughness in the Vickers indentation method, for example [32]. Most simulations by Clayton et al. [15] invoked uniform fracture strengths (i.e., surface energies) for all grain and phase boundary facets, though a few exploratory simulations considered completely random strength distributions [33]. The results showed, for purely tensile loading, that fractures tended to initiate earlier in materials with random versus uniform distributions, leading to a reduced peak strength on average. Other trends regarding the benefits of plasticity and residual stresses, which agreed with experimental inferences [6,34], persisted when either type of distribution was modeled.
The objective of the current research is understanding the effects of composition, microstructure, residual stress, inelastic deformation mechanisms, and imposed biaxial strain magnitude on B 4 C and B 4 C-TiB 2 . The current application of the variational phase field theory with residual stress [14,15] includes the following innovations over previous studies:
  • Weibull distributions of fracture strengths of grain and phase boundaries, which are known to be more physically realistic for polycrystalline ceramics [35], including B 4 C [36], than uniform or purely random distributions;
  • Biaxial strain states more pertinent than uniaxial tensile states to surface cracking [37] and also more relevant for failure by shear-driven median cracking in brittle elastic materials for regions directly under the indenter [30,38];
  • Revisited comparison of cumulative current and past simulation results with detailed experimental findings [6,34].
The general phase field theory including fracture, inelasticity, and residual stresses is described in Section 2. Material aspects pertinent to the present ceramic systems, including grain and phase boundary descriptions and rendering of microstructures, are detailed in Section 3. Numerical techniques including the imposition of boundary conditions and averaging of field variables for subsequent analysis are explained in Section 4. Model results, including a comparison with past experimental findings, are given in Section 5. Conclusions appear in Section 6.

2. Phase Field Mechanics

The general phase field theory of Clayton [14] accounts for finite strains, temperature changes, rate effects, and initial stresses of arbitrary origin. This theory was recently extended [15] with a detailed, thermodynamically consistent treatment of residual stresses, e.g., arising from thermal processing history. Here, a geometrically linearized theory is implemented, which is sufficient for the loading protocols of the current study. The applied strain rates are low enough that a quasi-static, variational approach suffices, wherein viscous dissipation is negligible. The theory of Clayton et al. [14,15] is presented next in Section 2 in abbreviated form, specialized thereafter in Section 3, Section 4 and Section 5 to low-rate loading of B 4 C and B 4 C-TiB 2 .

2.1. Coordinates and Order Parameters

Denote by X , with covariant components X K , the position of a material particle. Rectangular Cartesian coordinates are used exclusively, with { E K } the fixed coordinate basis and E K = X / X K = K X a basis vector ( K = 1 , 2 , 3 in ambient Euclidean three-space). A solid body occupies a reference domain Ω 0 with boundary Ω 0 . The outward unit normal to Ω 0 is N ( X ) . For a quasi-static theory, the explicit time (t) dependence of fields is omitted.
Two order parameter fields are η ( X ) and ξ ( X ) . Field η measures structural changes such as slip and deformation twinning, depending on the crystal type. Field ξ measures fracture, i.e., damage in the solid involving the formation of free surfaces. In the phase field method, slip bands, twin boundaries, and fracture surfaces are diffuse or regularized, rather than resolved discretely. The values of order parameters η [ 0 , 1 ] , ξ [ 0 , 1 ] physically represent the following:
η = 0 : parent crystal , ( 0 , 1 ) : partially slipped / twinned state , = 1 : fully slipped or twinned state ; ξ = 0 : undamaged material , ( 0 , 1 ) : partially degraded state , = 1 : fractured or failed state .

2.2. Kinematics

Particle displacement u and its gradient h are denoted, respectively, with x the displaced particle position:
u ( X ) = x ( X ) X , h ( X ) = u ( X ) ,
where ( · ) = K ( · ) E K . The total strain tensor is the symmetrized displacement gradient:
ϵ = 1 2 h + h T ϵ I J = 1 2 ( I u J + J u I ) .
The displacement gradient and strain are partitioned into thermoelastic ( · ) E and residual ( · ) - parts:
h ( X ) = h E ( X ) + h ¯ ( η ( X ) , ξ ( X ) ) , ϵ ( X ) = ϵ E ( X ) + ϵ ¯ ( η ( X ) , ξ ( X ) ) .
Residual distortion and strain are decomposed into contributions from η and ξ :
h ¯ ( η ( X ) , ξ ( X ) ) = h ξ ( ξ ( X ) ) + h η ( η ( X ) ) , ϵ ¯ ( η ( X ) , ξ ( X ) ) = ϵ ξ ( ξ ( X ) ) + ϵ η ( η ( X ) ) .
Structure tensors are derivatives of residual distortion with respect to the order parameters:
A ξ = h ¯ / ξ , A η = h ¯ / η .

2.3. Balance Laws and Thermodynamics

The symmetric Cauchy stress tensor field is P ( X ) ; the associated traction vector is t = P · N . The original and current mass densities are ρ 0 and ρ . Local static balance laws for mass, linear momentum, and angular momentum conservation are, in the geometrically linear approximation,
ρ 0 = ( 1 + · u ) ρ , · P = 0 , P = P T .
Internal microforces π η and π ξ , microscopic stress vectors s η and s ξ , and the corresponding surface forces t η and t ξ are introduced, along with local microforce balances [14,39]:
t η = s η · N , t ξ = s ξ · N [ on Ω 0 ] .
· s η + π η = 0 , · s ξ + π ξ = 0 [ in Ω 0 ] .
The Helmholtz free energy per unit reference volume is the scalar field Ψ ( X ) . The functional forms of free energy, stress, microforces, and microstresses are
Ψ = Ψ ( h , η , ξ , η , ξ ) , P = P ( h , η , ξ , η , ξ ) ;
s η = s η ( h , η , ξ , η , ξ ) , s ξ = s ξ ( h , η , ξ , η , ξ ) ; π η = π η ( h , η , ξ , η , ξ ) , π ξ = π ξ ( h , η , ξ , η , ξ ) .
From thermodynamic arguments requiring non-negative dissipation [14,39] with rate independence restrictions,
P = Ψ h = Ψ ϵ , s η = Ψ η , s ξ = Ψ ξ , π η = Ψ η , π ξ = Ψ ξ .
Governing equations can alternatively be derived with variational methods [26,27]. Assume Ψ is of the functional form in (10) and that the following variational principle holds:
δ V Ψ d Ω 0 = S [ t · δ u + t η δ η + t ξ δ ξ ] d Ω 0 ,
with V a region enclosed by surface S upon which natural boundary conditions are applied. Assuming field variables are sufficiently differentiable, (13) produces [26,40]
· Ψ h = · Ψ ϵ = · P = 0 ; [ in V ]
δ Ψ δ η = Ψ η | h · Ψ η = 0 , δ Ψ δ ξ = Ψ ξ | h · Ψ ξ = 0 ; [ in V ]
t = P · N = Ψ h · N , t η = Ψ η · N = s η · N , t ξ = Ψ ξ · N = s ξ · N . [ on S ]
Equations (14)–(16) are consistent with (7)–(9) and (12). These hold for quasi-statics, isothermal states, and inviscid kinetics. The variational derivative with respect to generic argument x is δ ( · ) / δ x [41]. The dependence of Ψ on h is now replaced with ϵ E of (4):
Ψ = Ψ ^ ( ϵ E , η , ξ , η , ξ ) .
Note
ϵ E ( h , η , ξ ) = 1 2 h + h T ϵ ¯ ( η , ξ ) , ϵ I J E / h K L = 1 2 ( δ I K δ J L + δ J K δ I L ) .
A change of variables from h to ϵ E with (6) leads to
( · ) η | h = ( · ) η | ϵ E + ( · ) ϵ E | η : ϵ E η | h = ( · ) η | ϵ E 1 2 ( · ) ϵ E | η : A η + ( A η ) T ,
( · ) ξ | h = ( · ) ξ | ϵ E + ( · ) ϵ E | ξ : ϵ E ξ | h = ( · ) ξ | ϵ E 1 2 ( · ) ϵ E | ξ : A ξ + ( A ξ ) T .
Recalling the present theory is geometrically linear, Cauchy stress obeys, from (12), (17), and (18),
P I J = Ψ / h I J = ( Ψ ^ / ϵ K L E ) ( ϵ K L E / h I J ) = Ψ ^ / ϵ I J E P = Ψ ^ / ϵ E .
The internal microforces in (12) become, with (19), (20), and the symmetry of P ,
π η = Ψ ^ η | ϵ E + P : A η , π ξ = Ψ ^ ξ | ϵ E + P : A ξ ,
where thermoelastic driving forces are the rightmost terms after each equality involving the structure tensors of (6). Denote by W Ψ the strain energy, f η Ψ a phase energy with prominent dependence on η and its gradient, and f ξ Ψ on ξ and its gradient. Then,
Ψ ^ ( ϵ E , η , ξ , η , ξ ) = W Ψ ( ϵ E , η , ξ ) + f η Ψ ( η , ξ , η ) + f ξ Ψ ( η , ξ , ξ ) ;
f η Ψ ( η , ξ , η ) = f η 0 Ψ ( η , ξ ) + f η Ψ ( η , ξ , η ) , f ξ Ψ ( η , ξ , ξ ) = f ξ 0 Ψ ( η , ξ ) + f ξ Ψ ( η , ξ , ξ ) ;
P = W Ψ ϵ E , s η = f η Ψ η , s ξ = f ξ Ψ ξ .

2.4. Twinning, Plastic Shear, and Dilatation

Distortion h η arises from twinning shear or localized slip, described here on a single plane with unit normal m . The shearing direction is the unit vector s , and s · m = 0 . The saturation magnitude of shear is γ 0 ; for deformation twinning, this is often known from the crystal structure [42]. Isochoric inelastic distortion, inelastic strain, and the second structure tensor of (6) are, respectively,
h η ( η ) = γ 0 ϕ ( η ) s m , ϵ η ( η ) = 1 2 γ 0 ϕ ( η ) [ s m + m s ] , A η ( η ) = γ 0 ϕ ( η ) s m .
The interpolation function ϕ is defined, for argument x, as follows, with the corresponding derivative:
ϕ ( x ) = 0 x < 0 , x 2 ( 3 2 x ) x [ 0 , 1 ] , 1 x > 1 , ϕ ( x ) = d ϕ ( x ) d x = 0 x < 0 , 6 x ( 1 x ) x [ 0 , 1 ] , 0 x > 1 .
In ductile solids, residual dilatation may arise from nucleated voids. In brittle solids, dilatation may be caused by shear-induced bulking, especially in high-pressure regimes [43] or granular flow regimes upon impact and dynamic comminution [28,44]. In the present applications, the average pressure and strain rates are small, fragmentation is minimal, and bulking is assumed negligible. Thus,
h ξ = ϵ ξ = 0 , A ξ = 0 h ¯ = h η , ϵ ¯ = ϵ η .

2.5. Isotropic Elastic Formulation

In a heterogeneous polycrystal with grains of different crystal types or phases, each crystal is assigned to a different sub-body Ω 0 with potentially different physical properties. Elasticity is isotropic, but fracture is not when α ^ > 0 , where α ^ is defined briefly. Slip and twinning are, by the kinematic definition (26), always anisotropic.
Elastic strain energy includes isotropic elasticity and isotropic residual stress of thermodynamic origin [15]:
W Ψ ( ϵ E , η , ξ ) = 1 2 B ( η , ξ , ω ¯ ) · ( tr ϵ E ) 2 1 1 3 β 0 · ( tr ϵ E ) + G ( η , ξ ) · ( ϵ E : ϵ E ) + σ ˜ 0 ( η ) · Λ ( tr ϵ E , ξ ) .
The deviatoric thermoelastic strain is ϵ E = ϵ E 1 3 ( tr ϵ E ) 1 , where 1 is the unit tensor: ( 1 ) I J = δ I J . The tangent bulk modulus is B , and the tangent shear modulus is G . A nonlinear pressure–volume response is enabled via β 0 2 B 0 1 [14], where B 0 is the ambient pressure derivative of the bulk modulus. Thermoelastic coefficients are usually constants in a homogeneous single crystal, but generally can depend on the order parameters:
B ( η , ξ , ω ¯ ) = B 0 ( η ) · χ ( ξ ) · ω ¯ + ( 1 ω ¯ ) , G ( η , ξ ) = G 0 ( η ) · χ ( ξ ) ;
B 0 ( η ) = B 0 | 0 + ( B 0 | 1 B 0 | 0 ) · ϕ ( η ) , G 0 ( η ) = G 0 | 0 + ( G 0 | 1 G 0 | 0 ) · ϕ ( η ) , σ ˜ 0 ( η ) = σ ˜ 0 | 0 + [ σ ˜ 0 | 1 σ ˜ 0 | 0 ] · ϕ ( η ) .
Superscripts ( · ) 0 | 0 and ( · ) 0 | 1 correspond to undamaged states before and after structural transformation, with ( ξ = 0 , η = 0 ) and ( ξ = 0 , η = 1 ) , respectively. The bulk modulus is preserved under compressive pressure, but the shear modulus is not [20,27,45]. The indicator function for volumetric elastic compression versus extension (corresponding to positive versus negative pressure) is ω ¯ ; the interpolator ϕ is defined in (27); the degradation function is χ ( ξ ) [ ζ 0 , 1 ] , with 0 < ζ 0 1 [40]:
ω ¯ = H ( tr ϵ E ) ; χ ( ξ ) = ζ 0 + ( 1 ζ 0 ) ( 1 ξ ) 2 .
The right-continuous unit Heaviside function is { H : H ( x ) = 0 x < 0 ; H ( x ) = 1 x 0 } .
For each anisotropic domain, cleavage fracture may localize on a critical crystallographic plane with unit normal vector M ( η ( X ) ) . Denote the cleavage anisotropy factor [45] by α ^ 0 , where for isotropic f ξ Ψ , α ^ = 0 . The fracture regularization length is l ξ > 0 ; the fracture surface energy is Υ . Then,
f ξ Ψ ( η , ξ , ξ ) = Υ ( η ) ξ 2 / l ξ + l ξ · ω : ( ξ ξ ) , ω ( η ) = 1 + α ^ ( η ) · [ 1 M ( η ) M ( η ) ] ;
W Ψ ξ | ϵ E f η Ψ ξ = 2 l ξ Υ ξ l ξ 2 · ( Υ ω ξ ) .
Energy functions for η -equilibrium contain surface energy Γ , bulk energy A ^ , and phase field regularization length l η . The damage-transformation coupling function [40] is χ ^ ( ξ ) , typically assumed as χ ^ = χ or χ ^ = 1 (i.e., full or no coupling). Assigning the first of (24), the first of (9) follows:
f η 0 Ψ ( η , ξ ) = χ ^ ( ξ ) · f ¯ η 0 Ψ ( η ) , f η Ψ ( η , ξ ) = χ ^ ( ξ ) · f ¯ η Ψ ( η ) ;
f ¯ η 0 Ψ ( η ) = 12 [ Γ / l η ] η 2 ( 1 η ) 2 + A ^ η 2 , f ¯ η Ψ ( η ) = 3 4 Γ · l η · | η | 2 ;
Ψ ^ η | ϵ E = P : A η 3 2 l η · ( Γ η ) .
Total stress P is computed from (29), where the residual contribution σ ˜ 0 is spherical for isotropy:
P = W Ψ ϵ E = B 1 1 2 β 0 ( tr ϵ E ) ( tr ϵ E ) 1 + 2 G ϵ E + σ ˜ 0 Λ ( tr ϵ E ) 1 .
Elastic strain ϵ E is measured with respect to a datum state ( ϵ E = 0 ) at which P = σ ˜ 0 1 . In a cubic or an isotropic (poly)crystalline solid, lattice spacing at the datum state could be determined from the inversion of a pressure–volume equation of state at ambient temperature and datum pressure σ ˜ 0 .
A few remarks regarding terms entering the free energy function of (23) are in order. The surface energy of cracks is contained in the term f ξ Ψ , which follows the usual sum of quadratic forms in ξ and ξ of phase field fracture models [46], further extended for damage anisotropy [17,45]. The surface energy of twin boundaries and stacking faults, as well as the possible energy of phase transformations and dislocation lines, is contained in the term f η Ψ , which again follows the usual sum of quadratic forms [41]. The energy f η Ψ also degrades with local damage through function χ ^ ( ξ ) [40], regardless of the local stress/strain state. Elastic strain energy density W Ψ consists of three terms in (29): the volumetric strain energy scaled by the tangent bulk modulus B , the deviatoric strain energy scaled by the tangent shear modulus G , and the residual strain energy scaled by the factor Λ defined later in Section 2.6. According to (30) and (31), the tangent bulk modulus is interpolated from the bulk moduli of coexisting phases, where the interpolated value is degraded by local damage ξ under tensile elastic strain states (tensile pressure), but not for compressive elastic strain states (compressive pressure) [27,47]. The tangent shear modulus is interpolated from the shear moduli of coexisting phases, degraded by local damage ξ regardless of local stress/strain state. The residual strain energy attributed to thermal-residual stress, which is hydrostatic for isotropic materials, is degraded similarly, but not identically, to the bulk strain energy according to (39) and (40), i.e., a reduction for tensile states, but not compressive states. Accordingly, fracture will not occur if the loading is of purely hydrostatic compression, while Mode I cracks can nucleate and propagate for tensile states, regardless of shear. For combined compressive pressure and shear stress, the fracture tendency is reduced, but not eliminated, since the reduction of the shear modulus acts as a driving force for Mode II-/III-type cracks. Under such compressive–shear states, a brittle material can become pulverized (e.g., severely reduced tangent shear modulus), yet fluid-like, since the bulk modulus is not degraded. Further details are available in related work [14,15], noting that alternative schemes for tensile versus compressive stress states have also been implemented, e.g., [46].

2.6. Initial Stress

The model of Clayton et al. [15] is invoked for residual stresses in the ambient state. Define function y = tr ϵ E / ϵ C , with ϵ C > 0 a constant. The integral of the first of (27) is, with y the argument,
Φ ( tr ϵ E ) = 0 tr ϵ E ϕ ( ϵ / ϵ C ) d ϵ = 0 if tr ϵ E < 0 , ϵ C · ( tr ϵ E / ϵ C ) 3 [ 1 ( tr ϵ E / ϵ C ) / 2 ] if 0 tr ϵ E ϵ C , tr ϵ E ϵ C / 2 if tr ϵ E > ϵ C .
Function Λ ( tr ϵ E , ξ ) controls the degradation of initial stress due to increasing ξ , for tensile states:
Λ = Φ · ( 1 ξ ) 2 + ( 1 Φ ) Λ / ( tr ϵ E ) = ϕ ( y ) · ( 1 ξ ) 2 + ( 1 ϕ ( y ) ) .
Then the total isotropic stress contribution from σ ˜ 0 and its contribution to the thermodynamic driving force for fracture are, respectively,
σ ˜ ( tr ϵ E , ξ , η ) = σ ˜ 0 ( η ) · 1 + ( ξ 2 2 ξ ) · ϕ ( tr ϵ E / ϵ C ) , σ ˜ 0 · ( Λ / ξ ) = 2 σ ˜ 0 · ( 1 ξ ) Φ .
The critical tensile pressure P C and critical volume strain ϵ C are defined as [15]
P C = 3 16 6 B 0 Υ / l ξ , ϵ C = 16 9 P C / B 0 = { ( 1 2 ν 0 ) Υ } / { ( 1 + ν 0 ) G 0 l ξ } .
The initial elastic modulus is E 0 = ( 2 + 2 ν 0 ) G 0 , and Poisson’s ratio is ν 0 . In (42), these elastic constants are all evaluated at the initial (parent) state with η = 0 if nominally phase-dependent.

3. Material Properties and Polycrystalline Microstructures

The materials of study are B 4 C-23 vol. % TiB 2 and, for comparison, polycrystalline B 4 C. Differences from [15] implemented here are the Weibull statistics for grain boundary fracture properties [35] and a focus on the effects of different physical mechanisms (i.e., residual stresses, plasticity) under biaxial strain boundary conditions. Fracture and plasticity incurred deep in the material directly under indentation are affected by the confining pressure of the surrounding material. In the stress field for Vickers indentation of a homogeneous isotropic elastic body, all principal stresses are compressive, so fractures are shear-induced [37,38]. However, biaxial residual stress fields with a tensile component (typically smaller than the compressive component) arise in elastic–plastic or fractured materials [38]. Pure shear (biaxial) loading is thus thought more qualitatively representative than uniaxial tensile loading for stress fields incurred during indentation, though surface stress distributions for pyramidal indenters are non-uniform and not equi-biaxial at most locations.
Tensile loading conditions, with and without superposed simple shear, were thoroughly investigated [15] with the intent of comparison to flexure experiments. Only a few demonstrative simulations with biaxial and simple shear were executed in prior work [15], without the isolation of the individual effects of the full range of physical mechanisms available in the phase field model.

3.1. Boron Carbide Phase

The properties and parameters for bulk grains of B 4 C are listed in Table 1. Isotropic elasticity is assumed [34,48], and nonzero β 0 is invoked in the compressive regime. To prevent tensile numerical instabilities [15], 1 3 β 0 · ( tr ϵ E ) 1 3 β 0 · ( tr ϵ E ) in (29), where ( · ) = 1 2 [ ( · ) + | ( · ) | ] . Twinning occurs on 10 1 ¯ 0 { 0001 } and fracture on basal { 0001 } planes, giving M . Amorphous shear bands are enabled to form within twinned domains [49,50,51] as η 1 . Twinning shear is γ 0 = 2 3 a/c, with a and c lattice parameters. The surface energy resisting twinning is Γ . The energy barrier A ^ is obtained from the difference between the free energies of crystalline and amorphous phases. The preferred twinning system in a randomly oriented B 4 C grain is the one of among three possible basal twinning systems with the maximum Schmid factor, producing s and m [52]. Cleavage anisotropy α ^ is prescribed similarly based on prior works [27,45,52], and χ ^ = χ in (35) [40].
The choices of the regularization lengths l ξ and l η were analyzed in detail in a prior work on ceramic composites [52]; that discussion is now summarized. Here, the minimum acceptable length permitted by the mesh resolution and dimensions of the simulation domain [45,48] is assigned, with l ξ = l η for convenience. If explicitly resolving atomic-scale phenomena, regularization lengths can correlate physically with perturbed atomic displacements in the vicinity of crack faces [53] or twin boundaries [26,54]. In such nano-scale simulations, parameters correlate with molecular mechanics and take values of nm or smaller. Parametric studies with different regularization lengths for twinning, phase transformations, and fractures are reported in several prior works [26,45,52,55]. Generally, increasing the regularization length while holding the surface energy constant leads to a reduction in nucleation stress and peak strength, though the relative importance depends on the particular problem. In one prior study [52], varying the ratio l η / l ξ from 1 2 to 2 produced similar mechanisms in the simulation results, but the predicted widths of regularized cracks and twin boundaries increased and the homogenized peak stresses decreased, with increasing regularization lengths.
Partial twinning is reversible upon unloading, as observed in other investigations [56,57]. The irreversibility of amorphization is imposed for η η T , with η T = 0.9 , and likewise for fracture, with ξ T = 0.9 . Constraints enforcing irreversibility in numerical simulations are described in prior work [40,51]. Different choices of ξ T were further investigated in the preparation of prior works on phase field fracture [27] and fracture with twinning [40]. Too small a value of the threshold for the irreversibility of fracture locks in permanent, diffuse damage contours, especially under relatively homogeneous loading protocols, wherein sharp cracks do not nucleate immediately. On the other hand, omitting the threshold for fracture irreversibility entirely leads to healing of fully developed cracks upon elastic unloading as the system seeks to minimize total elastic and surface energy. Similar remarks apply for amorphized, twinned, or slipped regions. The aforementioned prior investigations found that, for the present constitutive theory and variational numerical implementation, the presently prescribed value of 0.9 for ξ T and η T provides a suitable compromise, producing physically realistic results for relatively brittle materials of study.

3.2. Titanium Diboride Phase

The properties and parameters for grains of TiB 2 are likewise listed in Table 1. Cleavage occurs on { 0001 } , giving M , where Υ is obtained from DFT [34]. Slip occurs on families of systems with the lowest stacking fault (SF) energy barrier Γ from DFT [34]: basal slip 11 2 ¯ 0 { 0001 } with (full) Burgers vector b 0 = a . In the phase field model for restricted slip in TiB 2 [34,48], η is related to the magnitude b of the Burgers vector of a partial dislocation and cumulative dislocation density ρ D . It is is used to interpolate from null to saturation shear γ 0 on a single system in (26). Regularization length, cleavage anisotropy, and irreversibility are addressed similarly to B 4 C; values are justified in prior work [15]. The active slip system was chosen among six possible basal systems (three pairs with parallel s of opposing signs) by the maximum applied Schmid factor [52], giving s and m . The maximum distance a typical dislocation travels prior to arrest is x ¯ = 50 nm [12]. Denote by ρ S = 10 15 m 2 the saturation density of dislocations. The stored elastic energy density of dislocation lines is 1 2 G 0 b 2 ρ D [42]. Then [34,48],
η = ( b / b 0 ) ρ D / ρ S , γ 0 = ρ S b 0 x ¯ , A ^ = 1 2 G 0 b 0 2 ρ S .
Table 1. Physical parameters for B 4 C, TiB 2 , and boundary regions.
Parameter (Units)B 4 CTiB 2 BoundaryDescription (Refs.)
ρ 0 (g/cm 3 )2.524.52-mass density 1 [34,58,59]
B 0 (GPa)205240211initial bulk modulus [14,59,60]
G 0 (GPa)187255200initial shear modulus [14,59,60]
β 0 (-)8.403.047.16bulk stiffening in (38) [14,61,62]
Υ 0 (J/m 2 )3.274.143.47nominal fracture energy [34,48,63]
α ^ 10100-cleavage anisotropy [27,34,48,52]
Γ (J/m 2 )0.540.12-twin boundary or SF energy [12,34,48]
γ 0 0.310.015-max twin shear or plastic slip [12,34,48]
A ^ (MPa)18811.4-phase or dislocation energy [34,48,64]
l ξ = l η ( μ m)0.10.10.1regularization length [34,48,65]
σ ˜ 0 (GPa)−0.4961.660-nominal residual stress in (46) [4,6,34]
K R (MPa·m 1 / 2 )1.54-1.25residual toughening in (47) [4]
1 B4C-23 vol.% TiB2 composite ρ0 = 2.99 g/cm3 [6,34].

3.3. Grain and Phase Boundaries

As in some prior work [3,15,52], larger crystals of each phase are encapsulated in an isotropic binder with effective elastic and fracture properties. This binding matrix accounts for the effects of phase and grain boundaries and very small grains that cannot be resolved discretely in FE simulations. Fracture properties can vary among boundary regions (e.g., different grain and phase boundary facets), each defined by initial position vector X ¯ . The matrix has the same volume fractions of constituents as the entire composite. Thus, isotropic elastic properties of the composite [14] are used for the matrix.
Superscripts ( · ) ( 0 ) , ( · ) ( 1 ) , ( · ) ( 2 ) correspond to (B 4 C, TiB 2 , boundary) phases. Let ( υ ( 0 ) , υ ( 1 ) ) = ( 0.77 , 0.23 ) be the initial volume fractions of the (B 4 C, TiB 2 ) phases of the composite, where υ ( 0 ) = 1 υ ( 1 ) . In the absence of experimental or atomic simulation data, the fracture surface energy for boundary regions follows a mixture rule with possible heterogeneity, the latter scaled according to global Weibull statistics via location-dependent function r ^ :
Υ ( 2 ) ( X ¯ ) = υ ( 0 ) Υ ( 0 ) + υ ( 1 ) Υ ( 1 ) = Υ 0 ( homogeneous ) , ( υ ( 0 ) Υ ( 0 ) + υ ( 1 ) Υ ( 1 ) ) · r ^ ( X ¯ ) ( Weibull ) ; r ^ ( X ¯ ) = f ^ 2 ( Υ 0 , m ) ( X ¯ ) .
When homogeneous boundary energies are imposed, Υ ( 2 ) = Υ 0 is independent of X ¯ . When heterogeneous energies are imposed, Υ ( 2 ) contains dimensionless multiplier r ^ , where a different instantiation of r ^ is applied at each boundary region X ¯ . Previous works [15,33] considered completely random (uniform) fracture energy distributions on the approximate interval r ^ ( 0 , 2 ) . Weibull distributions on the fracture toughness and strengths of grain boundaries were investigated in cohesive FE simulations of polycrystalline alumina [35] with Weibull modulus m = 10 , roughly characteristic of macroscopic strength statistics [36]. The macroscopic Weibull modulus has not been measured for B 4 C-TiB 2 , so m = 10 was used for the present phase field simulations, with the shape factor given by tensile failure stress P 0 Υ 0 [14,66]. The Weibull probability density function f for failure stress P 0 is then
f ( P ; P 0 , m ) = m P 0 P P 0 m 1 exp P P 0 m .
In a given simulation, field f ^ was initialized over all grain boundary facets such that P follows (45) in discretized form, squared in (44) to account for Υ P 2 in the phase field approach ( f ^ f ). The median value of P from (45) is P 0 · ( ln 2 ) 1 / m 0.964 P 0 , so the median energy is 0.929 Υ 0 , which is slightly lower than that of the homogeneous condition ( m ). The anisotropic mechanisms of twinning and dislocation slip were omitted in isotropic boundary regions, and α ^ = 0 accordingly. For simulations of pure B 4 C, a distinction was neither necessary nor imposed between the properties of bulk crystals and grain boundary regions. Since pure B 4 C tends to fracture transgranularly, rather than intergranularly [6], the resolution of the distributions of its boundary energies was deemed uncritical here, though the distributions could be considered given sufficient microscopic data. Macroscopic failure statistics emerged regardless, due to grain-to-grain variations of cleavage plane orientations.

3.4. Residual Stresses

The B 4 C-TiB 2 composite is processed at temperature T P T 0 , where T 0 is room temperature. Cooling from T P leads to unequal contraction among B 4 C and TiB 2 grains due to different coefficients of thermal expansion A 0 of each phase. Values of σ ˜ 0 were calculated for each bulk phase using the analytical solution of Taya et al. [4]. In the simulations, each crystal was assigned a uniform value of σ ˜ 0 during a seeding step. Initial residual stresses were redistributed as an outcome of the solution, to maintain stress and order parameter equilibrium, before (see Figure 1b) and after displacement boundary conditions were applied. Boundary regions have σ ˜ 0 = 0 since they are nominally self-equilibrated; however, after equilibration, boundary regions can be initially stressed depending on the morphology and composition of the surrounding microstructure. As in the original derivations [4], isotropic thermal expansion was assumed, where α ( i ) = 1 3 A 0 ( i ) is the linear thermal expansion coefficient of the bulk phase i = 0 , 1 . Young’s modulus and Poisson’s ratio were E 0 ( i ) and ν 0 ( i ) , and Ξ = [ ( 1 + ν 0 ( 0 ) ) / ( 1 2 ν 0 ( 1 ) ) ] [ E 0 ( 1 ) / E 0 ( 0 ) ] . Residual stresses of thermal origin ( σ ˜ 0 ( 0 ) , σ ˜ 0 ( 1 ) ) for (B 4 C, TiB 2 ) grains are calculated from analytical micromechanics [4] as
σ ˜ 0 ( 0 ) = υ ( 1 ) υ ( 0 ) σ ˜ 0 ( 1 ) = 2 υ ( 1 ) E 0 ( 0 ) Ξ · ( α ( 1 ) α ( 0 ) ) ( T 0 T P ) ( 1 υ ( 1 ) ) ( Ξ + 2 ) ( 1 + ν 0 ( 0 ) ) + 3 Ξ υ ( 1 ) ( 1 ν 0 ( 0 ) ) .
Residual stresses are self-equilibrated: υ ( 0 ) σ ˜ 0 ( 0 ) + υ ( 1 ) σ ˜ 0 ( 1 ) = 0 . The fracture toughness of a given phase with compressive residual stress was increased by K R [4]:
K R ( i ) = 2 σ ˜ 0 ( i ) ( 2 / π ) ( 1.085 d / υ ( 1 ) d ) .
The mean grain diameter of the less-abundant phase is d. Fracture energy is updated via [15]
Υ ( i ) = ( K C ( i ) + K R ( i ) ) 2 [ 1 ( ν 0 ( i ) ) 2 ] / ( 2 ψ R E 0 ( i ) ) , ψ R 2 ,
with K C the fracture toughness corresponding to Υ 0 via the usual linear elastic fracture mechanics relation [14,15]. The outcomes of this model were σ ˜ 0 < 0 for B 4 C (residual compression) and σ ˜ 0 > 0 for TiB 2 (residual tension). Fracture energy Υ ( 2 ) increased by K R ( 0 ) via Υ ( 0 ) from (48) inserted into (44), since negative (i.e., compressive) residual stress toughens subscale B 4 C constituents. The corresponding K R ( 2 ) was extracted from (48) applied to the binder. The values in Table 1 were obtained from α ( 0 ) = 4.8 × 10 6 /K [58], α ( 1 ) = 8 × 10 6 /K [59], d = 3 μ m, and T P T 0 = 1873 K [6]. Parameter ϵ C was found from (42).

4. Numerical Methods

The FE method with an implicit formulation is invoked for solution of boundary value problems of deforming polycrystals that implement the variational phase field theory and constitutive models and parameters of the respective Section 2 and Section 3.

4.1. Geometric Rendering and Investigated Parameters

Each polycrystal contains on the order of 50 polyhedral bulk grains. These belong to the B 4 C or TiB 2 phase with the associated parameters of Table 1. As discussed in Section 3.3, a very thin layer of binder material, just wide enough to resolve cracks in the regularized phase field approach, covers each bulk grain. This layer is partitioned into many domains. Each domain corresponds to a boundary layer facet between neighboring crystals, and each domain has a centroidal coordinate vector X ¯ . Heterogeneous fracture properties were implemented from (44).
A representative FE mesh of a B 4 C-TiB 2 polycrystal is shown in Figure 1a. The volume of the domain, Ω 0 , is 10 3 μ m 3 . The three phases (B 4 C, TiB 2 , and boundary) are differentiated by color in Figure 1a. Volume fractions of (B 4 C, TiB 2 ), denoted ( υ ( 0 ) , υ ( 1 ) ) = ( 0.77 , 0.23 ) , were exactly reproduced. The average grain diameter was 3 μ m; too few grains were included to attempt matching experimentally determined size and orientation distributions. Random lattice orientations were assigned. Some simulations modeled pure B 4 C rather than the composite, in which case, all domains were logically assigned properties of B 4 C. Meshes consisted of approximately 1.5 M hexahedral elements with full integration. As discussed in prior 3D phase field modeling works on boron carbide- and silicon carbide-based ceramic composites with comparable mesh densities [15,52,67], FE meshes are sufficiently refined to resolve regularization lengths for fracture, slip, and twinning and, thereby, mitigate the potential mesh size dependence of solutions.
The simulation results of Section 5 investigated the effects of the following for biaxial loading conditions corresponding to pure shear, rather than uniaxial extension prioritized in a prior study [15]:
  • Composition: B 4 C-23 vol. % TiB 2 versus pure B 4 C;
  • Residual stress: nonzero σ ˜ 0 enabled via (46) or suppressed ( σ ˜ 0 = 0);
  • Twinning and slip: η > 0 enabled or suppressed ( η = 0 );
  • Boundary properties: Weibull distributions (as opposed to random [15]) according to (44);
  • Grain morphology: effects examined via different loading directions;
  • Lattice orientation: randomized to activate different cleavage, habit, and slip planes.

4.2. Boundary Conditions and Homogenization
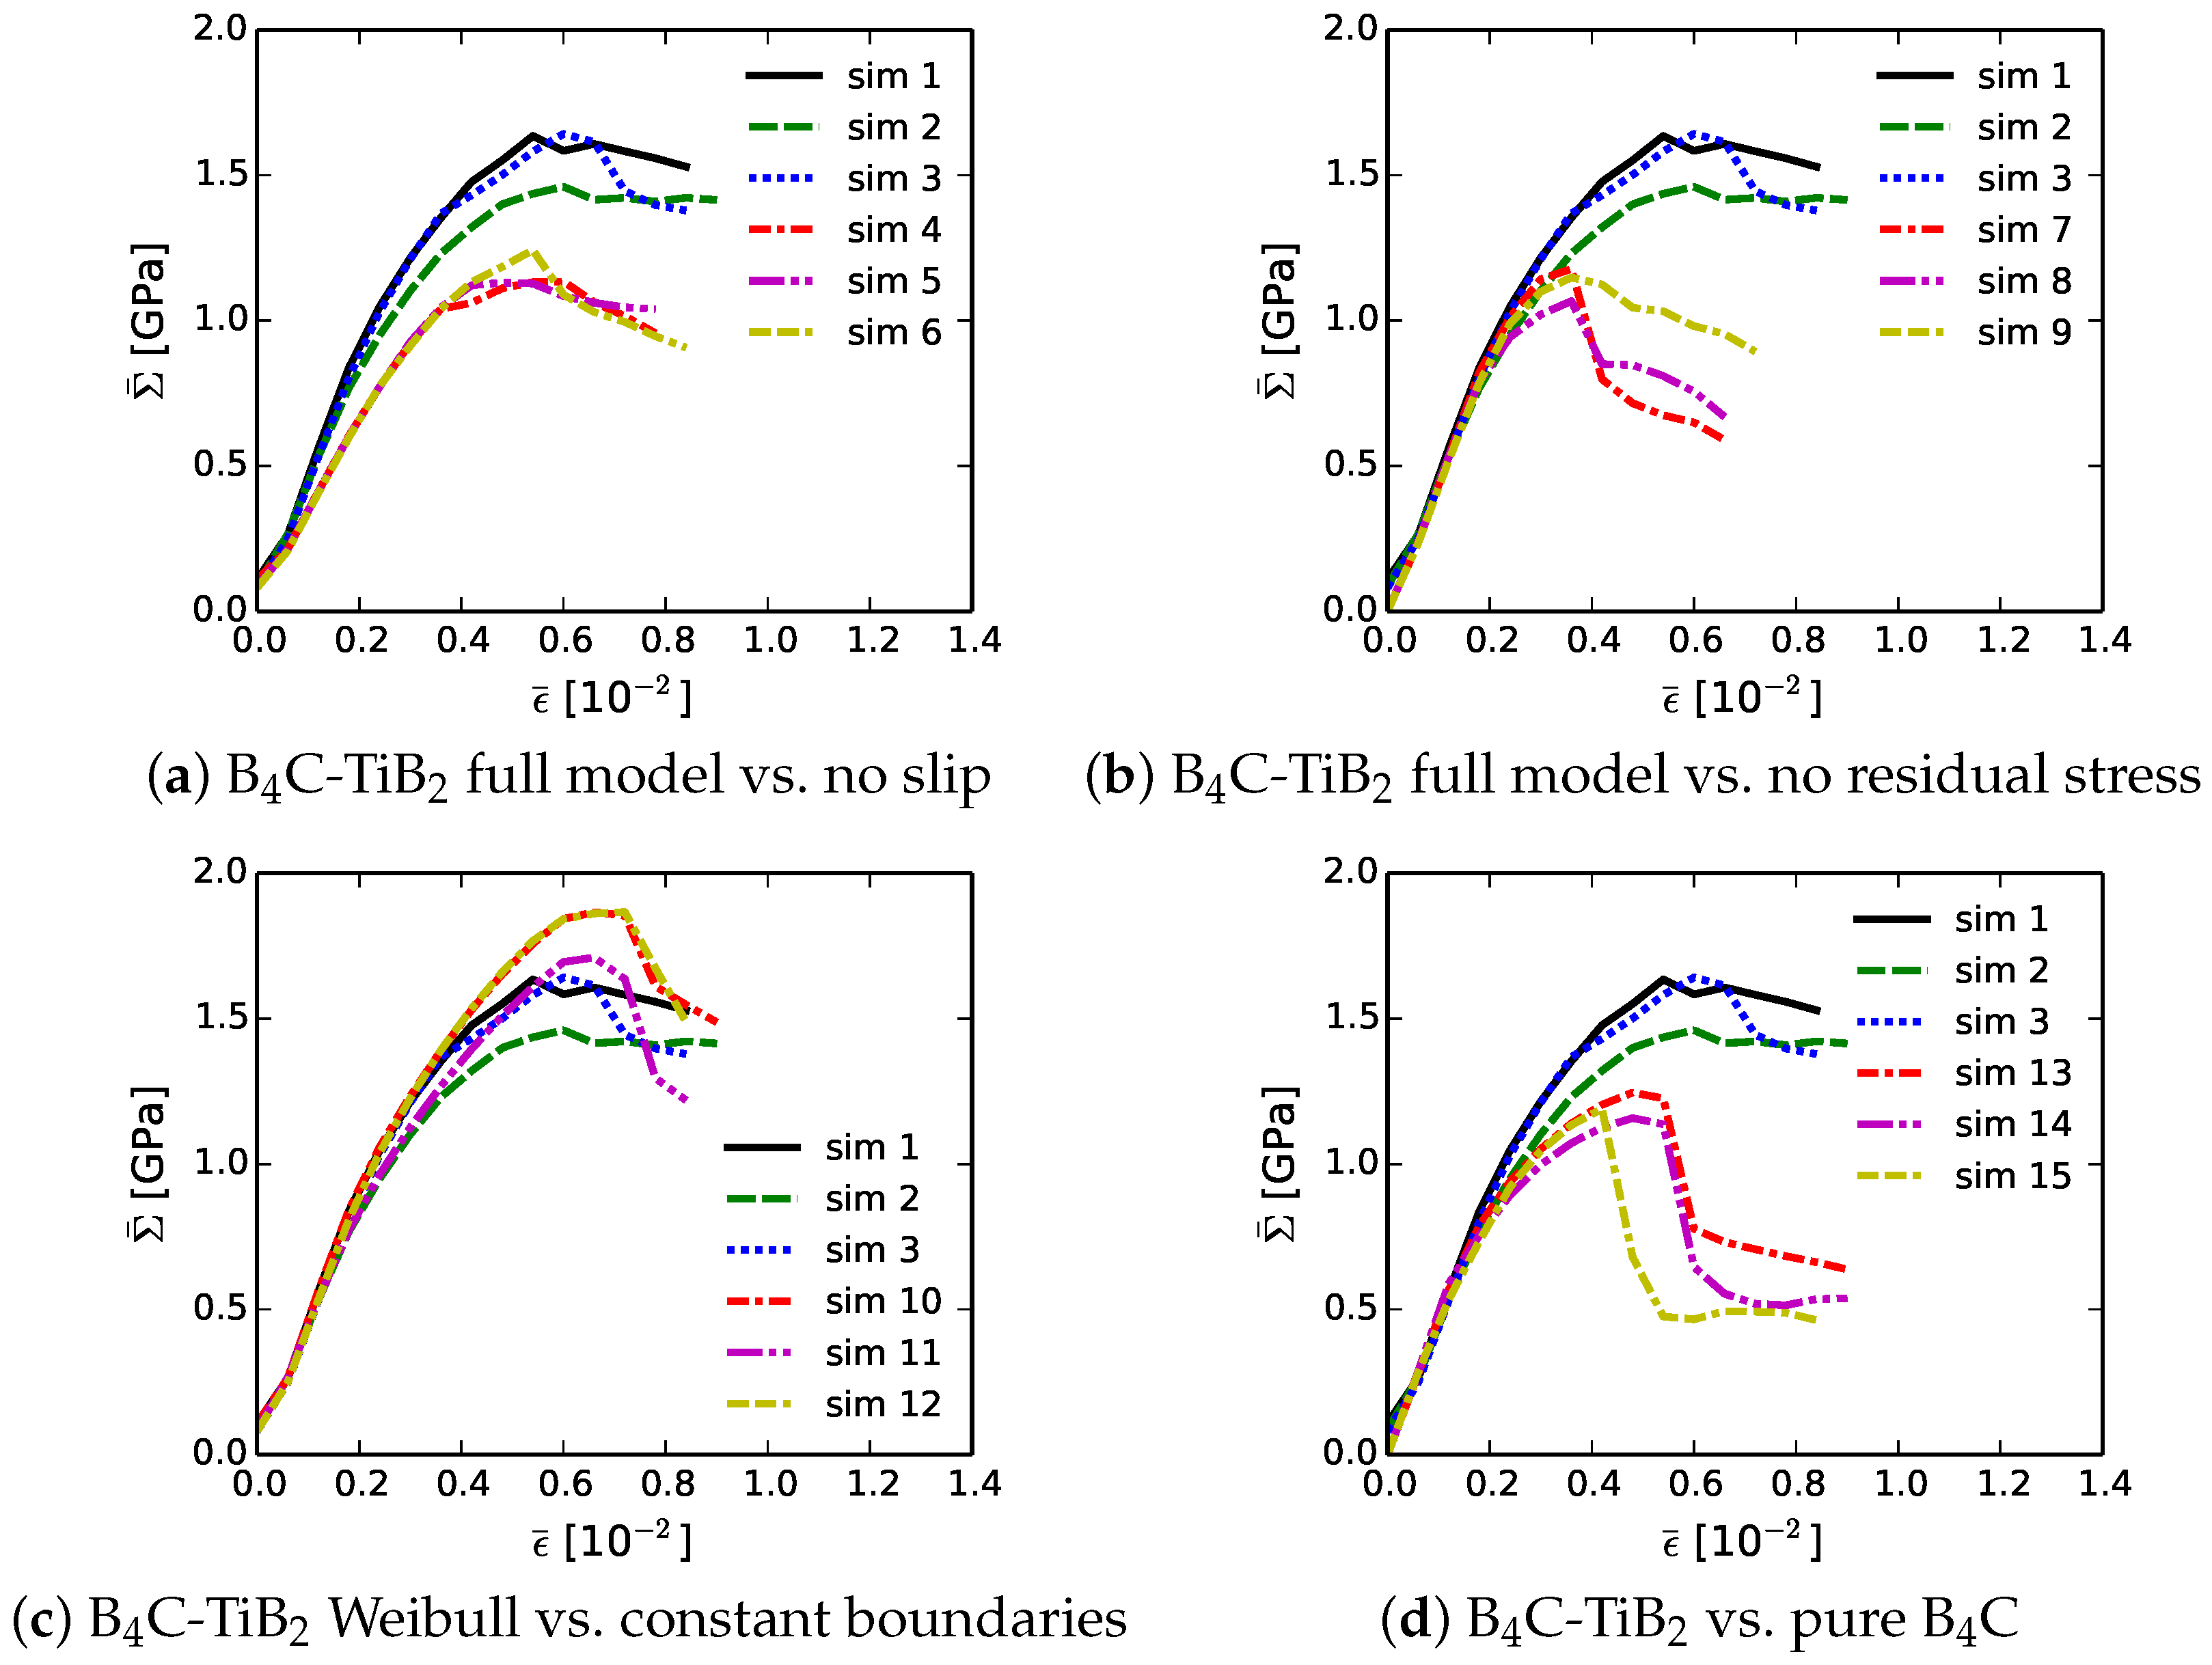
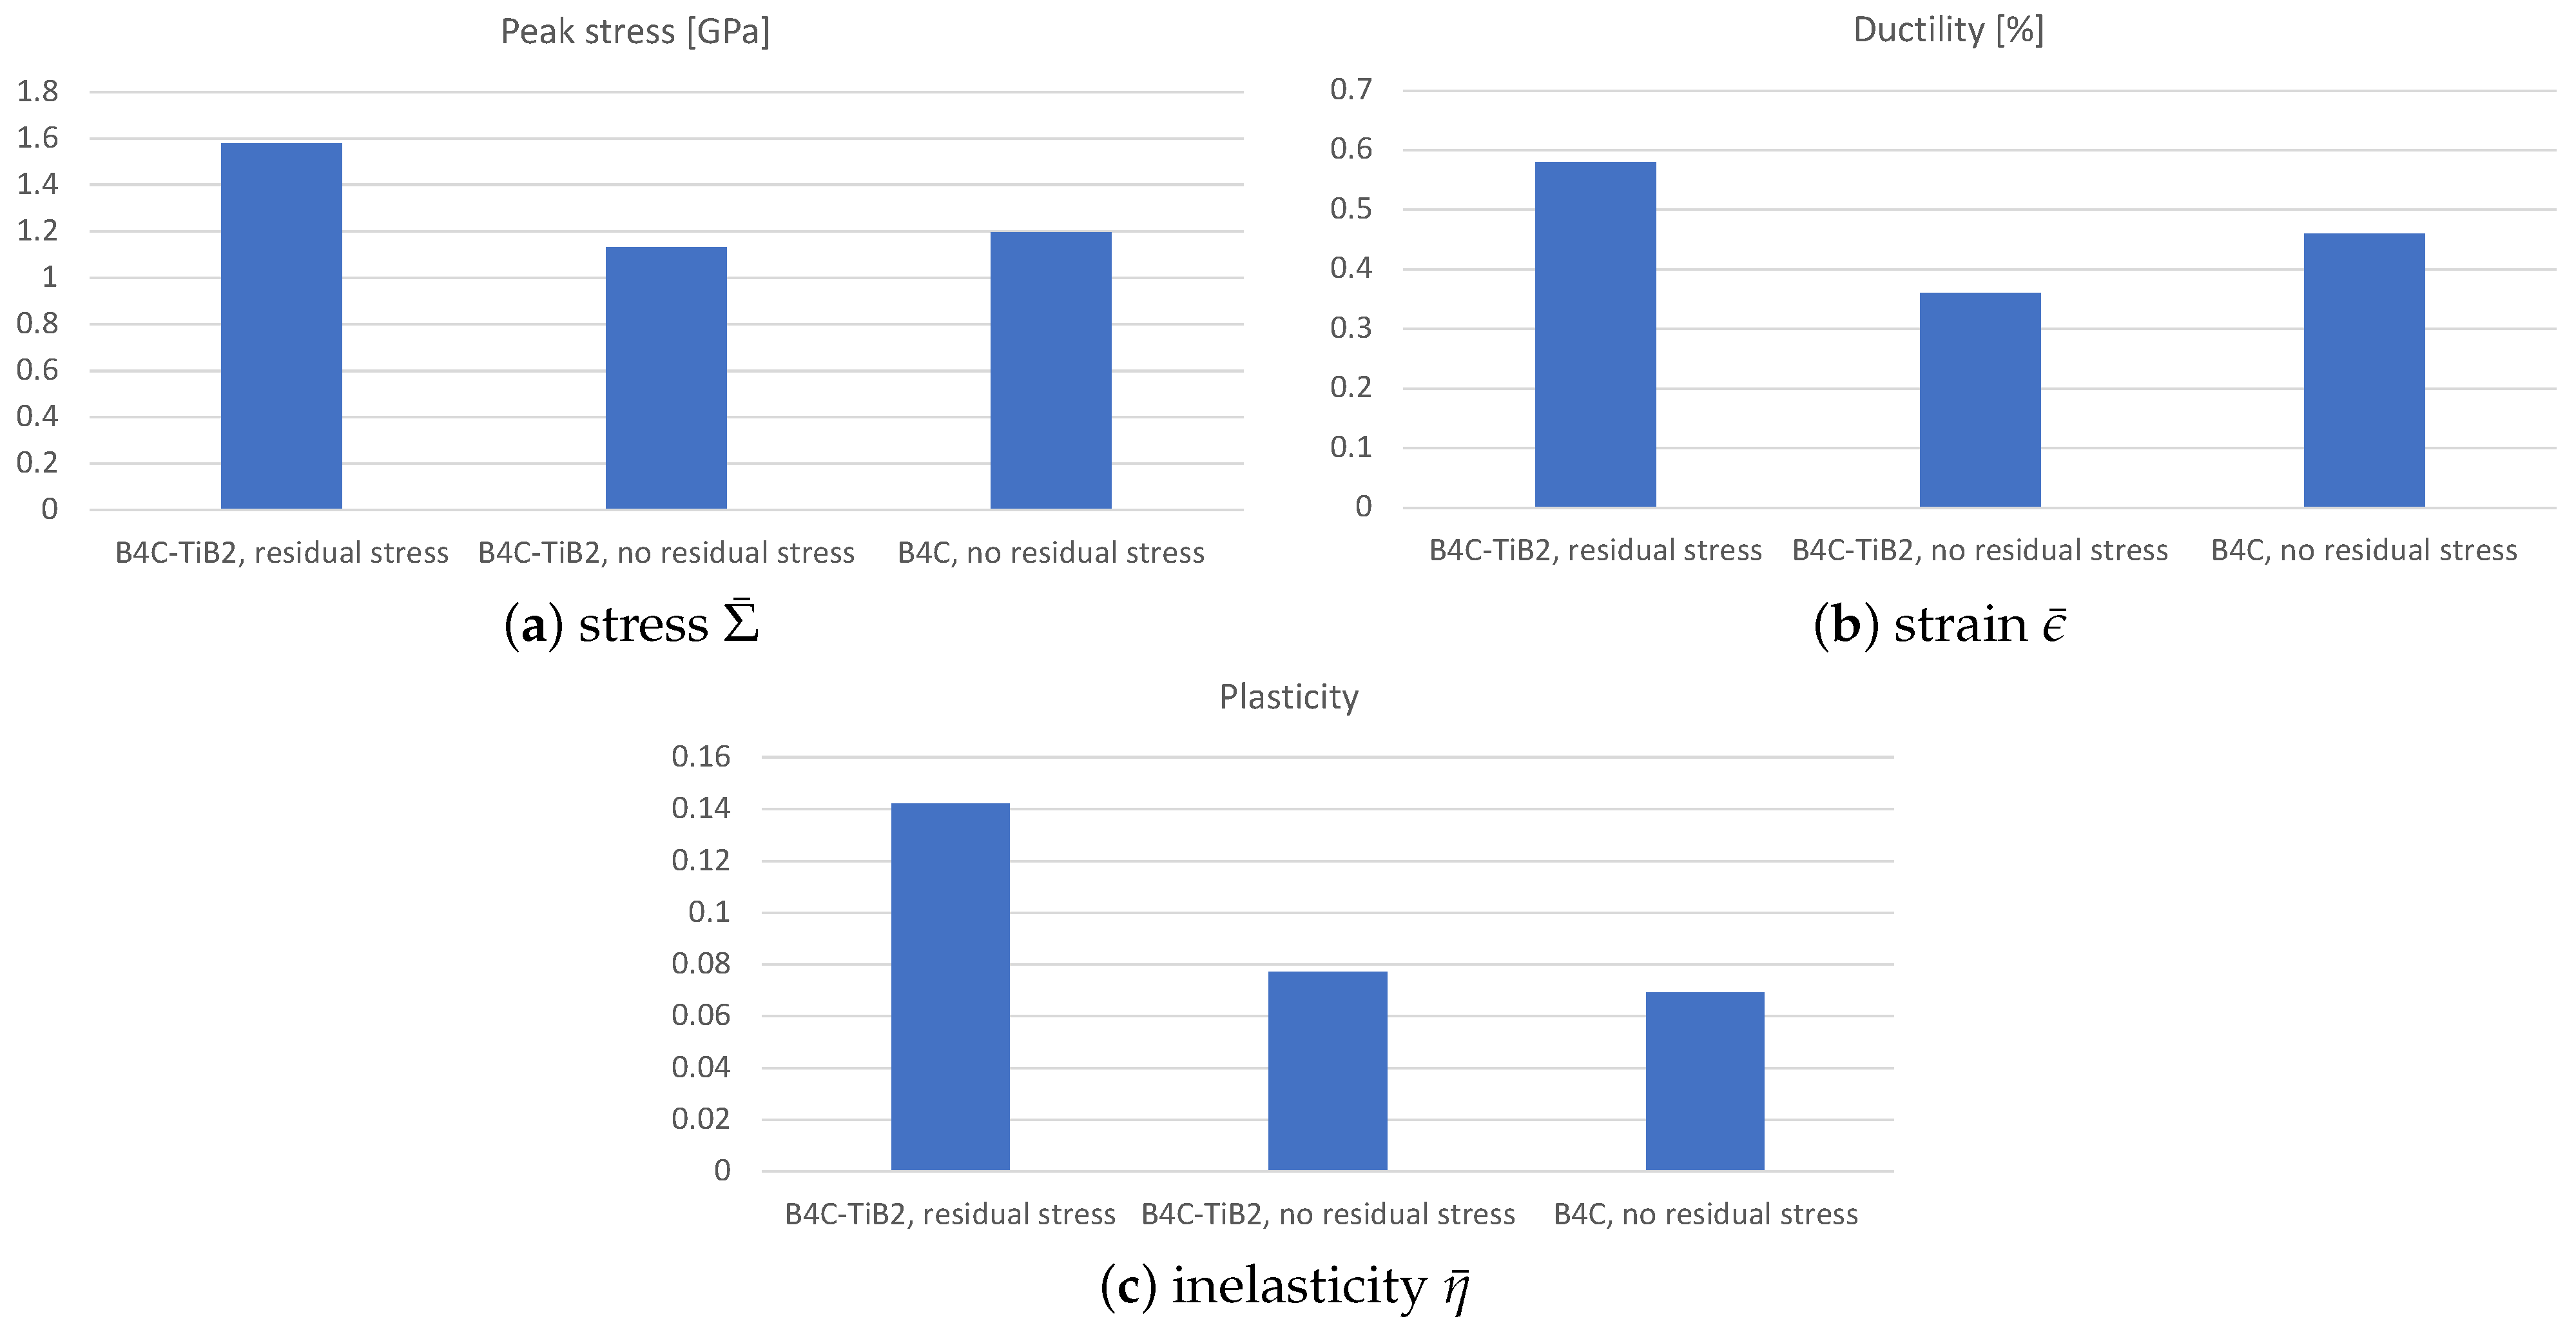
Conjugate gradient energy minimization was applied in implicit FE simulations at each imposed displacement increment δ i . Fields u ( X ) , η ( X ) , ξ ( X ) were sought that minimized Ψ subject to boundary constraints, in accordance with (13). A load parameter ϵ ¯ is defined as
ϵ ¯ = ( 1 / L 0 ) i δ i 0 ,
where the edge length of domain Ω 0 is L 0 = 10 μ m; ϵ ¯ quantifies the average strain. Displacement boundary conditions imposed on Ω 0 correspond to pure shear (i.e., biaxial tension–compression). For example, the macroscopic strain tensor ϵ ¯ for tension–compression in the X 1 X 2 -plane ( J , K = 1 , 2 ) is
ϵ ¯ = ϵ ¯ [ E 1 E 1 E 2 E 2 ] .
Principal directions E J and E K were permutated among J , K = 1 , 2 , 3 , where J K . (In contour figure legends, X 1 X , X 2 Y , X 3 Z .) The aggregate is traction-free in the direction orthogonal to the plane of shear. An equilibrated stress distribution at ϵ ¯ = 0 for a residually stressed B 4 C-TiB 2 aggregate is shown in Figure 1b. Note that B 4 C grains were initially compressed, TiB 2 initially extended, and boundaries may be in tension or compression depending on location. Free natural boundary conditions t ξ = 0 and t η = 0 [40,66] are assigned in (16) over all faces of the cube comprising Ω 0 upon which tensile displacement boundary conditions are not applied. On faces of Ω 0 where essential tensile increments δ i are enforced, conditions ξ = 0 and η = 0 are invoked to eliminate premature fracture or yielding of the material on such boundaries [15] (i.e., failure at specimen grips is inhibited). The average stress, fracture parameter, and twinned or slipped fraction are
P ¯ = 1 Ω 0 Ω 0 P d Ω 0 , ξ ¯ = 1 Ω 0 Ω 0 ξ d Ω 0 , η ¯ = 1 Ω 0 Ω η d Ω 0 .
Local pressure is p ( X ) = 1 3 tr P ( X ) , and the local von Mises stress is Σ ( X ) = { 1 2 [ ( P 11 P 22 ) 2 + ( P 22 P 33 ) 2 + ( P 33 P 11 ) 2 + 6 ( P 12 2 + P 23 2 + P 31 2 ) ] } 1 / 2 0 , where P I J = P I J ( X ) . When found from (51),
p ¯ = 1 3 tr P ¯ , Σ ¯ = { 1 2 [ ( P ¯ 11 P ¯ 22 ) 2 + ( P ¯ 22 P ¯ 33 ) 2 + ( P ¯ 33 P ¯ 11 ) 2 + 6 ( P ¯ 12 2 + P ¯ 23 2 + P ¯ 31 2 ) ] } 1 / 2
are the average pressure and average effective shear stress.

5. Model Results

Eighteen simulations (Sims), all differing from those in prior work [15], were undertaken with the pure shear boundary conditions of (50). The features are listed in Table 2. Polycrystals were assigned one of two material categories, either B 4 C-23 vol. % TiB 2 (Sims 1–12) or all B 4 C (Sims 13–18), one of three lattice orientation distributions, and one of three permutations of loading directions J , K corresponding to applied strain ϵ ¯ J K . Only three out of a maximum of six permutations, when sign reversals were considered, were simulated. Twinning and slip were disabled in Sims 4–6 and 16–18. Residual stresses were omitted in Sims 7–9 and 13–18, where the latter six contain all B 4 C. Weibull distributions of grain and phase boundary fracture stress, (44) with r ^ differing from unity, were used in most representations of the composite (Sims 1–9); otherwise, Υ ( 2 ) is spatially constant.
Shown in Figure 2 are the results for Sim 2, which corresponds to the B 4 C-23 vol. % TiB 2 composite with slip and twinning enabled, residual stresses enabled, and a Weibull distribution of effective grain and phase boundary strengths. Stress normal to the extension direction is visualized in Figure 2a, where local relaxation is evident in many fractured regions. The fracture parameter contour for ξ of Figure 2b demonstrates a preponderance of fractures along grain and phase boundaries, with very sparse fractures within large grains of either phase. Inelasticity order parameter η in Figure 2c shows the largest values in TiB 2 grains ( 0.5 η 1.0 ) preferentially oriented for basal plane slip. Low values in B 4 C crystals ( 0.05 η 0.25 ) correspond to diffuse twinning or stacking fault formation prior to shear localization. However, a few localized zones where η approaches unity do arise in B 4 C, which correspond to amorphous shear band formation.
Fracture contours for six simulations (Sims 1, 4, 7, 10, 14, 17), i.e., one of each grouping with similar characteristics in Table 2, are presented in Figure 3. Comparing Figure 3a with Figure 3b, transgranular fractures, particularly in the TiB 2 phase, are more prevalent when η representing basal slip is suppressed. Similarly, in Figure 3c, the tendency for transgranular fracture is increased in the absence of residual stress. When uniform (i.e., constant) grain and phase boundary strengths were imposed rather than Weibull statistics, fewer distinct cracks emerged and at different locations, as is evident in Figure 3d.
With or without twinning and shear localization (i.e., amorphous banding) enabled, the pure B 4 C material is dominated by transgranular fractures, along the same plane of maximum shear stress in Figure 3e,f. The fractured zone is physically wider in the latter case at the same ϵ ¯ , but η does not appreciably alter the crack morphology. It was found, however, that the shear strain at peak load was reduced by an average of 0.08% when inelastic shear was incorporated in the simulations of pure B 4 C. Thus, ductility is compromised by the transition from twinning to amorphous banding, leading to earlier catastrophic fracture in the monolithic material.
The effective average stress Σ ¯ of (52) is reported versus the applied strain ϵ ¯ of (50) for 15 simulations in Figure 4, where results from the full composite model (Sims 1, 2, 3) are contrasted with those with other model features enabled/disabled in Sims 4 through 15 in each subfigure. For every simulation, the maximum value of Σ ¯ attained is listed in Table 2, along with the following average field variables at the applied strain corresponding to peak stress: average pressure p ¯ , average inelasticity order parameter η ¯ , and average fracture order parameter ξ ¯ . The following trends are noted from Figure 4, Table 2, and visual inspection of individual contour plots for all 18 simulations:
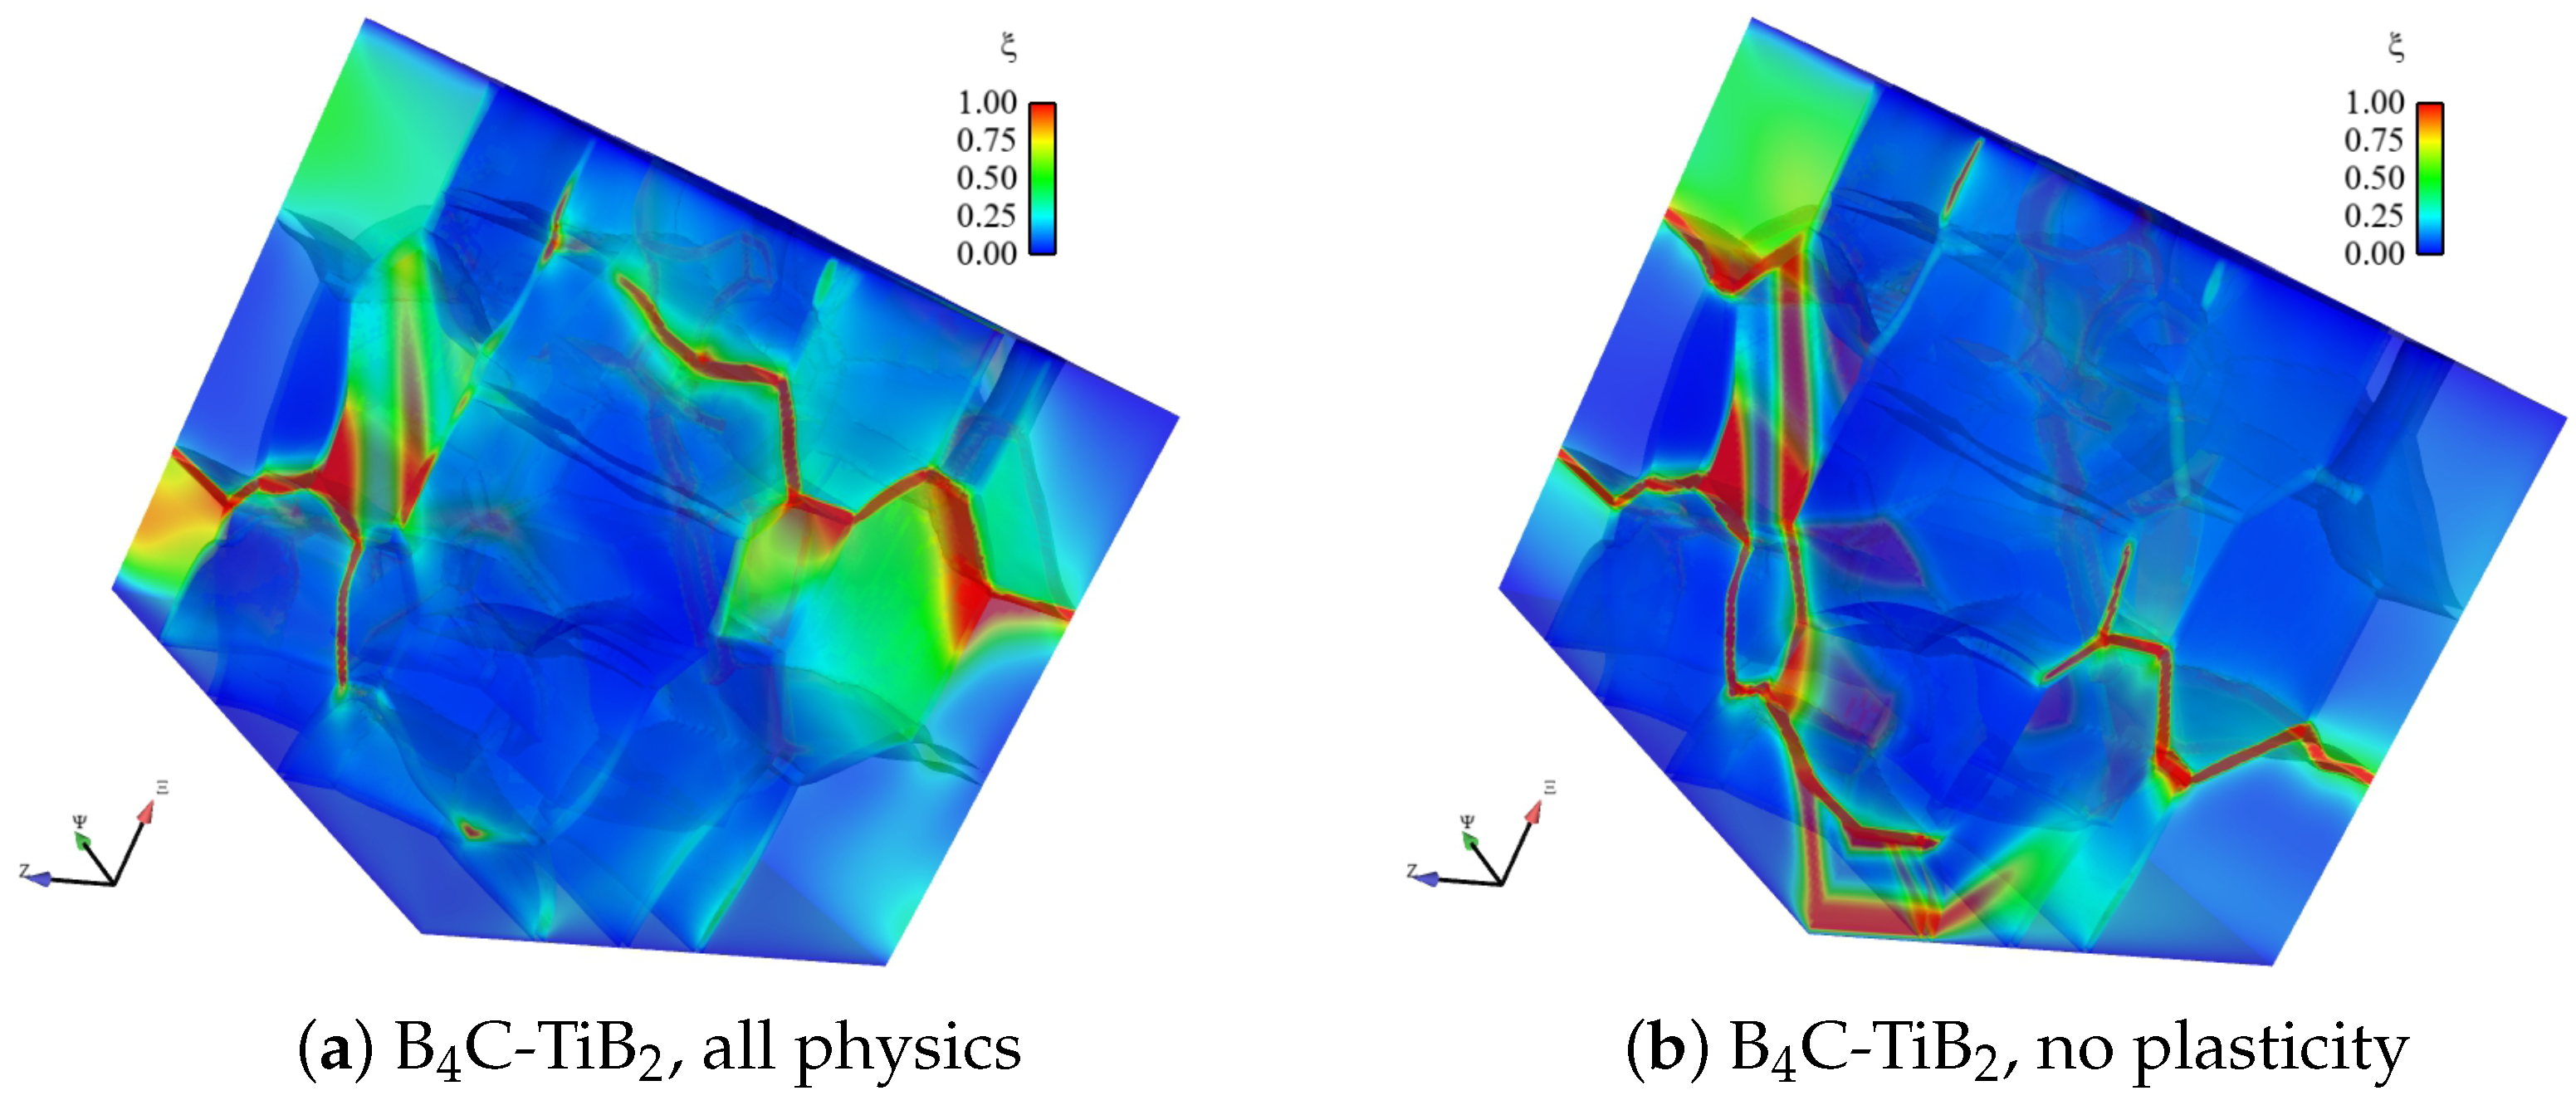
  • Plasticity, when it occurs, is much more prevalent in the TiB 2 phase (basal slip) than the B 4 C phase (twinning, shear bands).
  • Plasticity reduces the tendency for transgranular fracture, especially in TiB 2 grains of the composite.
  • Average peak pressure p ¯ is always slightly compressive, but average pressure is negligible compared to effective deviatoric stress Σ ¯ , as expected for equi-biaxial loading.
  • Thermal-residual stress enhances overall strength and ductility, primarily via toughening of the B 4 C phase initially under residual compression.
  • Heterogeneous grain and phase boundary energies from the Weibull strength statistics lead to more cracks and lower overall strength, in general, than constant boundary energies, which correspond to fewer very weak links in the microstructure.
  • The composite, in which intergranular fractures dominate (with transgranular fractures arising sometimes, but less often) demonstrates greater overall strength and ductility than pure B 4 C, in which transgranular fractures dominate.
  • Peak effective stress for the B 4 C-TiB 2 composite, averaged over Sims 1, 2, and 3 from Table 2, is 1.58 GPa. Peak effective stress for pure B 4 C, averaged over Sims 13, 14, and 15, is 1.20 GPa. The ratio of composite-to-monolithic material effective strength is 1.58/1.20 = 1.32.
  • When plasticity is suppressed in constitutive models of both materials (Sims 4, 5, and 6 vs. 16, 17, and 18), the ratio of composite-to-monolithic material effective strength is 1.17.
When slip and twinning mechanisms are potentially active, peak Σ ¯ appears higher, as noted in related work under different boundary conditions [15]. However, further analysis revealed that the applicability of this trend is sensitive to modeling assumptions and parameters for the phase field representation of inelasticity, as well as the microstructure (e.g., lattice orientation) and other details entering the stress state homogenization procedures. For example, peak strength was found to decrease, but ductility was found to increase, when twinning was more profuse in a diamond-SiC ceramic composite [52]. In another study [34], the tendency for strength increase or decrease was found to depend on lattice orientation affecting the activity, or lack thereof, of inelastic deformation systems. Above a small threshold, or with the availability of more systems, plasticity may reduce hardness and peak load capacity as the tendency to flow inelastically increases [52]. As noted in the present findings and experiments [68], a transition from inelastic shear (e.g., twinning) to amorphization may inhibit ductility in B 4 C. Regardless, a consistent trend among current and prior work is a decrease in average fracture activity ξ ¯ with increasing average slip or deformation twinning η ¯ . Along with local crack tip blunting, this should contribute to a higher toughness, even if ultimate strength is reduced.

Comparison with Experiments and Prior Modeling

Mechanical experiments reported by Rubink et al. [6] include static and dynamic flexure via three-point bending, Chevron notched bending for fracture toughness, and Vickers indentation for hardness and fracture toughness. Scanning electron microscopy (SEM) was used to investigate post-mortem fracture paths in samples recovered from these tests. Transmission electron microscopy (TEM) was used to further investigate fracture and dislocation plasticity mechanisms at finer resolution, where a focused ion beam (FIB) was used to extract small-scale samples in the vicinity of cracks induced by Vickers indentation. Synchrotron X-ray diffraction (XRD) was used to measure lattice spacing and infer residual stress states of grains of each phase.
Analysis of SEM images showed crack deflection and crack bridging by second-phase TiB 2 particles. The high surface roughness of the cracked material suggested intergranular fracture in the composite. In contrast, pure B 4 C failed predominantly by transgranular fracture, similar to observations in other studies [68]. The same physical mechanisms were observed in both static and dynamic flexure. The analysis of TEM images corroborated the fracture tendencies from SEM, i.e., more crack branching in the composite than the pure B 4 C. The TEM images further showed stacking faults and dislocations in the TiB 2 grains, as observed in earlier work [12,13].
The analysis of XRD peaks in the composite showed definitive compressive lattice strains for B 4 C and milder tensile lattice strains for TiB 2 . The addition of TiB 2 to B 4 C yielded higher flexure strength, a higher elastic modulus, and higher fracture toughness [6]. The lower toughness of pure B 4 C was quantified by longer cracks produced by Vickers indentation; however, the higher hardness of pure B 4 C was quantified by smaller residual indents. Similar improvements in the mechanical properties were measured in earlier work on a previous generation of SPS ceramics [34]. Improvements in tensile strength and toughness were likewise measured in hot-pressed B 4 C-TiB 2 composites of lower TiB 2 content (10%) and with Si/B doping [68,69].
The following differences in the experimental findings are summarized for the dual-phase composite with 23% by volume of the second phase, i.e., B 4 C-23 vol. % TiB 2 versus pure B 4 C, both produced by SPS [6]:
  • Elastic modulus increase of approximately 20%;
  • Static flexure strength increase of approximately 20%;
  • Dynamic flexure strength increase of approximately 30%;
  • Static fracture toughness increase on the order of 100%;
  • Increased dislocation mechanisms;
  • Increased tendency for intergranular over transgranular fracture;
  • Vickers hardness decrease of approximately 10%;
  • Mass density increase of approximately 20%.
The first six items listed above are beneficial for the composite, the last two detrimental. The apparently beneficial properties of dislocation plasticity for mitigating fracture in the TiB 2 phase have been noted for other ceramics such as aluminum nitride [70]. Twins and amorphous shear bands have been observed in the B 4 C phase. Twins have been suggested to improve the mechanical properties of B 4 C [71,72], while solid-state amorphization is thought to degrade strength, since it tends to be accompanied by fracture and fragmentation [73]. Doping with silicon (Si) and boron (B) has been shown to reduce the tendency for amorphization in B 4 C [68,69]; the addition of TiB 2 to such doped materials produces increased flexure strength and toughness through the mechanisms listed above [6], as well as grain refinement.
The present model results corroborate the above experimental findings. Under biaxial loading, when the Weibull distributions of boundary strengths and thermal-residual stresses (where compressive stresses intrinsically toughen the more brittle B 4 C phase) are implemented, the phase field predictions of improved peak strength, reduced fracture tendency (i.e., increased overall toughness), and increased plasticity and ductility with the addition of TiB 2 all concur with experimental data [6,34]. For supporting quantitative evidence, see Figure 5, which compares numerical averages, over three simulation cases, for the composite with and without residual stress and pure B 4 C. Average strength, ductility, and plastic deformation are all higher in the composite with residual stress than in the composite when residual stress is omitted and are also all higher in the composite relative to pure B 4 C. In both the model and experiment, intergranular fracture arises more often than transgranular fracture in the composite, as opposed to strongly preferential cleavage fracture in the monolithic B 4 C, which is clear in the model results upon comparison of Figure 3a with Figure 3e. Prior recent work [15] for tensile loading conditions and uniform boundary strengths produced similar trends; furthermore, the toughness, albeit at a lower scale of resolution than the Vickers experiments, was quantified for pre-cracked samples, providing a respectable validation of the model and parameters. The reduction in peak strength with increased variability of the properties, attributed to more weak links for fracture in a probabilistic sense, is shared among tensile and shear loading conditions and among random and Weibull boundary strength distributions.
Overall, including TiB 2 is recommended to improve strength and ductility. However, hardness is reduced and mass density is increased with the addition of TiB 2 . Thus, applications requiring simultaneously high hardness, strength, and ductility, as well as low weight will require moderation of the ideal fraction of TiB 2 , i.e., a trade-off among physical properties. Furthermore, a maximum improvement in strength and toughness exists at a fraction of TiB 2 under 100% since pure TiB 2 tends to demonstrate lower flexure strength and lower fracture toughness than the B 4 C-23 vol. %TiB 2 composite [34].

6. Conclusions

A phase field model of fracture and inelasticity accounting for thermal-residual stresses was implemented in numerical simulations of boron-carbide-based ceramics and ceramic composites. The new computations included the effects of the Weibull distributions of grain and phase boundary energies for biaxial loading of polycrystalline B 4 C and B 4 C-TiB 2 aggregates. The results confirm the experimental observations and trends observed in prior numerical work that focused on tensile loading and uniform boundary strengths. Improved mechanical properties manifest from the toughening effects of residual stresses, plasticity, and cleavage crack blockage by stronger TiB 2 grains and more tortuous intergranular crack paths exhibited by the composite relative to the dominant transgranular failure exhibited by the pure B 4 C.

Funding

This research received no external funding.

Data Availability Statement

Not applicable.

Acknowledgments

Tom Scharf (University of North Texas with joint faculty appointment at DEVCOM ARL) is thanked for sharing experimental observations on boron carbide and boron carbide-titanium diboride ceramics. R.B. Leavy and J. Knap (DEVCOM ARL) are acknowledged for supporting the simulation software used here, first developed in the prior co-authored work [3,15].

Conflicts of Interest

The author declares no conflict of interest.

References

  1. Ko, Y.; Tsurumi, T.; Fukunaga, O.; Yano, T. High pressure sintering of diamond-SiC composite. J. Mater. Sci. 2001, 36, 469–475. [Google Scholar] [CrossRef]
  2. Herrmann, M.; Matthey, B.; Hohn, S.; Kinski, I.; Rafaja, D.; Michaelis, A. Diamond-ceramics composites–new materials for a wide range of challenging applications. J. Eur. Ceram. Soc. 2012, 32, 1915–1923. [Google Scholar] [CrossRef]
  3. Clayton, J.; Guziewski, M.; Ligda, J.; Leavy, R.; Knap, J. A multi-scale approach for phase field modeling of ultra-hard ceramic composites. Materials 2021, 14, 1408. [Google Scholar] [CrossRef] [PubMed]
  4. Taya, M.; Hayashi, S.; Kobayashi, A.; Yoon, H. Toughening of a particulate-reinforced ceramic-matrix composite by thermal residual stress. J. Am. Ceram. Soc. 1990, 73, 1382–1391. [Google Scholar] [CrossRef]
  5. Sigl, L. Microcrack toughening in brittle materials containing weak and strong interfaces. Acta Mater. 1996, 44, 3599–3609. [Google Scholar] [CrossRef]
  6. Rubink, W.; Ageh, V.; Lide, H.; Ley, N.; Young, M.; Casem, D.; Faierson, E.; Scharf, T. Spark plasma sintering of B4C and B4C-TiB2 composites: Deformation and failure mechanisms under quasistatic and dynamic loading. J. Eur. Ceram. Soc. 2021, 41, 3321–3332. [Google Scholar] [CrossRef]
  7. Gao, Y.; Tang, T.; Yi, C.; Zhang, W.; Li, D.; Xie, W.; Huang, W.; Ye, N. Study of static and dynamic behavior of TiB2–B4C composite. Mater. Des. 2016, 92, 814–822. [Google Scholar] [CrossRef]
  8. Pittari, J., III; Subhash, G.; Zheng, J.; Halls, V.; Jannotti, P. The rate-dependent fracture toughness of silicon carbide-and boron carbide-based ceramics. J. Eur. Ceram. Soc. 2015, 35, 4411–4422. [Google Scholar] [CrossRef]
  9. Wenbo, H.; Jiaxing, G.; Jihong, Z.; Jiliang, Y. Microstructure and properties of B4C-ZrB2 ceramic composites. J. Eng. Innov. Technol. 2013, 3, 163–166. [Google Scholar]
  10. Sadowski, T.; Marsavina, L. Multiscale modelling of two-phase ceramic matrix composites. Comput. Mater. Sci. 2011, 50, 1336–1346. [Google Scholar] [CrossRef]
  11. Ortiz, M.; Suresh, S. Statistical properties of residual stresses and intergranular fracture in ceramic materials. J. Appl. Mech. 1993, 60, 77–84. [Google Scholar] [CrossRef]
  12. Vanderwalker, D.; Croft, W. Dislocations in shock-loaded titanium diboride. J. Mater. Res. 1988, 3, 761–763. [Google Scholar] [CrossRef]
  13. Vanderwalker, D. Fracture in titanium diboride. Phys. Status Solidi A 1989, 111, 119–126. [Google Scholar] [CrossRef]
  14. Clayton, J. Nonlinear thermodynamic phase field theory with application to fracture and dynamic inelastic phenomena in ceramic polycrystals. J. Mech. Phys. Solids 2021, 157, 104633. [Google Scholar] [CrossRef]
  15. Clayton, J.; Leavy, R.; Knap, J. Phase field mechanics of residually stressed ceramic composites. Philos. Mag. 2022, 102, 1891–1944. [Google Scholar] [CrossRef]
  16. Bryant, E.; Sun, W. A mixed-mode phase field fracture model in anisotropic rocks with consistent kinematics. Comput. Methods Appl. Mech. Eng. 2018, 342, 561–584. [Google Scholar] [CrossRef]
  17. Na, S.; Sun, W. Computational thermomechanics of crystalline rock, Part I: A combined multi-phase field/crystal plasticity approach for single crystal simulations. Comput. Methods Appl. Mech. Eng. 2018, 338, 657–691. [Google Scholar] [CrossRef]
  18. Nguyen, T.T.; Réthoré, J.; Yvonnet, J.; Baietto, M.C. Multi-phase field modeling of anisotropic crack propagation for polycrystalline materials. Comput. Mech. 2017, 60, 289–314. [Google Scholar] [CrossRef] [Green Version]
  19. Shahba, A.; Ghosh, S. Coupled phase field finite element model for crack propagation in elastic polycrystalline microstructures. Int. J. Fract. 2019, 219, 31–64. [Google Scholar] [CrossRef]
  20. Del Piero, G.; Lancioni, G.; March, R. A variational model for fracture mechanics: Numerical experiments. J. Mech. Phys. Solids 2007, 55, 2513–2537. [Google Scholar] [CrossRef]
  21. Agrawal, V.; Dayal, K. Dependence of equilibrium Griffith surface energy on crack speed in phase field models for fracture coupled to elastodynamics. Int. J. Fract. 2017, 207, 243–249. [Google Scholar] [CrossRef]
  22. Amirian, B.; Jafarzadeh, H.; Abali, B.; Reali, A.; Hogan, J. Thermodynamically-consistent derivation and computation of twinning and fracture in brittle materials by means of phase field approaches in the finite element method. Int. J. Solids Struct. 2022, 252, 111789. [Google Scholar] [CrossRef]
  23. Needleman, A. A continuum model for void nucleation by inclusion debonding. J. Appl. Mech. 1987, 54, 525–531. [Google Scholar] [CrossRef]
  24. Clayton, J. Dynamic plasticity and fracture in high density polycrystals: Constitutive modeling and numerical simulation. J. Mech. Phys. Solids 2005, 53, 261–301. [Google Scholar] [CrossRef]
  25. Foulk, J.; Vogler, T. A grain-scale study of spall in brittle materials. Int. J. Fract. 2010, 163, 225–242. [Google Scholar] [CrossRef]
  26. Clayton, J.; Knap, J. A phase field model of deformation twinning: Nonlinear theory and numerical simulations. Phys. D 2011, 240, 841–858. [Google Scholar] [CrossRef] [Green Version]
  27. Clayton, J.; Knap, J. A geometrically nonlinear phase field theory of brittle fracture. Int. J. Fract. 2014, 189, 139–148. [Google Scholar] [CrossRef]
  28. Clayton, J.; Williams, C. Modelling the anomalous shock response of titanium diboride. Proc. R. Soc. Lond. A 2022, 478, 20220253. [Google Scholar] [CrossRef]
  29. Clayton, J. Finsler differential geometry in continuum mechanics: Fundamental concepts, history, and renewed application to ferromagnetic solids. Math. Mech. Solids 2022, 27, 910–949. [Google Scholar] [CrossRef]
  30. Johnson, K. Contact Mechanics; Cambridge University Press: Cambridge, UK, 1985. [Google Scholar]
  31. Chen, X.; Hutchinson, J.; Evans, A. The mechanics of indentation induced lateral cracking. J. Am. Ceram. Soc. 2005, 88, 1233–1238. [Google Scholar] [CrossRef]
  32. Quinn, G.; Bradt, R. On the Vickers indentation fracture toughness test. J. Am. Ceram. Soc. 2007, 90, 673–680. [Google Scholar] [CrossRef]
  33. Kraft, R.; Molinari, J. A statistical investigation of the effects of grain boundary properties on transgranular fracture. Acta Mater. 2008, 56, 4739–4749. [Google Scholar] [CrossRef]
  34. Clayton, J.; Rubink, W.; Ageh, V.; Choudhuri, D.; Chen, R.; Du, J.; Scharf, T. Deformation and failure mechanics of boron carbide-titanium diboride composites at multiple scales. JOM 2019, 71, 2567–2575. [Google Scholar] [CrossRef]
  35. Zavattieri, P.; Raghuram, P.; Espinosa, H. A computational model of ceramic microstructures subjected to multi-axial dynamic loading. J. Mech. Phys. Solids 2001, 49, 27–68. [Google Scholar] [CrossRef]
  36. Wereszczak, A.; Kirkland, T.; Strong, K.; Jadaan, O.; Thompson, G. Size scaling of tensile failure stress in boron carbide. Adv. Appl. Ceram. 2010, 109, 487–492. [Google Scholar] [CrossRef]
  37. Giannakopoulos, A.; Larsson, P.L.; Vestergaard, R. Analysis of Vickers indentation. Int. J. Solids Struct. 1994, 31, 2679–2708. [Google Scholar] [CrossRef]
  38. Zeng, K.; Giannakopoulos, A.; Rowcliffe, D. Vickers indentations in glass II. Comparison of finite element analysis and experiments. Acta Metall. Et Mater. 1995, 43, 1945–1954. [Google Scholar] [CrossRef]
  39. Gurtin, M. Generalized Ginzburg-Landau and Cahn-Hilliard equations based on a microforce balance. Phys. D 1996, 92, 178–192. [Google Scholar] [CrossRef]
  40. Clayton, J.; Knap, J. Phase field modeling of coupled fracture and twinning in single crystals and polycrystals. Comput. Methods Appl. Mech. Eng. 2016, 312, 447–467. [Google Scholar] [CrossRef]
  41. Allen, S.; Cahn, J. A microscopic theory for antiphase boundary motion and its application to antiphase domain coarsening. Acta Metall. 1979, 27, 1085–1095. [Google Scholar] [CrossRef]
  42. Clayton, J. Nonlinear Mechanics of Crystals; Springer: Dordrecht, The Netherlands, 2011. [Google Scholar]
  43. Brace, W.; Paulding, B.; Scholz, C. Dilatancy in the fracture of crystalline rocks. J. Geophys. Res. 1966, 71, 3939–3953. [Google Scholar] [CrossRef]
  44. Curran, D.; Seaman, L.; Cooper, T.; Shockey, D. Micromechanical model for comminution and granular flow of brittle material under high strain rate application to penetration of ceramic targets. Int. J. Impact Eng. 1993, 13, 53–83. [Google Scholar] [CrossRef]
  45. Clayton, J.; Knap, J. Phase field modeling of directional fracture in anisotropic polycrystals. Comput. Mater. Sci. 2015, 98, 158–169. [Google Scholar] [CrossRef]
  46. Borden, M.; Verhoosel, C.; Scott, M.; Hughes, T.; Landis, C. A phase field description of dynamic brittle fracture. Comput. Methods Appl. Mech. Eng. 2012, 217, 77–95. [Google Scholar] [CrossRef]
  47. Amor, H.; Marigo, J.J.; Maurini, C. Regularized formulation of the variational brittle fracture with unilateral contact: Numerical experiments. J. Mech. Phys. Solids 2009, 57, 1209–1229. [Google Scholar] [CrossRef]
  48. Clayton, J.; Leavy, R.; Knap, J. Phase field modeling of heterogeneous microcrystalline ceramics. Int. J. Solids Struct. 2019, 166, 183–196. [Google Scholar] [CrossRef]
  49. An, Q.; Goddard, W.A.; Cheng, T. Atomistic explanation of shear-induced amorphous band formation in boron carbide. Phys. Rev. Lett. 2014, 113, 095501. [Google Scholar] [CrossRef] [Green Version]
  50. An, Q.; Goddard, W. Atomistic origin of brittle failure of boron carbide from large-scale reactive dynamics simulations: Suggestions toward improved ductility. Phys. Rev. Lett. 2015, 115, 105051. [Google Scholar] [CrossRef] [Green Version]
  51. Clayton, J.; Knap, J. Continuum modeling of twinning, amorphization, and fracture: Theory and numerical simulations. Contin. Mech. Thermodyn. 2018, 30, 421–455. [Google Scholar] [CrossRef]
  52. Clayton, J.; Zorn, J.; Leavy, R.; Guziewski, M.; Knap, J. Phase field modeling of diamond-silicon carbide ceramic composites with tertiary grain boundary phases. Int. J. Fract. 2022, 237, 101–138. [Google Scholar] [CrossRef]
  53. Patil, S.; Heider, Y.; Padilla, C.; Cruz-Chú, E.; Markert, B. A comparative molecular dynamics-phase field modeling approach to brittle fracture. Comput. Methods Appl. Mech. Eng. 2016, 312, 117–129. [Google Scholar] [CrossRef]
  54. Hu, S.; Henager, C.; Chen, L.Q. Simulations of stress-induced twinning and de-twinning: A phase field model. Acta Mater. 2010, 58, 6554–6564. [Google Scholar] [CrossRef]
  55. Jafarzadeh, H.; Levitas, V.; Farrahi, G.; Javanbakht, M. Phase field approach for nanoscale interactions between crack propagation and phase transformation. Nanoscale 2019, 11, 22243–22247. [Google Scholar] [CrossRef] [PubMed]
  56. Li, W.; Hahn, E.; Branicio, P.; Yao, X.; Germann, T.; Feng, B.; Zhang, X. Defect reversibility regulates dynamic tensile strength in silicon carbide at high strain rates. Scr. Mater. 2022, 213, 114593. [Google Scholar] [CrossRef]
  57. Clayton, J.; Knap, J. Phase field modeling of twinning in indentation of transparent single crystals. Model. Simul. Mater. Sci. Eng. 2011, 19, 085005. [Google Scholar] [CrossRef]
  58. Thevenot, F. A review on boron carbide. Key Eng. Mater. 1991, 56, 59–88. [Google Scholar] [CrossRef]
  59. Munro, R. Material properties of titanium diboride. J. Res. Natl. Inst. Stand. Technol. 2000, 105, 709–720. [Google Scholar] [CrossRef]
  60. Swab, J.; Meredith, C.; Casem, D.; Gamble, W. Static and dynamic compression strength of hot-pressed boron carbide using a dumbbell-shaped specimen. J. Mater. Sci. 2017, 52, 10073–10084. [Google Scholar] [CrossRef]
  61. Dandekar, D.; Benfanti, D. Strength of titanium diboride under shock wave loading. J. Appl. Phys. 1993, 73, 673–679. [Google Scholar] [CrossRef]
  62. Dodd, S.; Saunders, G.; James, B. Temperature and pressure dependences of the elastic properties of ceramic boron carbide (B4C). J. Mater. Sci. 2002, 37, 2731–2736. [Google Scholar] [CrossRef]
  63. Beaudet, T.; Smith, J.; Adams, J. Surface energy and relaxation in boron carbide (10 ¯ 1 1) from first principles. Solid State Commun. 2015, 219, 43–47. [Google Scholar] [CrossRef]
  64. Fanchini, G.; McCauley, J.; Chhowalla, M. Behavior of disordered boron carbide under stress. Phys. Rev. Lett. 2006, 97, 035502. [Google Scholar] [CrossRef] [PubMed] [Green Version]
  65. Clayton, J. Computational modeling of dual-phase ceramics with Finsler-geometric phase field mechanics. Comput. Model. Eng. Sci. CMES 2019, 120, 333–350. [Google Scholar] [CrossRef] [Green Version]
  66. Miehe, C.; Schaenzel, L.M.; Ulmer, H. Phase field modeling of fracture in multi-physics problems. Part I. Balance of crack surface and failure criteria for brittle crack propagation in thermo-elastic solids. Comput. Methods Appl. Mech. Eng. 2015, 294, 449–485. [Google Scholar] [CrossRef]
  67. Clayton, J.; Knap, J. Geometric micromechanical modeling of structure changes, fracture, and grain boundary layers in polycrystals. J. Micromech. Mol. Phys. 2018, 3, 1840001. [Google Scholar] [CrossRef]
  68. Hwang, C.; Du, J.; Yang, Q.; Celik, A.; Christian, K.; An, Q.; Schaefer, M.; Xie, K.; LaSalvia, J.; Hemker, K.; et al. Addressing amorphization and transgranular fracture of B4C through Si doping and TiB2 microparticle reinforcing. J. Am. Ceram. Soc. 2022, 105, 2959–2977. [Google Scholar] [CrossRef]
  69. Yang, Q.; Celik, A.; Du, J.; LaSalvia, J.; Hwang, C.; Haber, R. Advancing the mechanical properties of Si/B co-doped boron carbide through TiB2 reinforcement. Mater. Lett. 2020, 266, 127480. [Google Scholar] [CrossRef]
  70. Hu, G.; Chen, C.; Ramesh, K.; McCauley, J. Mechanisms of dynamic deformation and dynamic failure in aluminum nitride. Acta Mater. 2012, 60, 3480–3490. [Google Scholar] [CrossRef]
  71. Shen, Y.; Li, G.; An, Q. Enhanced fracture toughness of boron carbide from microalloying and nanotwinning. Scr. Mater. 2019, 162, 306–310. [Google Scholar] [CrossRef]
  72. Ye, K.; Wang, Z. Twins enhanced mechanical properties of boron carbide. Ceram. Int. 2022, 48, 14499–14506. [Google Scholar] [CrossRef]
  73. Chen, M.; McCauley, J.; Hemker, K. Shock-induced localized amorphization in boron carbide. Science 2003, 299, 1563–1566. [Google Scholar] [CrossRef] [PubMed]
Figure 1. Boron carbide-titanium diboride initial rendering for phase field simulations: (a) FE mesh of phases (yellow = TiB 2 , white = B 4 C, dark = binder); (b) equilibrated initial stress component P 22 prior to biaxial tension–compression loading in the X 1 X 2 plane.
Solids 03 00040 g001
Figure 2. Simulation 2, ϵ ¯ = 8.4 × 10 3 (solid rendering): (a) normal stress component P 22 ; (b) fracture order parameter ξ ; (c) slip/twinning order parameter η .
Solids 03 00040 g002aSolids 03 00040 g002b
Figure 3. Fracture order parameter ξ (transparent rendering): (a) Sim 1, ϵ ¯ = 7.8 × 10 3 ; (b) Sim 4, ϵ ¯ = 7.2 × 10 3 ; (c) Sim 7, ϵ ¯ = 6.0 × 10 3 ; (d) Sim 10, ϵ ¯ = 8.4 × 10 3 ; (e) Sim 14, ϵ ¯ = 8.4 × 10 3 ; (f) Sim 17, ϵ ¯ = 8.4 × 10 3 .
Solids 03 00040 g003aSolids 03 00040 g003b
Figure 4. Effective average stress Σ ¯ versus applied biaxial strain ϵ ¯ : (a) Sims 1, 2, and 3 vs. Sims 4, 5, and 6; (b) Sims 1, 2, and 3 vs. Sims 7, 8, and 9; (c) Sims 1, 2, and 3 vs. Sims 10, 11, and 12; (d) Sims 1, 2, and 3 vs. Sims 13, 14, and 15.
Solids 03 00040 g004
Figure 5. Average values for simulations with B 4 C-TiB 2 (with and without residual stress) and pure B 4 C: (a) maximum effective stress Σ ¯ ; (b) ductility measured by applied strain ϵ ¯ at peak stress; (c) plasticity measured by averaged slip/twinning order parameter η ¯ at peak stress.
Solids 03 00040 g005
Table 2. Phase field simulations: biaxial loading, different microstructures, and physics. Right four columns: peak average von Mises stress and average pressure and order parameters at peak stress.
Sim.MaterialLatticeBound.Slip/TwinRes. StressWeibull Σ ¯ p ¯ η ¯ ξ ¯
Cond. η > 0 | σ ˜ 0 | > 0 Υ ( 2 ) (GPa)(GPa)
1B 4 C-TiB 2 1 ϵ ¯ 11 ϵ ¯ 22 YYY1.63490.0063470.14510.1196
2B 4 C-TiB 2 2 ϵ ¯ 22 ϵ ¯ 33 YYY1.46030.0067760.13900.1261
3B 4 C-TiB 2 3 ϵ ¯ 33 ϵ ¯ 11 YYY1.64190.0073270.14200.1359
4B 4 C-TiB 2 1 ϵ ¯ 11 ϵ ¯ 22 NYY1.13410.0054500.00000.1584
5B 4 C-TiB 2 2 ϵ ¯ 22 ϵ ¯ 33 NYY1.13020.0039490.00000.1232
6B 4 C-TiB 2 3 ϵ ¯ 33 ϵ ¯ 11 NYY1.24220.0048010.00000.1480
7B 4 C-TiB 2 1 ϵ ¯ 11 ϵ ¯ 22 YNY1.17760.0055070.07580.1128
8B 4 C-TiB 2 2 ϵ ¯ 22 ϵ ¯ 33 YNY1.06660.0056290.07660.1064
9B 4 C-TiB 2 3 ϵ ¯ 33 ϵ ¯ 11 YNY1.14790.0071160.07840.1122
10B 4 C-TiB 2 1 ϵ ¯ 11 ϵ ¯ 22 YYN1.86630.0090830.17820.1478
11B 4 C-TiB 2 2 ϵ ¯ 22 ϵ ¯ 33 YYN1.71050.0083390.16180.1323
12B 4 C-TiB 2 3 ϵ ¯ 33 ϵ ¯ 11 YYN1.86700.0103200.18130.1662
13B 4 C1 ϵ ¯ 11 ϵ ¯ 22 YNN1.24600.0084890.07070.1485
14B 4 C2 ϵ ¯ 22 ϵ ¯ 33 YNN1.15800.0075540.07490.1392
15B 4 C3 ϵ ¯ 33 ϵ ¯ 11 YNN1.19030.0062580.06120.1217
16B 4 C1 ϵ ¯ 11 ϵ ¯ 22 NNN1.02120.0065410.00000.2383
17B 4 C2 ϵ ¯ 22 ϵ ¯ 33 NNN1.02400.0059840.00000.2374
18B 4 C3 ϵ ¯ 33 ϵ ¯ 11 NNN1.02030.0061820.00000.2383
Publisher’s Note: MDPI stays neutral with regard to jurisdictional claims in published maps and institutional affiliations.

