Article

Parametric Optimization of Ball-Milled Bimetallic Nanoadsorbents for the Effective Removal of Arsenic Species

by
Mercyrani Babudurai
1,
Karthick Sekar
1,2,
Onyekachi Michael Nwakanma
3,
Ravichandran Manisekaran
4,
Marco A. Garza-Navarro
5,
Velumani Subramaniam
3,6,*,
Natanael Cuando-Espitia
7 and
Halaney David
6
1
Nanoscience and Nanotechnology Program, Centro de Investigacion y de Estudios Avanzados, Instituto Politecnico Nacional (CINVESTAV-IPN), Col. San Pedro Zacatenco, Mexico City 07360, Mexico
2
GREMAN UMR 7347, Université de Tours, CNRS, INSA Centre Val de Loire, CEDEX 2, 37071 Tours, France
3
Department of Electrical Engineering (SEES), Centro de Investigacion y de Estudios Avanzados, Instituto Politecnico Nacional (CINVESTAV-IPN), Col. San Pedro Zacatenco, Mexico City 07360, Mexico
4
Interdisciplinary Research Laboratory (LII), Nanostructures and Biomaterials Area, National School of Higher Studies (ENES) Leon Unit, Predio el Saucillo y el Potrero, Comunidad de los Tepetates, Leon 37684, Mexico
5
Department of Mechanical and Electrical Engineering, Universidad Autonoma de Nuevo Leon, San Nicolas de Los Garza, Nuevo Leon, Mexico City 66451, Mexico
6
J. Mike Walker ‘66 Department of Mechanical Engineering, Texas A&M University, College Station, TX 77843, USA
7
CONACyT, Applied Physics Group, DICIS, University of Guanajuato, Salamanca, Guanajuato 368850, Mexico
*
Author to whom correspondence should be addressed.
Solids 2022, 3(3), 549-568; https://doi.org/10.3390/solids3030035
Submission received: 19 August 2022 / Revised: 8 September 2022 / Accepted: 13 September 2022 / Published: 16 September 2022

Abstract

:
Arsenic (As) removal from portable water bodies using the nanotechnology-based adsorption technique offers a unique method to lower the As contamination below the World Health Organization’s (WHO) maximum contaminant level (MCL). This work promotes a systematic methodological-based adsorption study by optimizing the different parameters that affect As removal using TiO2/γ-Fe2O3 nanocomposites (T/M NCs) prepared with the green, facile, and cost-effective ball milling method. The studies using X-ray Diffraction (XRD) illustrate the structural modifications with variations in the constituting T/M ratios, with high-resolution transmission electron microscopy (HRTEM) being used for the NC morphological studies. The optical characterization studies showed that bandgap tuning between 2–2.8 eV reduced the maghemite (γ-Fe2O3) content in the NCs and the elemental analysis confirmed the desired stoichiometry of the NCs. The magnetic measurements showed that the magnetic interaction among the particles tends towards exchange coupling behavior as the weight ratio of γ-Fe2O3 content decreases in the NCs. The adsorption studies using the most efficient NCs with an optimized condition (NC dose (8 g/L), contact time (15 min), As concentration (2 ppm), and pH (4)) resulted in a more than 99% removal of As species, suggesting the excellent behavior of the synthesized nanomaterial for water treatment and making it more economical than other competing adsorption techniques and materials.

1. Introduction

Human health is one of man’s most significant priorities but is bedeviled by many environmental contaminants. Most of the pollutants are predominantly in metallic forms and of high carcinogenicity, with specific heavy metals such as arsenic (As) being top on the list. Several studies reveal that millions of people worldwide are exposed to these heavy metals through contaminated drinking and groundwater used for domestic purposes [1,2]. The varying degrees of severity in different parts of the globe show that arsenic ranks at the top, justifying the urgency and numerous attempts to develop several methods for removing it from potable water sources [3,4,5,6,7,8].
The high prevalence of As within the Earth’s crust accounts for the facile leaching into water bodies and soil. Industrial products, wastes, and mining activities may account for contamination from human-made activities [9,10]. The As atoms may combine with a complex carbon atoms framework to form a harmless organic structure or exist as highly toxic inorganic As compounds without carbon. In the inorganic forms, As atoms exist in various oxidation states (−3, 0, +3, +5), with As (III) (arsenite) and As (V) (arsenate) dominating mostly in aqueous mediums. Owing to their prevalence in the environment, the European Union (EU), the United States of America (USA), and the World Health Organization (WHO) established the maximum contaminant level of 10 μg/L for As in drinking water. Other countries retained the earlier WHO guideline of 50 μg/L as their interim target [11]. However, with potential accumulation, long-term exposure or intake can lead to severe diseases, including acute and chronic poisoning in the respiratory and gastrointestinal system, conjunctivitis, hyperkeratosis, hyperpigmentation, cardiovascular diseases, and disturbance in the peripheral vascular and nervous systems [12]. Therefore, there is a significant need to remove As from drinking water to avoid its substantial effects on humanity’s health [13]. Thus, in the 2030 agenda, the WHO and United Nations (UN) jointly developed a new set of Sustainable Development Goals to meet and ensure safe and sustainable access to drinking water free of various contaminants, including As metal.
Therefore, various strategies and techniques have been widely reported to offer methods for removing As from water bodies, such as electrochemical treatment, reverse osmosis, chemical treatment, ion exchange, membrane filtration, co-precipitation, photocatalysis, and adsorption [14,15,16,17,18]. Adsorption techniques are commonly employed for water treatments to remove organic, inorganic, and biological pollutants. Most soluble and insoluble adsorbents offer several advantages, including high removal efficiency, simplicity, relatively low-cost, easy operation, wide pH range, and less harmful by-products [19,20]. The materials used for the adsorption processes also offer higher reclamation potentials, accounting for the numerous scientific investigations on this technique [21].
The adsorption process involves the adhesion of atoms, ions, or molecules from a gas, liquid, or dissolved solid (adsorbate) to a surface, creating a layer on the adsorbing material surface (adsorbent). The amount of adsorbate on the adsorbing material depends on numerous factors: pH, dosage, time, concentration, and temperature, which influence the efficiency of removing the contaminants in the aqueous medium. Engineered nanomaterials offer massive potential for completely removing As (III) and (V), carbon-based materials, surfactants, agriculture, industrial wastes, and polymers. The use of metals and metal oxides, such as Fe2O3, TiO2, CeO2, CuO, and ZrO2, has been extensively exploited considering their low-cost, high adsorption capacity, and affinity towards As [14,22,23,24]. Other studies employ the combination of two or more metal oxides in the form of composites to enhance the adsorption characteristics, which has recently attracted considerable interest from researchers [25,26,27].
The use of metals and metallic oxides for As oxyanion adsorption depends strongly on the properties of the active sites of d-block elements (i.e., Fe, Cu, Mn, Zn, Ni, and Ti) [28]. Predominantly, iron oxides (IOs) provide excellent adsorption properties with a high surface-area-to-volume ratio and modifiable surfaces, proven biocompatibility, excellent magnetic properties, reusability, ease of separation using an external magnetic field, and a comparatively low cost [29,30]. The adsorption mechanism of IOs-based nano-adsorbents depends on heavy metals’ migration, deprotonation, and surface complexation. The tools mainly occur through ligand exchange, i.e., hydroxyl (OH) or hydroxide (OH2) groups in the coordination sphere of surface structural Fe atoms, and are explained through a zero-point charge [31]. In the ion-exchange process, the specific adsorption to OH groups and their recoverability is due to their magnetic properties positioned on the iron-based adsorbents specifically for the adsorption process [32]. They can coordinate easily with other elements due to variable oxidation states.
Fe3O4 (magnetite), α-Fe2O3 (hematite), and γ-Fe2O3 (maghemite), among other IOs nanomaterials, are the most common, highly explored, and widely used in water treatment applications [33]. The cubic crystal structured maghemite unit cell contains 32 O2− ions, 21(1/3) FeIII ions, 2(1/3) positive vacancies, and the most stable polymorph. The cationic vacancies in the octahedral sites provide stability and homogeneous ion distribution for γ–Fe2O3, significantly increasing the removal efficiency compared to other phases containing only singly coordinated reactive OH moieties [34].
The widely investigated anatase TiO2 for adsorption stems from its low toxicity, physicochemical stability, facile preparation, low cost, and eco-friendly properties [35,36]. However, it has certain limitations, including a decreasing surface area due to agglomeration. In comparison, a restriction of IOs is particle aggregation due to its large surface-to-volume ratio and low surface energy [37]. Consequently, surface modification ensures these particles’ stability; combining these nanomaterials to form nanocomposites (NCs) anatase TiO2, and γ-Fe2O3 provides an excellent combination of NCs for adsorption purposes and overcomes the limitation of their modified counterparts [38].
The drawback associated with individual metal oxides is agglomeration due to the low energy barrier, however, this problem can be overcome by the impregnation method, surface coating or doping of nanoparticles with the various types of surfactants (anionic, cationic, and nonionic), polymers (polyethylene glycol, etc.), polyelectrolytes, and different metal or metal oxide nanoparticles [39,40,41]. Among metal oxides, the magnetic nanoparticles (MNPs) can be easily separated from an aqueous solution with a low external magnetic field, leading to the growing interest in heavy metal removal. Hence, to enhance the adsorption behavior of arsenic, iron-oxide (maghemite phase) is combined with the TiO2 anatase phase. The TiO2/Iron oxide nanocomposites were formed using the ball milling technique.
Compared to other synthesis methods, the mechanical ball milling technique provides an advantageous and cost-efficient process for preparing NCs. Further advantages over other synthesis methods include its greener and facile features, which may not require solvents or surfactants during synthesis. The milling process yields a more considerable amount of desired product with a short processing time under ambient conditions, eliminating waste generation from multi-step procedures and high temperature and pressure requirements with no hazardous or expensive chemicals. In addition, the relatively low installation cost, use of a common powered grinding medium, and potential for both batch and continuous operation make it suitable for large-scale industrial production [42,43,44,45].
In this work (Scheme 1), the T/M NCs were synthesized by considering the various milling parameters, for example, ball-to-powder ratio (BPR), milling time, and rotation-per-minute (RPM). Another essential consideration is the ratio of the individual nanomaterials in the NCs, which ultimately influences the adsorption performance. Thus, this study optimizes the adsorption conditions with the intention to remove As (III) and (V) contaminants using NCs prepared with a mechanically milled process. The effect of adsorption factors, such as dosage, time, concentration, and pH, was studied extensively to obtain optimized conditions for complete As removal. To the best of our knowledge, the obtained results presented in this study are novel, with the synthesized NCs showing >99% removal of As (III) and (V).

2. Nanocomposite Synthesis, Characterization, and Adsorption Studies
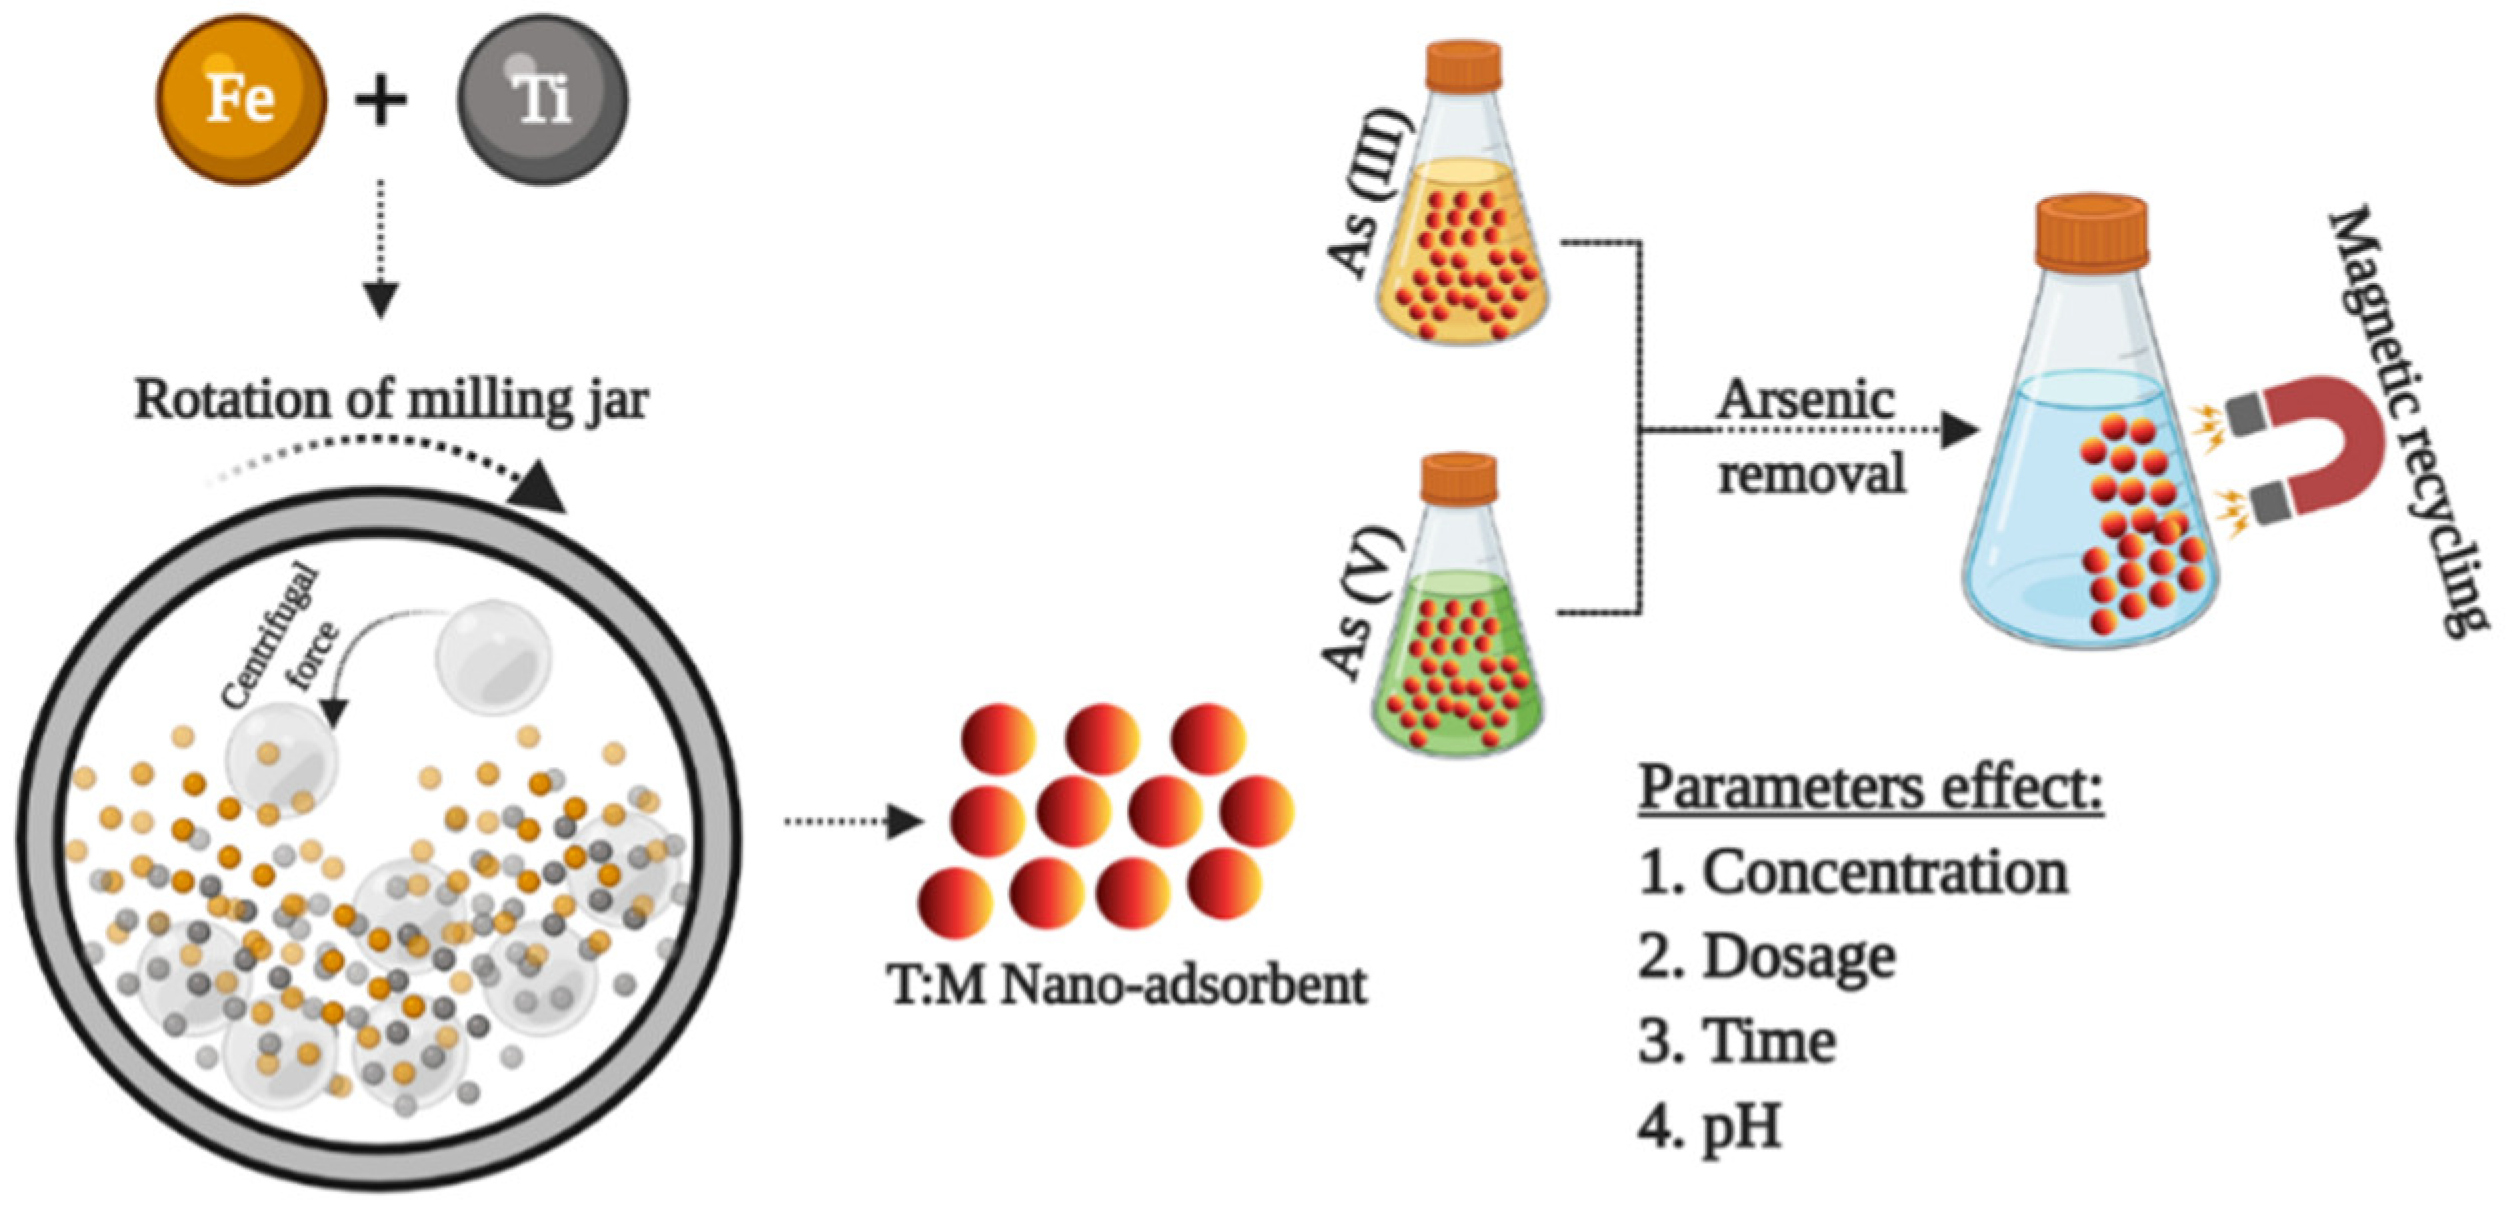
2.1. Synthesis

The anatase TiO2 materials were synthesized using the sol-gel method, and γ-Fe2O3 was prepared with the co-precipitation technique, which was further used for NC synthesis. The anatase nanopowder was obtained by adding 5 mL of titanium tetrachloride (TiCl4) dropwise into 15 mL of ethanol at 60 °C under continuous stirring. After 30 min, a light-yellow gel was obtained and then kept in the oven at 70 °C for 24 h. The dry-gel precursor was calcined at 450 °C in the furnace and ground to create the TiO2 anatase nanopowder.
The IOs nanopowder was obtained by mixing ferric chloride (Fe2+) and ferrous chloride (Fe3+) in a 1:2 ratio in 100 mL of deionized water at room temperature. An ammonium hydroxide (NH4OH) solution was added dropwise to the mixture under continuous stirring and constant nitrogen flow until a black precipitate was formed. The resulting residue was then recovered and washed several times with deionized water, and the suspended particles were collected with a strong neodymium magnet. The material was then dried in an oven at 70 °C overnight. The material was calcined at 150 °C for 2 h to obtain the pure maghemite phase.
The as-synthesized TiO2 (T) and γ-Fe2O3 (M) were used to produce T/M NCs by the ball-milling technique at a constant BPR of 10:1 and a duration of 2 h. The synthesis methods and preliminary results were published in [46], providing a detailed description of the techniques adopted in this study. The different T/M NCs ratios prepared were 1/9, 3/7, 5/5, 7/3, and 9/1, based on the BPR calculations, and resulted in a powdered form. The obtained NCs were stored until further use and evaluated for adsorption studies. A detailed description of the NC’s adsorption conditions is presented in the below table (Table 1).

2.2. Characterization

The X-ray diffractogram was obtained using the Bruker D2-phaser X-ray diffractometer (Cu λ = 1.5406 Å) in the range from 10°–80°, and the structural properties of the synthesized T/M NCs with crystallite sizes (Dp) were calculated using the Scherrer equation [47,48],
D p = K λ β   c o s θ
where K (0.94 for spherical crystallites) is the shape factor, θ is Bragg’s diffraction angle, and β is the full width at half maximum (FWHM). The dislocation density, δ, which measures the number of dislocation lines in a unit area, is calculated using the relation [49],
δ = 1 D p 2
and the microstrain was calculated by the following equation [50],
ε = β 4   t a n θ  
The morphological studies and micrographs were characterized using high-resolution transmission electron microscopy (HRTEM) at 200 KeV (JEM-2010, JEOL Inc., Peabody, MA, USA). The optical studies for the synthesized NCs in the wavelength range 200–800 nm were performed using a spectrophotometer (JascoV-670, Jasco, Pfungstadt, Germany), coupled with an integrating sphere, and the bandgap estimations of the samples were calculated using the Kubelka–Munk function given by [51],
F ( R ) = ( 1 R ) 2 2 R  
The extrapolation of the plot (F(R) × )2 against (where R is the reflectance), considering an indirect transition of the materials, allowed for estimating the energy bandgap value from the Kubelka–Munk theory.
The ratio of T and M elements in T/M NCs was studied using an oxford energy-dispersive spectroscope (EDS), a device coupled with a Hitachi TM-1000 Scanning Electron Microscope (SEM).
The magnetic properties of γ-Fe2O3 and NCs were analyzed using a Superconducting Quantum Interference Device (SQUID) magnetometer (Quantum Design MPMS3) and the corresponding magnetic hysteresis loop. The measurements were carried out to obtain magnetization-field (M-H) curves, magnetization temperature (M-T) curves, Zero-Field-Cooled (ZFC) curves at 1.8 K, and the Field-Cooled (FC) curve at a temperature interval between 2 K and 312 K using a constant magnetic field of 100 Oe.

3. Results and Discussion

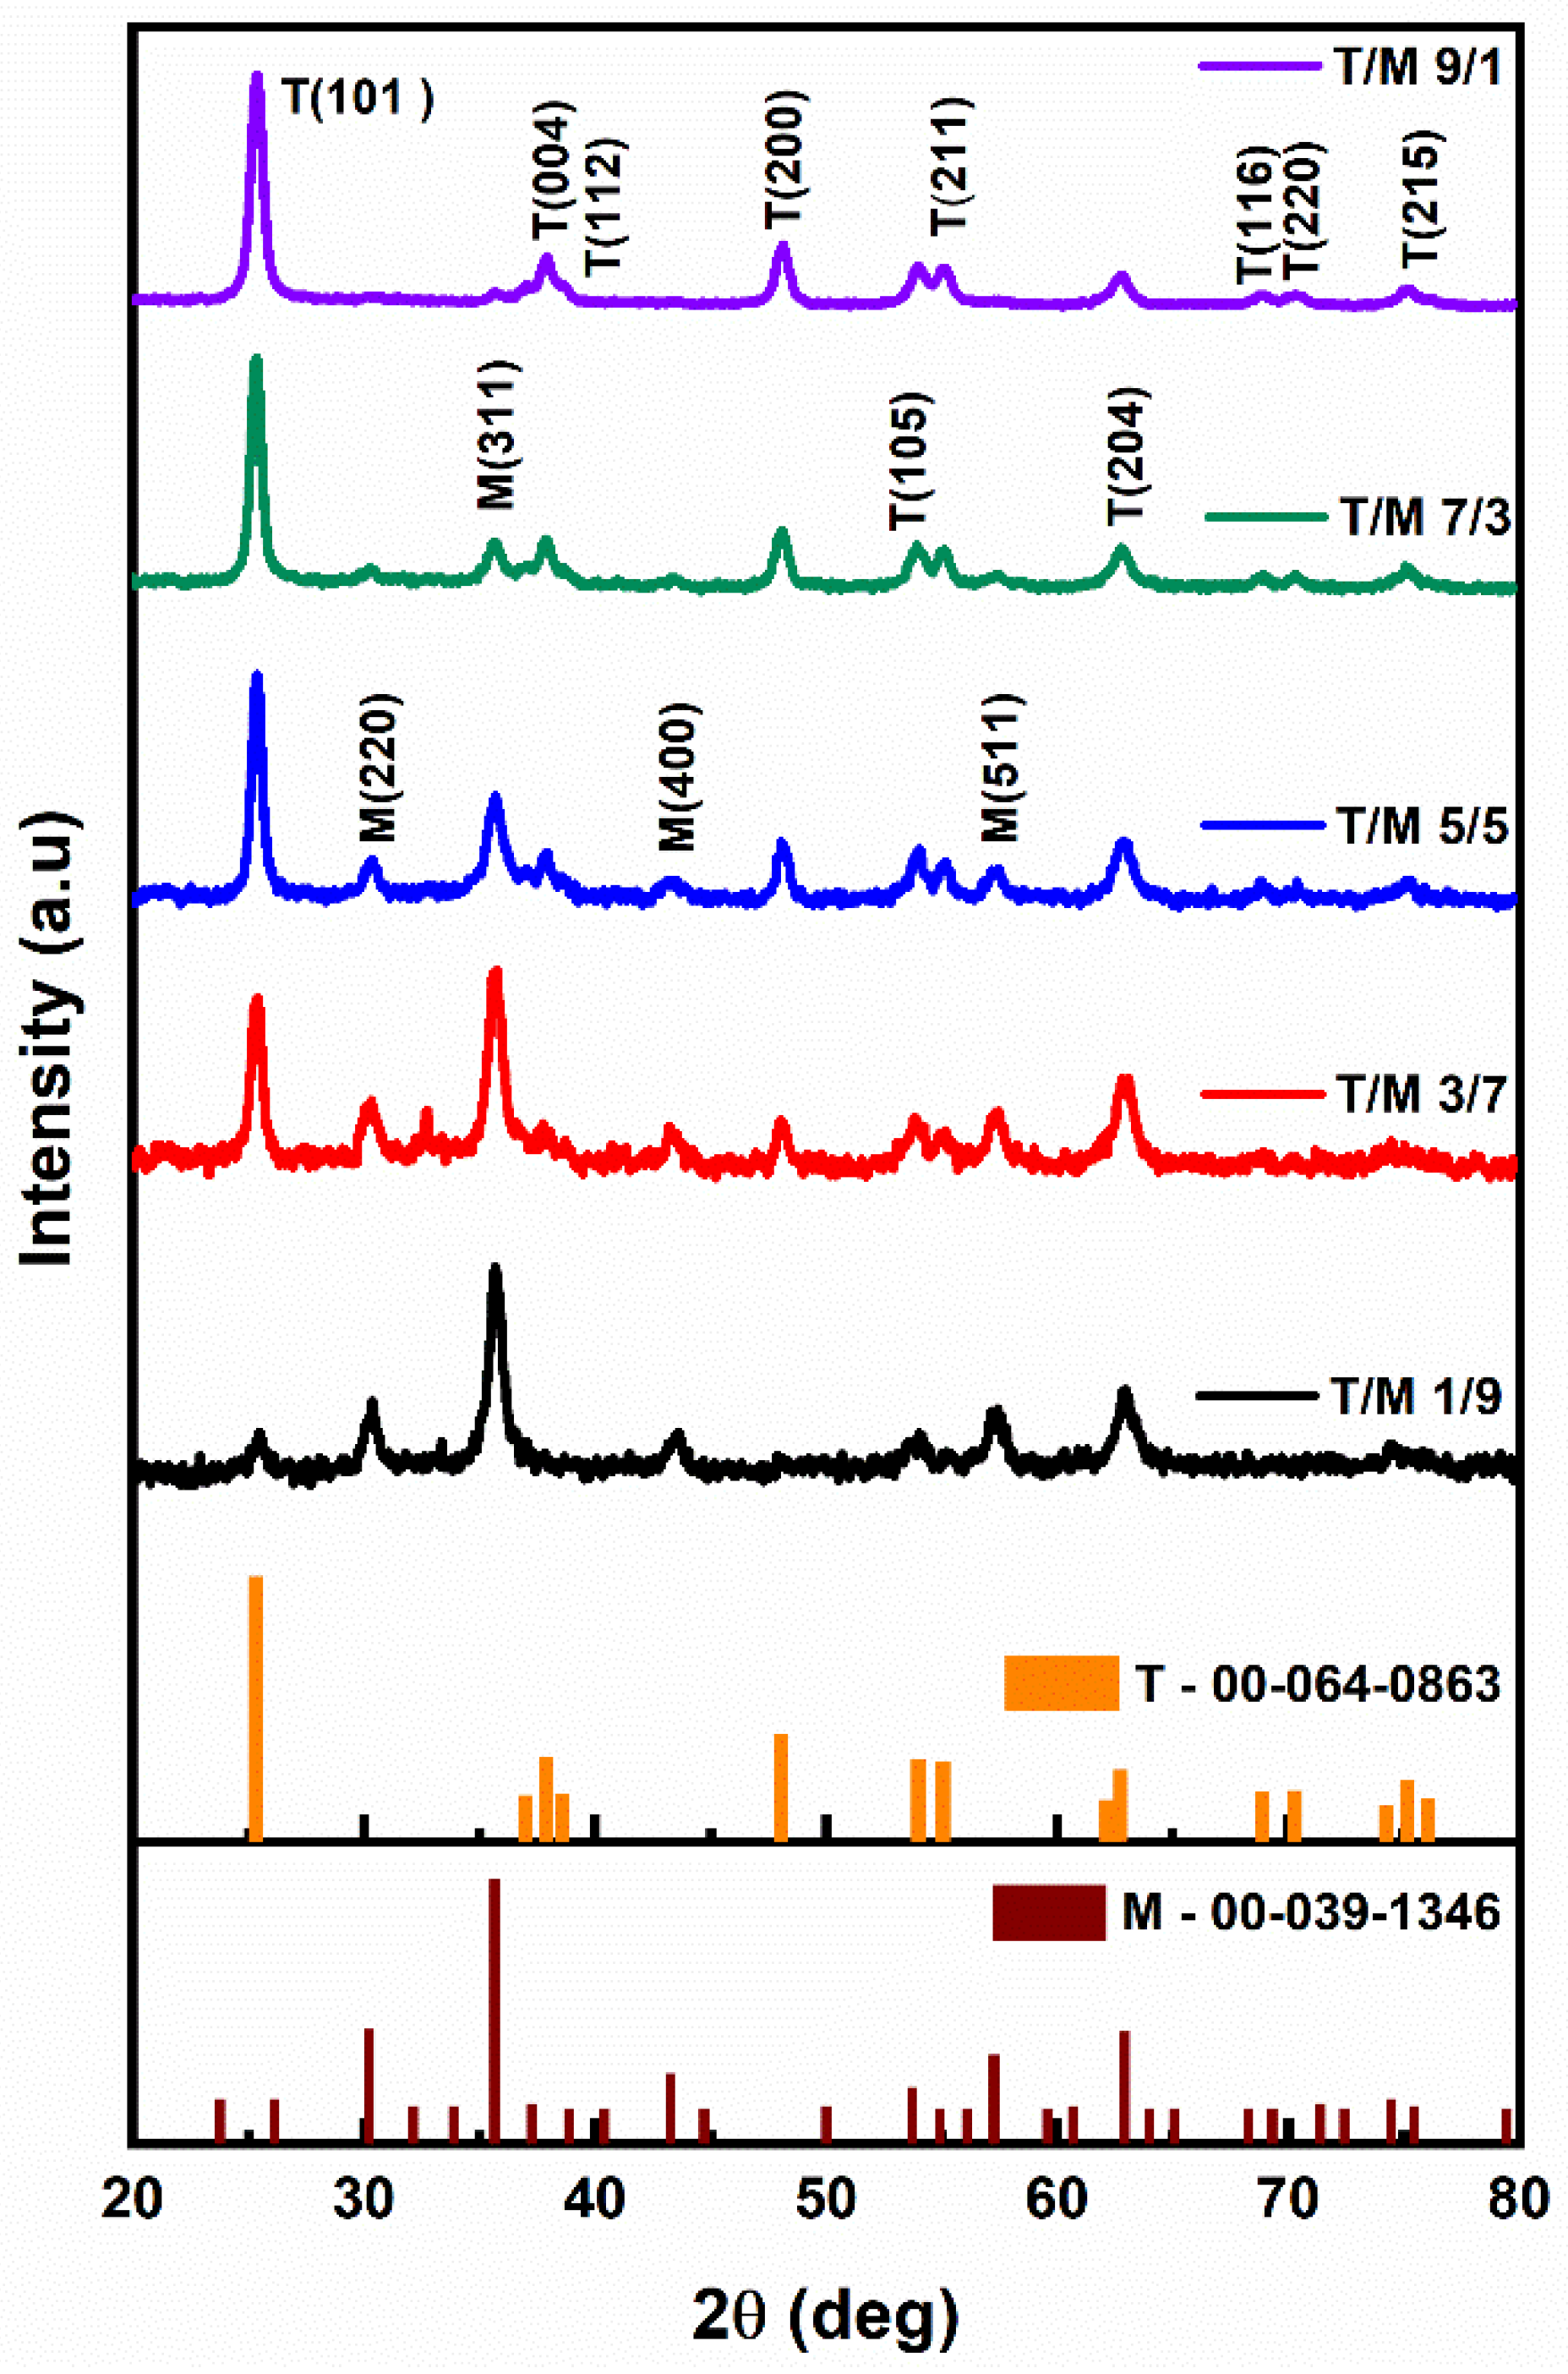
3.1. XRD Diffractograms
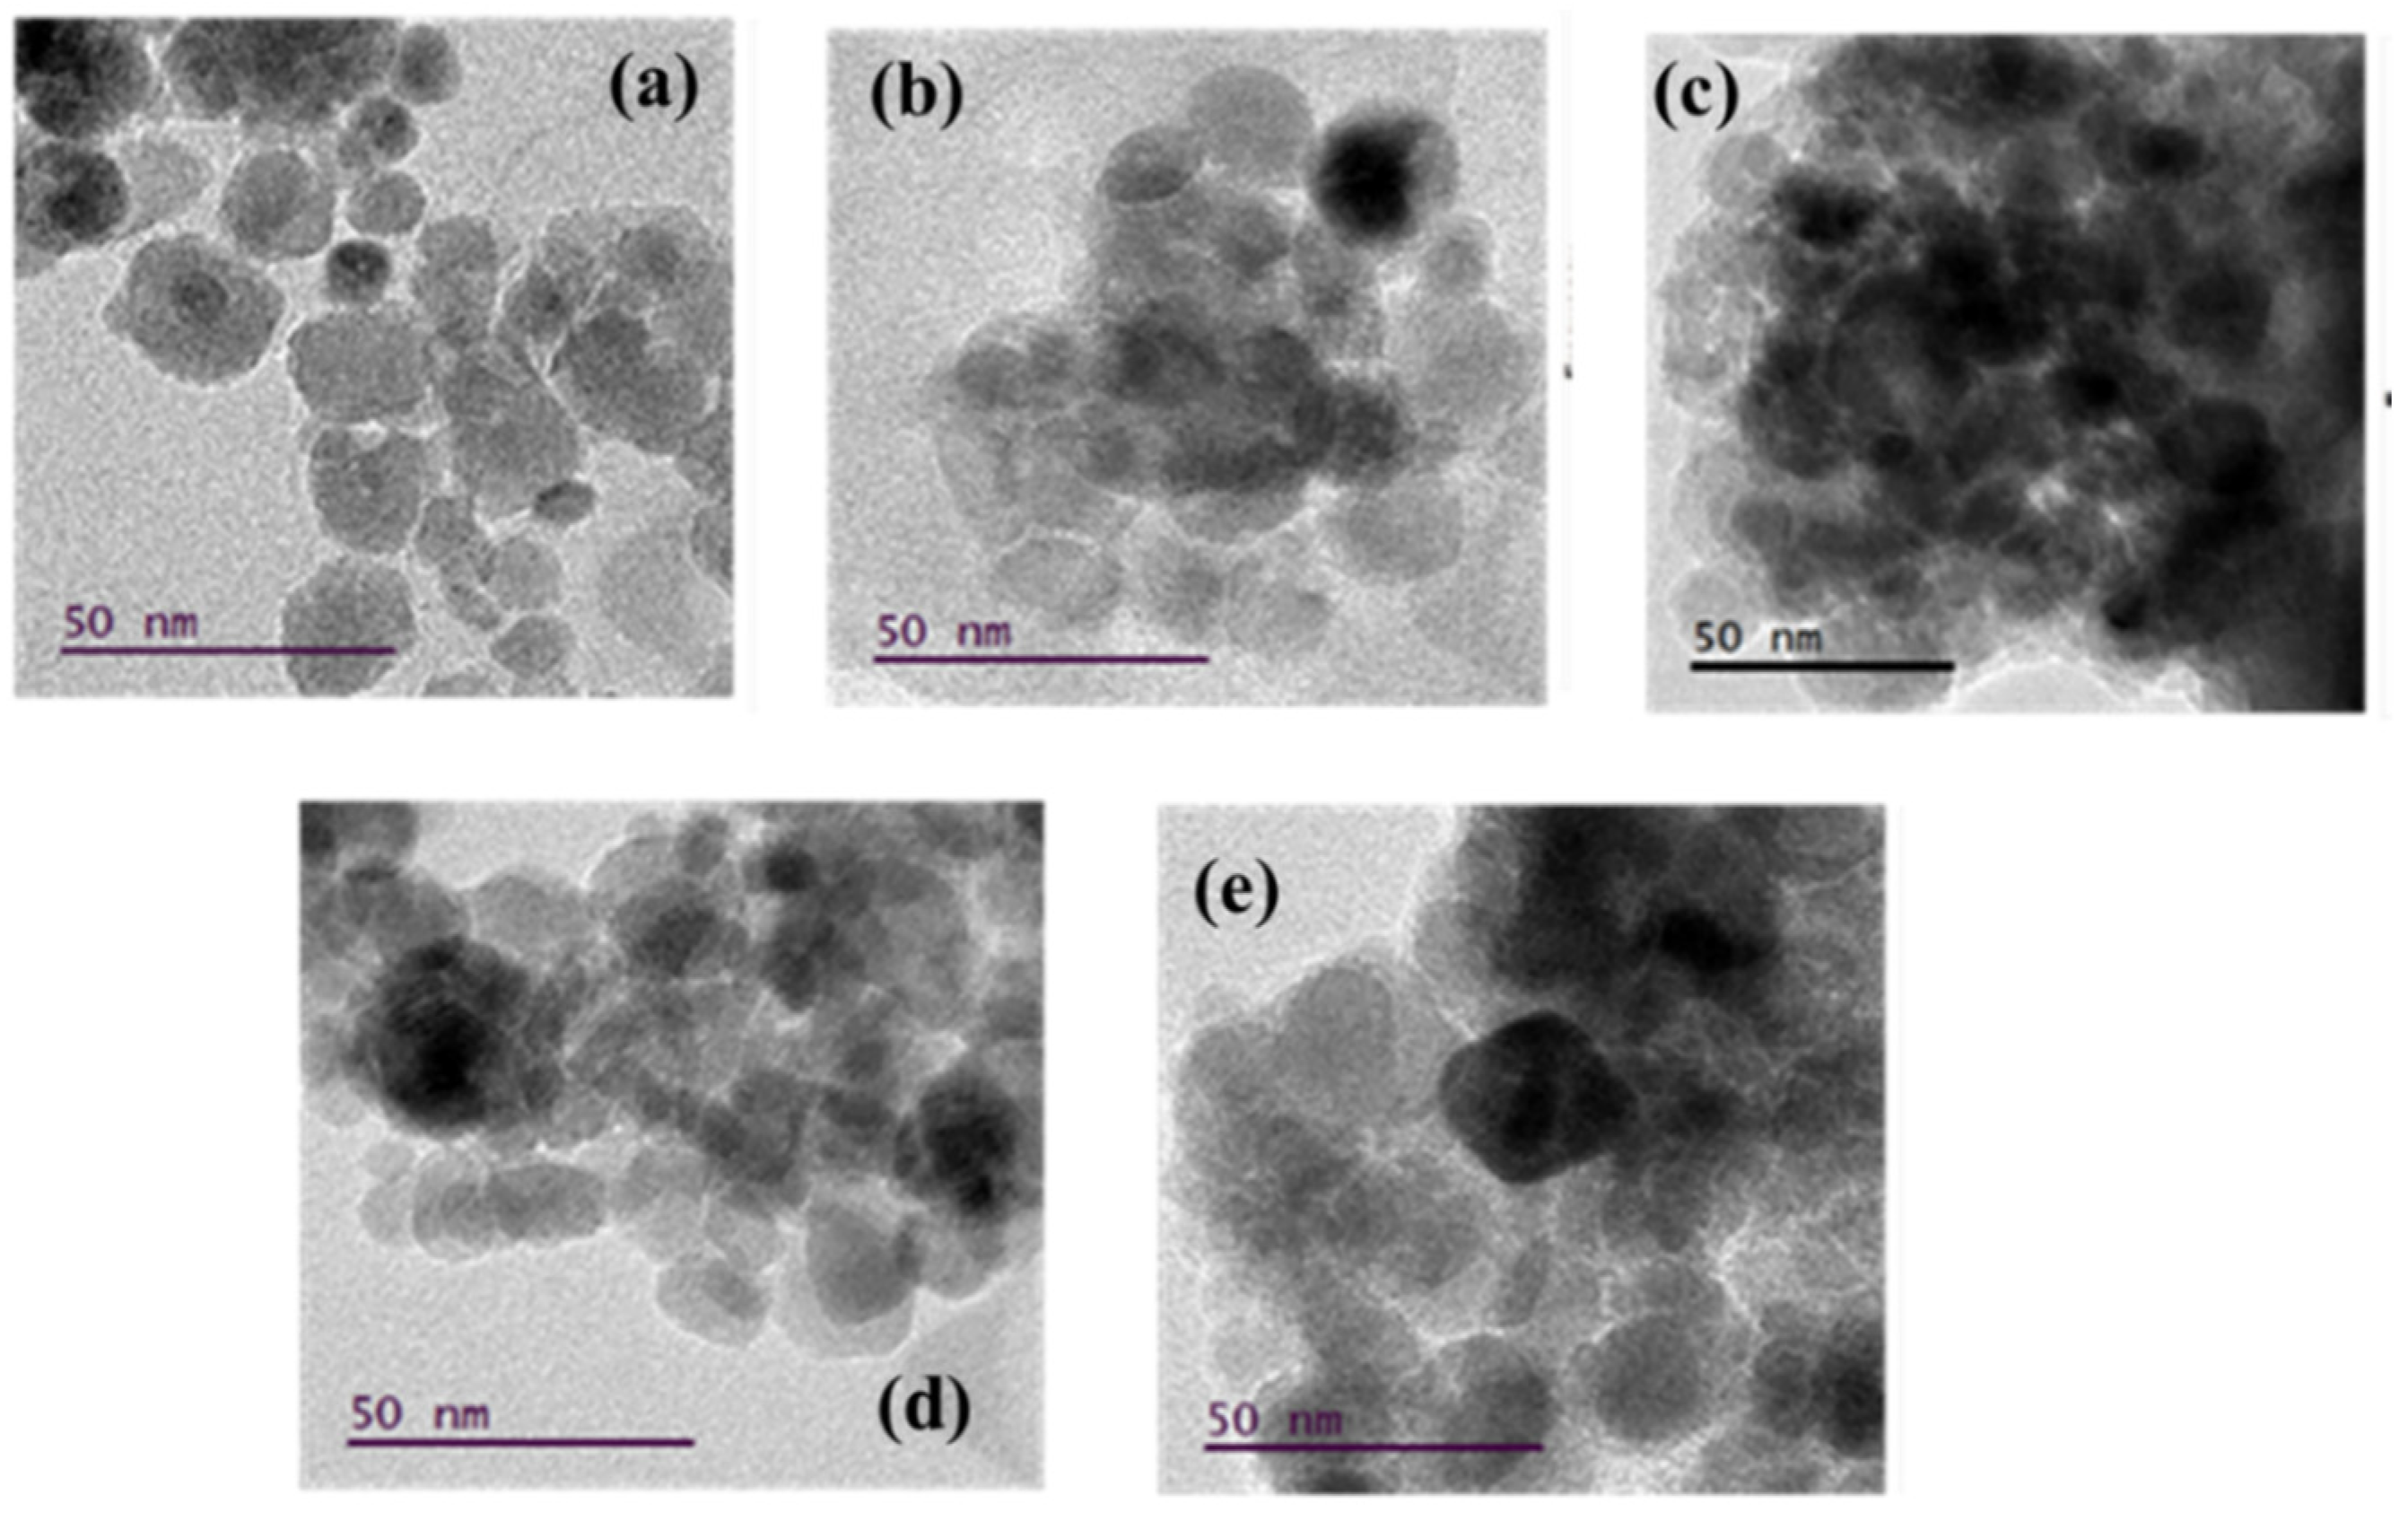
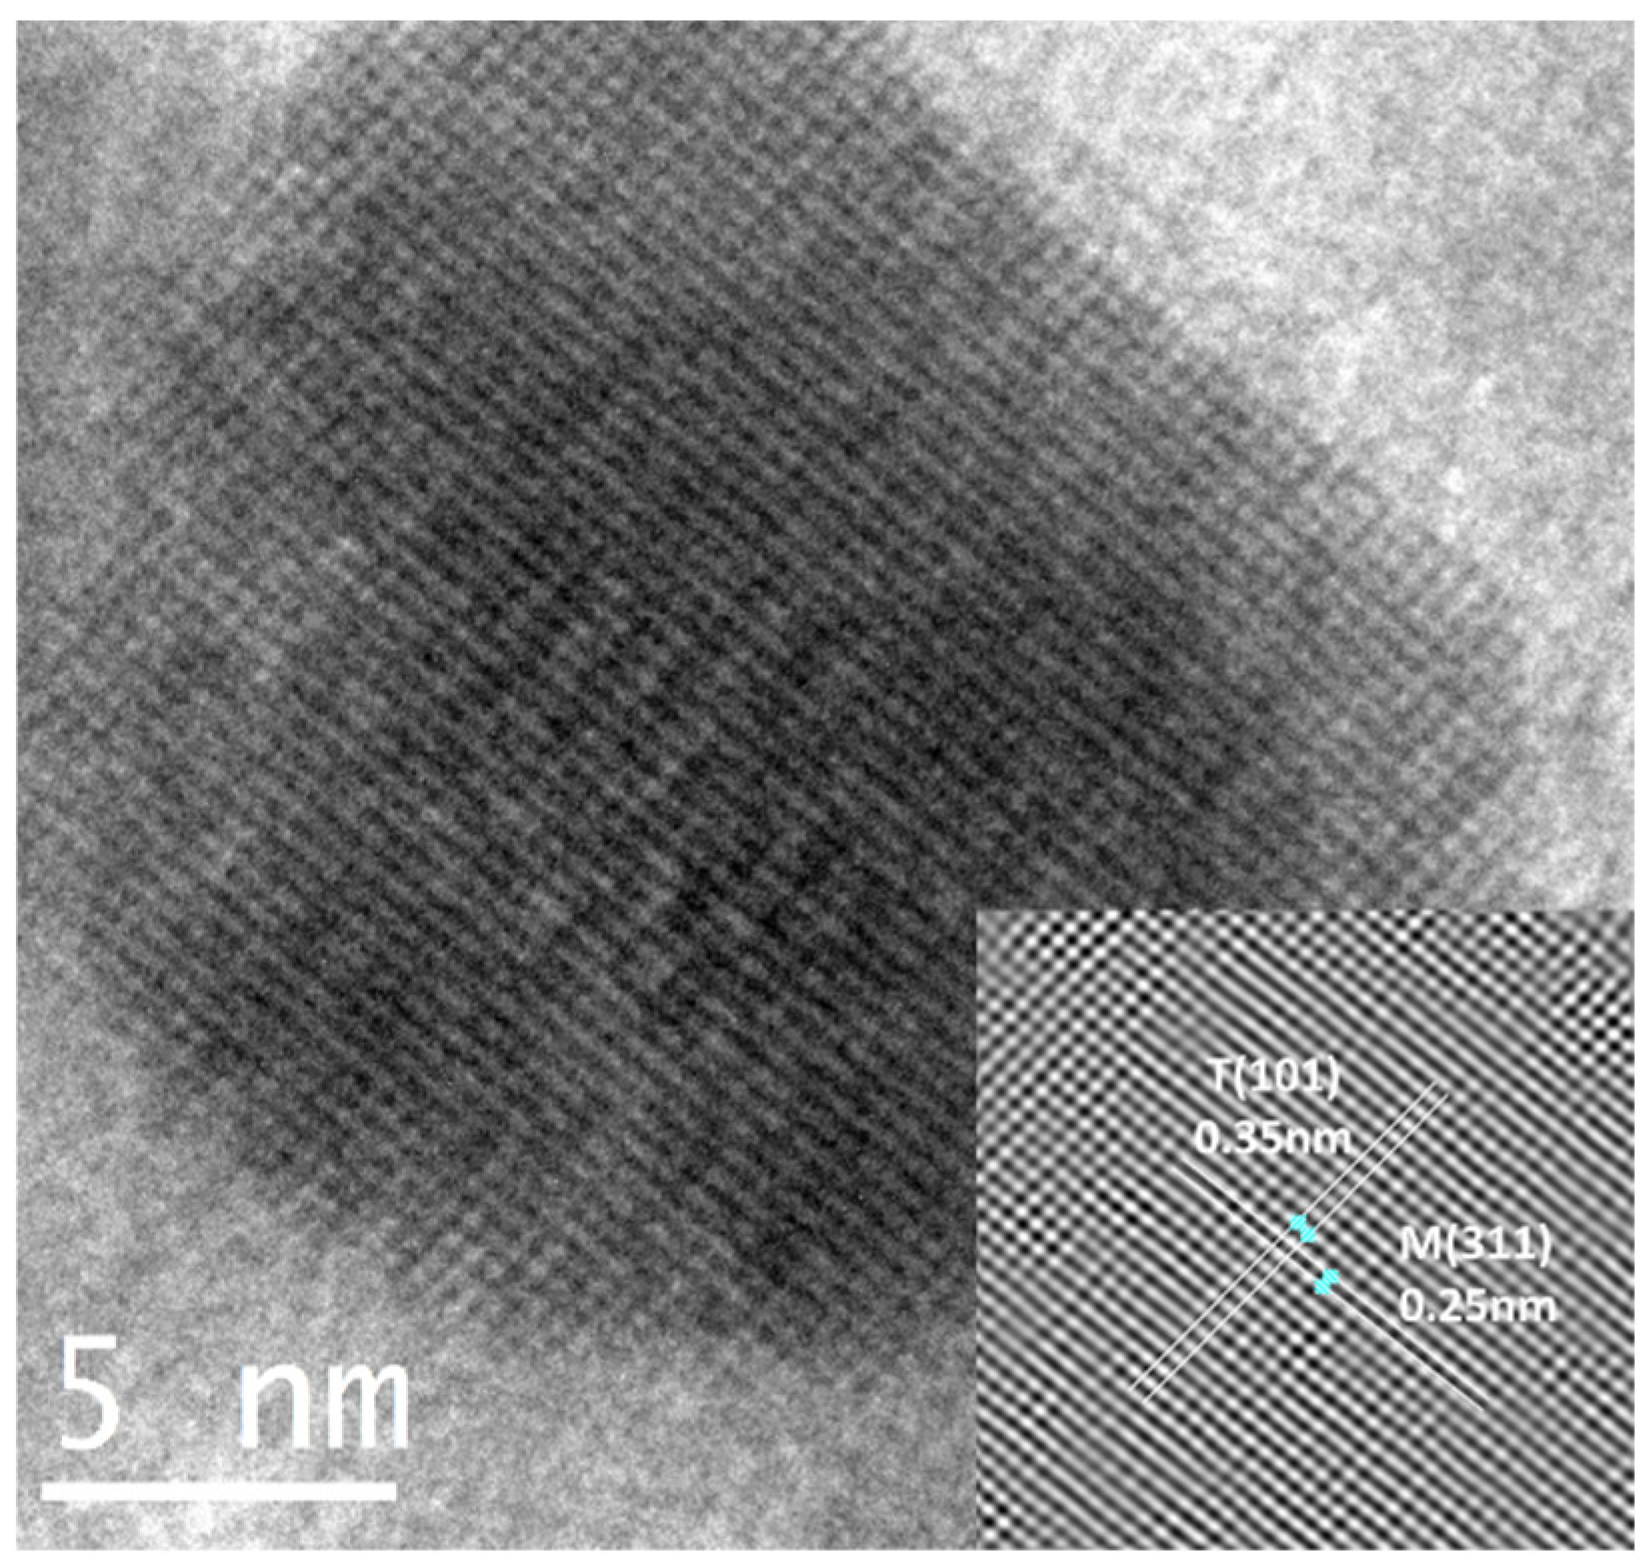
The X-ray diffractogram (Figure 1) for the different ratios depicts the variation of the peak intensities from the as-synthesized nanomaterials. The prominent peaks of anatase TiO2 (ICDD 00-064-0863) increased proportionately from the 1/9 ratio moving to the 9/1 ratio, as the peaks of cubic spinel structured γ-Fe2O3 (ICDD 00-039-1346) decreased. Additionally, the peak positions of TiO2 shift towards lower 2θ angles (25.46 to 25.34) as the ratio increases with the reduction in γ-Fe2O3. However, the milled NCs showed no phase changes nor the presence of any secondary phases [52,53].
The calculated crystallite sizes for the T/M NCs, considering the most intense peaks (Table 2), showed a size increment as the TiO2 composition increased, consistent with the observation that TiO2 has a larger crystallite size than γ-Fe2O3 [54]. The prominent peaks’ ratios (I(101)/I(311)) also showed a consistent variation which decreases while the γ-Fe2O3 composition increases (down the column) following the variation in ratios. This is due to the point defects in the crystal structure because of very similar ion sizes (the ionic radii of Ti4+ −0.68 Å and Fe3+ −0.64 Å). These defects aid in enhancing the NC’s specific surface area, which could significantly impact the nanomaterials’ electronic properties and their applications in the field of adsorption and photocatalysis.

3.2. TEM Analysis

The morphology of the synthesized T/M NCs (Figure 2) was studied using HRTEM characterizations that showed nearly spherical-shaped nanoparticles [55], with broad size distribution and reduced aggregation. The particle-size distribution histograms fitted with log-normal function for peak values (Figure 3) showed that the average particle size ranged between 15 to 20 nm. The distribution indicates that average particle sizes increased with increasing TiO2 ratios, corroborating the XRD data.
The estimation of the d-spacing using the image from a T/M (5/5) NC (Figure 4) measured using an inverse Fast Fourier Transform (FFT) showed fringes of sizes 0.35 nm and 0.25 nm, corresponding to the prominent (101) peaks of anatase TiO2 and (311) cubic γ-Fe2O3. It also verifies the observations and presence of both phases in the nanocomposite.

3.3. EDS Analysis

The EDS analysis was carried out to determine the stoichiometry from the ball-milled process. Table 3 shows the average elemental composition results for different T/M NCs (i.e., 1/9, 3/7, 5/5, 7/3, and 9/1), respectively, which is very close to the desired experimental values.

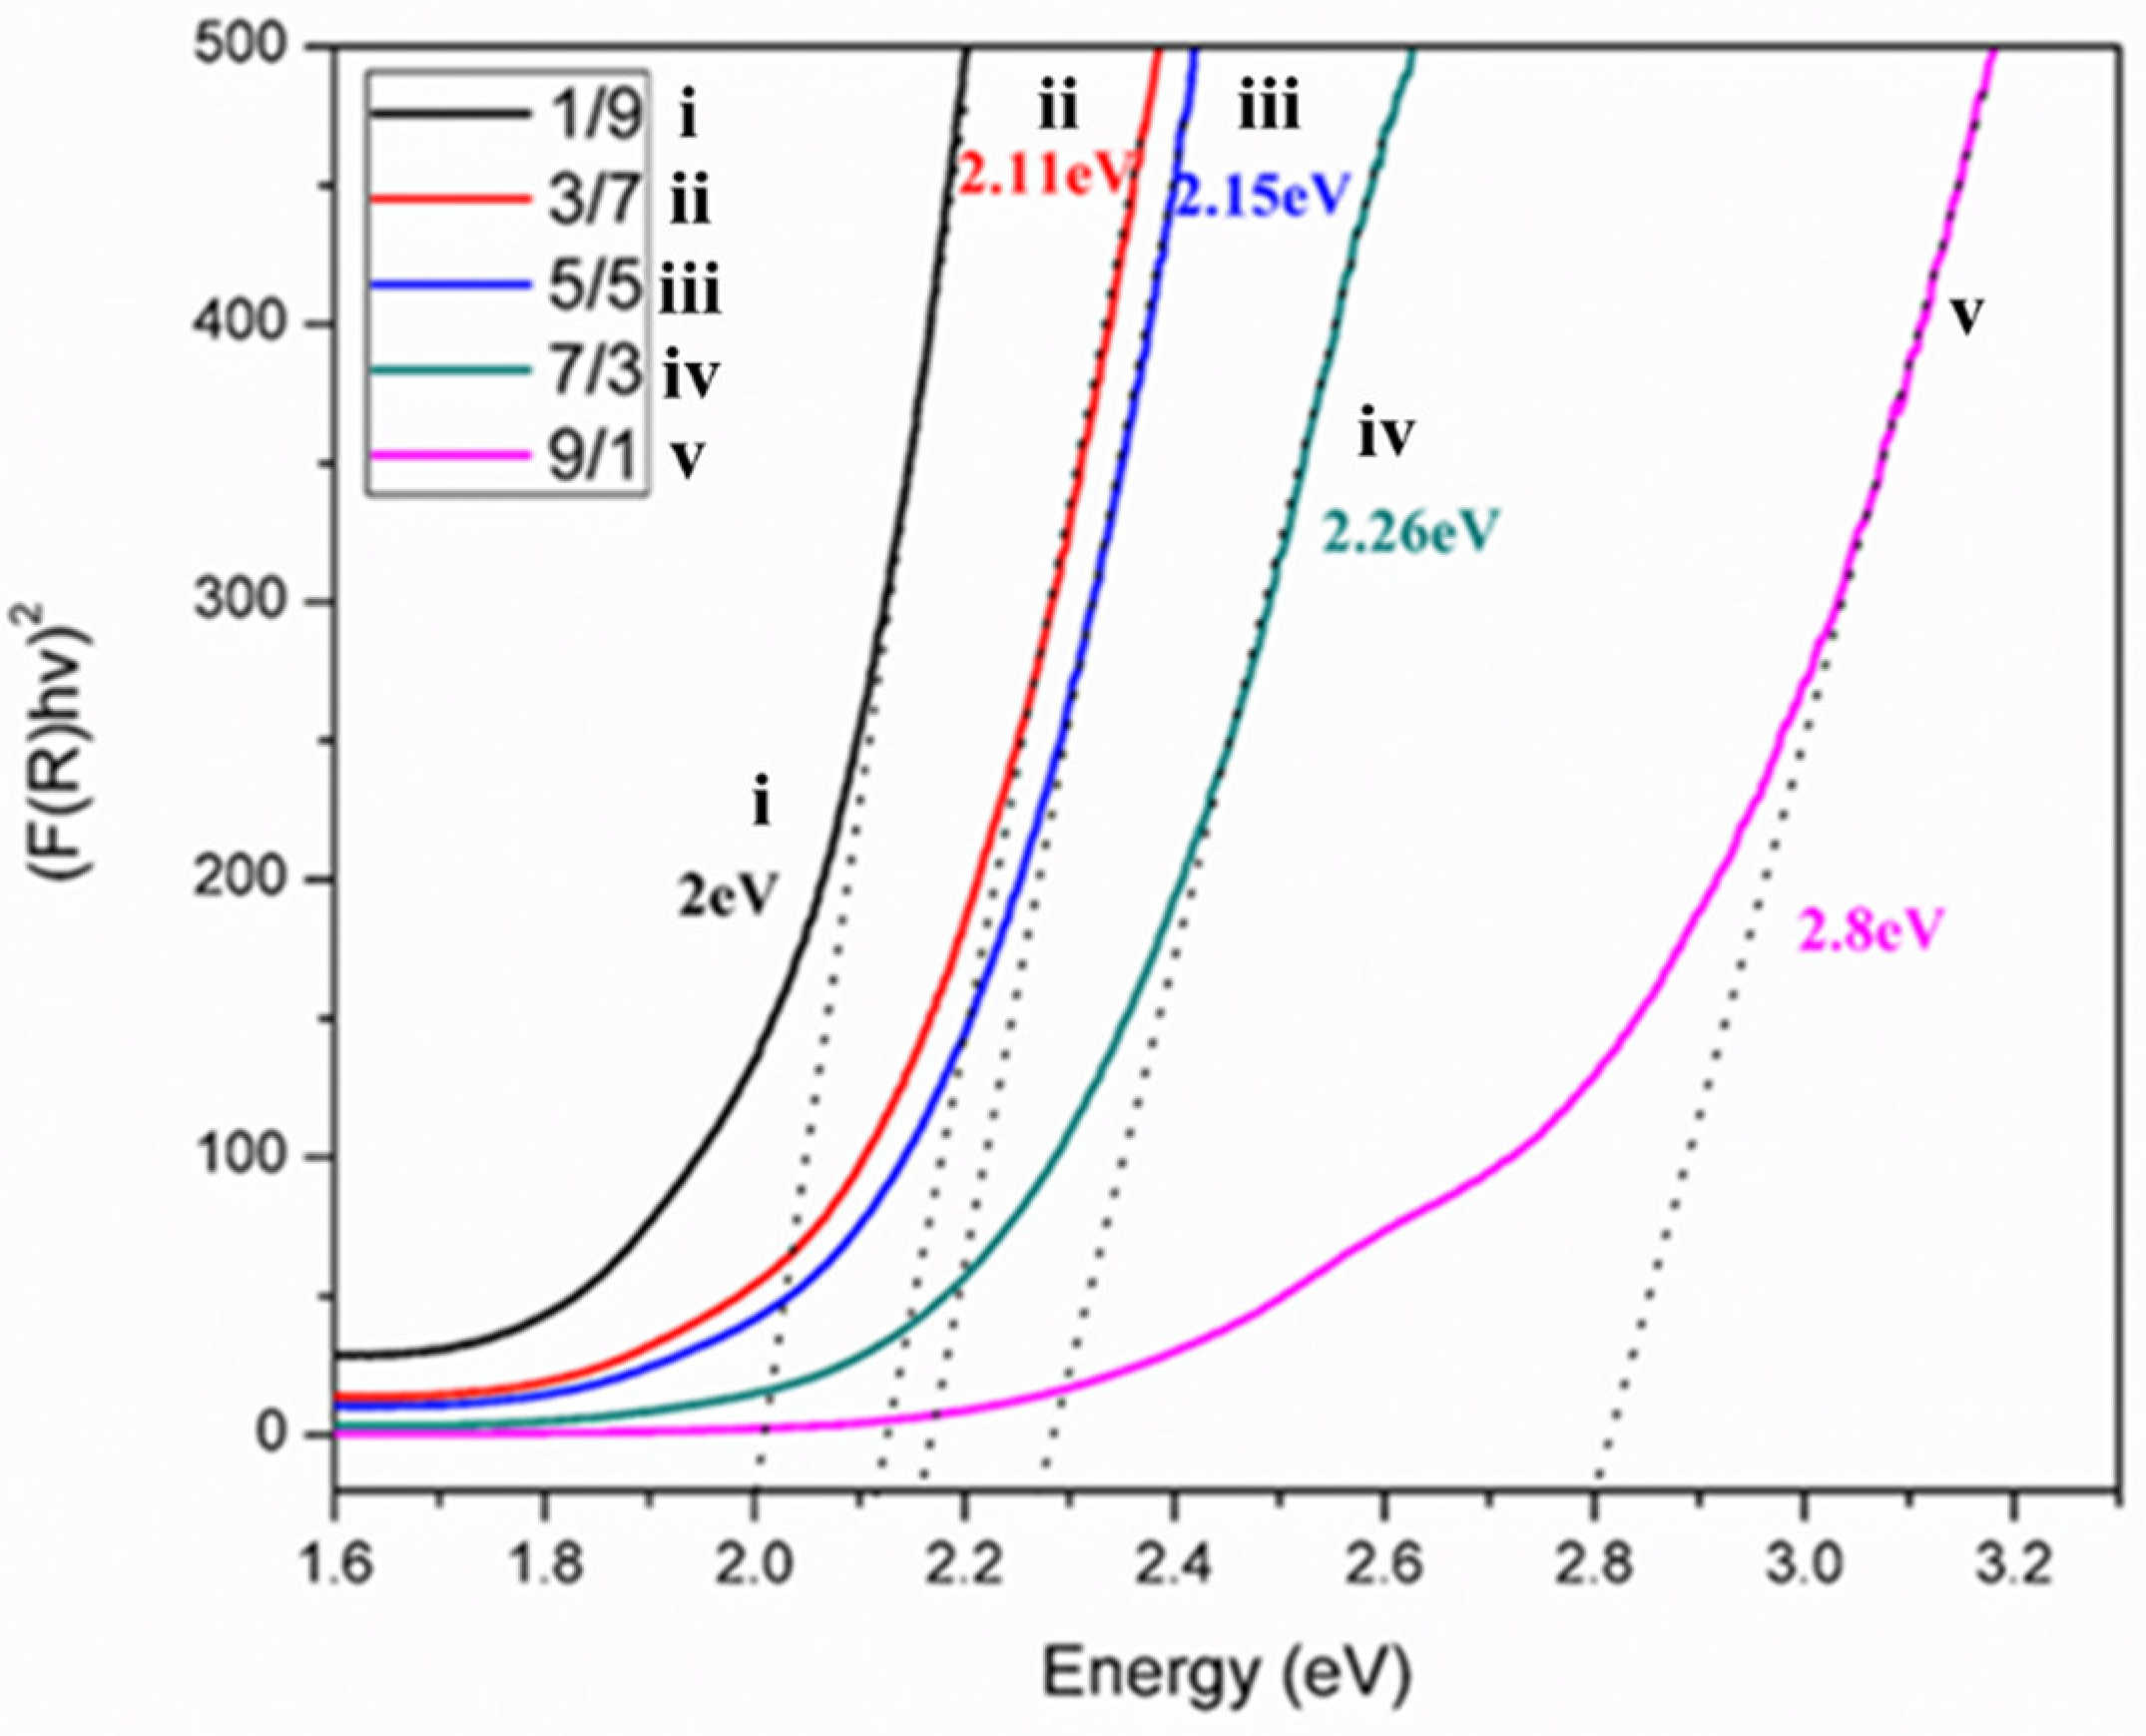
3.4. UV-VIS Diffuse Reflectance Spectrum
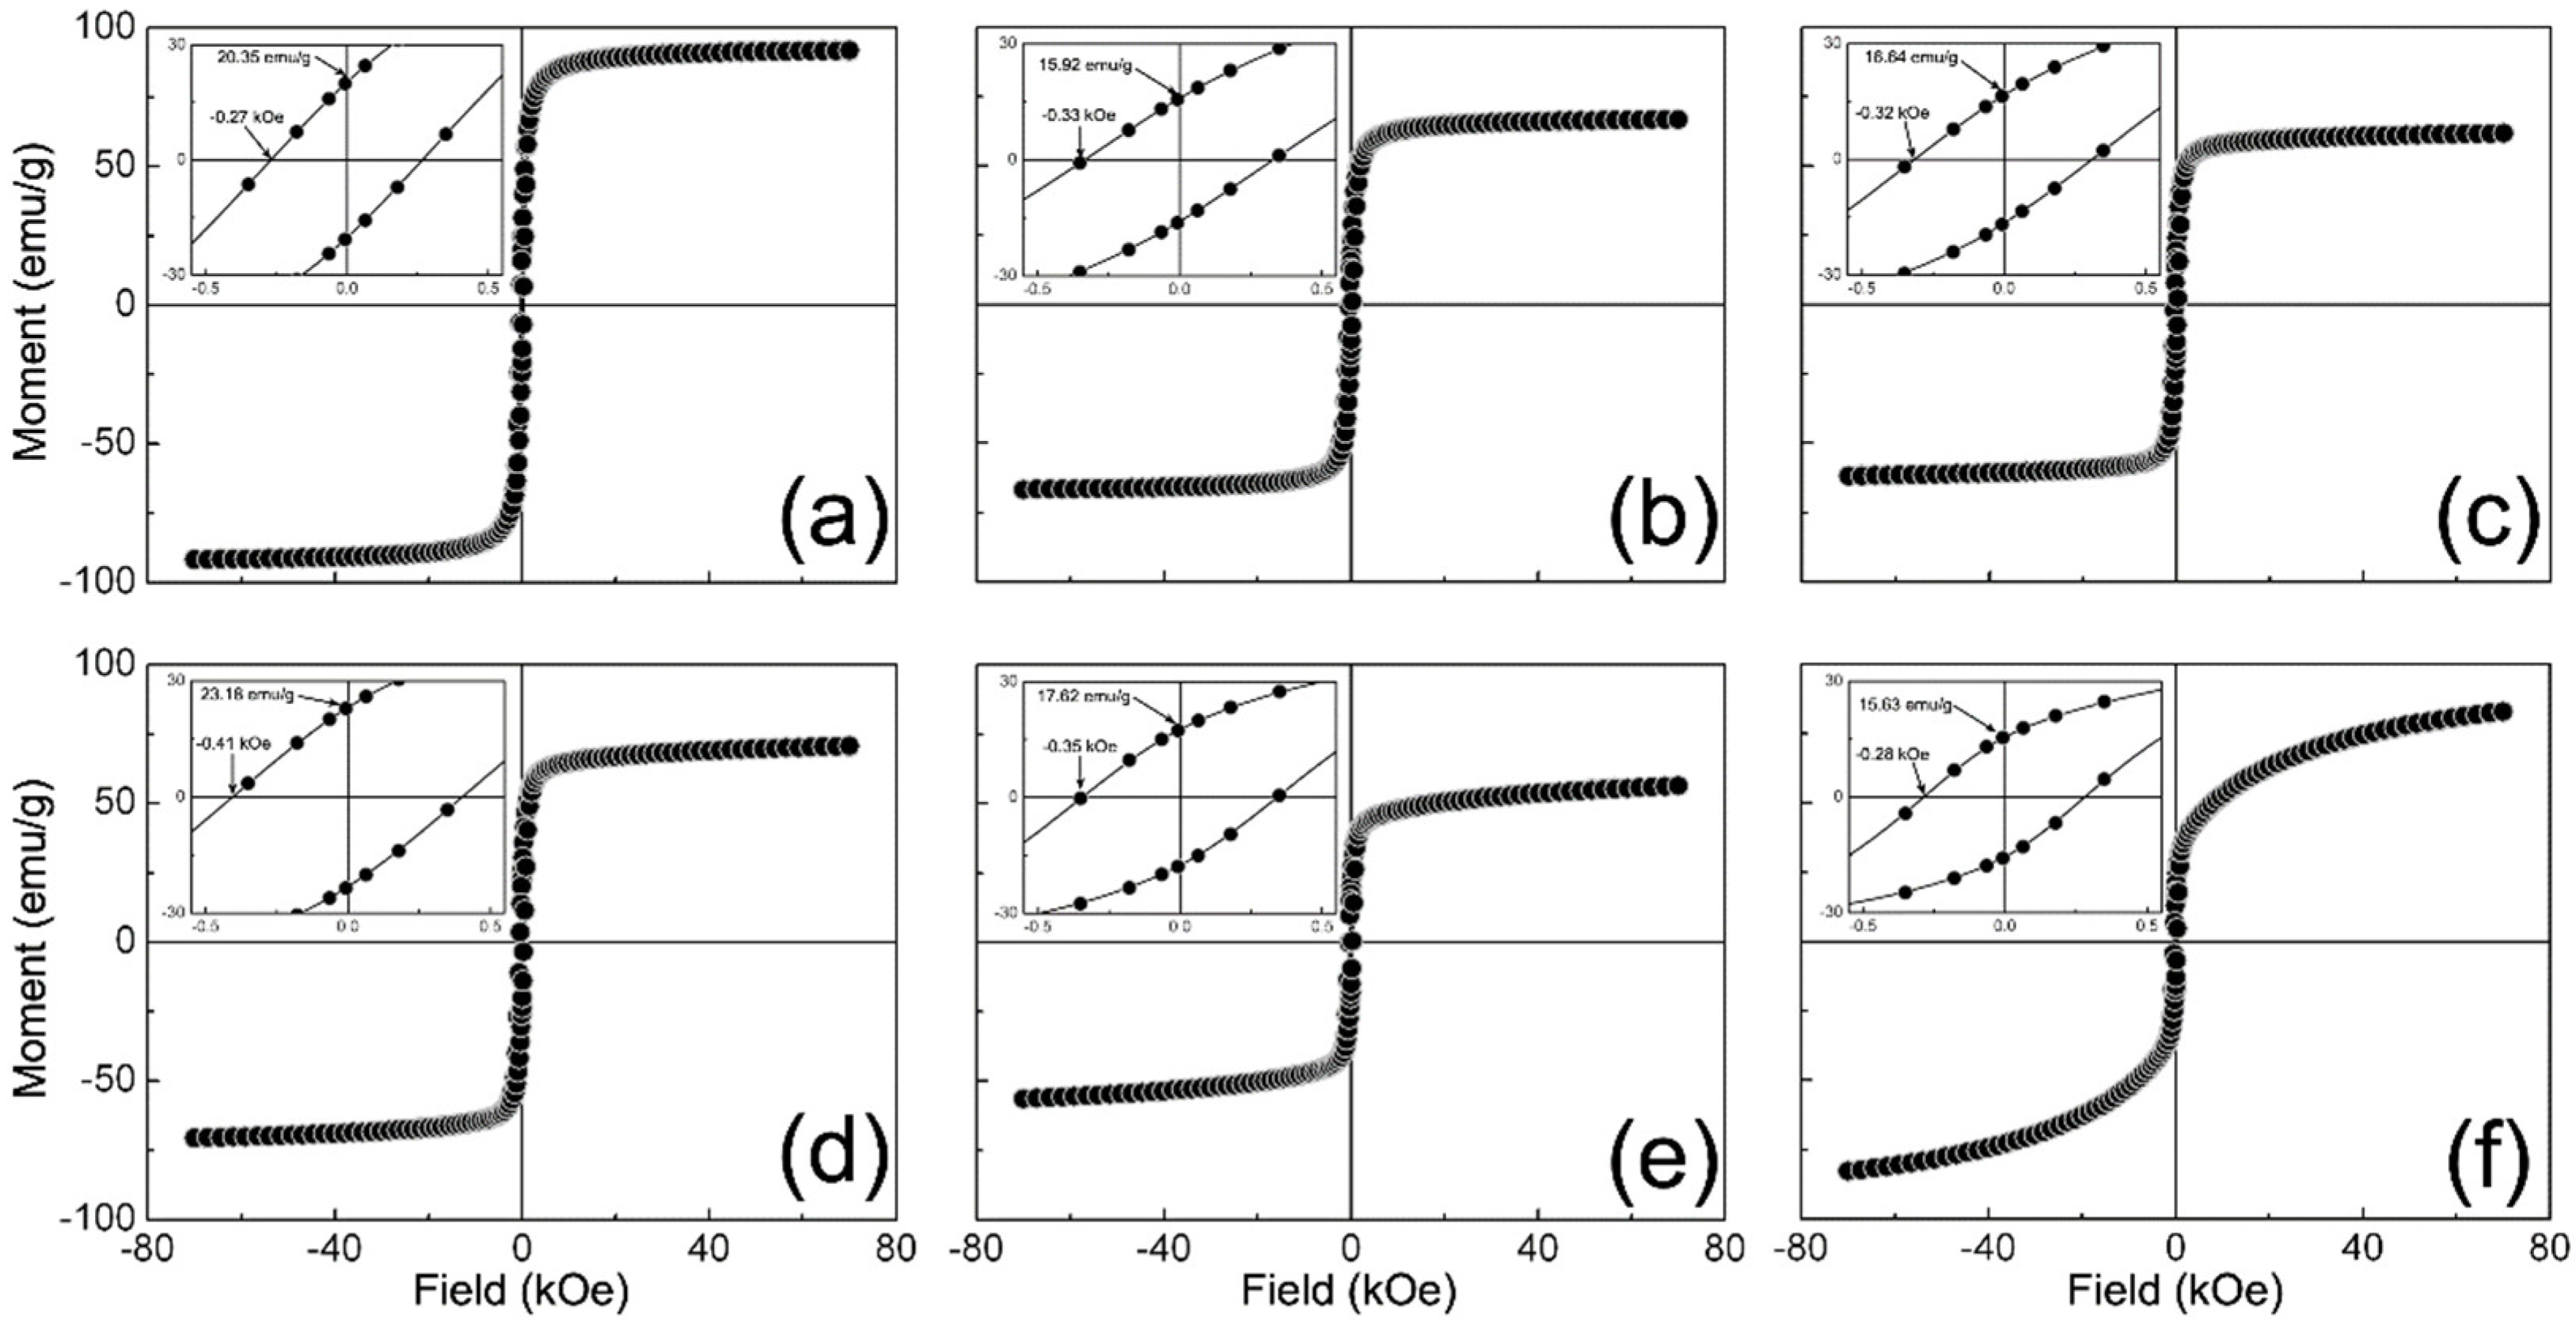
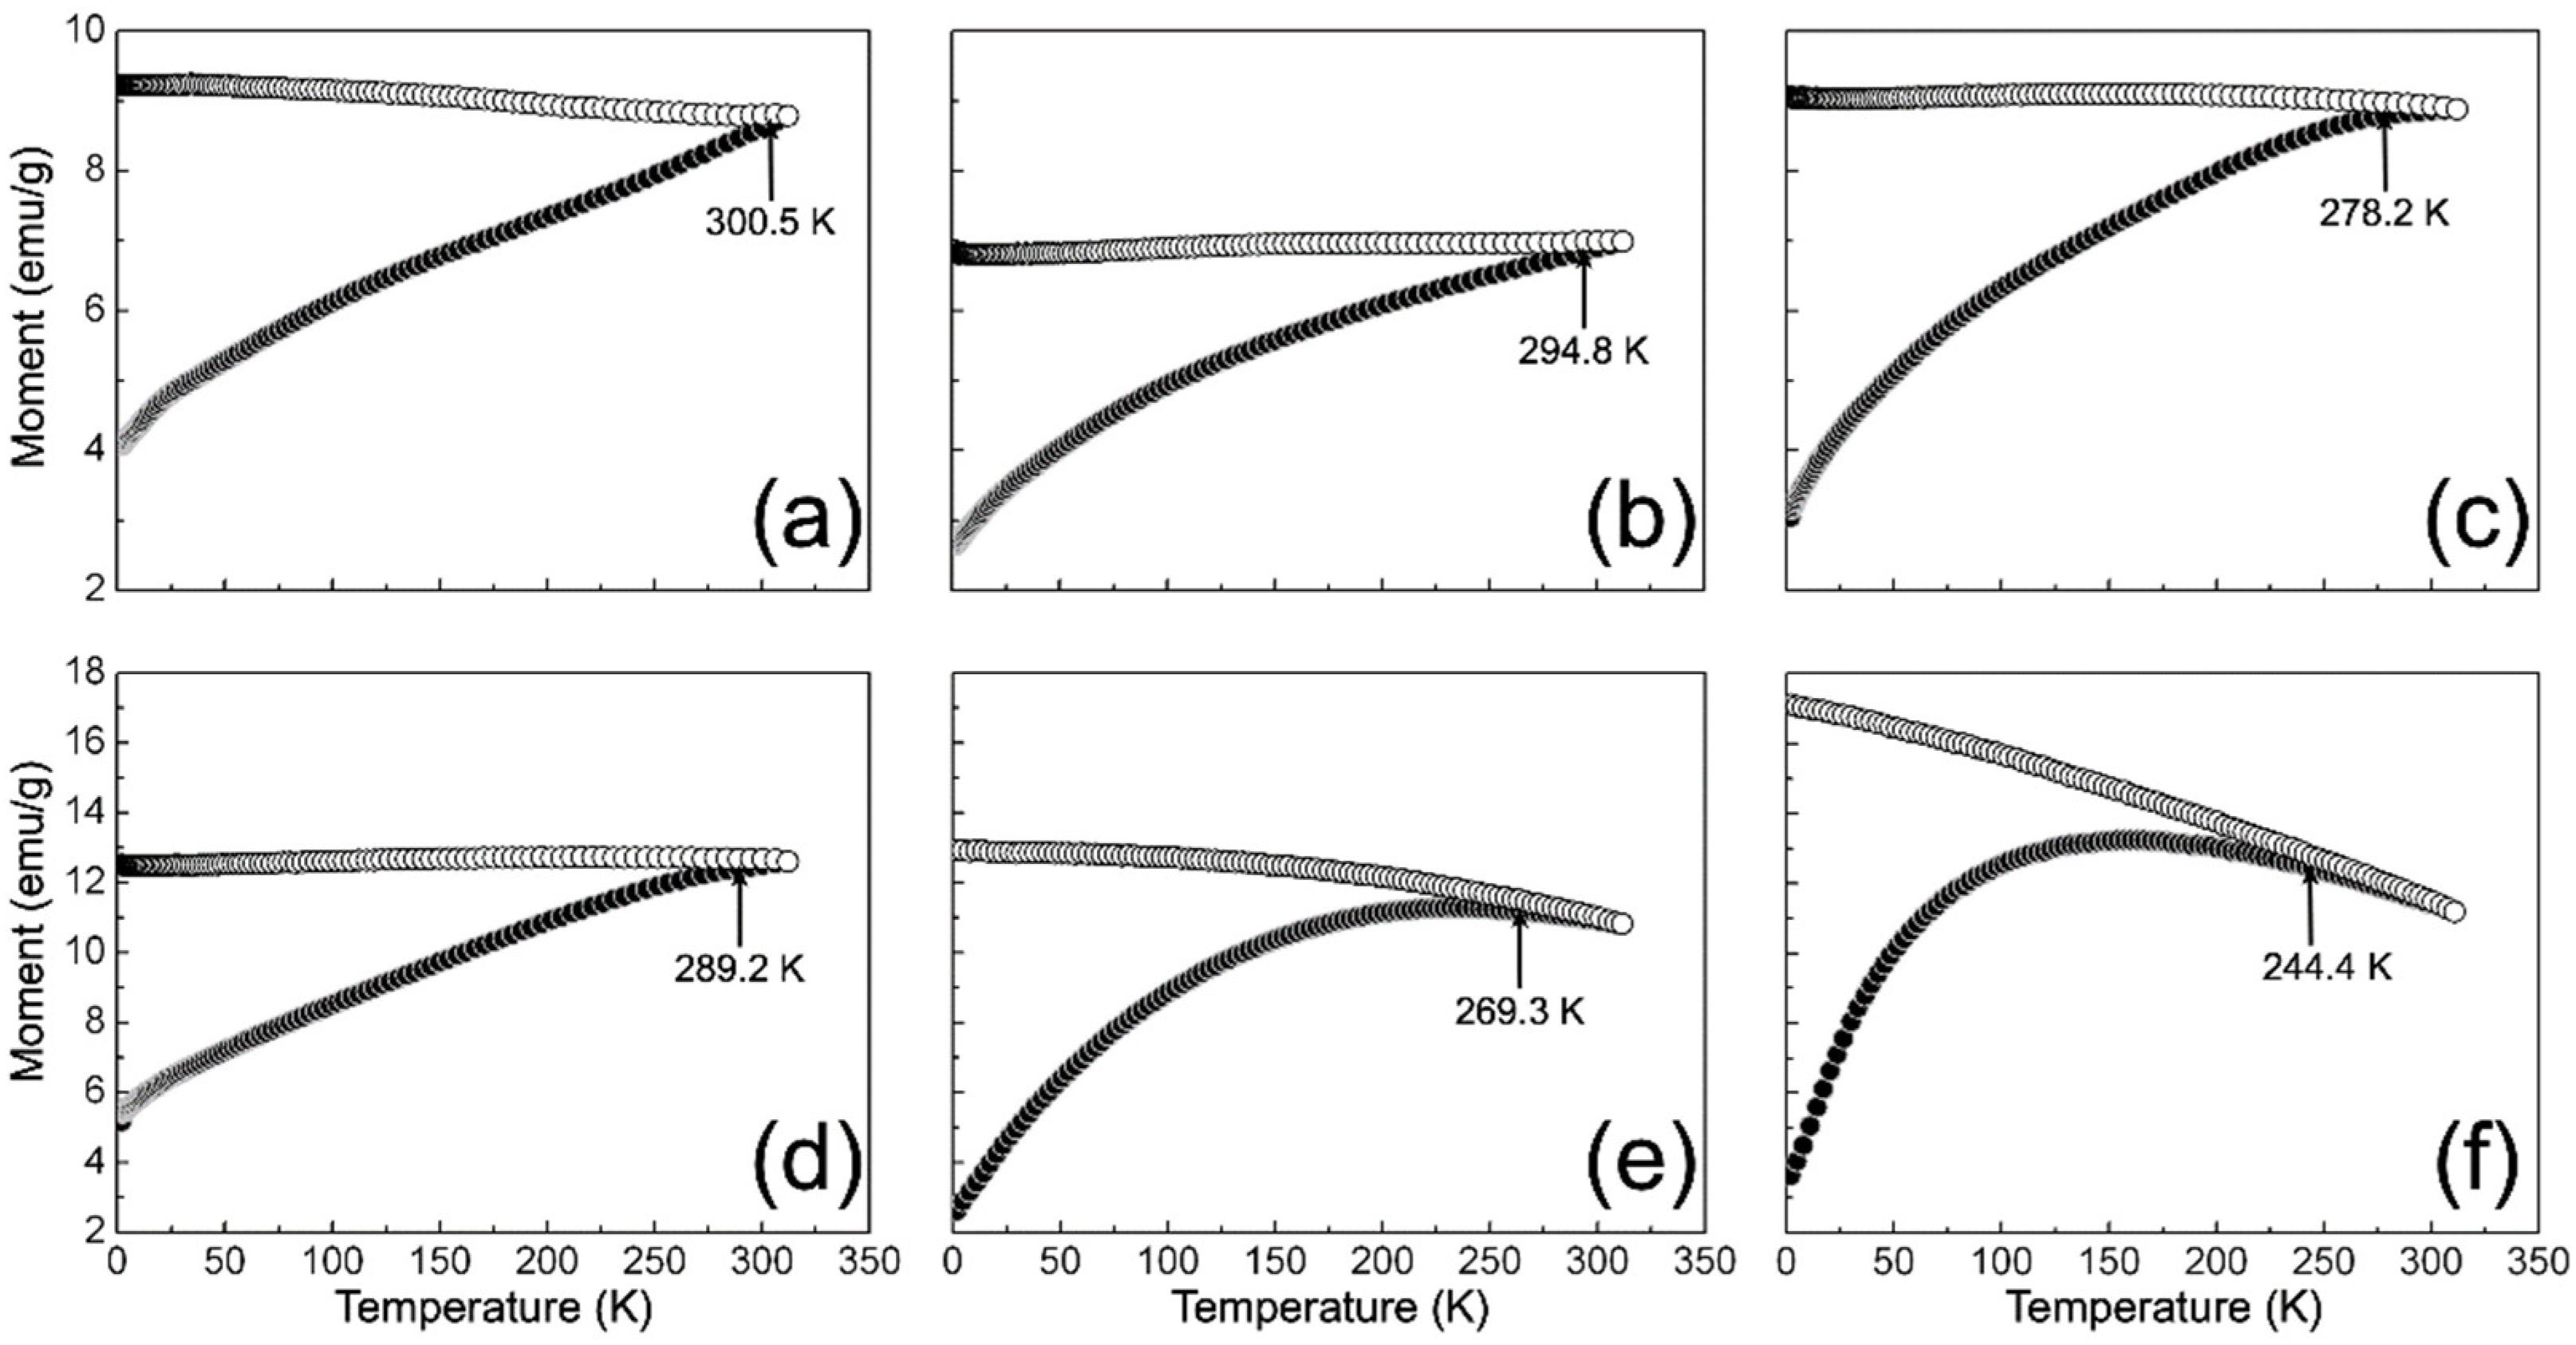
The bandgaps of synthesized anatase TiO2 (3.2 eV) and γ-Fe2O3 (1.95 eV) varied considerably with the composition ratio [46]. A plot of the bandgaps (Figure 5) for the different T/M NC ratios showed a reduction in the bandgaps as the amount of γ-Fe2O3 increased. The reduction in bandgap is associated with the increased electron transfer to TiO2 (leaving behind a compensating hole in γ-Fe2O3), accounting for a decreasing energy bandgap from the T/M NCs to TiO2 [56]; the presence of TiO2 in the NCs accounts for its higher bandgap values for γ-Fe2O3. Therefore, excess electrons are generated due to the composite formation highly recommended for the adsorption in the sorption-ion exchange mechanism [57,58].
However, excess γ-Fe2O3 contributes Fe ions to the NCs and can be toxic when used for drinking water treatment [59]. In addition, the X-ray diffractogram depicts the presence of TiO2 depletion at a higher γ-Fe2O3 presence (I(101)/I(311) from Table 4). Comparing the bandgap values with the ratios (Table 4) shows that the NC properties tend toward higher material composition.

3.5. SQUID Analysis

Figure 6 shows the M (H) curves recorded for the γ-Fe2O3 and NCs samples. Herein, it is possible to notice that all the curves exhibited hysteretic characteristics that agree with those expected for a ferromagnetic material (see insets in Figure 6). It is worth mentioning that the magnetic moment in these curves was normalized to the fraction of the magnetic phase in each sample. In addition, Table 5 reports the maximum magnetic moment (Mmax), coercitivity (HC), remanence (MR), and remanence ratio (RR) obtained for the samples. Nonetheless, we observed that the remanence ratio is lower than that reported for non-interacting magnetic nanoparticles (MNPs) with either cubic (RR = 0.8) or uniaxial (RR = 0.5) anisotropy [60,61]. This discrepancy can be related to the size of the synthesized MNPs [62]. As documented, small IO NPs can depict the surface-to-core exchange among non-collinearly arranged spins on their surface than at their core. Consequently, a reduced number of spins can contribute to the remanence of the sample. This feature is consistent with the lack of saturation at magnetic fields as high as 70 kOe for all samples.
There is also an observed decrease in Mmax from 91.89 to 61.71 emu/g as the γ-Fe2O3 content in NCs decreases towards a T/M weight ratio of 5/5, from which Mmax increases to 82.97 emu/g. This response could be related to the average particle size diminishing in NCs as the γ-Fe2O3 content decreases as well as either dipole-dipole or exchange coupling among particles that modify the effective anisotropy of samples (Keff). Accordingly, the dipole-dipole coupling is a long-range demagnetizing interaction that occurs among particles without contact, whereas the exchange coupling is a short-range magnetizing interaction among particles in close contact [63,64]. As Figure 2 shows, the nanoparticles become more aggregated as the T/M weight ratio tends to 1/9. Thus, it is possible to suggest that the magnetic interaction among particles tends towards exchange coupling as the γ-Fe2O3 weight content in NCs decreases. Moreover, this feature is congruent with the reduction in HC from 0.33 to 0.28 kOe for these NCs, as it has been reported for other composite magnetic materials [65].
On the other hand, Figure 7 shows the ZFC and FC curves recorded for γ-Fe2O3 and NC samples. As can be seen, all ZFC curves describe an increase in the size magnetic moment as a function of temperature, which can be related to the thermal relaxation of spins in the direction imposed by the applied magnetic field (100 Oe). Moreover, a remarkable irreversibility between the ZFC and FC curve is observed for all cases. This irreversibility can be attributed to the frozen surface spins’ ferromagnetic response in the field-cooled direction [66]. In addition, the FC curves of the NCs describe a plateau-like feature towards low temperature, which agrees with the results obtained from M (H), suggesting the interaction between particles. Consequently, this interaction can impose a cooperative blocking over the re-orientation of the nanoparticles’ spins at lower temperatures [61].

3.6. Adsorption Studies and Effect of Various Parameters

The As adsorption studies using the different NCs ratios (1/9, 3/7, 5/5, 7/3, and 9/1) and varying parameters were evaluated to derive and optimize the relevant factors for the effective removal of As species. Several factors affecting adsorption may primarily depend on the nano-adsorbent properties, in this case, the nanomaterials used for this study. Therefore, the structural, morphological, and optical properties of the NCs play a significant role in the effectiveness of the adsorption process.

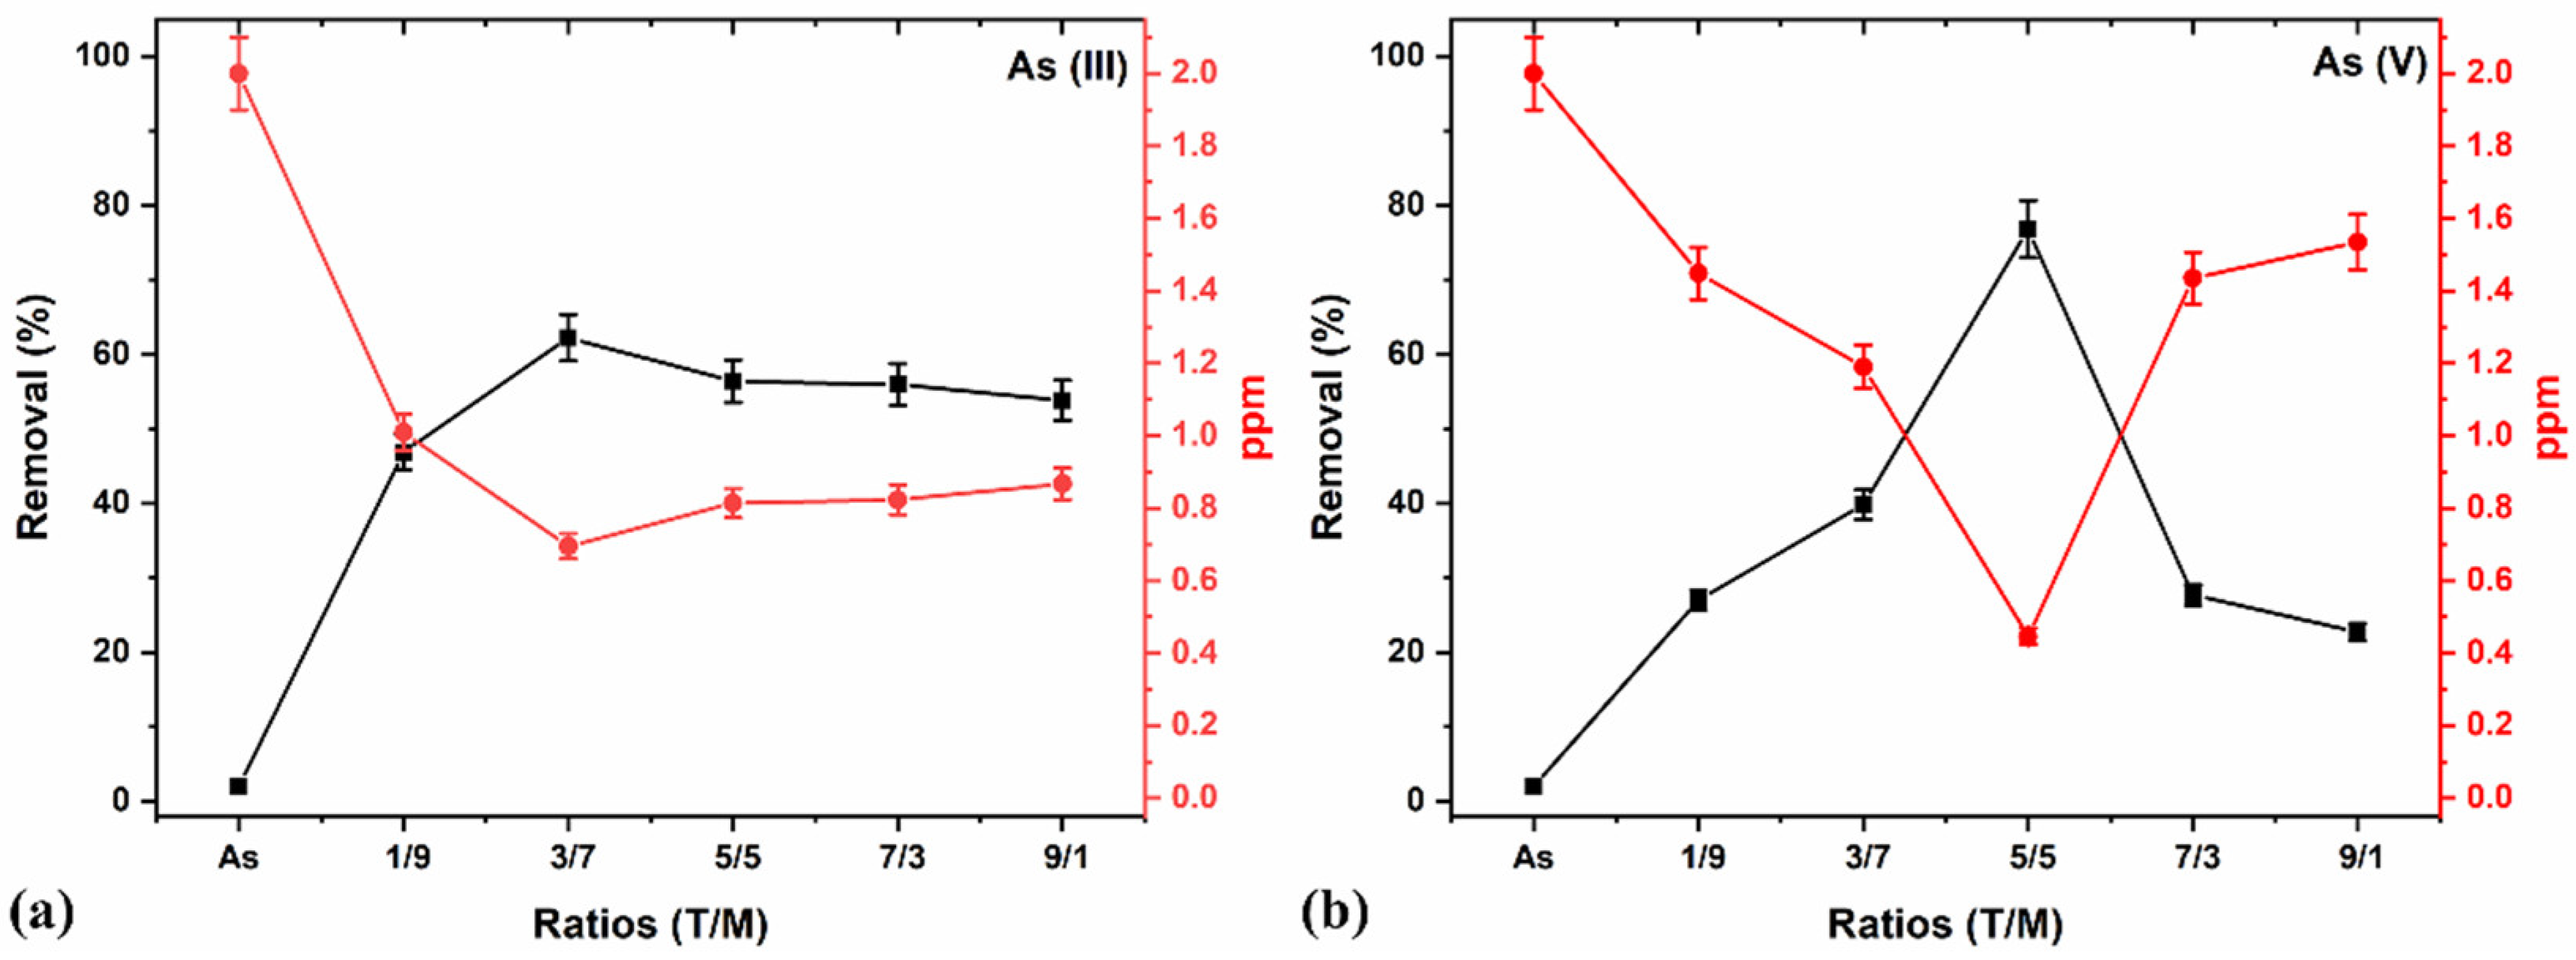
3.6.1. Adsorption Using the Synthesized T/M NC Ratios

The adsorption studies of As (III) and (V) using the various T/M NC ratios were determined with a constant dosage of 0.5 g/L, pH 7, and 2 ppm concentration for 5 min by adopting the methodology of our previous work [46]. Figure 8 shows an optimal As (V) removal with the T/M composition of a 5/5 ratio (Figure 8b); however, As (III) removal was marginally better with the 3/7 composition (Figure 8a). This performance is attributed to the higher γ-Fe2O3 composition in the composite and the presence of TiO2, which reduces the agglomeration effects, thereby increasing the surface area. A higher composition of γ-Fe2O3 (i.e., 1/9), although having the potential for providing more charges during the adsorption processes, has smaller crystallite and particle sizes (Table 4) and possesses the challenges of agglomeration. Contrarily, a higher TiO2 presented lower performances attributable to Fe’s composition and potentially lesser charges.
Similarly, a plot of the ppm concentration against the various ratios (Figure 8a,b) showed a minimal value with a 5/5 ratio for As (V) removal and comparatively better performance with a 3/7 composition for As (III) removal. Generally, the NCs showed better As (V) than As (III) reduction for all ratios, consistent with literature reports that As (V) is more straightforward to remove than As (III) [67].
The choice of the 5/5 ratio offers almost equivalent compositions of Fe and Ti in the NCs (Table 2) and parameters desirable for adsorption properties, tapping the practically identical distribution of the physical properties of TiO2 and γ-Fe2O3. The ratio also offers the potential to optimally remove both As (III) and As (V) simultaneously without changing the adsorbing material, which is substantially advantageous. Thus, this study’s subsequent adsorption processes and optimizations mainly focused on the 5/5 T/M NCs ratio based on the preliminary data.
The performance of fabricated nanomaterials for As removal depends on certain prevalent ambient conditions, for example, pH, concentration, time, and dosage. Thus, the systematic study of these conditions will provide an in-depth understanding of the better-operating conditions for nano-adsorbents. Furthermore, efficient applications can allow for better utilization of the adsorbing materials. Therefore, this study aims to elucidate various factors and their influence on As adsorption using the nano-adsorbent.

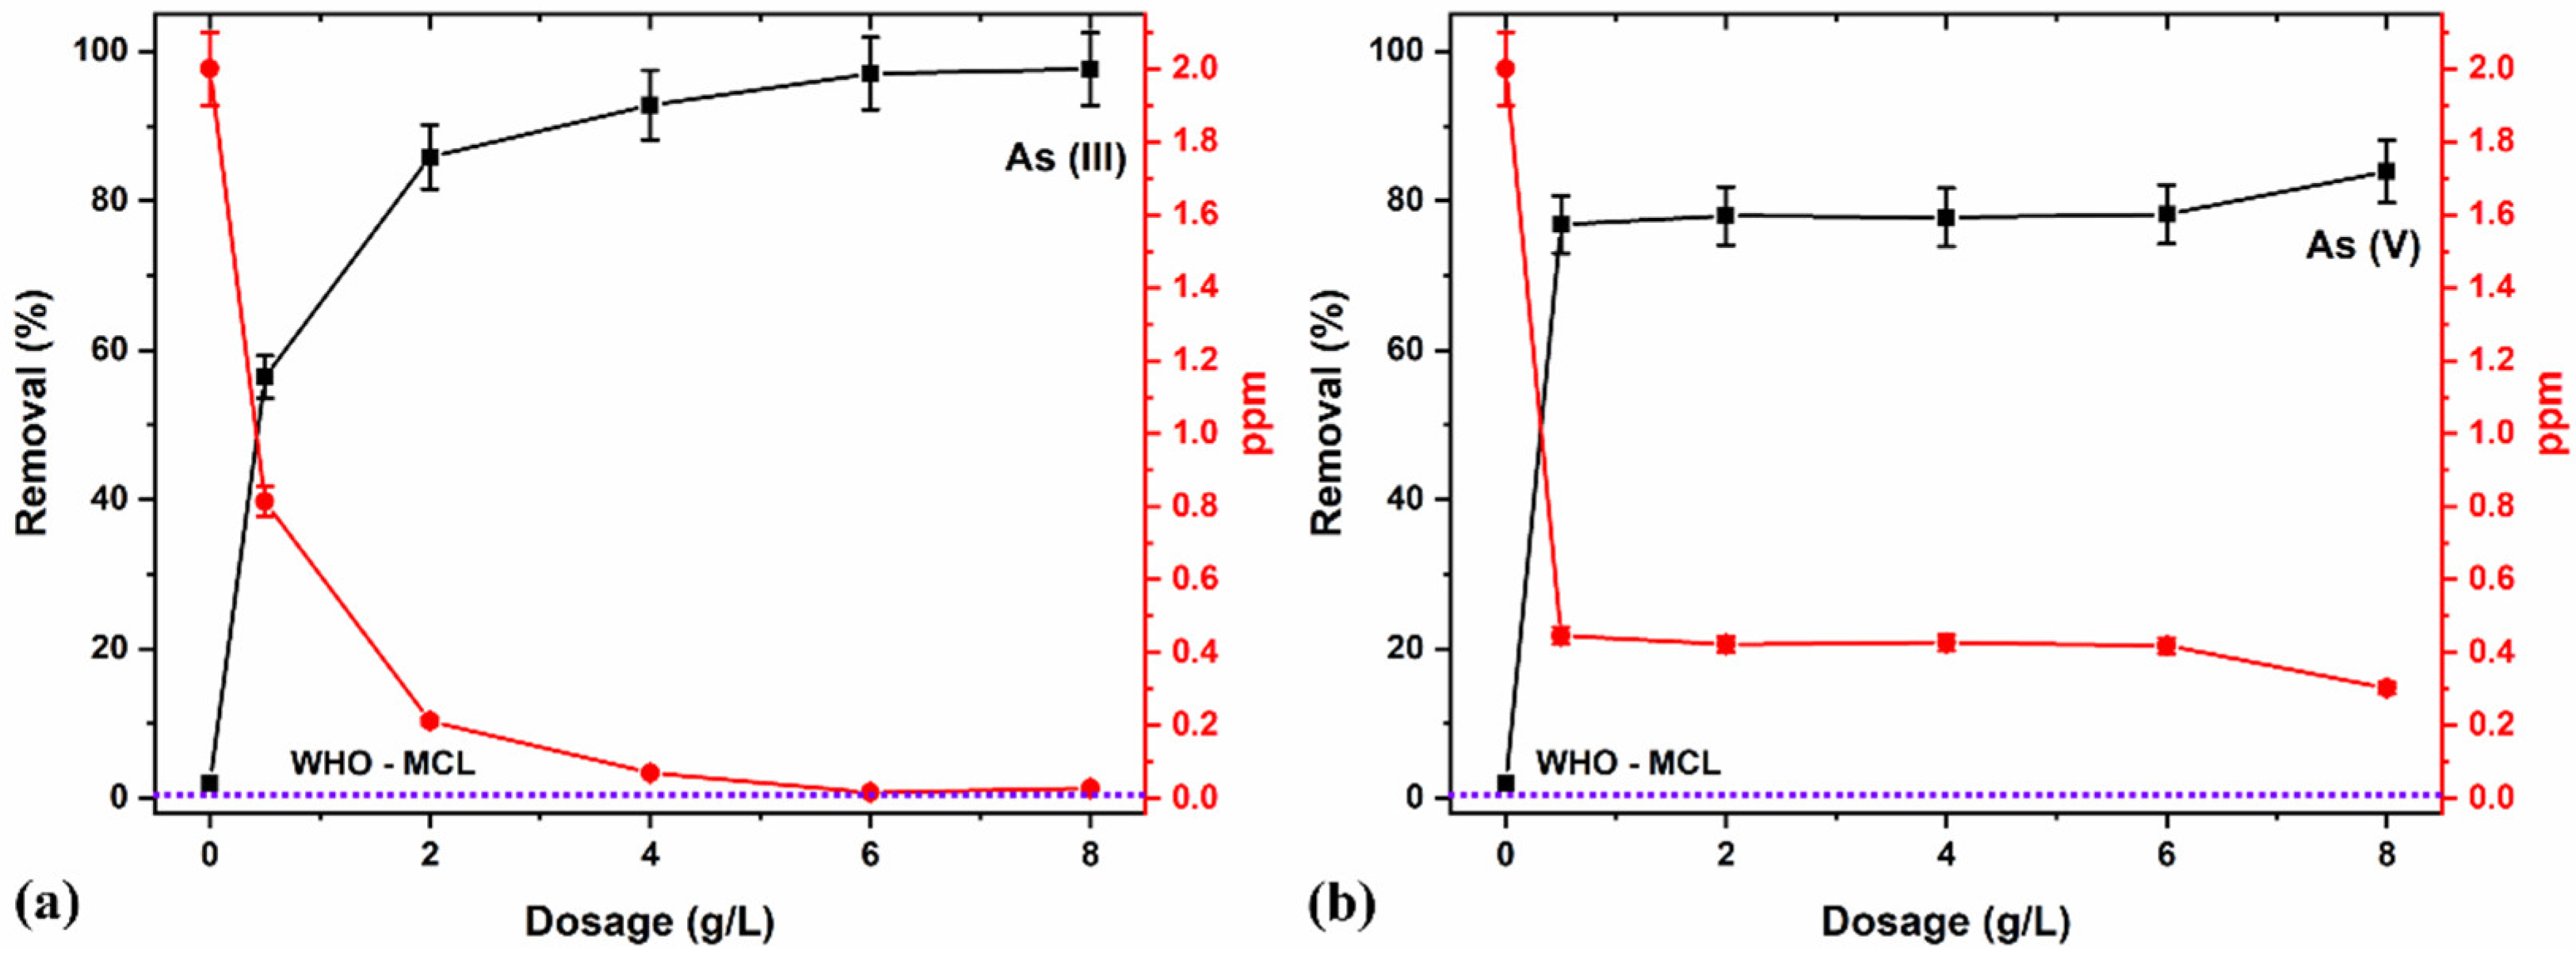
3.6.2. Effect of Nano-Adsorbent Dosage

The dosage refers to the nano-adsorbent concentration used in adsorption, determining an adsorbent’s capacity for an initial adsorbate concentration. The optimal dose is mainly related to the availability of active sites linked to exposed surface functional groups on the nanomaterials. The solute’s adsorption magnitude is directly proportional to the adsorbent concentration, increasing active exchangeable adsorption sites [68]. Thus, an optimum concentration or the amount of nano-adsorbent dosage determines the adsorbent surface area and adsorption sites. For example, the adsorption efficiency may decrease in the presence of excess adsorbent concentration due to interference resulting from the interaction of active adsorbent sites [69,70,71,72] or adsorption sites remaining unsaturated during the process [73]. Therefore, there is a vital need to optimize the dose of an adsorbent to achieve effective removal.
Figure 9a,b represents the significant increase in the removal of As (III) and (V) with a nano-adsorbent dosage that directly relates to the active site’s availability and, therefore, the presence of surface functional groups providing active exchangeable adsorption sites in the NCs [68]. The adsorption studies using different dosage amounts (0.5, 2, 4, 6, and 8 g/L), evaluated at a constant pH value of 7, showed an increased removal concentration of 2 ppm and 5 min contact time percentage with the increase in the adsorbent dose.
As depicted in Figure 9a, an optimal dosage of 8 g/L is provided for As (III) removal to the MCL recommended by the WHO [74]. A further increase in the dosage poses a potentially excess adsorbent concentration, thereby decreasing adsorption by interfering with the interaction of active sites and unsaturated adsorption sites. The observed poor performance in As (V) removal (Figure 9b) may be due to pH or inefficient contact time for optimal removal, and, therefore, the need for other optimization parameters was carried out.

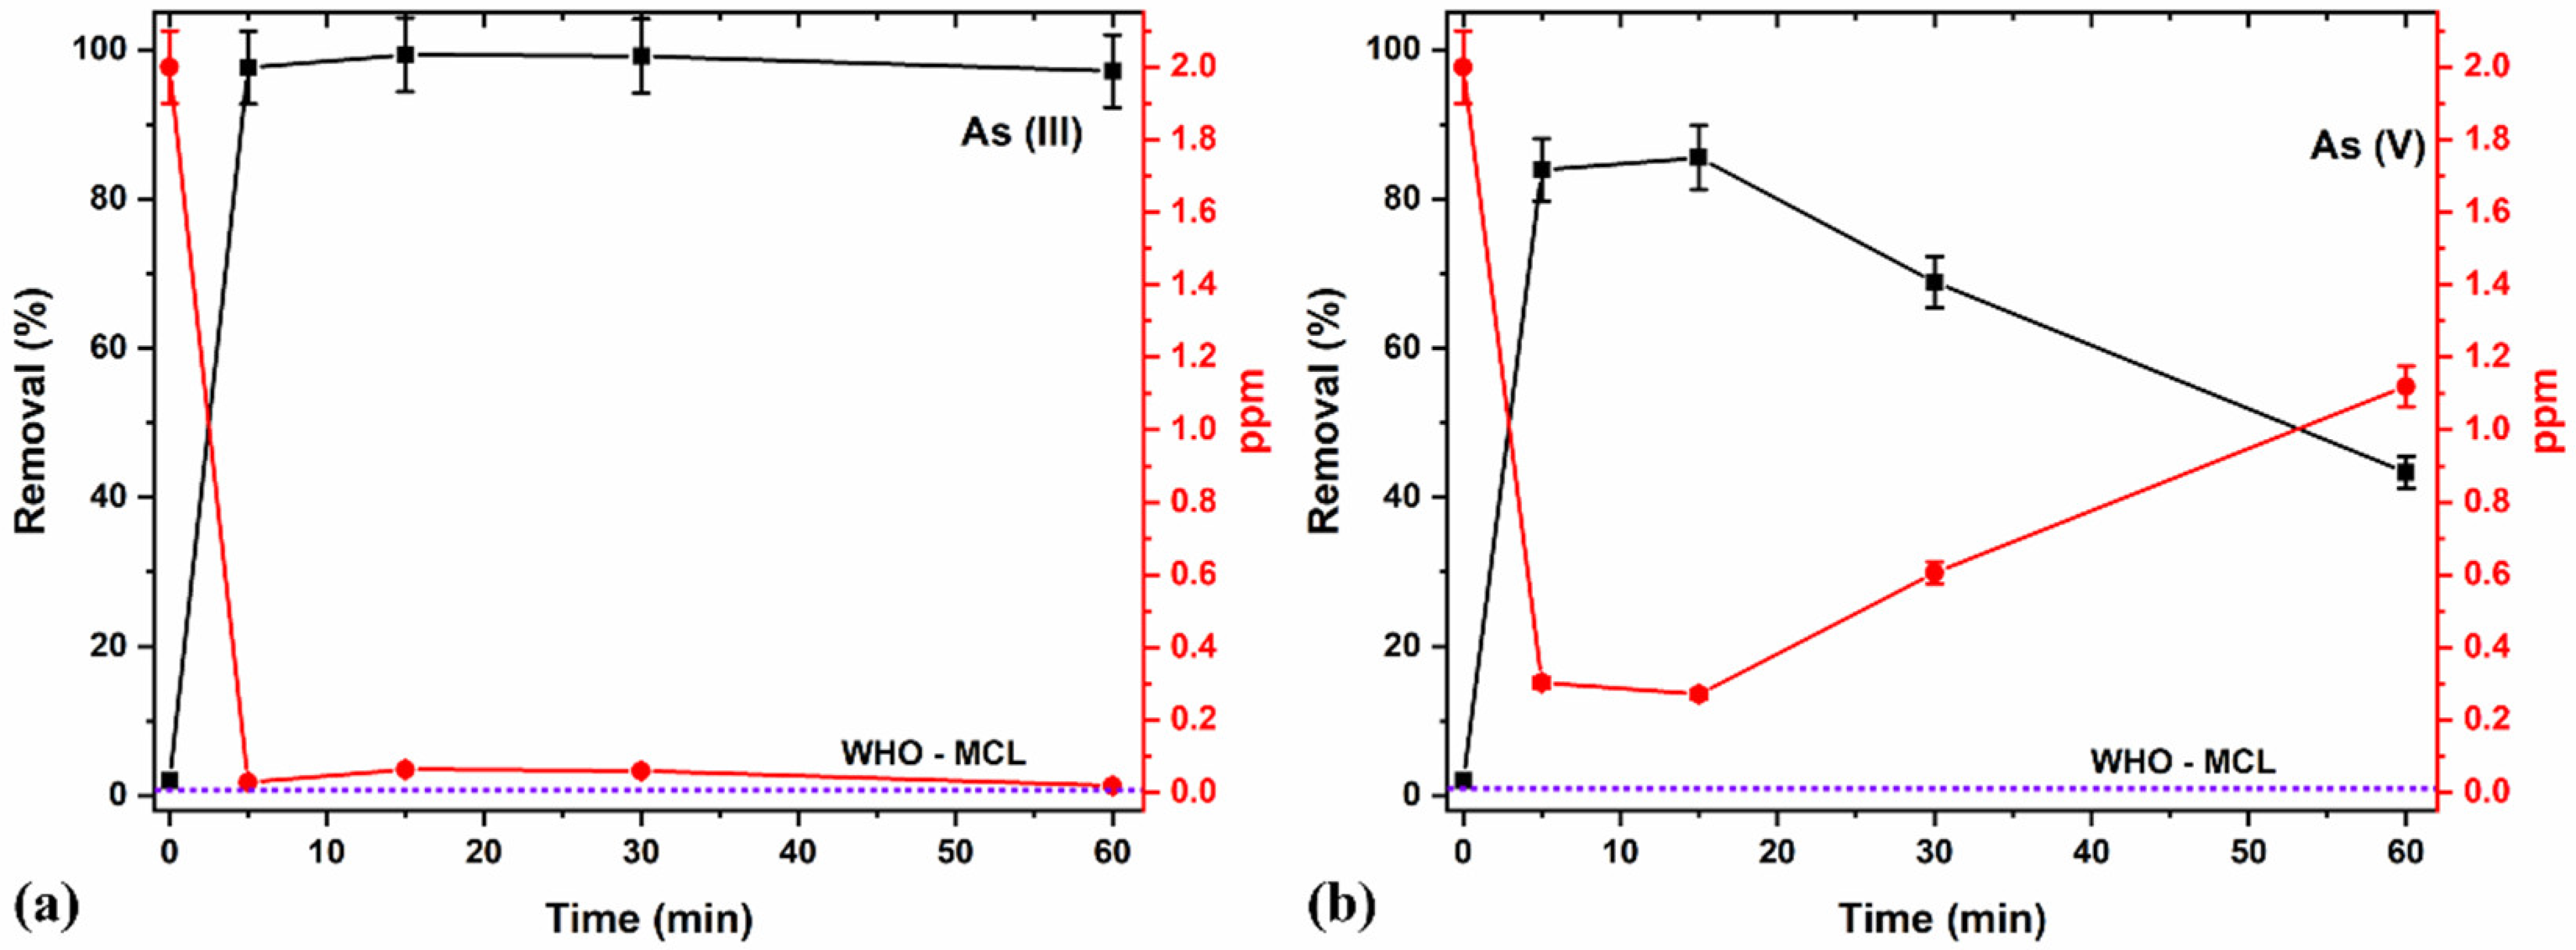
3.6.3. Effect of Contact Time

The contact time is an essential factor affecting the adsorption process. It can also influence the economic efficiency of the process and the adsorption kinetics [75]. For instance, the initial stages will always result in very high adsorption, primarily due to the presence of many available sites for adsorption. However, as the time prolongs and the adsorbents’ active sites approach saturation with adsorbates, the adsorption percentage and efficiency of further adsorption decrease. Therefore, the effects of time on adsorption were evaluated for different time durations (Figure 10a,b) and the adsorption kinetics and efficiency of the process were explored.
A higher removal percentage was observed in the initial stages (between 5 and 15 min) because of the great adsorption sites’ availability [75]. Further increasing the duration produced lesser adsorption efficiencies for As (III) removal and even lower in the case of As (V) removal. This proves that considering contact time remains vital in adsorption studies and processes to control the effects of saturation on the adsorbents’ active sites, thereby avoiding potential leaching of the As species back into the media. The potential leaching of As (III) and (V) into the media at longer durations (30 min and longer) may account for the observed decrease in removal percentage and increase in ppm (Figure 10a,b). Comparatively, a 15-minute contact time yielded an optimal removal of 98% and 85% of As (III) and As (V), respectively, with a better As (III) removal efficiency compared to As (V).

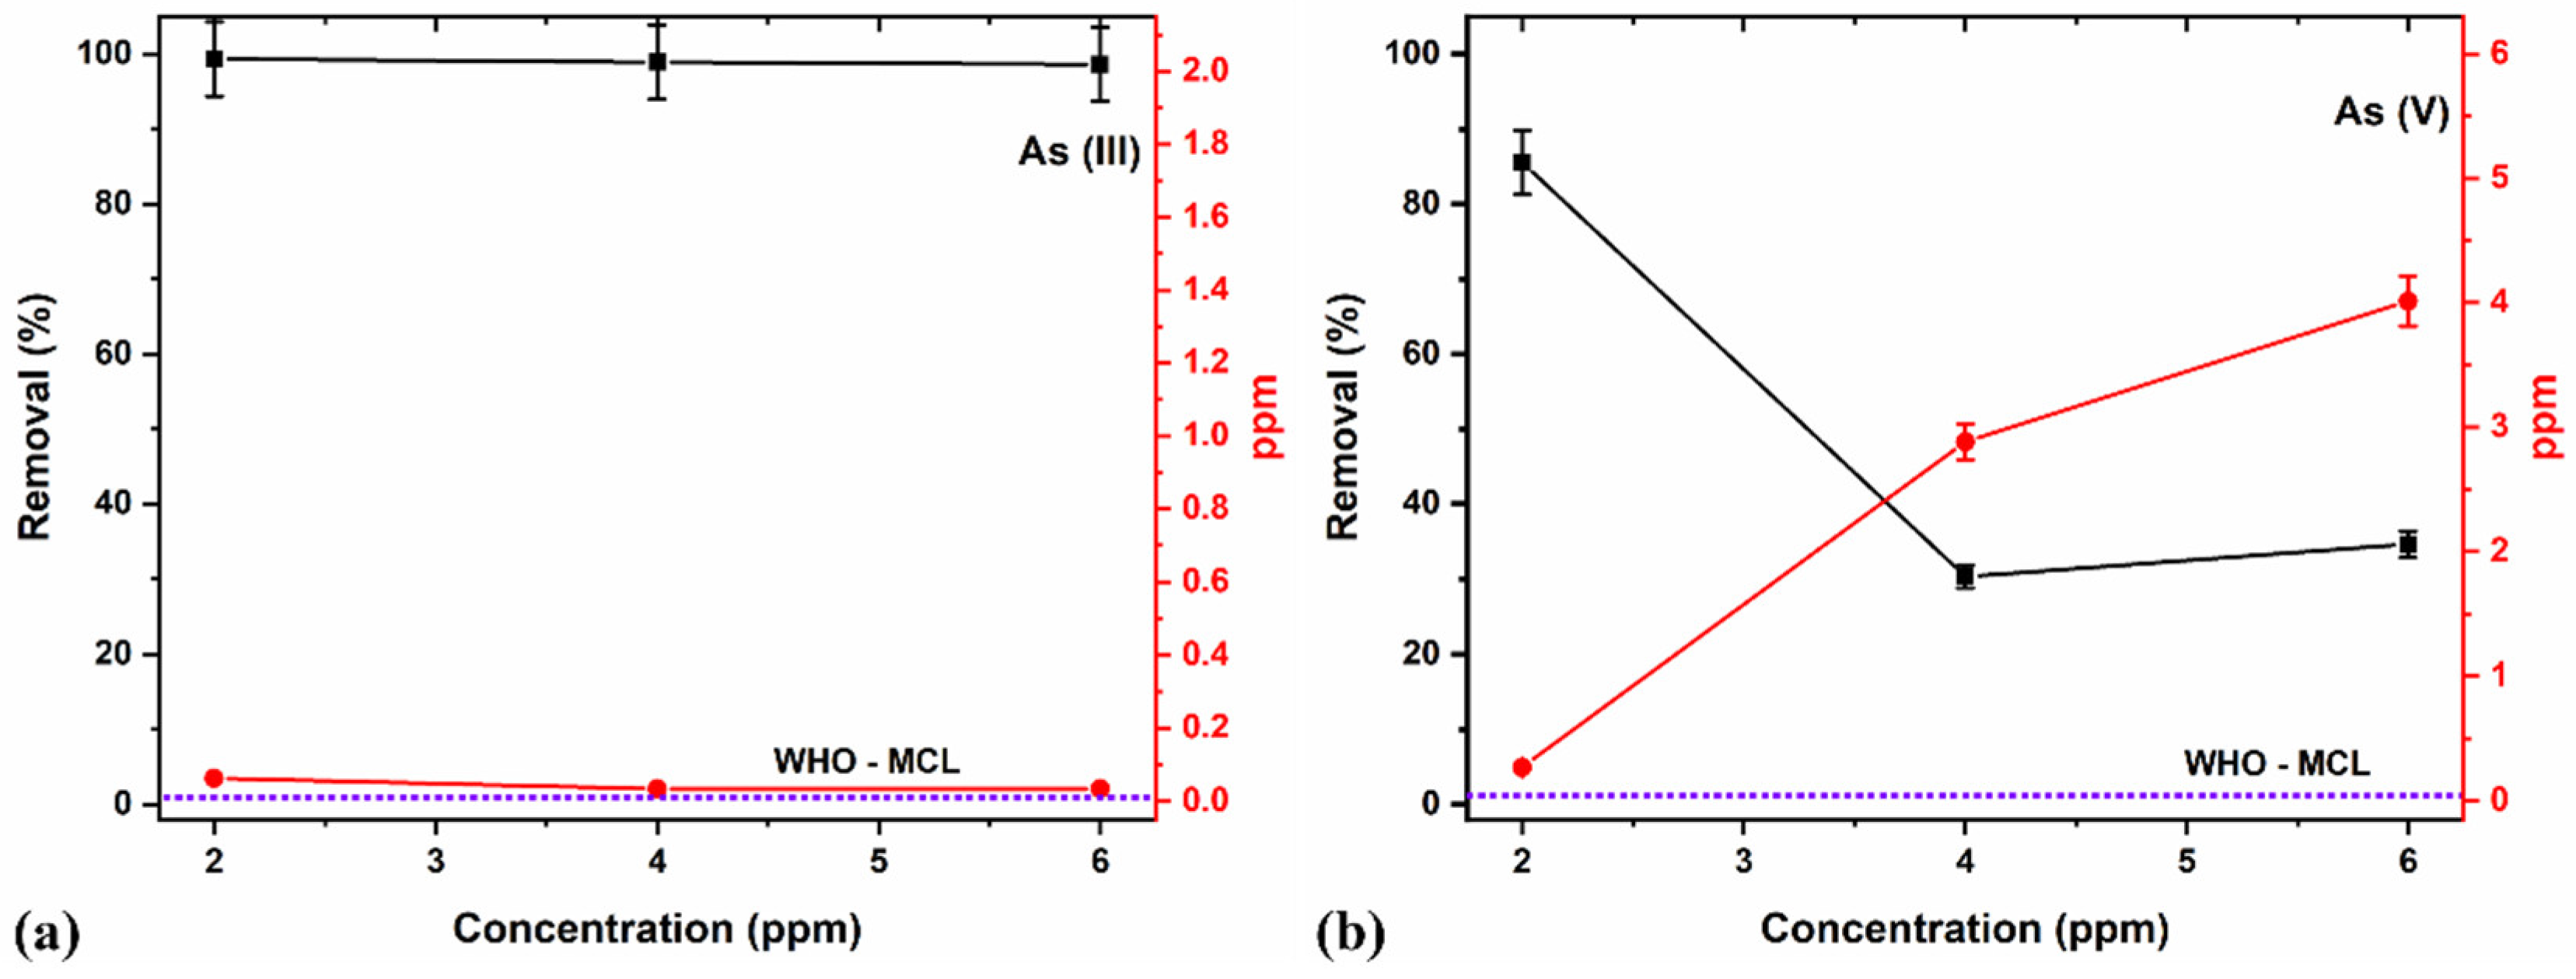
3.6.4. Effect of As Concentration
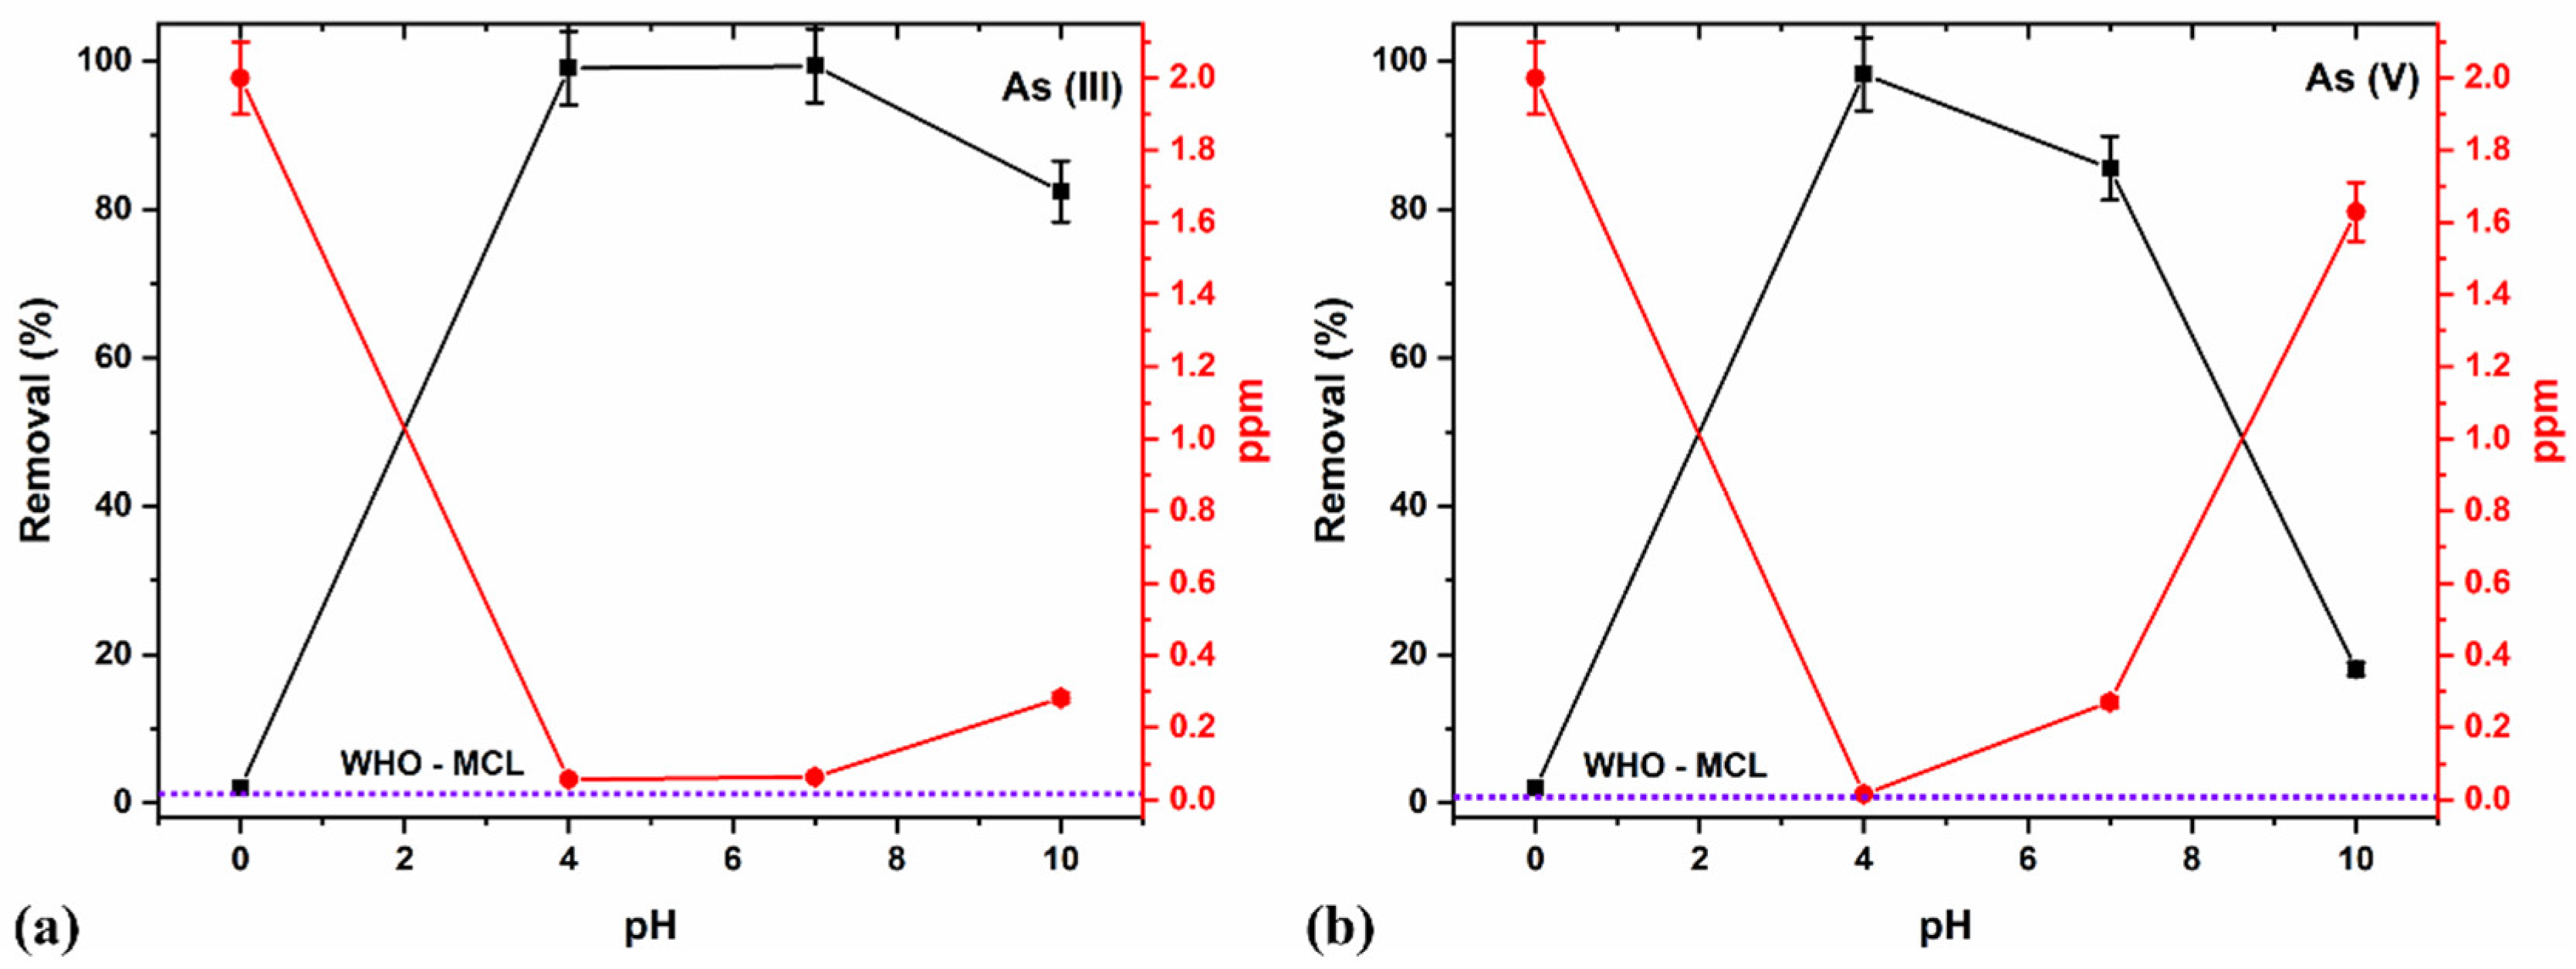
An initial As concentration significantly influences the percentage removal of the species. At low adsorbate concentrations, the surface area, adsorption sites, and adsorbents’ availability are relatively high, allowing for instantaneous adsorbing to the contaminants [76]. However, higher concentrations signify that all the available adsorption sites are insufficient, thus decreasing the removal percentage. Consequently, the removal percentage of an adsorption process purely depends upon the ratio of the number of adsorbate moieties to the adsorbent’s available active sites in a particular environment [77]. A lesser ratio depicts more sites’ availability, which gradually increases with the decrease in adsorbates resulting from increased percentage removal.
Studies on the effects of As removal with different concentrations using a fixed adsorbent NC dosage of 8 g/L at a pH of 7 were carried out (Figure 11a,b). The pre-determined optimal duration of 15 min helped eliminate the potential disadvantage of As species leaching back into the aqueous media after adsorption.
In this study, the 8 g/L adsorbent NC dosage showed a maximum (>99%) As (III) removal for all concentrations (i.e., 2, 4, and 6 ppm, Figure 11a). The depreciation in performance as As concentration increases for As (V) removal (Figure 11b) may be due to the higher concentration and comparatively reducing adsorption sites of the adsorbents and availability for readily adsorbing the contaminants [76], thereby decreasing the removal percentage. Consequently, a lower ratio (number of active sites occupied/number of active sites available), increasing the number of adsorbate moiety per unit volume of solution at a fixed adsorbent dose, might be recommendable for better performances. The limited performance with As (V) compared to As (III) may also be related to the pH of the media, which tends to favor As (III) removal at near-neutral pH values in comparison to lower values for As (V) removal [77].

3.6.5. Effect of pH

The media’s pH remains a critical variable affecting the adsorption of As, mainly due to ionization and an adsorbent’s surface characteristics. The pH reportedly modifies the adsorbent’s surface and the present functional groups, e.g., OH. This potential modification helps the adsorbent to be efficient enough to adsorb in a slightly acidic environment due to the electrostatic repulsion between H+ ions and surface functional groups [46]. Other studies also report that the adsorption of As and other metals (e.g., La) at pH values preferentially less than 9.0 [73] was beneficial for heavy metal removal. The optimal pH of 7.0 for As (III) removal and even lesser pH values for As (V) removal reportedly causes the adsorption sites on the adsorbents’ surface to be protonated. The constraints imposed by the pH in the aqueous media significantly affect the degree of speciation of As species and the adsorbent surface charge. The interaction between the IOs surface containing OH group becomes protonated as FeOH2+, causing the surface to acquire a positive charge [78]. The OH group’s deprotonation causes the IOs surface to develop a negative charge (FeO), creating an electrostatic attraction between the negatively and the positively charged iron oxide surface [46,79,80]. The acidic pH (around 4.0) favors the sorption of anions onto the iron oxide surface and reportedly favors the maximum adsorption capacity for As (V) due to their anionic forms [81].
Some possible combinations, e.g., Fe and Ti, provide other functional groups at the surface, causing them to acquire more positive charges at various pH levels. These materials have significant efficiency for As removal from polluted water at different pH values. Some literature reports include the maximum adsorption capacity for As (III) and As (V) using a composite of Fe-M (M = Sn, Cr, Cu, Mn, Ti) binary oxides [82,83,84,85,86].
Thus, we determined the effect of pH on As species removal at a constant 15 min duration, 2 ppm concentration, and 8 g/L adsorbent dosage by varying between acidic (pH 4), neutral (pH 7), and alkaline (pH 10) media (Figure 12a,b).
The acidic pH 4 produced >99% removal for both As (III) and (V) (Figure 12a,b), owing to reportedly modified adsorbent’s surface and present functional groups which help adsorption due to the electrostatic interaction existing between H+ ions and surface functional groups [46]. The acidic pH favors the anions’ sorption onto the iron oxide surface and accounts for the maximum adsorption capacity for As (V) due to their anionic forms [81]. The modifications due to the combination of the Fe-Ti oxide provided other functional groups at the surface. They possibly acquired more positive charges at various pH, thereby maximizing adsorption capacity for As (III) and As (V) using the binary composite oxide. The optimal results at pH 4, which almost lie on the MCL limit (Figure 12a,b), showed that the NCs efficiently remove all As species contaminants.
Further, an increase in the pH values to neutral (7.0) still produced >99% As (III) removal, which decreased at an alkaline pH value (10). At a neutral pH (7.0), the removal percentage for As (V) reduced, which is consistent with the reported literature results, and declined further at an alkaline pH (10) [73,81]. These observations also agree with the previous results for the optimal pH of 4–9 for As (V) removal and pH of 3–11 for As (III) removal [87]. We compared our results with the other synthesis methodology and found that the ball-milled samples show high efficiency as a nano-adsorbent which is represented in (Table 6).

4. Conclusions

The TiO2/γ-Fe2O3 (T/M) nanocomposites synthesized using facile ball-milling and used for As (III) and (V) adsorption studies showed more than 99% arsenic removal. The structural studies of the milled nanocomposites showed no phase changes or presence of any secondary phases for all the synthesized ratios. The morphological studies showed the presence of spherical particles, with d-spacing values of 0.35 nm and 0.25 nm corresponding to the (101) and (311) planes belonging to the anatase TiO2 and cubic γ-Fe2O3 phases. The studies also showed variation in the crystallite and particle sizes, which decreases by increasing the maghemite content and the bandgap of the nanocomposites. Moreover, the SQUID analysis of the samples showed that the NC’s magnetic parameters tend to vary based on the γ-Fe2O3 weight content. The adsorption studies focused on optimizing the factors affecting arsenic removal, dosage, time, concentration, and pH. From the results, it is determined that an optimal T/M (5/5) NC ratio at an adsorbent dosage of 8 g/L with a contact time of 15 min, and pH 4 confirmed the maximum adsorption of >99% As (III) and (V), well below the WHOs recommended permissible concentration (0.01 ppm). From the results of the removal efficiency studies using a maximum of 2 ppm, we determined that the nanocrystals can be efficiently employed for even higher concentrations. Thus, the promising results obtained from this nanocomposite will be further studied to determine the kinetics. This also proves it may be a potential candidate for the effective removal of arsenic and can be implemented in a large-scale application, which is currently underway.

Author Contributions

Conceptualization, methodology, investigation, and writing original draft, M.B.; writing—review and editing, K.S. and O.M.N.; writing—review and editing, formal analysis, and data curation, R.M. and M.A.G.-N.; writing—review and editing, N.C.-E. and H.D.; and supervision, project administration, and funding acquisition, V.S. All authors have read and agreed to the published version of the manuscript.

Funding

This research was funded by Consejo Nacional de Ciencia y Tecnología (National Council of Science and Technology, CONACyT-Mexico) providing financial support from the project CONACyT-SENER 263043.

Data Availability Statement

The data presented in this study are available from the corresponding author upon request.

Acknowledgments

The authors would like to express their gratitude to Jaime Santoyo Salazar from CINVESTAV-IPN for TEM characterizations and Marina Vega González from Centro de Geosciences-UNAM for EDS analysis.

Conflicts of Interest

The authors declare no conflict of interest.

References

  1. Singh, R.; Singh, S.; Parihar, P.; Singh, V.P.; Prasad, S.M. Arsenic Contamination, Consequences and Remediation Techniques: A Review. Ecotoxicol. Environ. Saf. 2015, 112, 247–270. [Google Scholar] [CrossRef]
  2. Jain, C.K.; Singh, R.D. Technological Options for the Removal of Arsenic with Special Reference to South East Asia. J. Environ. Manag. 2012, 107, 1–18. [Google Scholar] [CrossRef] [PubMed]
  3. Stopelli, E.; Duyen, V.T.; Mai, T.T.; Trang, P.T.K.; Viet, P.H.; Lightfoot, A.; Kipfer, R.; Schneider, M.; Eiche, E.; Kontny, A.; et al. Spatial and Temporal Evolution of Groundwater Arsenic Contamination in the Red River Delta, Vietnam: Interplay of Mobilisation and Retardation Processes. Sci. Total Environ. 2020, 717, 137143. [Google Scholar] [CrossRef] [PubMed]
  4. Gong, G.; Mattevada, S.; O’Bryant, S.E. Comparison of the Accuracy of Kriging and IDW Interpolations in Estimating Groundwater Arsenic Concentrations in Texas. Environ. Res. 2014, 130, 59–69. [Google Scholar] [CrossRef] [PubMed]
  5. Bhowmick, S.; Pramanik, S.; Singh, P.; Mondal, P.; Chatterjee, D.; Nriagu, J. Arsenic in Groundwater of West Bengal, India: A Review of Human Health Risks and Assessment of Possible Intervention Options. Sci. Total Environ. 2018, 612, 148–169. [Google Scholar] [CrossRef]
  6. Hashim, M.A.; Kundu, A.; Mukherjee, S.; Ng, Y.S.; Mukhopadhyay, S.; Redzwan, G.; Sen Gupta, B. Arsenic Removal by Adsorption on Activated Carbon in a Rotating Packed Bed. J. Water Process Eng. 2019, 30, 100591. [Google Scholar] [CrossRef]
  7. Parga, J.R.; Cocke, D.L.; Valenzuela, J.L.; Gomes, J.A.; Kesmez, M.; Irwin, G.; Moreno, H.; Weir, M. Arsenic Removal via Electrocoagulation from Heavy Metal Contaminated Groundwater in La Comarca Lagunera México. J. Hazard. Mater. 2005, 124, 247–254. [Google Scholar] [CrossRef]
  8. Shaji, E.; Santosh, M.; Sarath, K.V.; Prakash, P.; Deepchand, V.; Divya, B.V. Arsenic Contamination of Groundwater: A Global Synopsis with Focus on the Indian Peninsula. Geosci. Front. 2021, 12, 101079. [Google Scholar] [CrossRef]
  9. Erdogan, H.; Yalçinkaya, Ö.; Türker, A.R. Determination of Inorganic Arsenic Species by Hydride Generation Atomic Absorption Spectrometry in Water Samples after Preconcentration/Separation on Nano ZrO2/B2O3 by Solid Phase Extraction. Desalination 2011, 280, 391–396. [Google Scholar] [CrossRef]
  10. Gautam, R.K.; Sharma, S.K.; Mahiya, S.; Chattopadhyaya, M.C. CHAPTER 1. Contamination of Heavy Metals in Aquatic Media: Transport, Toxicity and Technologies for Remediation. Heavy Met. Water 2014, 1–24. [Google Scholar] [CrossRef]
  11. Xu, Y.; Dai, Y.; Zhou, J.; Xu, Z.P.; Qian, G.; Lu, G.Q.M. Removal Efficiency of Arsenate and Phosphate from Aqueous Solution Using Layered Double Hydroxide Materials: Intercalation vs. Precipitation. J. Mater. Chem. 2010, 20, 4684–4691. [Google Scholar] [CrossRef]
  12. Hughes, M.F. Treatment of Arsenic Poisoning: Diagnosis with Biomarkers; Chakrabarty, N., Ed.; CRC Press: Boca Raton, FL, USA, 2015; Volume 7, ISBN 9781482241976. [Google Scholar]
  13. QA, M.; MS, K. Effect on Human Health Due to Drinking Water Contaminated with Heavy Metals. J. Pollut. Eff. Control 2016, 05, 10–11. [Google Scholar] [CrossRef]
  14. Lata, S.; Samadder, S.R. Removal of Arsenic from Water Using Nano Adsorbents and Challenges: A Review. J. Environ. Manag. 2016, 166, 387–406. [Google Scholar] [CrossRef] [PubMed]
  15. Kabir, F.; Chowdhury, S. Arsenic Removal Methods for Drinking Water in the Developing Countries: Technological Developments and Research Needs. Environ. Sci. Pollut. Res. 2017, 24, 24102–24120. [Google Scholar] [CrossRef] [PubMed]
  16. Çermikli, E.; Şen, F.; Altıok, E.; Wolska, J.; Cyganowski, P.; Kabay, N.; Bryjak, M.; Arda, M.; Yüksel, M. Performances of Novel Chelating Ion Exchange Resins for Boron and Arsenic Removal from Saline Geothermal Water Using Adsorption-Membrane Filtration Hybrid Process. Desalination 2020, 491, 114504. [Google Scholar] [CrossRef]
  17. Pessoa Lopes, M.; Galinha, C.F.; Crespo, J.G.; Velizarov, S. Optimisation of Arsenate Removal from Water by an Integrated Ion-Exchange Membrane Process Coupled with Fe Co-Precipitation. Sep. Purif. Technol. 2020, 246, 116894. [Google Scholar] [CrossRef]
  18. Abejón, A.; Garea, A.; Irabien, A. Arsenic Removal from Drinking Water by Reverse Osmosis: Minimization of Costs and Energy Consumption. Sep. Purif. Technol. 2015, 144, 46–53. [Google Scholar] [CrossRef]
  19. Ince, M.; Kaplan İnce, O. An Overview of Adsorption Technique for Heavy Metal Removal from Water/Wastewater: A Critical Review. Int. J. Pure Appl. Sci. 2017, 3, 10–19. [Google Scholar] [CrossRef]
  20. Gomes, J.A.; Rahman, M.S.; Das, K.; Varma, S.; Cocke, D. A Comparative Electrochemical Study on Arsenic Removal Using Iron, Aluminum, and Copper Electrodes. ECS Trans. 2010, 25, 59–68. [Google Scholar] [CrossRef]
  21. Harikishore Kumar Reddy, D.; Vijayaraghavan, K.; Kim, J.A.; Yun, Y.S. Valorisation of Post-Sorption Materials: Opportunities, Strategies, and Challenges. Adv. Colloid Interface Sci. 2017, 242, 35–58. [Google Scholar] [CrossRef]
  22. Siddiqui, S.I.; Chaudhry, S.A. Iron Oxide and Its Modified Forms as an Adsorbent for Arsenic Removal: A Comprehensive Recent Advancement. Process Saf. Environ. Prot. 2017, 111, 592–626. [Google Scholar] [CrossRef]
  23. La, D.D.; Nguyen, T.A.; Jones, L.A.; Bhosale, S.V. Graphene-Supported Spinel CuFe2O4 Composites: Novel Adsorbents for Arsenic Removal in Aqueous Media. Sensors 2017, 17, 1292. [Google Scholar] [CrossRef] [PubMed]
  24. Qasem, N.A.A.; Mohammed, R.H.; Lawal, D.U. Removal of Heavy Metal Ions from Wastewater: A Comprehensive and Critical Review. npj Clean Water 2021, 4, 36. [Google Scholar] [CrossRef]
  25. La, D.D.; Patwari, J.M.; Jones, L.A.; Antolasic, F.; Bhosale, S.V. Fabrication of a GNP/Fe-Mg Binary Oxide Composite for Effective Removal of Arsenic from Aqueous Solution. ACS Omega 2017, 2, 218–226. [Google Scholar] [CrossRef]
  26. Zhou, W.; Fu, H.; Pan, K.; Tian, C.; Qu, Y.; Lu, P.; Sun, C.C. Mesoporous TiO2/α-Fe2O3: Bifunctional Composites for Effective Elimination of Arsenite Contamination through Simultaneous Photocatalytic Oxidation and Adsorption. J. Phys. Chem. C 2008, 112, 19584–19589. [Google Scholar] [CrossRef]
  27. Ceballos-Chuc, M.C.; Ramos-Castillo, C.M.; Alvarado-Gil, J.J.; Oskam, G.; Rodríguez-Gattorno, G. Influence of Brookite Impurities on the Raman Spectrum of TiO2 Anatase Nanocrystals. J. Phys. Chem. C 2018, 122, 19921–19930. [Google Scholar] [CrossRef]
  28. Uddin, M.J.; Jeong, Y.K. Review: Efficiently Performing Periodic Elements with Modern Adsorption Technologies for Arsenic Removal. Environ. Sci. Pollut. Res. 2020, 27, 39888–39912. [Google Scholar] [CrossRef] [PubMed]
  29. Mayo, J.T.; Yavuz, C.; Yean, S.; Cong, L.; Shipley, H.; Yu, W.; Falkner, J.; Kan, A.; Tomson, M.; Colvin, V.L. The Effect of Nanocrystalline Magnetite Size on Arsenic Removal. Sci. Technol. Adv. Mater. 2007, 8, 71–75. [Google Scholar] [CrossRef]
  30. Yavuz, C.T.; Mayo, J.T.; Yu, W.W.; Prakash, A.; Falkner, J.C.; Yean, S.; Cong, L.; Shipley, H.J.; Kan, A.; Tomson, M.; et al. Low-Field Magnetic Separation of Monodisperse Fe3O4 Nanocrystals. Science 2006, 314, 964–967. [Google Scholar] [CrossRef]
  31. Cumbal, L.; Sengupta, A.K. Arsenic Removal Using Polymer-Supported Hydrated Iron(III) Oxide Nanoparticles: Role of Donnan Membrane Effect. Environ. Sci. Technol. 2005, 39, 6508–6515. [Google Scholar] [CrossRef]
  32. Bui, T.T.; Le, X.Q.; To, D.P.; Nguyen, V.T. Investigation of Typical Properties of Nanocrystalline Iron Powders Prepared by Ball Milling Techniques. Adv. Nat. Sci. Nanosci. Nanotechnol. 2013, 4, 045003. [Google Scholar] [CrossRef]
  33. Dar, M.I.; Shivashankar, S.A. Single Crystalline Magnetite, Maghemite, and Hematite Nanoparticles with Rich Coercivity. RSC Adv. 2014, 4, 4105–4113. [Google Scholar] [CrossRef]
  34. Grau-Crespo, R.; Al-Baitai, A.Y.; Saadoune, I.; De Leeuw, N.H. Vacancy Ordering and Electronic Structure of γ-Fe2O 3 (Maghemite): A Theoretical Investigation. J. Phys. Condens. Matter 2010, 22, 255401. [Google Scholar] [CrossRef] [PubMed]
  35. Miao, J.; Zhang, R.; Zhang, L. Photocatalytic Degradations of Three Dyes with Different Chemical Structures Using Ball-Milled TiO2. Mater. Res. Bull. 2018, 97, 109–114. [Google Scholar] [CrossRef]
  36. Kong, L.B.; Ma, J.; Huang, H.; Zhang, R.F. Effect of Excess PbO on Microstructure and Electrical Properties of PLZT7/60/40 Ceramics Derived from a High-Energy Ball Milling Process. J. Alloys Compd. 2002, 345, 238–245. [Google Scholar] [CrossRef]
  37. Ajinkya, N.; Yu, X.; Kaithal, P.; Luo, H.; Somani, P.; Ramakrishna, S. Magnetic Iron Oxide Nanoparticle (Ionp) Synthesis to Applications: Present and Future. Materials 2020, 13, 4644. [Google Scholar] [CrossRef]
  38. Han, Q.; Setchi, R.; Evans, S.L. Synthesis and Characterisation of Advanced Ball-Milled Al-Al2O3 Nanocomposites for Selective Laser Melting. Powder Technol. 2016, 297, 183–192. [Google Scholar] [CrossRef]
  39. Saravanan, R.; Gupta, V.K.; Prakash, T.; Narayanan, V.; Stephen, A. Synthesis, Characterization and Photocatalytic Activity of Novel Hg Doped ZnO Nanorods Prepared by Thermal Decomposition Method. J. Mol. Liq. 2013, 178, 88–93. [Google Scholar] [CrossRef]
  40. Hotze, E.M.; Phenrat, T.; Lowry, G.V. Nanoparticle Aggregation: Challenges to Understanding Transport and Reactivity in the Environment. J. Environ. Qual. 2010, 39, 1909–1924. [Google Scholar] [CrossRef]
  41. Hua, M.; Zhang, S.; Pan, B.; Zhang, W.; Lv, L.; Zhang, Q. Heavy Metal Removal from Water/Wastewater by Nanosized Metal Oxides: A Review. J. Hazard. Mater. 2012, 211–212, 317–331. [Google Scholar] [CrossRef]
  42. Castrillón Arango, J.A.; Cristóbal, A.A.; Ramos, C.P.; Bercoff, P.G.; Botta, P.M. Mechanochemical Synthesis and Characterization of Nanocrystalline Ni1-XCoxFe2O4 (0 ≤ x ≤ 1) Ferrites. J. Alloys Compd. 2019, 811, 152044. [Google Scholar] [CrossRef]
  43. Hu, J.; Geng, X.; Duan, Y.; Zhao, W.; Zhu, M.; Ren, S. Effect of Mechanical-Chemical Modification Process on Mercury Removal of Bromine Modified Fly Ash. Energy Fuels 2020, 34, 9829–9839. [Google Scholar] [CrossRef]
  44. Jiang, J.; Li, J. Mechanically Induced N-Arylation of Amines with Diaryliodonium Salts. ChemistrySelect 2020, 5, 542–548. [Google Scholar] [CrossRef]
  45. Do, J.L.; Friščić, T. Mechanochemistry: A Force of Synthesis. ACS Cent. Sci. 2017, 3, 13–19. [Google Scholar] [CrossRef]
  46. Babudurai, M.; Nwakanma, O.; Romero-Nuñez, A.; Manisekaran, R.; Subramaniam, V.; Castaneda, H.; Jantrania, A. Mechanical Activation of TiO2/Fe2O3 Nanocomposite for Arsenic Adsorption: Effect of Ball-to-Powder Ratio and Milling Time. J. Nanostruct. Chem. 2021, 11, 619–632. [Google Scholar] [CrossRef]
  47. Jilani, A.; Melaibari, A.A. MoS2-Cu/CuO@graphene Heterogeneous Photocatalysis for Enhanced Photocatalytic Degradation of MB from Water. Polymers 2022, 14, 3259. [Google Scholar] [CrossRef]
  48. Karthick, S.; Ríos-Ramírez, J.J.; Chakaravarthy, S.; Velumani, S. Electrical, Optical, and Topographical Properties of RF Magnetron Sputtered Aluminum-Doped Zinc Oxide (AZO) Thin Films Complemented by First-Principles Calculations. J. Mater. Sci. Mater. Electron. 2018, 29, 15383–15395. [Google Scholar] [CrossRef]
  49. Ohring, M. Mechanical Behavior of Solids. In Engineering Materials Science; Elsevier: Amsterdam, The Netherlands, 1995; p. 299. ISBN 978-0-12-524995-9. [Google Scholar]
  50. Morán, A.; Nwakanma, O.; Velumani, S.; Castaneda, H. Comparative Study of Optimised Molybdenum Back-Contact Deposition with Different Barriers (Ti, ZnO) on Stainless Steel Substrate for Flexible Solar Cell Application. J. Mater. Sci. Mater. Electron. 2020, 31, 7524–7538. [Google Scholar] [CrossRef]
  51. Makuła, P.; Pacia, M.; Macyk, W. How To Correctly Determine the Band Gap Energy of Modified Semiconductor Photocatalysts Based on UV-Vis Spectra. J. Phys. Chem. Lett. 2018, 9, 6814–6817. [Google Scholar] [CrossRef]
  52. Wei, X.; Zhu, G.; Fang, J.; Chen, J. Synthesis, Characterization, and Photocatalysis of Well-Dispersible Phase-Pure Anatase TiO2 Nanoparticles. Int. J. Photoenergy 2013, 2013, 726872. [Google Scholar] [CrossRef] [Green Version]
  53. Aliahmad, M.; Nasiri Moghaddam, N. Synthesis of Maghemite (γ-Fe2O3) Nanoparticles by Thermal-Decomposition of Magnetite (Fe3O4) Nanoparticles. Mater. Sci. Pol. 2013, 31, 264–268. [Google Scholar] [CrossRef]
  54. Mercyrani, B.; Hernandez-Maya, R.; Solís-López, M.; Th-Th, C.; Velumani, S. Photocatalytic Degradation of Orange G Using TiO2/Fe3O4 Nanocomposites. J. Mater. Sci. Mater. Electron. 2018, 29, 15436–15444. [Google Scholar] [CrossRef]
  55. Li, C.Y.; Wang, J.B.; Wang, Y.Q. Microstructure and Photocatalytic Activity of Titanium Dioxide Nanoparticles. Chin. Phys. B 2012, 21, 098102. [Google Scholar] [CrossRef]
  56. Danish, M.I.; Qazi, I.A.; Zeb, A.; Habib, A.; Awan, M.A.; Khan, Z. Arsenic Removal from Aqueous Solution Using Pure and Metal-Doped Titania Nanoparticles Coated on Glass Beads: Adsorption and Column Studies. J. Nanomater. 2013, 2013, 69. [Google Scholar] [CrossRef]
  57. Mohan, D.; Pittman, C.U. Arsenic Removal from Water/Wastewater Using Adsorbents-A Critical Review. J. Hazard. Mater. 2007, 142, 1–53. [Google Scholar] [CrossRef]
  58. Awual, M.R.; Shenashen, M.A.; Yaita, T.; Shiwaku, H.; Jyo, A. Efficient Arsenic(V) Removal from Water by Ligand Exchange Fibrous Adsorbent. Water Res. 2012, 46, 5541–5550. [Google Scholar] [CrossRef]
  59. Solano, R.A.; Herrera, A.P.; Maestre, D.; Cremades, A. Fe-TiO2 Nanoparticles Synthesized by Green Chemistry for Potential Application in Waste Water Photocatalytic Treatment. J. Nanotechnol. 2019, 2019, 4571848. [Google Scholar] [CrossRef]
  60. Guirado-López, R.A.; Aguilera-Granja, F. Bimetallic Fe-Ni Cluster Alloys: Stability of Core(Fe)-Shell(Ni) Arrays and Their Role Played in the Structure and Magnetic Behavior. J. Phys. Chem. C 2008, 112, 6729–6739. [Google Scholar] [CrossRef]
  61. Maaz, K.; Mumtaz, A.; Hasanain, S.K.; Ceylan, A. Synthesis and Magnetic Properties of Cobalt Ferrite (CoFe2O4) Nanoparticles Prepared by Wet Chemical Route. J. Magn. Magn. Mater. 2007, 308, 289–295. [Google Scholar] [CrossRef]
  62. Coey, J.M.D. Noncollinear Spin Arrangement in Ultrafine Ferrimagnetic Crystallites. Phys. Rev. Lett. 1971, 27, 1140–1142. [Google Scholar] [CrossRef] [Green Version]
  63. Peddis, D.; Cannas, C.; Musinu, A.; Ardu, A.; Orruì, F.; Fiorani, D.; Laureti, S.; Rinaldi, D.; Muscas, G.; Concas, G.; et al. Beyond the Effect of Particle Size: Influence of CoFe2O4 Nanoparticle Arrangements on Magnetic Properties. Chem. Mater. 2013, 25, 2005–2013. [Google Scholar] [CrossRef]
  64. Blanco-Mantecón, M.; O’Grady, K. Interaction and Size Effects in Magnetic Nanoparticles. J. Magn. Magn. Mater. 2006, 296, 124–133. [Google Scholar] [CrossRef]
  65. Akdogan, O.; Li, W.; Balasubramanian, B.; Sellmyer, D.J.; Hadjipanayis, G.C. Effect of Exchange Interactions on the Coercivity of SmCo5 Nanoparticles Made by Cluster Beam Deposition. Adv. Funct. Mater. 2013, 23, 3262–3267. [Google Scholar] [CrossRef]
  66. Torres-Martínez, N.E.; Garza-Navarro, M.A.; Lucio-Porto, R.; García-Gutiérrez, D.; Torres-Castro, A.; González-González, V.A. One-Pot Synthesis of Magnetic Hybrid Materials Based on Ovoid-like Carboxymethyl-Cellulose/Cetyltrimethylammonium-Bromide Templates. Mater. Chem. Phys. 2013, 141, 735–743. [Google Scholar] [CrossRef]
  67. Ray, P.Z.; Shipley, H.J. Inorganic Nano-Adsorbents for the Removal of Heavy Metals and Arsenic: A Review. RSC Adv. 2015, 5, 29885–29907. [Google Scholar] [CrossRef]
  68. Kütahyali, C.; Şert, S.; Çetinkaya, B.; Inan, S.; Eral, M. Factors Affecting Lanthanum and Cerium Biosorption on Pinus Brutia Leaf Powder. Sep. Sci. Technol. 2010, 45, 1456–1462. [Google Scholar] [CrossRef]
  69. Esposito, A.; Pagnanelli, F.; Lodi, A.; Solisio, C.; Vegliò, F. Biosorption of Heavy Metals by Sphaerotilus Natans: An Equilibrium Study at Different PH and Biomass Concentrations. Hydrometallurgy 2001, 60, 129–141. [Google Scholar] [CrossRef]
  70. Das, N.; Das, D. Recovery of Rare Earth Metals through Biosorption: An Overview. J. Rare Earths 2013, 31, 933–943. [Google Scholar] [CrossRef]
  71. Xie, J.; Lin, Y.; Li, C.; Wu, D.; Kong, H. Removal and Recovery of Phosphate from Water by Activated Aluminum Oxide and Lanthanum Oxide. Powder Technol. 2015, 269, 351–357. [Google Scholar] [CrossRef]
  72. Torab-Mostaedi, M.; Asadollahzadeh, M.; Hemmati, A.; Khosravi, A. Biosorption of Lanthanum and Cerium from Aqueous Solutions by Grapefruit Peel: Equilibrium, Kinetic and Thermodynamic Studies. Res. Chem. Intermed. 2015, 41, 559–573. [Google Scholar] [CrossRef]
  73. Iftekhar, S.; Ramasamy, D.L.; Srivastava, V.; Asif, M.B.; Sillanpää, M. Understanding the Factors Affecting the Adsorption of Lanthanum Using Different Adsorbents: A Critical Review. Chemosphere 2018, 204, 413–430. [Google Scholar] [CrossRef] [PubMed]
  74. Sinha, D.; Prasad, P. Health Effects Inflicted by Chronic Low-Level Arsenic Contamination in Groundwater: A Global Public Health Challenge. J. Appl. Toxicol. 2020, 40, 87–131. [Google Scholar] [CrossRef] [PubMed]
  75. Srivastava, V.; Sharma, Y.C.; Sillanpää, M. Green Synthesis of Magnesium Oxide Nanoflower and Its Application for the Removal of Divalent Metallic Species from Synthetic Wastewater. Ceram. Int. 2015, 41, 6702–6709. [Google Scholar] [CrossRef]
  76. El-Latif, M.M.A.; Ibrahim, A.M.; Showman, M.S.; Hamide, R.R.A. Alumina/Iron Oxide Nano Composite for Cadmium Ions Removal from Aqueous Solutions. Int. J. Nonferrous Metall. 2013, 2, 47–62. [Google Scholar] [CrossRef]
  77. Mondal, P.; Majumder, C.B.; Mohanty, B. Effects of Adsorbent Dose, Its Particle Size and Initial Arsenic Concentration on the Removal of Arsenic, Iron and Manganese from Simulated Ground Water by Fe3+ Impregnated Activated Carbon. J. Hazard. Mater. 2008, 150, 695–702. [Google Scholar] [CrossRef] [PubMed]
  78. Cornell, R.M.; Schwertmann, U. Colour Plates. In The Iron Oxides; Wiley: Hoboken, NJ, USA, 2003; ISBN 3527302743. [Google Scholar]
  79. Ali, S.; Rizwan, M.; Shakoor, M.B.; Jilani, A.; Anjum, R. High Sorption Efficiency for As(III) and As(V) from Aqueous Solutions Using Novel Almond Shell Biochar. Chemosphere 2020, 243, 125330. [Google Scholar] [CrossRef] [PubMed]
  80. Akram, A.; Muzammal, S.; Shakoor, M.B.; Ahmad, S.R.; Jilani, A.; Iqbal, J.; Al-Sehemi, A.G.; Kalam, A.; Aboushoushah, S.F.O. Synthesis and Application of Egg Shell Biochar for As(V) Removal from Aqueous Solutions. Catalysts 2022, 12, 431. [Google Scholar] [CrossRef]
  81. Lin, S.; Jin, J.; Sun, S.; Yu, J. Removal of Arsenic Contaminants Using a Novel Porous Nanoadsorbent with Superior Magnetic Recovery. Chem. Eng. Sci. X 2020, 8, 100069. [Google Scholar] [CrossRef]
  82. Chaudhry, S.A.; Ahmed, M.; Siddiqui, S.I.; Ahmed, S. Fe(III)–Sn(IV) Mixed Binary Oxide-Coated Sand Preparation and Its Use for the Removal of As(III) and As(V) from Water: Application of Isotherm, Kinetic and Thermodynamics. J. Mol. Liq. 2016, 224, 431–441. [Google Scholar] [CrossRef]
  83. Basu, T.; Ghosh, U.C. Influence of Groundwater Occurring Ions on the Kinetics of As(III) Adsorption Reaction with Synthetic Nanostructured Fe(III)-Cr(III) Mixed Oxide. Desalination 2011, 266, 25–32. [Google Scholar] [CrossRef]
  84. Zhang, G.; Ren, Z.; Zhang, X.; Chen, J. Nanostructured Iron(III)-Copper(II) Binary Oxide: A Novel Adsorbent for Enhanced Arsenic Removal from Aqueous Solutions. Water Res. 2013, 47, 4022–4031. [Google Scholar] [CrossRef] [PubMed]
  85. Zhang, C.; Shan, C.; Jin, Y.; Tong, M. Enhanced Removal of Trace Arsenate by Magnetic Nanoparticles Modified with Arginine and Lysine. Chem. Eng. J. 2014, 254, 340–348. [Google Scholar] [CrossRef]
  86. Beduk, F. Superparamagnetic Nanomaterial Fe3O4-TiO2 for the Removal of As(V) and As(III) from Aqueous Solutions. Environ. Technol. 2016, 37, 1790–1801. [Google Scholar] [CrossRef] [PubMed]
  87. Wei, Z.; Liang, K.; Wu, Y.; Zou, Y.; Zuo, J.; Arriagada, D.C.; Pan, Z.; Hu, G. The Effect of PH on the Adsorption of Arsenic(III) and Arsenic(V) at the TiO2 Anatase [101] Surface. J. Colloid Interface Sci. 2016, 462, 252–259. [Google Scholar] [CrossRef]
  88. Babu, C.M.; Vinodh, R.; Sundaravel, B.; Abidov, A.; Peng, M.M.; Cha, W.S.; Jang, H.T. Characterization of Reduced Graphene Oxide Supported Mesoporous Fe2O3/TiO2 Nanoparticles and Adsorption of As(III) and As(V) from Potable Water. J. Taiwan Inst. Chem. Eng. 2016, 62, 199–208. [Google Scholar] [CrossRef]
  89. Monárrez-Cordero, B.E.; Amézaga-Madrid, P.; Leyva-Porras, C.C.; Pizá-Ruiz, P.; Miki-Yoshida, M. Study of the Adsorption of Arsenic (III and V) by Magnetite Nanoparticles Synthetized via AACVD. Mater. Res. 2016, 19, 103–112. [Google Scholar] [CrossRef]
  90. Hernández-Flores, H.; Pariona, N.; Herrera-Trejo, M.; Hdz-García, H.M.; Mtz-Enriquez, A.I. Concrete/Maghemite Nanocomposites as Novel Adsorbents for Arsenic Removal. J. Mol. Struct. 2018, 1171, 9–16. [Google Scholar] [CrossRef]
  91. Sherlala, A.I.A.; Raman, A.A.A.; Bello, M.M.; Buthiyappan, A. Adsorption of Arsenic Using Chitosan Magnetic Graphene Oxide Nanocomposite. J. Environ. Manag. 2019, 246, 547–556. [Google Scholar] [CrossRef] [PubMed]
  92. Choi, J.S.; Lingamdinne, L.P.; Yang, J.K.; Chang, Y.Y.; Koduru, J.R. Fabrication of Chitosan/Graphene Oxide-Gadolinium Nanorods as a Novel Nanocomposite for Arsenic Removal from Aqueous Solutions. J. Mol. Liq. 2020, 320, 114410. [Google Scholar] [CrossRef]
  93. Liu, H.; Li, P.; Qiu, F.; Zhang, T.; Xu, J. Controllable Preparation of FeOOH/CuO@WBC Composite Based on Water Bamboo Cellulose Applied for Enhanced Arsenic Removal. Food Bioprod. Process. 2020, 123, 177–187. [Google Scholar] [CrossRef]
Scheme 1. Graphical illustration represents the objective of the designed work.
Solids 03 00035 sch001
Figure 1. X-ray diffractograms of T/M nanocomposites at different ratios of 1/9, 3/7, 5/5, 7/3, and 9/1.
Solids 03 00035 g001
Figure 2. Micrographs obtained from the HRTEM image analysis for the various T/M NCs ratios; (a) 1/9, (b) 3/7, (c) 5/5, (d) 7/3, and (e) 9/1, respectively.
Solids 03 00035 g002
Figure 3. Particle size distribution from the HRTEM image using a log-normal function for average size estimations for the various T/M NCs ratios; (a) 1/9, (b) 3/7, (c) 5/5, (d) 7/3, and (e) 9/1, respectively.
Solids 03 00035 g003
Figure 4. HRTEM micrograph of T/M (5/5) NC fringes corresponding to the inter-planar spacing.
Solids 03 00035 g004
Figure 5. Bandgap estimations for the different T/M NCs ratios (1/9, 3/7, 5/5, 7/3, and 9/1).
Solids 03 00035 g005
Figure 6. Magnetization field-dependent M (H) curves measured for samples: (a) γ-Fe2O3; (b) 1/9; (c) 3/7; (d) 5/5; (e) 7/3; and (f) 9/1.
Solids 03 00035 g006
Figure 7. Magnetization temperature-dependent ZFC (black circles) and FC (white circles) curves measured for samples: (a) γ-Fe2O3; (b) 1/9; (c) 3/7; (d) 5/5; (e) 7/3; and (f) 9/1.
Solids 03 00035 g007
Figure 8. (a) As (III) and (b) As (V) removal in percentage and ppm concentration, using a constant 0.5 g/L dosage, pH 7, and 2 ppm concentration for 5 min for various T/M NCs ratios.
Solids 03 00035 g008
Figure 9. (a) As (III) and (b) As (V) removal for various dosages in percentage and ppm concentrations, using a 5/5 T/M NC ratio and pH 7 for 5 min.
Solids 03 00035 g009
Figure 10. Effects of adsorption time for (a) As (III) and (b) As (V) removal at pH 7 and 2 ppm using an optimized 8 g/L concentration of 5/5 T/M NC ratio.
Solids 03 00035 g010
Figure 11. Effects of different adsorption concentrations on (a) As (III) and (b) As (V) removal.
Solids 03 00035 g011
Figure 12. pH studies using the optimized 8 g/L dosages at a constant 15 min duration and 2 ppm (a) As (III) and (b) As (V) concentration.
Solids 03 00035 g012
Table 1. Optimization conditions adopted for this study.
S.noAdsorption
Parameters
Experimental
Conditions
Description
1Initial study
(T/M NCs ratios:
1/9, 3/7, 5/5, 7/3, and 9/1)
As (III) and As (V)—2 ppm
Dose—0.5 g/L
pH—7
Time—5 min
Studies on the
optimization of
the complete removal
of arsenic using
the best ratio.
2Effect of
Dosage
Dose = 0.5, 2, 4, 6, and 8 g/L
pH—7
Time—5 min
As (III) and As (V)—2 ppm
3Effect of
time
Time = 5, 15, 30, and 60 min
Dose—8 g/L
pH—7
As (III) and As (V)—2 ppm
4Effect of
concentration
Concentration = 2, 4, and 6 ppm
Dose—8 g/L
pH—7
Time—15 min
5Effect of
pH
pH = 4, 7, and 10
Dose—8 g/L
Time—15 min
As (III) and As (V)—2 ppm
Table 2. The calculated crystallite parameters from XRD studies for the different ratios.
T/M NC
Ratios
2θ (Degrees)Average
Dp (nm)
I(101)/I(311)
TiO2Fe2O3
9/125.3435.69136.94
7/325.3435.57142.46
5/525.3835.67131.42
3/725.435.73120.95
1/925.4635.67100.76
Table 3. The average elemental compositions of different T/M NC ratios.
Ratios (T/M NCs)Ti (%)Fe (%)
9/190.79.30
7/367.033.0
5/547.252.8
3/729.470.6
1/98.791.3
Table 4. Compiled and compared table of average crystallite, particle sizes, and bandgap of T/M NCs.
Ratios
(T/M NCs)
Av. Crystallite Size (nm)Av. Particle Size (nm)Bandgap (eV)
9/113192.80
7/314202.26
5/513172.15
3/712152.11
1/910152.00
Table 5. Magnetic characteristics were obtained at 1.8 K for γ-Fe2O3 and NC samples.
SampleMmax
(emu/g)
HC
(kOe)
MR (emu/g)RR = MR/Mmax (Unitless)
γ-Fe2O391.890.2720.350.22
1/966.720.3315.920.24
3/761.710.3216.640.27
5/570.640.4123.180.33
7/356.360.3517.620.31
9/182.970.2815.630.19
Table 6. Comparison of As removal percentage with some adsorbing nanomaterials and their synthesis methodology.
AdsorbentsSynthesis MethodAs RemovalReference
GO-Fe2O3/TiO2Sol-gelAs (III) and (V)~92%[88]
GNPs/CuFe2O4One-pot hydrothermalAs (V)~98%[23]
TiO2HydrothermalAs (III) and (V)~70%[87]
Fe3O4AACVDAs (III)~88%
As (V)~100%
[89]
GNPs/Fe−MgOne-pot hydrothermalAs (V)~98%[25]
Concrete/γ-Fe2O3Simple mixingAs(V) 10 ppm to 10 ppb [90]
CS magnetic GOCo-precipitationAs (III)~61%[91]
CS/GO-GdCo-precipitation hydrothermalAs (V)~99%[92]
FeOOH/CuO@WBCTwo-step hydrothermalAs (III)~75%[93]
Fe3O4–TiO2Co-precipitationAs (III)~93%
As (V)~94%
[86]
TiO2/Fe2O3Ball-millingAs (III) and
(V) > 99%
This work *
* GO—graphene oxide, TiO2—titanium oxide, Fe2O3—hematite, Fe3O4—magnetite, γ-Fe2O3—maghemite, GNPs—gold nanoparticles, CuFe2O4—copper iron-oxide, Mg—magnesium, Gd—gadolinium, FeOOH—iron oxyhydroxide, CuO—copper oxide, WBC—water bamboo cellulose, CS—Chitosan, and AACVD—Aerosol-assisted chemical vapor deposition.
Publisher’s Note: MDPI stays neutral with regard to jurisdictional claims in published maps and institutional affiliations.

