Article

Biogenic Hydrogen Sulfide Production Using Elemental Sulfur and Low-Cost Organic Substrates to Remove Metal Ions from Mining Effluents

Departamento de Bioquímica y Biología Molecular, Facultad de Ciencias Químicas y Farmacéuticas, Universidad de Chile, Santiago 8380000, Chile
*
Author to whom correspondence should be addressed.
Mining 2023, 3(2), 241-260; https://doi.org/10.3390/mining3020015
Submission received: 12 March 2023 / Revised: 2 April 2023 / Accepted: 24 April 2023 / Published: 26 April 2023

Abstract

:
One of the best technologies available for metal removal from mining effluents is the precipitation of metals as sulfides. However, the high cost and difficulty in managing reagents limit its widespread application. Recent literature suggests the use of sulfur-reducing bacteria (S°RB) as a safe and effective alternative to producing H2S. Nevertheless, direct substrates for S°RB are high-cost low molecular compounds. This research aimed to evaluate the ability to produce sulfides by sulfur-reducing consortia in fixed-bed bioreactors using complex organic substrates. Consortia enriched using cellulose or Spirulina as electron donors were phylogenetically characterized by fluorescent in situ hybridization. Microorganisms belonging to Bacteria and Archaea were involved, being the most representative of the δ-Proteobacterias. The results obtained in test tube culture indicated that these consortia could use cellulose and Spirulina in alkaline conditions, resulting in high sulfide production. Upflowed fixed-bed bioreactors were implemented to establish optimal parameters., resulting in H2S volumetric productivities ranging from 1.94 to 2.94 mol/m3∙day. In conclusion, an active biomass with significant sulfidogenic activity can be generated in bioreactors under an upflowed regime using cellulose or Spirulina.

1. Introduction

Surface and groundwater sources are exposed to many contamination threats. It is for this reason that industrial and agricultural activity has as its main challenge the integral management of wastewater generated in its processes [1,2]. The composition of the residual liquids varies depending on the type of manufacturing and processes conducted. One of the main problems of industrial wastewater is its high concentration of heavy metals in effluents. Unlike organic contaminants, heavy metals are non-biodegradable and tend to accumulate in living organisms, with many heavy metal ions known to be toxic or carcinogenic. Examples of these heavy metals include zinc, copper, nickel, mercury, cadmium, lead and chromium.
Various methods and technologies are being used to remove heavy metal ions, including chemical precipitation, ion exchange, adsorption, membrane filtration, electrochemical treatment technologies, and more [3,4,5]. Among the most important and established methods for removing metals in polluted waters is the precipitation of metals in the form of sulfides, being an effective method for extracting and enriching metals from contaminated effluents [3,6]. The solubility of the metal sulfide precipitates is lower than hydroxide precipitates. An example of this is the theoretical metal ion solubilities (mg/L) for Cd, Co and Cu as sulfide are 6.7 × 10⁻¹⁰, 1.0 × 10⁻⁸ and 5.8 × 10⁻¹³, respectively, while as hydroxide are 2.3 × 10⁻⁵, 2.2 × 10⁻¹ and 2.2 × 10⁻², respectively [7]. Therefore, sulfide precipitation has a great advantage, as it can achieve a high degree of metal removal over a broad pH range compared with hydroxide precipitation. Additionally, metal sulfide sludge exhibits better thickening and dewatering characteristics than the corresponding metal hydroxide sludge [3].
However, the hazards and costs associated with the transport, handling and storage of sulfides, such as Na2S, NaSH, CaS, FeS and H2S, have prevented its widespread use [8]. Because of these limitations, the search for alternatives has led to the use of microorganisms to generate these sulfur species. This has been facilitated by advances in our understanding of their role in biogeochemical cycles [5,9,10,11,12]. Special attention has been given to the development and optimization of microbial processes that separate valuable metals like metal sulfides from contaminated effluents. In this area, sulfate and sulfur-reducing bacteria (SRB and S°RB, respectively) can play a critical role in these processes due to their ability to reduce sulfur compounds to produce hydrogen sulfide as metabolic waste [13]. They can be used to precipitate heavy metals in the form of metal sulfides [1,5,8] and play a crucial role in the final degradation of organic matter (electron donors) in anoxic environments [14]. In the last decade, several bioprocesses based on the use of S°RB for the treatment and recovery of heavy metals have been developed [15,16,17,18]. However, there are few publications on the production of sulfides using S°RB, with the main disadvantage being the insufficient content of carbon sources in domestic sewages to maintain a high H2S production rate in the sulfidogenic bioreactor [8,16,17,18]. Since S°RB are the main group in reducing elemental sulfur and the final oxidation of organic macromolecules requires the participation of a complex anaerobic microbial consortium, the selection of an appropriate configuration and operation of a robust system for the start-up of an effective sulfidogenic bioprocess becomes critical.
This study evaluated the efficacy of hydrogen sulfide formation by a sulfur-reducing microbial consortium during the operation of fixed bed columns using complex substrates. The results obtained can be useful in generating an efficient technology for the treatment of polluted industrial waters, using alternatives, non-traditional and lower-cost carbon sources, such as cellulose (a model substrate of vegetable waste) and Spirulina (easily cultured cyanobacteria) for the metal removal and recovery from contaminated effluents.

2. Materials and Methods

2.1. Microbial Consortium

The microbial consortium used in this study was obtained from an environmental sample with sulfurogenic activity (saline lake). The consortium was initially enriched using a modified Postgate C medium [19]. The medium consisted of K2HPO4 (0.5 g/L), NH4Cl (1.0 g/L), CaCl2 × 6H2O (0.1 g/L), MgCl2 (2.0 g/L), NaCl (30.0–70.0 g/L, depending on the operating conditions of the bioreactor), yeast extract (0.5 g/L), FeCl3 × 6H2O (0.5 g/L), and sulfur (S°) (1.0 g/L). The carbon sources used to grow the consortium were cellulose (microcrystalline cellulose Sigmacell purchased from Sigma-Aldrich (Sigma-Aldrich, St. Louis, MS, USA)) (40 g/L) or Spirulina (purchased from General Nutrition Centers, Pittsburgh, PA, USA) (3 g/L) in 0.25, 0.50, 0.75 and 1.00 g substrate/g sulfur ratios. All cultures were incubated at 28 °C.

2.2. Bioreactors

The bioreactors used consisted of one glass column with a useful volume of 500 cm3 (49 cm high and 3.6 cm diameter) and one Teflon column with a useful volume of 410 cm3 (49 cm high and 3.3 cm diameter). In two experiments, the bioreactors were packed with Celite R-635 (Celite Corp. Lompoc, CA, USA) as a support material. Celite R-635 is a thermally and chemically stable cylindrical pellet of diatomaceous earth (6.35 × 12.7 mm, pore diameter of approximately 20 μm).

2.3. Characterization of Microbial Consortia by Fluorescence In Situ Hybridization

Fluorescence in situ hybridizations (FISH) was used to characterize the different microbial. Various probes were utilized for FISH, as detailed in Table 1 [20]. The procedure commenced with the collection of 100 μL of culture, which was then resuspended in 900 μL of PBS, centrifuged for 5 min at 13,400× g, and the supernatant was discarded. The pellet was subsequently resuspended in 900 μL of PBS and then centrifuged for 3 min at 2062× g. 50 μL of supernatant was deposited onto a slide to fix the sample with heat. Following fixation, 20 μL of formaldehyde (37%) was added, and the sample was allowed to stand for 20 min. Subsequently, 50 μL of hybridization solution was added to each sample (according to Table 2), containing 20 ng of probe (Table 1). The slides with the samples were then incubated for 90 min at 45 °C, then washed with the respective wash solution for 30 min at 45 °C (Table 3). After washing, the slides with the fixed samples were allowed to dry at room temperature. They were then stained with 20 μL of 4′,6-diamidino-2-phenylindole (DAPI) (50 μg/mL) for 10 min, after which the excess DAPI was rinsed with distilled water to remove the excess DAPI. Finally, the samples were observed in a Zeiss Axioskop epifluorescence microscope, equipped with a Zeiss #20 filter for CY3-labeled probe and a Zeiss #09 filter for DAPI-labeled bacteria. Samples were photographed using a Canon PowerShot sx110 IS camera and captured with Remote Capture v.3.0.1.8 software. The images were analyzed using ImageJ software [21] to count labeled microorganisms with the respective probe versus total microorganisms labeled with DAPI.

2.4. Culture Media

To grow the microbial consortium, test tubes (20 mL) were used, containing 10 mL of modified Postgate C medium [19] supplemented with either cellulose or Spirulina as electron donors. The pH of the medium was adjusted between 5.5 and 10.0, depending on the specific experiment. Anaerobic conditions were established by covering the medium with sterile paraffin oil, and 0.1 g/L of thioglycolic acid (0.1 g/L) was added as a reducing agent. The culture media were inoculated with 200 µL of the preculture and were kept at 28 °C. Culture times are indicated in the Figures.

2.5. Batch Cultures

Batch cultures were carried out in capped 300 mL bottles filled with modified Postgate C medium to inoculate the bioreactors. The bottles were inoculated with 20 mL of precultures, and thioglycolic acid (0.1 g/L) was added. To minimize oxygenation, the bottles were filled to the top with medium and incubated at 28 °C. Culture times are indicated in the Figures.

2.6. System Setup and Operation

Three fixed-bed bioreactors were constructed as columns (Table 4, Figure 1). Each column had two lower and two upper inlets, which were filled with the support material, culture medium, and an electron donor and autoclaved at 110 °C for 30 min. The bioreactors were inoculated with 100 mL of precultures from the bottles and sealed to maintain anaerobic conditions. Thioglycolic acid (0.1 g/L) was added to enhance the anaerobiosis. The bioreactors were pumped (Masterflex Group, Gelsenkirchen, Germany) with fresh medium to obtain a chemical oxygen demand/S° ratio of 1.0 through one of the lower inputs while the effluent was removed from one of the upper outlets. The remaining two inputs (upper and lower) were used to maintain an upward recirculation. Tygon Tubing L/S 14 (Cole-Parmer, Vernon Hills, IL, USA) with low gas permeability was employed. The bioreactors were maintained at 28 °C. Operation times are indicated in the figures.

2.7. Determination of Hydrogen Sulfide in Culture Media

The determination of hydrogen sulfide (H2S) in the culture media was based on the production of methylene blue production by reacting H2S with N,N-dimethyl-1,4-phenylenediamine oxalate and FeCl3. To quantify H2S, 5 mL of the sample was taken, to which 500 μL of a solution of N, N-dimethyl-1,4-phenylenediamine oxalate (6.75 g/L) and 150 μL of FeCl3 (1500 g/L) were added. After 5 min, (NH4)2HPO4 (500 g/L) was added to eliminate the interference of excess iron (III) chloride. Finally, the absorbance was measured at 664 nm (using a spectrophotometer Jenway 6320D, United Kingdom). All quantitative measurements were made in the culture medium without iron to determine the total sulfide produced by the cultures [22].

2.8. Quantification of Chemical Oxygen Demand

The quantification of chemical oxygen demand (COD) was performed using the HI 93754A-25 LR COD kit from Hanna, which is based on the procedure outlined in Standard Methods for the Examination of Water & Wastewater, 1997. Organic matter was oxidized with K2Cr2O7 in an H2SO4 medium. In this case, the sample was diluted at least 40 times, and 2 mL of the diluted sample was mixed with the tubes supplied for the kit, then heated for 2 h at 150 °C. The tubes were cooled to room temperature, and the COD concentration was determined by colorimetry in a photometer at 420 nm (using a multiparameter photometer Bench C99 model from Hanna, Italy) [22].

2.9. Determination of the Grow Capacity of the Microbial Consortium in Bioreactors

The capacity of the microbial consortium to grow in three bioreactors was evaluated. Bioreactor R1 contained 200 g of Celite ™ R-635. Bioreactor R2 contained no carrier material. The added Spirulina acted as a support material for the microorganisms added. Bioreactor R3 contained 200 g of Celite™ R-635 as biomass immobilization material. The three bioreactors contained a modified Postgate C culture medium with 1 g/L of each substrate (as detailed in Table 4). They were kept in batches during the first stage and then fed semi-continuously for the total operation time. Once the H2S concentration was stabilized, the operational conditions were changed to obtain better H2S volumetric productivity, as detailed in Table 5, Table 6 and Table 7. The dissolved sulfide levels (blue methylene method) and pH were determined daily.

2.10. Analysis of Data

All analytical measurements were conducted in triplicate, unless otherwise indicated. The data were subjected to statistical analysis using the Infostat v.2011e software. Analysis of variance (ANOVA) was employed to determine the presence of significant differences, with a significance level of 95% (p < 0.05).

2.11. Operation Parameters

Hydraulic retention time (HRT), feed flow, and organic loading rate were calculated using the following equations:
HRT = V r Q l = Hydraulic   retention   time   h F f = rpm × 13 60 = Feeding   Flow   mL / min Q r = Q l   ×   COD f V r = Organic   loading   rate   g   DQO / L × h
where:
Vr = reactor volume (L)
Ql = volumetric flow (mL/min)
CODf = chemical oxygen demand in feed (g/L)

3. Results

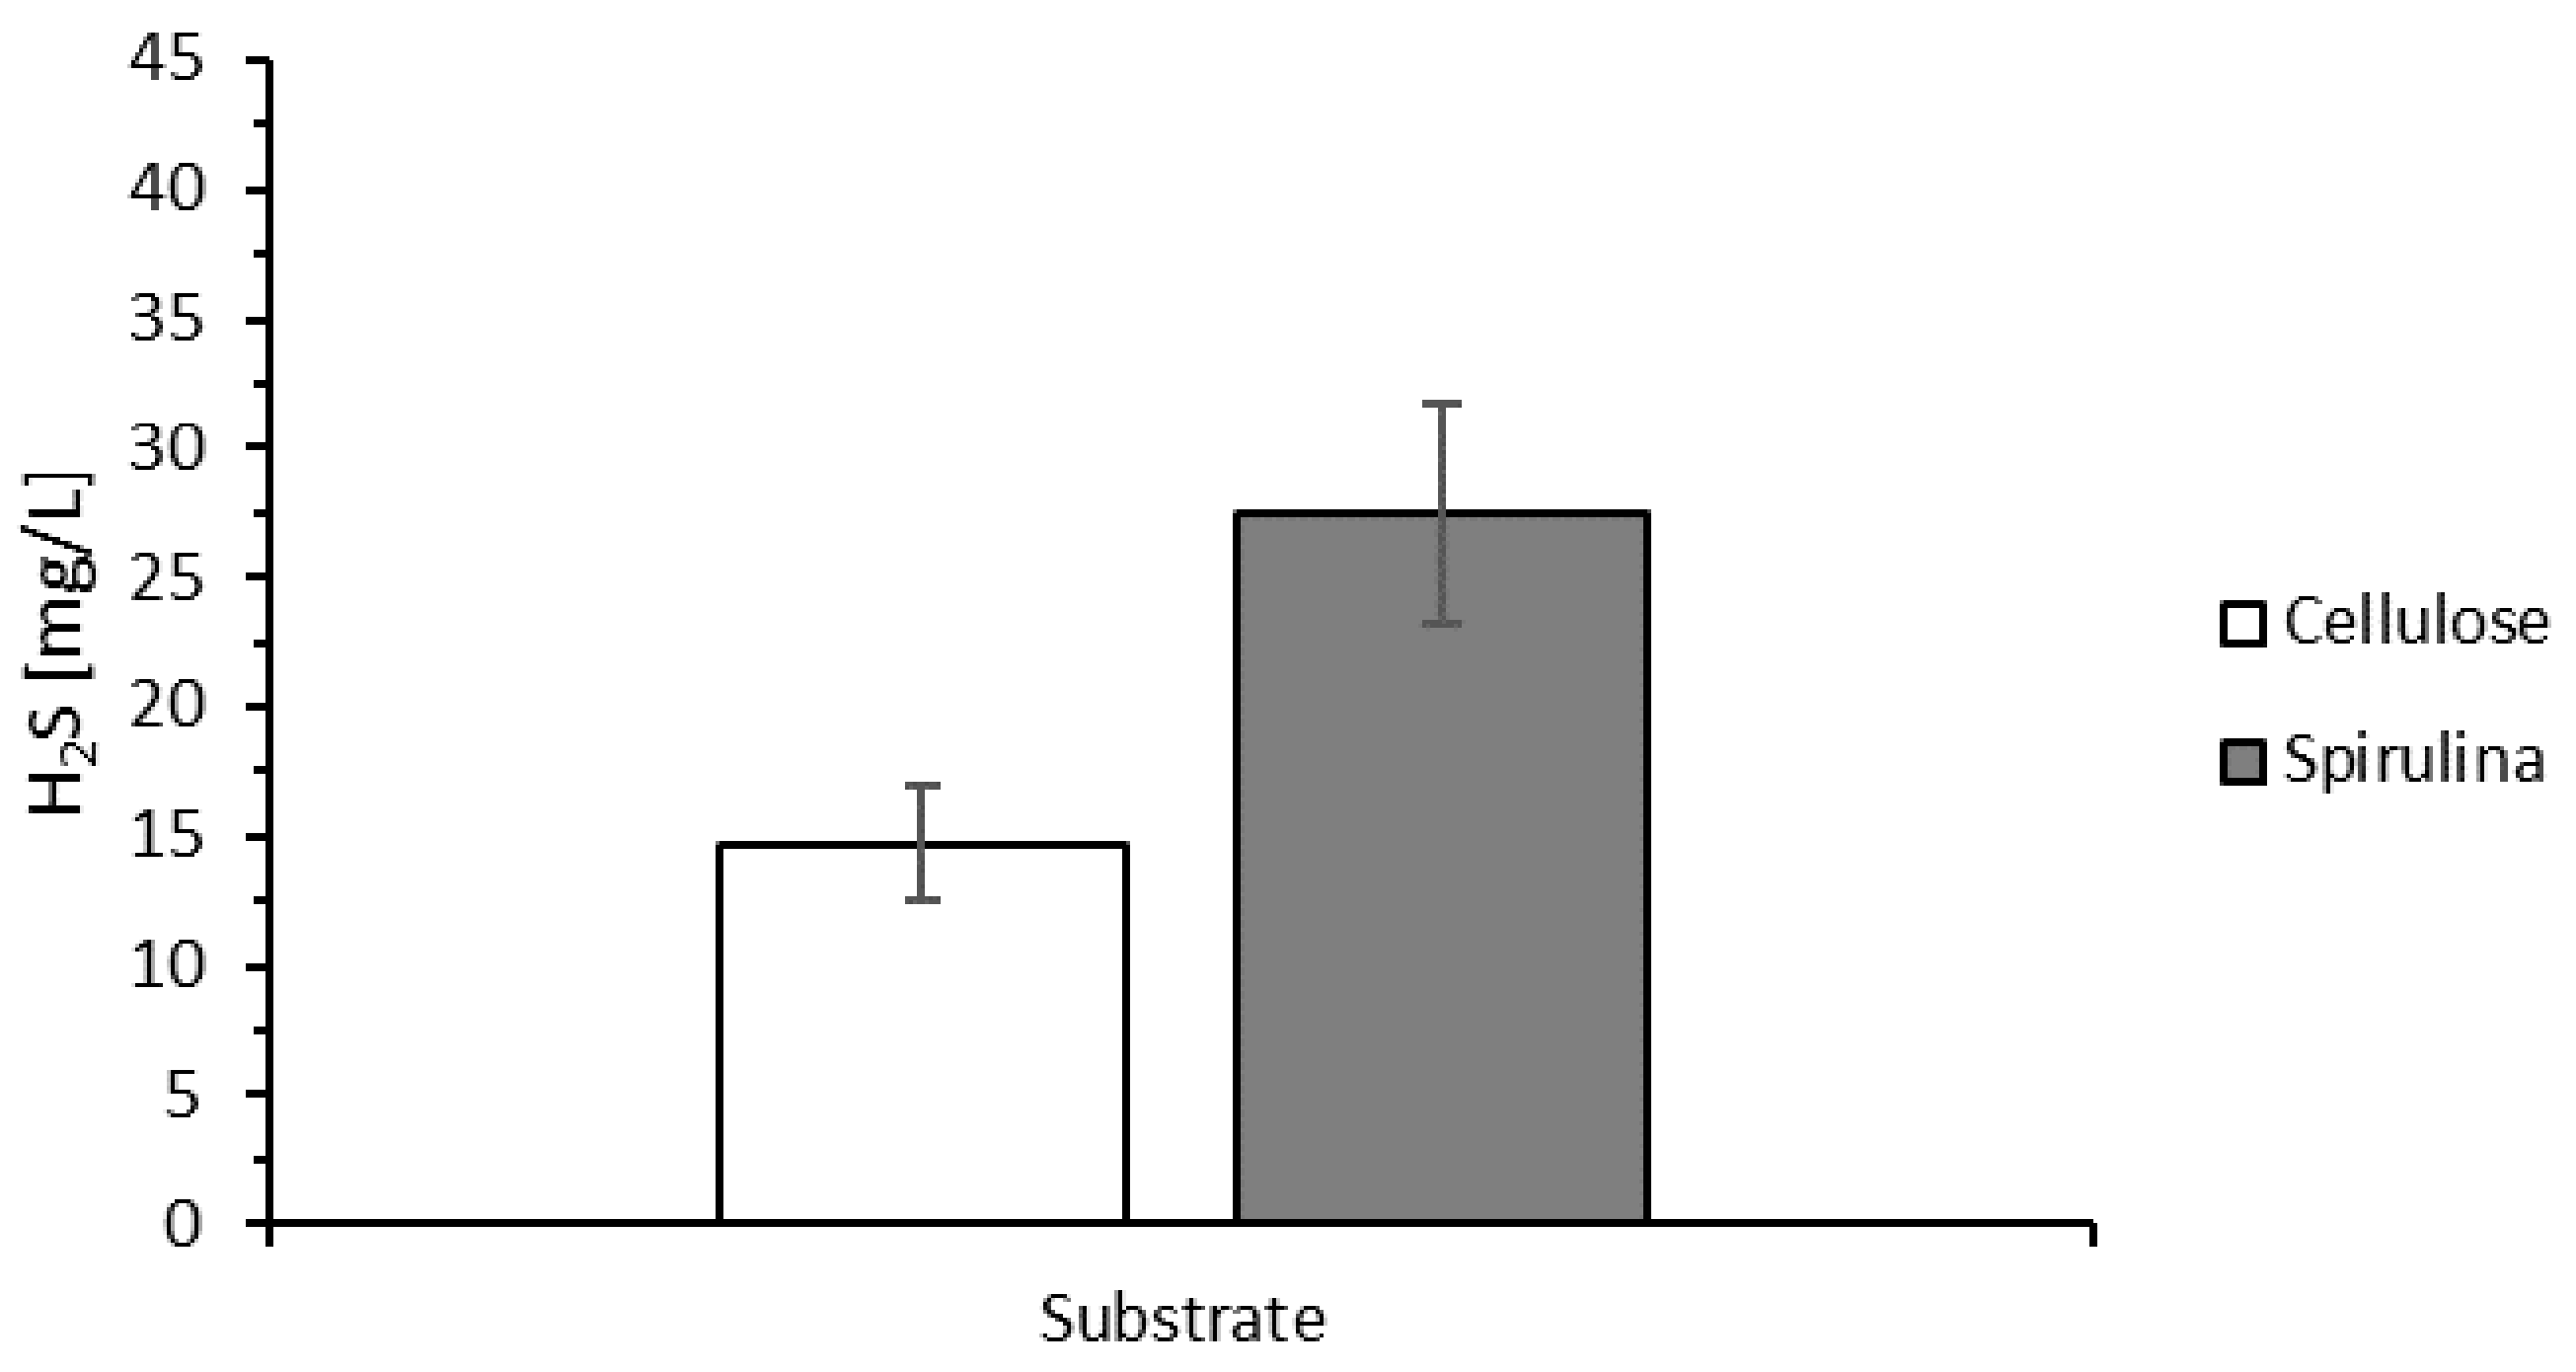
3.1. Growth of the Microbial Consortium and Determination of H2S Generation

The development of sulfur-reducing bacteria was determined by the appearance of a black precipitate in the culture media with cellulose and Spirulina as the electron donor. The generation of H2S by the microbial consortium grown at pH 7.1 was measured (Figure 2). Higher sulfide production was observed in media grown with Spirulina, whereas with cellulose, there was a significantly lower sulfide production (according to Duncan’s test, p < 0.05).

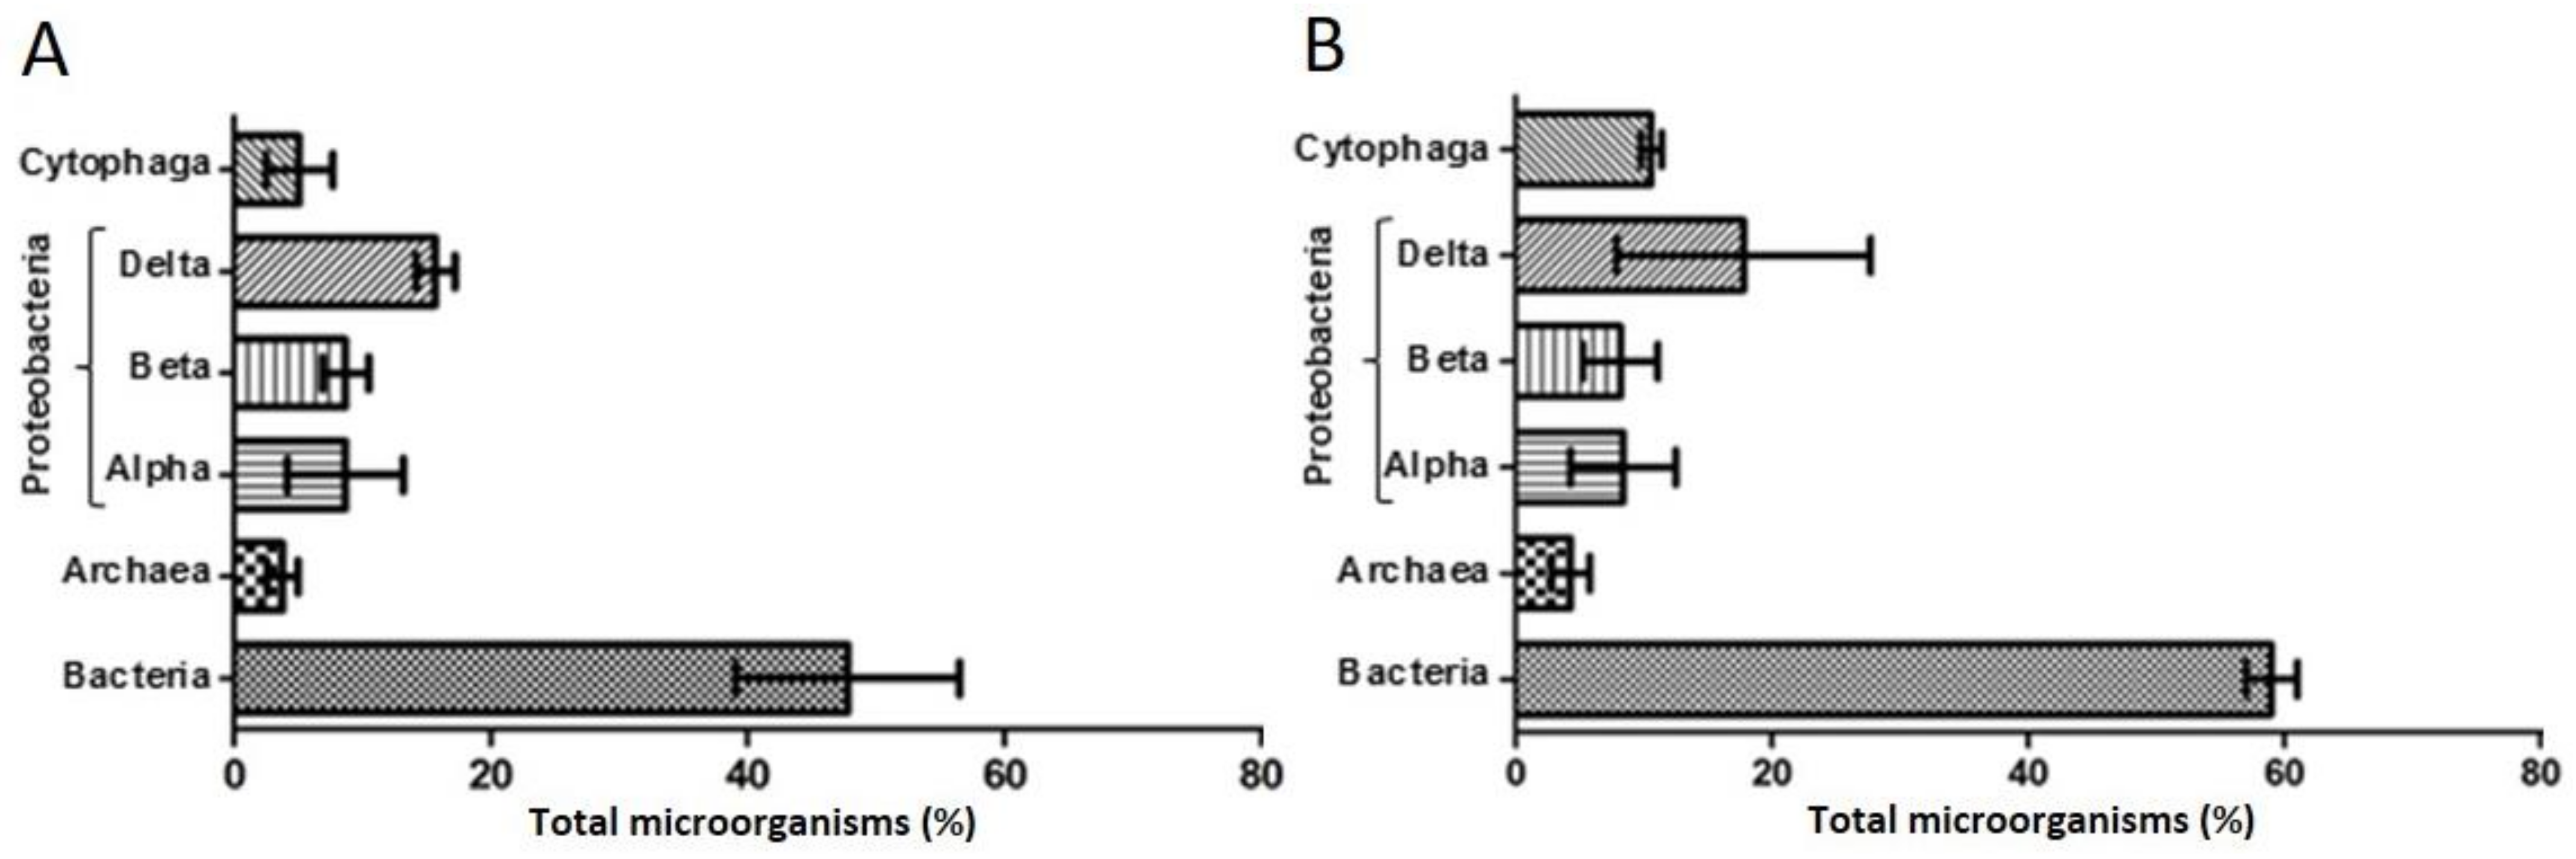
3.2. Microbial Consortium Characterization

In situ hybridizations were performed to characterize the microbial consortia of cultures developed in test tubes, using media with cellulose or Spirulina as organic substrate. This study allowed us to determine the relative microbial diversity of the microorganisms present in each consortium. In the microbial consortium cultivated in a medium with cellulose as the electron donor, it was observed that 47.8% of the microorganisms were identified as Bacteria, while 3.8% corresponded to Archaea (Figure 3A). On the other hand, the δ-proteobacteria were the most represented subclass with 15.7%. We also observed the presence of α and β-proteobacteria, as well as microorganisms from the Cytophaga-Flavobacterium group, each with less than 10% of the total of microorganisms. As shown in Figure 3A, the sum of the percentages of Proteobacteria α, β and δ, in addition to the Cytophaga-Flavobacterium group, corresponded to 38.2%, a lower percentage of microorganisms labeled with the Bacteria probe.
When analyzing the microbial consortium grown in Spirulina as the only electron donor, it was observed that the Bacteria domain corresponded to 59.0% of the labeled microorganisms, while 4.3% were Archaea (Figure 3B). It was observed that the most represented subclass was δ-Proteobacteria with 17.8%, followed by the Cytophaga-Flavobacterium group with 10.6% and finally, the subclasses α and β-Proteobacteria with 8.4 and 8.2%, respectively. The sum of the percentages of the studied groups was 45.0%, much lower than the percentage of microorganisms marked with the Bacteria probe.

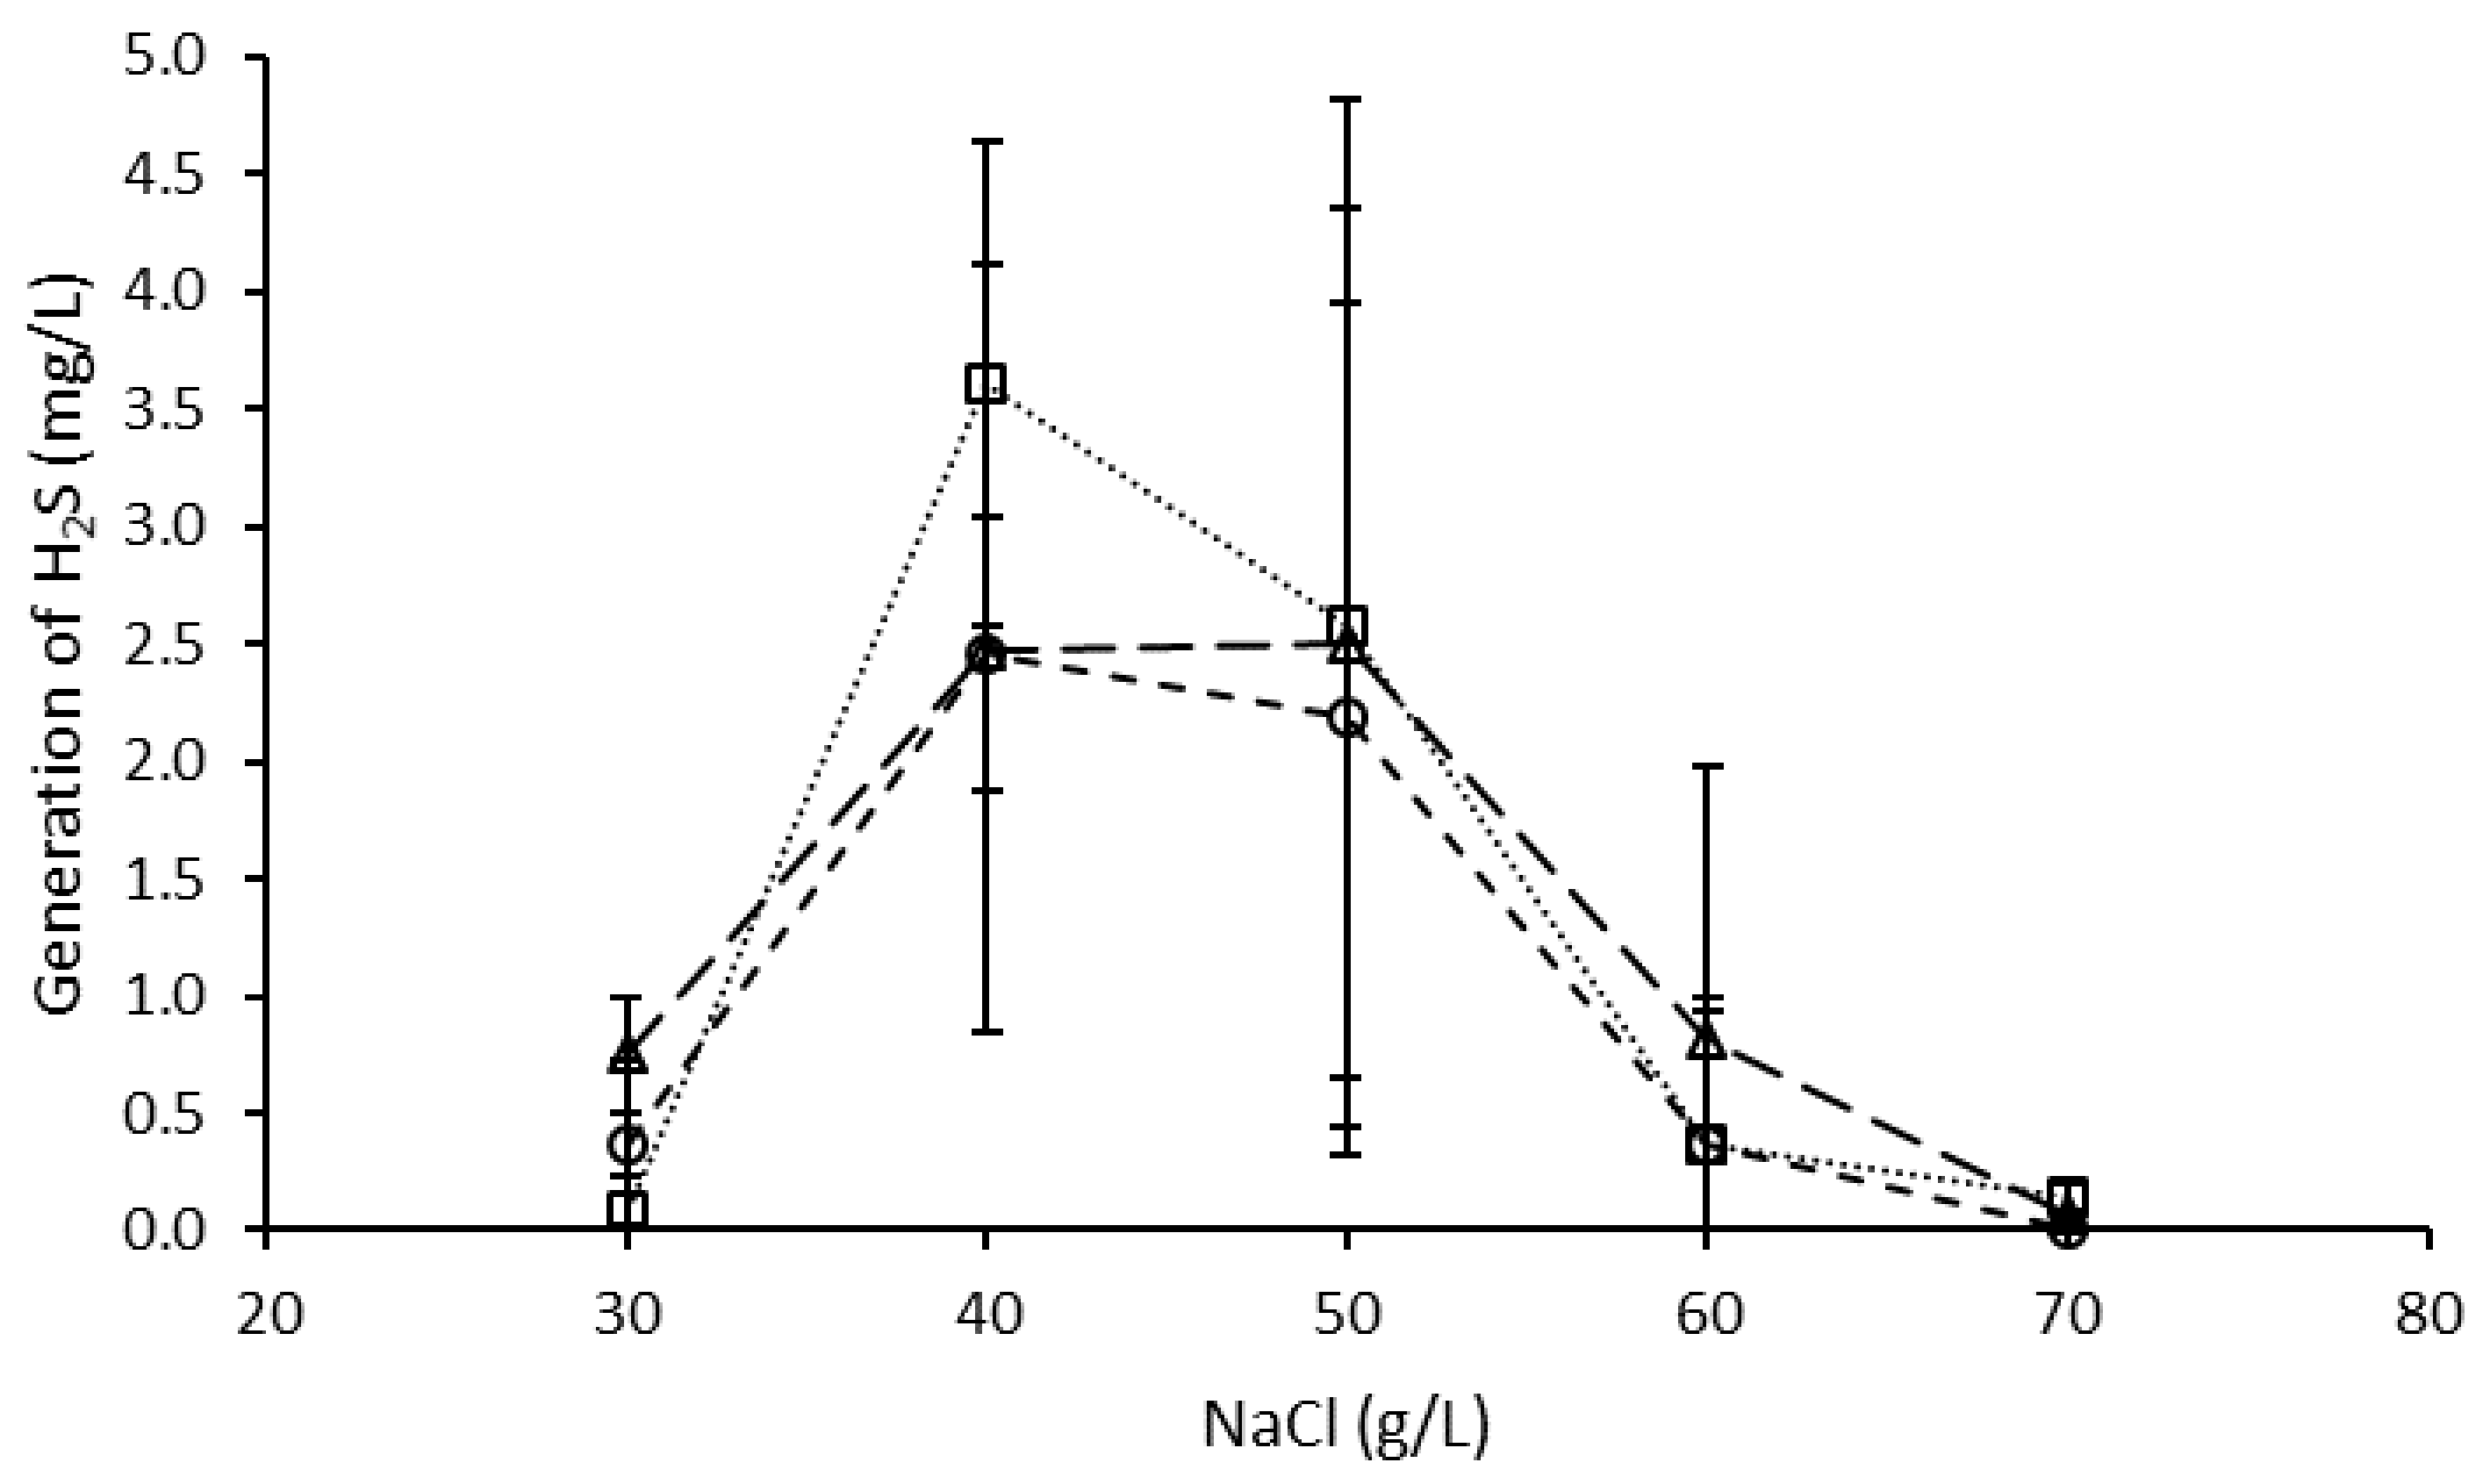
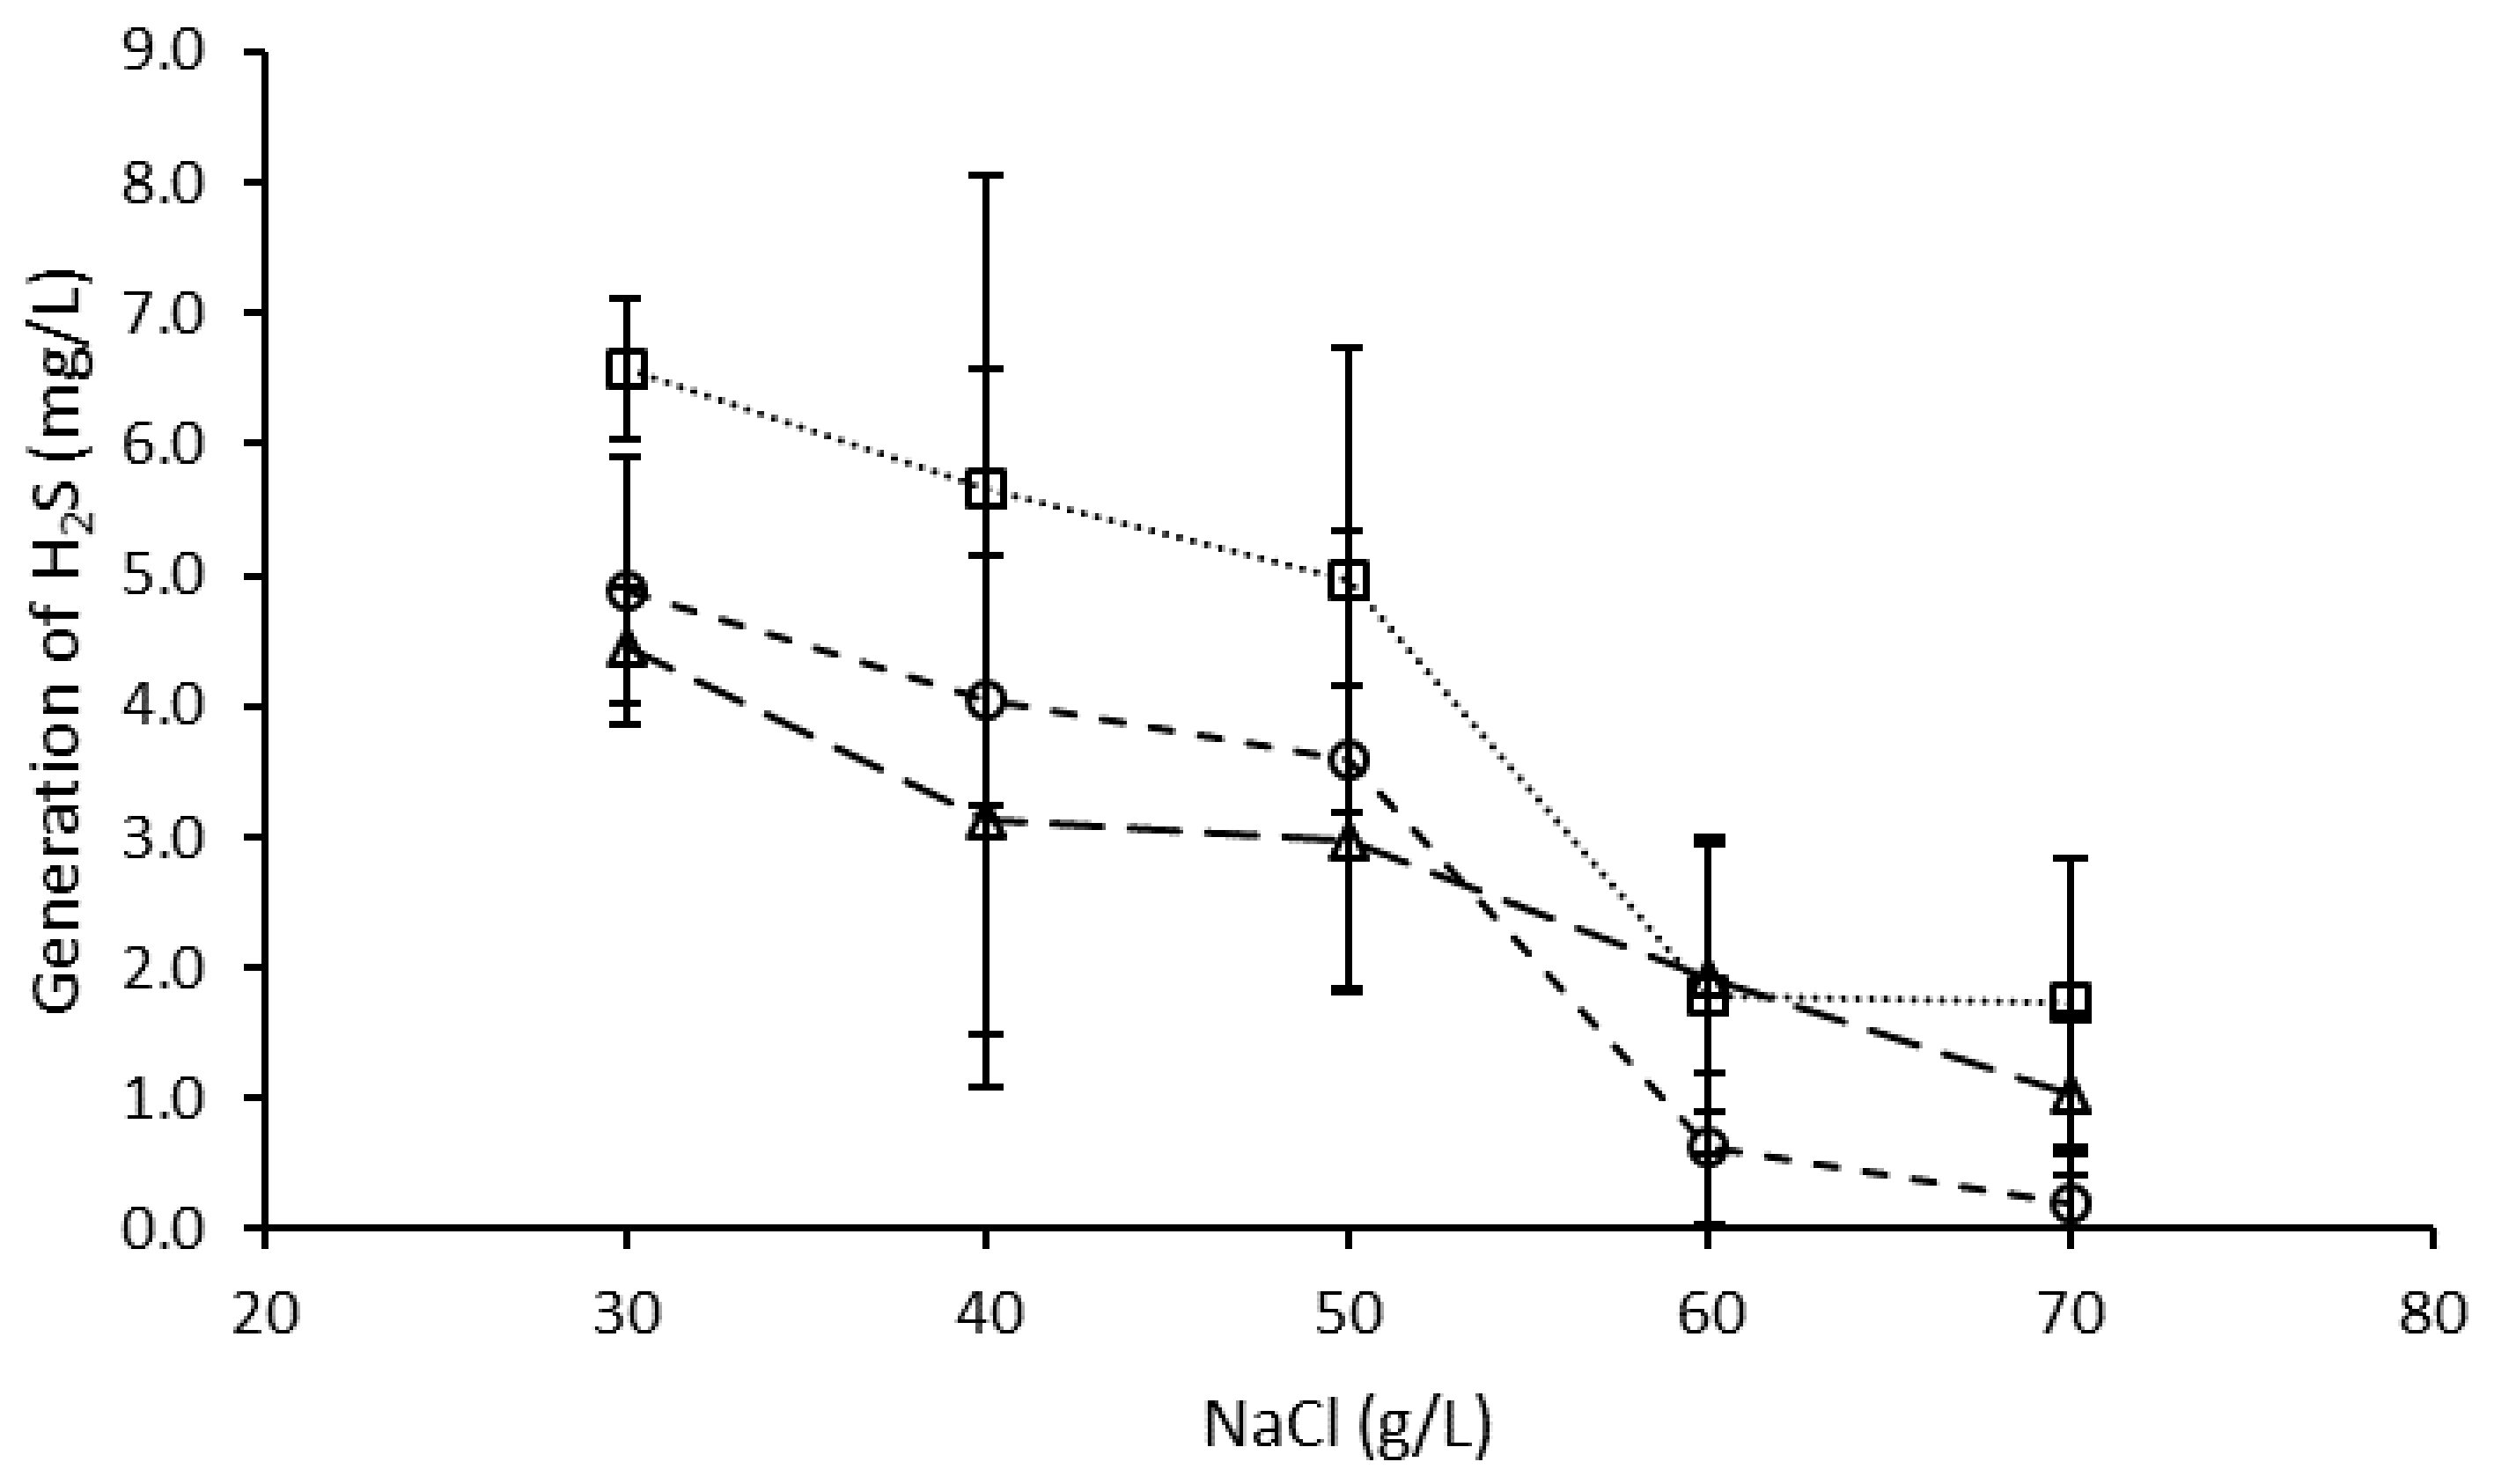
3.3. Effect of NaCl on H2S Generation by the Microbial Consortium

Since the sample to enrich the S°RB was obtained from a saline lake, it was necessary to know the effect of NaCl on the behavior of microbial consortia. In the microbial consortium grown with cellulose as a substrate (Figure 4), the highest H2S production was observed between 40 and 50 g/L of NaCl for the different days evaluated, with a maximum H2S yield at 40 g/L on day 7 of culture. However, there were no significant differences found between the average sulfide production and the studied NaCl concentrations.
Similarly, in the microbial consortium grown with Spirulina as a substrate (Figure 5), the maximum H2S production was observed at 30 g/L NaCl on day 7 of the culture. An increase in NaCl concentration resulted in a decrease in H2S production. However, no significant differences were found between the average sulfide production at the NaCl concentrations studied.

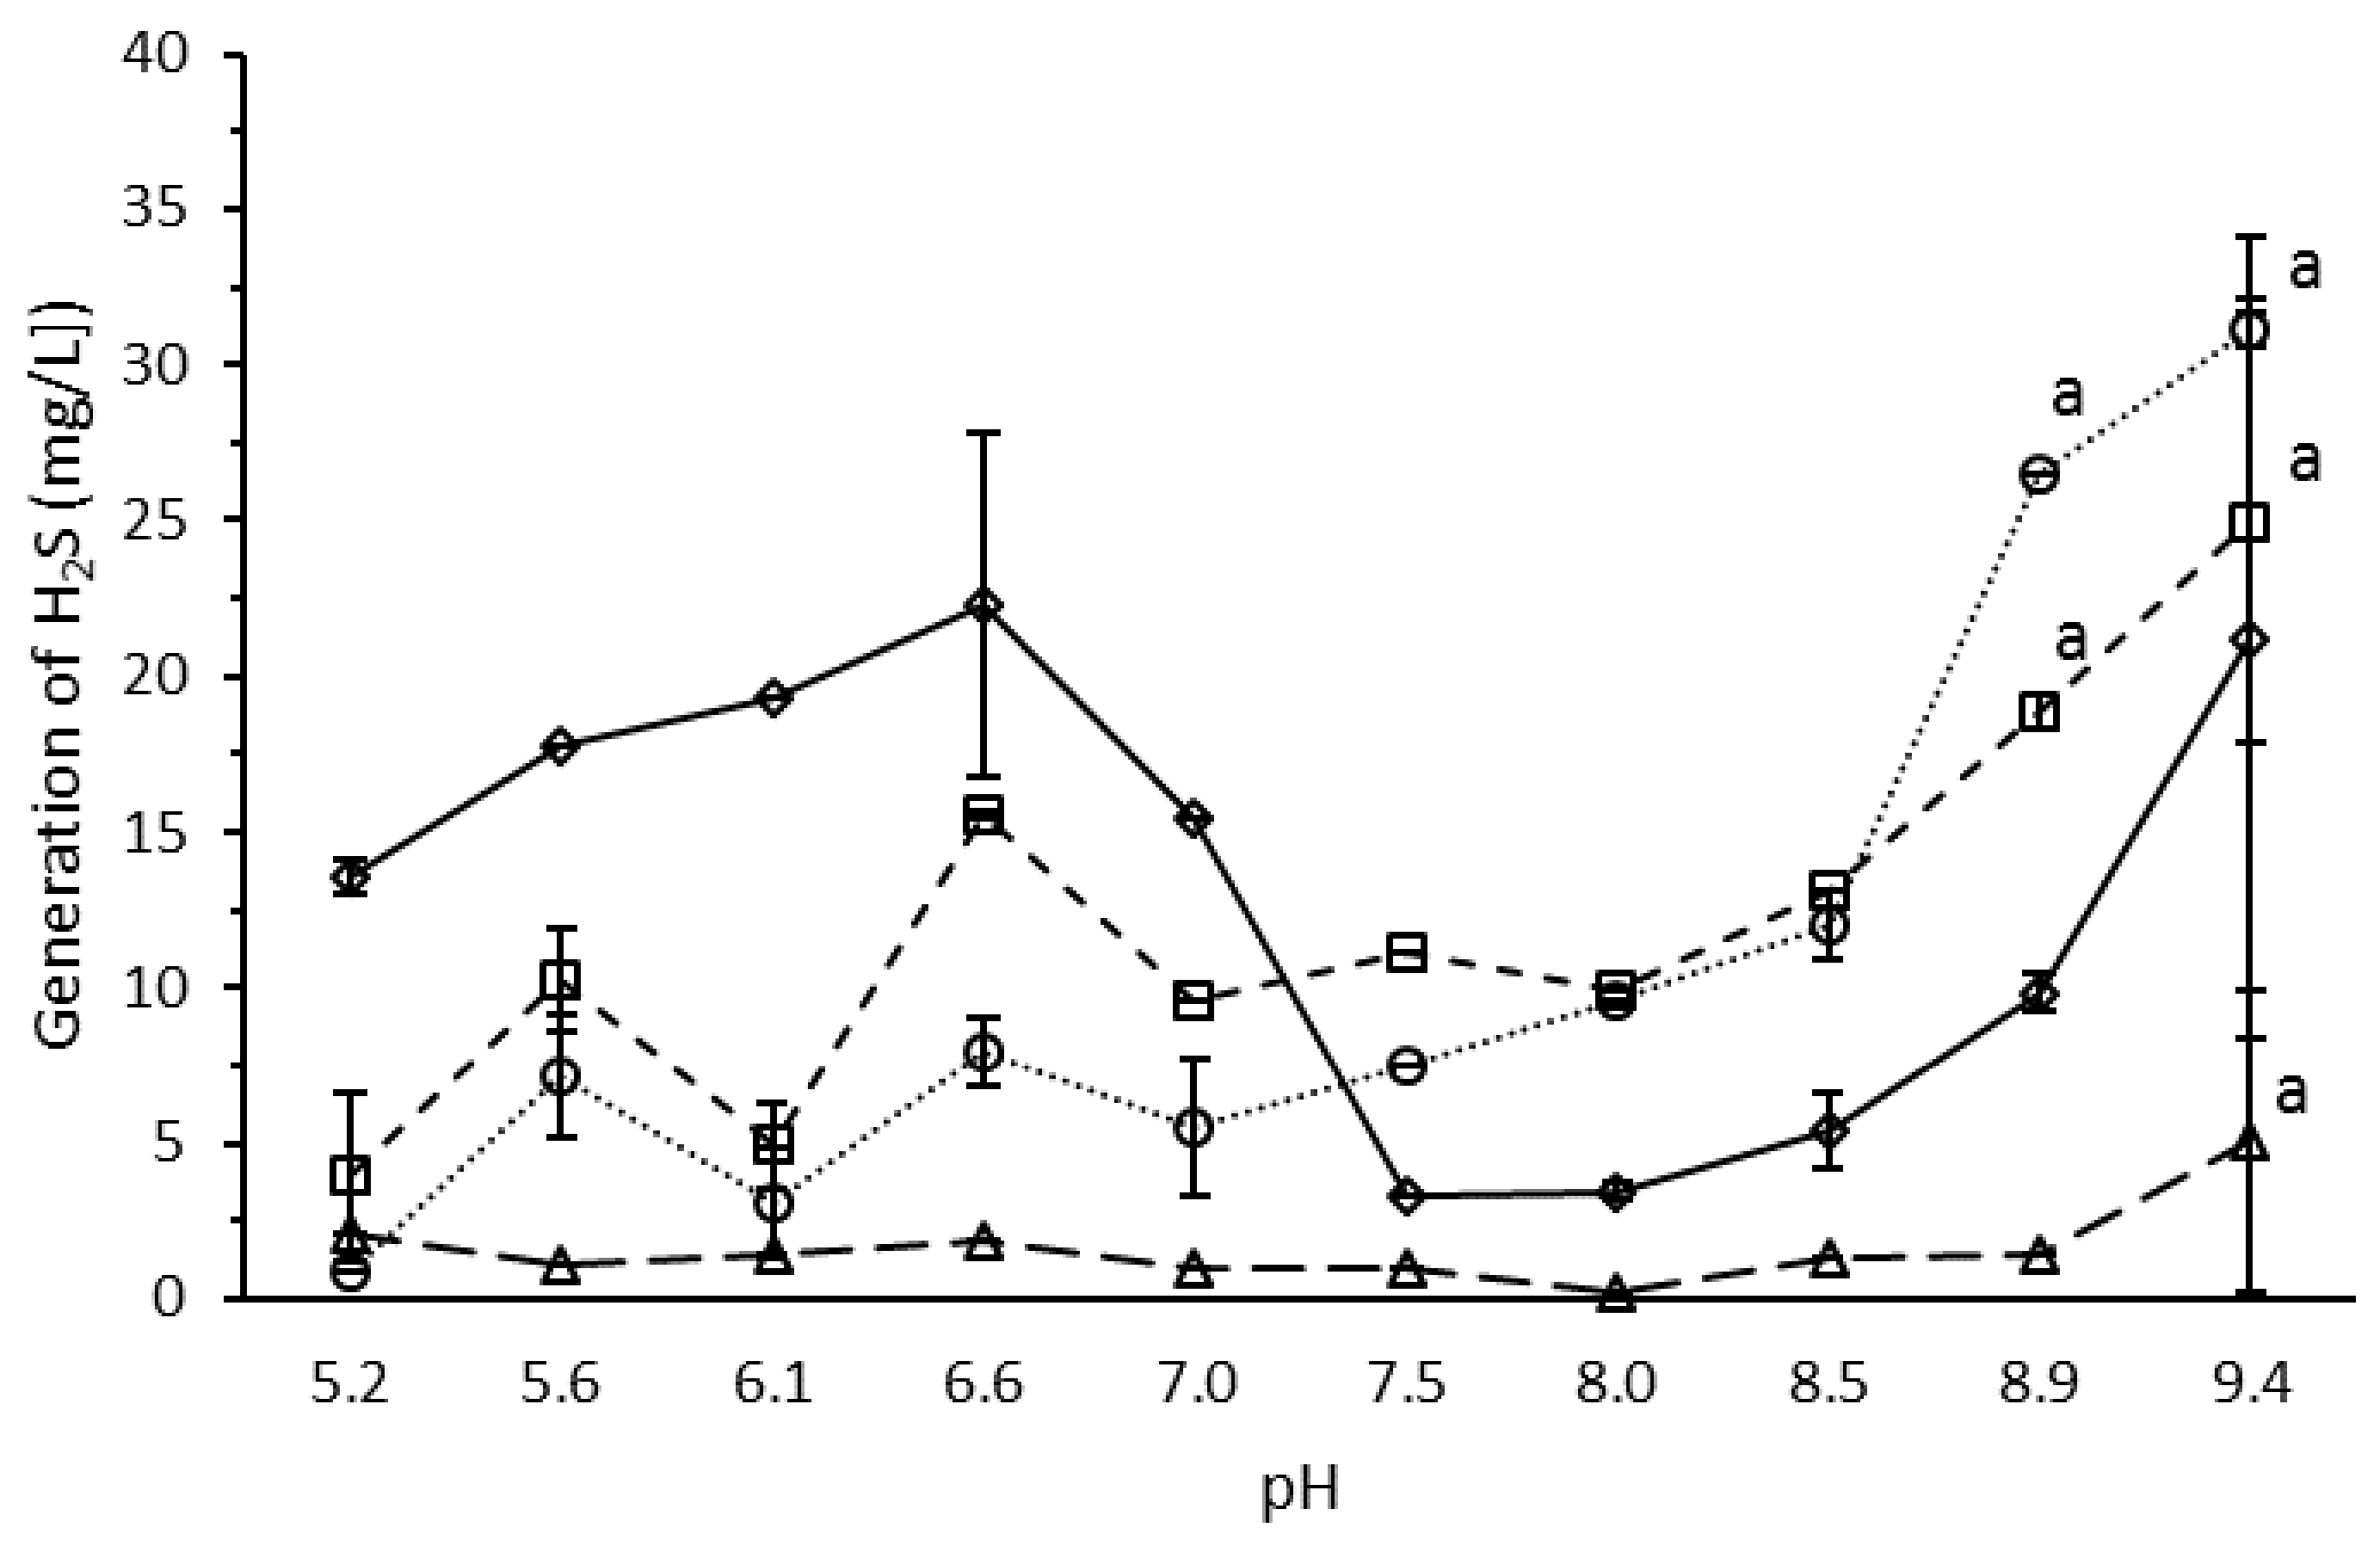
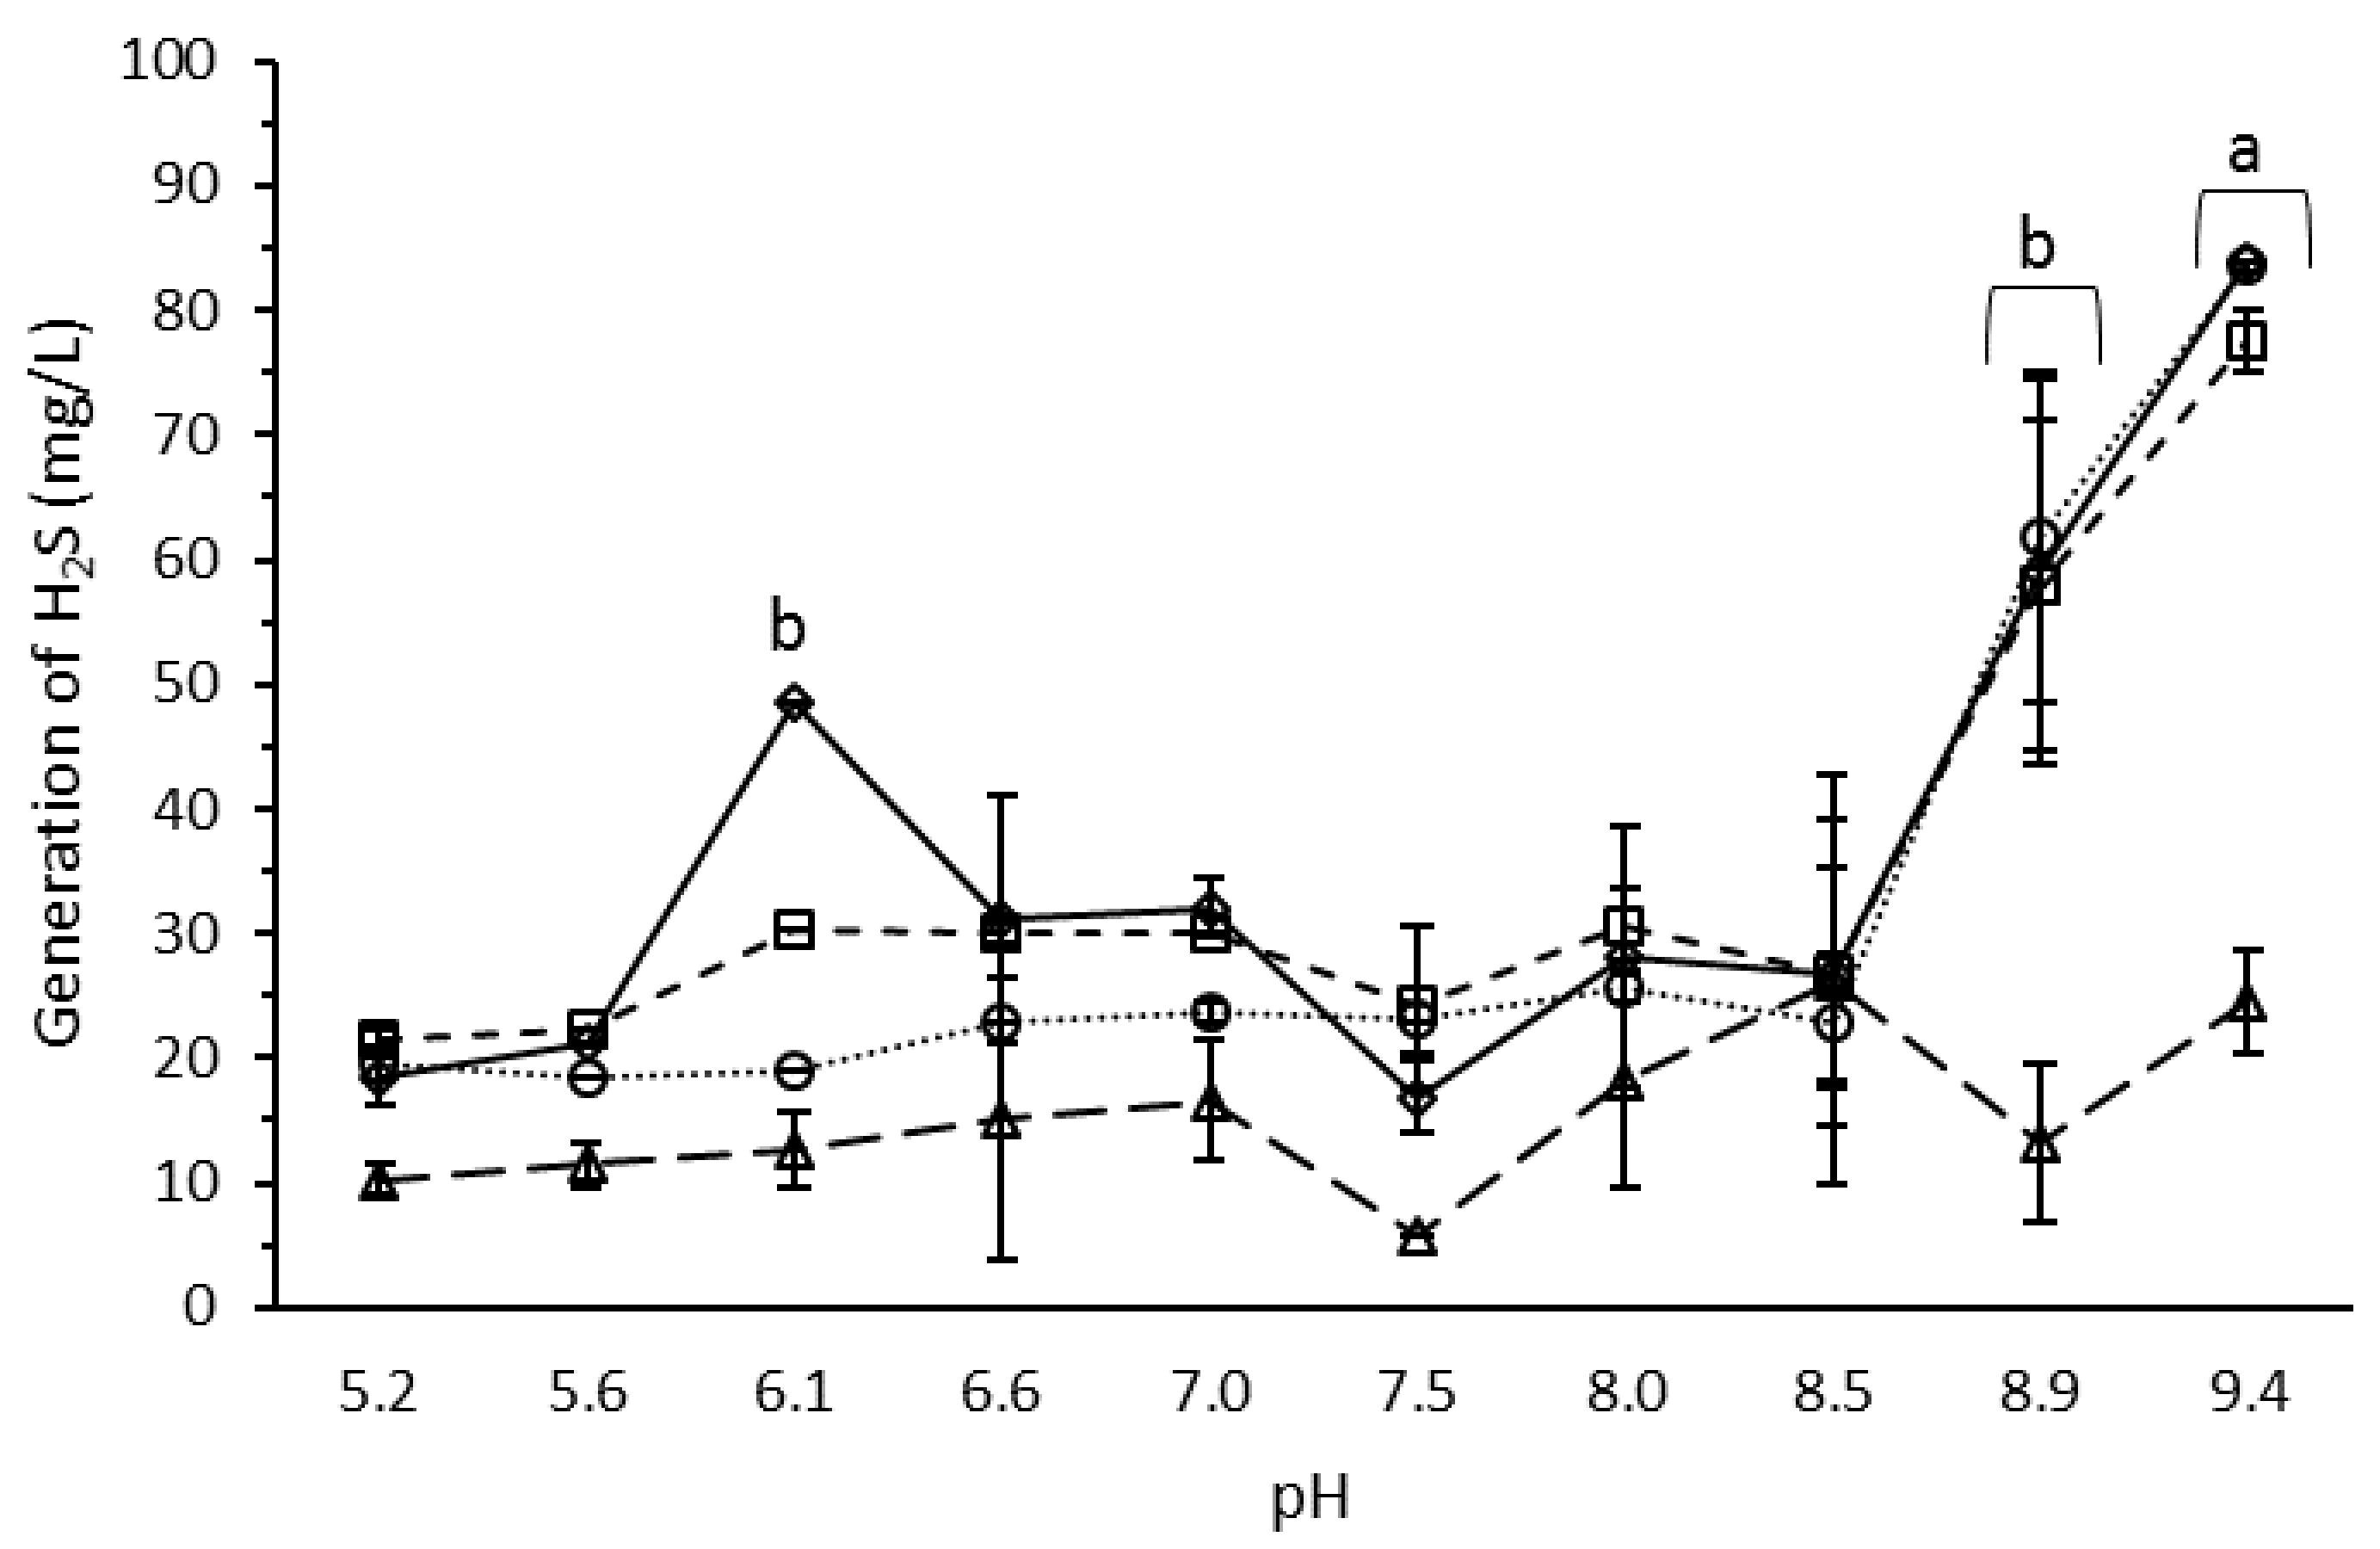
3.4. Effect of pH on H2S Production by the Microbial Consortium

The effect of pH on H2S production by the microbial consortium was investigated in culture media without FeCl3, using different electron donors as substrates. The pH range evaluated was 5.2 to 9.4. In the consortium grown with cellulose as a carbon source, a maximum trend of H2S production was observed at alkaline pH (8.9 and 9.4) for all the analyzed days (Figure 6). Additionally, on day 14, there was a peak production at pH 6.6. The H2S production on day 21 at pH 9.4 was significantly higher compared to the other pH values analyzed.
Similarly, the evaluation of H2S production in media with Spirulina as an electron donor indicated a higher production at alkaline pH for all days evaluated, with a significant difference in sulfide levels on the media at pH 9.4 to the other pH values, for all the studied days (Figure 7). An exception was observed on day 21 of culture, where no significant differences were observed between the different pHs evaluated (according to Duncan’s test, p < 0.05).
In brief, higher sulfide production was observed in cultures grown using Spirulina as an organic substrate in media with alkaline pH (9.4). However, there were no major differences in productivity at lower pH. A similar trend was observed in media with cellulose but with smaller production ranges.

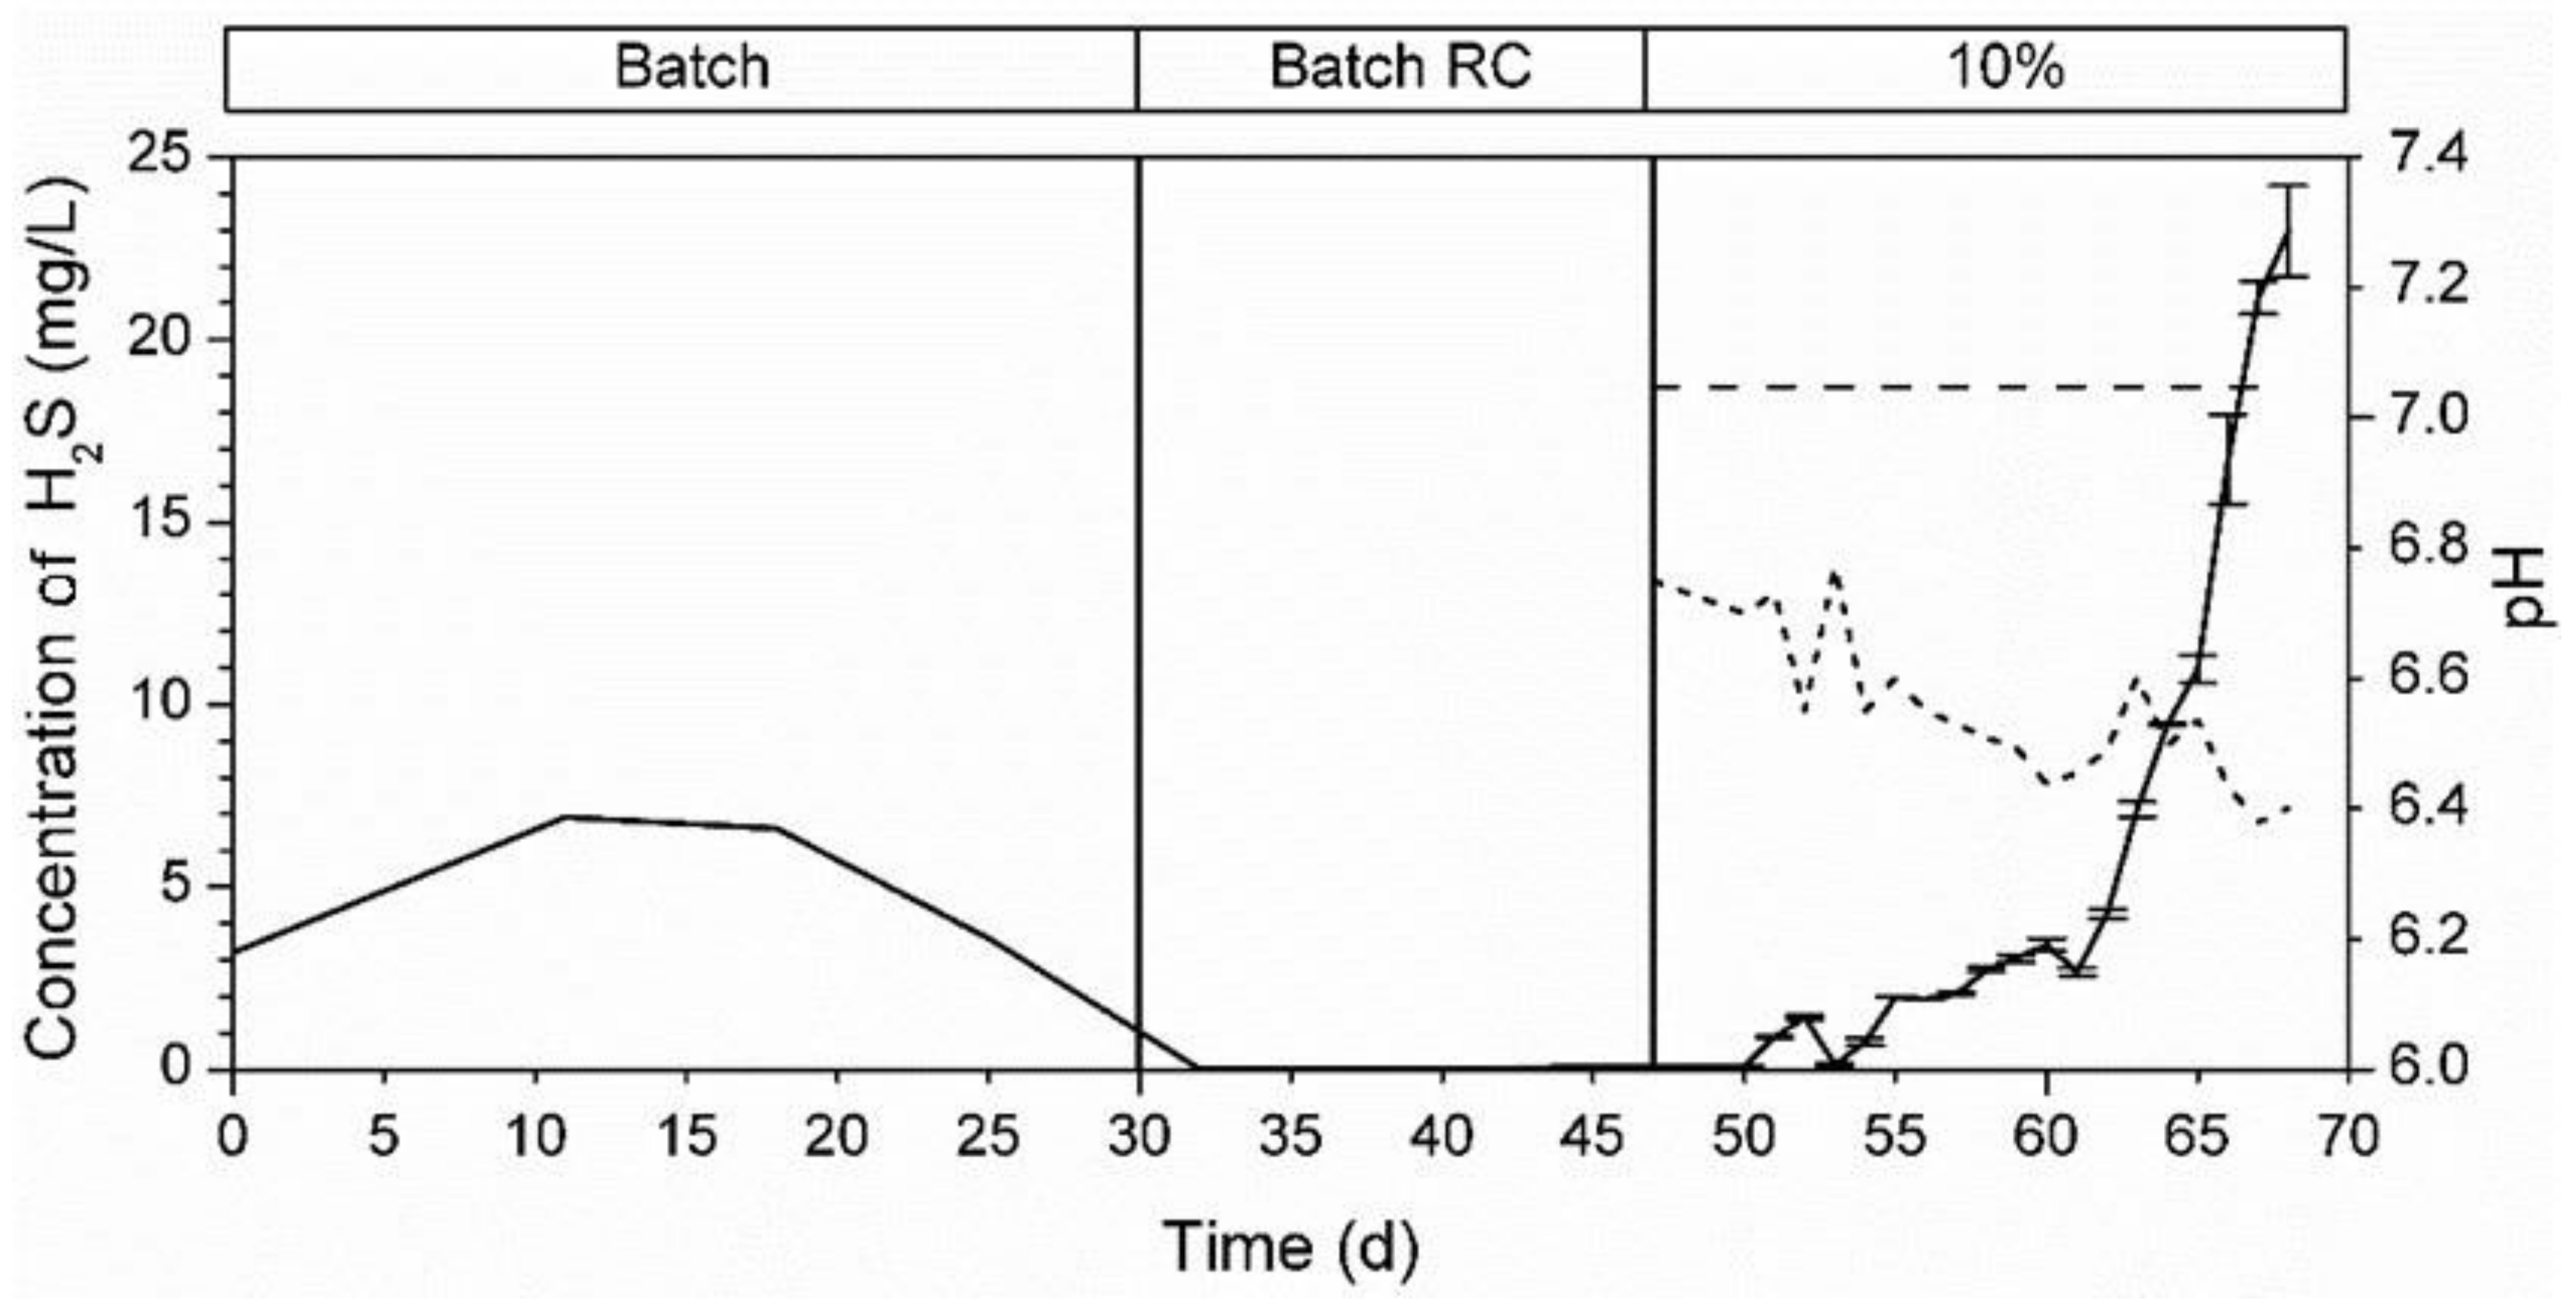
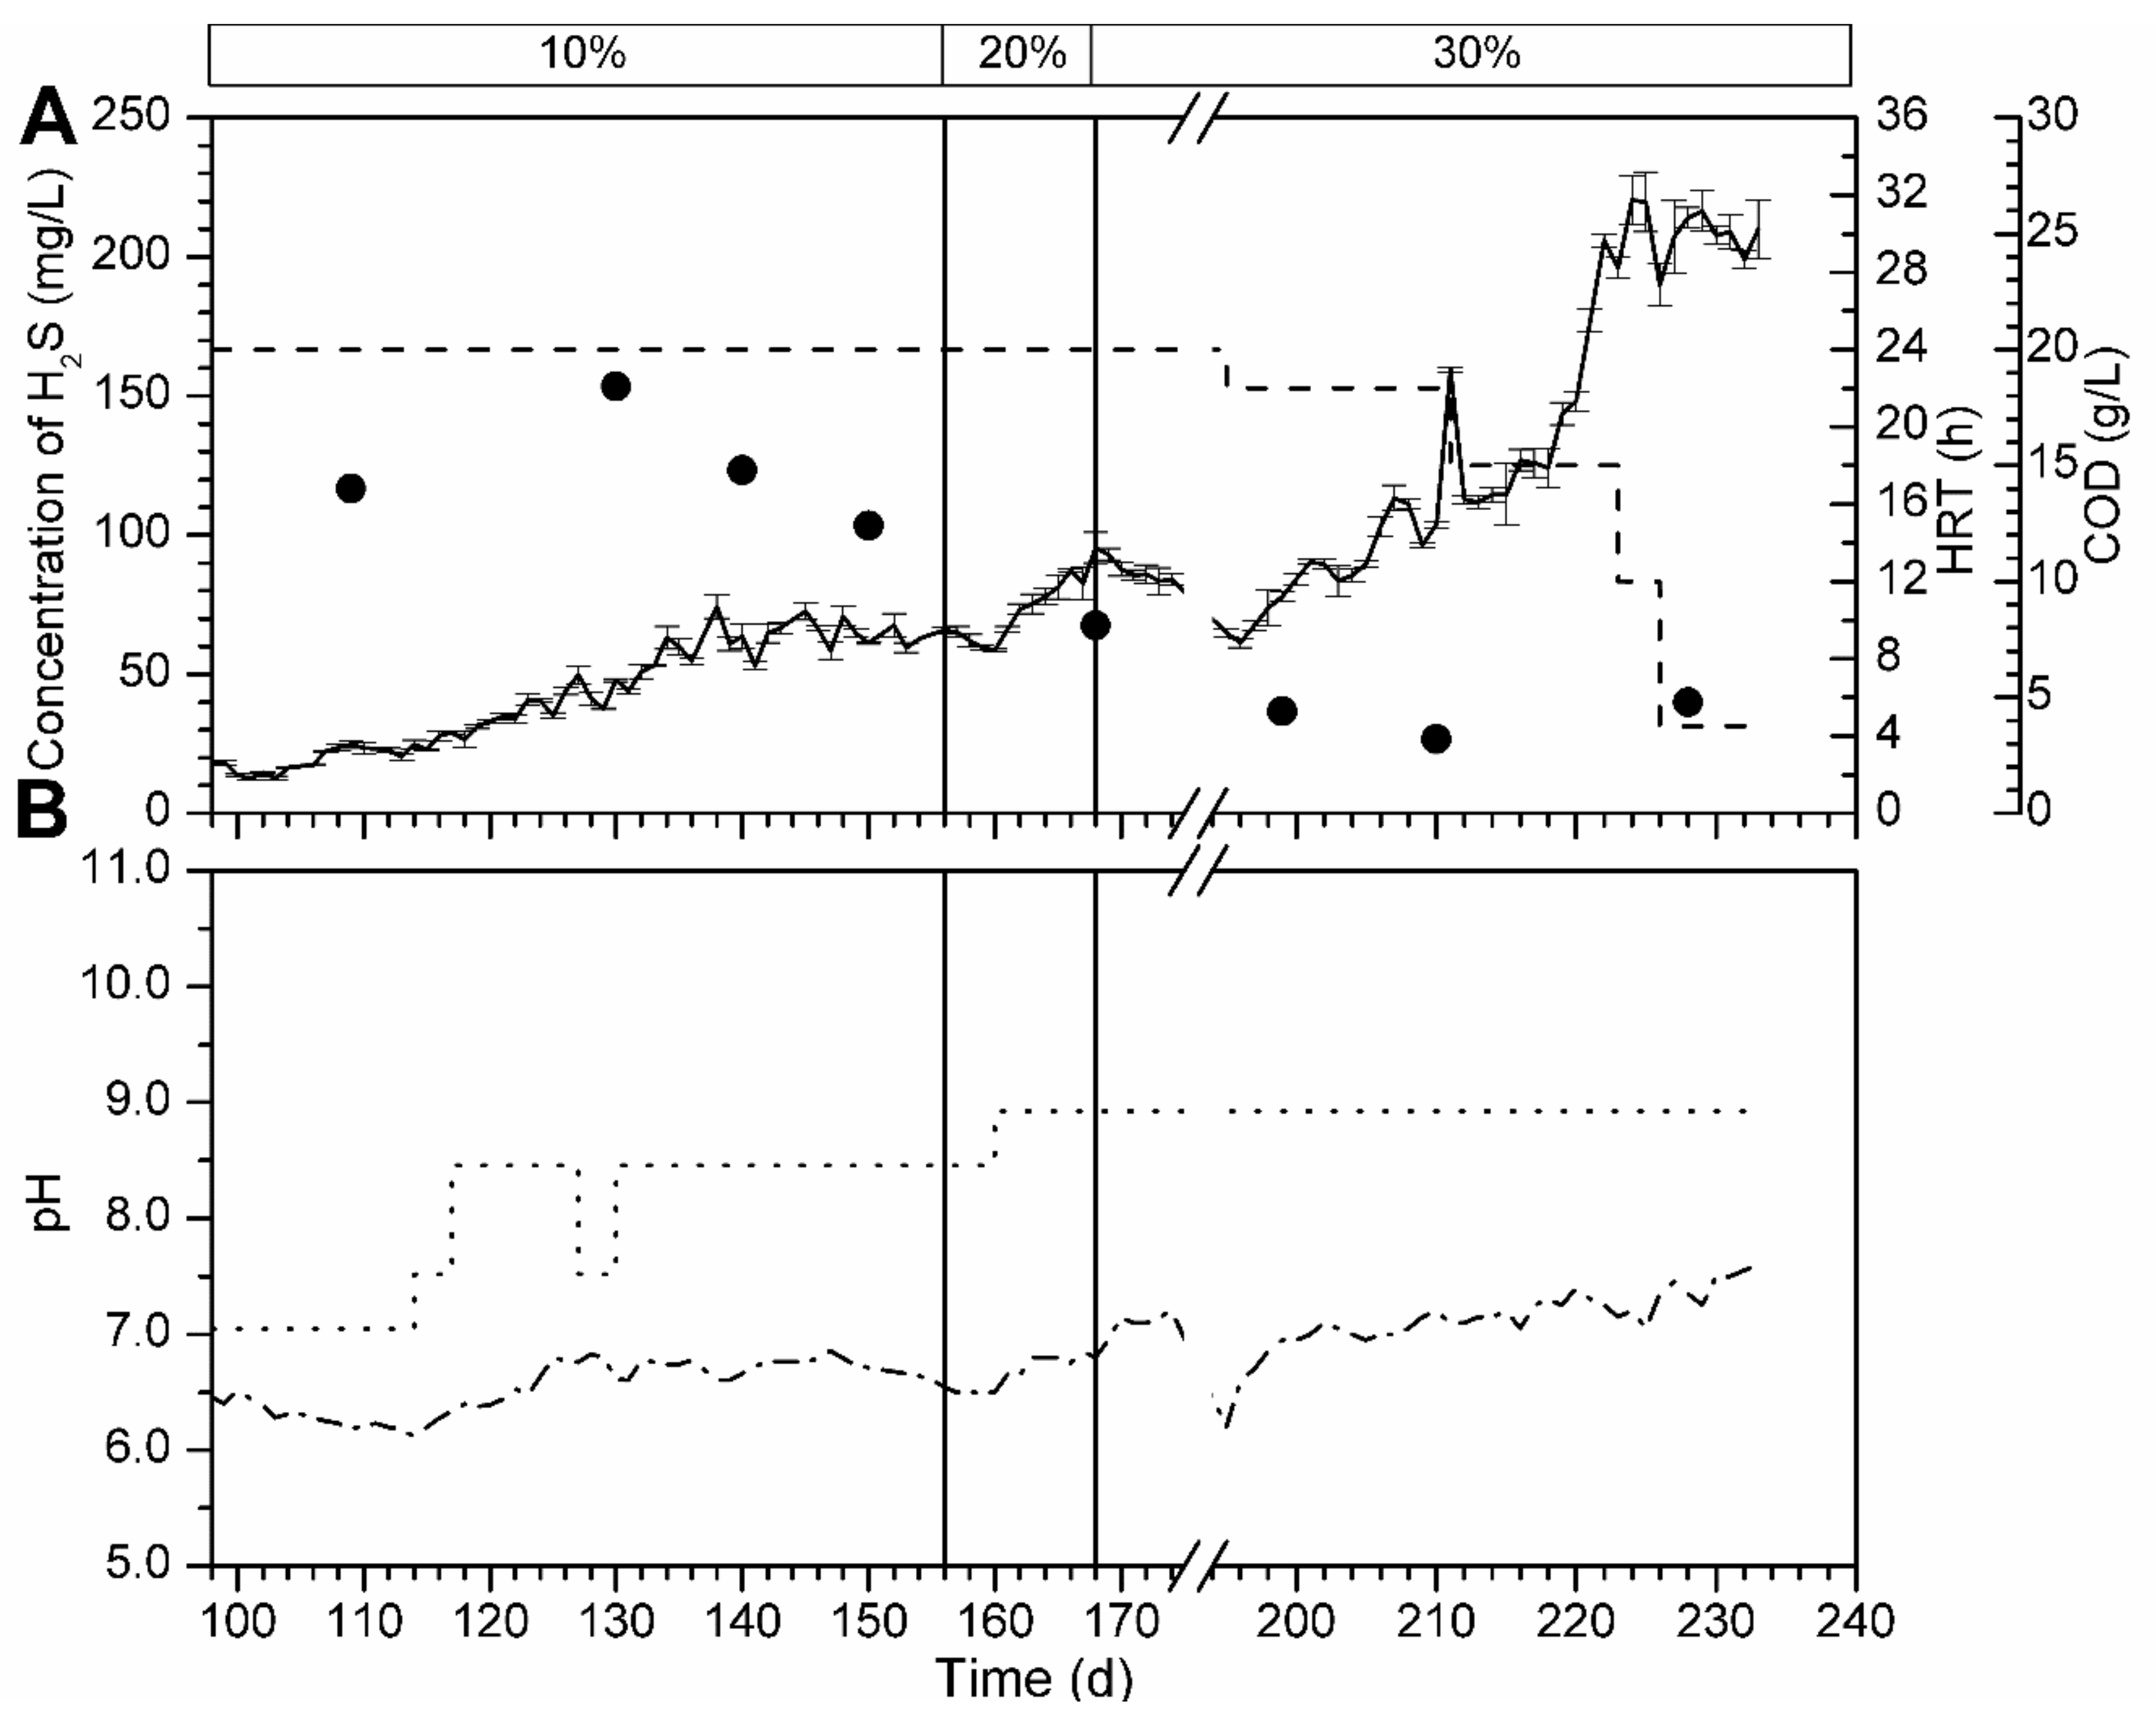
3.5. Determination of the Growth Capacity of the Microbial Consortium in Bioreactors

The growth capacity of the microbial consortium to develop in three bioreactors (R1, R2 and R3) was studied under different operating conditions. R1 was filled with Celite™ R-635 and fed with cellulose, while R2 had no support material inside and was fed with Spirulina and R3 was filled with Celite™ R-635 and fed with Spirulina. The operating conditions for the three bioreactors are detailed in Table 5, Table 6 and Table 7.

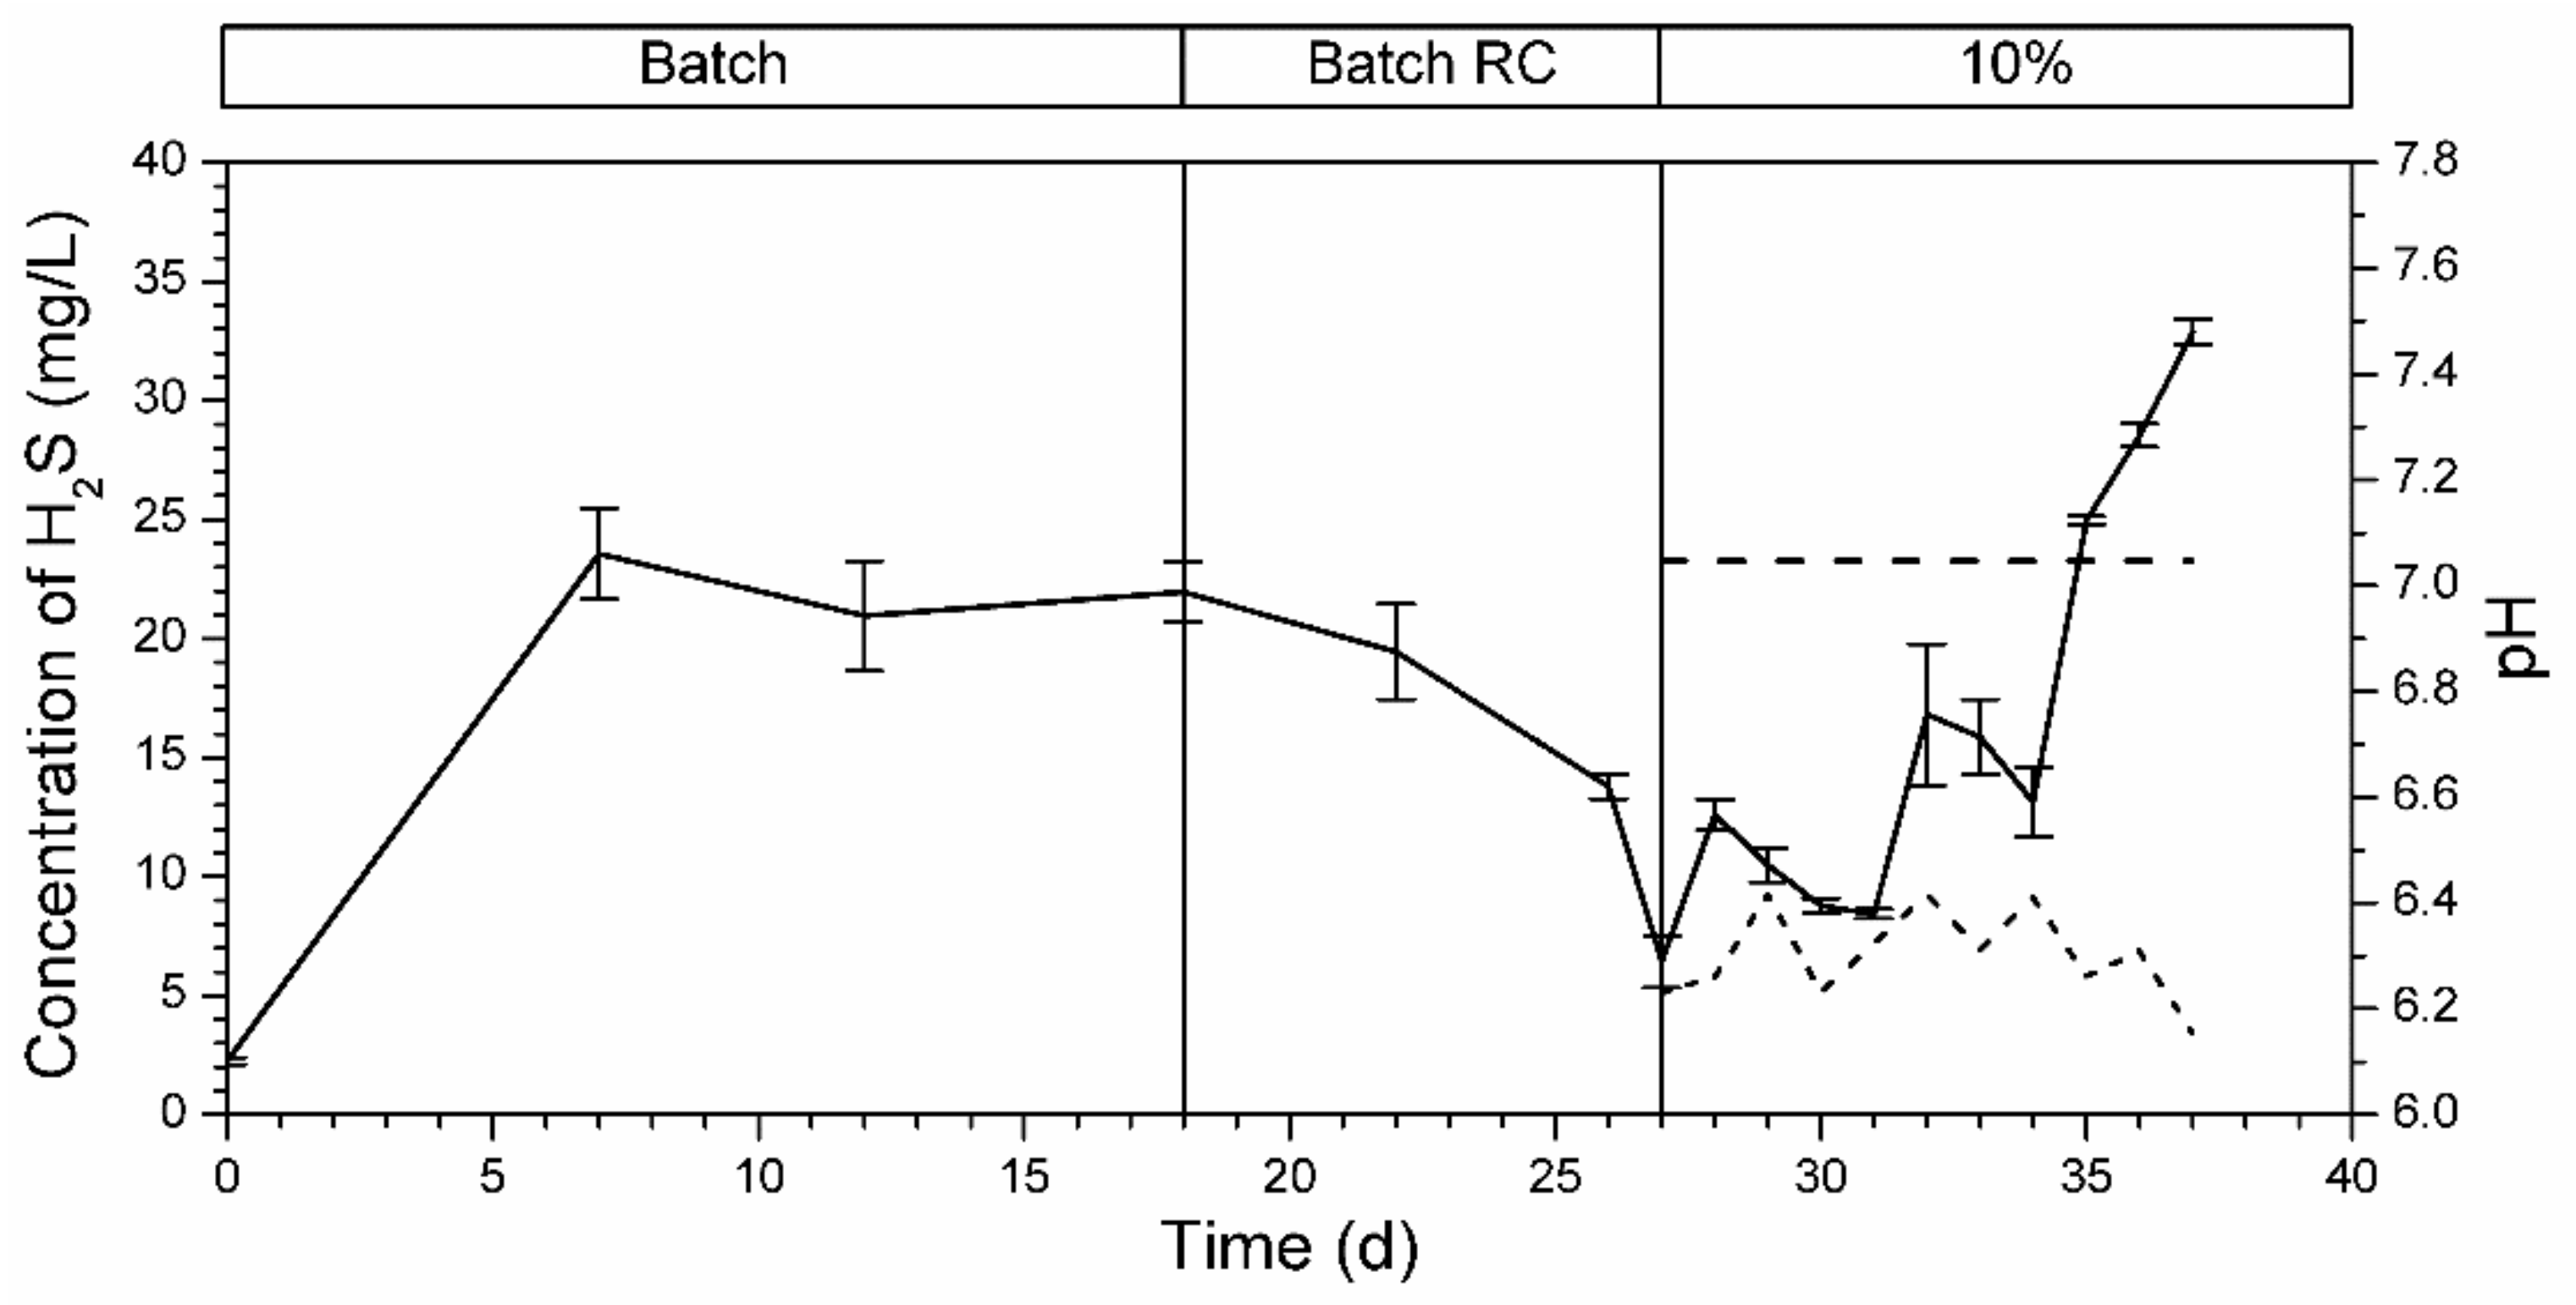
3.5.1. Bioreactor R1 Filled with Celite™ R-635 and Fed with Cellulose

R1 was operated under the operating conditions comprising the experimental periods I, II and III, detailed in Table 5. During the first batch maintenance phase, hydrogen sulfide levels reached values close to 7 mg/L H2S (Figure 8). Subsequently, the H2S levels gradually decreased until they reached non-quantifiable values. After the start of feeding with 10% of the equivalent volume of the bioreactor, there was a slight increase in dissolved sulfide levels near day 50 of operation, which then gradually decreased until reaches non-quantifiable values were reached. Additionally, after the start of feeding with a culture medium at pH 7.1, a constant decrease in the pH of the effluent was observed, reaching levels close to pH 6.4. The sulfide production appears to be directly related to changes in pH and organic matter delivery. As sulfidogenic productivity increases, there is a gradual decrease in pH levels in the effluent.
The performance of bioreactor R1 was studied in a subsequent stage of the operation, as shown in Figure 9. During this stage, the bioreactor was run under a semi-continuous regime, as specified in Table 5. Initially, the feed volume was 10% of the total bioreactor volume (day 98), which resulted in a slight increase in H2S concentration until day 112. Subsequently, the pH of the feed medium was increased to 8.5, leading to a significant rise in H2S production until day 155. The sulfide concentration and pH remained relatively stable, while COD levels tended to decline. Between days 156 and 167, both pH in feed (pH 8.9) and feed volume (20% of the total volume) were increased, resulting in increased H2S productivity. Thereafter, the feed was raised again to 30% until day 174. A recirculated batch operation was then initiated, lasting until day 194 (without feeding), after which the feed medium was returned with 30% of the total volume. In the subsequent periods, only the HRT was decreased to increase the volumetric productivity until the end of the bioreactor R1 operation. Overall, an increase in the volumetric productivity of the sulfides generated in the bioreactor was observed, driven primarily by the changes in the pH of the feed, variations in the supplied volumes and a decrease in the HRT. The final H2S concentration was 210 mg/L, corresponding to volumetric productivity of 1.94 mol/m3∙day. Despite the high volumes of feed and pH supplied, the pH in the effluents could not rise, indicating clear acidification of the internal environment by the microbial sulfidogenic consortium.

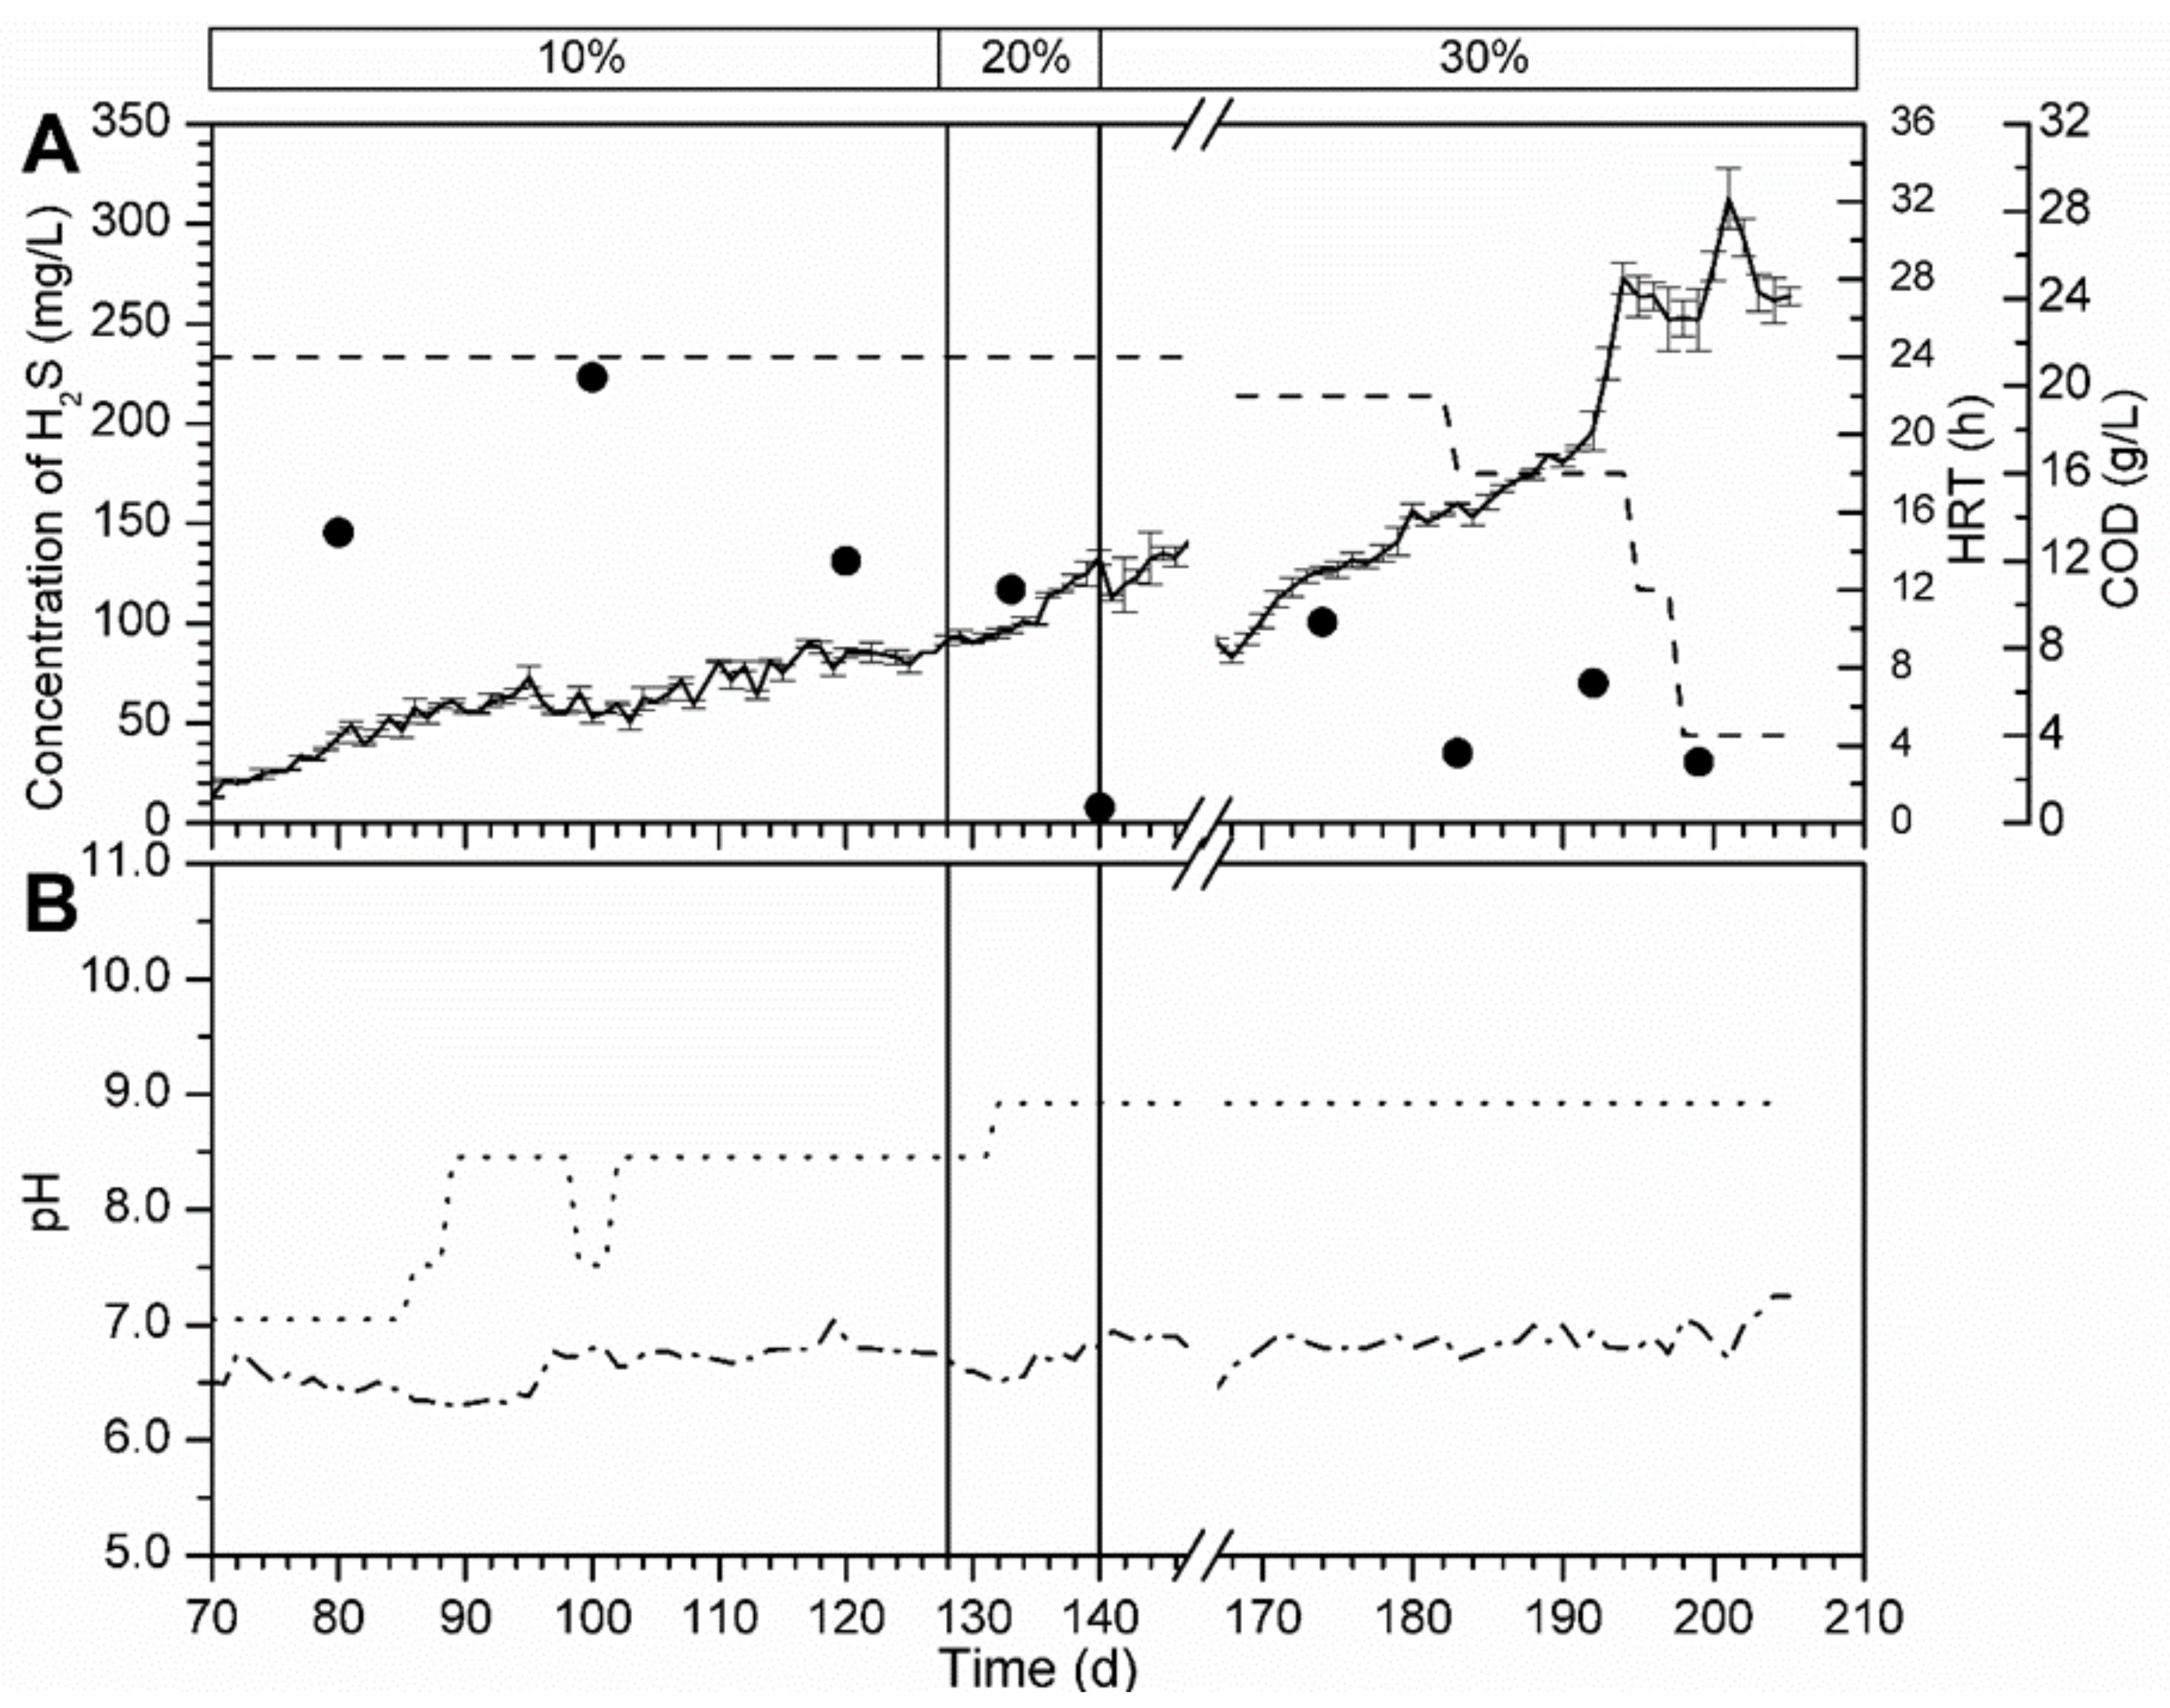
3.5.2. Bioreactor R2 without Support Material and Fed with Spirulina

The bioreactor R2 was operated under the conditions described in Table 6 (Figure 10) for the experimental periods I, II and III. During the batch phase (days 0–18), the levels of hydrogen sulfide reached a maximum of approximately 22 mg/L and gradually decreased to 7 mg/L (days 18–27). Upon feeding with 10% of the equivalent volume of the bioreactor, the dissolved sulfides gradually increased, reaching concentrations close to 33 mg/L. The increase in the fresh medium feed may be related to the reactivation of the sulfidogenic activity of the consortium after more than 34 days of cultivation.
The bioreactor R2 was subjected to a semi-continuous regime in the second stage of operation with operating conditions spanning periods V through XIII (Table 6). The pH and HRT were modified in response to sulfidogenic productivity. During this stage, the bioreactor was initially fed with fresh medium at a pH of 7.1, representing 10% of the total volume of the bioreactor on day 70 (Figure 11). The H2S concentration increased gradually until day 86, at which point, the pH of the feed was increased to pH 8.5 due to stagnant sulfidogenic productivity. This change resulted in a gradual increase in the concentration of H2S and pH of the effluent until day 128. In period VII (days 128–139), the volume of feed was increased to 20%, and the pH of the supplied medium was increased to pH 8.9, resulting in a considerable increase in productivity. The feed volume was increased again to 30% of the total volume until day 147. After this period, a recirculated batch maintenance phase was initiated, extending until day 167, after which the feed was resumed with 30% of the total useful volume of the bioreactor. The HRT was reduced in the subsequent periods to increase both the substrate/consortium contact and the volumetric productivity of H2S.
These findings suggest that the sulfides production was influenced by the percentage of fresh medium feed and its pH, the quantity of organic matter present in the feed and the HRT of the recirculation. H2S production gradually increased, peaking at 310 mg/L, which corresponds to volumetric productivity of 2.75 mol/m3∙day. Effluent pH values suggest clear acidification in the internal environment, which may be linked to fermentation processes generated by the microbial consortium.

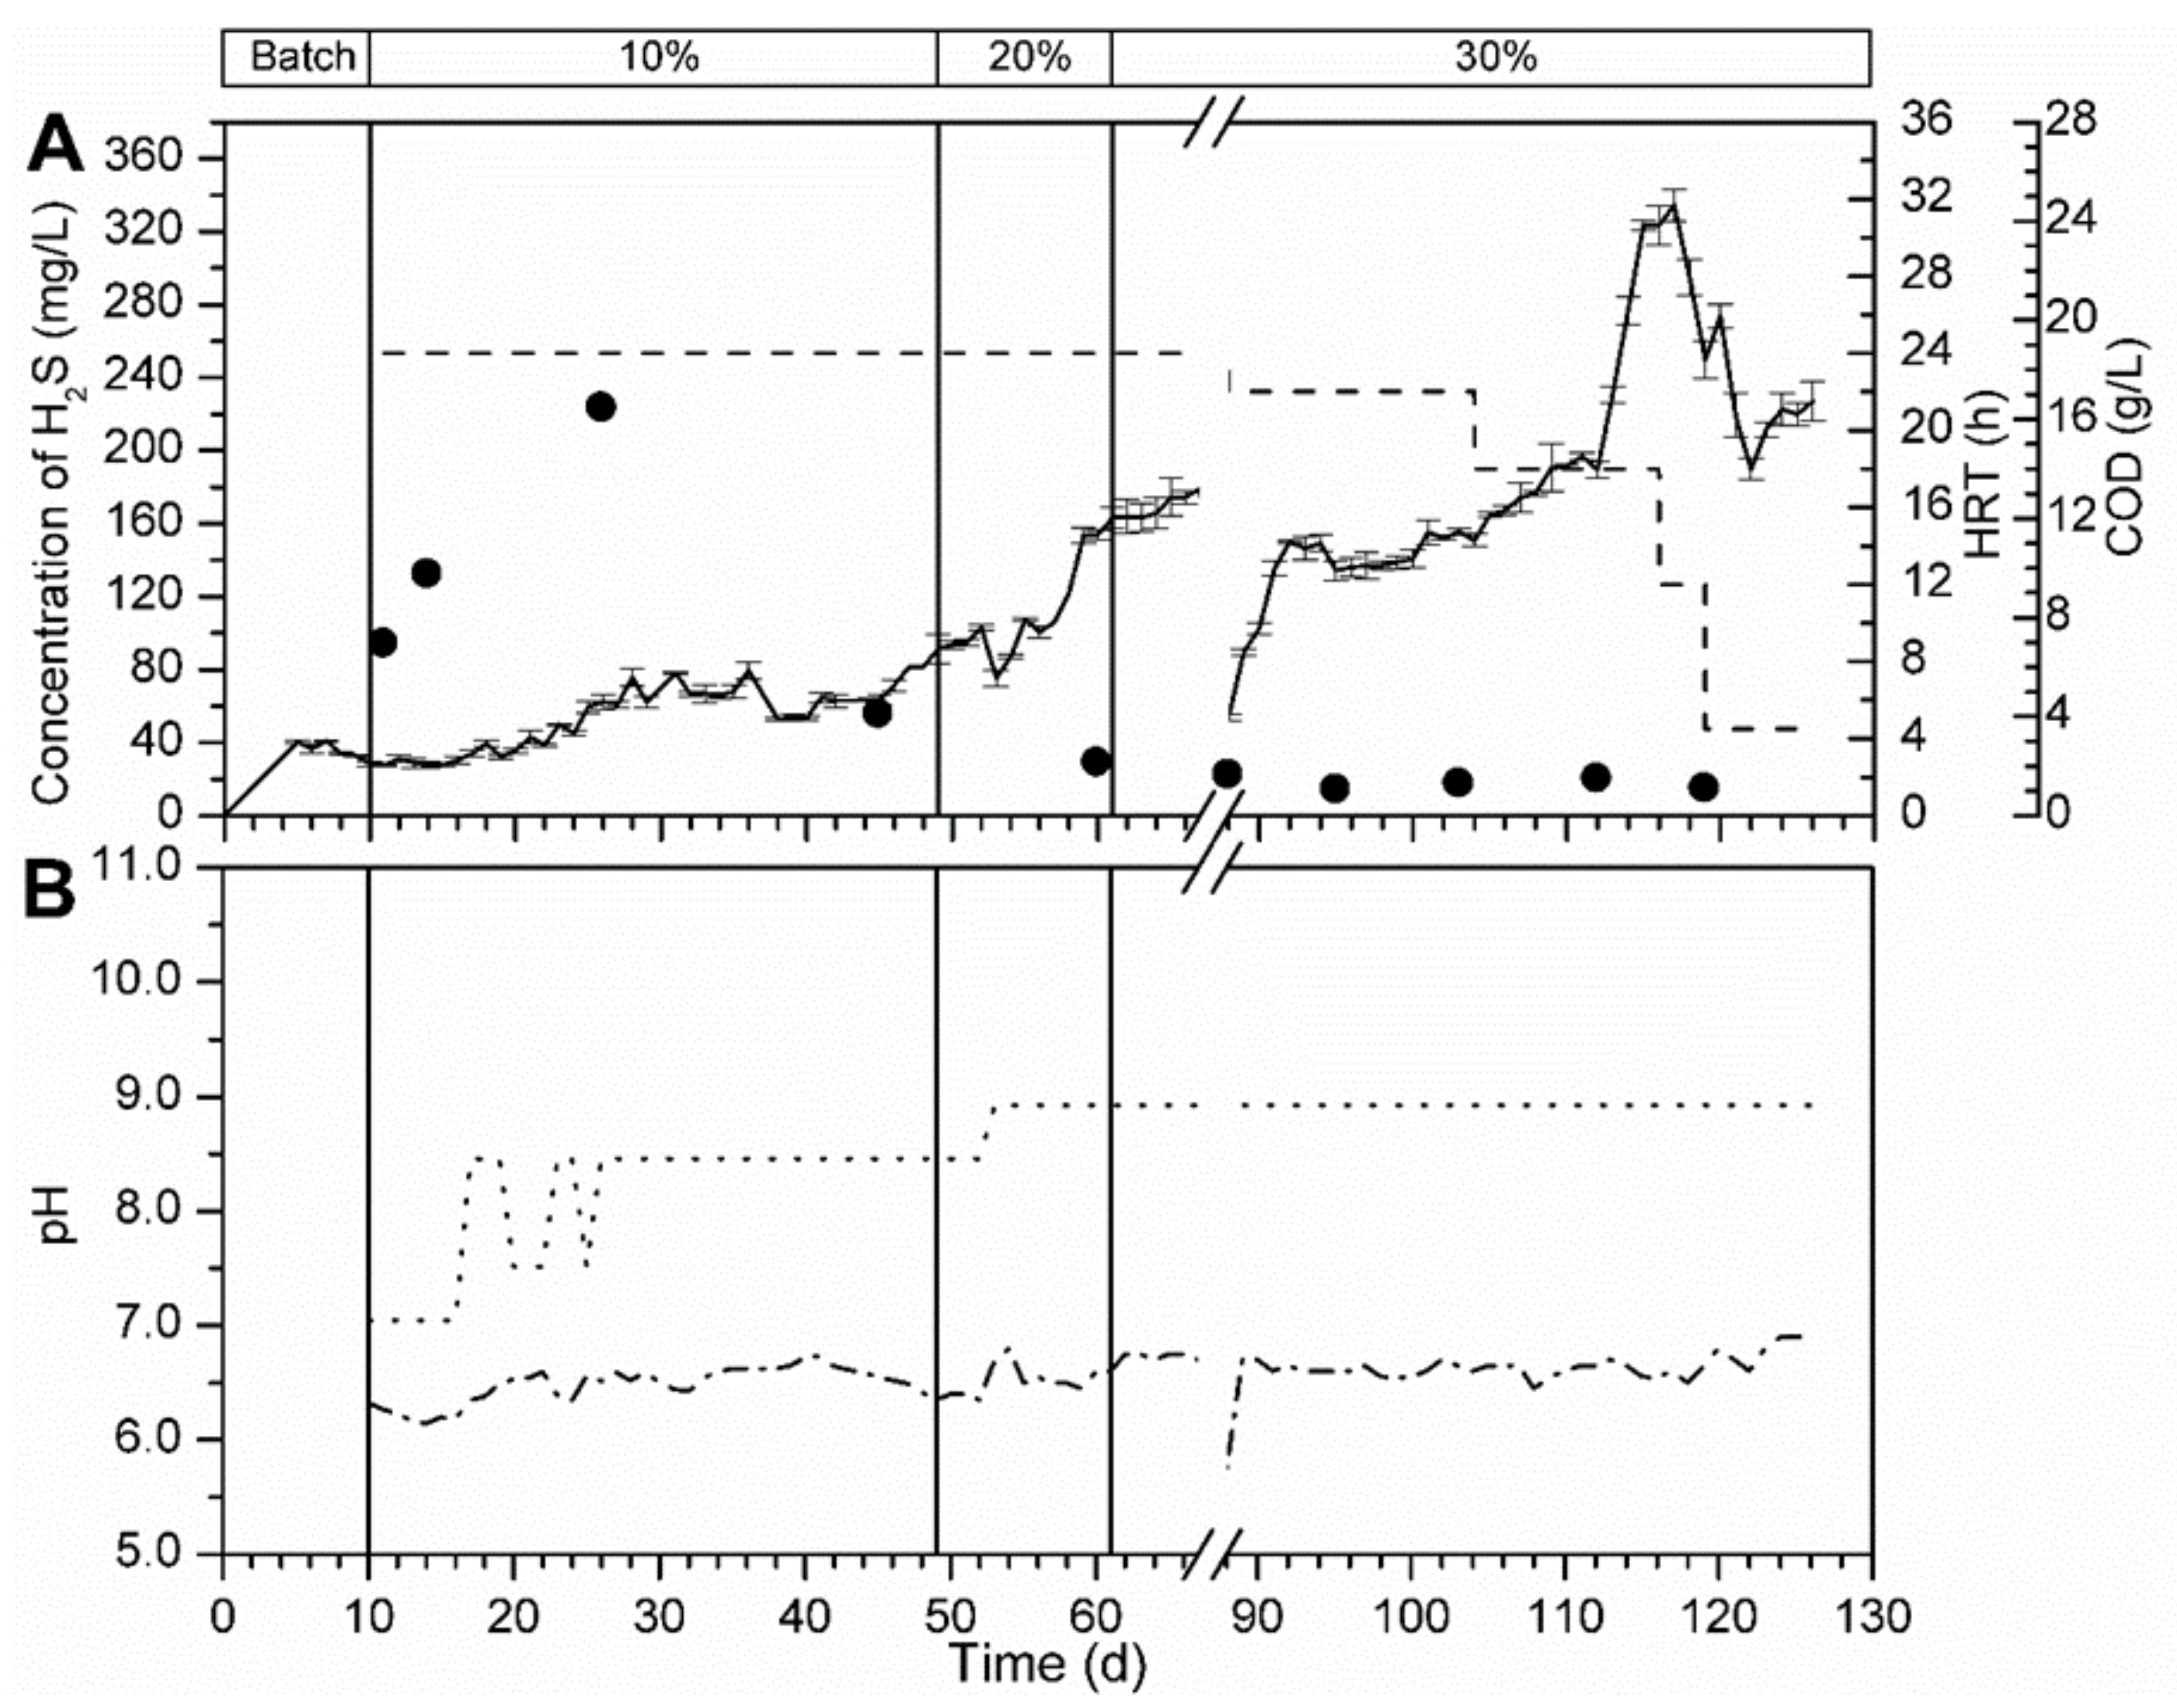
3.5.3. Bioreactor R3 Filled with Celite™ R-635 and Fed with Spirulina

The third bioreactor, R3, was operated under three different regimes: batch, recirculated batch, and semi-continuous. The operating conditions for each experimental period are presented in Table 7. The batch and recirculated batch phases lasted only nine days, where H2S levels near 40 mg/L were reached (Figure 12). This reduction in start-up time was achieved thanks to the experience acquired in the operation of bioreactors R1 and R2. On day 10, feeding with 10% of the total volume began, resulting in an increase in sulfide concentration and a decrease in effluent pH. Subsequently, feeding with a pH of 8.5 began on day 17, leading to an increase in sulfidogenic activity and a decrease in COD on day 46. At this time, the feed volume and pH were increased to 20% and 8.9, respectively, resulting in an improvement in H2S productivity. The feed volume was again increased to 30%. On day 67, a recirculated batch feeding period began, which lasted until day 88. After this period, the supply was resumed with the fresh medium of 30% of the total volume of the bioreactor. In the later stages, the HRT was decreased, leading to an increase in both the substrate/consortium contact and the volumetric productivity of H2S. Therefore, sulfide production is clearly related to the feed volume of the medium (organic matter available) and the supplied pH, while recirculation HRT is crucial for increasing sulfidogenic activity. Acidification of the medium was also observed in this bioreactor. A gradual increase in the H2S volumetric productivity was observed, reaching a maximum of 2.94 mol/m3∙day.

4. Discussion

This study has demonstrated the potential of a microbial sulfur-reducing consortium for the biogenic production of hydrogen sulfide during the start-up phase of bioreactors with immobilized biomass. This process presents a cost-effective alternative for metal recovery through the generation of sulfides using elemental sulfur as the final electron acceptor and complex organic compounds as a source of carbon and energy.
The current literature mainly focuses on finding new complex carbon and energy sources for sulfate-reducing bacteria. However, information is scarce on the case of sulfur-reducing bacteria. Some of the electron donors for the SRB include cellulose waste, wood chips, sawdust, manure, sugarcane waste, mushroom compost, cut rice straw, creek sediment, algae, peat moss, waste from the wine industry, cheese whey, and molasses [23,24,25,26,27,28,29,30,31,32]. These sources have yielded high volumetric productivities of H2S (ranging from 3 to 677 mol/m3∙day) [24]. It is important to note that volumetric productivity depends on various factors, such as bioreactor design, inoculum origin, operating conditions and substrate used.
In this study, we assessed the potential use of two organic substrate models as electron donors in S°RB, such as cellulose and Spirulina. Serial subcultures were conducted to enrich the sulfur-reducing consortia. Cellulose was used as a model substrate of vegetable waste [33]. Spirulina is a photosynthetic cyanobacterium used mainly as a supplement due to its high nutritional value, with a high percentage of proteins and, to a lesser extent, carbohydrates, fatty acids, and minerals [34].
It is known that the complex substrates studied cannot be used directly by the sulfate and sulfur-reducing bacteria [1,13]. Therefore, it can be inferred that in the different enriched microbial consortia, there should be one or more bacterial groups capable of hydrolyzing and degrading these compounds to generate easily degradable substrates for S°RB. In this work, the quantitative analysis of H2S production showed a significantly higher production for Spirulina (27.43 ± 4.23 mg/L) compared to cultures grown in cellulose (14.66 ± 2.21 mg/L) during the days of maximum sulfidogenic productivity.
A thorough understanding of the microbial community structure is crucial for the development of an efficient bioprocess for hydrogen sulfide production by a microbial consortium using different complex substrates. Previous studies have highlighted the importance of the composition of the microbial community composition for anaerobic reactor stability and performance [12,35]. Therefore, in this study, the microbial community present in the sulfidogenic consortium was determined using FISH for the different organic substrates tested. The presence of halophilic Archaea is essential since the culture medium had high salinity, which favors the development of these microorganisms [36,37]. However, the presence of methanogenic Archaea cannot also be ruled out, mainly due to the culture conditions of the consortium [35,38]. Proteobacteria comprise the largest and most diverse group of bacteria of the microbial consortium [20,39]. Furthermore, bacteria from the Cytophaga-Flavobacterium group were also detected, which includes bacteria capable of degrading cellulosic compounds [36]. While most of the identified microorganisms may allow the degradation of complex organic substrates, it is difficult to attribute a specific role to the identified bacterial groups. Notably, the dominant group in the bacterial consortium for all the substrates studied is the δ-Proteobacteria group, as most of the sulfidogenic microorganisms belong to this group [1,14]. However, the presence of other bacterial groups, different from sulfur reducers, must also be considered since they may influence the sulfur reduction process through competition or syntrophy [12]. These findings highlight the need for a detailed study of the microbial diversity within the consortium and the possible structural manipulation of the microbial community to produce a more robust start-up stage.
The anaerobic hydrolysis of organic matter is a crucial step in its degradation [1]. Spirulina, which contains polysaccharides and free sugars, is expected to be easily de-gradable due to its composition. However, during cultivation, a significant decrease in sulfidogenic productivity was observed. Conversely, cultures with cellulose showed lower productivity but sustained it over time due to the complex catabolic process involved in the anaerobic degradation of cellulose, which requires the participation of many microorganisms [40,41,42,43].
The production of hydrogen sulfide was not affected by NaCl concentrations between 0 and 120 g/L, indicating that the microbial consortium used in this study is halotolerant. The study results allowed the identification of the optimal NaCl concentrations in which the microbial consortium achieved the highest sulfidogenic productivity for the studied substrates. The optimal concentrations were 40 g/L for cellulose and 30 g/L for Spirulina. The amount of energy generated during the dissimilatory metabolism and the mode of osmotic adaptation used are the main factors determining whether a microorganism can grow under high concentrations of NaCl [37,44].
To achieve a high yield in H2S productivity, it was necessary to manage the culture parameters, with a particular focus on controlling pH levels. Generally, optimal growth pHs for sulfur-reducing bacteria (SRB) range from neutrality to relatively acidic pH, resulting in the majority of sulfidogenic bioreactors operating within this pH range [1,45,46]. However, it is of particular importance to study microbiology in environments with high salt concentrations and high pH, as there are currently many studies on sulfur-dissimilating bacteria in alkaline lakes and soils with pH levels of 9–10 [37,47,48]. Therefore, we determined the effect of pH on the production of H2S by the sulfurogenic consortium in test tubes using the different substrates studied. Under all pH conditions analyzed, it was possible to quantify H2S, indicating that the microbial consortium could grow and generate sulfides using the two substrates studied within a wide pH range (5.17–9.40). The H2S concentration at pH 9.40 was higher in Spirulina (84.0 mg/L) than in cellulose (5.0 mg/L H2S). When Spirulina was used as an electron donor, a clear trend of maximum sulfide production was observed at high pH (9.40). This effect on sulfidogenic productivity could be attributed to several factors, such as (i) the oxidation of organic molecules, with elemental sulfur acting as a reductant, is energetically more efficient at high salt concentrations and alkaline pH [37,47,48], (ii) the dominant sulfur species in a system with alkaline pH is the ionized form HS-, which favors the formation of polysulfides (the reactive species in the sulfur reduction process) [8,49,50,51,52], and (iii) the ionic form HS- has the lowest toxicity among sulfides (H2S, HS, S2−) at the studied pH levels [1,6,52]. It has also been reported that pH is one of the factors influencing the efficiency of sulfate-reducing bioprocesses, affecting the growth and activity of SRB, such that at high pH (>8), these microorganisms are favored over methanogens [52].
In this study, Celite R-635 was chosen as an inert support for establishing the sulfidogenic consortium in bioreactors due to its innocuous nature towards the microbial consortium, and it has been reported as one of the most suitable materials for biomass immobilization in the literature [53,54]. The formation of microbial biofilms on supports provides significant advantages to the bioprocess, such as an increase in biomass within a bioreactor, making solids retention times (SRT) independent of hydraulic retention times (HRT), which improves mixing and contact between effluent and biomass [1,52,55]. In addition, the high population density and the spatial distribution of the microbial biofilms facilitate syntrophic metabolism and provide a protective microenvironment for the microorganisms [56]. The support material’s ability to retain a large amount of biomass is crucial for the design of a fixed bed bioreactor, affecting both its volumetric productivity and rapid establishment, which reduces the start-up period of the bioreactor [52,54].
During the first operational stage of the bioreactors, optimal parameters and times were determined for the establishment of an active biofilm of the sulfur-reducing consortium. It has been reported that the biofilm’s maturation over long periods determines the performance of the system [35,57]. In the second stage, the factors involved in the increase in H2S production were investigated by progressively increasing the daily organic load to stimulate both the growth of the biofilm and the volumetric productivity of H2S. A conventional strategy used to increase the organic load without increasing shear stress was to progressively increase the feed volume to the bioreactors, which promoted the accumulation of biofilms and minimized detachment [54]. However, the increase in organic load must be carefully monitored to avoid overloading the system with organic matter, leading to sulfidogenic inhibition and the subsequent failure of the start-up process [14,57]. Another method used to refine the operational parameters of the bioreactors was to decrease the HRT in the final periods of their operation, which promoted competition for the substrate between the suspended or planktonic biomass and the biofilm biomass [14,57].
In broad terms, the hydrogen sulfide levels in the bioreactors gradually increased after biofilm establishment and the associated operational changes. This study was able to achieve H2S volumetric productivities of approximately 3 mol/m3∙day of H2S, which are comparable to those described in the literature that uses complex organic substrates [24]. It was also possible to reduce the start-up times of the sulfidogenic bioreactors. However, low pH values in the effluents were one of the challenges encountered. Acid metabolites produced by the degradation and fermentation of complex organic substrates (such as polysaccharides) contributed to the increase in acidity in the bioreactor culture medium [58,59].
In conclusion, this research successfully enriched sulfidogenic microbial consortia with the potential to degrade complex organic compounds, such as cellulose and Spirulina, achieving high volumetric productivity. This biological sulfur reduction system has great potential for developing technology to treat industrial effluents contaminated with heavy metals. Therefore, there is a need to continue studying this bioprocess, focusing mainly on increasing sulfidogenic productivity, and improving knowledge of start-up periods.

Author Contributions

Conceptualization, C.M. and D.C.; methodology, C.M. and P.V.; validation, C.M. and P.V.; formal analysis, C.M.; investigation, C.M. and P.V.; resources, D.C.; data curation, C.M., F.C. and D.C.; writing—original draft preparation, C.M. and F.C.; writing—review and editing, C.M., P.V., F.C. and D.C.; supervision, P.V. and D.C.; project administration, D.C. All authors have read and agreed to the published version of the manuscript.

Funding

This research received no external funding.

Data Availability Statement

Not applicable.

Conflicts of Interest

The authors declare no conflict of interest.

References

  1. Sheoran, A.S.; Sheoran, V.; Choudhary, R.P. Bioremediation of acid-rock drainage by sulphate-reducing prokaryotes: A review. Miner. Eng. 2010, 23, 1073–1100. [Google Scholar] [CrossRef]
  2. Barakat, M.A. New trends in removing heavy metals from industrial wastewater. Arab. J. Chem. 2011, 4, 361–377. [Google Scholar] [CrossRef]
  3. Fu, F.; Wang, Q. Removal of heavy metal ions from wastewaters: A review. J. Environ. Manag. 2011, 92, 407–418. [Google Scholar] [CrossRef] [PubMed]
  4. Hashim, M.A.; Mukhopadhyay, S.; Sahu, J.N.; Sengupta, B. Remediation technologies for heavy metal contaminated groundwater. J. Environ. Manag. 2011, 92, 2355–2388. [Google Scholar] [CrossRef] [PubMed]
  5. Verma, A.; Dua, R.; Singh, A.; Bishnoi, N.R. Biogenic sulfides for sequestration of Cr (VI), COD and sulfate from synthetic wastewater. Water Sci. 2015, 29, 19–25. [Google Scholar] [CrossRef]
  6. Lewis, A.E. Review of metal sulphide precipitation. Hydrometallurgy 2010, 104, 222–234. [Google Scholar] [CrossRef]
  7. Pohl, A. Removal of heavy metal ions from water and wastewaters by sulfur-containing precipitation agents. Water Air Soil Poll. 2020, 231, 503. [Google Scholar] [CrossRef]
  8. Huisman, J.L.; Schouten, G.; Schultz, C. Biologically produced sulphide for purification of process streams, effluent treatment and recovery of metals in the metal and mining industry. Hydrometallurgy 2006, 83, 106–113. [Google Scholar] [CrossRef]
  9. Cohen, R.R.H. Use of microbes for cost reduction of metal removal from metals and mining industry waste streams. J. Clean. Prod. 2006, 14, 1146–1157. [Google Scholar] [CrossRef]
  10. Cotoras, D.; Valenzuela, F.; Zarzar, M.E.; Viedma, P.L. Plant for the Removal of Metals by Biosorption from Mining or Industrial Effluents. U.S. Patent 7,479,220, 20 January 2009. [Google Scholar]
  11. Cotoras, D.; Viedma, P.L. Bacterial Strain for a Metal Biosorption Process. U.S. Patent 7,951,578, 31 May 2011. [Google Scholar]
  12. Geets, J.; Vangronsveld, J.; Diels, L.; Taghavi, S.; van der Lelie, D. Microbial activities, monitoring and application as part of a management strategy for heavy metal-contaminated soil and ground water. Dev. Soil Sci. 2008, 32, 521–559. [Google Scholar] [CrossRef]
  13. Rabus, R.; Hansen, T.A.; Widdel, F. Dissimilatory sulfate- and sulfur-reducing prokaryotes. In The Prokaryotes: Ecophysiology and Biochemistry; Dworkin, M., Falkow, S., Rosenberg, E., Schleifer, K.-H., Stackebrandt, E., Eds.; Springer: New York, NY, USA, 2006; Volume 2, pp. 659–768. [Google Scholar]
  14. Muyzer, G.; Stams, A.J.M. The ecology and biotechnology of sulphate-reducing bacteria. Nat. Rev. Microbiol. 2008, 6, 441–454. [Google Scholar] [CrossRef] [PubMed]
  15. Guo, J.; Wang, J.; Qiu, Y.; Sun, J.; Jiang, F. Realizing a high-rate sulfidogenic reactor driven by sulfur-reducing bacteria with organic substrate dosage minimization and cost-effectiveness maximization. Chemosphere 2019, 236, 124381. [Google Scholar] [CrossRef] [PubMed]
  16. Sun, R.; Li, Y.; Lin, N.; Ou, C.; Wang, X.; Zhang, L.; Jiang, F. Removal of heavy metals using a novel sulfidogenic AMD treatment system with sulfur reduction: Configuration, performance, critical parameters and economic analysis. Environ. Int. 2020, 136, 105457. [Google Scholar] [CrossRef]
  17. Li, G.; Liang, Z.; Sun, J.; Qiu, Y.; Qiu, C.; Liang, X.; Zhu, Y.; Wang, P.; Li, Y.; Jiang, F. A pilot-scale sulfur-based sulfidogenic system for the treatment of Cu-laden electroplating wastewater using real domestic sewage as electron donor. Water Res. 2021, 195, 116999. [Google Scholar] [CrossRef]
  18. Zhang, L.; Qiu, Y.Y.; Zhou, Y.; Chen, G.H.; van Loosdrecht, M.C.; Jiang, F. Elemental sulfur as electron donor and/or acceptor: Mechanisms, applications and perspectives for biological water and wastewater treatment. Water Res. 2021, 202, 117373. [Google Scholar] [CrossRef] [PubMed]
  19. Postgate, J.R. The Sulphate-Reducing Bacteria, 2nd ed.; Cambridge University Press: Cambridge, UK; New York, NY, USA, 1984. [Google Scholar]
  20. Amann, R.I.; Ludwig, W.; Schleifer, K.H.; Amann, R.I.; Ludwig, W. Phylogenetic identification and in situ detection of individual microbial cells without cultivation. Microbiol. Rev. 1995, 59, 143–169. [Google Scholar] [CrossRef] [PubMed]
  21. Abràmofff, M.D.; Magalhães, P.J.; Ram, S.J. Image processing with ImageJ Part II. Biophotonics Int. 2005, 11, 36–43. [Google Scholar]
  22. APHA/AWWA/WEF. Standard Methods for the Examination of Water and Wastewater; American Public Health Association: Washington, DC, USA, 1999; pp. 1–541. [Google Scholar]
  23. Choudhary, R.P.; Sheoran, A.S. Comparative study of cellulose waste versus organic waste as substrate in a sulfate reducing bioreactor. Bioresour. Technol. 2011, 102, 4319–4324. [Google Scholar] [CrossRef]
  24. McMahon, M. Development of a Sulfate Reducing Packed Bed Bioreactor for Use in a Sustainable Hydrogen Production Process. Master’s Thesis, Queen’s University, Kingston, ON, Canada, 2007. [Google Scholar]
  25. Neculita, C.M.; Yim, G.J.; Lee, G.; Ji, S.W.; Jung, J.W.; Park, H.S.; Song, H. Comparative effectiveness of mixed organic substrates to mushroom compost for treatment of mine drainage in passive bioreactors. Chemosphere 2011, 83, 76–82. [Google Scholar] [CrossRef]
  26. Ayala-Parra, P.; Sierra-Alvarez, R.; Field, J.A. Algae as an electron donor promoting sulfate reduction for the bioremediaton of acid rock drainage. J. Hazard. Mater. 2016, 317, 335–343. [Google Scholar] [CrossRef]
  27. Márquez-Reyes, J.M.; López-Chuken, U.J.; Valdez-González, A.; Luna-Olvera, H.A. Removal of chromium and lead by a sulfate-reducing consortium using peat moss as carbon source. Bioresour. Technol. 2013, 144, 128–134. [Google Scholar] [CrossRef] [PubMed]
  28. Zhang, M.; Wang, H. Biological treatment of acidic coal refuse using sulphate-reducing bacteria with chicken manure as carbon source. Environ. Technol. 2014, 35, 2947–2955. [Google Scholar] [CrossRef] [PubMed]
  29. Martins, M.; Faleiro, M.L.; Barros, R.J.; Veríssimo, A.R.; Costa, M.C. Biological sulphate reduction using food industry wastes as carbon sources. Biodegradation 2009, 20, 559–567. [Google Scholar] [CrossRef] [PubMed]
  30. Teclu, D.; Tivchev, G.; Laing, M.; Wallis, M. Determination of the elemental composition of molasses and its suitability as carbon source for growth of sulphate-reducing bacteria. J. Hazard. Mater. 2009, 161, 1157–1165. [Google Scholar] [CrossRef] [PubMed]
  31. Boshoff, G.; Duncan, J.; Rose, P.D. The use of micro-algal biomass as a carbon source for biological sulphate reducing systems. Water Res. 2004, 38, 2659–2666. [Google Scholar] [CrossRef]
  32. Hurtado, C.; Viedma, P.; Cotoras, D. Design of a bioprocess for metal and sulfate removal from acid mine drainage. Hydrometallurgy 2018, 180, 72–77. [Google Scholar] [CrossRef]
  33. Vasquez, Y.; Escobar, M.C.; Saenz, J.S.; Quiceno-Vallejo, M.F.; Neculita, C.M.; Arbeli, Z.; Roldan, F. Effect of hydraulic retention time on microbial community in biochemical passive reactors during treatment of acid mine drainage. Bioresour. Technol. 2018, 247, 624–632. [Google Scholar] [CrossRef]
  34. Markou, G.; Georgakakis, D. Cultivation of filamentous cyanobacteria (blue-green algae) in agro-industrial wastes and wastewaters: A review. Appl. Energy 2011, 88, 3389–3401. [Google Scholar] [CrossRef]
  35. Celis, L.; Villa-Gómez, D.; Alpuche-Solís, A.; Ortega-Morales, B.; Razo-Flores, E. Characterization of sulfate-reducing bacteria dominated surface communities during start-up of a down-flow fluidized bed reactor. J. Ind. Microbiol. Biot. 2009, 36, 111–121. [Google Scholar] [CrossRef]
  36. Brock, T.D.; Madigan, M.T.; Martinko, J.M.; Parker, J. Brock Biology of Microorganisms; Prentice-Hall: Upper Saddle River, NJ, USA, 2003. [Google Scholar]
  37. Oren, A. Thermodynamic limits to microbial life at high salt concentrations. Environ. Microbiol. 2011, 13, 1908–1923. [Google Scholar] [CrossRef]
  38. Liamleam, W.; Annachhatre, A. Electron donors for biological sulfate reduction. Biotechnol. Adv. 2007, 25, 452–463. [Google Scholar] [CrossRef] [PubMed]
  39. Kersters, K.; De Vos, P.; Gillis, M.; Swings, J.; Vandamme, P.; Stackebrandt, E. Introduction to the Proteobacteria. In The Prokaryotes; Dworkin, M., Falkow, S., Rosenberg, E., Schleifer, K.H., Stackebrandt, E., Eds.; Springer: New York, NY, USA, 2006; pp. 3–37. [Google Scholar]
  40. Leschine, S.B. Cellulose degradation in anaerobic environments. Annu. Rev. Microbiol. 1995, 49, 399–426. [Google Scholar] [CrossRef] [PubMed]
  41. Dumova, V.A.; Kruglov, Y.V. A cellulose-decomposing bacterial association. Microbiology 2009, 78, 234–239. [Google Scholar] [CrossRef]
  42. Singh, G.; Chandoha-Lee, C.; Zhang, W.; Renneckar, S.; Vikesland, P.J.; Pruden, A. Biodegradation of nanocrystalline cellulose by two environmentally-relevant consortia. Water Res. 2016, 104, 137–146. [Google Scholar] [CrossRef] [PubMed]
  43. Strang, O.; Ács, N.; Wirth, R.; Maróti, G.; Bagi, Z.; Rákhely, G.; Kovács, K.L. Bioaugmentation of the thermophilic anaerobic biodegradation of cellulose and corn stover. Anaerobe 2017, 46, 104–113. [Google Scholar] [CrossRef] [PubMed]
  44. Oren, A. Bioenergetic aspects of halophilism. Microbiol. Mol. Biol. Rev. 1999, 63, 334–348. [Google Scholar] [CrossRef]
  45. Tang, K.; Baskaran, V.; Nemati, M. Bacteria of the sulphur cycle: An overview of microbiology, biokinetics and their role in petroleum and mining industries. Biochem. Eng. J. 2009, 44, 73–94. [Google Scholar] [CrossRef]
  46. Yuan, C.L.; Zhang, L.M.; Wang, J.T.; Hu, H.W.; Shen, J.P.; Cao, P.; He, J.Z. Distributions and environmental drivers of archaea and bacteria in paddy soils. J. Soils Sediments 2019, 19, 23–37. [Google Scholar] [CrossRef]
  47. Sorokin, D.Y.; Rusanov, I.I.; Pimenov, N.V.; Tourova, T.P.; Abbas, B.; Muyzer, G. Sulfidogenesis under extremely haloalkaline conditions in soda lakes of Kulunda Steppe (Altai, Russia). FEMS Microbiol. Ecol. 2010, 73, 278–290. [Google Scholar] [CrossRef]
  48. Sorokin, D.Y.; Kuenen, J.G.; Muyzer, G. The microbial sulfur cycle at extremely haloalkaline conditions of soda lakes. Front. Microbiol. 2011, 2, 44. [Google Scholar] [CrossRef]
  49. Schauder, R.; Müller, E. Polysulfide as a possible substrate for sulfur-reducing bacteria. Arch. Microbiol. 1993, 160, 377–382. [Google Scholar] [CrossRef]
  50. Florentino, A.P.; Pereira, I.A.; Boeren, S.; van den Born, M.; Stams, A.J.; Sánchez-Andrea, I. Insight into the sulfur metabolism of Desulfurella amilsii by differential proteomics. Environ. Microbiol. 2019, 21, 209–225. [Google Scholar] [CrossRef]
  51. Wu, C.H.; Schut, G.J.; Poole, F.L.; Haja, D.K.; Adams, M.W.W. Characterization of membrane-bound sulfane reductase: A missing link in the evolution of modern day respiratory complexes. J. Biol. Chem. 2018, 293, 16687–16696. [Google Scholar] [CrossRef]
  52. Kaksonen, A.H.; Puhakka, J.A. Sulfate reduction based bioprocesses for the treatment of acid mine drainage and the recovery of metals. Eng. Life Sci. 2007, 7, 541–564. [Google Scholar] [CrossRef]
  53. Durham, D.; Marshall, L.; Miller, J.; Chmurny, A. Characterization of inorganic biocarriers that moderate system upsets during fixed-film biotreatment processes. Appl. Environ. Microb. 1994, 60, 3329–3335. [Google Scholar] [CrossRef] [PubMed]
  54. McMahon, M.; Daugulis, A. Enhancement of biogenic sulfide production in a packed-bed bioreactor via critical inoculum design and carrier material selection. Biotechnol. Bioeng. 2008, 100, 855–863. [Google Scholar] [CrossRef] [PubMed]
  55. Kousi, P.; Remoundaki, E.; Hatzikioseyian, A.; Battaglia-Brunet, F.; Joulian, C.; Kousteni, V.; Tsezos, M. Metal precipitation in an ethanol-fed, fixed-bed sulphate-reducing bioreactor. J. Hazard. Mater. 2011, 189, 677–684. [Google Scholar] [CrossRef]
  56. de Beer, D.; Stoodley, P. Microbial Biofilms. In The Prokaryotes: Symbiotic Associations, Biotechnology, Applied Microbiology, 3rd ed.; Dworkin, M., Falkow, S., Rosenberg, E., Schleifer, K.-H., Stackebrandt, E., Eds.; Springer: New York, NY, USA, 2006; Volume 1, pp. 904–937. [Google Scholar]
  57. Escudié, R.; Cresson, R.; Delgenès, J.P.; Bernet, N. Control of start-up and operation of anaerobic biofilm reactors: An overview of 15 years of research. Water Res. 2011, 45, 1–10. [Google Scholar] [CrossRef]
  58. Lyberatos, G.; Pullammanappallil, P.C. Anaerobic digestion in suspended growth bioreactors. In Environmental Biotechnology, Handbook of Environmental Engineering; Wang, L.K., Ivanov, V., Tay, J.H., Eds.; Humana Press: Totowa, NJ, USA, 2010; Volume 10, pp. 395–438. [Google Scholar]
  59. Guyot, J.P.; Calderon, M.; Morlon-Guyot, J. Effect of pH control on lactic acid fermentation of starch by Lactobacillus manihotivorans LMG 18010. J. Appl. Microbiol. 2000, 88, 176–182. [Google Scholar] [CrossRef]
Figure 1. Simplified flowchart of the fixed bed bioreactor used in the three assays. Each bioreactor was filled with the respective support.
Mining 03 00015 g001
Figure 2. Production of H2S by the microbial consortium, grown with cellulose and Spirulina for 14 and 8 days, respectively. The values are plotted as the means ± standard deviation. The averages had significantly different (Duncan, p < 0.05).
Mining 03 00015 g002
Figure 3. Hybridization in situ of the sulfur-reducing microbial consortium in a culture medium with cellulose (A) and Spirulina (B). The percentages of each of the groups, labeled with the specific probes, are shown relative to the total microorganisms labeled with DAPI. Values are plotted as the means ± standard deviation between the percentages of probe-labeled microorganisms obtained from at least three distinct images.
Mining 03 00015 g003
Figure 4. Effect of NaCl on the H2S production by the microbial consortium grown with cellulose as a substrate during 10 days of culture. Symbols: , day 4; □, day 7 and ∆ day 10. The values are plotted as the means ± standard deviation. No significant differences were observed, according to Duncan’s test (p < 0.05).
Mining 03 00015 g004
Figure 5. Effect of NaCl on the H2S production by the microbial consortium grown with Spirulina as a substrate during 10 days of culture. Symbols: , day 4; □, day 7 and ∆ day 10. The values are plotted as the means ± standard deviation. No significant differences were observed, according to Duncan’s test (p < 0.05).
Mining 03 00015 g005
Figure 6. Effect of pH on the H2S production by the microbial consortium grown with cellulose as a substrate during 21 days of culture. Symbols: , day 5; □, day 8; ◊, day 14 and ∆, day 21. The values are plotted as the means ± standard deviation. (a) Means determined on the same day followed by equal letters are not statistically different, according to Duncan’s test (p < 0.05).
Mining 03 00015 g006
Figure 7. Effect of pH on the H2S production by the microbial consortium grown with Spirulina as a substrate during 21 days of culture. Symbols: , day 5; □, day 8; ◊, day 14 and ∆, day 21. The values are plotted as the means ± standard deviation. (a, b) The average values with the same letter are not statistically different, except the means of day 21 of culture (Duncan, p < 0.05).
Mining 03 00015 g007
Figure 8. The performance profile of bioreactor R1 (Celite R-635 and cellulose fed) during the first stage of start-up of the bioreactor. The concentration values of H2S have been plotted as means ± standard deviation. The vertical line and the upper box in each figure represent the change in operating mode and the feed rate relative to the total volume of the bioreactor. Symbols: ───, concentration of H2S; − − −, pH in feed; --- effluent pH. RC: recirculated bioreactor.
Mining 03 00015 g008
Figure 9. The performance profile of bioreactor R1 (Celite R-635 and cellulose fed) during the second stage of start-up of the bioreactor. Concentration of H2S, HRT and COD (A). Effluent pH and pH in feed (B). The concentration values of H2S have been plotted as means ± standard deviation. The continuous vertical line and the upper box in each figure represent the change in the mode of operation and the percentage of feed with respect to the total volume of the bioreactor. The interval (//) represents a recirculated batch operation time in which there was no parameter determination. Symbols: ───, concentration of H2S; − − −, HRT; ● COD; ∙∙∙, pH in feed; −∙−, effluent pH.
Mining 03 00015 g009
Figure 10. The performance profile of bioreactor R2 (without the support and Spirulina fed) during the first stage of start-up of the bioreactor. The concentration values of H2S have been plotted as means ± standard deviation. The continuous vertical line and the upper box in each figure represent the change in the mode of operation and the percentage of feed with respect to the total volume of the bioreactor. Symbols: ───, concentration of H2S; − − −, pH in feed; --- effluent pH.
Mining 03 00015 g010
Figure 11. The performance profile of bioreactor R2 (without the support and Spirulina fed) during the second stage of start-up of the bioreactor. Concentration of H2S, HRT and COD (A). Effluent pH and pH in feed (B). The concentration values of H2S have been plotted as means ± standard deviation. The continuous vertical line and the upper box in each figure represent the change in operating mode and the feed rate relative to the total volume of the bioreactor. The interval (//) represents a recirculated batch operation time in which there was no parameter determination. Symbols: ───, concentration of H2S; − − −, HRT; ● COD; ∙∙∙, pH in feed; −∙−, effluent pH.
Mining 03 00015 g011
Figure 12. The performance profile of the R3 bioreactor (Celite R-635 and Spirulina fed) during the bioreactor start-up phase. Concentration of H2S, HRT and COD (A). Effluent pH and pH in feed (B). The concentration values of H2S have been plotted as means ± standard deviation. The continuous vertical line and the upper box in each figure represent the change in operating mode and the feed rate relative to the total volume of the bioreactor. The interval (//) represents a recirculated batch operation time in which there was no parameter determination. Symbols: ───, concentration of H2S; − − −, HRT; ● COD; ∙∙∙, pH in feed; −∙−, effluent pH.
Mining 03 00015 g012
Table 1. Probes for FISH, their sequence, specificity, and position (regards to rRNA 16S of E. coli) in the rRNA [20].
ProbesSpecificity (rRNA, Position)Sequence
EUB338Bacteria (16S, 338–355)GCTGCCTCCCGTAGGAGT
ArchaeaArchaea (16S, 915–934)GTGCTCCCCCGCCAATTCCT
ALF1bα-Proteobacteria (16S, 19–35)CGTTCGYTCTGAGCCAG
BET42aβ-Proteobacteria (23S, 1027–1043)GCCTTCCCACTTCGTTT
GAM42aγ-Proteobacteria (23S, 1027–1043)GCCTTCCCACATCGTTT
SRB385δ-Proteobacteria (16S, 385–402)CGGCGTCGCTGCGTCAGG
CF319aCytophaga-Flavobacterium (16S, 319–336)TGGTCCGTGTCTCAGTAC
Table 2. Composition of hybridization solutions used for FISH.
ProbesFormamide
[%]
NaCl
[M]
Tris/HCl (pH 7.2)
[mM]
SDS
[%]
ALF1b/EUB338/Archaea200.9200.01
BET42a/GAM42a/
CF319a/SRB385
350.9200.01
Table 3. Composition of washing solutions used for FISH.
ProbesTris/HCl (pH 7.2) [mM]SDS [%]NaCl [M]EDTA [mM]
ALF1b/EUB338/Archaea200.0101805
BET42a/GAM42a/
CF319a/SRB385
200.021405
Table 4. Characteristics and substrates (electron donors) used in the bioreactors.
BioreactorSubstrateSupportWorking Volume (mL)Dimensions (cm)Operation Time (Days)
R1CelluloseCelite™ R-63541049 × 3.3233
R2Spirulina41049 × 3.3205
R3SpirulinaCelite™ R-63549649 × 3.6126
Table 5. Operating conditions for the bioreactor R1.
Experimental Period
ParameterIIIIIIIVVVIVIIVIIIIXXXIXIIXIII
Type of feeding *BatchBatch RC10%Batch10%10%20%30%Batch RC30%30%30%30%
Operation time (days)0–3031–4748–6869–9798–113114–155156–167168–174175–194195–210211–222223–225226–233
Operating Conditions
Flow (mL/min)--1.08-1.951.951.951.95-1.951.521.731.52
HRT recirculated (h)-4824-24242424222218124.5
pH7.17.17.17.17.18.58.98.98.98.98.98.98.9
* The percentage represents the equivalent feed volume of the bioreactor. RC: recirculated; HRT: Hydraulic retention time.
Table 6. Operating conditions for the bioreactor R2.
Experimental Period
ParameterIIIIIIIVVVIVIIVIIIIXXXIXIIXIII
Type of feeding (a)BatchBatch RC10%Batch10%10%20%30%Batch RC30%30%30%30%
Operation time (days)0–1819–2526–3738–6970–8889–127128–139140–147148–166167–182183–194195–197198–205
Operating Conditions
Flow (mL/min)--1.08-1.951.951.951.95-1.951.521.731.52
HRT recirculated (h)-4824-24242424222218124.5
pH7.17.17.17.17.18.58.98.98.98.98.98.98.9
(a) The percentage represents the equivalent feed volume of the bioreactor. RC: recirculated; HRT: Hydraulic retention time.
Table 7. Operating conditions for the bioreactor R3.
Experimental Period
ParameterIIIIIIIVVVIVIIVIIIIXXXI
Type of feeding (a)BatchBatch RC10%10%20%30%Batch RC30%30%30%30%
Operation time (days)0–67–910–1617–4849–6061–6768–8788–103104–115116–118119–126
Operating Conditions
Flow (mL/min)NDND1.081.081.951.95ND1.951.521.731.52
HRT recirculated (h)-4824242424222218124.5
pH7.17.17.18.58.98.98.98.98.98.98.9
(a) The percentage represents the equivalent feed volume of the bioreactor. RC: recirculated; HRT: Hydraulic retention time. ND: Not Determined.
Disclaimer/Publisher’s Note: The statements, opinions and data contained in all publications are solely those of the individual author(s) and contributor(s) and not of MDPI and/or the editor(s). MDPI and/or the editor(s) disclaim responsibility for any injury to people or property resulting from any ideas, methods, instructions or products referred to in the content.

