
A Comprehensive Review of Large Strain Consolidation Testing for Application in Oil Sands Mine Tailings


1
Department of Civil and Environmental Engineering, University of Alberta, Edmonton, AB T6G1H9, Canada
2
Centre for Oil Sands Sustainability, Northern Alberta Institute of Technology (NAIT), Edmonton, AB T5G 0Y2, Canada
*
Author to whom correspondence should be addressed.
Mining 2023, 3(1), 121-150; https://doi.org/10.3390/mining3010008
Submission received: 12 January 2023
/
Revised: 1 February 2023
/
Accepted: 27 February 2023
/
Published: 3 March 2023
Abstract
:Oil sand tailings are a mixture of sand, fines, water, and a residual amount of un-extracted bitumen in varying proportions. Tailings management is highly dependent on the consolidation behavior of the tailings. Although a great deal of work on this sector has been performed to study the consolidation behavior of oil sands tailings, it continues to play a critical role in quantifying the long-term geotechnical stability of tailings storage facilities. A review of large strain consolidation testing that exists, whether in the industry or in academia, has been compiled and presented in this manuscript to illustrate the advantages and drawbacks of measuring consolidation behavior of tailings using these tests. For oil sands mine tailings, it has been concluded that the conventional oedometer consolidation test can result in significant errors in quantifying the consolidation behavior. Conversely, testing procedures such as multi-step loading large strain consolidation tests, large slurry consolidometer tests, centrifuge testing, and seepage induced consolidation tests are widely employed to quantify the consolidation behavior of oil sands tailings.
1. Introduction
Alberta’s oil sands sector is critical in Canada’s economy and energy supply. Approximately 168 billion barrels of crude bitumen are currently known to exist in the Alberta’s oil sands, making it the world’s third-largest proven reserve [1]. Oil sands tailings comprise a mixture of mineral grains (e.g., sand, silt, and clay particles), water, and residual process aids and chemicals (e.g., bitumen, salts, etc.), and are the by-product of the extraction procedure that separates the oil from the mineral components. Surface mining is utilized to extract oil sands deposits much less than 75 m below the ground surface, whilst in-situ methods (ex., Cyclic Steam Stimulation and Steam-Assisted Gravity Drainage) are used to recover deeper deposits [1,2]. Alberta oil sands comprise three deposits known as Athabasca, Cold Lake and Peace River, and are buried beneath roughly 142,200 km2 of land in Northern Alberta [1]. A total of 500 km2 of the 142,200 km2 oil sands deposits in Northern Alberta currently undergoes surface mining activity, which represents 20% of the oil sands reserves [1]. Athabasca oil sand deposit is the largest of the three deposits, containing 5.6 × 10⁹ m3 (approximately 35 billion barrels) of surface mineable bitumen. The bitumen extraction technique from surface-mined ore utilizing the Clark Hot Water Separation process (CHWS), which was pioneered by Dr. Karl Clark in 1992 [2,3]. In this technique, warm water, mechanical energy, and process chemicals such as sodium hydroxide are used to extract bitumen from the oil sand ore. Large quantities of mineral suspensions are produced during the water-based extraction process of surface-mined ore. As an example, an extraction method involving hot water from surface-mined oil sands generates ~55% solids waste streams that are ~82% sand, and ~17% fines, assuming the oil sand ore has a 10 wt% bitumen content [2]. As a rule of thumb, for the surface mining method, every 1.0 m3 of the in-place oil sands ore will produce approximately 1.5 m3 of fluid fine tailings (FFT) [4]. In the Athabasca oil sands region, the volume of fluid tailings accumulated at the mine sites totals 1,360 million cubic meters (Mm3) by the year 2020 [5].
Bitumen extraction from oil sand ore generates three major tailings streams: coarse sand tailings (CST), fluid fine tailings (FFT), and froth-treatment tailings (FTT). Coarse sand tailings (CST) have low fine particles content (i.e., 5–10% fines) and water, and the solids are largely sand (>44 mm) with approximately 40–60 wt% solids [2,6,7]. Fluid fine tailings (FFT) refers to tailings that are predominately comprising fines (>80%) in a liquid suspension with a solid content greater than 2% (mass basis) and have an undrained shear strength below 5 kilopascals (kPa) [8,9]. It is generally observed that fluid fine tailings with a low initial solids content consolidate at a very slow rate. The very slow consolidation rate of fluid fine tailings can be attributed to the clay dispersion produced during the extraction process, which is a consequence of the chemical interaction between clay, water, and residual bitumen, resulting in a significant reduction in hydraulic conductivity of the FFT. Another issue with these clay-rich tailings is they are extremely weak with undrained strengths <5 kPa at surface, making it difficult to support a solid cap as an example. Additionally, the high water content means that, if capped, the deposits are expected to settle by tens of meters over centuries, a behavior unsuitable for sustainable terrestrial landforms after closure as the long-term settlement should be kept to a minimum (less than 0.5 to 2 m) [10,11].
Consolidation behavior is a key factor in understanding the settlement and strength gain in tailings deposits. The consolidation phenomenon is a mechanism by which the volume of soil decreases due to a progressive change in the stresses and the dissipation of excess pore water pressure in the soil, reducing its thickness. Therefore, settlement behavior and pore water pressure dissipation must be understood to evaluate the deposit volume of the tailings storage facilities, post-reclamation settlements, vertical stress distributions, and chemical mass loading.
The consolidation characteristics of the tailings are composed of two major functions: compressibility and hydraulic conductivity. Tailings compressibility is described as a non-linear relationship between void ratio and effective stress that serves as the foundation for calculating the settlement of the total amount of tailings in tailings ponds. Tailings hydraulic conductivity is typically a function of void ratio and is used to calculate the consolidation rate of tailings over time. Thus, high moisture content, low hydraulic conductivity, and high compressibility fine-grained mine tailings such as oil sand FFT will result in great volume reductions and prolonged consolidation rates [12,13,14]. Therefore, mine operators face challenges when it comes to predicting and understanding geotechnical stability such as consolidation behavior of slurry-like materials such as FFT in tailings ponds. As a result, the majority of mine operators use physical and/or chemical additives to enhance the geotechnical properties of their tailings prior to closure [15].
Untreated FFT consolidate differently than treated fluid fine tailings, and consolidation behavior will vary based on the tailings’ material properties, such as their solids, fines, and clay content. In a study by Mckenna et al. [11], they conducted long-term consolidation modeling for different types of fluid fine tailings and treatments, where the post-filling consolidation settlements were predicted for a 40 m deposit over 20 to 1000+ years. The model shows that, depending on the compressibility and hydraulic conductivity of the tailings, some have little settlements achieved over a few decades, while others have enormous settlements that take decades or centuries to complete. For example, the untreated FFT would settle by more than 12 m within 20 years after filling. If a terrestrial landform is the intended closure objective for FFT deposit, this amount of settlement can result in large, flooded regions, increasing the likelihood of a dam breach, and altering the water balance of the landform [10].
A major challenge of tailings storage facility closure design is containing the release water, since it can lead to dam failure through several mechanisms such as overtopping, wave erosion, saturation of fills, piping, etc. [10,16,17]. Therefore, volume predictions based on the operational consolidation behavior predictions are important for ensuring that sufficient storage facilities are built to contain the amount of FFT produced [10]. Furthermore, volume predictions are significant to ensure water management meet both operational and closure requirements [6,10]. Consolidation settlement will also result in an upward chemical flux of tailings pore-water leading to potential contamination of the soils of the reclaimed landforms as well as the surface drainage. These chemical fluxes may contribute to salt accumulation or cover salinization under dry conditions [10]. Consequently, understanding the consolidation behavior of oil sands tailings will help quantify the chemical mass fluxes for pore water onto the landscape which impacts contaminant mobility calculations, predicted salt loading of the environment and water quality predictions for water capped deposits [15].
The estimation of the settlement of mine waste tailings after reclamation is dependent on the representative constitutive relationships between the vertical effective stress σ’, the void ratio e, and the hydraulic conductivity k. However, the consolidation testing to quantify these constitutive relationships is both expensive and time-consuming. Therefore, several test methods have been developed, whether in the industry or in academia, in an attempt to reduce the cost and time for testing as well as addressing the key challenges with measuring the consolidation behavior of tailings. However, quantifying the consolidation behavior of tailings remains a major challenge to mining planners and owners since many testing protocols exist.
This comprehensive review focuses on ten different large strain consolidation tests that have been used to quantify the consolidation behavior of slurry-like materials. For slurry-like materials, moisture content is significantly higher than liquid limit, and the soil particles flocculate in the water [18]. The purpose of this review is to present the key characteristics, strengths, and weaknesses of each of these testing protocols.
1.1. Theoretical Background
The concept of one-dimensional small-strain consolidation theory was first proposed by Karl Terzaghi in 1923, and this theory has since played a vital role in the geotechnical engineering field. The small-strain consolidation theory is a mathematical approach that assumes the consolidation settlement of the consolidating layer is relatively small compared to the thickness of the layer [19]. The theory was developed by combining the continuity equation (i.e., assumptions of the validity of Darcy’s law), fluid flow relationship, and the principle of effective stress. A few necessary assumptions were required, including the assumption that only small strains develop in the soil during consolidation and the coefficients of both the compressibility and consolidation remain constant during the consolidation process [20]. In general, the assumptions are valid only if the ultimate change in effective stress is small compared with the preconsolidation effective stress. Terzaghi’s one-dimensional small-strain consolidation theory was mathematically represented by Equation (1) as:
where cv is the coefficient of consolidation, u is the excess pore pressure, t is the time, and z is a one-dimensional vertical coordinate.
This mathematical expression represents the rate of the primary consolidation based on the assumption that it would be the total consolidation that would occur under a particular load (i.e., it excluded the secondary consolidation). The primary consolidation is caused by a change in the volume of voids of a saturated cohesive soil due to a decrease in the water content that fills these voids. The end point of the primary consolidation represents the limit at which excess pore water pressure is completely transferred to effective stress due to the dissipation of pore water pressure. The end point of primary consolidation is sometimes indirectly calculated based on the square root of time fitting method or directly from the point that corresponds to the full dissipation of excess pore pressures [21]. The secondary consolidation, which occurs due to plastic rearrangement of soil fabrics, starts following the completion of the primary consolidation under a constant load increment, and total consolidation is often arbitrarily separated into primary and secondary stages. Realistically, the “rearrangement of the soil fabrics” is a creep mechanism, which develops shear and/or volumetric strains over time at a rate controlled by the viscous-like resistance of the soil structure [22]. Therefore, the secondary consolidation that follows the primary consolidation is a special case of volumetric creep (i.e., time-dependent deformations under constant load) [22]. Although there is evidence of the importance of creep, this review does not focus on it. In the primary consolidation stage, the hydraulic conductivity of the soil controls the rate of volume change, whereas the resistance of the mineral grain structure controls the rate during the secondary consolidation stage [23]. Despite the important role of Terzaghi’s theory in soil mechanics, there is a noticeable discrepancy between the one-dimensional Terzaghi theory and laboratory results [24,25]. During the initial phase of consolidation, the theoretical solution is a good approximation, but during the secondary consolidation, consolidation rates become larger than theoretically predicted [24,25,26]. Furthermore, Terzaghi’s theory was founded on the premise of incompressible soil properties (i.e., small strain, constant hydraulic conductivity and void ratio, and negligible self-weight). In the case of slurry materials such as FFT and those undergoing inherently large strains, these assumptions would be invalid. Slurry materials, as an example, undergo large-strain consolidation, where compressibility and hydraulic conductivity behaviors are highly nonlinear, and this will violate the assumptions of small strain consolidation theory [12,27,28]. These limitations have paved the way into the development of the large strain consolidation theory.
The one-dimensional large-strain consolidation theory, in which the settlement of the consolidating layer is relatively large relative to its thickness, proposed by Gibson et al. [29] is used for slurry materials that undergo significant volumetric deformation. The theory was developed to overcome the limitations imposed by the conventional model due to small strain and linearity, allowing for the analysis of more complicated problems. The theory introduced by Gibson et al. [29] takes into consideration the nonlinearity changes in soil compressibility and hydraulic conductivity during consolidation. Gibson et al. [29] used vertical equilibrium, continuity equation, and a fluid flow relationship to develop the following Equation (2) for one-dimensional large strain consolidation:
where ρs is solids density, ρf is fluid density, e is void ratio, k(e) is hydraulic conductivity, σ′ is effective stress, t is time, and z is a reduced or material coordinate.
Due to the finite strains involved in the consolidation process, layer thickness changes over time. This indicates that the amount (1 + e), where e is the current void ratio, representing the specimen thickness at a particular depth and time, should no longer be thought of as a constant throughout consolidation. Because the thickness of the soil specimen changes continually in a finite strain consolidation problem, the top boundary is always changing. As a result, the upper boundary is time dependent. This sort of problem is generally solved by trial and error, making it an insurmountable challenge with a partial differential equation of second order with variable coefficients that govern the consolidation process. This challenge can be fully avoided if the problem is addressed in terms of Lagrangian coordinates [30,31,32]. In the Lagrangian coordinates system, an element of soil mass is always deemed to enclose the same soil particles as it moves, and its dimensions change throughout time. By using the Lagrangian coordinate system and rearranging continuity of solids and fluid flow relationships, Koppula [27] introduced the following Equation (3):
By using the convective coordinate system, Lee [33] proposed the governing Equation (4) of finite large strain consolidation in terms of porosity. However, it is more difficult to program because the convective coordinate system requires updated geometry at each time step due to changes of settlement while consolidating, resulting in increasing the computation time [30,34].
where n is the porosity, q is the applied stress, Gs is specific gravity of solids, and x is the convective vertical coordinate.
To predict the rate of the self-weight consolidation of slurry-like materials during and after slurry deposition, Somogyi [31] reformulated Equation (3) to present it in terms of excess pore water pressure (u) using Koppula’s [27] rearrangement of continuity of solids and fluid flow relationships as shown in Equation (5). Subsequently, Koppula and Morgenstern [35] utilized the similar strategy to develop a mathematical formulation in a way that is capable of evaluating the progress of the consolidation in a sedimenting clay layer.
1.2. Constitutive Relationships
The governing equation of the large strain consolidation theory was solved using two key constitutive relationships, both of which are non-linear: volume compressibility (e—σ′) and void ratio-hydraulic conductivity (k—e). These relationships, which are a function of void ratio, are often derived from experimental data, while numerical methods are employed to estimate the finite strain solution [12,31,39,40]. Somogyi [31] was the first to introduce the most widely used relationship, which used a power law function to deal with the nonlinearity of hydraulic conductivity-void ratio relationship as shown in Equation (6). Carrier et al. [12] proposed another empirical equation to estimate the hydraulic conductivity from void ratio for fine-grained mineral waste as shown in Equation (7). Furthermore, Bartholomeeusen et al. [39] developed a logarithmic function and is presented in Equation (8).
where C1, D, E1, and F1 are curve fitted constants determined based on laboratory results and are also material properties constants (with appropriate units).
The void ratio-effective stress relationship, which is known as compressibility, is critical and having a better understanding of the compressibility of the soil will result in a better estimation of consolidation in the long term. This constitutive relationship was introduced by several researchers with different correlations, including the Weibull function as shown in Equation (9) [41], logarithmic function as presented in Equation (10) [39], extended power function as shown in Equation (11) [42], and power function which is presented in Equation (12) [31,43].
where A, B, C2, E2, and F2 are curve fitted constants.
𝑒 = 𝐴ln(𝜎′) + 𝐵
Morris et al. [44] and others [45,46,47,48] have suggested employing correlations based on soil index properties (liquid limit, plasticity index, and activity) of dredged and comparable materials that may be assessed quickly using small, disturbed specimens. Notwithstanding, the new correlations must be used cautiously when dealing with sandy soils, soils having Atterberg limits outside the scope of the data set used to construct the correlations, soils with significant amounts of organic contents, or fibrous clays [47,48]. Therefore, in many cases, compressibility and hydraulic conductivity correlations were compiled from several large strain consolidation tests conducted at various periods of tailings consolidation investigations around the world. Thus, the understanding of the consolidation behavior is mostly dependent on the quality of the test done using similar types of tailings in the impoundment. Jeeravipoolvarn [34] emphasized the importance of carrying out laboratory investigations and stated that, “[r]egardless of all the mathematical formulas available and empirical parameters in the literatures, constitutive relationships for detailed consolidation analysis of soft soil should only be determined from direct measurements and the mathematical form to be used should be decided by the experimental data to cover the range of void ratio that the material would experience in the field.” However, determining which testing technique to use can be a challenge. Furthermore, several studies have compared two or three methods, but often the tests are limited to comparisons on a particular type of tailings at a time [34,49,50]. In this regard, there are considerable knowledge gaps surrounding the bias brought by these testing protocols and the models used to interpret the test results. Teasing out bias brought by testing is critical to demonstrating that oil sands fine tailings deposits are on the approved settlement trajectory as expected to achieve the desired closure and reclamation objectives.
2. Large Strain Consolidation Tests
Due to the lack of an ASTM (American Society for Testing and Materials) standard, several types of consolidation tests have been developed in an attempt to determine the two constitutive relationships for compressibility and hydraulic conductivity. The two relationships are required to determine consolidation progress and are quantified using one of the following large strain consolidation (LSC) procedures: modified conventional oedometer consolidation test, multi-step loading large strain consolidation test, large slurry consolidometer test, constant rate of deformation (CRD) test, controlled hydraulic gradient (CHG) test, seepage induced consolidation test (SICT), compressibility standpipe test, centrifuge test, and restricted flow consolidation test.
2.1. Modified Conventional Oedometer Consolidation Test
The ASTM standard oedometer step-loading consolidation test [21] is one of the most commonly used experiments in soil mechanics laboratories. The primary goal of this testing method is to determine the consolidation parameters of a soil based on the measured settlement time curve. The testing technique involves applying constant incremental loads to the specimen, for a standard load increment duration of approximately 24 h, and then the axial deformation is observed for each load increment [21]. The ASTM standard oedometer test is developed for one-dimensional small strain consolidation problems and generally adopts Terzaghi’s one-dimensional consolidation theory [20]. The one-dimensional consolidation theory proposed by Terzaghi [20] was based on assumptions that were discussed in Section 1.1. There are several techniques of determining the coefficient of consolidation and back calculating the hydraulic conductivity from the laboratory results as long as compressibility and consolidation coefficient remain constant during each load increment. However, the small-strain consolidation theory is erroneous to simulate the consolidation of slurry-like soils, such as oil sand tailings, due to large strains, nonlinearity of both hydraulic conductivity and compressibility, and influence of self-weight consolidation linked to slurry type soils [51,52]. The conventional oedometer apparatus typically operates with an initial applied stress greater than 5 kPa. Slurry-like materials are not stiff enough to support such an initial applied stress, leading to soil escaping through the gap between the metal ring and the upper porous stone.
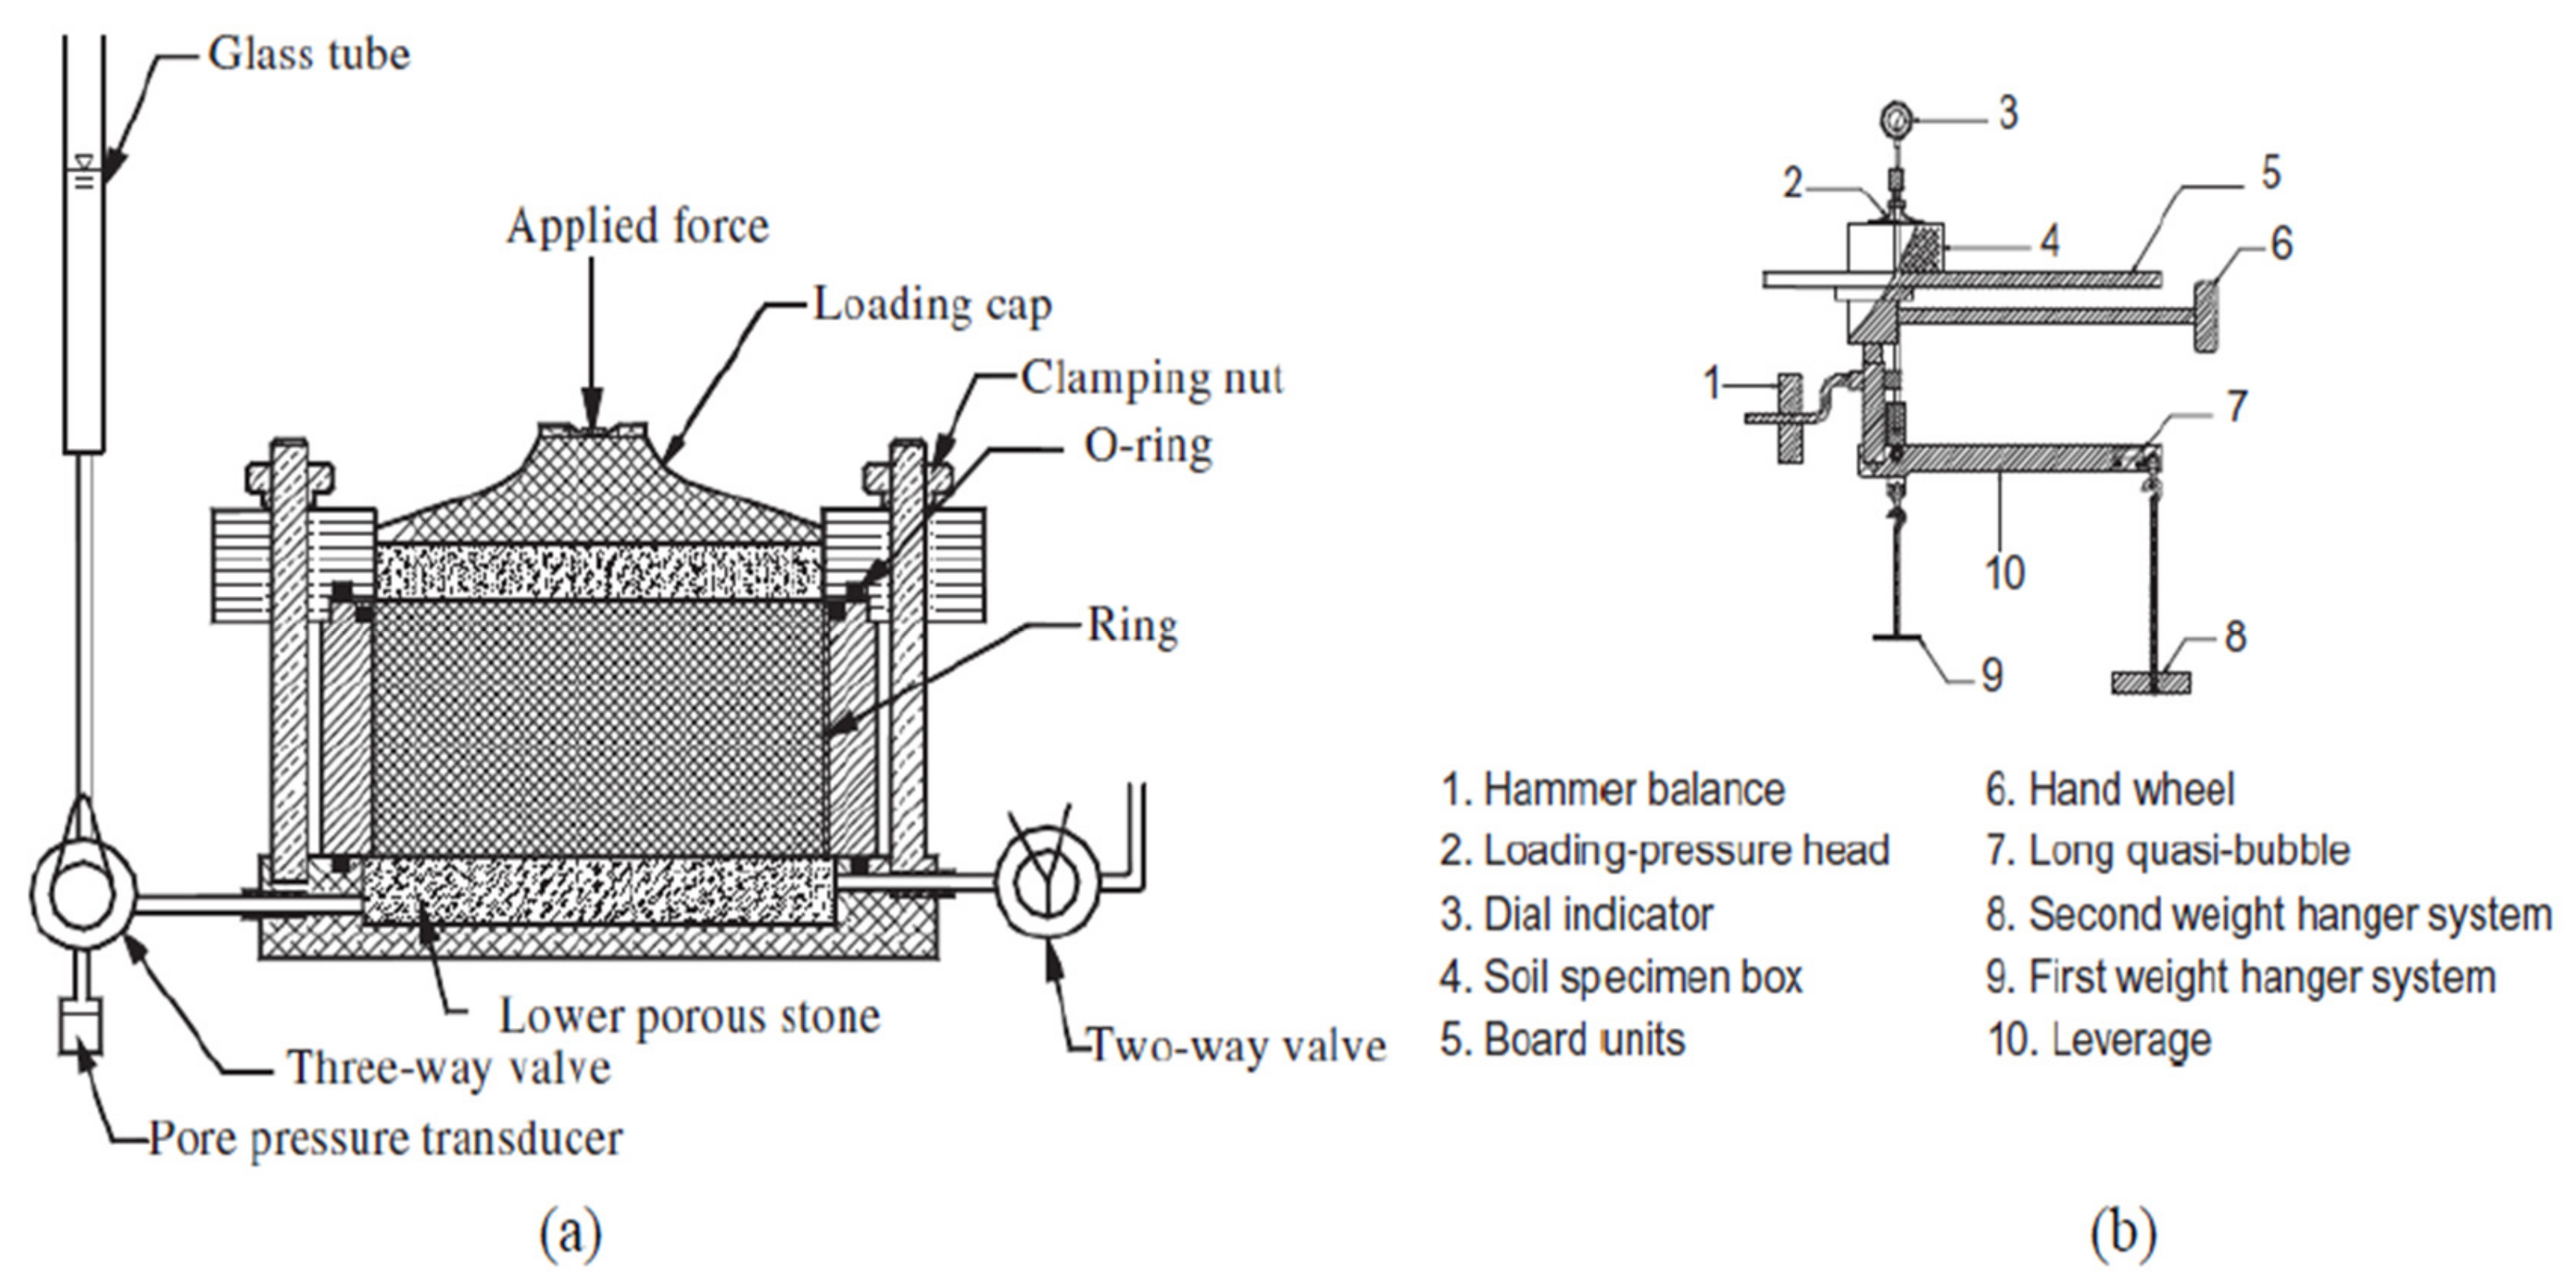
Hong et al. [53] and others [50,54,55] studied the consolidation behavior of soft-fine grained soils at high initial moisture contents (i.e., slurry-like soils) using a modified conventional oedometer apparatus. The conventional oedometer apparatus was modified to apply an initial pressure as low as 0.5 kPa by using two weight hangers with a light loading cap [53,54,55]. The first hanger was placed beneath the centre of the consolidation cell, and it was used only to apply stresses smaller than 12.5 kPa, whereas the second hanger was utilized to apply stresses higher than 12.5 kPa and was similar to that of a conventional oedometer apparatus as shown in Figure 1. In order to measure the hydraulic conductivity at the end of each load increment, a pliable tube connected the porous stone at the base to a three-way valve, which allowed connections with the consolidation cell as well as a graduated vertical glass tube for hydraulic conductivity constant head test [54,55,56,57,58].
The modified conventional oedometer test helped estimate the two constitutive relationships of void ratio function (i.e., compressibility and hydraulic conductivity) of slurry-like soils (with initial moisture content ≥2 * liquid limit). However, the test has several potential issues that bring the obtained results into questions: (1) leakage and its impact on the accuracy of hydraulic conductivity measurements [56,57]; (2) It is possible that small specimens are not fully representative [56,57]; (3) the direct estimation of the hydraulic conductivity may cause seepage-induced consolidation if the seepage force is higher than the applied pressure [50,59]; and (4) internal erosion is susceptible to occur if the actual hydraulic gradient was not kept below the critical hydraulic gradient. As a result, different test apparatus and advanced testing techniques have been developed to circumvent the limitations of the conventional oedometer test and to investigate the consolidation behavior of slurry-like soils.

2.2. Multi-Step Loading Large Strain Consolidation Test
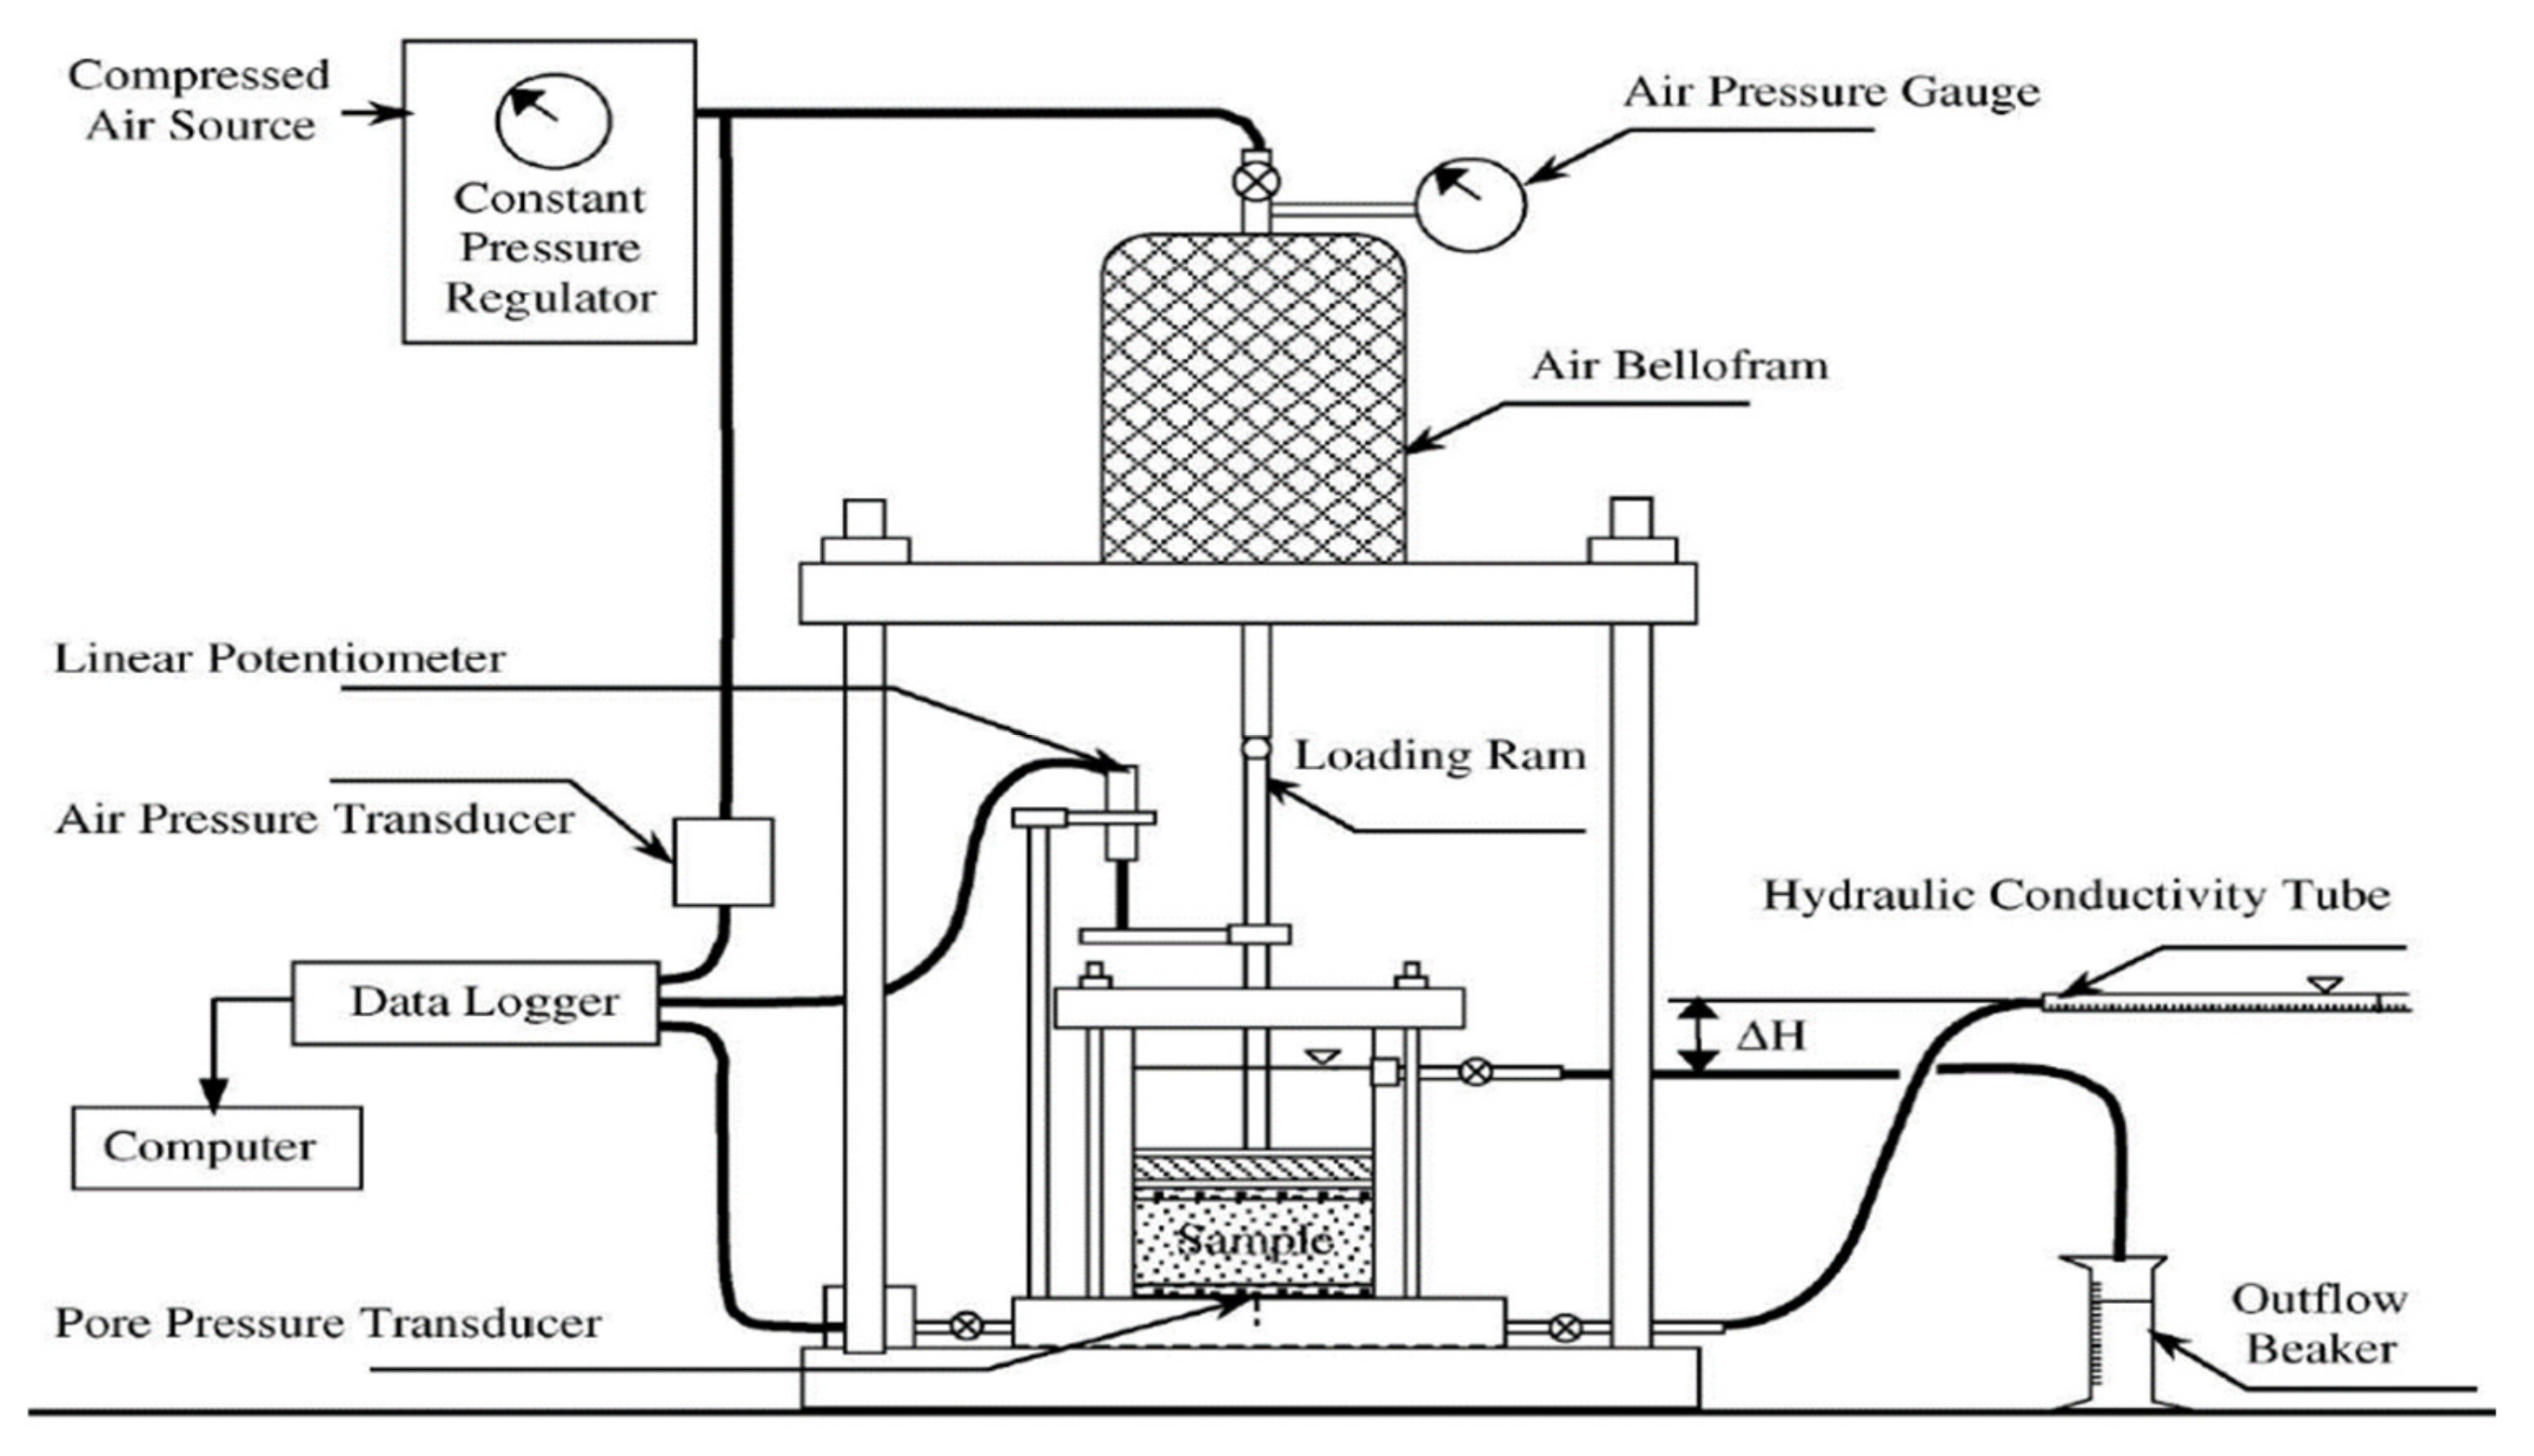
The multi-step loading large strain consolidation test is similar to the ASTM standard oedometer test [21], and it follows the large strain consolidation test that was described by Sheeran and Krizek [60] and Monte and Krizek [61]. The University of Alberta developed a multi-step loading large strain consolidation test to accommodate materials that exhibit large strain as shown in Figure 2. They use the multi-step loading large strain consolidation test to estimate the two key constitutive relationships, volume compressibility (e—σ′) and hydraulic conductivity (k—e), of slurry-like materials. The load is manually placed, and the pore water pressure port is installed only at the base of the consolidation cell. The multi-step loading large strain consolidation test works according to a one-dimensional mathematical model for large strain consolidation [60,61]. Load increments are applied manually (typically from self-weight to 8 kPa) on the surface of the specimen step by step to increase the effective stress. When the pressure is greater than 8 kPa, the bellofram air pressure system is used as it typically offers more control and is more suitable to higher pressures. The end of each load step is defined when the excess pore water pressure has entirely dissipated, and the deformation remains constant. At the end of each load step, one data point for the void ratio-effective stress relationship, known as compressibility, can be obtained. The hydraulic conductivity constant head test is carried out at the end of each load increment to estimate the hydraulic conductivity-void ratio relationship [62]. The constant head test is carried out with upward flow and an actual hydraulic gradient lower than the critical hydraulic gradient to prevent internal erosion. The inflow is observed during the hydraulic conductivity test until a steady state flow condition is reached, at which point the hydraulic conductivity value is measured. It is recommended that the sample height be selected so that the diameter-to-height ratio is greater than 2:1 to minimize wall friction at pressures greater than 10 kPa [21,34,63]. To obtain a homogeneous slurry specimen, the sample should be thoroughly mixed for few minutes and then poured into the saturated consolidation cell immediately. To prevent the segregation of the tailings sample, stir the tailings in the consolidation cell occasionally. A detailed discussion on how to produce high-quality slurry samples was described by Sheeran and Krizek [60] for further details. There are some case in which slurry specimens produce gas or contain gas. To deal with this type of slurry, special test setups, which may consist of de-airing cell placed on a shaking table and connected to a vacuum pump, are required to remove entrapped air.
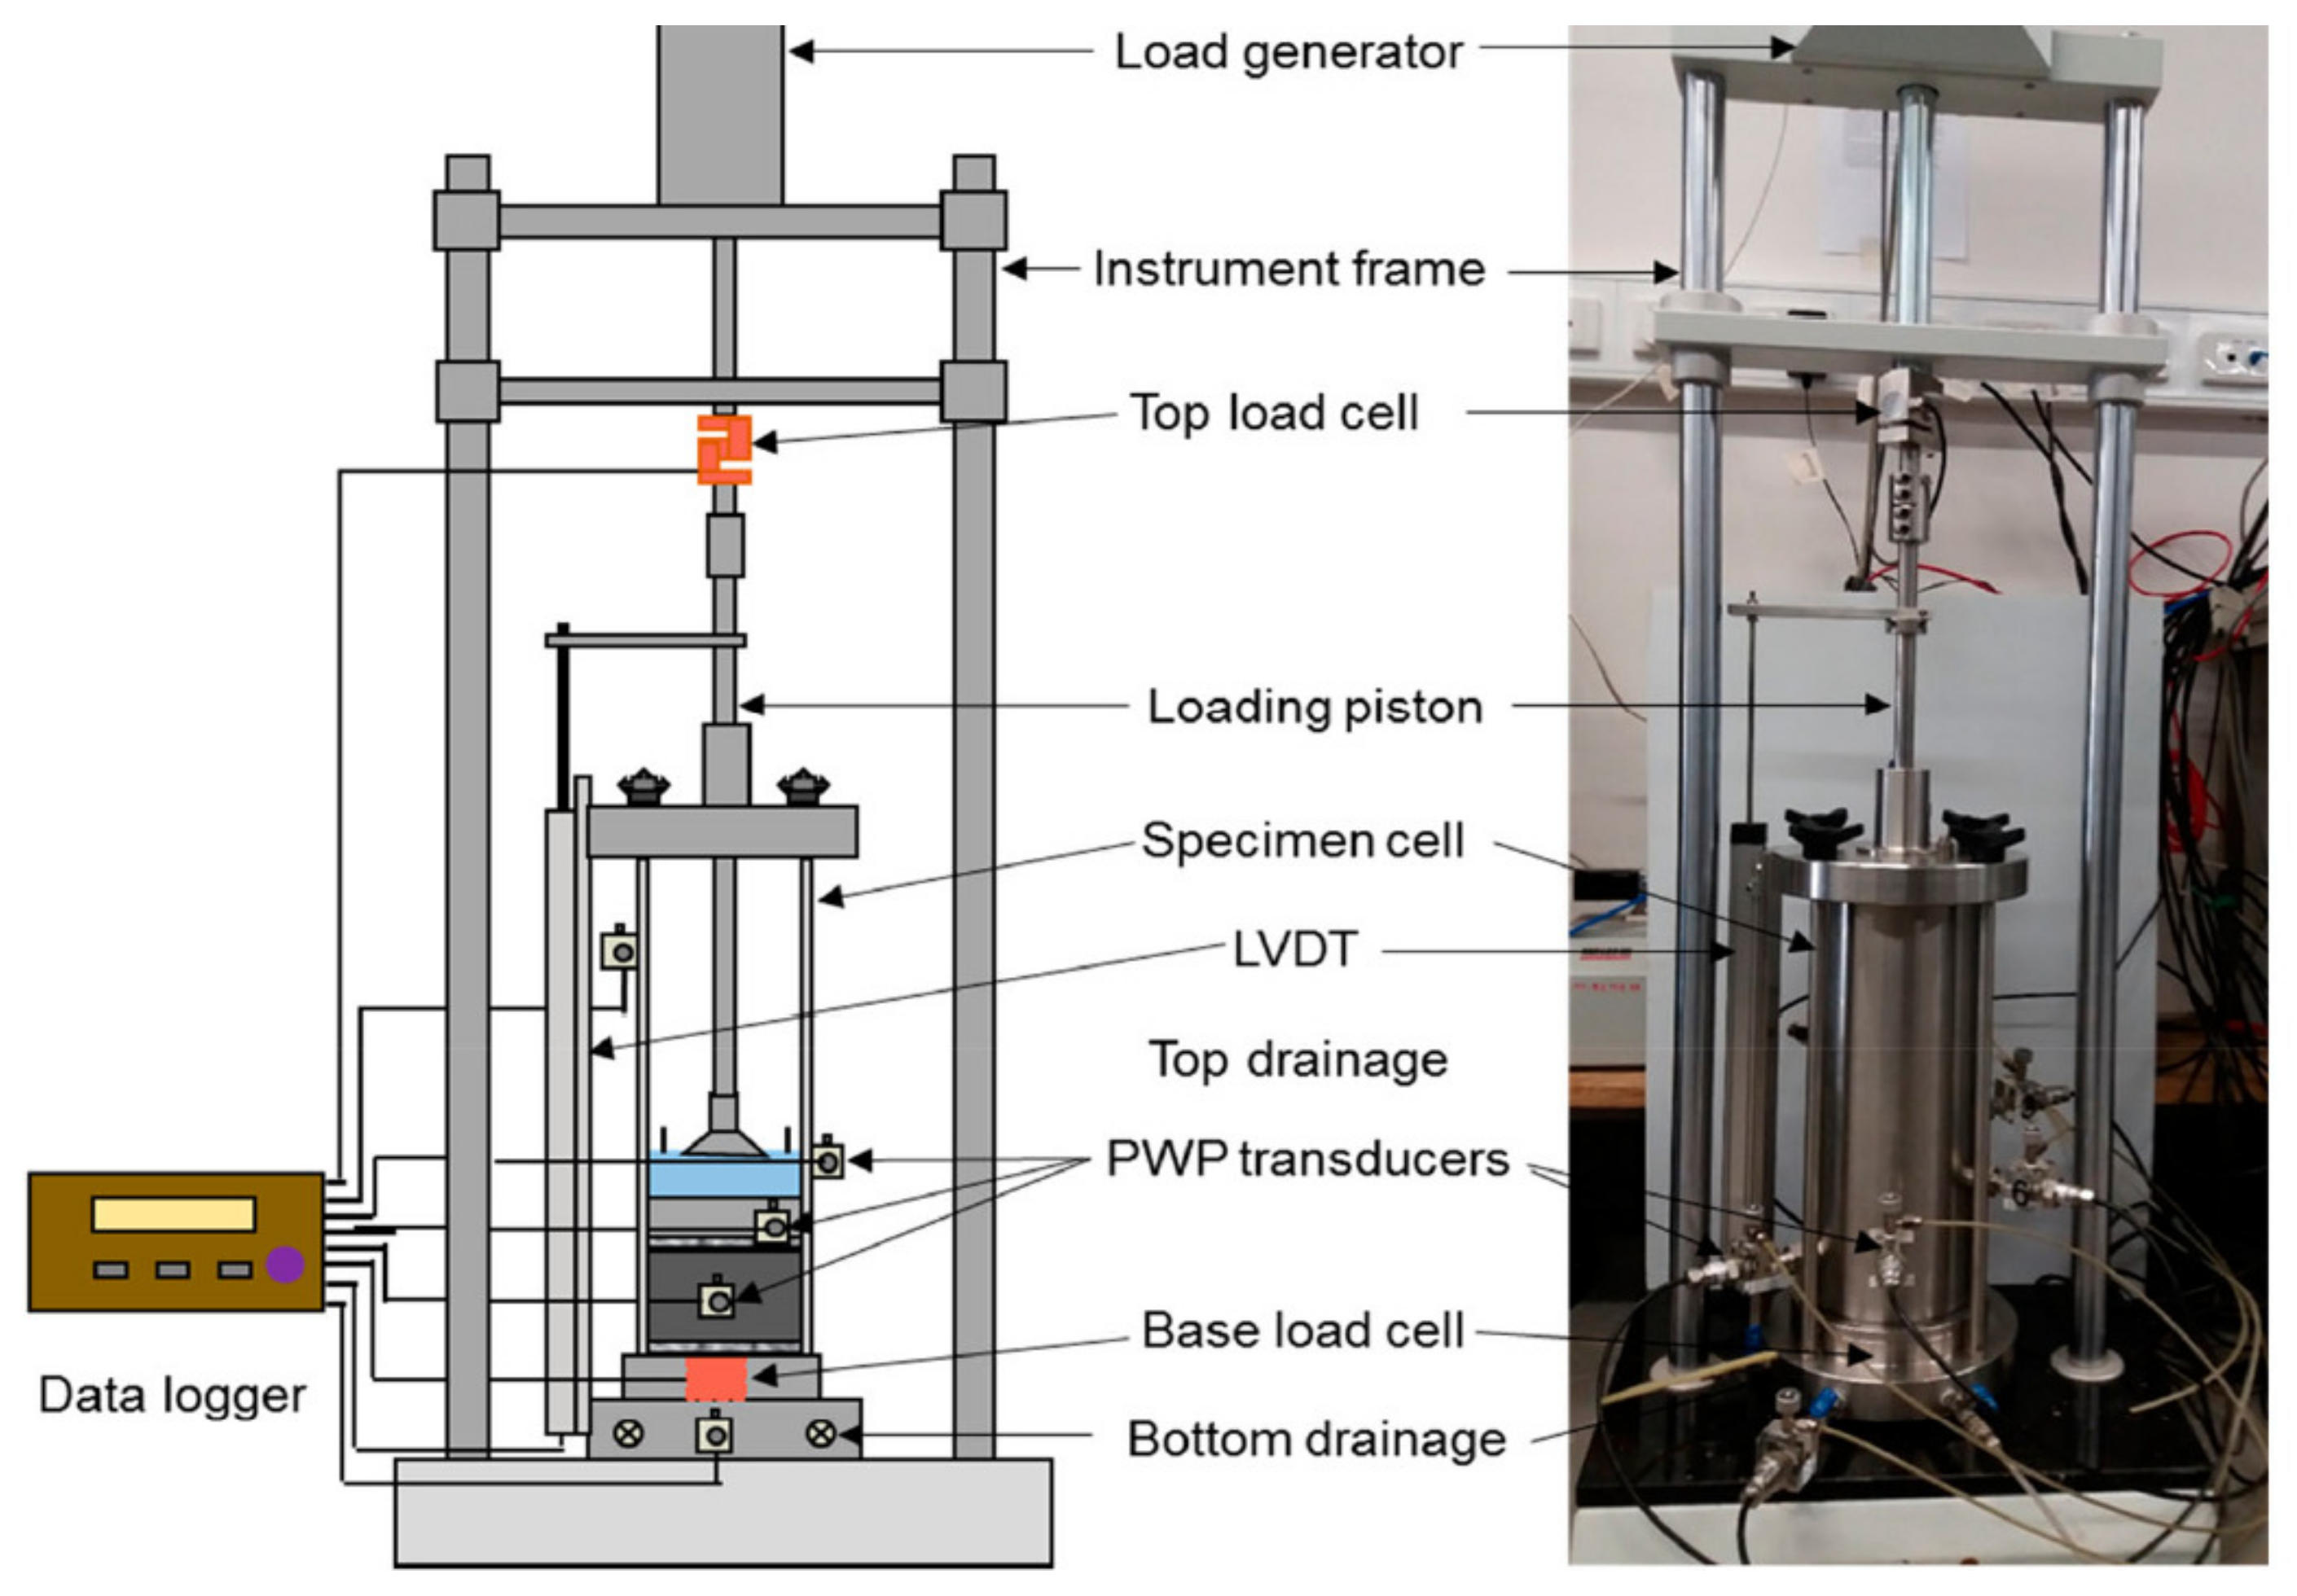
Pollock [65] and Suthaker [66] measured the consolidation properties of slurry-like material using a large strain slurry consolidometer test instead of using Terzaghi’s consolidation theory for data analysis. The large strain slurry consolidometer test is similar to the multi-step loading large strain consolidation test, as it follows the large strain consolidation test that was described by Sheeran and Krizek [60] and Monte and Krizek [61]. An example of a large, purpose-built, stress-controlled slurry consolidometer was constructed to the University of Queensland’s specifications is shown in Figure 3. This device consists of a stainless-steel cylindrical cell with an internal diameter of 150 mm and a height of 410 mm with top and base load cells, this consolidometer is capable of handling up to 10 kN (equivalent to approximately 566 kPa of applied stress). The pore water pressure (PWP) can be monitored using seven PWP transducers that are distributed at three levels, including one at the base, and six PWP transducers placed spirally at a regular interval of 100 mm vertically on the consolidation cell above the base (i.e., three transducers at 100 mm, and another three at 200 mm above the base) [67,68]. To simulate the continuous and fast re-deposition of mine waste tailings into the new mine pit, Shokouhi and Williams [67] and others [68,69,70] used the large, purpose-built slurry consolidometer by applying a constant rate of loading (CRL) to evaluate the volume change, shear strength, desiccation, and consolidation behavior of coal mine tailings.
The main disadvantage of the multi-step loading large strain consolidation test is the long test duration required for the material to consolidate under the step loads, especially for low hydraulic conductivity specimens. For example, testing a FFT sample with a starting void ratio of 5.0, and to consolidate it to a void ratio of 1.0, may need anywhere between 6 and 12 months to complete depending on the fines content [34]. Furthermore, potential piping during the hydraulic conductivity test can be a serious problem if the actual upward gradient is too high and is greater than the critical gradient at the current load step. On the other side, the main drawbacks of large slurry consolidometer tests are: (1) in large samples, there is spatial variation in the material properties [50]; (2) wall friction can be an issue as it depends on the diameter of consolidometers and loading sequences [71]. Regardless of their limitations, the multi-step loading large strain consolidation test and the large, purpose-built slurry consolidometer test have the benefit of being a direct measurement that does not require any back calculation of properties. These tests are widely employed as a tool for measuring the consolidation behavior of slurry and tailings materials, such as oil sands in Alberta.
2.3. Constant Rate of Deformation (CRD) Test
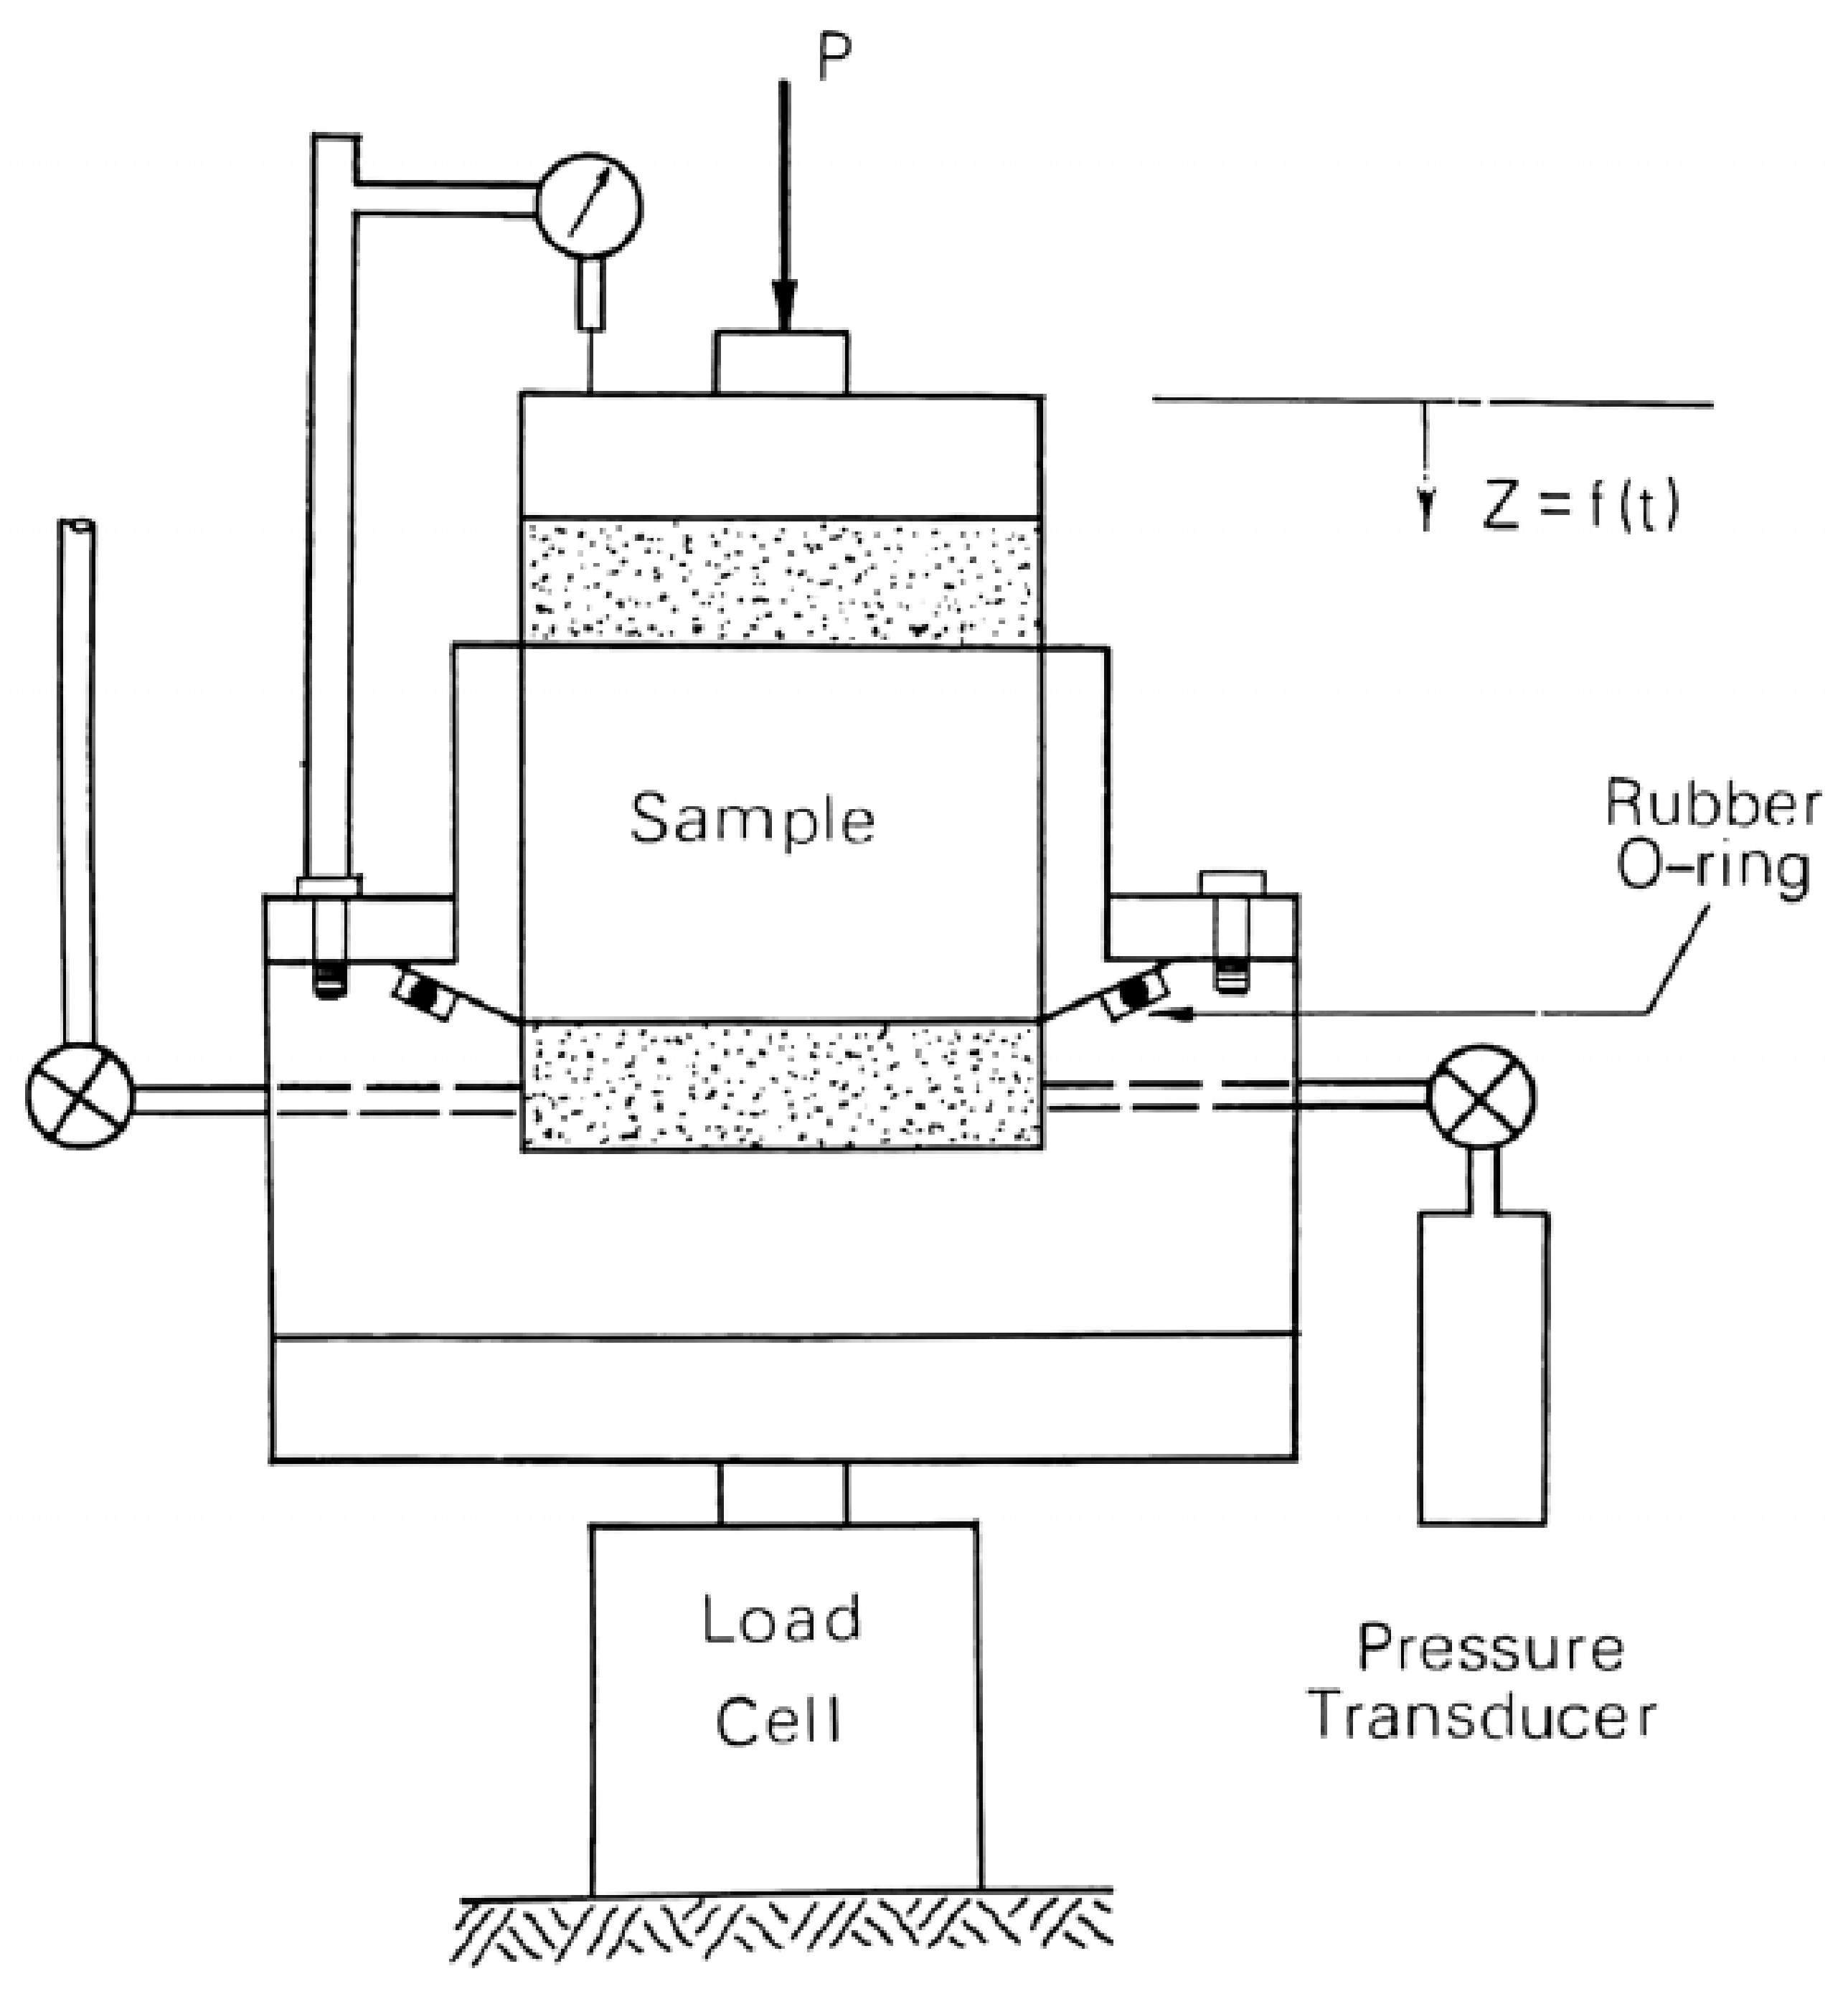
The constant rate of deformation test was first introduced by Hamilton and Crawford [72], and it is illustrated in Figure 4. Hamilton and Crawford [72] proposed the CRD test as a quick method of determining both the pre-consolidation pressure, Pc, and the void ratio-effective stress relationship to investigate fundamental issues about the compressibility of very soft soils with high water contents. The constant rate of deformation test was based upon the assumptions of linear void ratio-effective stress and hydraulic conductivity-void ratio relationships, constant coefficient of consolidation, and small strain theory [73]. As an alternative to a conventional consolidation test, the constant rate of deformation (CRD) testing approach was adapted to expedite the testing process and to test material at deformation rates that are more closely related to field deformation rates [74,75,76,77].
In this testing approach, the test specimen is deformed at a constant rate by applying a specified constant rate of deformation of the base plate with the axial load press. During the test, the pore water pressure at the base of the test specimen, the axial deformation, and the axial load are measured at each interval. In this apparatus, the consolidation ring can accommodate a test sample of 20 up to 50 mm in height from a very soft state with a high moisture content of 100% or more [78,79]. Presumably, the height restriction is to ensure a diameter to height ratio greater than 2:1 to minimize wall friction.
This testing method has various advantages over the conventional oedometer consolidation test: (1) the testing procedure is simple enough for any laboratory to instrument; (2) the test was able to overcome the limitations of the conventional consolidation test by reducing the duration of the process in a matter of days; and (3) in comparison to the conventional consolidation test, the CRD test provides many more data points to construct continuous void ratio-logarithmic vertical effective stress, and void ratio-logarithmic hydraulic conductivity curves for most soft clayey soils. Several methods for analyzing the CRD test have been proposed, such as Smith and Wahls’ method [76], Wissa’s method [77], Umehara and Zen’s method [79], and Lee’s method [80].
Smith and Wahls’ analysis has two major limitations [73]: (i) the implications of the assumption that the void ratio is a linear function of time and space variables cannot be assessed, and hence the degree of accuracy of the measured material properties is unknown; and (ii) there are some challenges with determining some of the parameters in the average effective stress and average coefficient of permeability equations, and there is no established method for determining it. The methods that have been proposed by Wissa et al. [77] and Umehara and Zen [79] are constrained by two fundamental assumptions. The consolidation coefficient is considered to remain constant during the test, and the compression index is likewise expected to be constant. As a result of these two assumptions, the two methods produce two unique curves for the effective stress-void ratio relationship [73]. Lee [80] noticed a strong possibility of finding distinct curves when strains and stresses are calculated at different ends of the specimen. However, there is no logical procedure for determining which of the curves best approximates true material behavior [73].
Despite the fact that the CRD testing and interpretation methods are well-established, the CRD test has a number of drawbacks that prohibit it from being extensively used in practice: (1) if the soil is to be consolidated directly from a slurry, the assumption of a small strain is unrealistic [79]; (2) unavailability of set standard for method of analysis for interpreting the CRD data; (3) errors in pore pressure measuring as well as initial transient conditions [81]; and (4) selecting the imposed strain rate is challenging as the rate of testing has a significant influence on the confined compression characteristics of the specimen [74,80,82].
Figure 4.
Schematic of the constant rate of deformation test equipment (Reprinted from permission from Smith and Wahls [76]. 2023, Copyright Clearance Center, Inc.).
Figure 4.
Schematic of the constant rate of deformation test equipment (Reprinted from permission from Smith and Wahls [76]. 2023, Copyright Clearance Center, Inc.).

2.4. Controlled Hydraulic Gradient (CHG) Test
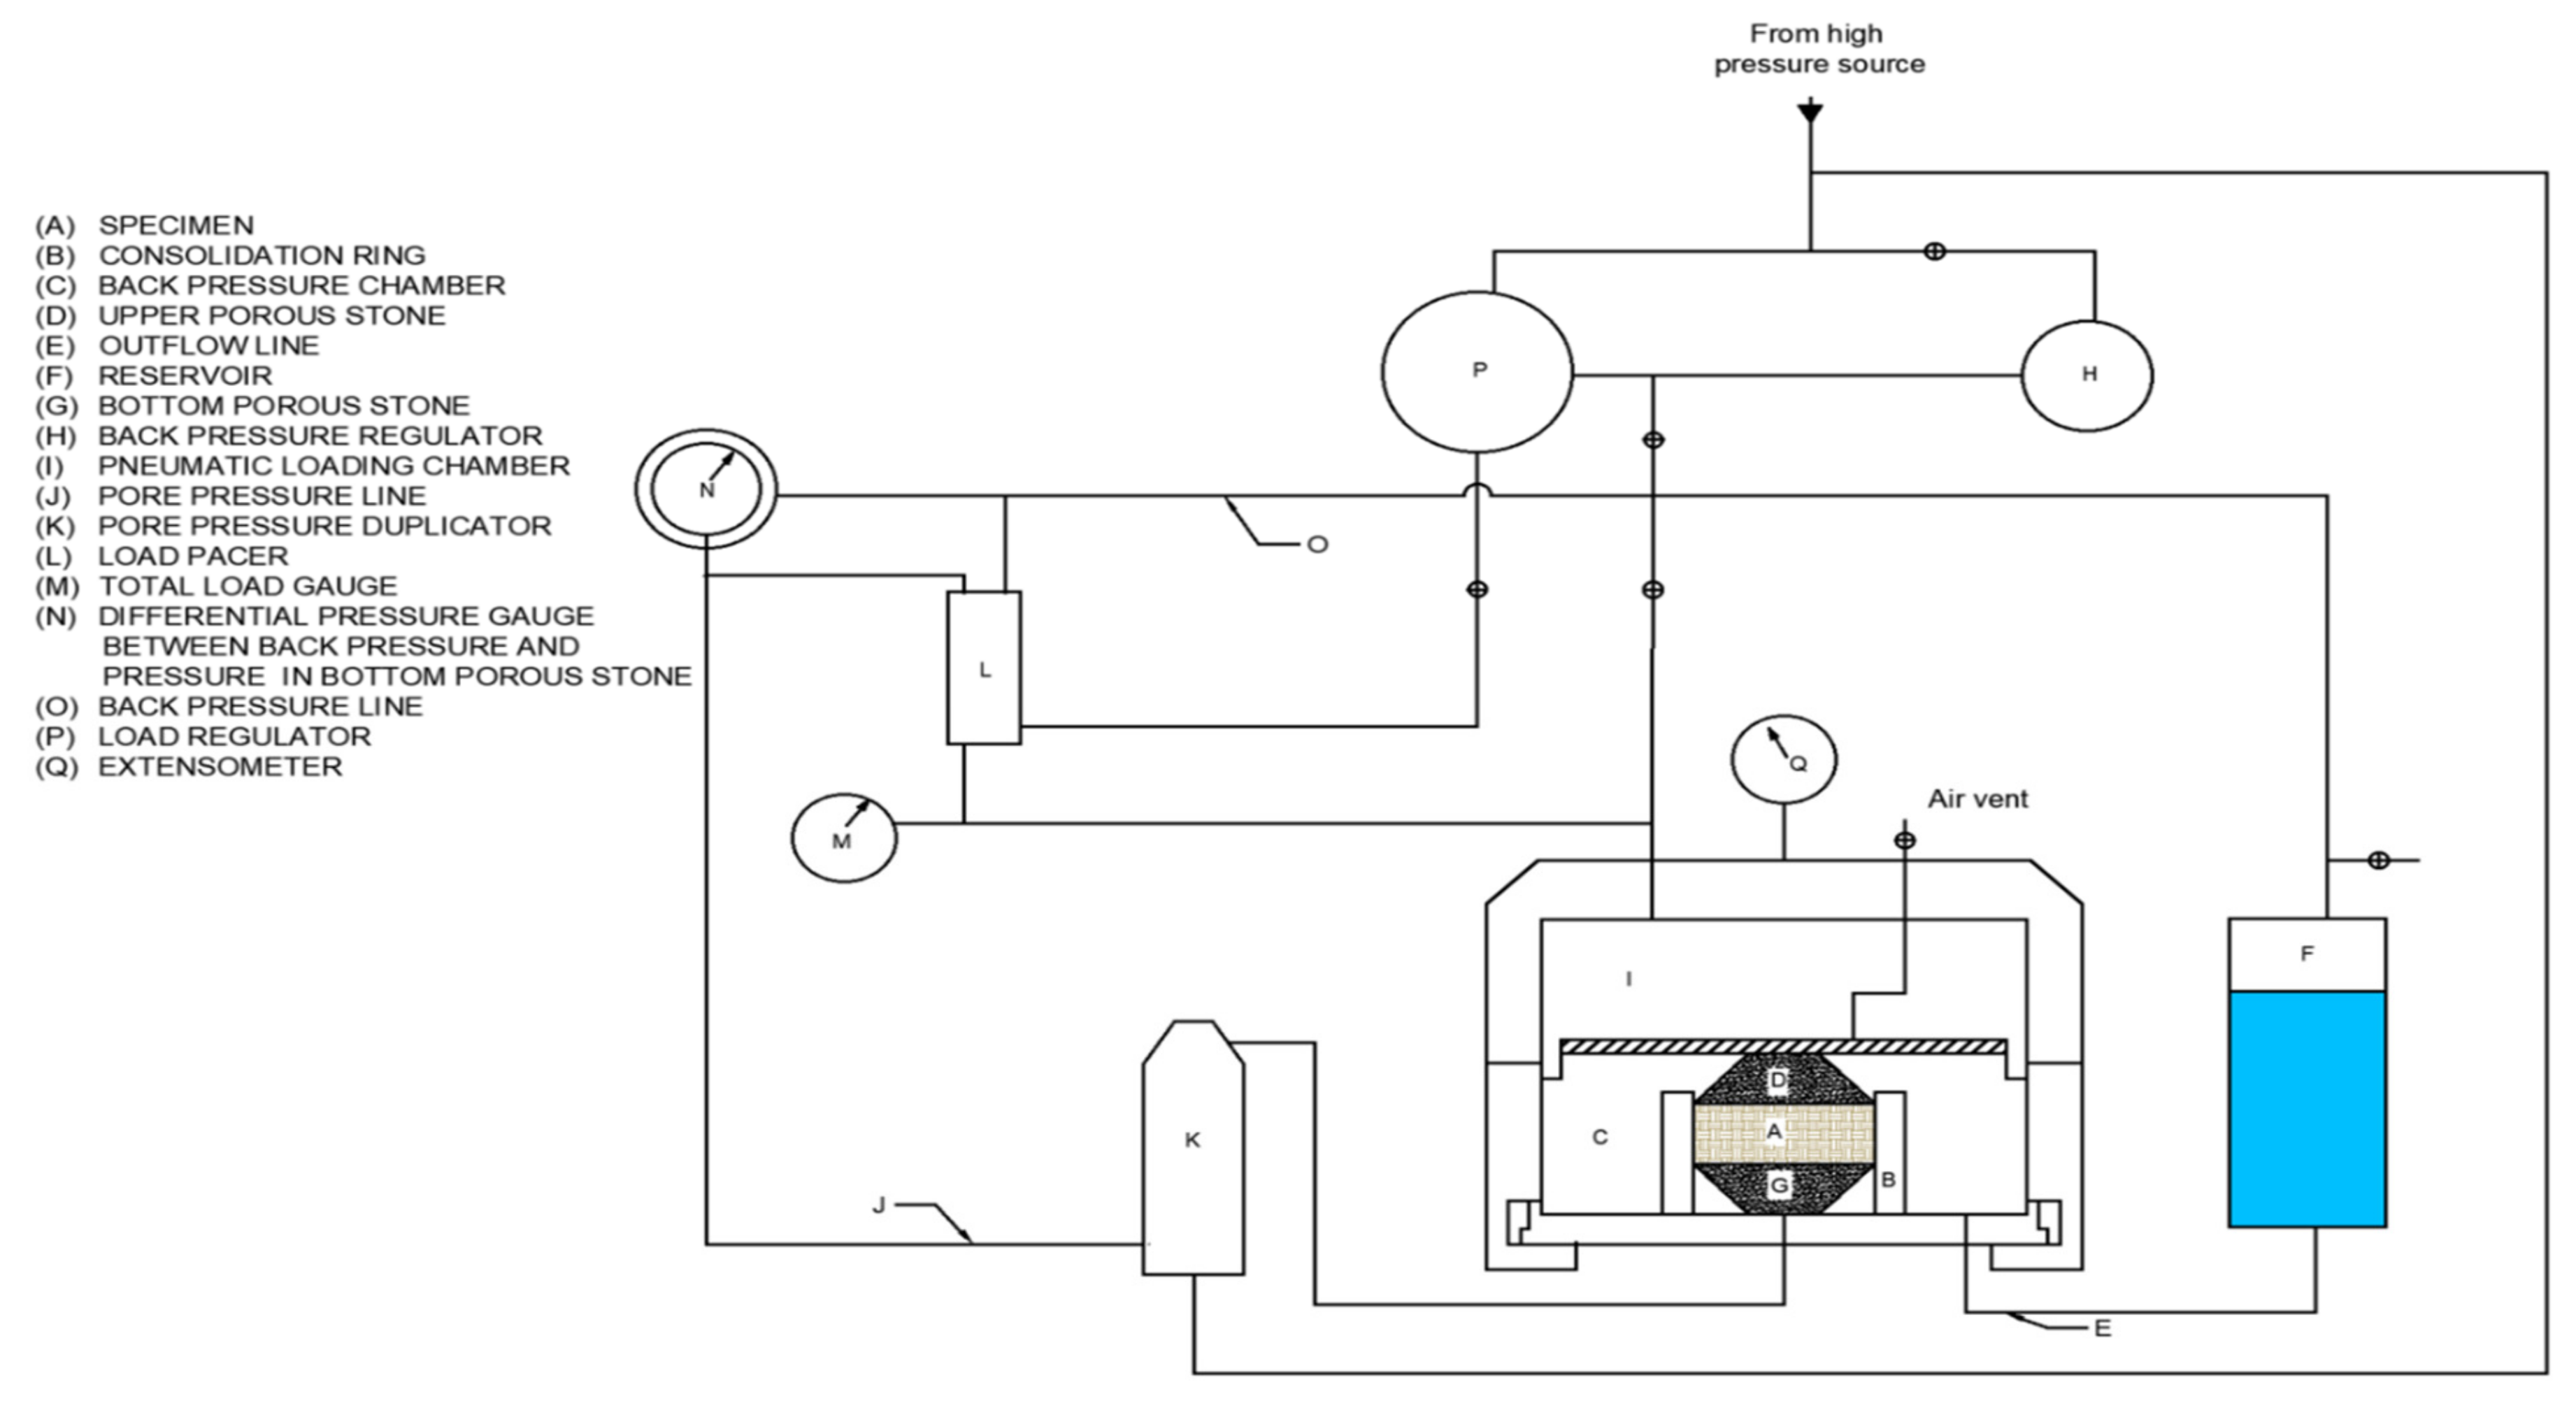
The controlled hydraulic gradient test introduced by Lowe et al. [83] was similar to the constant rate of deformation test except for where the loading rate is constantly regulated via a feedback mechanism as shown in Figure 5. This ensures that the pore water pressure at the undrained boundary remains constant; hence, the hydraulic gradient within the specimen remains constant during the test. At the beginning of the test, the back pressure regulator is used to incrementally increase back pressure to the test specimen in the back pressure chamber and to the pneumatic loading chamber. Drainage is only permitted in the axial direction and only to the upper boundary of the sample. The specimen is then loaded by raising the pressure in the pneumatic chamber. The load builds up hydrostatic excess pressure inside the saturated specimen as it is applied. In these boundary conditions, hydrostatic excess pore water pressure is distributed in a parabolic pattern from the bottom of the specimen to the upper face, where it is zero. When the hydrostatic excess pore water pressure in the lower porous stone reaches the set value, the load pacer device turns off the application of any additional loads. The pressure difference between the lower porous stone and the upper porous stone causes seepage in the direction of the upper porous stone, causing the sample to consolidate. The controlled hydraulic gradient test was based on the assumptions of a linear void ratio-effective stress relationship, constant hydraulic conductivity, constant void ratio throughout the specimen, and small strain theory [73].
The aims of the controlled gradient test were: (1) to ensure uniformity of the stress conditions during the course of testing as possible; (2) to maintain a constant rate of compression throughout the test; and (3) to be able to run experiments at various slow compression rates, allowing data to be extrapolated in the field to a lower compression rate than it actually is [74,84]. In reference to the results of this type of test, higher excess pore water pressure values cause higher pre-consolidation pressure values [83,85,86,87].
The major limitations of this test are: (1) the rate of loading is unknown at the start of the test, and it must be modified throughout the test to maintain a consistent pore pressure at the undrained boundary; and (2) because of theoretical limitations (i.e., using small strain theory for data analysis), it is inappropriate for soils that will experience substantial deformations [75,83].
Figure 5.
Schematic of the controlled hydraulic gradient consolidation test apparatus (Reprinted from permission from Lowe et al. [83]. 2023, Copyright Clearance Center, Inc.).
Figure 5.
Schematic of the controlled hydraulic gradient consolidation test apparatus (Reprinted from permission from Lowe et al. [83]. 2023, Copyright Clearance Center, Inc.).

2.5. Seepage Induced Consolidation Test (SICT)
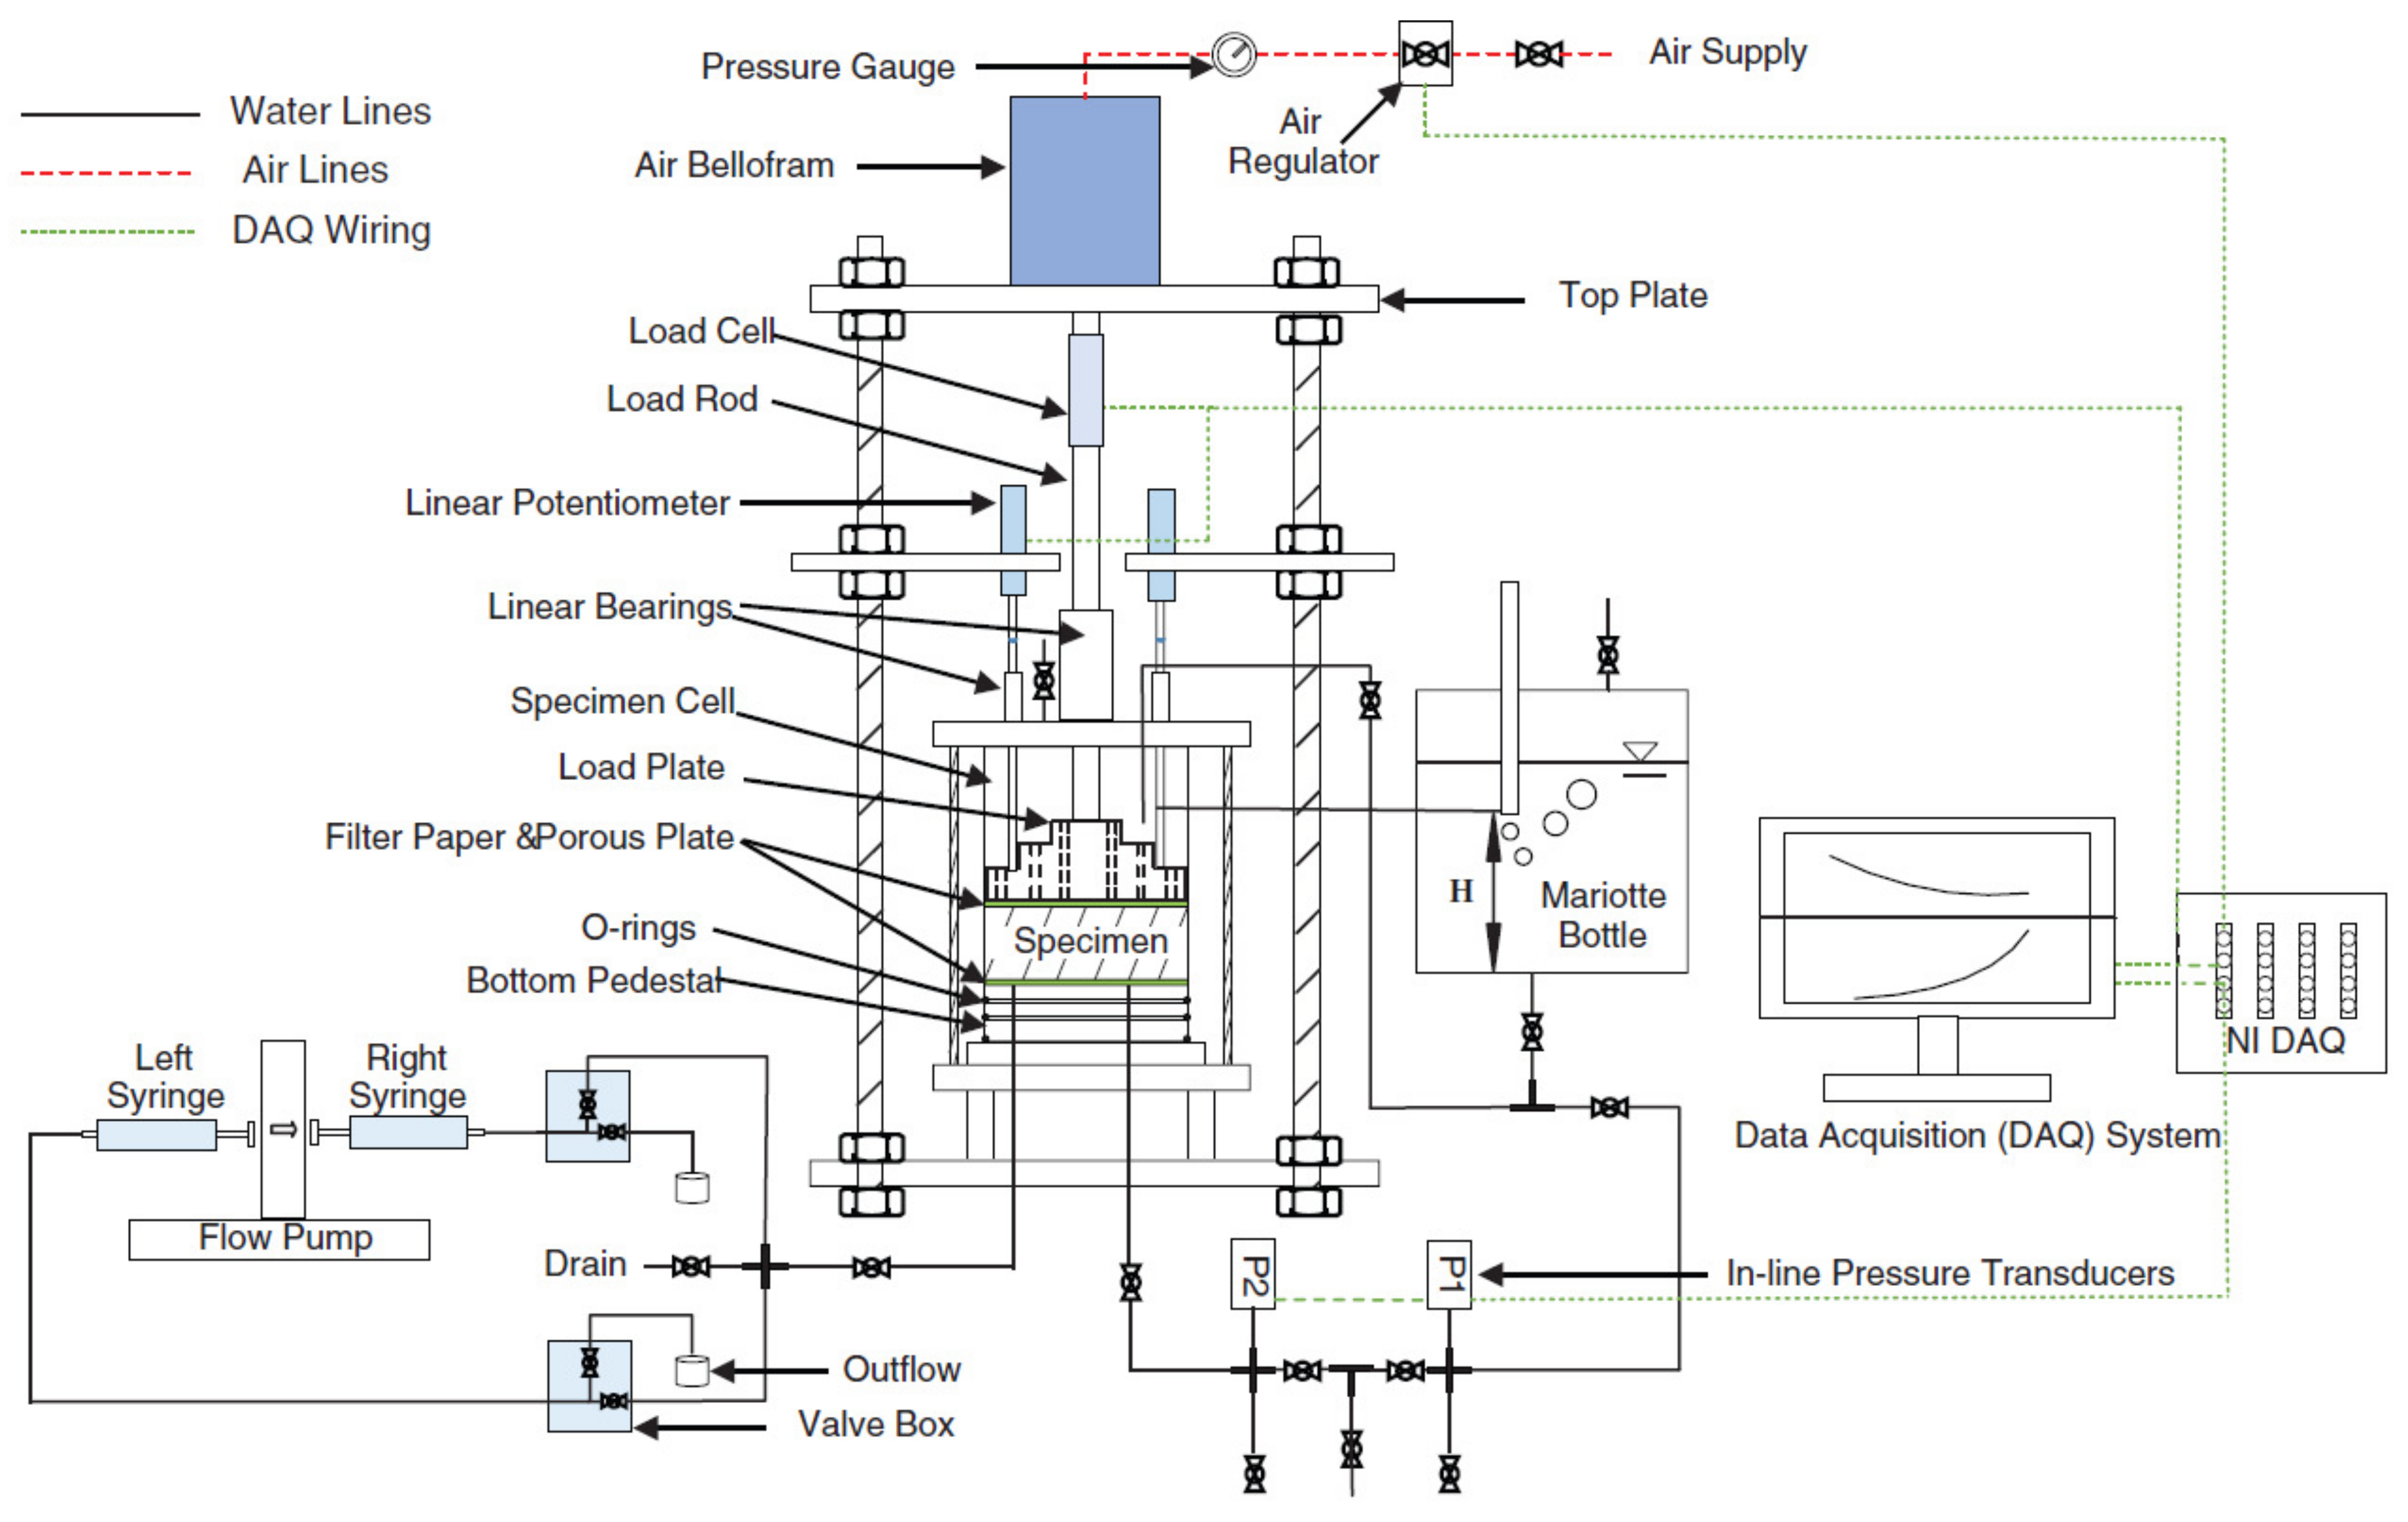
The seepage-induced consolidation test, as shown in Figure 6, was first introduced by Imai [88] to estimate the consolidation characteristics of dredged sediments, and the test was called the “hydraulic consolidation test”. The primary idea behind the test is to leverage the effective stress difference along the specimen induced by seepage pressures to initiate the consolidation process. In this technique, the test specimen is subjected to a downward seepage force, in addition to the self-weight of the specimen, by applying a constant head difference at the upper and lower boundaries of the specimen [73]. During the experiment, the pore-water pressure distribution within the sample is determined by taking measurements at various locations along the specimen. At the completion of the test, the specimen must be extracted and sliced into horizontal slices to determine the distribution of the void ratio along the test specimen. From the test results (i.e., void ratios, effective stresses, and pore-water pressure measurements), the void ratio-effective stress and hydraulic conductivity-void ratio relationships can be established. However, the test procedure described by Imai [88] has its own drawbacks [89]: (1) Imai’s method needs sophisticated instrumentation with the ability to measure local pore water pressure during the flow process; (2) the sample rebound during the determination of the distribution of the void ratio leads to erroneous results and to avoid the problem of specimen rebound, a technique such as X-rays [90] can be used during the test to measure the void ratios; (3) the formation of flow channels along the walls of the consolidation cell may leads to erroneous results (i.e., sidewall leakage); and (4) the quality of the measured data (i.e., void ratios, effective stresses, and pore-water pressure measurements) is entirely operator-based. In general, this analysis does not incorporate any consolidation theory, and consequently cannot be considered a consolidation test but rather functions as a measurement of the soil properties directly without the use of consolidation theory [91].
Analyzing the results obtained from the seepage-induced consolidation leads to primary issues which center around estimating the time-dependent capacity of the tailings disposal ponds as well as the rate at which material properties improve over time [92]. Huerta et al. [92] proposed a 1-D mathematical model based on large strain consolidation theory, originally developed by Gibson et al. [29], to address the issues of the seepage-induced consolidation in sediment slurries. They utilized the inverse solution technique to deduce the hydraulic conductivity and compressibility relationships for very soft clay using final settlement and steady-state flow data either from the laboratory or field testing. They also assumed that both the compressibility and hydraulic conductivity constitutive relationships can be described mathematically using power functions. Despite its comprehensive nature, Huerta et al. [92]’s method still requires direct measurement of the void ratio at the bottom of the sample, as well as an accurate calculation of the steady-state flow rate. This causes it to be an operator-dependent and challenging method. Each has some shortcomings that make application difficult, or at the very least make it cumbersome.
Znidarcic and Liu [93] developed a reliable testing procedure to assess the highly non-linear consolidation of dredged materials, which is mainly based on the hydraulic consolidation test proposed by Imai [88]. This testing procedure was improved, and a new analysis was developed [14,94,95]. The new testing and analysis procedure proposed by Abu-Hejleh et al. [14] for the seepage-induced consolidation test eliminates most of the shortcomings of the previous methods. The test procedure comprises three stages: (1) using sedimentation column to determine the zero effective stress void ratio, eo; (2) measuring the height of the specimen and pore water pressure difference within the specimen at steady-state flow rate; and (3) hydraulic conductivity and void ratio are measured for subsequent incremental loading at high effective stress.
Figure 6.
Schematic of the Seepage-Induced Consolidation Testing Equipment (Reprinted from permission from Tian et al. [96]. 2023, Copyright Clearance Center, Inc.).
Figure 6.
Schematic of the Seepage-Induced Consolidation Testing Equipment (Reprinted from permission from Tian et al. [96]. 2023, Copyright Clearance Center, Inc.).

Compared to the controlled head difference technique [88,92], the seepage induced consolidation test with the controlled flux rate has several benefits [14,89]: (1) the test is appropriate for measuring the void ratio and hydraulic conductivity in the low effective stress range (e.g., 0.01 to 50 kPa); (2) the flow pump allows for the accurate measurement of steady-state flow rates with a precision of 10−6 mL/s and for precise control low flow rates resulting in reliable measurements at low effective stresses for highly compressible waste materials and slurry-like soils; (3) the void ratio-effective stress and hydraulic conductivity-void ratio relationships can be obtained from a single test; (4) over the same effective-stress range, the time necessary to execute the seepage-induced consolidation test was 75% less than the time required to perform the step-loading consolidation test; and (5) the relationships are directly measured, with no requirement for the test results to be theoretically interpreted.
2.6. Compressibility Standpipe Test
Development of soil from slurry suspensions is governed by the process of sedimentation, in which soil particles suspended in water settle under the influence of gravitational force and create a layer of soil sediment on the top of the underlying sediment. As a result, the weight of the overlying sediment causes the underlying sediment to be consolidated [97]. Consolidation of slurried waste depositions under self-weight is a major problem in a variety of engineering areas such as surface disposal of mining tailings [12,44,98,99,100,101,102].
Been and Sills [90] presented laboratory experiments to study the development and self-weight consolidation of soft soils in self-weight consolidation columns, including measurements of density using non-destructive X-ray method, total stress, pore water pressure, and deformation. The findings of these experiments were compared to the predictions of the modified large strain self-weight consolidation theory that was proposed by Lee [33]. Subsequently, Sills [103,104] used a variety of self-weight consolidation columns to investigate the self-weight consolidation behavior of slurry-like soil of known density, including measurements of density using non-destructive X-ray method, compressibility, and excess pore water pressure.
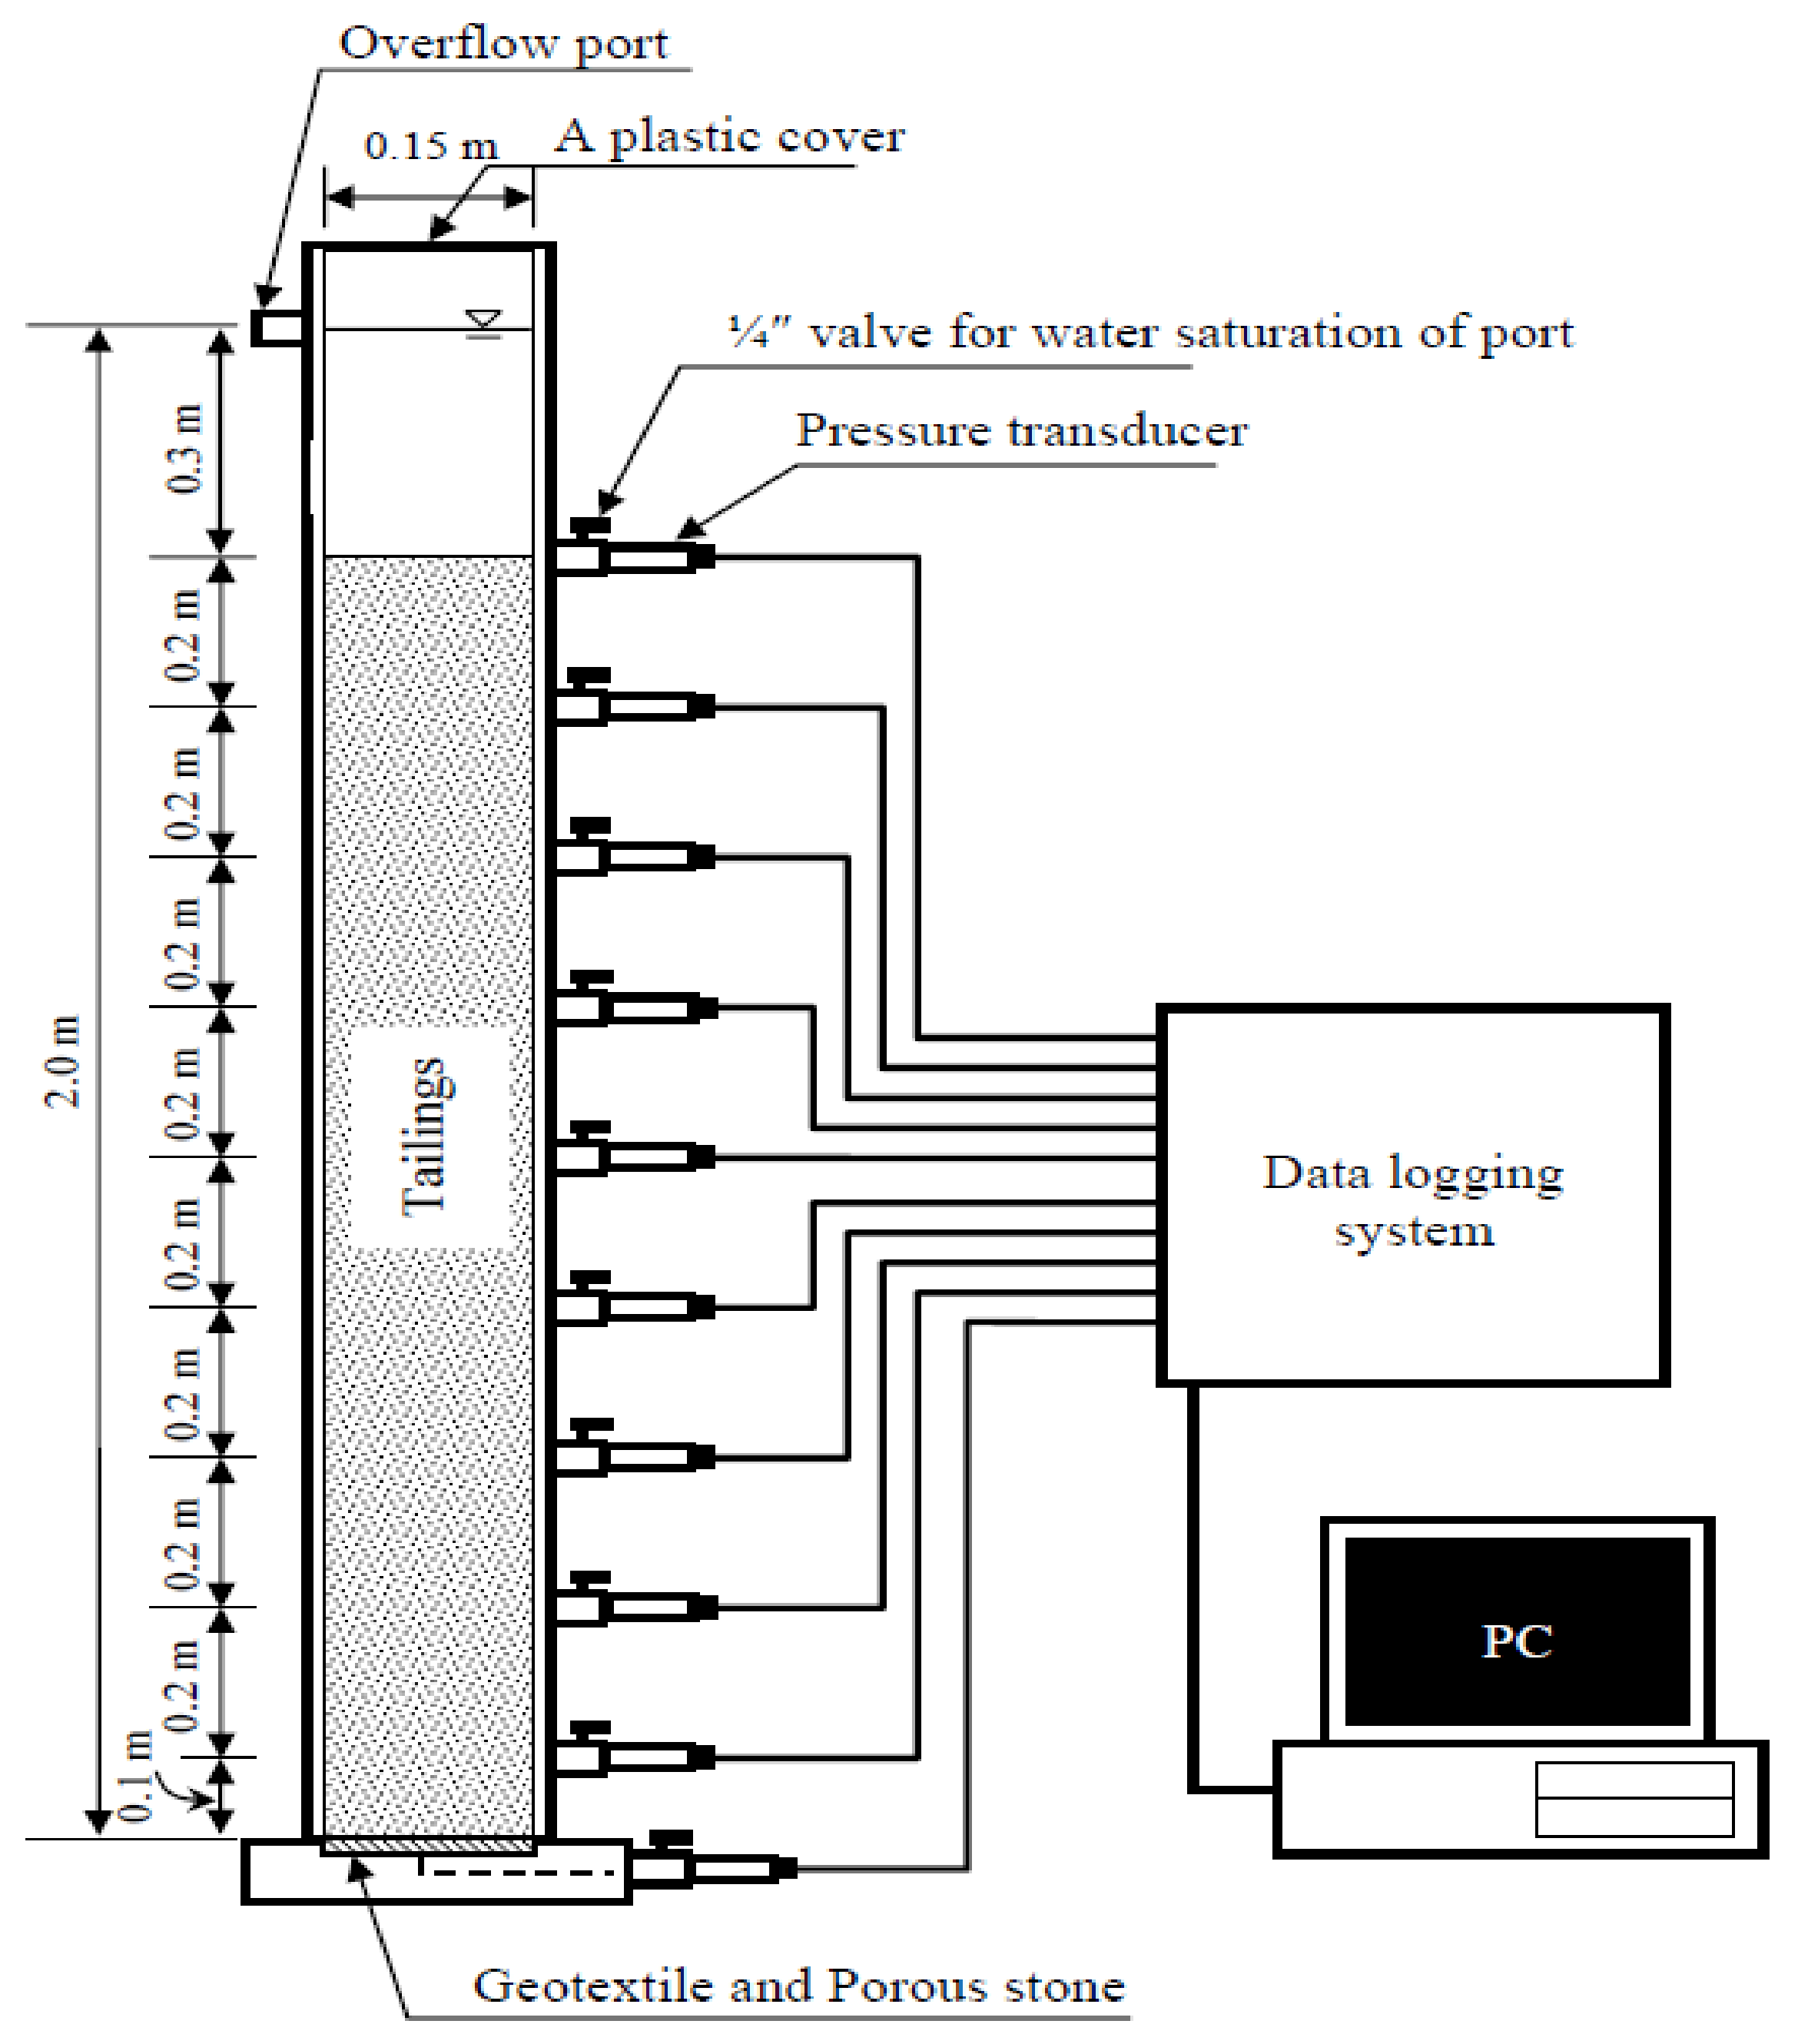
Self-weight consolidation tests on oil sands tailings (i.e., fluid find tailings and two mixes of fluid fine tailings and sand) were constructed by Syncrude Canada Ltd., using specimens 10 m high and 1 m in diameter [102]. The first step in the testing process is to conduct 2-m-high self-weight consolidation tests on sludge, sand-sludge, and overburden-sand-sludge mixtures at the University of Alberta as illustrated in Figure 7. The mixtures that show promising consolidation characteristics are then considered for testing in 10-m-high test cylinders. The main objective of these large-scale tests is to see whether slurry material properties obtained from both large strain slurry consolidation cells (i.e., 10-m-high cylinders) and 2-m-high consolidation tests, when integrated into the finite-strain consolidation mathematical model, can accurately predict the consolidation behavior of deep waste slurry deposits similar to those found in the field [102]. A 25-year monitoring period resulted in fluid fine tailings being deformed more than 30% by self-weight, but very little effective stress developed, while a mixture of fluid fine tailings and sand in standpipe #3 was compressed with substantial vertical effective stress development [105].
Wickland and Wilson [101] and Ou et al. [99] have conducted several self-weight column tests in which slurried deposition is deposited in a column by permitting downward drainage at the bottom of slurried depositions, without the use of any external hydraulic or mechanical triggers. These test techniques may thus be regarded as more suited for assessing the behavior of self-weight consolidation of slurry deposition.
A self-weight consolidation test was carried out by Li et al. [106] on slurried deposition by permitting drainage condition upward in order to measure the physical and hydraulic properties. These properties can be estimated by measuring the height of excess pore water pressure and the variation in thickness of consolidated sedimentation. It has been demonstrated by Li et al. [106] that the proposed testing approach is quite promising and effective in assessing the evolution of the physical and hydraulic characteristics of slurried deposition on an impermeable foundation based on the results of comparisons between experimental results and the proposed equations.
Babaoglu and Simms [107] have introduced a new self-weight consolidation column to evaluate the hydraulic conductivity-void ratio relationship using the Instantaneous Profiling Method (IPM), which was originally proposed by Watson [108]. In the Instantaneous Profiling Method (IPM), instantaneous profiles of macroscopic flow velocity and pore pressures are used in order to determine the hydraulic conductivity of the soil.
The compressibility standpipe test has the advantage of being simple to set up and carry out, allowing for the testing of multiple specimens at a low cost. However, the compressibility standpipe test is time-consuming when a low hydraulic conductivity specimen is tested. The 10 m high standpipe test on oil sands fine tailings could take 25 years to compress 3 m by self-weight [105].
2.7. Geotechnical Beam Centrifuge Test
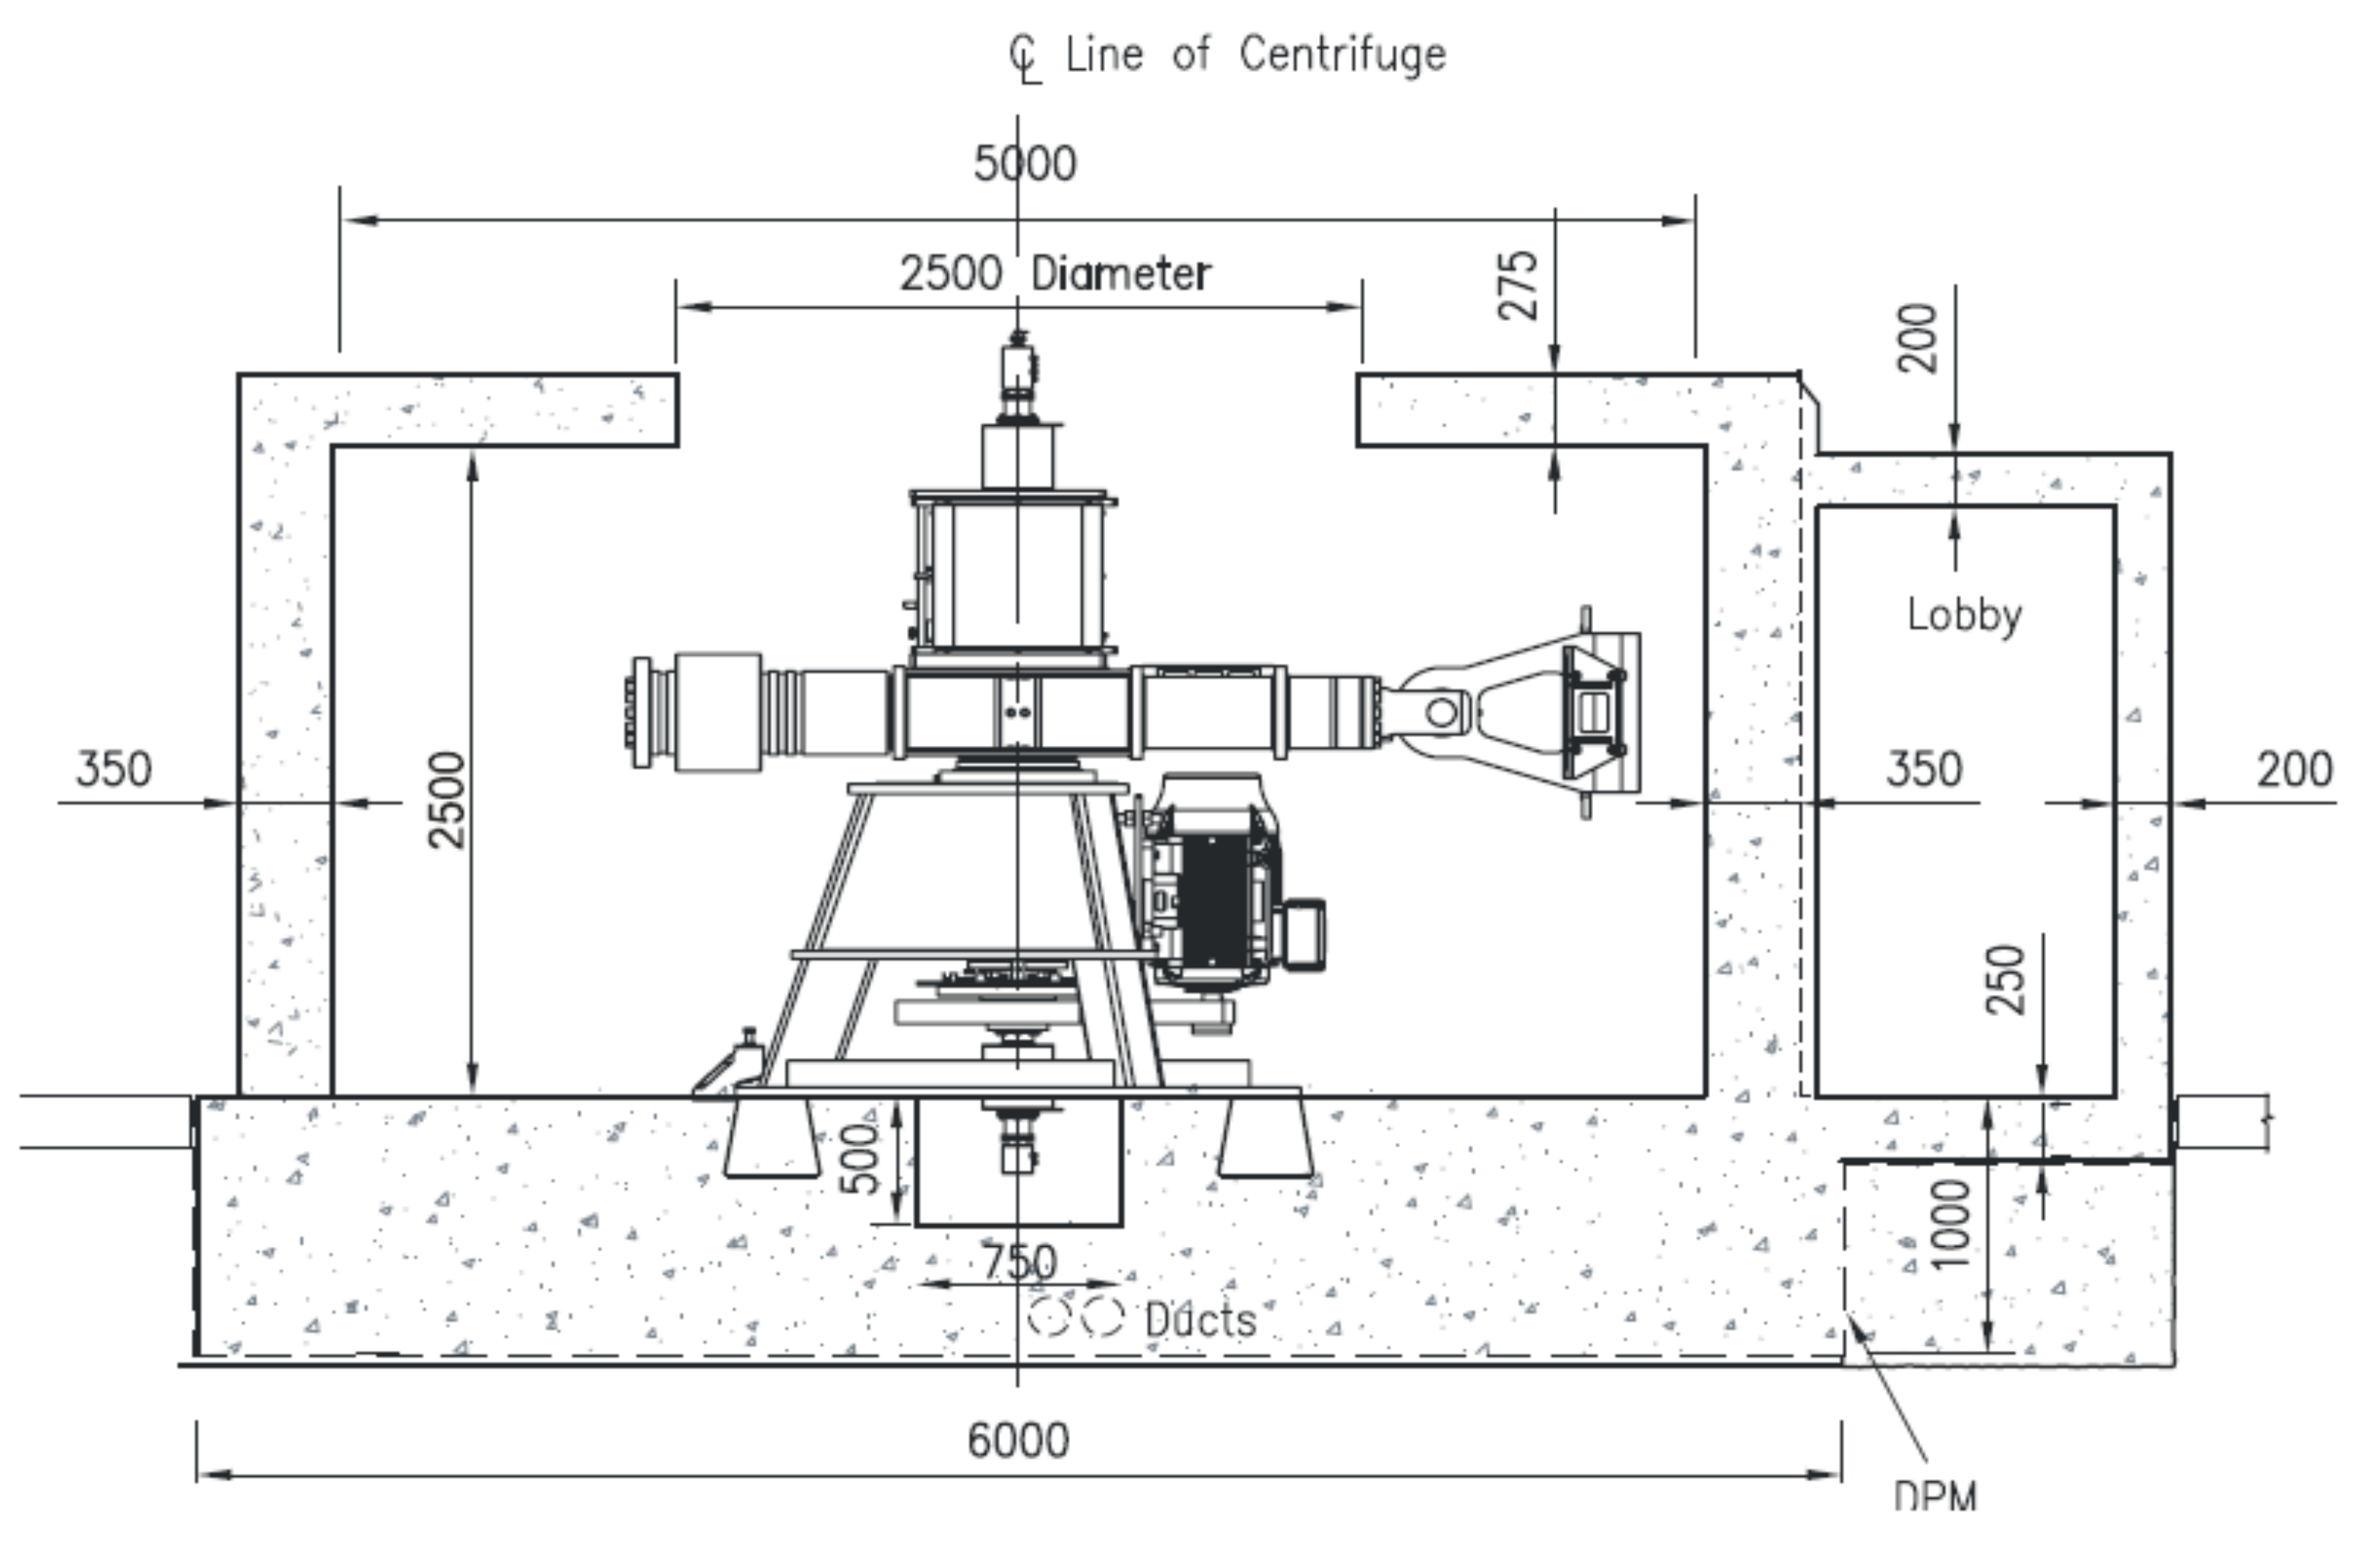
A geotechnical centrifuge is a machine that rotates an object around a fixed axis by applying a perpendicular centripetal force to the axis of rotation as illustrated in Figure 8. The geotechnical centrifuge-modeling technique encompasses the investigation of gravity-dependent geotechnical conditions using small-scale models, which are subjected to acceleration fields that are several times the gravitational acceleration of the Earth (g). The centrifuge-modeling technique, therefore, is particularly suited to geotechnical structures to simulate soil behavior in which the main driving force is gravity such as embankment construction, deposition and consolidation of mine waste, and self-weight consolidation [109,110,111,112,113,114,115].
The idea of centrifuge modeling is to apply the same stress in the model that the prototype experiences. The model is frequently a smaller scale replica of the prototype, which is especially true for centrifuge modeling. An appropriate scaling law must correlate the prototype to the model in order to correctly recreate a prototype response in a model or understand model findings as they pertain to prototype behavior. As an example of large strain consolidation, when modeling self-weight consolidation of tailings, the scaling laws for height and time in a geotechnical centrifuge model can be described by Equations (13) and (14), respectively. Geotechnical scaling laws between both the prototype and model in geotechnical centrifuge-modeling are summarized in Table 1.
where, hp is the specimen height in the prototype, hm is the specimen height in the centrifuged model, N is the ratio of the centrifuge acceleration (am) to Earth gravitational acceleration (g), tp is the elapsed-time in the prototype, and tm is the elapsed-time in the centrifuged model.
According to Ko [116], the four main uses of geotechnical centrifuges are as follows: modeling of prototypes, parametric studies, numerical modeling validation, and investigation of new phenomena. A centrifuge test has been used by numerous researchers to predict the field consolidation of phosphatic clays [117,118,119] and the consolidation behavior of flocculated clays [120]. Mikasa and Takada [121] and others [122,123] have also conducted theoretical studies of the consolidation process for centrifuge conditions in order to compare them to experimental results. Since the conventional oedometer test of slurry-like materials is not representative, Takada and Mikasa [124] used the centrifuge technique to obtain the consolidation parameters of these types of slurry-like materials. Croce et al. [123] also used a centrifuge to investigate the self-weight consolidation behavior of soft clay under single- or double-drainage conditions and then comparing the results with large strain numerical predictions.
Takada and Mikasa [124] derived the void ratio-effective stress relationship known as compressibility from the distribution of the final moisture content across the depth of the centrifuged model. They also proposed a formula to estimate the hydraulic conductivity–void ratio relationship based on the initial settling rate, which was assumed to be approximately linear. Nevertheless, this method necessitates a multiple of centrifuge model tests to be carried out at a varied initial void ratios in order to estimate the hydraulic conductivity-void ratio relationship [125]. With the help of a centrifuge test equipped with density and pore pressure transducers, Sorta [126] managed to determine the void ratio-effective stress and void ratio-hydraulic conductivity relationships of both oil sands tailings and kaolinite slurry, thereby avoiding the need to run any number of tests on the same samples. He derived the two constitutive relationships of void ratio function (i.e., compressibility and hydraulic conductivity) based on the slurry-water interface (i.e., interface-settlement), measured solids content, and pore water pressure distribution at different elapsed times, and by applying Darcy’s law, continuity principle, and using a material coordinate system.
The main disadvantages of this approach are: (1) there is a higher likelihood of particle segregation; (2) a centrifuge model has a non-linear vertical stress distribution [127]; (3) the centrifuge model test does not adequately represent the role of long-term chemical effects, thixotropy, and creep; (4) in terms of equipment, monitoring, and data interpretation, modeling the behavior of high void ratio materials such as FFT is more challenging than modeling the behavior of low void ratio materials [126]; and (5) there is no standardized process for converting centrifuge data to constitutive relationships. However, compared to conventional consolidation testing, the self-weight consolidation in the centrifuge test has several benefits [126]: (1) the self-weight consolidation process may be investigated in a short time span; (2) centrifuge modeling is more cost-effective, better regulated, easier, and more properly instrumented; and (3) because the large strain theory is very sensitive to consolidation parameters such as hydraulic conductivity, centrifuge modeling is more replicable than large strain theory prediction.
Figure 8.
Schematic of the geotechnical beam centrifuge equipment (Reprinted from permission from Black et al. [128]. 2023, Dr. Jonathan Black).
Figure 8.
Schematic of the geotechnical beam centrifuge equipment (Reprinted from permission from Black et al. [128]. 2023, Dr. Jonathan Black).

2.8. Bench-Top Centrifuge Test
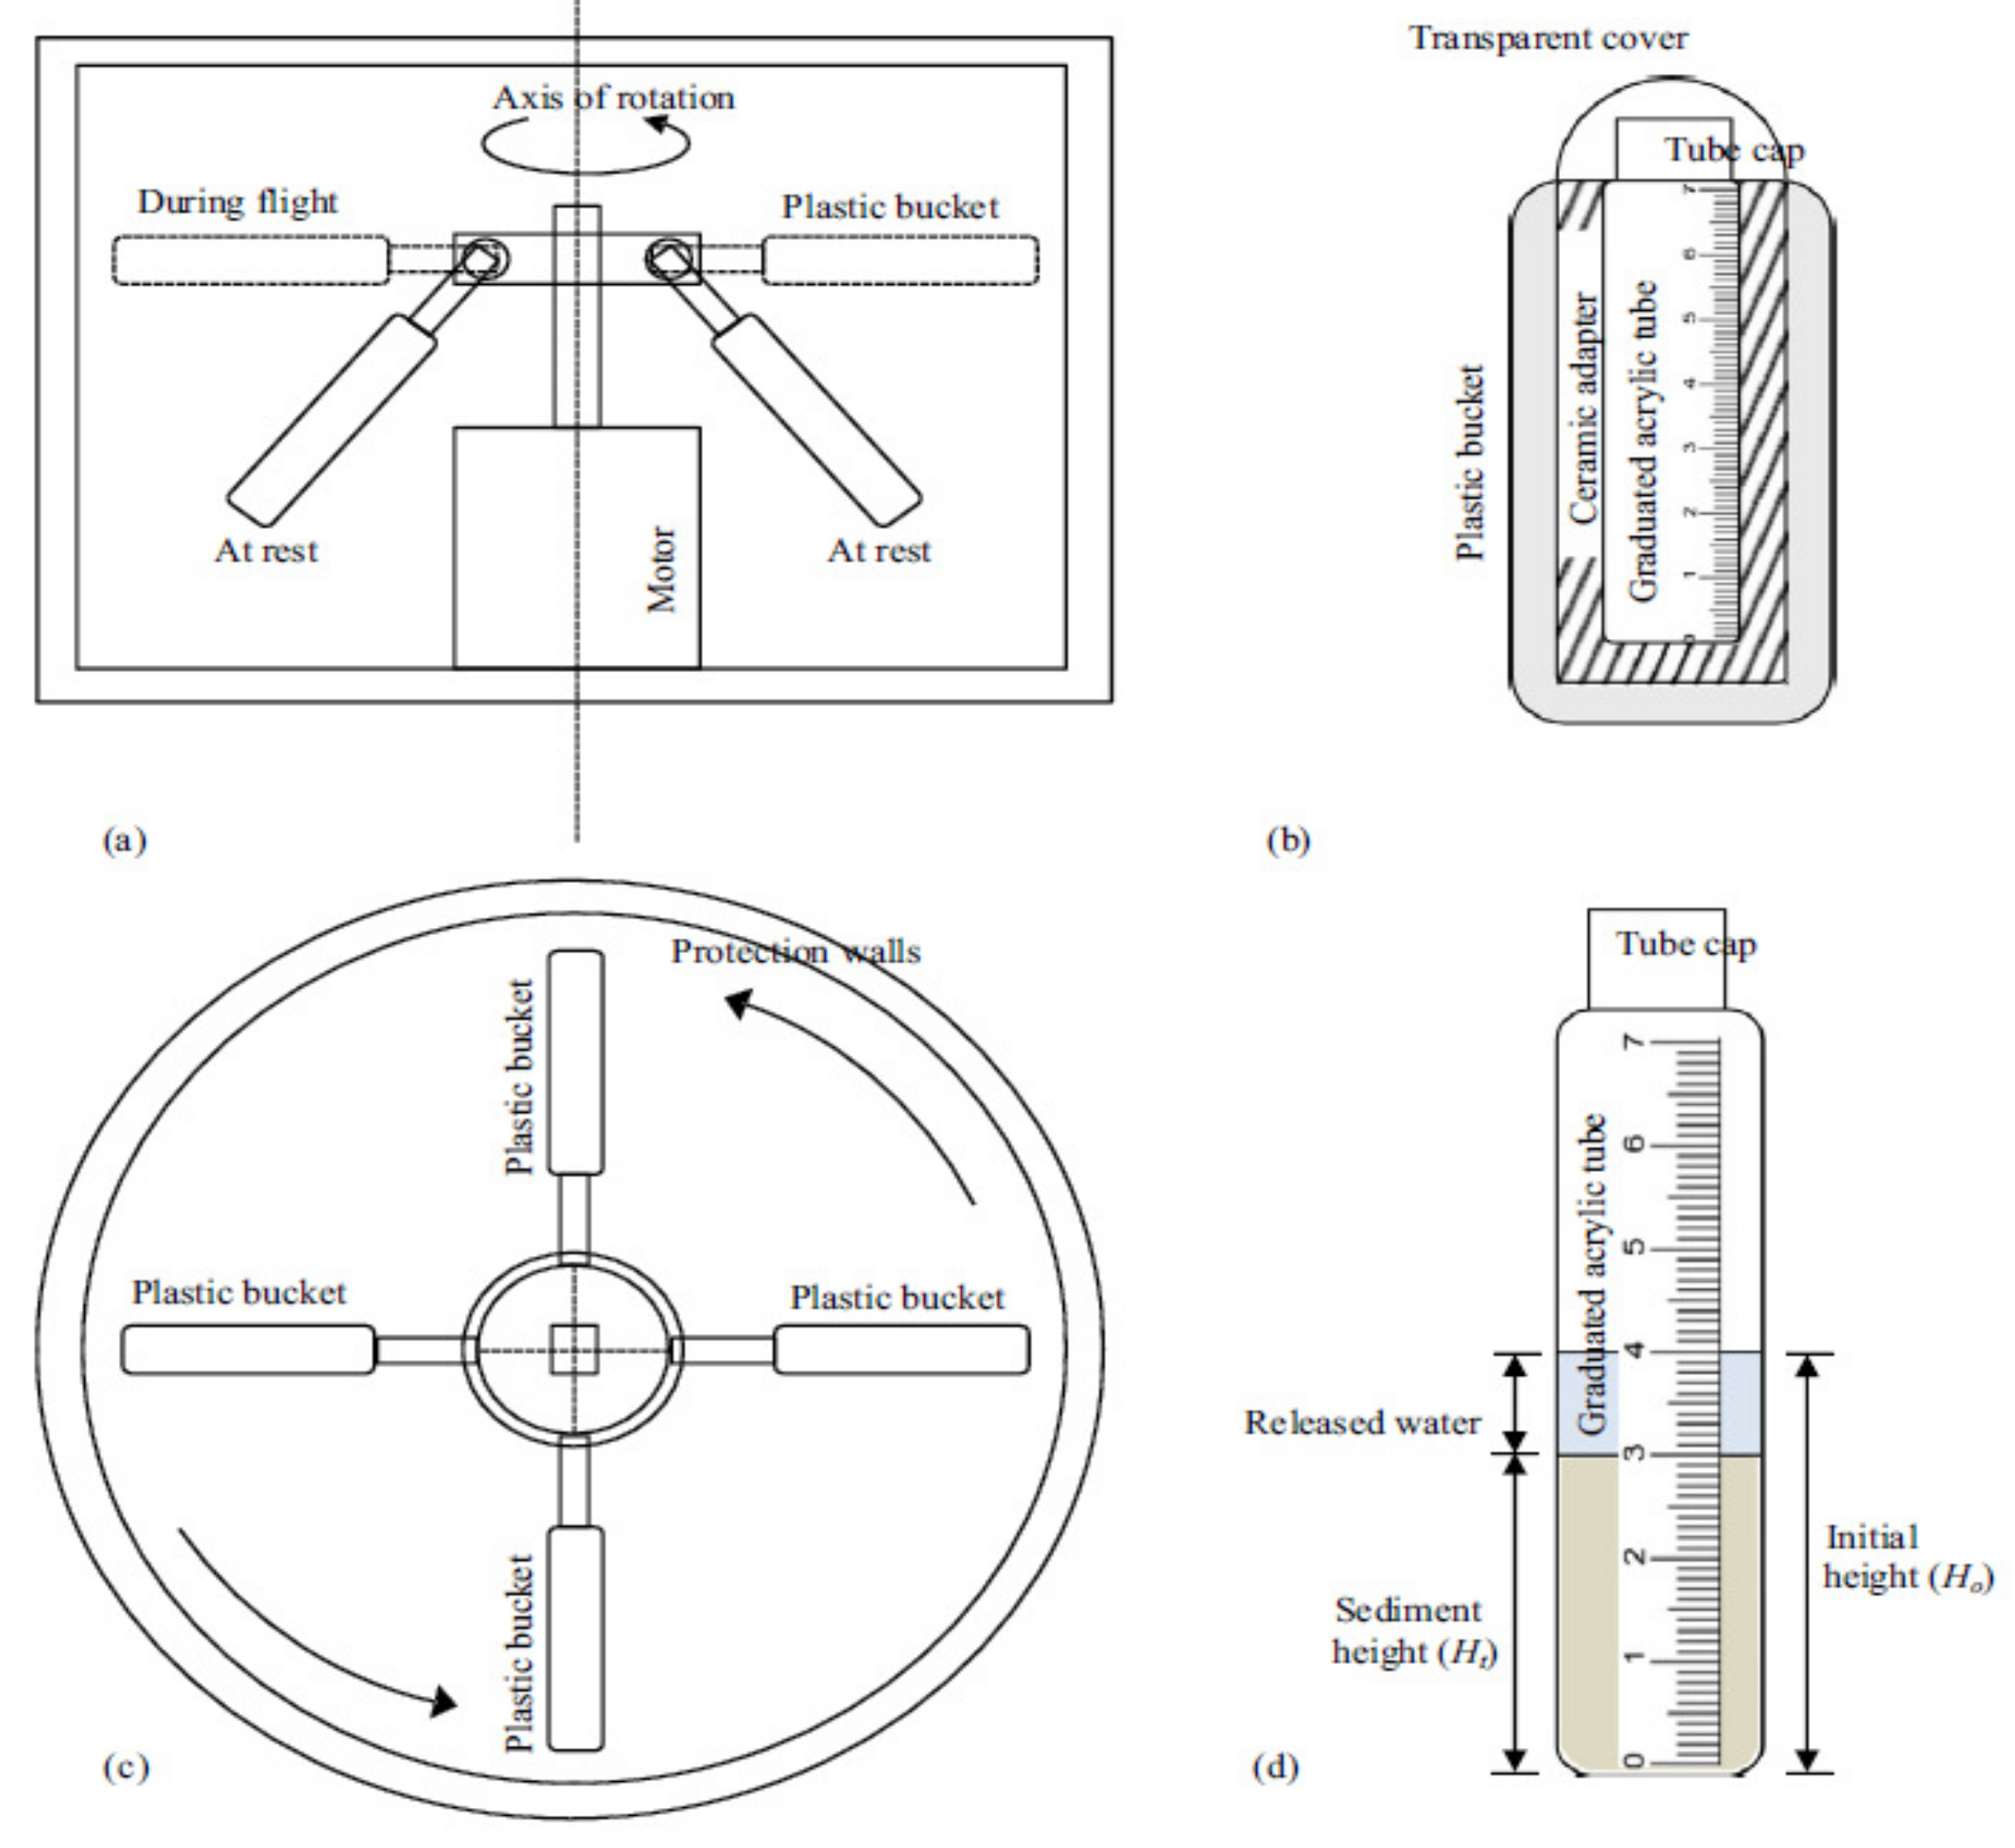
A bench-top centrifuge is a small-scale centrifuge that may be more suitable for smaller research laboratories with smaller spaces as illustrated in Figure 9. Centrifuge modeling is already a well-established method for studying soil behavior [129,130]. However, bench-top centrifuge, for example, has only been employed in a few studies to study the consolidation behavior of slurry-like materials.
McDermott and King [131] have conducted an accelerated consolidation testing of Speswhite kaolin clay in a bench-top centrifuge to determine the consolidation behavior of kaolin slurries at different initial moisture contents. The slurry samples were made by thoroughly mixing the kaolin powder with water to produce the desired moisture contents. In order to ensure the centrifuge was balanced during spinning, every chamber was weighed, and specimen added or removed until the total mass of the two filled chambers were within ± 0.1 g of each other. Their method for estimating hydraulic conductivity was derived from a formula developed by Takada and Mikasa [124]. According to Takada and Mikasa’s expression, the initial settling rate is approximately linear and therefore indicates the permeability at the start of the process. The void ratio-effective stress relationship was estimated from the final void ratio distribution across the depth of the samples in a way similar to that utilized by Takada and Mikasa [124].
El-Shall et al. [132] studied the consolidation behavior of phosphatic clays using a bench-top centrifuge with a radius of 55 mm. They consolidated each sample at different predetermined speeds for a prescribed period of time, where each sample was centrifuged five times at the same speed for equal intervals. In order to estimate the settlement, the height of mud line between the clay and the supernatant liquid was measured once the centrifuge had stopped at the end of each interval. The void ratio-effective stress and void ratio-hydraulic conductivity relationships were estimated by a mathematical model which is based on the first-order kinetics. Reid et al. [133] used a modified bench-top centrifuge to study the consolidation behavior of slurry-like soil (i.e., kaolin clay manufactured by Unimin Australia [134]). In order to prepare slurry samples, the kaolin was thoroughly mixed with deionized water to a 100 percent moisture content, and then the samples were de-aired by applying a suction of 100 kPa for approximately two hours. They developed the void ratio-effective stress profile based on the direct measurement of moisture content by taking one- or two-millimeter increments along the height of the samples after the completion of consolidation and assuming the samples are fully saturated. They developed an iterative numerical model using the finite-difference code FLAC v7.0 to estimate the effective stress-hydraulic conductivity profile of the tested samples to match the observed pore water pressure dissipation data.
Other researchers have also utilized the bench-top centrifuge, with a radius of 127.4 mm, to predict the consolidation behavior of clay slurries [50]. In their research, the void ratio at any time was calculated by measuring the height of interface of the sediments in a way similar to the technique that was used by El-Shall et al. [132]. They estimated the hydraulic conductivity from the settlement curves following the analysis that was proposed by Takada and Mikasa [124].
While each of the aforementioned modifications provided reasonable grounds for bench-top centrifuge to be utilized in studying the consolidation behavior of slurry-like soil, the comparatively small radius of rotation puts it in question. Relatively small radius of rotation may result in considerable variation in the centrifugal acceleration level (Ng) across the test specimen [130,135,136,137]. Muir Wood [130] reports that, provided the specimen height in the centrifuged model is less than about one-tenth of the radius of rotation, the variation of centrifugal acceleration level (Ng) across the specimen is often deemed negligible and can be presumed constant. However, if the specimen height in the centrifuged model is greater than one-tenth of the radius of rotation, the acceleration field as well as the acceleration ratio N, will vary, and therefore should not be taken as constant [130,137].
Figure 9.
Schematic of the bench-top centrifuge equipment: (a) side view; (b) section of the plastic bucket; (c) plan view; and (d) close up of the graduated tube (Reprinted from permission from Khan and Azam [50]. 2023, Elsevier).
Figure 9.
Schematic of the bench-top centrifuge equipment: (a) side view; (b) section of the plastic bucket; (c) plan view; and (d) close up of the graduated tube (Reprinted from permission from Khan and Azam [50]. 2023, Elsevier).

2.9. Restricted Flow Consolidation (RFC) Test
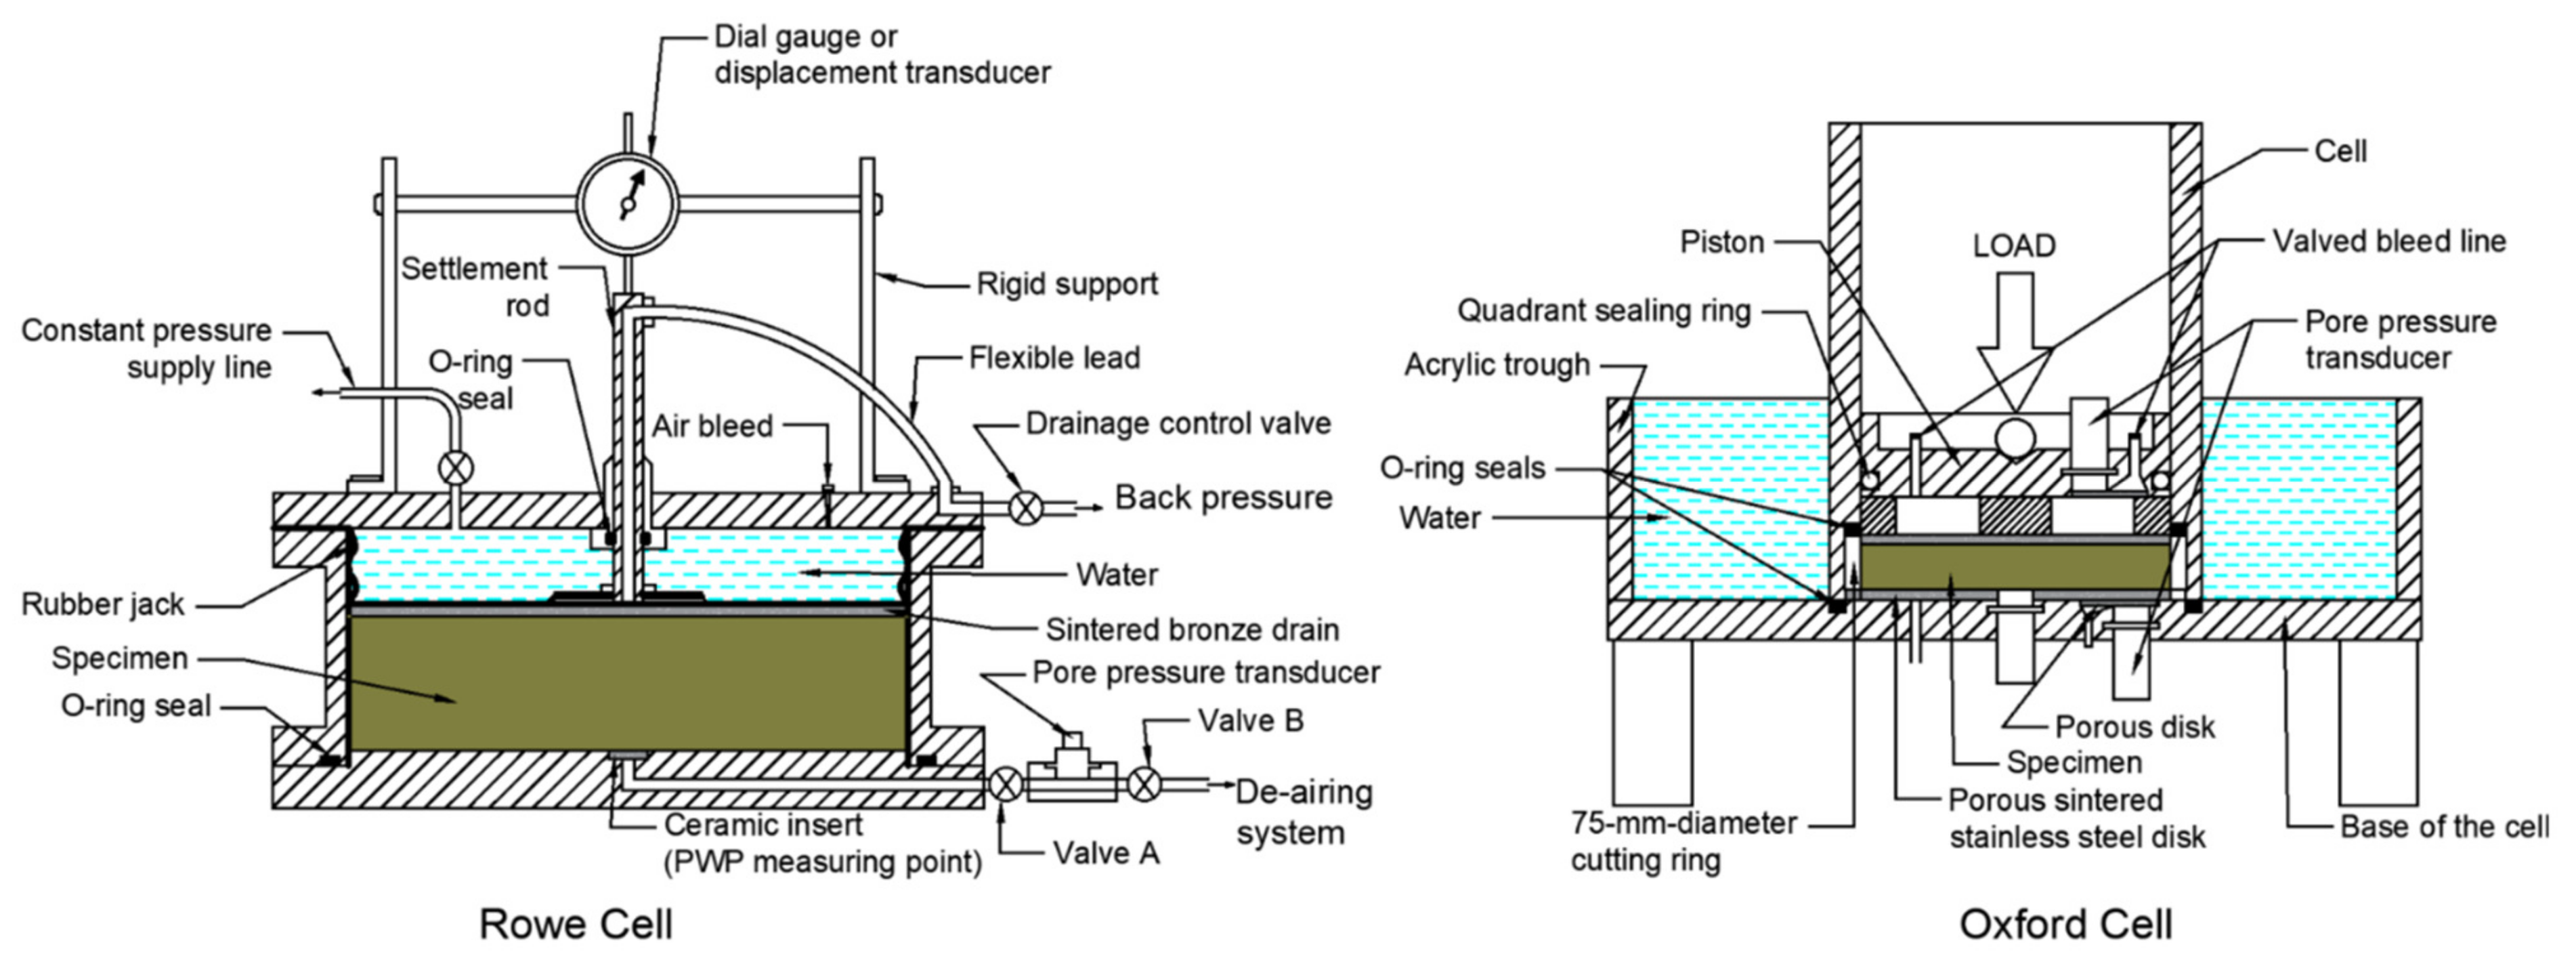
The restricted flow consolidation test was first proposed by Sills et al. [138] to assess the restricted flow technique in obtaining the stress-strain relationships of Combwich mud, which was thoroughly mixed to a uniform slurry at a moisture content of about 100 percent. The restricted flow consolidation test is based on the assumption that if the pore water pressure distribution across the specimen can be preserved nearly uniform during consolidation, then the effective stress and void ratio will be nearly uniform as well. Two different types of cells have been used and built specifically for this test as shown in Figure 10: a standard Rowe cell [139,140] and the Oxford cell [33,138]. The total stress can be applied using air pressure in the Rowe cell, whereas the loading in the Oxford cell can be applied using a regular loading frame or with an attachment that, like the Rowe cell, draws the load from a compressed air reservoir.
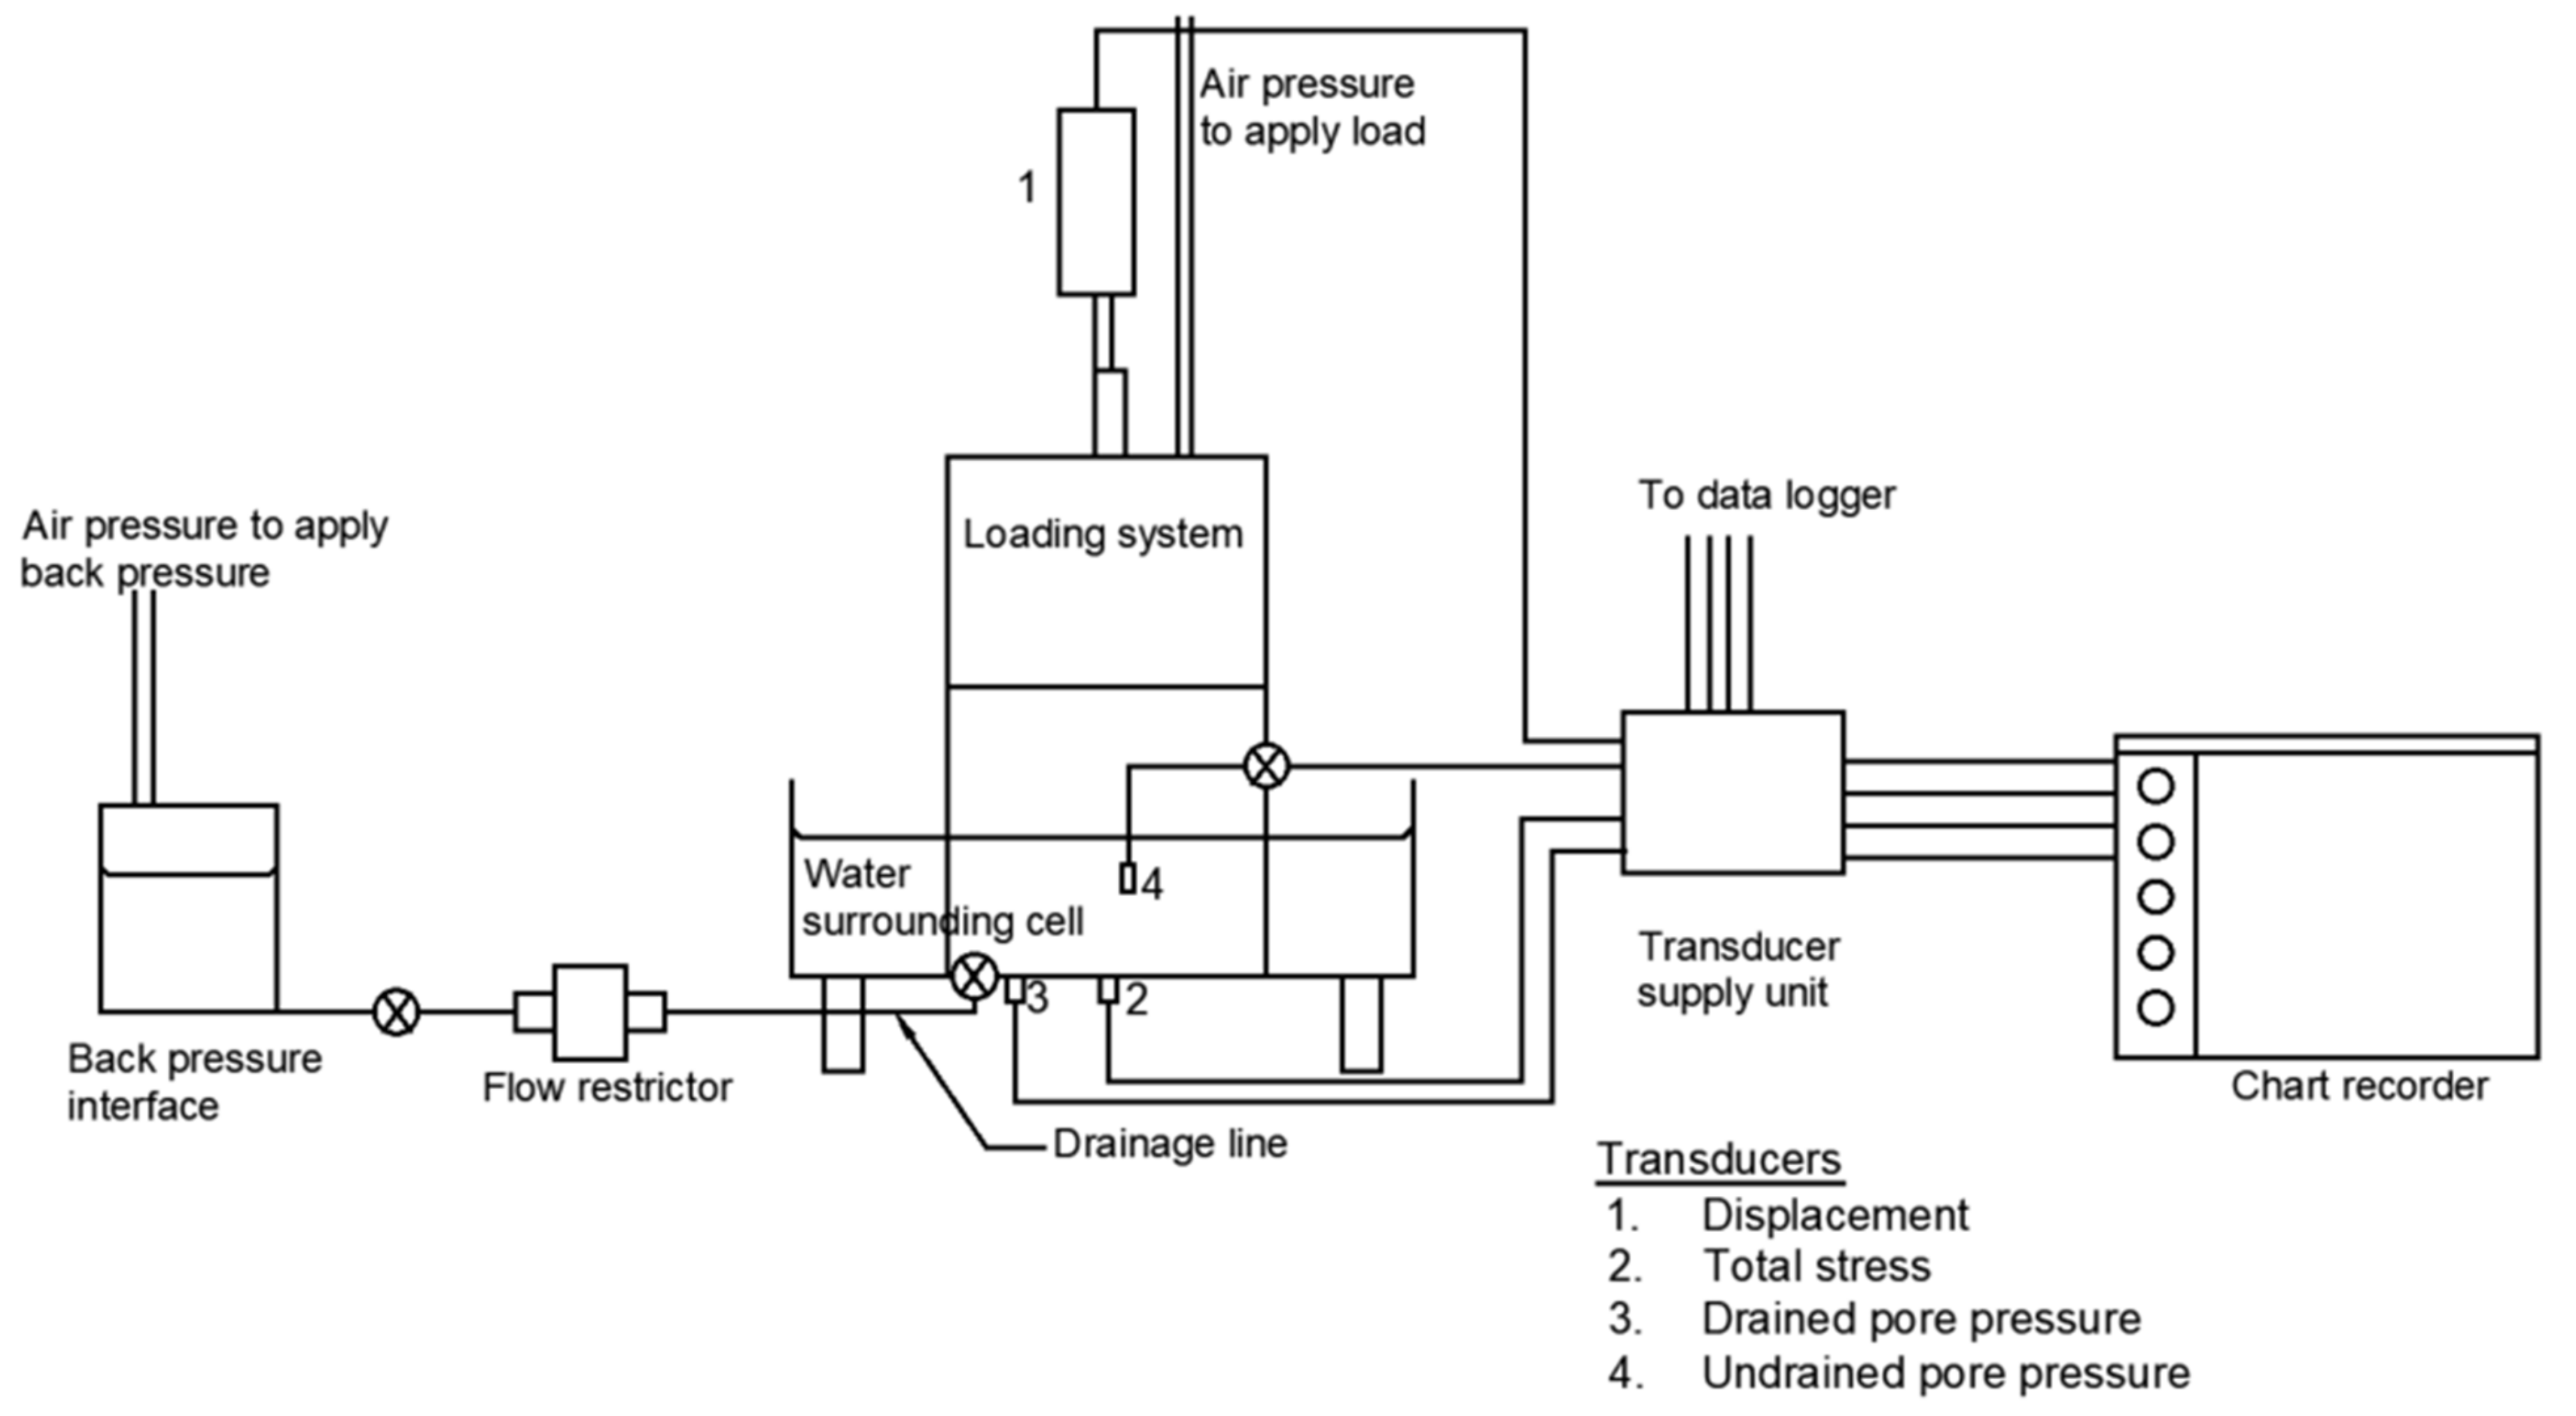
The test can constantly measure hydraulic conductivity during consolidation, as well as have a separate hydraulic conductivity measurement at the start and end of a consolidation test. The test can be implemented by applying the total stress as a discrete increment to one face of the specimen, and one-way drainage is only permitted from that face through a flow restrictor. The rate of drainage would be regulated by a flow restrictor in the drainage line. Pore water pressure transducers were installed in the base and on the piston, with a porous disk separating the active transducer face from the soil, and were used to measure pore water pressures at the drained and undrained faces of the specimen. Consequently, the hydraulic gradient across the specimen is determined by using the difference in pore water pressure at any time between the drained and undrained faces, as well as the current thickness of the specimen. The flow rate can be measured directly or computed from the compression or swelling of the specimen. Details of the restricted flow consolidation test arrangement are shown in Figure 11.
Figure 10.
Schematic of the basic configuration of the Rowe cell (Reprinted from permission from Rowe and Barden [139]. 2023, Copyright Clearance Center, Inc.) and the Oxford cell (Reprinted from permission from Sills et al. [138]. 2023, ASTM International).

Figure 11.
Schematic of the restricted flow consolidation test arrangement (Reprinted from permission from Sills et al. [138]. 2023, ASTM International).
Figure 11.
Schematic of the restricted flow consolidation test arrangement (Reprinted from permission from Sills et al. [138]. 2023, ASTM International).

This testing method has various advantages over the conventional oedometer consolidation test [138]: (1) the testing procedure is simple enough for any laboratory to instrument; (2) the test was able to overcome the limitations of the conventional oedometer consolidation test of obtaining a complete stress-strain curve by reducing the duration of the process in a matter of hours; and (3) its interpretation does not necessitate the use of any consolidation theory. Despite the fact that the restricted flow consolidation testing and interpretation methods are simple, the test has a number of drawbacks that prohibit it from being extensively used in practice: (1) in the case of low effective stress states, the procedure may be ineffective [14]; (2) the fundamental challenge of this test is obtaining an accurate measurement of the pore water pressure difference between the drained and undrained faces, especially when the difference at both ends of the specimen is minimal [138]; and (3) there is also the possibility of a leak developing anywhere between the undrained face and the downstream side of the flow restrictor [138].
3. Discussion
Large strain consolidation testing serves to measure the consolidation properties of the soil that undergoes large deformations and can only be explained by Gibson’s large strain consolidation theory. Thus, the analysis of the testing results must be coupled with the large strain consolidation theory. However, the test technique, setup, data interpretation, and associated assumptions all have a significant impact on how reliable the test data is. It is required that this information be documented in order to examine the effectiveness of the test method in quantifying the consolidation behavior of oil sands tailings. Thus far, the majority of research has concentrated on the reliability of the aforementioned large strain consolidation testing in quantifying the consolidation behavior of soils that undergo significant volumetric deformation. Laboratory tests that can be used to quantify the consolidation behavior of slurry-like soils are summarized in Table 2.
Modified conventional oedometer tests can help to determine the two constitute relationships of void ratio function. However, the small samples are not fully representative, and the direct measurement of the hydraulic conductivity may result in seepage-induced consolidation, especially in the low stress range (<1 kPa). For the compressibility standpipe test, the test is more reliable in simulating the consolidation behavior of oil sands tailings under self-weight. However, the compressibility standpipe test is time-consuming when a low hydraulic conductivity sample is tested.
The consolidation test techniques, including constant rate of deformation tests and controlled hydraulic gradient tests use an inversion of Terzaghi’s one-dimensional small-strain consolidation theory to back-calculate the consolidation parameters from a set of test data, limiting their applicability to soils that undergo significant volumetric deformation.
While the restricted flow consolidation test is simple and offers a speed advantage over the conventional oedometer test, it does not incorporate any consolidation theory in the data interpretation. Furthermore, the test procedure is not effective at the low effective stress states, which makes it unreliable when it comes to quantify the consolidation behavior of oil sands tailings within this range. Conversely, alternative consolidation test techniques, such as multi-step loading large strain consolidation tests, large slurry consolidometer tests, and seepage induced consolidation tests are capable of quantifying the consolidation behavior at the very low effective stress states as low as 0.1 kPa (e.g., self-weight conditions). These test techniques are widely employed as a tool of quantifying the consolidation behavior of slurry and tailings materials including Alberta’s oil sands. However, as the consolidation process progressed in the large strain consolidation testing, the formation of gas may occur due to biogeochemical changes and can cause issues. This can be demonstrated during the test by either no flow or a delay before flow occurs. The problem is more prevalent in the low gradient tests, while the higher gradient tests are more able to force water through. Therefore, at any given void ratio, the hydraulic conductivity of oil sand tailings decreases as the hydraulic gradient increases [65,141]. This makes the hydraulic conductivity of oil sand tailings dependent on the hydraulic gradient as higher hydraulic gradients can result in deformation of bitumen and/or migration of fine particles at high void ratios, leading to erroneous hydraulic conductivity results [65,141]. However, the hydraulic gradient impact might be negligible at small void ratios (i.e., void ratios less than 1.0).
Segregation is a phenomenon in which similar-sized or-property components preferentially accumulate in one or more physical zones of the assembly. In tailings ponds, where segregation is a typical phenomenon, segregation happens with the heaviest particles, such as sand, sinking to the bottom of the ponds. In centrifuge testing, the segregation of the heaviest particles is more likely to happen, and the risk of segregation during centrifuge modeling has been acknowledged by Mikasa and Takada [121] and others [119,125]. Segregation due to high gravity applications would cause specimen behavior in the centrifuge model to deviate from the prototype. It would also limit the mixtures that could be utilized in centrifuge testing as well as the range of consolidation parameters that could be determined from the experiments [126]. Finally, the consolidation data from the bench-top centrifuge test are in reasonable agreement with the results that were obtained from the traditional oedometer test, and Rowe cell on the same materials [50,133]. In spite of the obtained results from the bench-top centrifuge seeming to typically correlate with traditional testing, within reasonable bounds, more experiments should be performed to see if this degree of accuracy is consistent with different materials. Broadly speaking, centrifuge testing can give a much shorter turnaround timeframe than the other large strain consolidation tests mentioned herein. This would be beneficial for the oil sands tailings industry in terms of accelerated analysis and planning, preliminary assessment and screening, and tailings quality control and assurance. However, tests such as large slurry consolidometer, multi-step loading large strain consolidation test, and SICT are significantly important when it comes to detailed assessment of long-term geotechnical stability of oil sands tailings landform after closure, volume of the oil sands tailings storage facilities, and chemical mass loading. Yet, a comparison and understanding of the centrifuge testing results are still required alongside those of other large strain consolidation tests.

Table 2.
Summary of the large strain consolidation tests.
| Type of Consolidation Test | Test Procedure, Specimen Dimensions and Theory Used for Data Analysis | Limitations |
|---|---|---|
| Modified Conventional Oedometer Test [53,54,55,56,57] |
|
|
| Multi-step Loading Large Strain Consolidation Test [34,64,71,142,143] |
|
|
| Constant Rate of Deformation Test [73,75,78,79,80,87,144] |
|
|
| Controlled Hydraulic Gradient Test [75,83,87,144] |
|
|
| Seepage Induced Consolidation Test [96,145,146] |
|
|
| Compressibility Standpipe Test [34,90,101,102,107,147,148] |
|
|
| Geotechnical Beam Centrifuge Test [49,125,126,127,136,149,150,151] |
|
|
| Bench-top Centrifuge Test [50,131,132,133,135,152,153] |
|
|
| Restricted Flow Consolidation Test [14,138,154] |
|
|
Note: Ho = height of the specimen, Do = specimen diameter, e—σ′ = compressibility, k = hydraulic conductivity, LSC = large strain consolidation theory, SSC = small-strain consolidation theory, MLSC = multi-step loading large strain consolidation test, e = void ratio, σ′ = effective stress, OSTs = oil sands tailings, SF = sandy-fine tailings, T = transition tailings, F = fine tailings. Classification of tailings (e.g., SF, T, and F) is based on Unified Oil Sands Classification System (UOSTCS). Typical range (e.g., height, diameter, effective stress, strain rate, and centrifuge radius) represents the information that was publicly accessible at the time of review. With proper modification of the apparatus, this range can change. The indirect approach is one that relies on theoretical assumptions/inverse analyses, as well as assumed relationships to determine the results. By contrast, the direct approach is one that does not necessitate the use of such things. 1 Tailings specimen should be below static segregation boundary for 1 g tests and below centrifuge segregation boundary for centrifuge testing.
In order to directly compare one test to another, a systematic comparison of these tests should be conducted using a range of oil sands tailings’ specimens (e.g., each test in triplicate) and compared on the basis of: the error in the well-replicated laboratory results of the test itself and between other tests; repeatability; and uncertainties associated with each test and how well these uncertainties can be eliminated. Finally, based on the information presented in this review, the consolidation behavior must be investigated through carefully conducted laboratory and in-situ research and analyses. Although this review does not focus on the in-situ field measurements, the numerical prediction based on the large strain consolidation theory must be compared with the field data (e.g., settlement, void ratio, and effective stress profiles, etc.) [155].
4. Conclusions
Consolidation of tailings remains a major challenge to mining planners and owners since consolidation has implications on stability, storage capacity, and final closure of the tailings storage facilities, so that even a small difference in the consolidation coefficient can be the difference of decades or centuries of consolidation time. Thus, a clear understanding of the consolidation behavior of tailings is crucial in order to show that oil sands tailings deposits are on the approved settlement trajectory towards reclamation.
Terzaghi’s one-dimensional, small-strain consolidation theory is unsuitable for slurry-like soils that are undergoing inherently large strains such as fluid fine tailings, whereas the one-dimensional large-strain consolidation theory proposed by Gibson et al., 1967 is more appropriate. Therefore, a variety of large strains testing methods have been developed in an attempt to determine the two constitutive relationships of void ratio function (i.e., compressibility and hydraulic conductivity) as well as address the key challenges regarding tailings consolidation.
The constitutive relationships obtained from these methods are dependent on data interpretation and its associated assumptions, nature of tested materials, field conditions, and the reliability of the test technique. Test techniques such as multi-step loading large strain consolidation test, large slurry consolidometer, and seepage induced consolidation test have been used throughout the world for the characterization of slurry-like materials (e.g., oil sands tailings). These testing methods demonstrated their ability to measure the consolidation behavior of slurry and tailings materials. Notwithstanding, these testing methods must be used cautiously when dealing with slurry materials that generate or contain gas.
With the long test duration that the test operator should expect when using the aforementioned three tests, centrifuge testing overcomes this problem by providing results at much faster rate and with reasonable agreement. However, segregation of the heaviest particles is more frequent in centrifuge testing, and the probability of segregation during centrifuge modeling is high. Lastly, the repeatability of these tests, as well as comparisons between various large strain consolidation testing, have not been extensively examined. These knowledge gaps surrounding the bias brought by these testing protocols and the models used to interpret the test results can affect the long-term geotechnical stability of tailings landforms after closure.
Finally, considering all the information that presented in the comparative table (i.e., Table 2), test techniques such as the multi-step loading large strain consolidation test, large slurry consolidometer, and seepage induced consolidation test alongside centrifuge testing are recommended. However, these tests should be carried out in triplicate on different oil sands tailings’ samples to allow for the assessment of the repeatability and reliability of each test method. The field vs. lab behavior of tailings is another major part that needs to be addressed but this is out of the scope of the current review.
Author Contributions
Writing—original draft preparation, M.A.; writing—review and editing, N.A.B. and H.K.; project administration, N.A.B.; supervision, N.A.B. and H.K. All authors have read and agreed to the published version of the manuscript.
Funding
This research was funded by the Natural Sciences and Engineering Research Council of Canada and Canada’s Oil Sands Innovation Alliance (NSERC/COSIA) Industrial Research Chair in Oil Sands Tailings Geotechnique (IRCPJ 460863-18).
Data Availability Statement
Not applicable.
Acknowledgments
The authors gratefully acknowledge research and financial support from the Natural Sciences and Engineering Research Council of Canada and Canada’s Oil Sands Innovation Alliance (NSERC/COSIA) Industrial Research Chair in Oil Sands Tailings Geotechnique. The authors would like to thank Ahlam Abdulnabi (Thurber Engineering Ltd.) for her ongoing support throughout this research.
Conflicts of Interest
The authors declare no conflict of interest. The funders had no role in the design of the study; in the collection, analyses, or interpretation of data; in the writing of the manuscript; or in the decision to publish the results.
References
- Government of Alberta. Oil Sands: Facts and Stats. 2021. Available online: https://www.alberta.ca/oil-sands-facts-and-statistics.aspx (accessed on 1 August 2022).
- Chalaturnyk, R.J.; Scott, J.D.; Özüm, B. Management of oil sands tailings. Pet. Sci. Technol. 2002, 20, 1025–1046. [Google Scholar] [CrossRef]
- Government of Alberta. Alberta’s Energy Resources Heritage: Oil Sands—The Hot Water Separation Process. 2022. Available online: http://www.history.alberta.ca/energyheritage/sands/unlocking-the-potential/the-scientific-and-industrial-research-council-of-alberta/the-hot-water-separation-process.aspx (accessed on 29 May 2022).
- Kasperski, K.L.; Mikula, R.J. Waste streams of mined oil sands: Characteristics and remediation. Elements 2011, 7, 387–392. [Google Scholar] [CrossRef]
- Alberta Energy Regulator. State of Fluid Tailings Management for Mineable Oil Sands, 2020; Alberta Energy Regulator: Calgary, AB, Canada, 2021; p. 124. [Google Scholar]
- COSIA. Deep Deposit Design Guide for Oil Sands Tailings; Canada’s Oil Sands Innovation Alliance—Deep Deposit Working Group: Calgary, AB, Canada, 2022; p. 260. Available online: https://cosia.ca/research/tailings (accessed on 13 December 2022).
- McKenna, G. Landscape Engineering and Sustainable Mine Reclamation. Ph.D. Thesis, University of Alberta, Department of Civil and Environmental, Edmonton, AB, Canada, 2002. [Google Scholar]
- OSTC; COSIA. Technical Guide for Fluid Fine Tailings Management; Oil Sands Tailings Consortium (OSTC) and Canada’s Oil Sands Innovation Alliance (COSIA): Calgary, AB, Canada, 2012; Available online: https://cosia.ca/node/57 (accessed on 13 December 2022).
- Alberta Energy Regulator. Directive 085: Fluid Tailings Management for Oil Sands Mining Projects. 2022, pp. 1–59. Available online: https://static.aer.ca/prd/documents/directives/Directive085.pdf (accessed on 13 December 2022).
- Hyndman, A.; Sawatsky, L.; McKenna, G.; Vandenberg, J. Fluid fine tailings processes: Disposal, capping, and closure alternatives. In Proceedings of the 6th International Oil Sands Tailings Conference, Edmonton, AB, Canada, 9–12 December 2018. [Google Scholar]
- McKenna, G.; Mooder, B.; Burton, B.; Jamieson, A. Shear strength and density of oil sands fine tailings for reclamation to a boreal forest landscape. In Proceedings of the Fifth International Oil Sands Tailings Conference (IOSTC), Lake Louis, AB, Canada, 4–7 December 2016. [Google Scholar]
- Carrier, D.; Bromwell, L.; Somogyi, F. Design capacity of slurried mineral waste ponds. J. Geotech. Eng. 1983, 109, 699–716. [Google Scholar] [CrossRef]
- Agapito, L.A.; Bareither, C.A. Application of a one-dimensional large-strain consolidation model to a full-scale tailings storage facility. Miner. Eng. 2018, 119, 38–48. [Google Scholar] [CrossRef]
- Abu-Hejleh, A.N.; Znidarčić, D.; Barnes, B.L. Consolidation characteristics of phosphatic clays. J. Geotech. Eng. 1996, 122, 295–301. [Google Scholar] [CrossRef]
- Cossey, H.L.; Batycky, A.E.; Kaminsky, H.; Ulrich, A.C. Geochemical Stability of Oil Sands Tailings in Mine Closure Landforms. Minerals 2021, 11, 830. [Google Scholar] [CrossRef]
- Morgenstern, N.R.; Vick, S.G.; van Zyl, D. Independent Expert Engineering Investigation and Review Panel Report on Mount Polley Tailings Storage Facility Breach; Government of British Columbia: Victoria, BC, Canada, 2015.
- Schafer, H.L.; Beier, N.A.; Macciotta, R. A Failure Modes and Effects Analysis Framework for Assessing Geotechnical Risks of Tailings Dam Closure. Minerals 2021, 11, 1234. [Google Scholar] [CrossRef]
- Arulrajah, A.; Choa, V. Large deformation of slurry-like soil. In Deformation and Progressive Failure in Geomechanics; Elsevier Science: Nagoya, Japan, 1997; p. 437. [Google Scholar]
- Schiffman, R.L. Finite and infinitesimal strain consolidation. J. Geotech. Eng. Div. 1980, 106, 203–207. [Google Scholar] [CrossRef]
- Terzaghi, K. Theory of Consolidation, in Theoretical Soil Mechanics. 1943, pp. 265–296. Available online: https://onlinelibrary.wiley.com/doi/abs/10.1002/9780470172766.ch13 (accessed on 2 September 2022).
- ASTM Committee D-18 on Soil and Rock. Standard Test Methods for One-Dimensional Consolidation Properties of Soils Using Incremental Loading; ASTM International: West Conshohocken, PA, USA, 2011. [Google Scholar]
- Mitchell, J.K.; Soga, K. Fundamentals of Soil Behavior; John Wiley & Sons: New York, NY, USA, 2005; Volume 3. [Google Scholar]
- Crawford, C.B. State of the art: Evaluation and interpretation of soil consolidation tests. Consol. Soils Test. Eval. 1986, 892, 71–103. [Google Scholar]
- Cryer, C. A comparison of the three-dimensional consolidation theories of Biot and Terzaghi. Q. J. Mech. Appl. Math. 1963, 16, 401–412. [Google Scholar] [CrossRef]
- Znidarcic, D.; Schiffman, R. On Terzaghi’s concept of consolidation. Geotechnique 1982, 32, 387–389. [Google Scholar] [CrossRef]
- Clayton, C.R.I.; Steinhagen, H.M.; Powrie, W. Terzaghi’s theory of consolidation, and the discovery of effective stress. (Compiled from the work of K. Terzaghi and A.W. Skempton). Proc. Inst. Civ. Eng.-Geotech. Eng. 1995, 113, 191–205. [Google Scholar] [CrossRef]
- Koppula, S.D. The Consolidation of Soil in Two Dimensions and with Moving Boundaries; National Library: Ottawa, ON, Canada, 1970. [Google Scholar]
- Caldwell, J.A.; Ferguson, K.; Schiffman, R.L.; Van Zyl, D. Application of finite strain consolidation theory for engineering design and environmental planning of mine tailings impoundments. In Sedimentation Consolidation Models—Predictions and Validation; ASCE: Reston, VA, USA, 1984. [Google Scholar]
- Gibson, R.; England, G.; Hussey, M. The Theory of one-dimensional consolidation of saturated clays: 1. finite non-Linear consolidation of thin homogeneous layers. Geotechnique 1967, 17, 261–273. [Google Scholar] [CrossRef]
- Ito, M.; Azam, S. Large-strain consolidation modeling of mine waste tailings. Environ. Syst. Res. 2013, 2, 7. [Google Scholar] [CrossRef]
- Somogyi, F. Large strain consolidation of fine grained slurries. In Proceedings of the Canadian Society for Civil Engineering, Winnipeg, Manitoba, 29 May 1980; pp. 29–30. [Google Scholar]
- Gibson, R.E.; Schiffman, R.L.; Cargill, K.W. The theory of one-dimensional consolidation of saturated clays. II. Finite nonlinear consolidation of thick homogeneous layers. Can. Geotech. J. 1981, 18, 280–293. [Google Scholar] [CrossRef]
- Lee, K. An Analytical and Experimental Study of Large Strain Soil Consolidation; University of Oxford: Oxford, UK, 1979. [Google Scholar]
- Jeeravipoolvarn, S. Geotechnical Behavior of In-Line Thickened Oil Sands Tailings. Master’s Thesis, University of Alberta, Department of Civil and Environmental, Edmonton, AB, Canada, 2010. [Google Scholar]
- Koppula, S.; Morgenstern, N. On the consolidation of sedimenting clays. Can. Geotech. J. 1982, 19, 260–268. [Google Scholar] [CrossRef]
- Schiffman, R.; Cargill, K. Finite strain consolidation of sedimenting clay deposits. In Proceedings of the 10th International Conference on Soil Mechanics and Foundation Engineering, Stockholm, UK, 15–19 June 1981; Volume 1, pp. 239–242. [Google Scholar]
- Krizek, R.J.; Somogyi, F. Perspectives on modelling consolidation of dredged materials. In Unknown Host Publication Title; ASCE: Reston, VA, USA, 1984; pp. 296–332. [Google Scholar]
- Bromwell, L.G. Consolidation of mining wastes. In Sedimentation Consolidation Models—Predictions and Validation; ASCE: Reston, VA, USA, 1984. [Google Scholar]
- Bartholomeeusen, G.; Sills, G.C.; Znidarčić, D.; Van Kesteren, W.; Merckelbach, L.M.; Pyke, R.; Carrier, W.D., III; Lin, H.; Penumadu, D.; Winterwerp, H.; et al. Sidere: Numerical prediction of large-strain consolidation. Géotechnique 2002, 52, 639–648. [Google Scholar] [CrossRef]
- Cargill, K.W. Consolidation of Soft Layers by Finite Strain Analysis; U.S. Army Engineer Research and Development Center (ERDC): Vicksburg, MI, USA, 1982; Available online: https://hdl.handle.net/11681/10139 (accessed on 15 October 2022).
- Jeeravipoolvarn, S.; Chalaturnyk, R.; Scott, J. Consolidation modeling of oil sands fine tailings: History matching. In Proceedings of the GeoEdmonton’08, Edmonton, AB, Canada, 21–24 September 2008; pp. 190–197. [Google Scholar]
- Liu, J.-C.; Znidarčić, D. Modeling one-dimensional compression characteristics of soils. J. Geotech. Eng. 1991, 117, 162–169. [Google Scholar] [CrossRef]
- Townsend, F.; McVay, M. SOA: Large strain consolidation predictions. J. Geotech. Eng. 1990, 116, 222–243. [Google Scholar] [CrossRef]
- Morris, P.; Lockington, D.; Apelt, C. Correlations for mine tailings consolidation parameters. Int. J. Surf. Min. Reclam. Environ. 2000, 14, 171–182. [Google Scholar] [CrossRef]
- Carrier, W.; Beckman, J. Correlations between index tests and the properties of remoulded clays. Geotechnique 1984, 34, 211–228. [Google Scholar] [CrossRef]
- Morris, P.H.; Lockington, D.A. Geotechnical Compressibility and Consolidation Parameters and Correlations for Remoulded Fine-Grained Marine and Riverine Sediments; CRC for Sustainable Tourism: Boca Raton, FL, USA, 2002. [Google Scholar]
- Morris, P. Compressibility and permeability correlations for fine-grained dredged materials. J. Waterw. Port Coast. Ocean. Eng. 2003, 129, 188–191. [Google Scholar] [CrossRef]
- Morris, P. Correlations for zero effective stress void ratio of fine-grained marine and riverine sediments. J. Waterw. Port Coast. Ocean. Eng. 2007, 133, 305–308. [Google Scholar] [CrossRef]
- Robinson, R.; Tan, T.; Lee, F. A comparative study of suction-induced seepage consolidation versus centrifuge consolidation. Geotech. Test. J. 2003, 26, 92–101. [Google Scholar]
- Khan, F.S.; Azam, S. Determination of consolidation behavior of clay slurries. Int. J. Min. Sci. Technol. 2016, 26, 277–283. [Google Scholar] [CrossRef]
- Proskin, S.; Sego, D.; Alostaz, M. Freeze–thaw and consolidation tests on Suncor mature fine tailings (MFT). Cold Reg. Sci. Technol. 2010, 63, 110–120. [Google Scholar] [CrossRef]
- Schiffman, R.L. The consolidation of soft marine sediments. Geo-Mar. Lett. 1982, 2, 199–203. [Google Scholar] [CrossRef]
- Hong, Z.-S.; Yin, J.; Cui, Y.-J. Compression behavior of reconstituted soils at high initial water contents. Géotechnique 2010, 60, 691–700. [Google Scholar] [CrossRef]
- Xu, G.; Gao, Y.; Yin, J.; Yang, R.; Ni, J. Compression behavior of dredged slurries at high water contents. Mar. Georesour. Geotechnol. 2015, 33, 99–108. [Google Scholar] [CrossRef]
- Xu, G.; Gao, Y.-F.; Xu, C. Permeability behavior of high-moisture content dredged slurries. Mar. Georesour. Geotechnol. 2015, 33, 348–355. [Google Scholar] [CrossRef]
- Tavenas, F.; Jean, P.; Leblond, P.; Leroueil, S. The permeability of natural soft clays. Part II: Permeability characteristics. Can. Geotech. J. 1983, 20, 645–660. [Google Scholar] [CrossRef]
- Tavenas, F.; Leblond, P.; Jean, P.; Leroueil, S. The permeability of natural soft clays. Part I: Methods of laboratory measurement. Can. Geotech. J. 1983, 20, 629–644. [Google Scholar] [CrossRef]
- Zeng, L.L.; Hong, Z.S.; Cai, Y.Q.; Han, J. Change of hydraulic conductivity during compression of undisturbed and remolded clays. Appl. Clay Sci. 2011, 51, 86–93. [Google Scholar] [CrossRef]
- Pane, V.; Croce, P.; Znidarčić, D.; Ko, H.Y.; Olsen, H.W.; Schiffman, R.L. Effects of consolidation on permeability measurements for soft clay. Geotechnique 1983, 33, 67–72. [Google Scholar] [CrossRef]
- Sheeran, D.; Krizek, R. Preparation of homogeneous soil samples by slurry consolidation. J. Mater. 1971, 6, 356–373. [Google Scholar]
- Monte, J.L.; Krizek, R. One-dimensional mathematical model for large-strain consolidation. Geotechnique 1976, 26, 495–510. [Google Scholar] [CrossRef]
- ASTM. Standard Test Method for Permeability of Granular Soils (Constant Head); ASTM International: West Conshohocken, PA, USA, 2019. [Google Scholar]
- Caughill, D.L. Geotechnics of Nonsegregating Oil Sand Tailings. Master’s Thesis, University of Alberta, Edmonton, AB, Canada, 1992. [Google Scholar] [CrossRef]
- Azam, S. Large strain settling behavior of polymer-amended laterite slurries. Int. J. Geomech. 2011, 11, 105–112. [Google Scholar] [CrossRef]
- Pollock, G.W. Large Strain Consolidation of Oil Sand Tailings Sludge. Ph.D. Thesis, University of Alberta, Department of Civil and Environmental, Edmonton, AB, Canada, 1988. [Google Scholar]
- Suthaker, N. Geotechnics of Oil sand Tailings. Ph.D. Thesis, University of Alberta, Edmonton, AB, Canada, 1995. [Google Scholar]
- Shokouhi, A.; Williams, D.J. Volume change behavior of mixtures of coarse coal reject and tailings. Min. Technol. 2017, 126, 163–176. [Google Scholar] [CrossRef]
- Shokouhi, A.; Zhang, C.; Williams, D.J. Settling, consolidation and desiccation behavior of coal tailings slurry. Min. Technol. 2018, 127, 1–11. [Google Scholar] [CrossRef]
- Islam, S.; Williams, D.J.; Bhuyan, M.H. Consolidation testing of tailings in a slurry consolidometer using constant rate and accelerated loading. Proc. Inst. Civ. Eng. Geotech. Eng. 2021. ahead of print. [Google Scholar] [CrossRef]
- Islam, S.; Williams, D.J.; Zhang, C.; Llano-Serna, M. Geotechnical characterisation of coal tailings down the beach and constant rate of loading consolidation in a slurry consolidometer. Min. Technol. 2021, 130, 67–80. [Google Scholar] [CrossRef]
- He, W.; Williams, D.; Shokouhi, A. Numerical study of slurry consolidometer tests taking into account the influence of wall friction. Comput. Geotech. 2017, 91, 39–47. [Google Scholar] [CrossRef]
- Hamilton, J.J.; Crawford, C.B. Improved Determination of Preconsolidation Pressure of a Sensitive Clay; ASTM International: West Conshohocken, PA, USA, 1959; pp. 254–271. [Google Scholar]
- Znidarcic, D.; Croce, P.; Pane, V.; Olsen, H.W.; Schiffman, R.L. The theory of one-dimensional consolidation of saturated clays: III. existing testing procedures and analyses. Geotech. Test. J. 1984, 7, 123–134. [Google Scholar]
- Crawford, C.B. Interpretation of the consolidation test. J. Soil Mech. Found. Div. 1964, 90, 87–102. [Google Scholar] [CrossRef]
- Gorman, C.T.; Hopkins, T.C.; Deen, R.C.; Drnevich, V.P. Constant-rate-of-strain and controlled-gradient consolidation testing. Geotech. Test. J. 1978, 1, 3–15. [Google Scholar]
- Smith, R.E.; Wahls, H.E. Consolidation under constant rates of strain. J. Soil Mech. Found. Div. 1969, 95, 519–539. [Google Scholar] [CrossRef]
- Wissa, A.E.; Christian, J.T.; Davis, E.H.; Heiberg, S. Consolidation at constant rate of strain. J. Soil Mech. Found. Div. 1971, 97, 1393–1413. [Google Scholar] [CrossRef]
- Znidarčić, D.; Schiffman, R.L.; Pane, V.; Croce, P.; Ko, H.Y.; Olsen, H.W. The theory of one-dimensional consolidation of saturated clays: Part V, constant rate of deformation testing and analysis. Géotechnique 1986, 36, 227–237. [Google Scholar] [CrossRef]
- Umehara, Y.; Zen, K. Constant rate of strain consolidation for very soft clayey soils. Soils Found. 1980, 20, 79–95. [Google Scholar] [CrossRef]
- Lee, K. Consolidation with constant rate of deformation. Geotechnique 1981, 31, 215–229. [Google Scholar] [CrossRef]
- González, J.H. Experimental and Theoretical Investigation of Constant Rate of Strain Consolidation; Massachusetts Institute of Technology: Singapore, 2000. [Google Scholar]
- Crawford, C. The Influence of Rate of Strain on Effective Stresses in Sensitive Clay; ASTM International: West Conshohocken, PA, USA, 1960; pp. 36–61. [Google Scholar] [CrossRef]
- Lowe, J.; Jonas, E.; Obrcian, V. Controlled gradient consolidation test. J. Soil Mech. Found. Div. 1969, 95, 77–97. [Google Scholar] [CrossRef]
- Crawford, C.B. Closure to “Interpretation of the Consolidation Test”. J. Soil Mech. Found. Div. 1965, 91, 104–108. [Google Scholar] [CrossRef]
- Leroueil, S.; Samson, L.; Bozozuk, M. Laboratory and field determination of preconsolidation pressures at Gloucester. Can. Geotech. J. 1983, 20, 477–490. [Google Scholar] [CrossRef]
- Leroueil, S.; Tavenas, F.; Samson, L.; Morin, P. Preconsolidation pressure of Champlain clays. Part II. Laboratory determination. Can. Geotech. J. 1983, 20, 803–816. [Google Scholar] [CrossRef]
- Silvestri, V.; Yong, R.N.; Soulié, M.; Gabriel, F. Controlled-strain, controlled-gradient, and standard consolidation testing of sensitive clays. In Consolidation of Soils: Testing and Evaluation; ASTM International: West Conshohocken, PA, USA, 1986. [Google Scholar]
- Imai, G. Development of a new consolidation test procedure using seepage force. Soils Found. 1979, 19, 45–60. [Google Scholar] [CrossRef]
- Fox, P.J.; Baxter, C.D. Consolidation properties of soil slurries from hydraulic consolidation test. J. Geotech. Geoenviron. Eng. 1997, 123, 770–776. [Google Scholar] [CrossRef]
- Been, K.; Sills, G. Self-weight consolidation of soft soils: An experimental and theoretical study. Geotechnique 1981, 31, 519–535. [Google Scholar] [CrossRef]
- Znidarcic, D. Laboratory Determination of Consolidation Properties of Cohesive Soil; University of Colorado at Boulder: Boulder, CO, USA, 1982. [Google Scholar]
- Huerta, A.; Kriegsmann, G.A.; Krizek, R.J. Permeability and compressibility of slurries from seepage-induced consolidation. J. Geotech. Eng. 1988, 114, 614–627. [Google Scholar] [CrossRef]
- Znidarcic, D.; Liu, J. Consolidation characteristics determination for dredged materials. Proc 1989, 22, 45–65. [Google Scholar]
- Abu-Hejleh, A.N.; Znidarcic, D. Estimation of the consolidation constitutive relations. In International Conference on Computer Methods and Advances in Geomechanics; A.A. Balkema: Rotterdam, The Netherlands, 1994. [Google Scholar]
- Znidarcic, D.; Abu-Hejleh, A.N.; Fairbanks, T.; Roberson, A. Seepage Induced Consolidation Test, Equipment Description and User’s Manual; Report prepared for FIPR; Department of Civil Engineering, University of Colorado: Boulder, CO, USA, 1992. [Google Scholar]
- Tian, Z.; Bareither, C.A.; Scalia, J. Development and assessment of a seepage-induced consolidation test apparatus. Geotech. Test. J. 2019, 43, 894–917. [Google Scholar] [CrossRef]
- Imai, G. Experimental studies on sedimentation mechanism and sediment formation of clay materials. Soils Found. 1981, 21, 7–20. [Google Scholar] [CrossRef]
- Aubertin, M.; Bussiere, B.; Chapuis, R.P. Hydraulic conductivity of homogenized tailings from hard rock mines. Can. Geotech. J. 1996, 33, 470–482. [Google Scholar] [CrossRef]
- Ou, X.D.; Yang, J.W.; Yin, X.T.; Liao, Y.F. Experimental study on mechanism for self-weight consolidation of the red mud tailings placed in the karsts. In Applied Mechanics and Materials; Trans Tech Publications Ltd.: Bäch, Switzerland, 2011. [Google Scholar]
- Vick, S.G. Planning, Design, and Analysis of Tailings Dams; BiTech Publishers Ltd.: Richmond, BC, Canada, 1990. [Google Scholar]
- Wickland, B.E.; Wilson, G.W. Self-weight consolidation of mixtures of mine waste rock and tailings. Can. Geotech. J. 2005, 42, 327–339. [Google Scholar] [CrossRef]
- Scott, J.D.; Dusseault, M.B.; Carrier, W.D. Large-scale self-weight consolidation testing. In Consolidation of Soils: Testing and Evaluation; ASTM International: West Conshohocken, PA, USA, 1986. [Google Scholar]
- Sills, G. Time dependent process in soil consolidation. Compress. Consol. Clayey Soils 1995, 2, 875–890. [Google Scholar]
- Sills, G. Development of structure in sedimenting soils. Philosophical Transactions of the Royal Society of London. Ser. A Math. Phys. Eng. Sci. 1998, 356, 2515–2534. [Google Scholar] [CrossRef]
- Jeeravipoolvarn, S.; Scott, J.; Chalaturnyk, R. 10 m standpipe tests on oil sands tailings: Long-term experimental results and prediction. Can. Geotech. J. 2009, 46, 875–888. [Google Scholar] [CrossRef]
- Li, L.; Alvarez, I.; Aubertin, J. Self-weight consolidation of slurried deposition: Tests and interpretation. Int. J. Geotech. Eng. 2013, 7, 205–213. [Google Scholar] [CrossRef]
- Babaoglu, Y.; Simms, P. A Rapid Measurement Method to Determine Hydraulic Conductivity of Tailings Under Self-Weight Consolidation. In Proceedings of the 24th International Conference on Tailings and Mine Waste ‘20, Fort Collins, CO, USA, 15–18 November 2020. [Google Scholar]
- Watson, K. An instantaneous profile method for determining the hydraulic conductivity of unsaturated porous materials. Water Resour. Res. 1966, 2, 709–715. [Google Scholar] [CrossRef]
- Schofield, A.N. Cambridge geotechnical centrifuge operations. Geotechnique 1980, 30, 227–268. [Google Scholar] [CrossRef]
- Beasley, D.; James, R. Use of a hopper to simulate embankment construction in a centrifugal model. Geotechnique 1976, 26, 220–226. [Google Scholar] [CrossRef]
- King, G.; McLoughlin, J. Centrifuge model studies of a cantilever retaining wall in sand. In Retaining Structures; Thomas Telford Publishing: London, UK, 1993; pp. 711–720. [Google Scholar]
- Lyndon, A.; Pearson, R. Pressure Distribution on a Rigid Retaining Wall in Cohesionless Material.; A.A. Balkema: Rotterdam, The Netherlands, 1985. [Google Scholar]
- Antonaki, N.; Sasanakul, I.; Abdoun, T.; Sanin, M.V.; Puebla, H.; Ubilla, J. Centrifuge modeling of deposition and consolidation of fine-grained mine tailings. In Proceedings of the Geo-Congress 2014: Geo-characterization and Modeling for Sustainability, Atlanta, Georgia, USA, 23–26 February 2014. [Google Scholar]
- Antonaki, N.; Abdoun, T.; Sasanakul, I. Centrifuge tests on comixing of mine tailings and waste rock. J. Geotech. Geoenvironmental Eng. 2018, 144, 04017099. [Google Scholar] [CrossRef]
- Bassett, R. Centrifugal model tests of embankments on soft alluvial foundations. In Proceedings of the 8th International Conference on Soil Mechanics and Foundation Engineering, Moscow, Russia, 6–11 August 1973. [Google Scholar]
- Ko, H.-Y. Summary of the state-of-the-art in centrifuge model testing. In Centrifuges in Soil Mechanics; CRC Press: Boca Raton, FL, USA, 1988; pp. 11–18. [Google Scholar]
- Bloomquist, D. Centrifuge Modeling of Large Strain Consolidation Phenomena in Phosphatic Clay Retention Ponds (Florida); University of Florida: Gainesville, FL, USA, 1982. [Google Scholar]
- Lawver, J.; Carrier, W. Mathematical and centrifuge modeling of phosphatic clay disposal systems. In Proceedings of the SME-AIME Annual Meeting, Atlanta, GA, USA, 6–10 March 1983. [Google Scholar]
- Townsend, F.; Hernandez, J. Predictions of phosphatic clay consolidation by numerical and centrifugal models. In Flocculation, Sedimentation and Consolidation; Moudgil, B.M., Somasundaran, P., Eds.; American Institute of Chemical Engineers: Sea Island, GA, USA, 1986; pp. 449–455. [Google Scholar]
- Weiland, R.; Bunnaul, P.; Hogg, R. Centrifugal dewatering of flocculated clays. Min. Metall. Explor. 1994, 11, 37–40. [Google Scholar] [CrossRef]
- Mikasa, M.; Takada, N. Selfweight consolidation of very soft clay by centrifuge. In Sedimentation Consolidation Models—Predictions and Validation; ASCE: Reston, VA, USA, 1984. [Google Scholar]
- McVay, M.; Townsend, F.; Bloomquist, D. Quiescent consolidation of phosphatic waste clays. J. Geotech. Eng. 1986, 112, 1033–1049. [Google Scholar] [CrossRef]
- Croce, P.; Pane, V.; Znidarčić, D.; Ko, H.Y.; Olsen, H.W.; Schiffman, R.L. Evaluation of Consolidation Theories by Centrifuge Modelling; CRC Press: Boca Raton, FL, USA, 1985. [Google Scholar]
- Takada, N.; Mikasa, M. Determination of consolidation parameters by selfweight consolidation test in centrifuge. In Consolidation of Soils: Testing and Evaluation; ASTM International: West Conshohocken, PA, USA, 1986. [Google Scholar]
- McVay, M.C.; Townsend, F.C.; Bloomquist, D.G.; Martinez, R.E. Reclamation of Phosphatic Clay Waste Ponds by Capping Volume 6: Consolidation Properties of Phosphatic Clays from Automated Slurry Consolidometer and Centrifugal Model Tests; FIPR Publication; Florida Institute of Phosphate Research: Bartow, FL, USA, 1987. [Google Scholar]
- Sorta, A.R. Centrifugal Modelling of Oil Sands Tailings Consolidation. Ph.D. Thesis, University of Alberta, Department of Civil and Environmental, Edmonton, AB, Canada, 2015. [Google Scholar]
- Taylor, R. Centrifuges in modelling: Principles and scale effects (Chapter 2). In Geotechnical Centrifuge Technology; Taylor, R.N., Ed.; Blackie Academic & Professional: London, UK, 1995; pp. 20–34. [Google Scholar]
- Black, J.A.; Baker, N.; Ainsworth, A. Establishing a 50g-ton geotechnical centrifuge at the University of Sheffield. In Physical Modelling in Geotechnics-Gaudin & White; Taylor & Francis Group: London, UK, 2014; pp. 181–186. [Google Scholar]
- Madabhushi, G. Centrifuge Modelling for Civil Engineers; CRC Press: Boca Raton, FL, USA, 2014. [Google Scholar]
- Muir Wood, D. Geotechnical Modelling; CRC Press: Boca Raton, FL, USA, 2017. [Google Scholar]
- McDermott, I.; King, A. Use of a bench-top centrifuge to assess consolidation parameters. In Tailings and Mine Waste’98; Routledge: London, UK, 1998. [Google Scholar]
- El-Shall, H.; Moudgil, B.; Bogan, M. Centrifugal modeling of the consolidation of solid suspensions. Min. Metall. Explor. 1996, 13, 98–102. [Google Scholar] [CrossRef]
- Reid, D.; Fourie, A.; Watson, S. Accelerated consolidation of soft clays and mine tailings using a desktop centrifuge. In Proceedings of the 15th International Seminar on Paste and Thickened Tailings, Sun City, South Africa, 17–19 April 2012; Australian Centre for Geomechanics: Crawley, WA, Australia. [Google Scholar]
- Lehane, B.M.; O’loughlin, C.D.; Gaudin, C.; Randolph, M.F. Rate effects on penetrometer resistance in kaolin. Géotechnique 2009, 59, 41–52. [Google Scholar] [CrossRef]
- Anderson, C.; Sivakumar, V.; Black, J. Measurement of permeability using a bench-top centrifuge. Géotechnique 2015, 65, 12–22. [Google Scholar] [CrossRef]
- Black, J.A. Development of a small scale teaching centrifuge. In Physical Modelling in Geotechnics-Gaudin & White; Taylor & Francis Group: London, UK, 2014; pp. 187–192. [Google Scholar]
- Fox, P.J.; Lee, J.; Qiu, T. Model for large strain consolidation by centrifuge. Int. J. Geomech. 2005, 5, 267–275. [Google Scholar] [CrossRef]
- Sills, G.; Hoare, S.; Baker, N. An experimental assessment of the restricted flow consolidation test. In Consolidation of Soils: Testing and Evaluation; ASTM International: West Conshohocken, PA, USA, 1986. [Google Scholar]
- Rowe, P.W.; Barden, L. A new consolidation cell. Geotechnique 1966, 16, 162–170. [Google Scholar] [CrossRef]
- Premchitt, J.; Ho, K.; Evans, N. Conventional and CRS Rowe cell consolidation test on some Hong Kong clays; Geotechnical Engineering Office, Civil Engineering Department: Hong Kong, China, 1996. [Google Scholar]
- Suthaker, N.N.; Scott, J.D. Measurement of hydraulic conductivity in oil sand tailings slurries. Can. Geotech. J. 1996, 33, 642–653. [Google Scholar] [CrossRef]
- Jeeravipoolvarn, S. Compression Behavior of Thixotropic Oil Sands Tailings; University of Alberta: Edmonton, AB, Canada, 2005. [Google Scholar]
- Jeeravipoolvarn, S.; Masala, S.; Zhang, C.; Moore, T. Revisiting the large strain consolidation test for oil sands. In Proceedings of the Tailings and Mine Waste 2015, Vancouver, BC, Canada, 26–28 October 2015. [Google Scholar]
- Gorman, C.T. Constant-Rate-of-Strain and Controlled-Gradient Consolidation Testing; Kentucky Transportation Center Research Report, Research Report No. 448. 1976. Available online: https://uknowledge.uky.edu/ktc_researchreports/866 (accessed on 15 October 2022).
- Znidarcic, D.; Abu-Hejleh, A.N.; Fairbanks, T.; Robertson, A. Consolidation Characteristics Determination for Phosphatic Clays, Volume 1: Seepage Induced Consolidation Test Equipment Description and Users Manual; Technical Report; Florida Institute of Phosphate Research: Bartow, FL, USA, 1994. [Google Scholar]
- Estepho, M. Seepage Induced Consolidation Test: Characterization of Mature Fine Tailings; University of British Columbia: Vancouver, BC, Canada, 2014. [Google Scholar]
- Dromer, J.B.; Aubertin, M.; Kennedy, G.; Pedroni, L.; Bussière, B. A new testing system to investigate the sedimentation and consolidation of sludge and slurry. In Proceedings of the 57th Canadian Geotechnical Conference, Québec, QC, Canada, 24–26 October 2004. [Google Scholar]
- Miller, W.G. Comparison of geoenvironmental properties of caustic and noncaustic oil sand fine tailings. Ph.D. Thesis, University of Alberta, Department of Civil and Environmental, Edmonton, AB, Canada, 2010. [Google Scholar]
- Dunmola, A.; Wang, N.; Lorentz, J.; Chalaturnyk, R.; Zambrano, G.; Song, J. Comparison of geotechnical beam centrifuge predictions to field data from 10m deep FFT centrifuge cake columns. In Proceedings of the 6th International Oil Sands Tailings Conference, Edmonton, AB, Canada, 3 June 2018; pp. 290–298. [Google Scholar]
- Znidarčić, D.; Miller, R.; Van Zyl, D.; Fredlund, M.; Wells, S. Consolidation testing of oil sand fine tailings. In Proceedings of the Tailings and Mine Waste, Vancouver, BC, Canada, 6–9 November 2011. [Google Scholar]
- McNamara, A.; Divall, S.; Goodey, R.; Taylor, N.; Stallebrass, S.; Panchal, J. Physical Modelling in Geotechnics. In Proceedings of the 9th International Conference on Physical Modelling in Geotechnics (ICPMG 2018), London, UK, 17–20 July 2018; CRC Press: Boca Raton, FL, USA, 2018; Volume 1. [Google Scholar]
- Gaudin, C.; White, D. Physical Modelling in Geotechnics. In Proceedings of the 8th International Conference on Physical Modelling in Geotechnics 2014 (ICPMG 2014), Perth, Australia, 14–17 January 2014. [Google Scholar]
- Sharma, J.S. Consolidation characteristics of tailings using a high-g bench-top centrifuge. In Proceedings of the 8th International Conference on Physical Modelling in Geotechnics, Perth, Australia, 14–17 January 2014. [Google Scholar]
- Nash, D.; Sills, G.; Davison, L. One-dimensional consolidation testing of soft clay from Bothkennar. Géotechnique 1992, 42, 241–256. [Google Scholar] [CrossRef]
- Dunmola, A.; Werneiwski, R.A.; McGowan, D.; Shaw, B.; Carrier, D. Geotechnical performance of fine tailings in an oil sands pit lake. Can. Geotech. J. 2022. [Google Scholar] [CrossRef]
Figure 2.
Schematic of the University of Alberta multi-step loading large strain consolidation test (Reprinted from permission from Azam [64]. 2023, Copyright Clearance Center, Inc.).
Figure 2.
Schematic of the University of Alberta multi-step loading large strain consolidation test (Reprinted from permission from Azam [64]. 2023, Copyright Clearance Center, Inc.).

Figure 3.
Schematic of the large strain slurry consolidometer (Reprinted from permission from Islam et al. [70]. 2023, Informa UK Limited, trading as Taylor & Francis Group).
Figure 3.
Schematic of the large strain slurry consolidometer (Reprinted from permission from Islam et al. [70]. 2023, Informa UK Limited, trading as Taylor & Francis Group).

Figure 7.
Schematic of the Two-meter compressibility standpipe test (Reprinted from permission from Jeeravipoolvarn [34]. 2023, Dr. Silawat Jeeravipoolvarn).
Figure 7.
Schematic of the Two-meter compressibility standpipe test (Reprinted from permission from Jeeravipoolvarn [34]. 2023, Dr. Silawat Jeeravipoolvarn).

Table 1.
Geotechnical scaling law relations for physical properties.
| Physical Property | Scale Factor (Prototype/Model) |
|---|---|
| Length (m) | N |
| Settlement (Deformation) (m) | N |
| Cross-sectional Area (m2) | N2 |
| Weight Force (N) | N2 |
| Time (Consolidation) (s) | N2 |
| Mass (kg) | N3 |
| Mass Density (kg/m3) | 1 |
| Stress (N/m2) | 1 |
| Hydraulic Gradient | 1 |
| Acceleration (m/s2) | 1/N |
| Fluid Velocity (m/s) | 1/N |
| Hydraulic Conductivity (m/s) | 1/N |
Disclaimer/Publisher’s Note: The statements, opinions and data contained in all publications are solely those of the individual author(s) and contributor(s) and not of MDPI and/or the editor(s). MDPI and/or the editor(s) disclaim responsibility for any injury to people or property resulting from any ideas, methods, instructions or products referred to in the content. |
© 2023 by the authors. Licensee MDPI, Basel, Switzerland. This article is an open access article distributed under the terms and conditions of the Creative Commons Attribution (CC BY) license (https://creativecommons.org/licenses/by/4.0/).
Share and Cite
MDPI and ACS Style
Ahmed, M.; Beier, N.A.; Kaminsky, H. A Comprehensive Review of Large Strain Consolidation Testing for Application in Oil Sands Mine Tailings. Mining 2023, 3, 121-150. https://doi.org/10.3390/mining3010008
AMA Style
Ahmed M, Beier NA, Kaminsky H. A Comprehensive Review of Large Strain Consolidation Testing for Application in Oil Sands Mine Tailings. Mining. 2023; 3(1):121-150. https://doi.org/10.3390/mining3010008
Chicago/Turabian StyleAhmed, Mahmoud, Nicholas A. Beier, and Heather Kaminsky. 2023. "A Comprehensive Review of Large Strain Consolidation Testing for Application in Oil Sands Mine Tailings" Mining 3, no. 1: 121-150. https://doi.org/10.3390/mining3010008