
Modeling of Coalmine Methane Flows to Estimate the Spacing of Primary Roof Breaks
by
 ,
,
Vladimir Sergeevich Brigida
1,2,* ,
,
Vladimir Ivanovich Golik
3,4 and
Boris Vitalievich Dzeranov
5,6 1
Federal Research Centre the Subtropical Scientific Centre of the Russian Academy of Sciences, 354002 Sochi, Russia
2
Department of Biomedical, Veterinary and Ecological Directions, Peoples’ Friendship University of Russia (RUDN University), 117198 Moscow, Russia
3
Department “Technique and Technology of Mining and Oil and Gas Production”, Moscow Polytechnic University, 107023 Moscow, Russia
4
Department “Mining”, North Caucasian Institute of Mining and Metallurgy, 362021 Vladikavkaz, Russia
5
Geophysical Center of the Russian Academy of Sciences (GC RAS), 119296 Moscow, Russia
6
Geophysical Institute, Vladikavkaz Scientific Center of the Russian Academy of Sciences (GPI VSC RAS), 362002 Vladikavkaz, Russia
*
Author to whom correspondence should be addressed.
Mining 2022, 2(4), 809-821; https://doi.org/10.3390/mining2040045
Submission received: 9 November 2022
/
Revised: 14 December 2022
/
Accepted: 15 December 2022
/
Published: 19 December 2022
(This article belongs to the Special Issue Application of Empirical, Analytical, and Numerical Approaches in Mining Geomechanics)
Abstract
:The global challenge for the mining sector is the problem of “decarbonization” of coal mining. The modeling of emission flows of coalmine methane is stipulated by the need to prove the environmental effect of the implemented technological changes. For longwall geotechnology, the dynamics of methane concentration in the gas–air mixture extracted by the degassing system reflects the complex relationship between emission and geomechanical processes in the rock mass. In this regard, the aim of the work was to improve the methods for assessing the steps of caving the main roof when mining gas-coal seams. The method of work consisted of processing experimental data (smoothing—Loess, three-dimensional interpolation, regression—the method of least squares) to obtain reliable response functions in three-dimensional space. When developing algorithms in the Python language, the Vi Improved text editor was used. Graphical representation of the results was carried out in “Gnuplot”. As a result of modeling, it was found that the increase in the span of the main roof from 83 to 220 m (S = 1340–1120 m) in the distance range of 120 m in front of the stoping face line and up to 50 m behind it (L = −120–50 m) leads to an alternating cyclicity of local extrema of the dynamics of methane release, according to a polynomial dependence. This fact is a consequence of the implementation of deformation-wave processes in geo-environments, which produce cyclic nonlinearities in the nature of the aero-gas regime of mine methane emissions into anthropogenically disturbed rock masses. In addition, the influence of the situational geomechanical conditions of the excavation area in the goaf was clarified. This makes it possible to reliably identify the caving steps of the main roof.
1. Introduction
According to a number of researchers, in 2016, the share of the Russian Federation in the global emissions of greenhouse gases was 7%. Up to 50% of this volume was caused by the extractive sector of the economy [1]. From a global perspective, anthropogenic methane emissions can be up to 19% of all greenhouse gas emissions [2]. The share of mine methane out of this volume ranges from 11 to 13% [3]. Based on the foregoing facts, it follows that ensuring the environmental transformation of the extractive sector in the aspect of “decarbonization” of the extraction of anthropogenic georesources is not just an urgent scientific problem, but rather a challenge for the sustainable development of the industry as a whole.
A number of studies [4,5,6,7] have been devoted to the formation of a sustainable state of the mining industry, while the climatic aspects, in most cases, were left largely unaddressed. For example, in previous studies [8,9,10], more emphasis was placed on practical issues of tailings disposal as elements of goaf backfilling. Other studies aimed at ecological modernization of in situ leaching of uranium and only addressed the issues of carbon dioxide capture and disposal during mining [11,12]. More significant, in our opinion, are attempts to improve geoecological monitoring based on unmanned aerial vehicles in combination with advanced GIS technologies [13]. The need to model the emission flows of climatically active gases is stipulated by the need for a reliable assessment of the effect of “decarbonization” from the implemented technological changes.
Using the example of coalmine methane, emission flows are formed not only by the difference in the gas balance in the extraction area and the efficiency of degassing, but also by the processes of anthropogenic disturbance of the massif up to the surface. Modern approaches to predicting the caving steps of the main roof are far from perfect. It is known that the process of rock layers collapsing is a complex dynamic process with a significant share of the stochastic component [14]. The existing approaches to estimating the main caving span are based on processing empirical data; five categorical Q-Q models based on the RSCi index [15]; the application of Cosser at theory for 3D finite element modeling using COSFLOW [16] or ANSYS [17]; two-dimensional synthetic rock mass models (SRM) [18]; and genetic programming or GEP methods [19]. Moreover, for calculations of the stress–strain state of the massif (even for the classical theory of “pressure arch”), the cyclicity of loads on the racks of powered support is taken into account [19]. The non-linearity of rock pressure manifestations can also be associated with the difference in the stratigraphic structure of the roof rocks. For example, in [20], it was found that greater rigidity of the roof layers leads to an expansion of the support pressure zone by 5 m with an increase in stresses by 10.4 MPa. From the analysis of this work, it is obvious that only a change in mining and geological factors during the development of an extraction column can cause the migration of local maxima of the support pressure (with a constant advance rate of stop). The most striking empirical evidence of the manifestations of periodic nonlinear manifestations of the “pressure arch” is the work of Polevshchikov G.Ya. [21]. This paper states “In the inelastic zone, there are two “elements” with the same “wave” characteristics”, while the author himself points to ““deformation-wave” nature of rock mass response to the change of external conditions”. These assumptions are apparently based on the confirmed fact of the presence of the phenomenon of zonal disintegration [22] around the development workings (the theory itself was fully formed by academician Oparin V.N. only by 2008 [23].
It is worth noting that this direction began to develop as early as the works of Spackeler G. (1930) who, based on field studies of Weber H. (1916), proposed a hypothesis about the existence of a nonlinear (“wave”) component in the theory of rock pressure. Further, only by the 1990s (“dynamic waves” I.P. Chernyak) did this direction find its continuation. In addition, it should be noted that in fundamental works on the disclosure of the features of destruction of unequally loaded rock samples, both in situ [24] and in laboratory studies [25,26], similar effects are encountered. The evolution of induced micro fracturing in shear faults is most clearly reflected by wave-like graphs of changes in acoustic emission parameters (Q-profiles) under the influence of dynamic stresses (see Figure 2 in [25]).
The theory of degassing is known as the leading role of “destressing” in the decomposition of a solid gas-coal solution. This process causes an increase in methane release (methane concentration) in wells. The possibility of a qualitative assessment of rock pressure parameters in a degassed massif based on the dynamics of methane release into underground wells is indicated in many papers [27,28,29]. At the same time, their main indicator maybe the distribution of the methane concentration in the gas–air mixture extracted by underground wells. The issues of describing the features of aerogas processes caused by stopped excavation have been solved, both by Russian [30] and foreign researchers [31,32,33]. At the same time, a number of phenomena remain not fully understood. In this regard, the purpose of the present paper is to improve approaches to assessing the caving step of the main roof during longwall mining of gas-coal seams.
2. Materials and Methods
The task of geoecological modeling in the form of estimating an approximating function to a set of experimental data (data set) is equivalent to establishing a regression model of the studied process given in an implicit form. The time factor introduces its own difficulties, creating an additional dimension, but also provides a potential way out—reformatting the primary data into an invariant form, using dimensionality reduction methods, etc., “expansion” of the problem and the optimal selection of influencing components in determining the type of response function (CH4).
One of the difficulties is taking into account the mining and geological features of the extraction area and, in connection with this, the “individuality” of the spatial distribution of gas for each coal seam [34]. In this regard, it is necessary to develop models of several types of wells to form a “portrait” of emission processes in different conditions of mining the same seam.
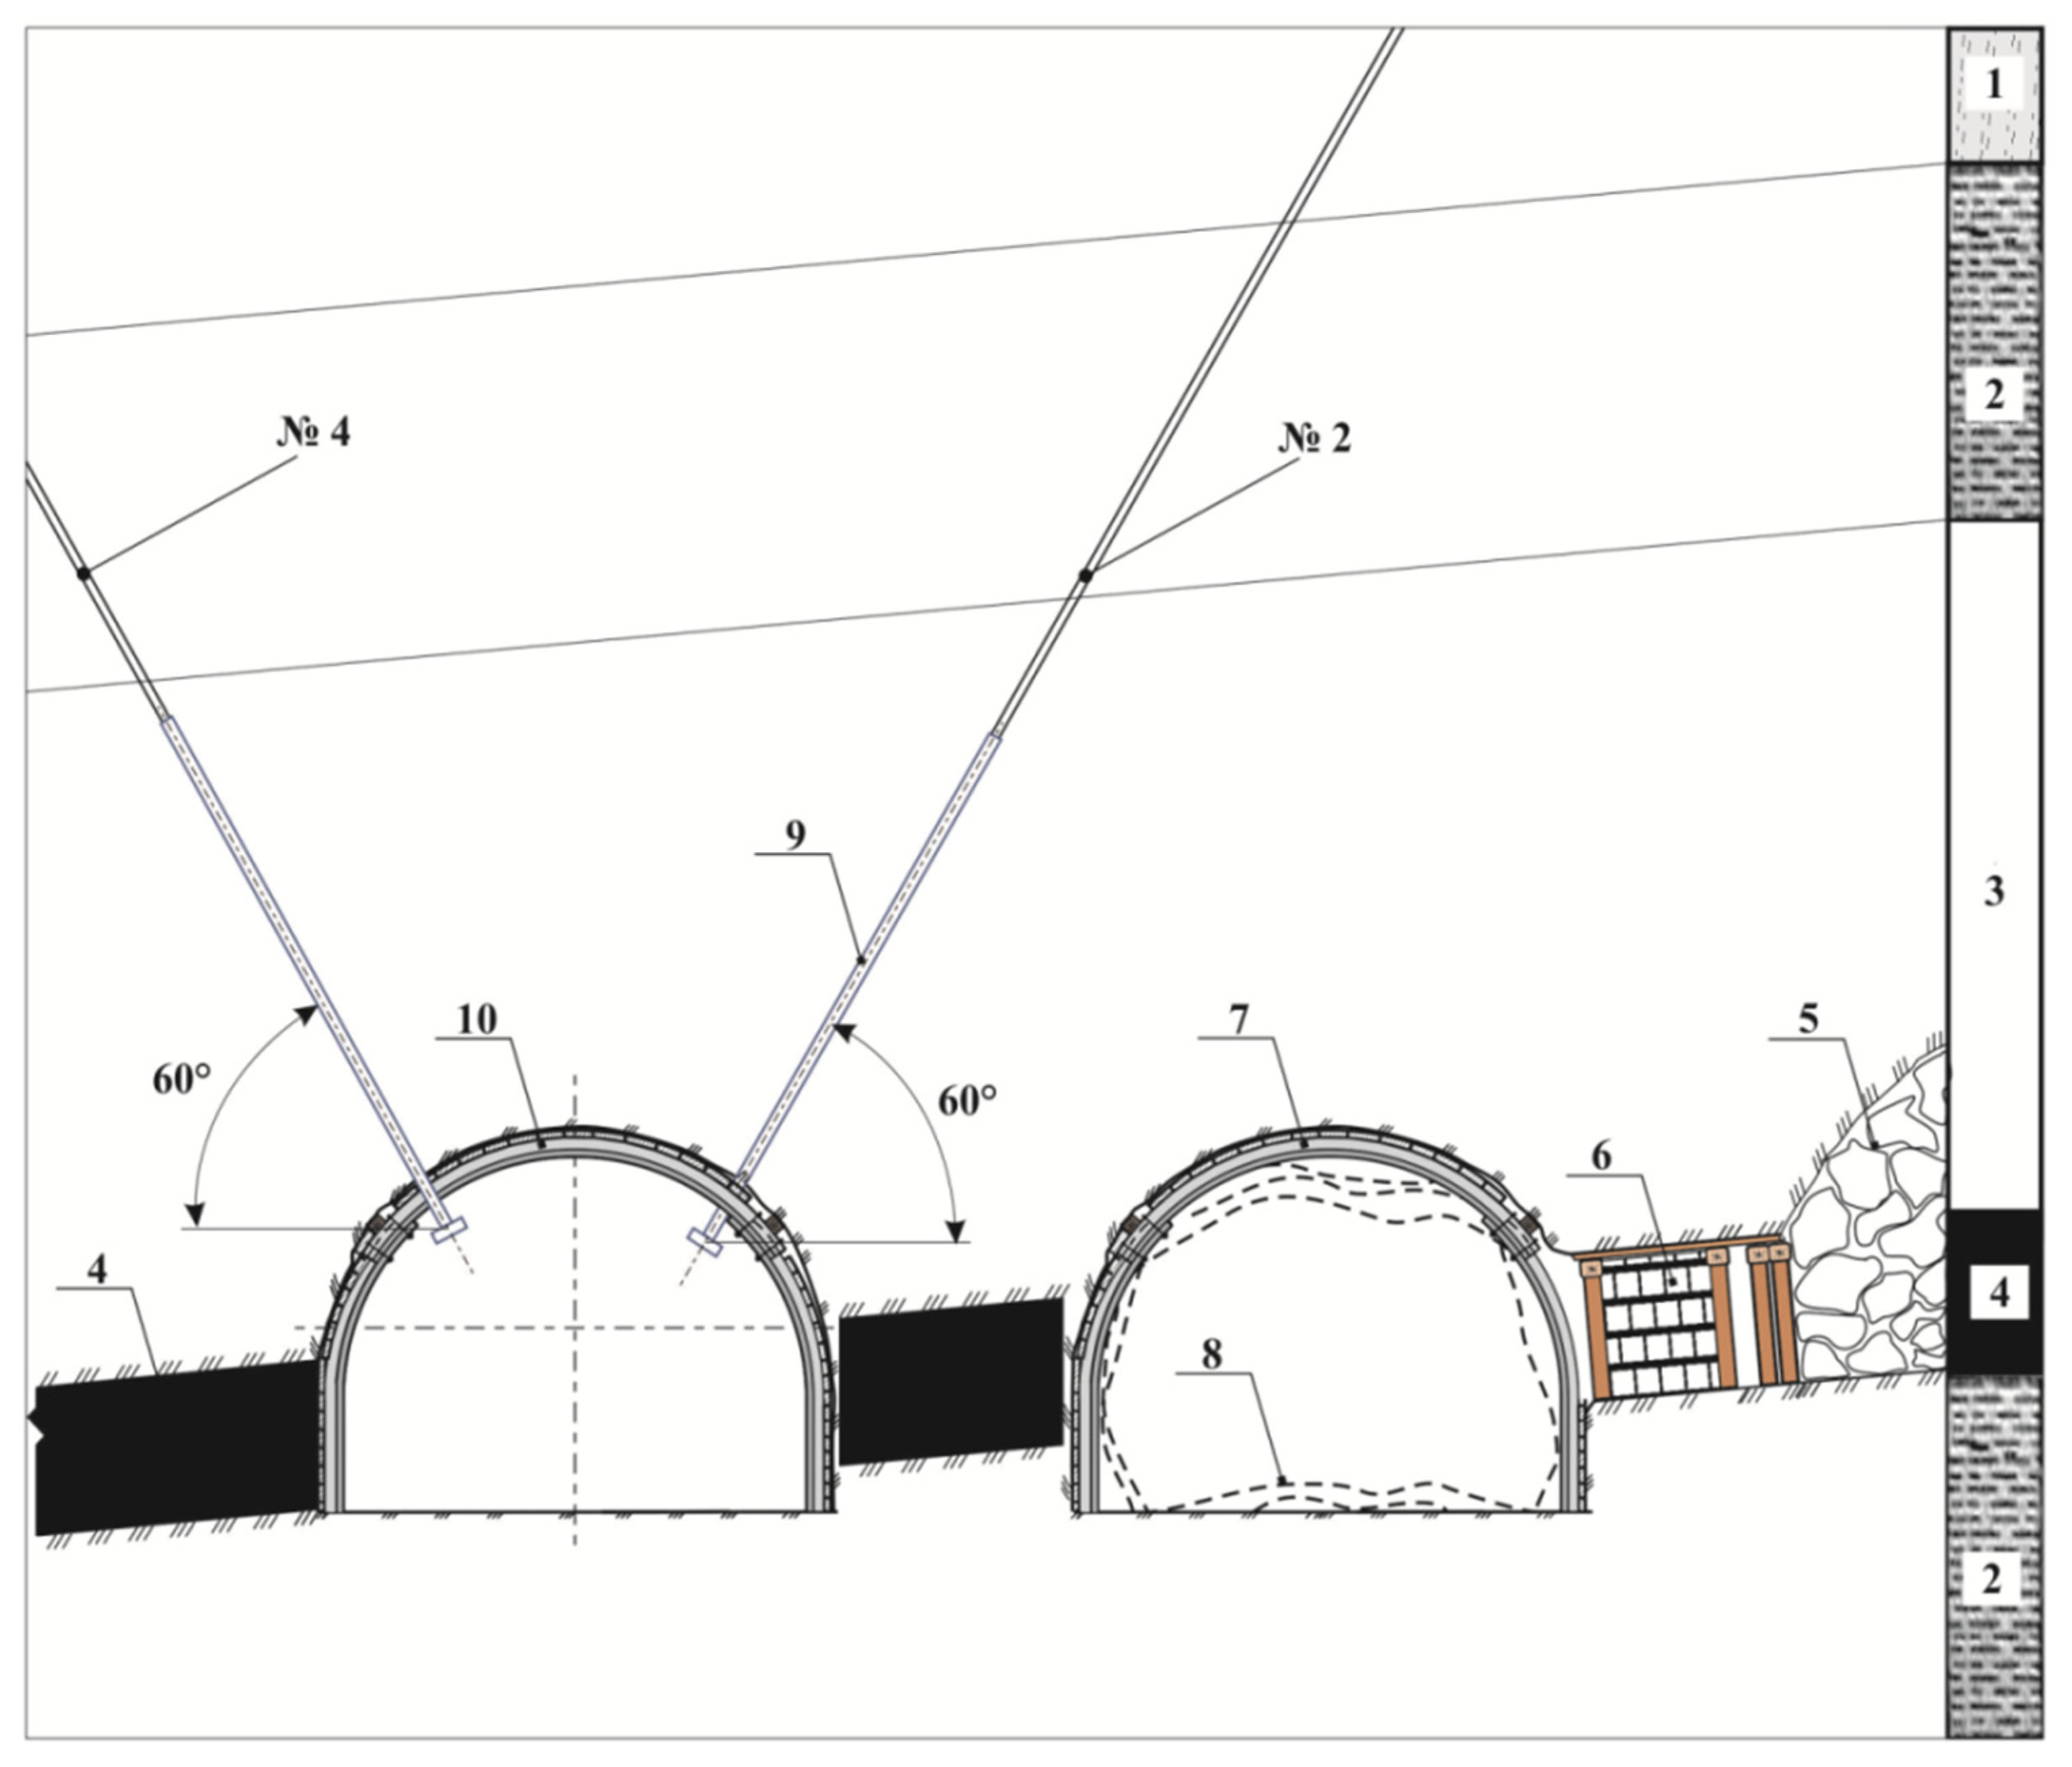
The drilling of underground degassing wells was carried out on the seam m3 CJSC “Mine named after. A.F. Zasyadko” (development depth exceeded 1300 m, longwall length of 300–305 m) during the mining of the 18th eastern longwall. A series of 3 wells with different parameters of spatial orientation (“pads”) were sunk at a frequency of 20–25 m, while in each pad, there were two wells (No. 2 and No. 3) oriented to the overlying massif (with re-drilling of gas-bearing sandstone) and one “axial” (No. 4, with a zero turn), or “on the goaf” (No. 4). To assess the features of methane emission flows, two types of wells were selected—type No. 2 and No. 4 due to the fact that the angle of their turn to the bottom of the longwall was the same (β = 60°). Moreover, the ascent angles relative to the horizon were also equal (α = 60°, Figure 1), which determines the similarity in the development of deformation processes in the conditions of the previously undermined massif and the beginning development of reserves.
In addition, the choice of “goodness-of-fit” criteria (an indicator of assessing the reliability of modeling the initial data) for three-dimensional models remains open. The most commonly used are correlation tightness indicators [35,36], special correlation functions (for additive random processes [37]), relative errors, coefficient of determination (for example, in “wavelet analysis”) [38], or approximations of the thermodynamic equilibrium of carbon dioxide [11].
In our study, the proportion of the model variance, which is based on experimental data (R2), was used in the first stage—the selection of filtering/smoothing parameters according to the method given in [39]. In contrast to the criteria approach [40], artificial neural networks (ANN) [41], the multivariate regression method (with the application of SPSS software) [42], or the finite element method (FEM) [43], further, already smoothed data (on a distributed grid) were interpolated similarly to the study [39], after which the parameters of high-degree polynomials were selected (regression) by the method of least squares. The algorithms were first written in “Vi Improved” (version 9.0, open-source software from Bram Moolenaar, Holland) in Python (version 2.7.10., Python Software Foundation, DE, USA). To improve the quality of modeling at each stage, the residuals on the projections (Z = ƒ(X;Y)) were analyzed, and the presentation of graphical results (vectorization) was programmed in the “gnuplot” program (version 5.4, Thomas Williams & Colin Kelley). To assess the quality of the final models, at the last stage, quantile–quantile (Q-Q) plots were additionally built in MS Excel.
The basis for the data set was mine data (obtained by the standard method) of methane concentration measurements for 151 points (L, S, CH4)—well type No. 2—and 261 points—type No. 2 (due to the fact that wells in goaf were drilled through one picket). The “data set” fragment is presented in Table 1.
3. Results
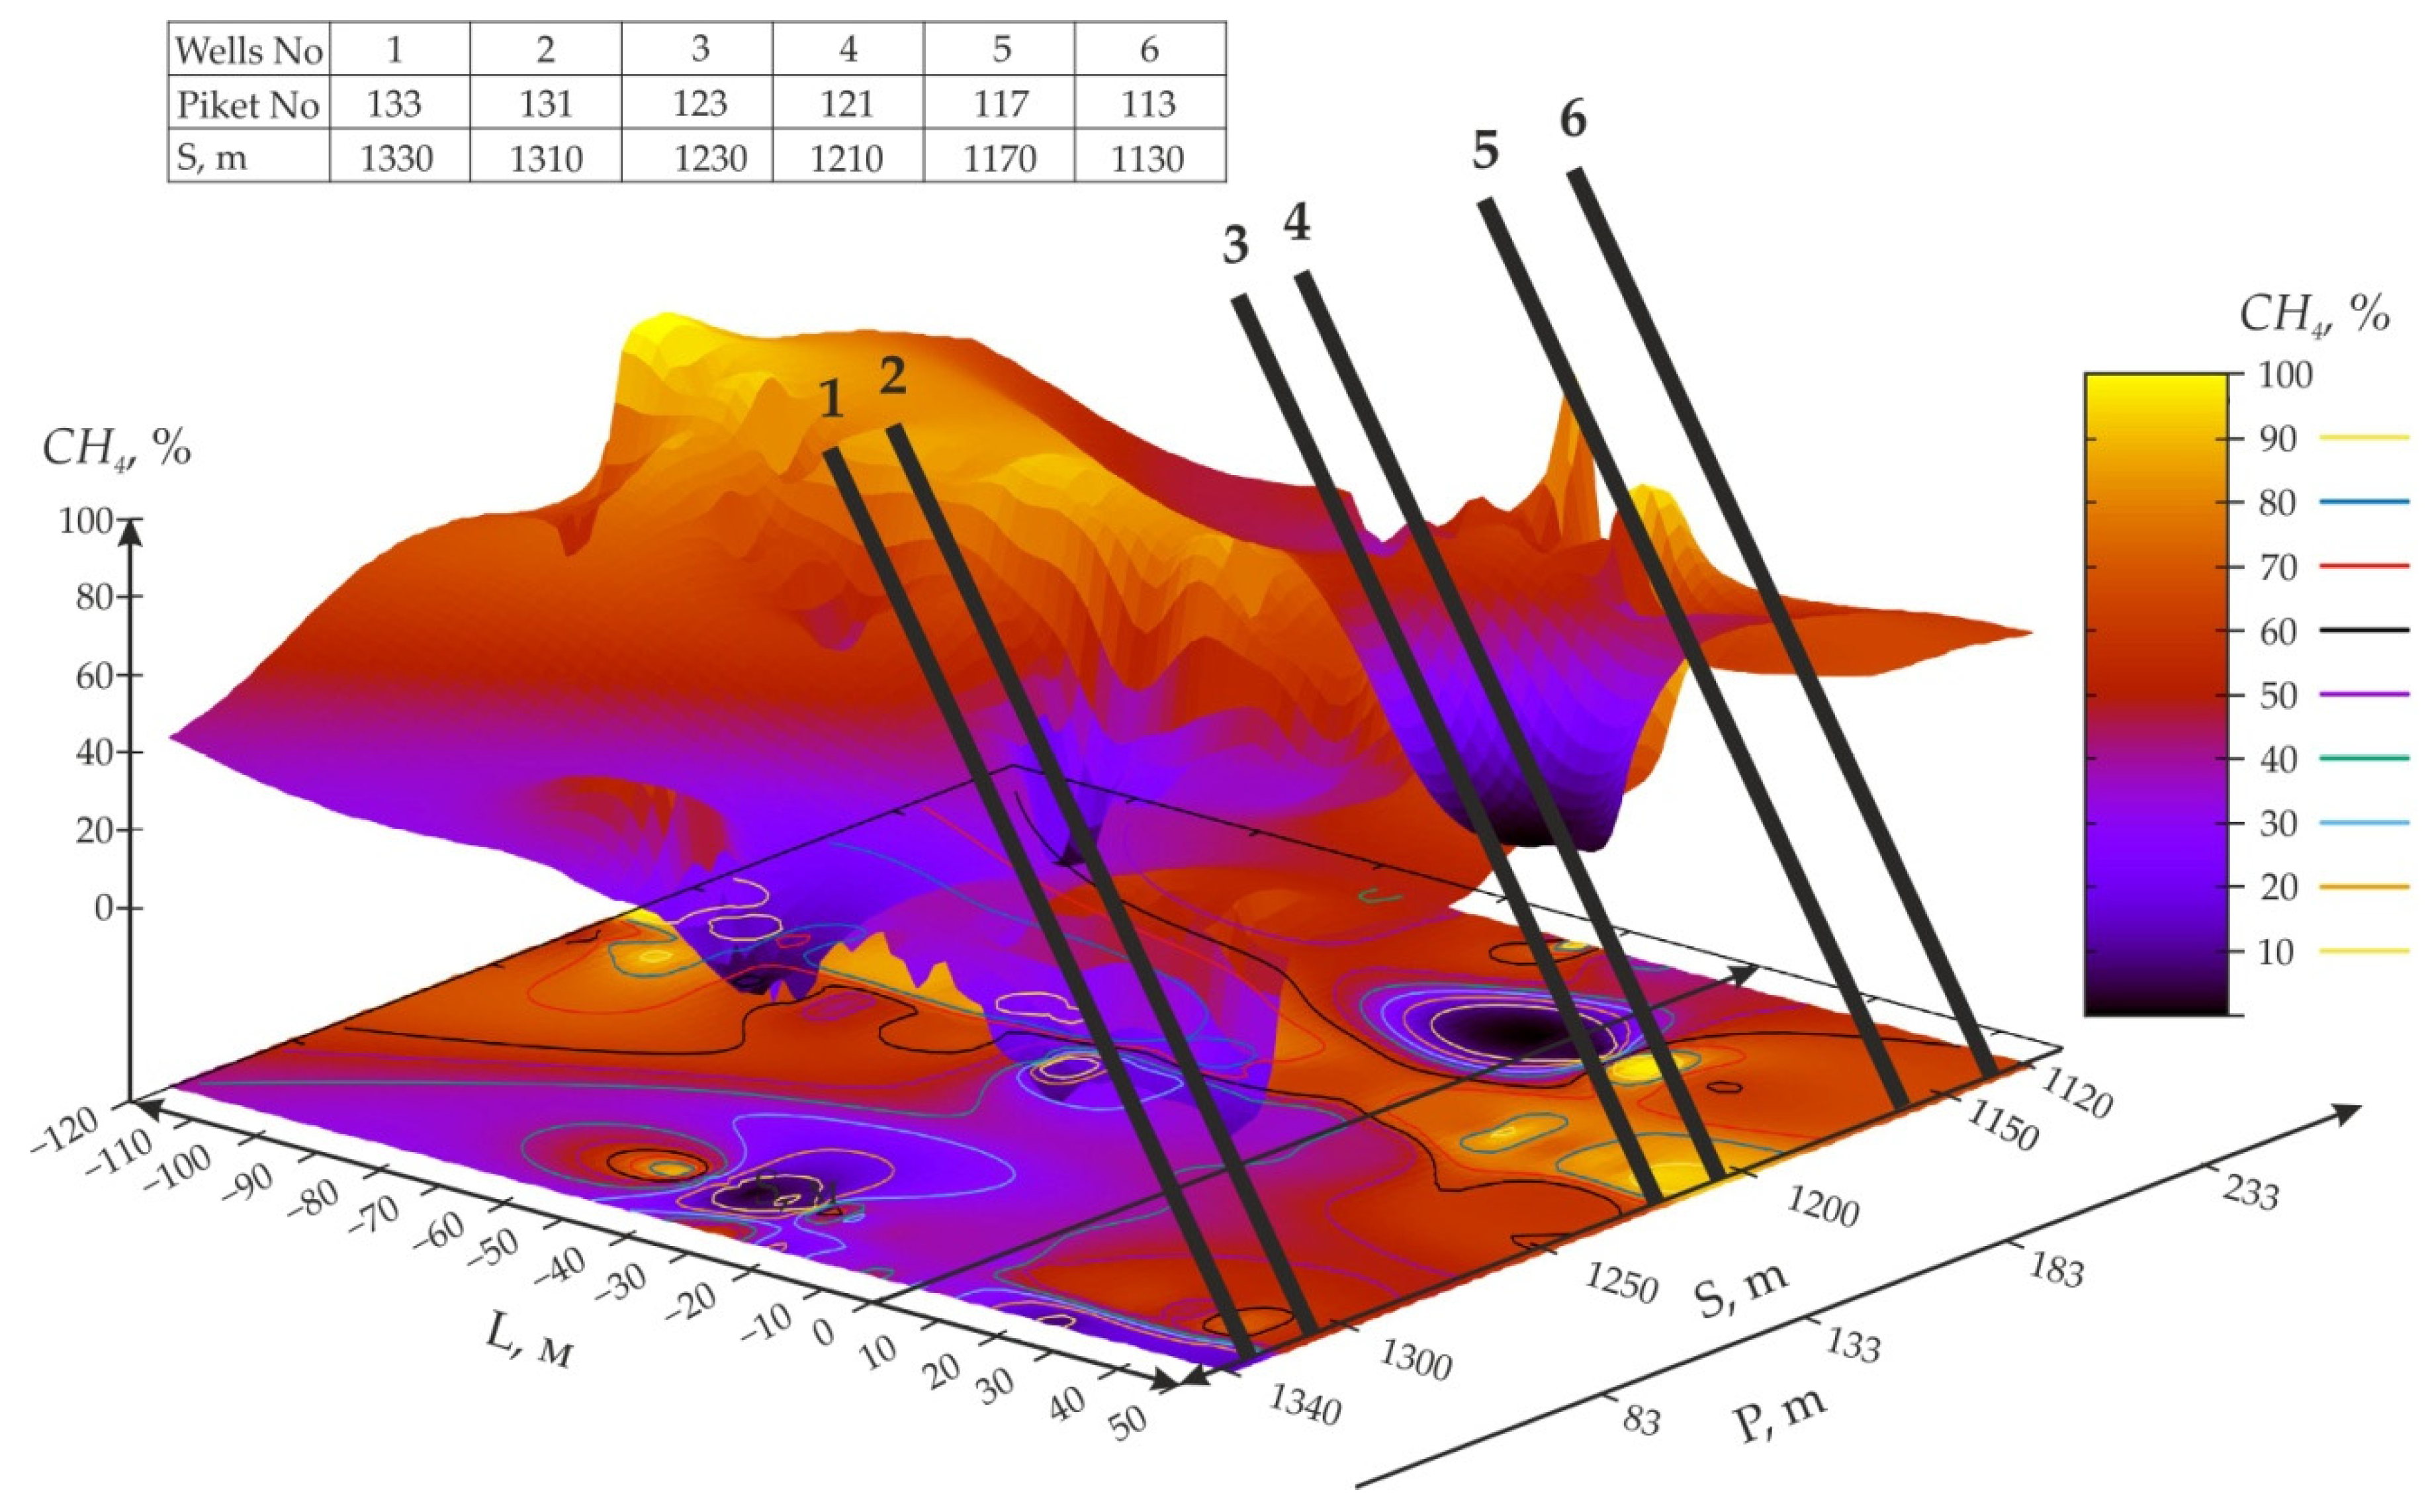
An example of a graphical representation of experimental data (data set vectorization) for comparison with the resulting response surface (after all stages of processing with the formation of a regression model) for the example of type 2 wells is shown in Figure 2.
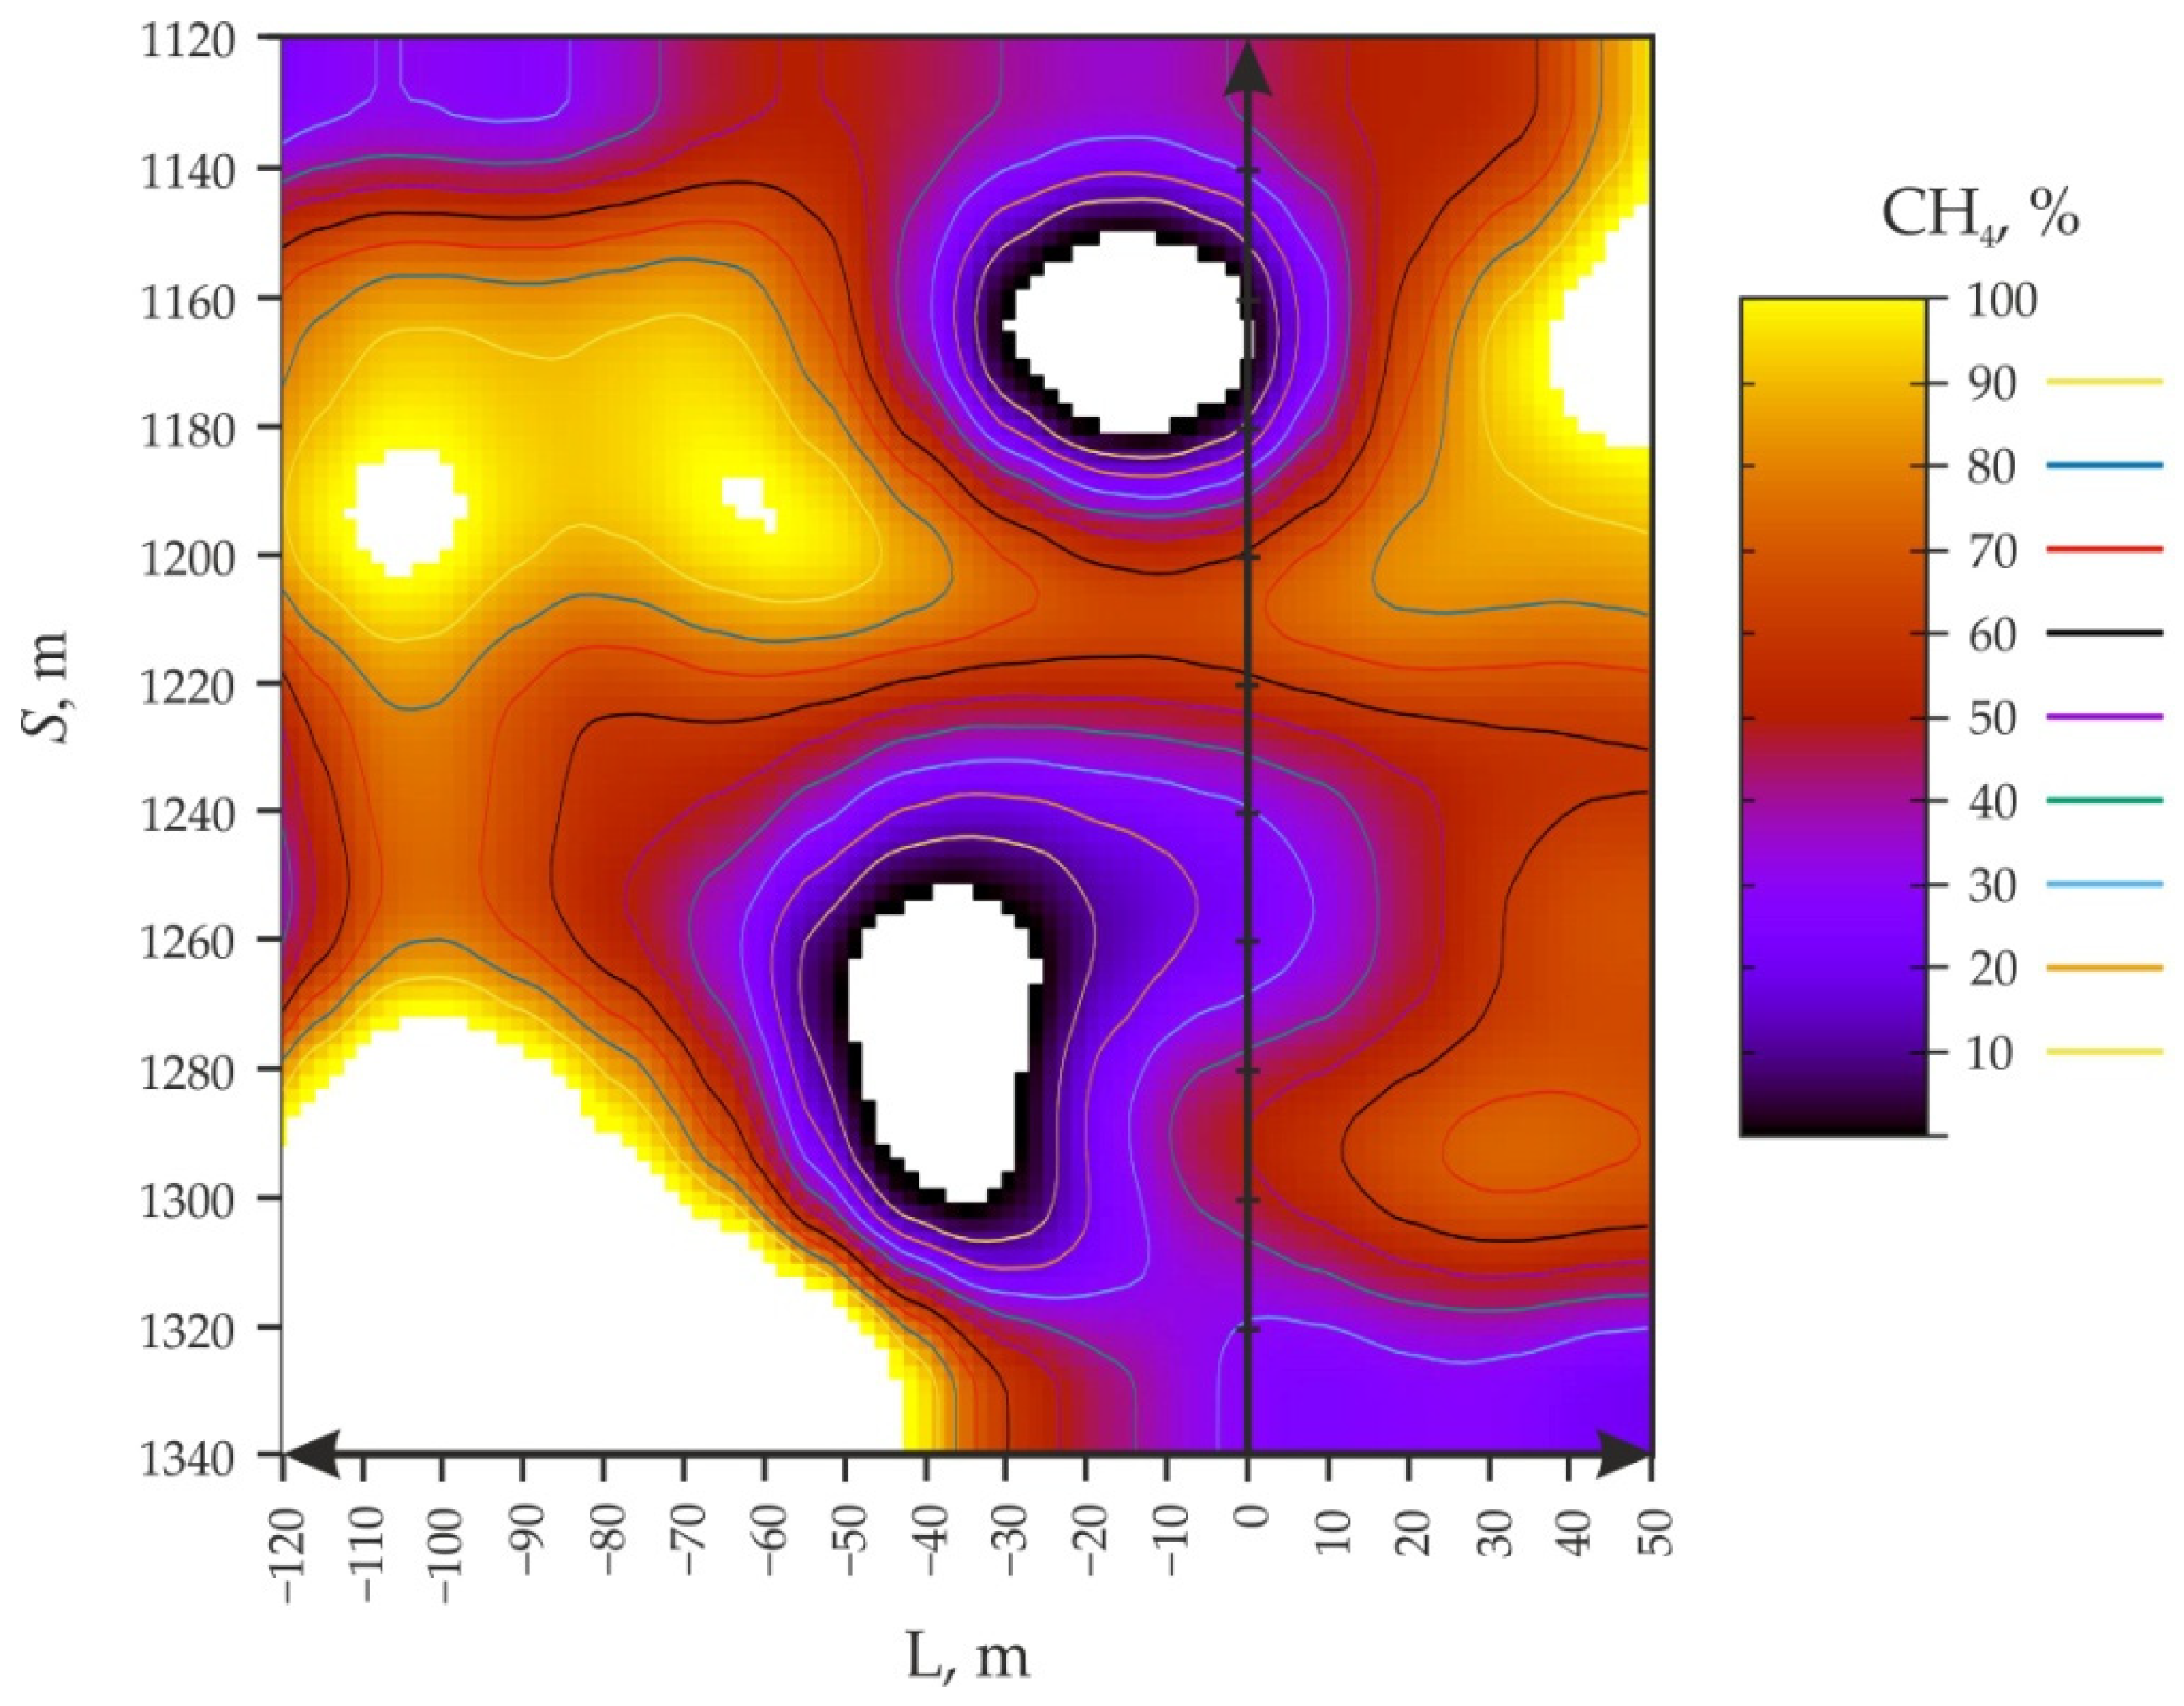
The spatial distribution of gas flows (after processing the experimental data according to the accepted methodology) from wells drilled into the mined-out space of a previously worked longwall during longwall mining of the m3 seam is shown in Figure 3.
From the analysis of Figure 3, it follows that at the beginning of reserves development (at S = 1340 m) for wells drilled into the goaf of a previously worked out longwall, a “high content” of methane in the extracted mixture is characteristic—CH4 ≥ 60% (the area limited by the black curve) from −120 to −30 m before the stope.
Ahead of the longwall, the general trend of the “local maximum” concentration (CH4 = 100–90%, the area bounded by the dark yellow curve) can be traced from −120 to −40 m, followed by its sharp decrease from −38 to −14 m (from 80 to 40%), which is replaced by a more gentle decline to −4 m (from 40 to 30%). Stabilization and constancy of the methane concentration = 30%, which began −4 m ahead of the longwall, continues up to 50 m behind it, while this trend does not change during the first 63 m (S = 1320 m) of the longwall. When the stoping face line approaches the mark S = 1320 m, up to S = 1268 m, the area of the local maximum decreases from the area −120 to −43 m to the area −106 to −98 m. Further, the area of the maximum concentration disappears and begins to be traced only from the range S = 1218–1165 m, at distances from −120 to −110 m to −60 to −43 m ahead of the longwall. Behind the longwall of the studied area, it does not exist up to S = 1197, while it is localized at the level L = 50 m. With subsequent mining of the reserves, the area of the local maximum gradually increases in size. It reaches its maximum expansion (L = from 30 to 50 m) at S = from 1180 to 1160 m relative to the beginning of the extraction column. Further, from S = 1160, the studied area sharply decreases and shifts again to L = 50 m at S = 1140 m.
The zone of high methane content (CH4 ≥ 60%), starting from S = 1320 m, is removed relative to the distance to the bottom hole (L = −110 to −85 m) and decreases in size, after which, up to S = 1220 m, the size and localization of this zone remain stable. A very interesting mining area is S = 1218–1200 m, which is characterized by the presence of CH4 ≥ 60% for any distance from the stope, both in front and behind the longwall. After S = 1200 m, the zone is removed relative to the distance to the face L = from −120 to −10 m and decreases in size L = from −120 to −53 m in front of the longwall at S = 1140 m.
The area of a dangerously “local minimum” concentration (CH4 ≤ 20%, limited by the orange curve in Figure 3) begins to form from 1310 m from the beginning of the extraction column at L = −28 m in front of the longwall and gradually expands in size. The maximum width of the region (L = from −60 to −8 m) is traced at S = 1250 m, after which it sharply narrows to a point (S = 1240 m L = −35 m). Further, the area of the minimum concentration disappears and begins to be traced only from S = 1183 m, at a distance of −11 m in front of the longwall. The maximum width of the region (L = from −37 to 7 m) is traced at S = 1162 m, after which it sharply narrows to a point (S = 1140 m L = −15 m). Behind the longwall, this area is essentially absent.
As a result of the studies (the graphical solution of which is shown in Figure 3), a polynomial dependence of the methane concentration on the distance from the stoping face line was established with a decrease in the distance to the beginning of the extraction area (R2 = 0.97):
- -
- The definition domain of the points (orthogonality interval of the approximating polynomials) corresponds to S = S′ for all S′ ∈ [0, π] and L = L′ for all corresponds to S = S′ for all S′ ∈ [0, π] and L = L′ for all L′ ∈ [0, π].
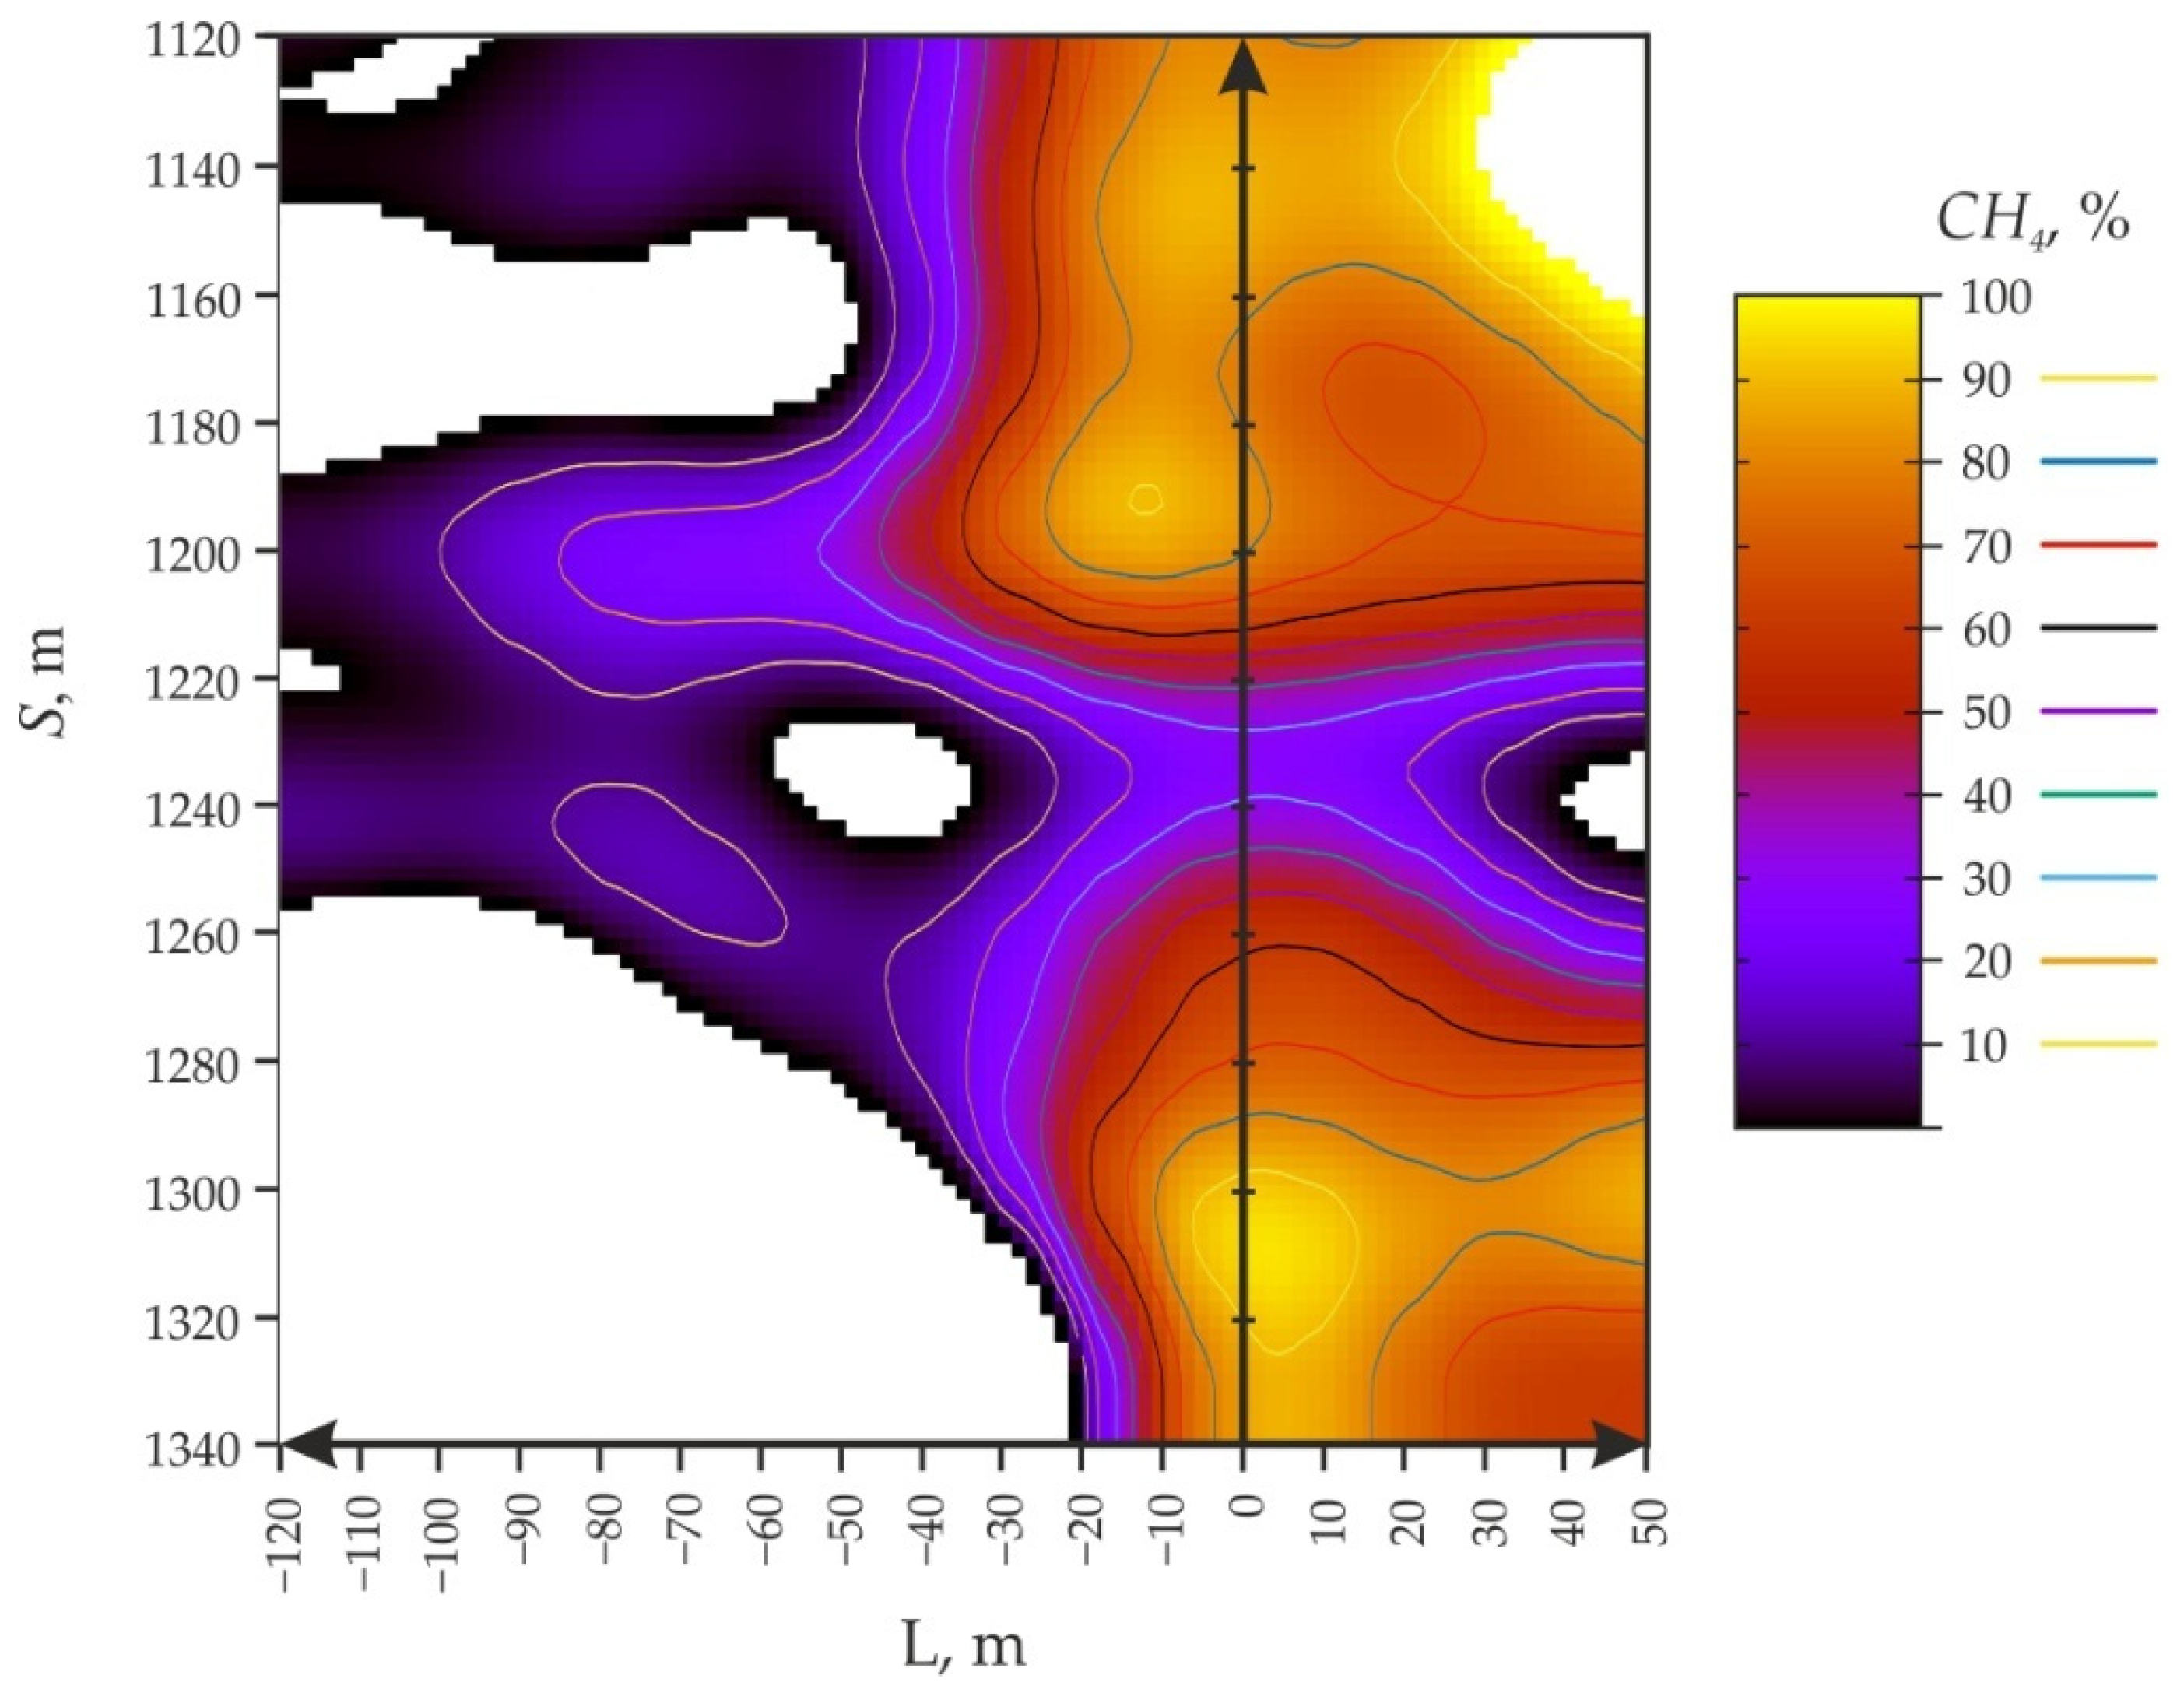
The results of the distribution of gas flow from wells drilled into the overlying adjacent seams during the longwall development of the m3 seam are shown in Figure 4.
From the analysis of Figure 4, it follows that at the beginning of the development of reserves for wells drilled above the developed seam to create a barrier (cross-measure boreholes), it is characteristic that the zone of the “local maximum” concentration (CH4 ≥ 60%) begins from points S = 1323 m and L = 4 m behind the longwall. The maximum width of the region (L = from −6 to 15 m) is traced at S = 1305 m, after which sharp narrowing to a point (S = 1298 m L = from 2 m) is observed. Further, insignificant dimensions of the studied zone begin to be traced only from the range S = 1197–1194 m, at distances from −12 to −9 m ahead of the longwall. Subsequently, behind the longwall, the zone begins to form from 1172 m from the beginning of the site at L = −50 m in front of the longwall and gradually expands in size. The maximum width of the region (L = from 20 to 50 m) is observed at S = 1140 m, after which it sharply narrows to a width of L = from 33 to 50 m at S = 1120 m.
The area of high methane content (CH4 ≥ 60%), starting from S = 1340 m, is stably traced at a distance L = −10 m in front of the longwall and in the entire range L = 0–50 m behind it (which means the width of the area is 60 m) to the picket S = 1298 m. Subsequent mining of the reserves leads to a decrease in the width of the area to the point S = 1261 m L = 5 m. Of particular interest is the area of the extraction column S = 1260–1218 m, which is characterized by the presence of CH4 ≤ 60% for any distance from the stoping face, both in front of and behind the longwall. Moreover, several zones of the “local minimum” are dispersed on one line in this range. Further, the area of high productivity of degassing begins from the point (S = 1218 m; L = −13 m), expanding sharply up to 50 m behind the longwall (starting from S = 1208 m) and up to −34 m in front of the longwall (S = 1200 m). Further, ahead of the longwall, there is a slight decrease in the width of the zone of high methane content, followed by stabilization at a value of L = −25 m, from S = 1168 m to S = 1120 m.
The area of a dangerous “local minimum” of concentration (CH4 ≤ 20%) in front of the longwall can be traced from a picket of 1340 m, at a distance L = from −120 to −18 m and gradually decreasing (at the first stage) in size to S = 1278 m (L = from −120 to −35 m). Further, the area expands to maximum values of −120 to −13 m at picket 1239 m, after which the width of the area again begins to decrease to minimum values (L = from −120 to −84 m) at S = 1200 m. In the last stage, the growth and stabilization of the zone width up to L = from −120 to −39 m after the picket = 1168 m is typical. Behind the longwall, the area of the local minimum begins to form from 1260 m from the beginning of the excavation column to 50 m ahead of the longwall and gradually expands in size. The maximum width of the region (L = 20 to 50 m) is traced at S = 1239 m, after which it sharply narrows to a point (S = 1220 m L = 50 m).
Numerical values (analysis of residuals) for the formation of ideas for assessing the quality of the obtained models are given in Table 2.
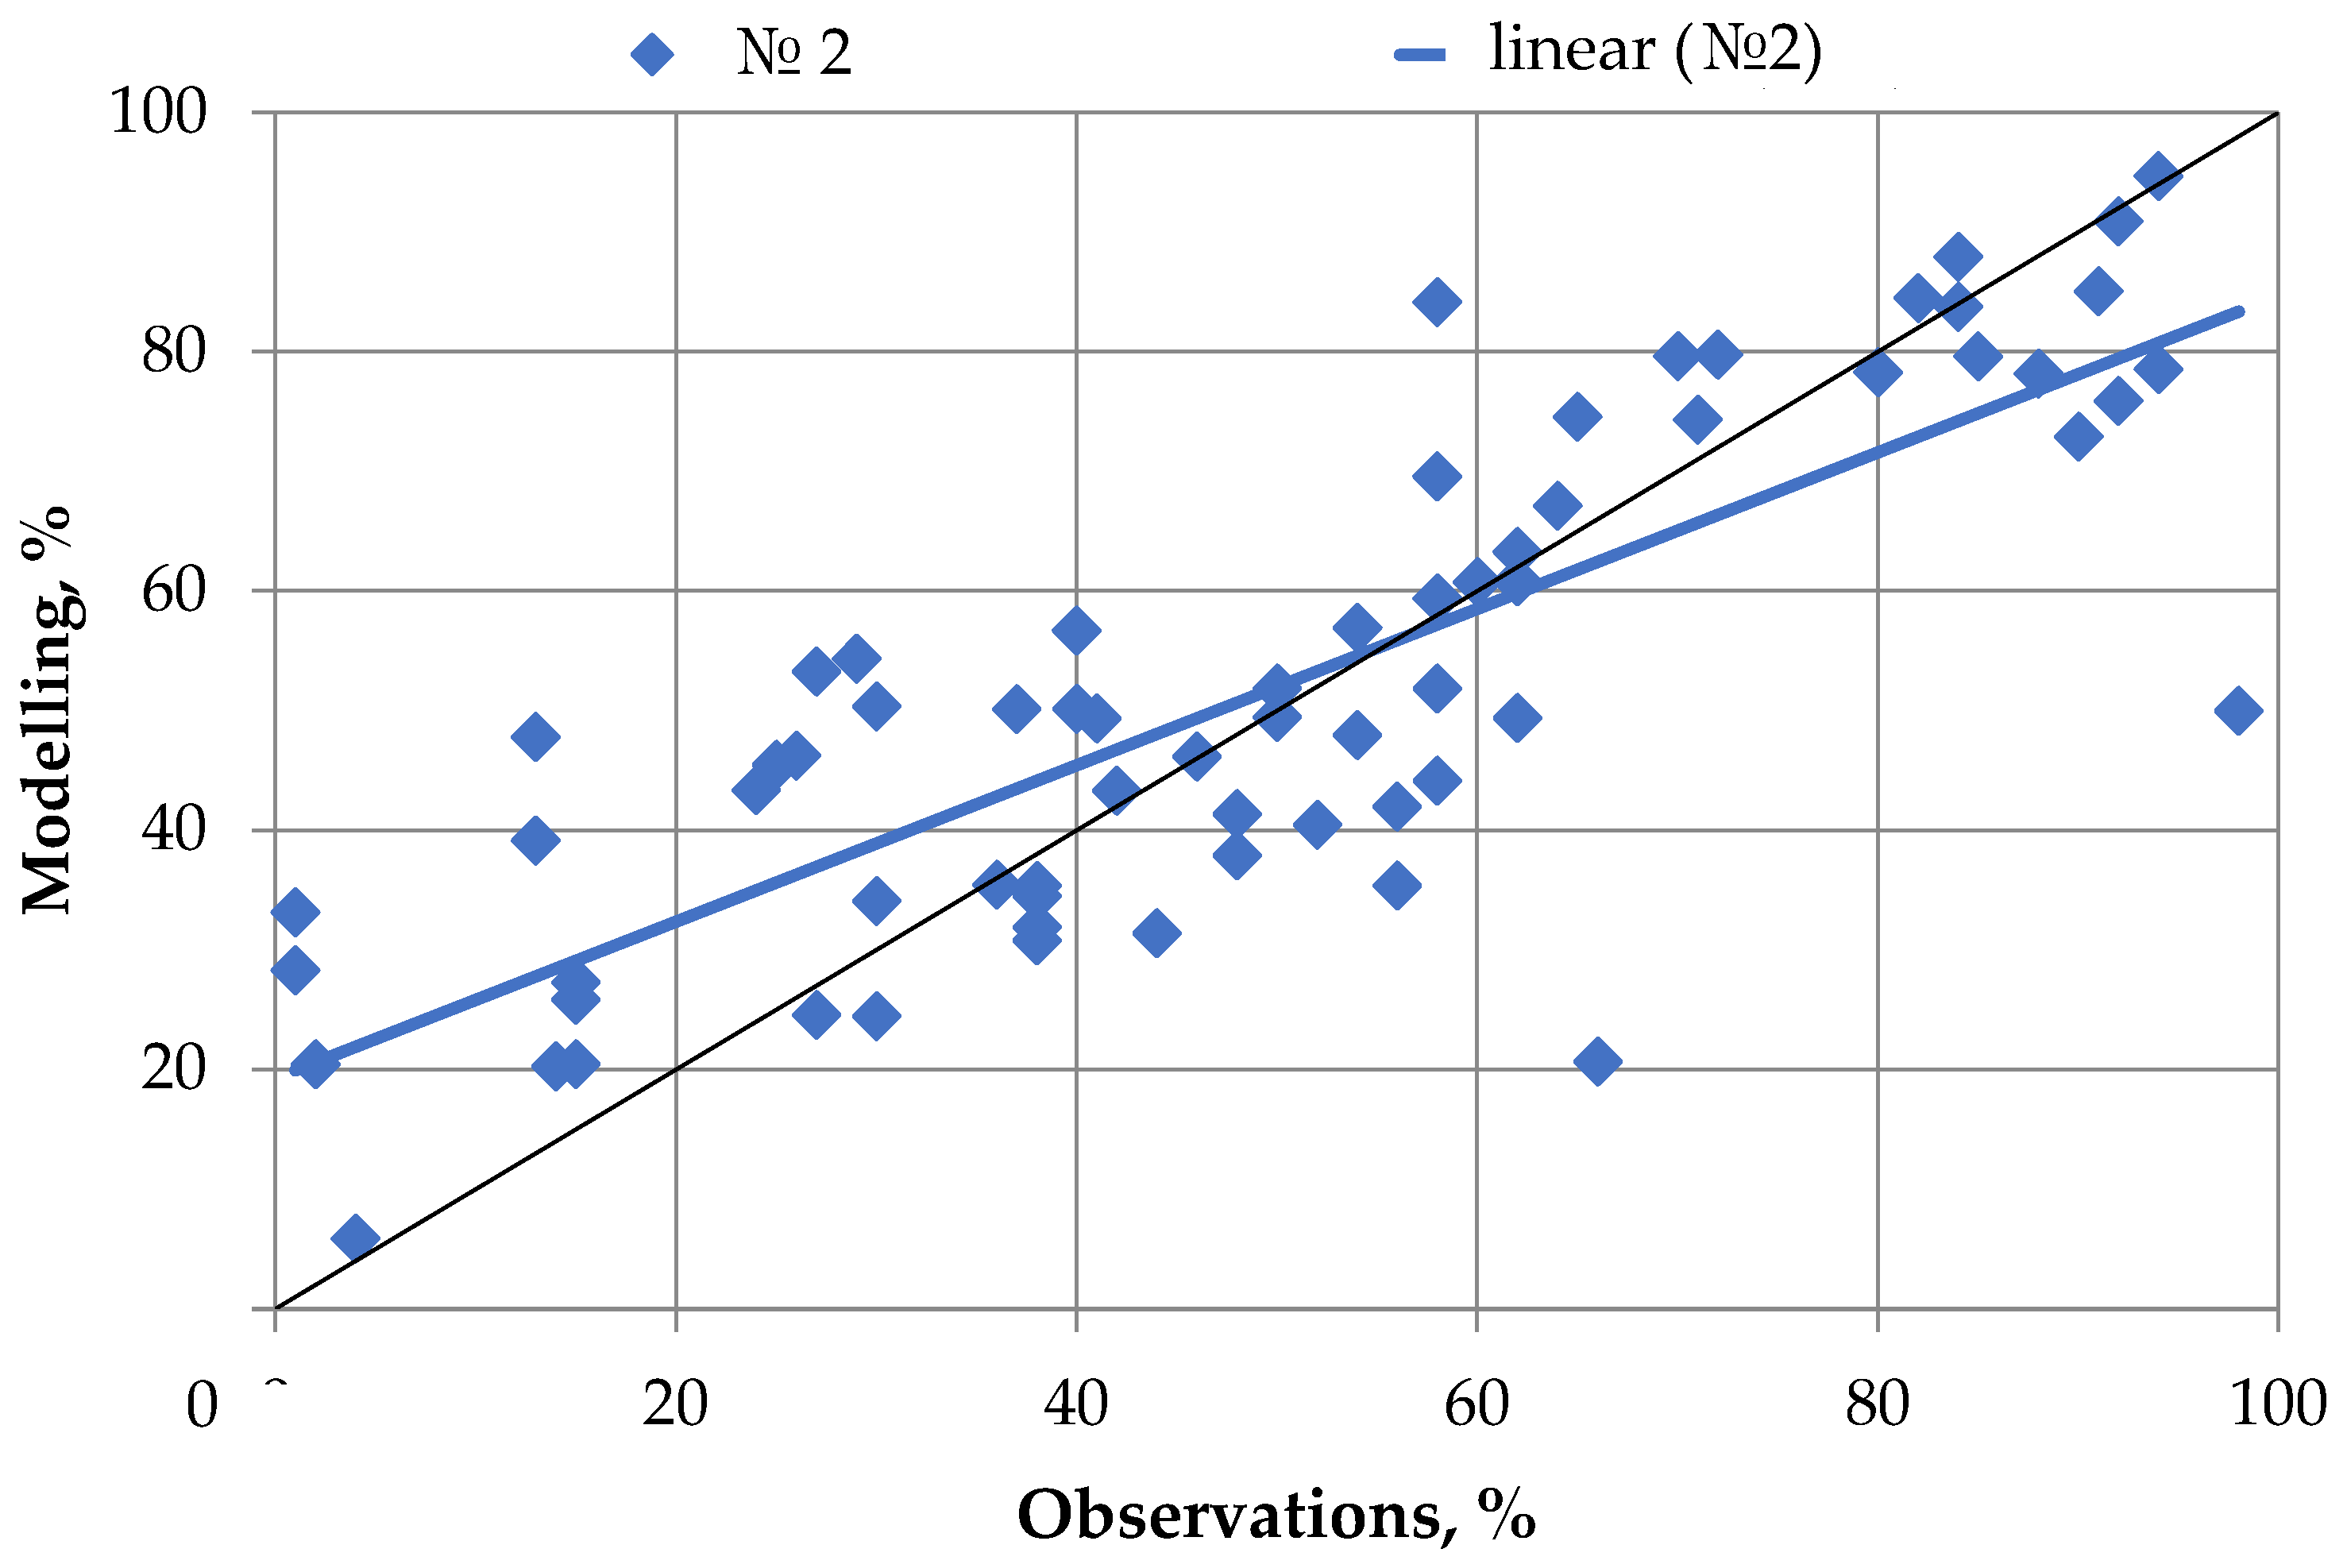
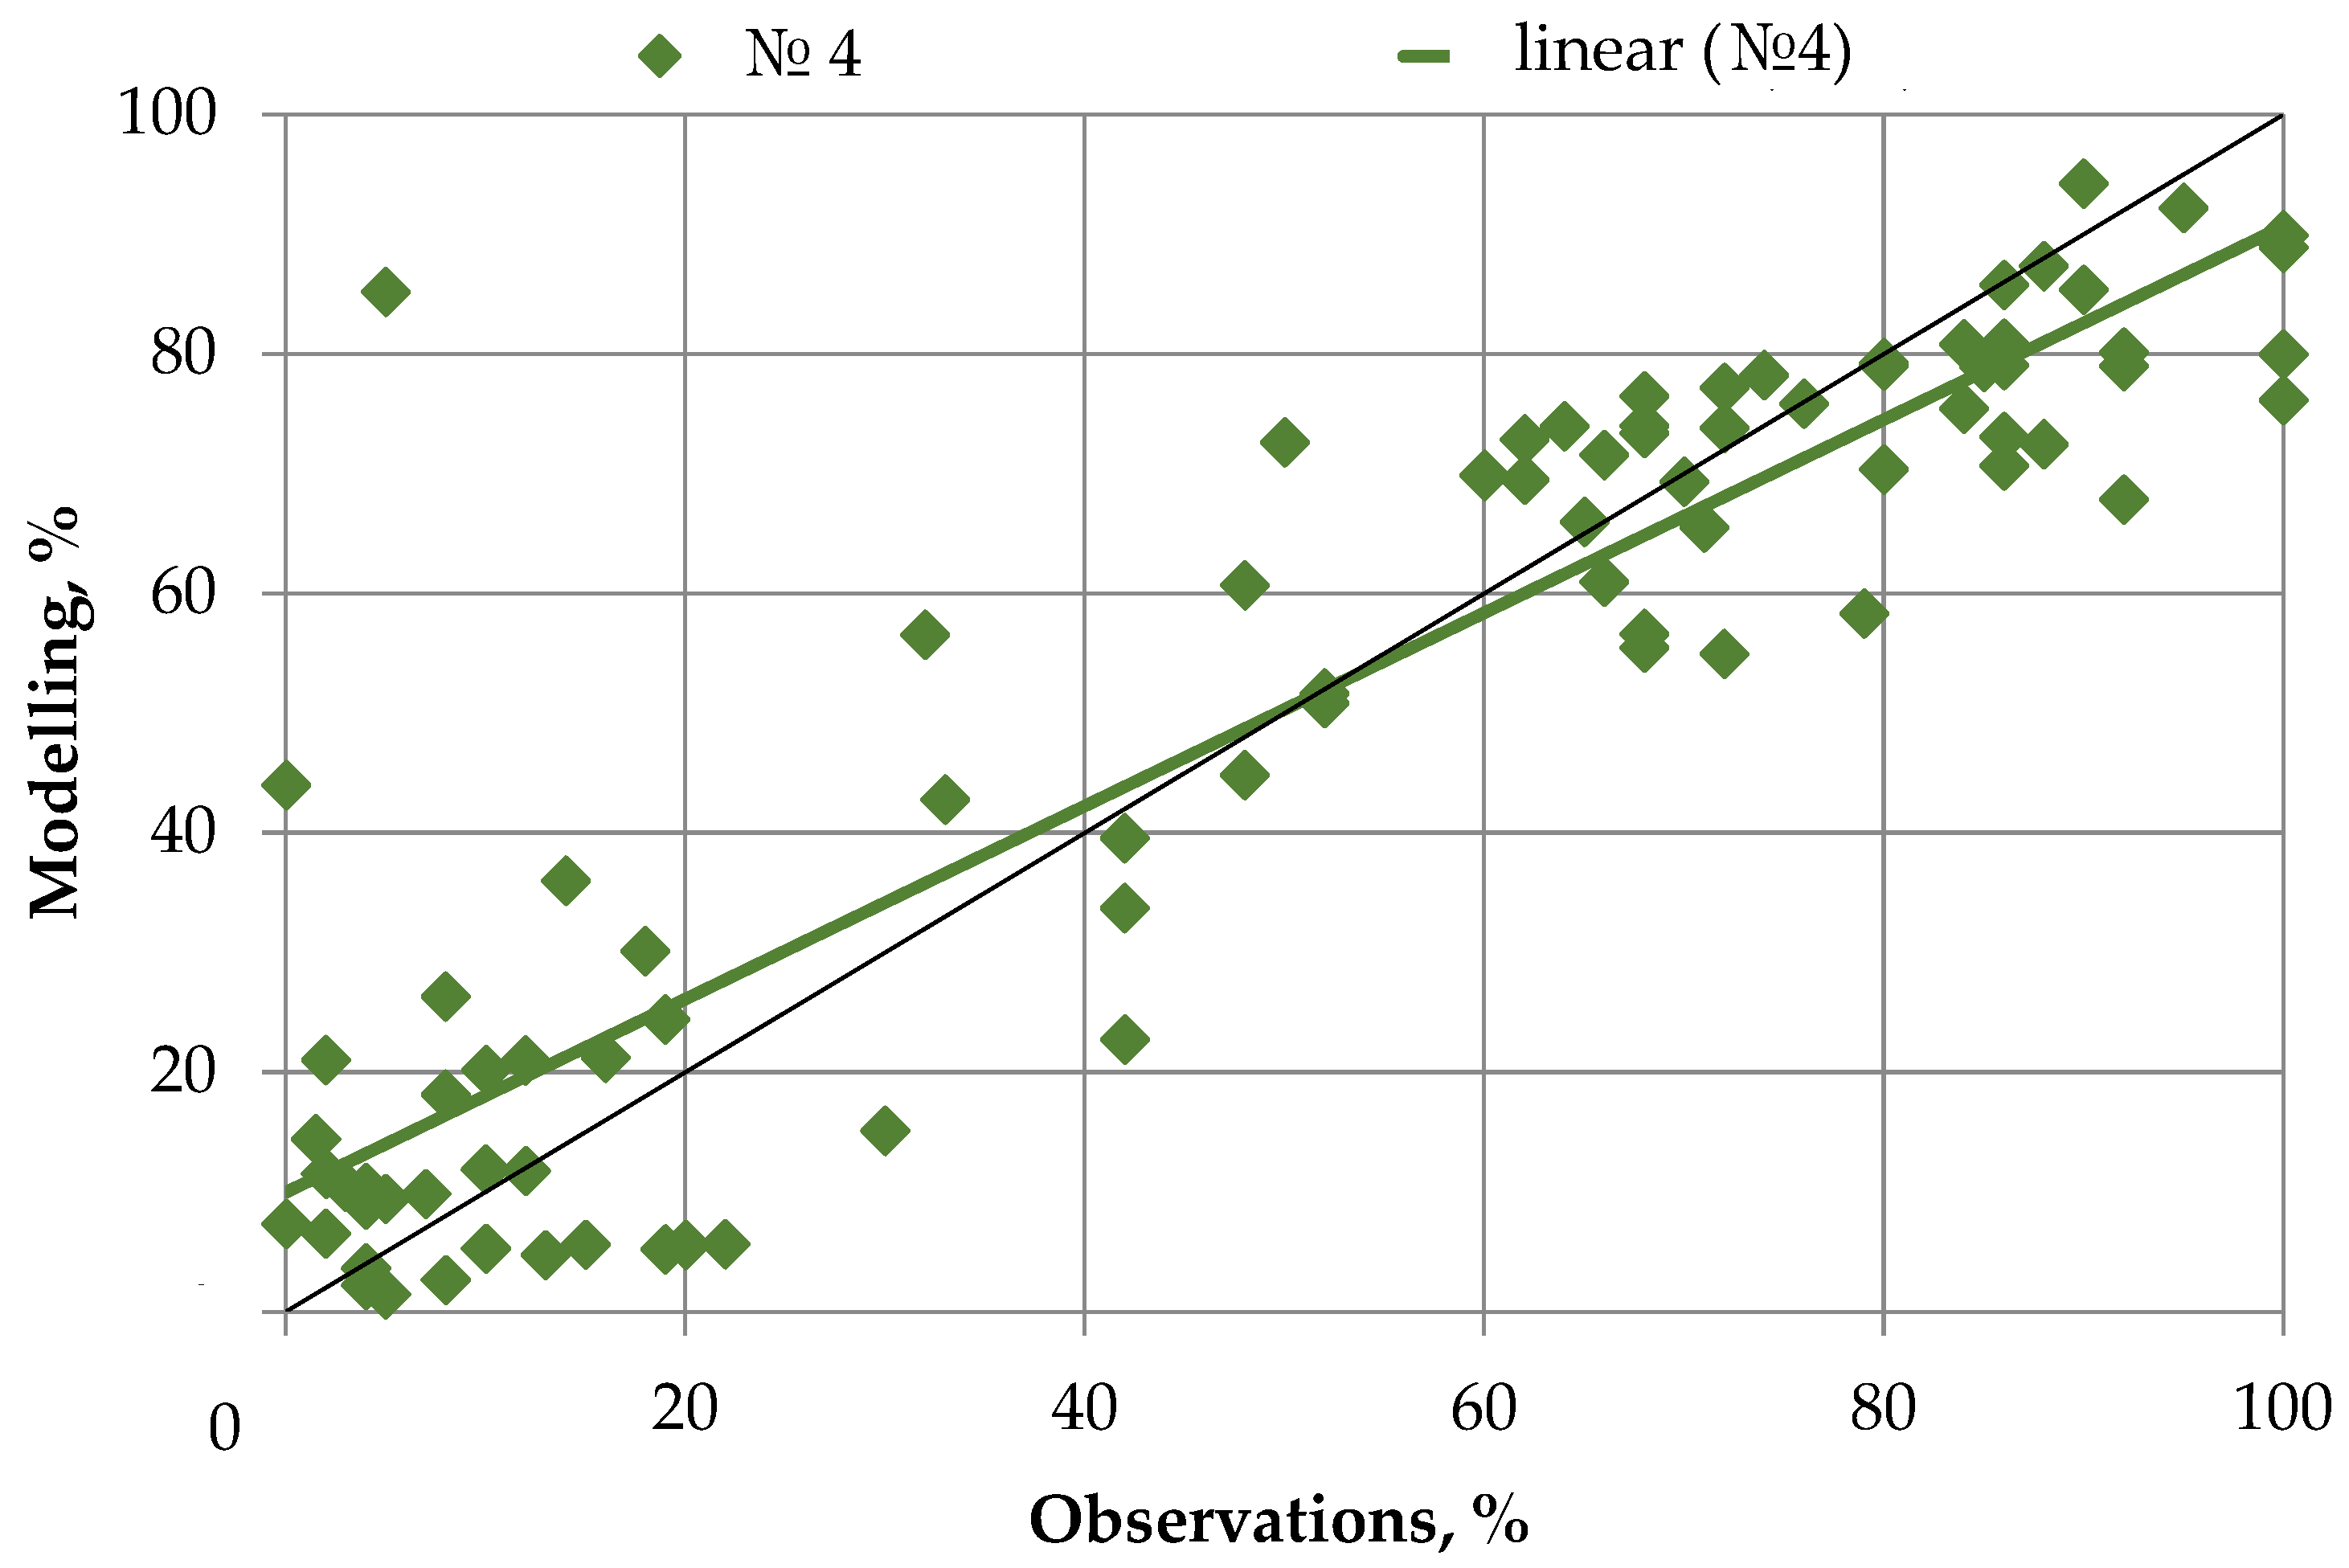
The results of constructing Q-Q graphs for two types of wells, based on the data in Table 2, are shown in Figure 5 and Figure 6.
The analysis of Figure 5 shows that the linear trend for the model data (high-order polynomials) deviates slightly from the reference black line (maximum likelihood), while the presence of “releases” resulted in (R² = only 0.66). The equation of the studied straight line has the following form:
The analysis of Figure 6 shows that the linear trend for model data (high-order polynomials) deviates minimally from the reference trend (maximum likelihood), while R² = 0.82). The equation of the studied straight line has the following form:
From the analysis of the angles of deviations of linear trends for different types of wells, it follows that for them, with the same approach to data processing, insignificant discrepancies were obtained in modeling quality.
This can be explained by a significant discrepancy in sample sizes (sets of experimental data)—151 for type No. 2 and 261 for type No. 4, which causes a 50–70% larger slope of linear trends. At the same time, the modeling accuracy in both cases is sufficient to establish the general patterns of the studied process.
4. Discussion
A striking feature of the operation of undermined wells (type No. 4, see Figure 4) is the complete loss of performance, based on the proposed mechanism of well collapse [44,45] throughout the entire length of the local degassing network. In general, the results confirm the well-known fact of “overflow” of gas flows in the zone of advanced fracturing (enveloping the surface of partial unloading around the stoping face line). In addition, it confirms a number of the manifestation features (see Figure 9 of the paper [46]) of deformation-wave processes in geo-environments [21,46]. The projections of the simulated response surfaces on the S-L axis (the length of the extraction column of the 18th eastern longwall–the distance to the longwall) make it possible to identify significant isogases for interpreting the relationship between deformation and aerogas processes during the stopped excavation. The absence of parallelism of the curve in the zone of advanced fracturing (the area of high methane content is the black isoline in Figure 4), as in [47,48], confirms the assumption about the manifestation features of situational geomechanical conditions in the extraction area. The presence of such wave manifestations is indicated in the works of researchers from China [49,50].Based on this, it should be assumed that (for well type No. 4) in the area S = from 1240 to 1220 m, the main roof was caved (failure of wells due to cutting of the boreholes). Prior to this, S = from 1250 to 1240 m, a decrease in the productivity of degassing due to the collapse of casing strings (in zones of ultimate stress state) occurred. In wells drilled into goaf, a different pattern is observed. Obviously, at a minimum distance (−40 to −30 m) ahead of the longwall, the concentration of methane in the extracted mixture should not be high due to the interception of gas flows (by more productive wells No. 3 and No. 4, see the diagram in Figure 1 [29]). Moreover, the formation and expansion of the area of the local minimum of methane concentration from −60 to −20 m and, accordingly, the narrowing of the zone of maximum productivity in the zone S = from 1310 to 1240 m, is a response to a change in the productivity of wells drilled above the developed formation and an increase in the stress concentration in the support pressure zone.
The caving of the main roof (according to Figure 3 and Figure 4, it occurred in the area of picket No. 1240 m, which corresponds to the displacement of the longwall from the installation pass at 163 m), based on the simulation results, does not lead to a complete failure of the degassing section networks consisting of wells drilled into goaf [51]. Wells “recover” faster due to less damage to stability caused by extreme operating conditions. Starting from section S = from 1218 to 1220 m, an atypical phenomenon of high methane emission is observed in all operating wells in the section from −120 to 50 m (in wells No. 2 both in front of and behind a longwall). This can be explained by the transitional period of “gassing after caving” when the volumes of the new goaf above the mined seam do not yet form an anthropogenic gas collector [52,53]. In subsequent periods, the balances of distribution of gas flow in wells drilled into the goaf of the previously worked out longwall and into the mined massif stabilize, which indirectly confirms the possibility of obtaining no less reliable models than, for example, those based on “machine learning” [53]. As a result of applying the author’s approach [54] to overcome the drawbacks of deterministic methods of three-dimensional interpolation of data, the resulting models are not inferior in reliability to models based on kriging. The results obtained can be used to improve the coal and gas co-mining methodology [55].
5. Conclusions
The development of anthropogenic gas-coal deposits while reducing the emission of greenhouse gases into the atmosphere requires significantlycomplexapproaches to modeling gas flows. Along with the common stochastic methods of geostatistics, the improvement of deterministic interpolation methods in combination with three-dimensional regression models has made it possible to obtain the following results:
- Deformation-wave processes in geo-environments produce cyclic non-linearities in the nature of the air–gas regime of mine methane emissions into anthropogenic rock masses, while only a part of the gas flows is captured by the degassing network in the extraction area.
- It has been established for the first time that a decrease in the distance of the stoping face line from the start of mining of the extraction column S = from 1340 to 1120 m and the distance in front of the longwall L = from −120 to 0 m leads to undulating changes in gas release (in wells No. 2), according to a polynomial dependence.
- The influence of situational geomechanical conditions of reserve mining on the area and the shape of the local extrema of the models was clarified. These models are transformed in proportion to the development of the stoping front and are displaced at certain angles to the alignment with the longwall.
Further research should be focused on improving the methodology of geoecological monitoring of emission flows of climatically active gases during the transformation of natural and technical systems. Conclusions are only valid for the lower technical limit of the m3 seam mining in Donbass. The main constraints include a development depth of 1250–1350 m, natural methane content of 23 m3/t dry ash-free mass and above, a coal seam thickness of 1.3–1.55 m, (the main limiting mining and technical factor) a rock temperature that exceeds 41 °C.
Author Contributions
Conceptualization, V.S.B. and V.I.G.; methodology, V.S.B.; software, V.S.B.; validation, V.S.B. and B.V.D.; formal analysis, B.V.D.; investigation, V.S.B.; resources, V.I.G.; data curation, V.S.B.; writing—original draft preparation, B.V.D.; writing—review and editing, B.V.D.; visualization, B.V.D.; supervision, V.S.B.; project administration, V.I.G. All authors have read and agreed to the published version of the manuscript.
Funding
This research received no external funding.
Data Availability Statement
Not applicable.
Conflicts of Interest
The authors declare no conflict of interest.
References
- Saunois, M.; Jackson, R.B.; Bousquet, P.; Poulter, B.; Canadell, J.G. The growing role of methane in anthropogenic climate change. Environ. Res. Lett. 2016, 11, 120207. [Google Scholar] [CrossRef] [Green Version]
- Shukla, P.R.; Skea, J.; Slade, R.; Khourdajie, A.A.; van Diemen, R.; McCollum, D.; Pathak, M.; Some, S.; Vyas, P.; Fradera, R.; et al. IPCC, 2022: Climate Change 2022: Mitigation of Climate Change. Contribution of Working Group III to the Sixth Assessment Report of the Intergovernmental Panel on Climate Change; Cambridge University Press: Cambridge, UK; New York, NY, USA, 2022; p. 2913. [Google Scholar] [CrossRef]
- Silvia, F.; Talia, V.; Di Matteo, M. Coal mining and policy responses: Are externalities appropriately addressed? A meta-analysis. Environ. Sci. Policy 2021, 126, 39–47. [Google Scholar] [CrossRef]
- Rylnikova, M.V. The Harmonious Development of Mining, Science and Higher Education—A Guarantee of Stable State of Mining Regions in Russia. Sustain. Dev. Mt. Territ. 2020, 12, 154–161. (In Russian) [Google Scholar] [CrossRef]
- Golik, V.I.; Razorenov, Y.I.; Dmitrak, Y.V.; Gabaraev, O.Z. Safety improvement of the underground ore extraction considering mass geodynamics. Occup. Saf. industry. 2019, 8, 36–42. (In Russian) [Google Scholar] [CrossRef]
- Rybak, J.; Tyulyaeva, Y.; Kongar-Syuryun, C.; Khayrutdinov, A.M.; Akinshin, I. Geomechanical substantiation of parameters of technology for mining salt deposits with a backfill. Min. Sci. 2021, 28, 19–32. [Google Scholar] [CrossRef]
- Amrani, M.; Taha, Y.; El Haloui, Y.; Benzaazoua, M.; Hakkou, R. Sustainable Reuse of Coal Mine Waste: Experimental and Economic Assessments for Embankments and Pavement Layer Applications in Morocco. Minerals 2020, 10, 851. [Google Scholar] [CrossRef]
- Kongar-Syuryun, C.B.; Faradzhov, V.V.; Tyulyaeva, Y.S.; Khayrutdinov, A.M. Effect of activating treatment of halite flotation waste in backfill mixture preparation. Min. Inf. Anal. Bull. 2021, 1, 43–57. (In Russian) [Google Scholar] [CrossRef]
- Gabaraev, O.Z.; Konovalova, T.G.; Turluev, R.R. Ecology and utilization of ore dressing tailings. IOP Conf. Ser. EarthEnviron. Sci. 2022, 1021. [Google Scholar] [CrossRef]
- Khayrutdinov, A.; Paleev, I.; Artemov, S. Replacement of traditional components of the backfill mixture with man-made waste. IOP Conf. Ser. Earth Environ. Sci. 2021, 904, 012005. [Google Scholar] [CrossRef]
- Dzhioeva, A.K. Prospects for mining ecologization to reduce harmful emissions into the atmosphere. Ugol’ 2022, 10, 29–32. (In Russian) [Google Scholar] [CrossRef]
- Rybak, J.; Khayrutdinov, M.M.; Kuziev, D.A.; Kongar-Syuryun, C.B.; Babyr, N.V. Prediction of the geomechanical state of the rock mass when mining salt deposits with stowing. J. Min. Inst. 2022, 253, 61–70. (In Russian) [Google Scholar] [CrossRef]
- Adero, N.J.; Drebenstedt, C.; Prokofeva, E.N.; Vostrikov, A.V. Spatial data and technologies for geomonitoring of land use under aspect of mineral resource sector development. Eurasian Min. 2020, 1, 69–74. [Google Scholar] [CrossRef]
- Mohammadi, S.; Ataei, M.; Kakaie, R.; Mirzaghorbanali, A.; Aziz, N. A Probabilistic Model to Determine Main Caving Span by Evaluating Cavability of Immediate Roof Strata in Longwall Mining. Geotech. Geol. Eng. 2021, 39, 2221–2237. [Google Scholar] [CrossRef]
- Mohammadi, S.; Ataei, M.; Kakaie, R.; Mirzaghorbanali, A. A New Roof Strata Cavability Index (RSCi) for Longwall Mining Incorporating New Rating System. Geotech. Geol. Eng. 2019, 37, 3619–3636. [Google Scholar] [CrossRef]
- Khanal, M.; Qu, Q.; Zhu, Y.; Xie, J.; Zhu, W.; Hou, T.; Song, S. Characterization of Overburden Deformation and Subsidence Behavior in a Kilometer Deep Longwall Mine. Minerals. 2022, 12, 543. [Google Scholar] [CrossRef]
- Islavath, S.; Deb, D. Interaction of a Shield Structure with Surrounding Rock Strata Under Geo-static and Fatigue Loadings. Geotech. Geol. Eng. 2022, 40, 2949–2965. [Google Scholar] [CrossRef]
- Arasteh, H.; Esmaeili, K.; Saeedi, G.; Farsangi, M.A.E. Discontinuous Modeling of Roof Strata Caving in a Mechanized Longwall Mine in Tabas Coal Mine. Int. J. Geomech. 2022, 22, 04022040. [Google Scholar] [CrossRef]
- Rasouli, H.; Shahriar, K.; Madani, S.H. Prediction of the Height of Fracturing via Gene Expression Programming in Australian Longwall Panels: A Comparative Study. Rud. GeoloskoNaft. Zb. 2022, 37, 91–104. [Google Scholar] [CrossRef]
- Zhu, Z.; Wu, Y.; Liang, Z. Mining-Induced Stress and Ground Pressure Behavior Characteristics in Mining a Thick Coal Seam With Hard Roofs. Front. Earth Sci. 2022, 10, 843191. [Google Scholar] [CrossRef]
- Polevshchikov, G.Y. Deformation-wave processes under production face advance in coal and rocks. J. Min. Sci. 2013, 49, 715–723. [Google Scholar] [CrossRef]
- Shemyakin, E.I.; Fisenko, G.L.; Kurlenya, M.V.; Oparin, V.N.; Reva, V.N.; Glushikhin, F.P.; Rosenbaum, M.A.; Tropp, E.A.; Kuznetsov, Y.S. The effect of zonal disintegration of rocks around underground workings. Doklady Akademii Nauk 1986, 1, 289. [Google Scholar]
- Shemyakin, E.I.; Fisenko, G.L.; Kurlenya, M.V.; Oparin, V.N.; Reva, V.N.; Glushikhin, F.P.; Rozenbaum, M.A.; Tropp, E.A.; Kuznetsov, Y.S. Zonal Disintegration of Rocks and Underground Workings Stability; Siberian Branch of the Russian Academy of Sciences: Novosibirsk, Russia, 2008; p. 276. [Google Scholar]
- Young, R.P.; Nasseri, M.H.B.; Sehizadeh, M. Mechanical and seismic anisotropy of rocks from the ONKALO underground rock characterization facility. Int. J. Rock Mech. Min. 2020, 126, 104190. [Google Scholar] [CrossRef]
- Ghaffari, H.; Nasseri, M.; Young, R. Faulting of Rocks in a Three-Dimensional Stress Field by Micro-Anticracks. Sci. Rep. 2014, 4, 5011. [Google Scholar] [CrossRef] [PubMed] [Green Version]
- Zhang, Z.; Zhang, R.; Cao, Z.; Gao, M.; Zhang, Y.; Xie, J. Mechanical Behavior and Permeability Evolution of Coal under Different Mining Induced Stress Conditions and Gas Pressures. Energies 2020, 13, 2677. [Google Scholar] [CrossRef]
- Karimpouli, S.; Tahmasebi, P.; Ramandi, H.L. A review of experimental and numerical modeling of digital coalbed methane: Imaging, segmentation, fractures modeling and permeability prediction. Int. J. Coal Geol. 2020, 228, 103552. [Google Scholar] [CrossRef]
- Szlazak, N.; Obracaj, D.; Korzec, M. Estimation of Gas Loss in Methodology for Determining Methane Content of Coal Seams. Energies 2021, 14, 982. [Google Scholar] [CrossRef]
- Brigida, V.S.; Zinchenko, N.N. Methane Release in Drainage Holes Ahead of Coal Face. J. Min. Sci. 2014, 50, 60–64. [Google Scholar] [CrossRef]
- Gryazev, M.V.; Kachurin, N.M.; Vorob’ev, S.A. Mathematical Models of Gas-Dynamic and Thermophysical Processes in Underground Coal Mining at Different Stages of Mine Development. J. Min. Inst. 2017, 223, 99–108. [Google Scholar] [CrossRef]
- Qu, Q.; Shi, J.; Wilkins, A. A Numerical Evaluation of Coal Seam Permeability Derived from Borehole Gas Flow Rate. Energies 2022, 15, 3828. [Google Scholar] [CrossRef]
- Cheng, Y.P.; Wang, L.; Zhang, X.L. Environmental impact of coal mine methane emissions and responding strategies in China. Int. J. Greenh. Gas Control. 2011, 5, 157–166. [Google Scholar] [CrossRef]
- Jiangfu, H.; Wenchao, H.; Chengpeng, Z.; Zhongguang, S.; Xiaoyi, S. Numerical simulation on the deformation characteristics of borehole failure in gas-bearing coal seams considering the effective stress principle under complicated stress path conditions. Geomech. Geophys. Geo-Energy Geo-Resour. 2022, 8, 95. [Google Scholar] [CrossRef]
- Hou, X.; Liu, S.; Zhu, Y.; Yang, Y. Evaluation of gas contents for a multi-seam deep coalbed methane reservoir and their geo-logical controls: In situ direct method versus indirect method. Fuel 2020, 265, 116917. [Google Scholar] [CrossRef]
- Bosikov, I.I.; Klyuev, R.V.; Khetagurov, V.N.; Azhmukhamedov, I.M. Development of methods and controls for aerogasodynamic processes at mining sites. Sustain. Dev. Mt. Territ. 2021, 1, 77–83. (In Russian) [Google Scholar] [CrossRef]
- Kadochnikov, V.G.; Dvoynikov, M.V. Development of Technology for Hydromechanical Breakdown of Mud Plugs and Improvement of Well Cleaning by Controlled Buckling of the Drill String. Appl. Sci. 2022, 12, 6460. [Google Scholar] [CrossRef]
- Bosikov, I.I.; Klyuev, R.V.; Azhmukhamedov, I.M.; Revazov, V.C. Assessment of coal mine ventilation control using statistical dynamics methods. Min. Inf. Anal. Bull. 2021, 11, 123–135. (In Russian) [Google Scholar] [CrossRef]
- Yao, H.; Peng, H.; Hong, B.; Guo, Q.; Ding, H.; Hong, Y.; Zhu, Y.; Cai, C.; Chi, J. Environmental Controls on Multi-Scale Dynamics of Net Carbon Dioxide Exchange From an Alpine Peatland on the Eastern Qinghai-Tibet Plateau. Front. Plant Sci. 2022, 12, 791343. [Google Scholar] [CrossRef]
- Dzhioeva, A.K.; Brigida, V.S. Spatial non-linearity of methane release dynamics in underground boreholes for sustainable mining. J. Min. Inst. 2020, 245, 522–530. [Google Scholar] [CrossRef]
- Qu, Q.; Balusu, R.; Belle, B. Specific gas emissions in Bowen Basin longwall mines, Australia. International. Int. J. Coal Geol. 2022, 261, 104076. [Google Scholar] [CrossRef]
- Borowski, M.; Zyczkowski, P.; Cheng, J.; Luczak, R.; Zwolinska, K. The Combustion of Methane from Hard Coal Seams in Gas Engines as a Technology Leading to Reducing Greenhouse Gas Emissions—Electricity Prediction Using ANN. Energies 2020, 13, 4429. [Google Scholar] [CrossRef]
- Alipenhani, B.; Majdi, A.; Amnieh, H.B. Determination of Caving Hydraulic Radius of Rock Mass in Block Caving Method using Numerical Modeling and Multivariate Regression. J. Min. Environ. 2022, 13, 217–233. [Google Scholar] [CrossRef]
- Khanal, M.; Adhikary, D.; Balusu, R.; Wilkins, A.; Belle, B. Mechanical study of shear failure of vertical goaf drainage hole. Geotech. Geol. Eng. 2022, 40, 1899–1920. [Google Scholar] [CrossRef]
- Niu, Y.; Zhang, X.; Wang, E.; Li, Z.; Cheng, Z.; Duan, X.; Li, H.; Wei, Y.; Qian, J.; Cai, G.; et al. A new method of monitoring the stability of boreholes for methane drainage from coal seams. Meas. J. Int. Meas. Confed. 2020, 15, 107521. [Google Scholar] [CrossRef]
- Brigida, V.S.; Golik, V.I.; Dmitrak, Y.V.; Gabaraev, O.Z. Ensuring Stability of Undermining Inclined Drainage Holes During Intensive Development of Multiple Gas-Bearing Coal Layers. J. Min. Inst. 2019, 239, 497–501. [Google Scholar] [CrossRef]
- Qu, Q.; Guo, H.; Balusu, R. Methane emissions and dynamics from adjacent coal seams in a high permeability multi-seam mining environment. Int. J. Coal Geol. 2022, 253, 103969. [Google Scholar] [CrossRef]
- Li, Y.; Wu, S.; Nie, B.; Ma, Y. A new pattern of underground space-time Tridimensional gas drainage: A case study in Yuwu coal mine, China. Energy Sci. Eng. 2019, 7, 399–410. [Google Scholar] [CrossRef] [Green Version]
- Dzhioeva, A.K.; Tekhov, A.V. Reduction of mine methane emissions for ensuring sustainable development of geotechnologies in the transition to Industry 3.0. IOP Conf. Ser. Mater. Sci. Eng. 2021, 1064, 012008. [Google Scholar] [CrossRef]
- Qin, B.; Shi, Z.S.; Hao, J.F.; Ye, D.L.; Liang, B.; Sun, W.J. Analysis of the Space–Time Synergy of Coal and Gas Co-mining. ACS Omega 2022, 7, 13737–13749. [Google Scholar] [CrossRef]
- Shi, Z.; Ye, D.; Hao, J.; Qin, B.; Li, G. Research on Gas Extraction and Cut Flow Technology for Lower Slice Pressure Relief Gas under Slice Mining of Extra-thick Coal Seam. ACS Omega 2022, 7, 24531–24550. [Google Scholar] [CrossRef]
- Zhang, C.; Tu, S.; Bai, Q.; Yang, G.; Zhang, L. Evaluating pressure-relief mining performances based on surface gas vent hole extraction data in longwall coal mines. J. Nat. Gas Eng. 2015, 24, 431–440. [Google Scholar] [CrossRef]
- Liu, T.; Zhao, Y.; Kong, X.; Lin, B.; Zou, Q. Dynamics of coalbed methane emission from coal cores under various stress paths and its application in gas extraction in mining-disturbed coal seam. J. Nat. Gas Eng. 2022, 104, 104677. [Google Scholar] [CrossRef]
- Khanal, M.; Poulsen, B.; Adhikary, D.; Balusu, R.; Wilkins, A.; Belle, B. Numerical study of stability and connectivity of vertical goaf drainage holes. Geotech. Geol. Eng. 2021, 39, 2669–2679. [Google Scholar] [CrossRef]
- Zhou, J.; Lin, H.; Jin, H.; Li, S.; Yan, Z.; Huang, S. Cooperative prediction method of gas emission from mining face based on feature selection and machine learning. Int. J. Coal Sci. Technol. 2022, 9, 51. [Google Scholar] [CrossRef]
- Zhong, S.; Lin, D. Evaluation of the Coordination Degree of Coal and Gas Co-Mining System Based on System Dynamics. Sustainability. 2022, 14, 16434. [Google Scholar] [CrossRef]
Figure 1.
The sink scheme of wells of various types in the excavation area: 1—gray sandstone; 2—dark gray siltstone; 3—mudstone; 4—seam m3; 5—mined-out space of previously worked out longwall; 6—bi-support; 7—belt road of 17th eastern longwall; 8—contour deformations; 9—casing; 10—air drift of 18th eastern longwall.

Figure 2.
The distribution of methane concentration in the previously mined rock mass during reverse development of the m3 seam (according to well type No. 2): L is the distance to the stopping face line of the 18th eastern longwall, m; S is remoteness of the face of the 18th eastern longwall relative to the beginning of the extraction column (pickets), m; P is main roof span, at a different point in time; CH4 is the concentration of methane in the extracted mixture, %.

Figure 3.
Evolution of the intensity of emission flows of coalmine methane during reverse mining of the m3 seam (according to data from wells type No. 4).
Figure 3.
Evolution of the intensity of emission flows of coalmine methane during reverse mining of the m3 seam (according to data from wells type No. 4).

Figure 4.
Spatial distribution of methane release dynamics in well No. 4.

Figure 5.
Scatter of modeling residuals (M) in relation to experimental data (O) for well type No. 2.
Figure 5.
Scatter of modeling residuals (M) in relation to experimental data (O) for well type No. 2.

Figure 6.
Scatter of modeling residuals in relation to experimental data for wells type No. 4.


Table 1.
Experimental data on methane concentration in degassing wells.
| N | Wells No. 4 | Wells No. 2 | ||||
|---|---|---|---|---|---|---|
| L, m | S, m | Measurements CH4, % | L, m | S, m | Measurements CH4, % | |
| 1 | −20 | 1330 | 2 | −30 | 1330 | 60 |
| 2 | −18 | 1330 | 10 | −28 | 1330 | 40 |
| 3 | −6 | 1330 | 100 | −26 | 1330 | 27 |
| 4 | 8 | 1330 | 88 | −24 | 1330 | 30 |
| 5 | 10 | 1330 | 86 | −22 | 1330 | 13 |
| 6 | 16 | 1330 | 86 | −20 | 1330 | 25 |
| 7 | 28 | 1330 | 65 | −18 | 1330 | 24 |
| 8 | 46 | 1330 | 48 | −6 | 1330 | 44 |
| 9 | −26 | 1310 | 15 | 8 | 1330 | 30 |
| 10 | −12 | 1310 | 72 | 10 | 1330 | 27 |
| 11 | −10 | 1310 | 100 | 16 | 1330 | 15 |
| 12 | −4 | 1310 | 95 | 28 | 1330 | 15 |
| 13 | 8 | 1310 | 90 | 46 | 1330 | 15 |
| 14 | 26 | 1310 | 80 | 50 | 1330 | 14 |
| 15 | 34 | 1310 | 72 | −50 | 1310 | 90 |
Table 2.
An example of a set of actual and model data.
| N | Wells No. 4 | Wells No. 2 | ||
|---|---|---|---|---|
| Model, % | Measurements, % | Model, % | Measurements, % | |
| 1 | 6.51 | 2 | 60.77 | 60 |
| 2 | 20.19 | 10 | 56.72 | 40 |
| 3 | 76.19 | 100 | 53.30 | 27 |
| 4 | 87.34 | 88 | 50.37 | 30 |
| 5 | 85.77 | 86 | 47.82 | 13 |
| 6 | 79.08 | 86 | 45.51 | 25 |
| 7 | 65.99 | 65 | 43.36 | 24 |
| 8 | 60.70 | 48 | 31.43 | 44 |
| 9 | 5.62 | 15 | 24.47 | 30 |
| 10 | 73.84 | 72 | 24.57 | 27 |
| 11 | 79.95 | 100 | 25.89 | 15 |
| 12 | 92.23 | 95 | 27.30 | 15 |
| 13 | 94.23 | 90 | 20.46 | 15 |
| 14 | 79.06 | 80 | 20.29 | 14 |
| 15 | 77.16 | 72 | 72.92 | 90 |
Publisher’s Note: MDPI stays neutral with regard to jurisdictional claims in published maps and institutional affiliations. |
© 2022 by the authors. Licensee MDPI, Basel, Switzerland. This article is an open access article distributed under the terms and conditions of the Creative Commons Attribution (CC BY) license (https://creativecommons.org/licenses/by/4.0/).
Share and Cite
MDPI and ACS Style
Brigida, V.S.; Golik, V.I.; Dzeranov, B.V. Modeling of Coalmine Methane Flows to Estimate the Spacing of Primary Roof Breaks. Mining 2022, 2, 809-821. https://doi.org/10.3390/mining2040045
AMA Style
Brigida VS, Golik VI, Dzeranov BV. Modeling of Coalmine Methane Flows to Estimate the Spacing of Primary Roof Breaks. Mining. 2022; 2(4):809-821. https://doi.org/10.3390/mining2040045
Chicago/Turabian StyleBrigida, Vladimir Sergeevich, Vladimir Ivanovich Golik, and Boris Vitalievich Dzeranov. 2022. "Modeling of Coalmine Methane Flows to Estimate the Spacing of Primary Roof Breaks" Mining 2, no. 4: 809-821. https://doi.org/10.3390/mining2040045