

Mouse Tracking as a Method for Examining the Perception and Cognition of Digital Maps


Department of Surveying and Geoinformatics Engineering, School of Engineering, University of West Attica, Egaleo Park Campus, Ag. Spyridonos Str., 12243 Egaleo, Greece
*
Author to whom correspondence should be addressed.
Digital 2023, 3(2), 127-136; https://doi.org/10.3390/digital3020009
Submission received: 26 April 2023
/
Revised: 26 May 2023
/
Accepted: 29 May 2023
/
Published: 30 May 2023
(This article belongs to the Special Issue “Management of Digital Ecosystems”: Dedicated to the Memory of Prof. William I. Grosky 8/4/1944–11/13/2020)
Abstract
:This article aims to present the authors’ perspective regarding the challenges and opportunities of mouse-tracking methodology while performing experimental research, particularly related to the map-reading process. We briefly describe existing metrics, visualization techniques and software tools utilized for the qualitative and quantitative analysis of experimental mouse-movement data towards the examination of both perceptual and cognitive issues. Moreover, we concisely report indicative examples of mouse-tracking studies in the field of cartography. The article concludes with summarizing mouse-tracking strengths/potential and limitations, compared to eye tracking. In a nutshell, mouse tracking is a straightforward method, particularly suitable for tracking real-life behaviors in interactive maps, providing the valuable opportunity for remote experimentation; even though it is not suitable for tracking the actual free-viewing behavior, it can be concurrently utilized with other state-of-the-art experimental methods.
1. Introduction
A map constitutes a medium designed to communicate generalized spatial information as well as existing relationships among geographic entities [1]. Cartographic products aim to transfer spatial information from mapmakers (cartographers) to the map readers/users taking also into account the third (i.e., time) dimension. Depending on the nature of the used medium, maps could be either analog or digital. Nowadays, the majority of the maps are distributed as digital products using the World Wide Web; they can be either static, animated, or interactive. In any case, the maps’ design is directly connected to the implementation of visual [2], dynamic [3] and/or sound [4] variables which are utilized towards the representation of qualitative and/or quantitative differences that characterize geographical entities and/or phenomena. Compared to other types of spatial representations (e.g., satellite images, orthophotos, etc.), both the effectiveness and the efficiency of the map-reading process are directly influenced by the selections made during the cartographic design process. The effectiveness and the efficiency are connected to the accuracy and the corresponding completion time required for the execution of map-reading tasks, accordingly [5].
The examination of map perception and cognition is mainly based on the performance of experimental research studies in which cartographic products act as visual stimuli and certain research hypotheses are tested under map-reading conditions [6]. More specifically, in cartographic research it is important to rate and/or rank the performance of the design tools (i.e., visual, dynamic and sound variables) utilized towards the visualization of spatiotemporal phenomena, as well as to analyze and model the strategies followed by map readers during the execution of basic or more complex map tasks. Over the last decades, several experimental methods, including questionnaire analysis (e.g., [7]), think-aloud protocols (e.g., [8]), reaction-time measures (e.g., [9]), eye tracking (e.g., [10]), mouse tracking (e.g., [11]), electroencephalography (EEG) (e.g., [12]), and functional Magnetic Resonance Imaging (fMRI) [13], as well as combinations among them (e.g., [14]), have been employed for the examination of perceptual and cognitive aspects related to the map-reading process. These approaches constitute well-established behavior research methods implemented in several fields related to cartography, such as psychology and neuroscience. In addition, the research outcomes produced by the performance of scientific experimentation have a direct influence on the process of cartographic design, especially for the production of modern multimedia and interactive maps distributed either as standalone applications or through the internet.
The aim of this work is to briefly present the methodology of mouse-tracking and mouse-movement analysis, as well as to highlight both the opportunities and the limitations it provides towards the examination of perceptual and cognitive issues related to the map-reading process. The higher-level goal of this article is to provide the future perspectives and potential directions in cartographic research, based on authors’ viewpoints.
In Section 2, mouse tracking is presented as an experimental method providing specific metrics and visualization techniques used for the analysis of the collected experimental data. Moreover, existing software solutions are reported in the same section. Section 3 summarizes recent cartographic studies which are based on the implementation of mouse-tracking techniques. Section 4 provides an outline of the strengths and future potential on the discussed research field, while the associated limitations are presented in Section 5. Section 6 showcases some concluding remarks of this perspective work.
2. The Mouse-Tracking Methodology
Mouse-tracking methodology constitutes one of the simplest methods used towards capturing user response during the execution of typical computer tasks (i.e., a task that is performed on a graphical user interface (GUI) presented on a digital display (e.g., mouse clicking/logging on specific linear elements)). Hence, this methodology could be utilized for the examination of both perceptual and cognitive processes related to the executed tasks [15]. Indeed, over the last decades, several applications have appeared in different domains (see, e.g., the examples presented by [15]).
2.1. Basic Description of the Method
The methodology of mouse tracking involves the process of recording and analyzing computerized mouse-movement trajectories [16]. In practice, the implementation of mouse-tracking techniques enables the collection of spatiotemporal mouse-movement data, also including mouse pointer events (i.e., single- and double-clicking). Hence, each mouse-movement data record mainly includes both horizontal and vertical coordinates of the mouse cursor position expressed in a display monitor coordinate system (usually referred to as pixel system), as well as the corresponding timestamp (usually expressed in msec). In other words, each record is mainly characterized by two spatial (x,y) and one temporal (t) value. Since the recording frequency of mouse-movement data is mainly influenced by the capabilities of the utilized system, such data can be characterized by high density. Therefore, the nature of mouse-movement data can be considered similar to other types of movement data, such as GPS trajectories and eye-tracking data. As a result, quantitative and qualitative approaches that are implemented in the aforementioned types of data could be adapted to mouse-movement data analysis and visualization (see, e.g., the studies provided by [15,17]).
The trajectories of the captured movements could reveal critical patterns regarding the strategies followed by the users. Moreover, the computation of specific metrics leads to the standardization of the analysis process, especially for the case of scientific experimentation. Besides, the computed indices are usually supported by simple or more sophisticated visualization techniques (see Section 2.2 for further details). Visualization techniques are able to qualitatively express existing patterns of the users’ searching behavior.
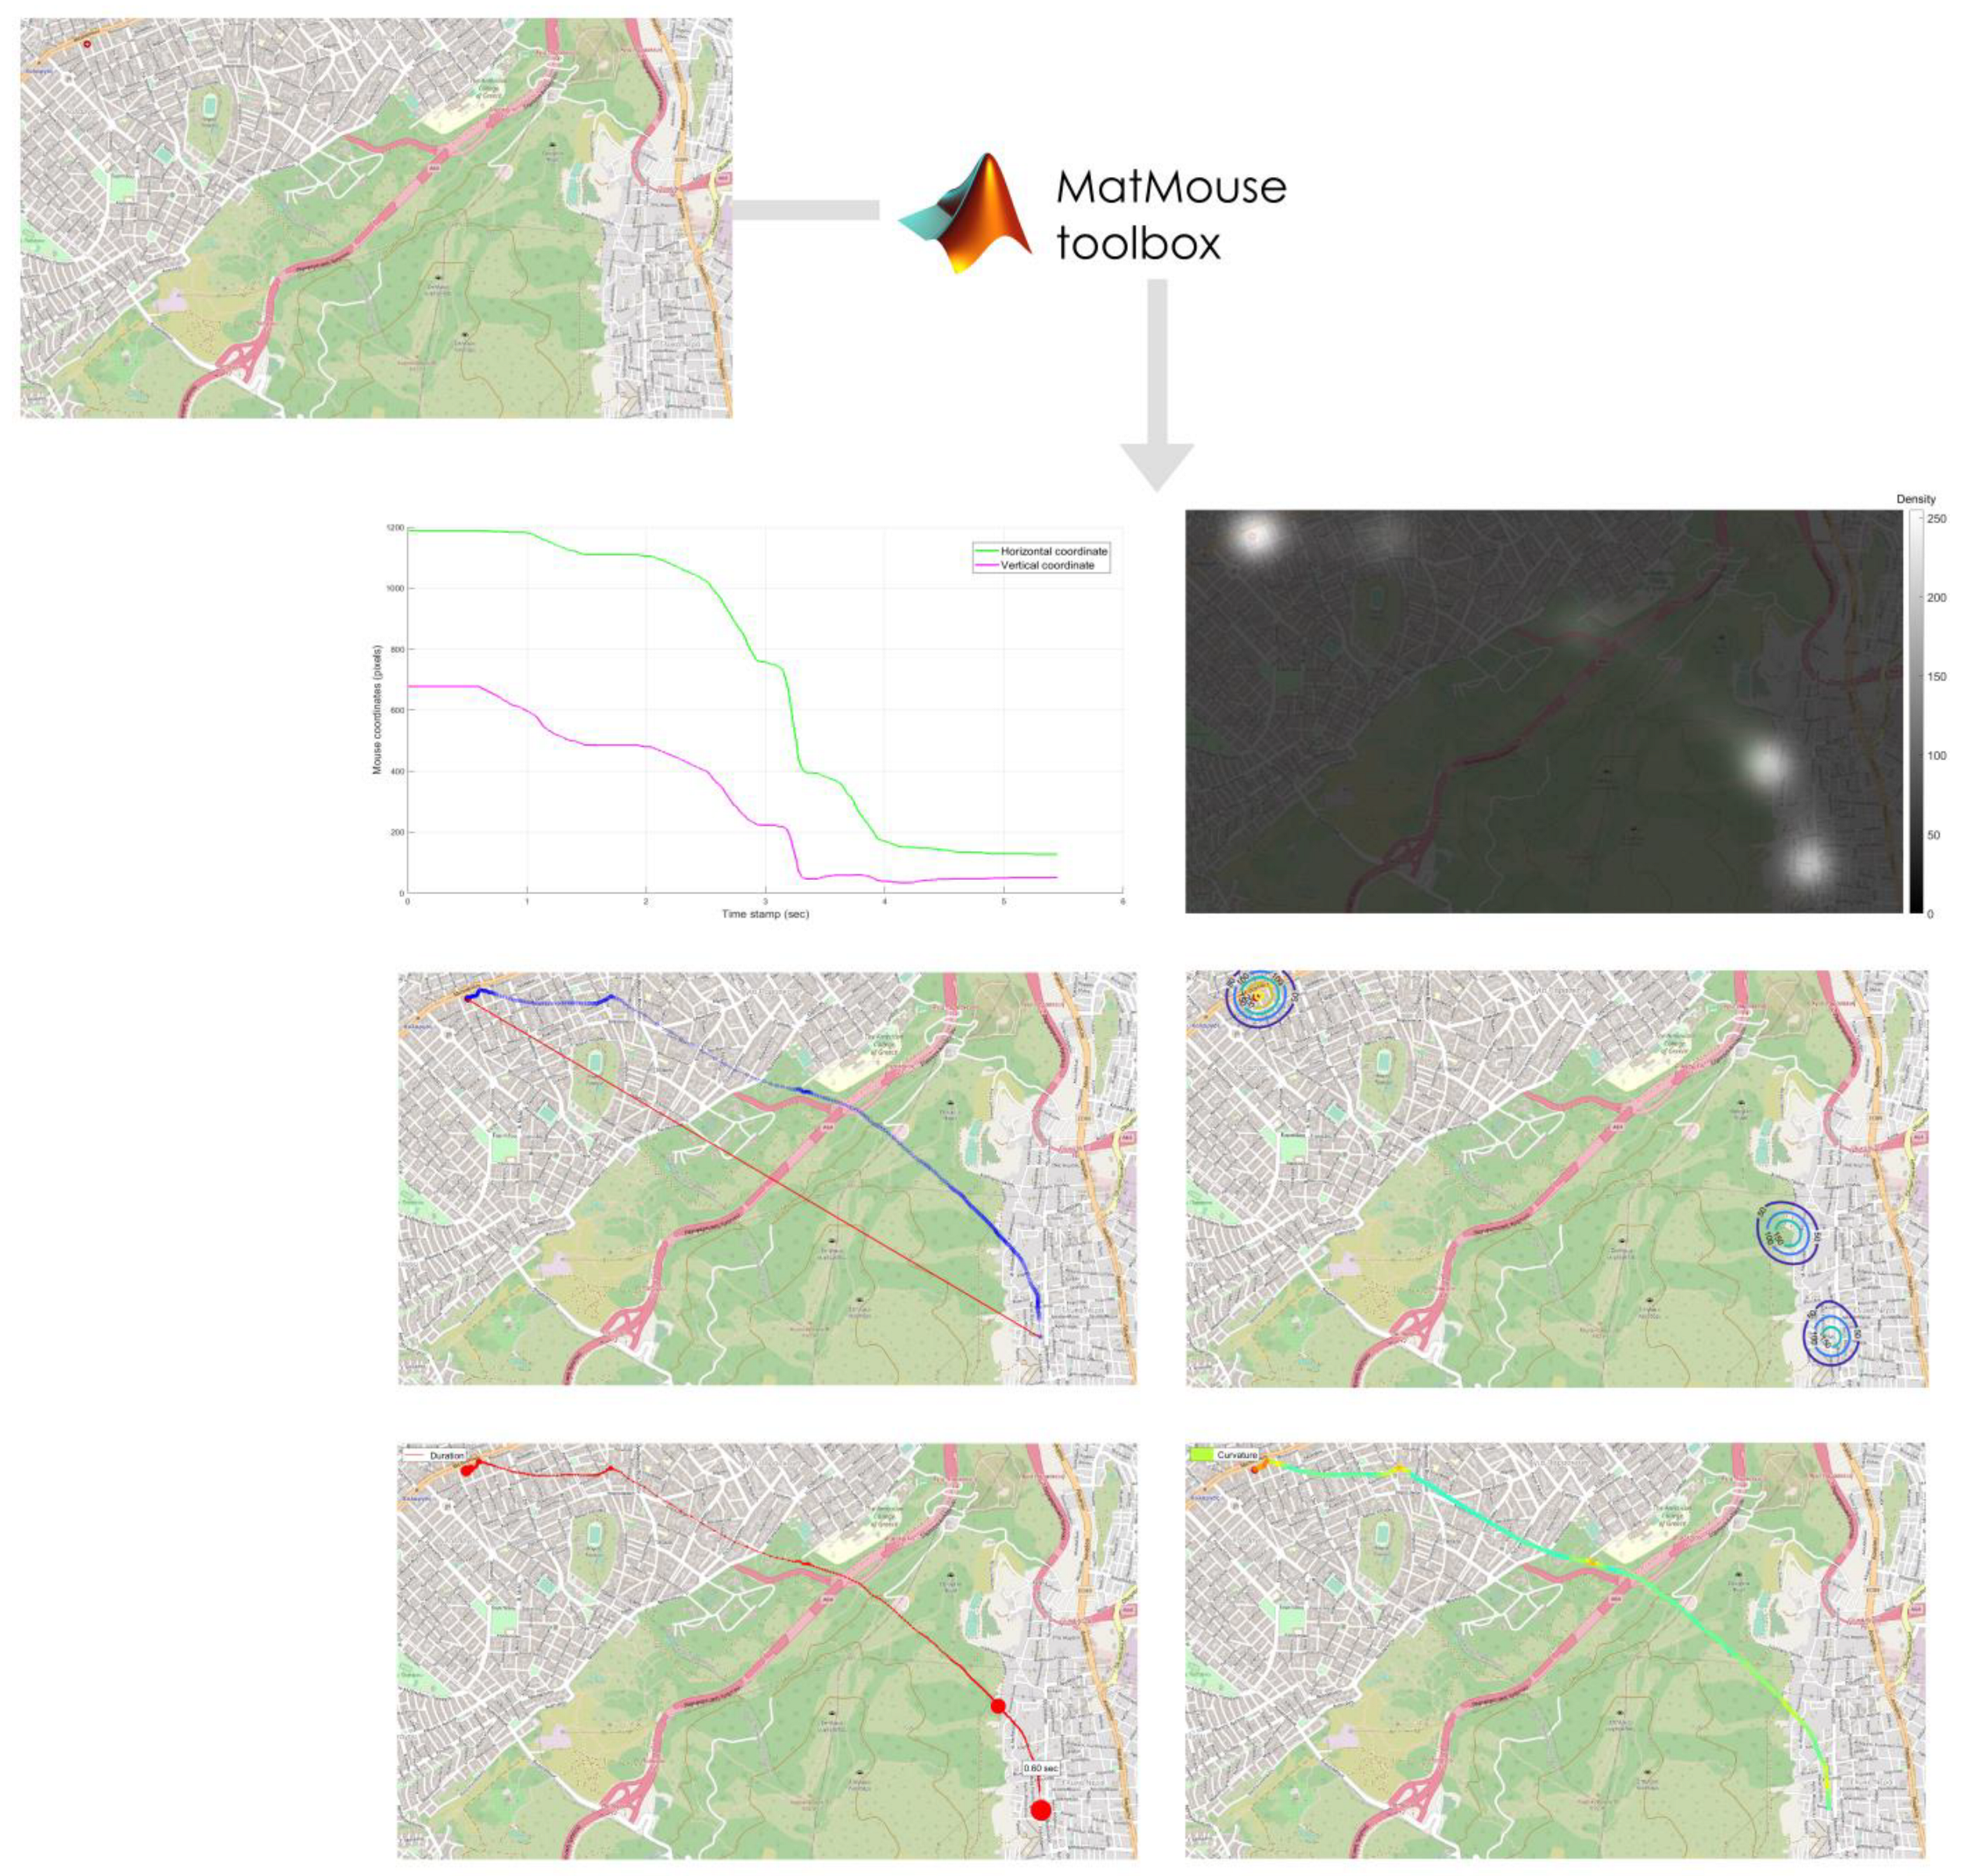
In order to highlight the potential provided by the method during a ‘real-world’ scenario, a simple example in the field of cartographic research is presented in Figure 1. In this example, experimental participants are asked to detect a specific (point) symbol on a cartographic background. Using mouse-tracking and analysis software, participants’ behavior could be modelled considering either specific metrics or different types of visualizations. Figure 1 involves different aspects of mouse trajectory produced by the MatMouse toolbox [15].
2.2. Metrics and Visualization Methods
Both the quantitative and the qualitative analyses of mouse-tracking experimental data are based on the computation of specific metrics which mainly aim to describe the individual (each participant’s) mouse-movement trajectories, as well as on the development of specific visualization methods that are used for highlighting either individual or aggregated (i.e., several/all participants’) searching strategies. The mouse-movement metrics, visualization techniques and software tools reported in the following sections (Section 2.2.1, Section 2.2.2 and Section 2.3) are indicative, whereas their reporting aims to reveal several opportunities that are offered towards addressing research questions connected to different aspects of visual perception and cognition.
2.2.1. Mouse-Movement Metrics
Mouse-movement trajectories indicate the searching strategies during the execution of a task (or a series of tasks) on a visual stimulus presented on a digital display. The principal aim behind the computation of specific metrics is to describe such strategies in a quantitative way, also providing the capability for statistical comparisons. Mouse-movement metrics include the computation of specific values that characterize the mouse trajectories’ deviations either temporally or geometrically [18]. More specifically, mouse-movement strategies could be described based on the relative reaction times, changes in direction, as well as on the corresponding trajectory velocity and acceleration [16]. The geometry-based description of mouse-movement trajectories includes quantitative measures that are able to reveal the existing differences compared to the optimal trajectory that corresponds to a straight line [15]. The most typical metrics in this category are the Maximum Absolute Deviation (MAD), the Area Under Curve (AUC), the Maximum Deviation (MD), and the Convex Hull (CH) area [15,19,20,21].
More precisely, such metrics provide fine-grained quantification of the conflict or uncertainty among response options [16]. For instance, MD quantifies the response between two elements of potential choice (e.g., icons in a website) by calculating the furthest point on the actual (mouse) trajectory from the optimal/ideal (straight) trajectory, while AUC calculates the area between the actual and the optimal straight trajectory [20]. Trajectories that approach the straight trajectory tend to reflect less conflict between the two options [22]. In cartographic research, the application of such metrics can significantly support the quantification of the amount of conflict for decisions regarding the elements existing in interactive cartographic products (e.g., map symbols) and/or GUIs (e.g., interactive tools). Aside from these mouse-tracking metrics, there are other, less standardized ones that quantify the temporal development of mouse trajectories (e.g., acceleration and velocity [23], or entropy analyses [24]) in order to assess the way a decision evolves [20,22].
2.2.2. Visualization Techniques
Visualization techniques could be used for supporting the analysis of experimental data in qualitative means. Although representing mouse trajectories as simple lines seems to be the more intuitive method for representing individual behaviors, several techniques have been reported in mouse-tracking studies over the last years. More specifically, considering the similarity between mouse- and eye-movement data in terms of their spatiotemporal nature, the corresponding techniques for data collection and analysis could share the approaches followed towards the visualization of both individual and aggregated experimental data. Hence, aside from the simple representation in horizontal plane as reported above, mouse-tracking data referring to an individual behavior during the execution of a task or a series of tasks on a visual scene could be also illustrated in both horizontal and vertical coordinates over time [15] and/or using Space–Time Cubes (STC) [25]. Furthermore, duration diagrams that depict the stationary situations (as happened with fixation events in eye-movement analysis) during searching, as well as curvature diagrams that highlight the corresponding curvature changes, could be utilized [15]. Additionally, mouse-movement data could be visualized using grayscale statistical heatmaps and isolines [15], as well as contiguous irregular cartograms [26]. These three techniques are also suitable for the visualization of aggregated behavior (i.e., cumulative outcome produced by different users’ searching strategies). Among them, grayscale statistical heatmaps could also serve as statistical products expressing the possibility (per each pixel of an image) of having mouse activity during search on a visual stimulus [11].
2.3. Software Tools
The practical implementation of mouse-tracking studies requires the utilization of software tools that are capable of supporting the process of experimental design, data analysis and visualization. Table 1 includes a collection of software tools described in scientific articles and delivered to the scientific community since 2006.
3. Mouse-Tracking Techniques in Cartographic Research
Since in our days the majority of cartographic products are digital and usually interactive, mouse-tracking techniques have been incorporated in cartographic research in order to examine how people interact with such modern products. Moreover, existing studies highlight that the mouse-tracking method is used as an alternative or as a supplementary approach to eye-tracking techniques [8,11,31,32]. Indeed, an experimental study presented by [25] has shown that there is a connection between eye and mouse movements during the execution of map-related tasks.
Previous studies highlight that mouse-tracking and -logging techniques have been utilized for the examination of usability issues in the map-reading process [33], for the interpretation of the existing patterns and the identification of differences between novice and expert users [34]. Mouse events, in conjunction with other inputs that may reveal user behavior (e.g., eye movements), have been employed for the examination of specific GUIs or cartographic interfaces (see, e.g., the work presented by [35]), which are also characterized by interactivity [36].
Mouse movements could also serve as one of the inputs in order to develop specific indices towards the evaluation of the effectiveness of interactive cartographic products (see, e.g., the recent work presented by [37]). Furthermore, mouse tracking has also been used for the examination of preattentive attributes of vision in cartographic symbols [11].
In a nutshell, the aforementioned studies confirm that the method is well accepted by the cartographic community. As it is obvious, the total number of empirical studies which utilize mouse tracking as the main experimental method is not that high, especially after comparing it with the existing applications of eye tracking in cartography and spatial research [38,39,40,41]. However, considering the main strengths and future potential discussed in the following section, mouse tracking could serve as one of the most powerful methods in cartographic research.
4. Strengths and Future Potential
In order to identify the future potential of mouse-tracking techniques in cartographic research and, more specifically, in the examination of both perceptual and cognitive issues related to map reading, it is important to highlight the main advantages of the discussed method compared to others.
Mouse tracking constitutes a simple method providing quantitative data during the performance of an experimental study. Hence, the analysis of the collected data can be based on the computation of specific metrics, as well as on the implementation of specific visualization methods (as discussed in Section 2.2). The description of participants’ behavior with quantitative indices allows the performance of statistical comparisons of the produced results. Therefore, the method appears to be quite suitable for the performance of cartographic experimentation since it aims to examine map-reading procedures under different conditions, including different cartographic designs, environmental conditions, as well as participants with different characteristics (e.g., age or level of expertise). In this way, the mouse-tracking method could substantially contribute towards meeting the clear need of understanding how map users behave when exploring modern interactive cartographic products [42].
The methodology could also be executed remotely through the internet (see, e.g., the technical framework recently provided by [32], as well as the experimental study described in [8]). Although this approach could have some limitations (e.g., different experimental conditions per participant, influence by network connection quality and/or connected device specifications [32]), it is considered much simpler than eye tracking in terms of implementation. This can be confirmed taking into consideration two additional (except for its suitability for remote testing) facts: it does not require any calibration process, and it can provide high-frequency spatiotemporal data using typical computers. Consequently, the method permits the ease of experimental data collection by a high overall number of participants. This advantage is quite important, especially when the examined research hypotheses are connected to several factors (see also the recent study provided by [43] where this issue is analyzed and discussed in the framework of the performance of map-user studies).
Since mouse tracking is mainly based on mouse events and trajectories, the method is suitable for the examination of task-based processes. Especially when dealing with more complex map GUIs in which the main map display is combined with multiple accompanying data displays [35], or in cases where interaction with the map GUI plays an inextricable role for map reading (through specific ‘digital activities’ such as zooming, panning, etc.) [36], mouse tracking appears to provide a unique advantage in recording and further quantifying the users’ mouse trajectories, as if these trajectories were executed in real-life conditions. Mouse tracking extends the data that are collected by the traditional experimental approach of recording the reaction times—an approach widely implemented in psychological research [44]—by providing spatiotemporal information related to participants’ searching strategies. Examining the behavior of map users under different types of tasks could reveal critical outcomes regarding several aspects related to the map-reading process. Typical examples in cartographic research involve the examination of identification, memorability and recognition issues [45], as well as the examination of visual complexity influence [46,47,48,49].
The collection of large-scale experimental data could also result in the distribution of the corresponding datasets to the scientific community. This is a common practice in research studies related to visual attention, including cartography and geographic information science (see, e.g., the eye-tracking datasets distributed by previous research studies [45,46,50]). In a recent study [40], the twofold advantages of this approach are explained: freely distributed datasets are considered as objective ground truths for the analysis and the modeling of searching behavior; at the same time, open science is promoted by providing the collected data to the scientific community for further research.
Finally, as also can be shown by the research studies reported in Section 3, mouse tracking could be easily combined with other experimental methods (i.e., questionnaire analysis, eye tracking, EEG, and fMRI), permitting the multimodal description of participants’ reactions. Moreover, the development of the existing tools in common programming language and/or frameworks could support the integrated manipulation of all stages in cartographic experimentation, including designing, analysis and visualization.
5. Limitations
Although mouse tracking has the potential to serve as a robust technique in cartographic experimentation, it has some limitations. These exact limitations can be particularly identified when mouse tracking is compared with eye tracking. Several studies report the correlation between eye and mouse movements (e.g., [25,51,52,53,54,55,56,57]). However, mouse movements cannot replace the detection of the so-called ‘point of regard’. Hence, even though task-based and interactive procedures can be adequately or even properly supported, mouse tracking is not that suitable in the examination of free-viewing procedures. Even in the cases in which the visual stimulus corresponds to an interactive map which requires mouse cursor panning for navigation, mouse trajectory is not necessarily connected to the salient locations of the visual stimulus. Therefore, mouse tracking cannot be utilized for generating ground truth towards modeling the unconscious reaction of map users.
Mouse tracking constitutes a computer-based method. Therefore, it can be used only for examining digital (cartographic) products or analog products that have been digitized and presented on a digital monitor. In other words, compared to other experimental methods, we are not able to implement this method in a real-world scenario which involves the execution of a typical map task using a traditional paper map, or a map printed in any other type of a physical analog medium.
The method is not quite suitable for capturing the reaction of map users during the utilization of touch-screen displays (e.g., smartphones and tablets). However, although the trajectory of map-user response is not recorded, response events referring to clicks, pan and zoom in/out could be used for higher-level analyses.
Summarizing both strengths/future potential and limitations presented in Section 4 and Section 5, a comparison table is provided (Table 2). More specifically, Table 2 summarizes the strengths/potential, as well as the limitations of mouse tracking—mainly compared to eye tracking—with a special focus on experimental procedures in cartographic research.
6. Concluding Remarks
Capturing and analyzing mouse movements and events constitutes a valuable method towards the examination of both perceptual and cognitive issues related to digital map-reading processes. Despite the existing limitations, the method is simple and straightforward, it appears particularly suitable for tracking real-life behaviors in interactive maps, also providing the valuable opportunity for remote experimentation. At the same time, considering the relatively common spatiotemporal nature between mouse- and eye-movement raw data, similar metrics and visualization techniques can be used in order to examine the response of map users during the execution of task-based procedures on digital cartographic products. This particularity also permits the direct comparison between mouse and eye movements, while the simplicity of the method grants its concurrent utilization with other state-of-the-art experimental methods.
Author Contributions
Conceptualization, V.K. and L.-M.M.; investigation, V.K.; writing—original draft preparation, V.K.; writing—review and editing, V.K. and L.-M.M. All authors have read and agreed to the published version of the manuscript.
Funding
This research received no external funding.
Data Availability Statement
Not applicable.
Conflicts of Interest
The authors declare no conflict of interest.
References
- Lapaine, M.; Midtbø, T.; Gartner, G.; Bandrova, T.; Wang, T.; Shen, J. Definition of the Map. Adv. Cartogr. GIScience ICA 2021, 3, 9. [Google Scholar] [CrossRef]
- Bertin, J. Semiology of Graphics; University of Wisconsin Press: Madison, WI, USA, 1983; ISBN 0299090604. [Google Scholar]
- DiBiase, D.; MacEachren, A.M.; Krygier, J.B.; Reeves, C. Animation and the Role of Map Design in Scientific Visualization. Cartogr. Geogr. Inf. Syst. 1992, 19, 201–214. [Google Scholar] [CrossRef]
- Krygier, J.B. Chapter 8—Sound and Geographic Visualization. In Visualization in Modern Cartography; MacEachren, A.M., Taylor, D.R.F.-M.C.S., Eds.; Academic Press: Cambridge, MA, USA, 1994; Volume 2, pp. 149–166. ISBN 1363-0814. [Google Scholar]
- Çöltekin, A.; Heil, B.; Garlandini, S.; Fabrikant, S.I. Evaluating the Effectiveness of Interactive Map Interface Designs: A Case Study Integrating Usability Metrics with Eye-Movement Analysis. Cartogr. Geogr. Inf. Sci. 2009, 36, 5–17. [Google Scholar] [CrossRef]
- Ciołkosz-Styk, A. The visual search method in map perception research. Geoinf. Issues 2012, 4, 33–42. [Google Scholar]
- Beitlova, M.; Popelka, S.; Voženílek, V.; Fačevicová, K.; Janečková, B.A.; Matlach, V. The Importance of School World Atlases According to Czech Geography Teachers. ISPRS Int. J. Geo-Inf. 2021, 10, 504. [Google Scholar] [CrossRef]
- Knura, M.; Schiewe, J. Map Evaluation under COVID-19 restrictions: A new visual approach based on think aloud interviews. Proc. ICA 2021, 4, 60. [Google Scholar] [CrossRef]
- Michaelidou, E.; Filippakopoulou, V.; Nakos, B.; Petropoulou, A. Designing point map symbols: The effect of preattentive attributes of shape. In Proceedings of the 22th International Cartographic Association Conference, La Coruña, Spain, 9–16 July 2005. [Google Scholar]
- Cybulski, P.; Krassanakis, V. The effect of map label language on the visual search of cartographic point symbols. Cartogr. Geogr. Inf. Sci. 2022, 49, 189–204. [Google Scholar] [CrossRef]
- Pappa, A.; Krassanakis, V. Examining the preattentive effect on cartographic backgrounds utilizing remote mouse tracking. Abstr. ICA 2022, 5, 111. [Google Scholar] [CrossRef]
- Keskin, M.; Ooms, K.; Dogru, A.O.; De Maeyer, P. EEG & Eye Tracking User Experiments for Spatial Memory Task on Maps. ISPRS Int. J. Geo-Inf. 2019, 8, 546. [Google Scholar] [CrossRef]
- Lobben, A.; Lawrence, M.; Olson, J.M. fMRI and Human Subjects Research in Cartography. Cartogr. Int. J. Geogr. Inf. Geovis. 2009, 44, 159–169. [Google Scholar] [CrossRef]
- Burian, J.; Popelka, S.; Beitlova, M. Evaluation of the Cartographical Quality of Urban Plans by Eye-Tracking. ISPRS Int. J. Geo-Inf. 2018, 7, 192. [Google Scholar] [CrossRef]
- Krassanakis, V.; Kesidis, A.L. MatMouse: A Mouse Movements Tracking and Analysis Toolbox for Visual Search Experiments. Multimodal Technol. Interact. 2020, 4, 83. [Google Scholar] [CrossRef]
- Kieslich, P.J.; Schoemann, M.; Grage, T.; Hepp, J.; Scherbaum, S. Design factors in mouse-tracking: What makes a difference? Behav. Res. Methods 2020, 52, 317–341. [Google Scholar] [CrossRef] [PubMed]
- Karagiorgou, S.; Krassanakis, V.; Vescoukis, V.; Nakos, B. Experimenting with polylines on the visualization of eye tracking data from observations of cartographic lines. In Proceedings of the CEUR Workshop Proceedings, Vienna, Austria, 23–24 September 2014; Volume 1241. [Google Scholar]
- Di Palma, M.; Carioti, D.; Arcangeli, E.; Rosazza, C.; Ambrogini, P.; Cuppini, R.; Minelli, A.; Berlingeri, M. The biased hand. Mouse-tracking metrics to examine the conflict processing in a race-implicit association test. PLoS ONE 2022, 17, e0271748. [Google Scholar] [CrossRef] [PubMed]
- Yamauchi, T.; Leontyev, A.; Razavi, M. Mouse Tracking Measures Reveal Cognitive Conflicts Better than Response Time and Accuracy Measures. In Proceedings of the CogSci, Montreal, QC, Canada, 24-27 July 2019; pp. 3150–3156. [Google Scholar]
- Stillman, P.E.; Shen, X.; Ferguson, M.J. How Mouse-tracking Can Advance Social Cognitive Theory. Trends Cogn. Sci. 2018, 22, 531–543. [Google Scholar] [CrossRef]
- Tian, G.; Wu, W. A Review of Mouse-Tracking Applications in Economic Studies. J. Econ. Behav. Stud. 2020, 11, 1–9. [Google Scholar] [CrossRef]
- Freeman, J.B.; Ambady, N. MouseTracker: Software for studying real-time mental processing using a computer mouse-tracking method. Behav. Res. Methods 2010, 42, 226–241. [Google Scholar] [CrossRef]
- Wojnowicz, M.T.; Ferguson, M.J.; Dale, R.; Spivey, M.J. The Self-Organization of Explicit Attitudes. Psychol. Sci. 2009, 20, 1428–1435. [Google Scholar] [CrossRef]
- Calcagnì, A.; Lombardi, L.; Sulpizio, S. Analyzing spatial data from mouse tracker methodology: An entropic approach. Behav. Res. Methods 2017, 49, 2012–2030. [Google Scholar] [CrossRef]
- Demšar, U.; Çöltekin, A. Quantifying gaze and mouse interactions on spatial visual interfaces with a new movement analytics methodology. PLoS ONE 2017, 12, e0181818. [Google Scholar] [CrossRef]
- Krassanakis, V. Aggregated Gaze Data Visualization Using Contiguous Irregular Cartograms. Digital 2021, 1, 130–144. [Google Scholar] [CrossRef]
- Arroyo, E.; Selker, T.; Wei, W. Usability Tool for Analysis of Web Designs Using Mouse Tracks. In Proceedings of the CHI ’06 Extended Abstracts on Human Factors in Computing Systems, Montreal, QC, Canada, 22–27 April 2006; Association for Computing Machinery: New York, NY, USA, 2006; pp. 484–489. [Google Scholar]
- Voßkühler, A.; Nordmeier, V.; Kuchinke, L.; Jacobs, A.M. OGAMA (Open Gaze and Mouse Analyzer): Open-source software designed to analyze eye and mouse movements in slideshow study designs. Behav. Res. Methods 2008, 40, 1150–1162. [Google Scholar] [CrossRef] [PubMed]
- Kieslich, P.J.; Henninger, F. Mousetrap: An integrated, open-source mouse-tracking package. Behav. Res. Methods 2017, 49, 1652–1667. [Google Scholar] [CrossRef] [PubMed]
- Mathur, M.B.; Reichling, D.B. Open-source software for mouse-tracking in Qualtrics to measure category competition. Behav. Res. Methods 2019, 51, 1987–1997. [Google Scholar] [CrossRef]
- Knura, M.; Schiewe, J. Analysis of User Behaviour While Interpreting Spatial Patterns in Point Data Sets. KN J. Cartogr. Geogr. Inf. 2022, 72, 229–242. [Google Scholar] [CrossRef]
- Krassanakis, V.; Kesidis, A.L.; Pappa, A.; Misthos, L.-M. Performing cartographic visual search experiments online: Opportunities and challenges. In Proceedings of the Workshop on Adaptable Research Methods for Empirical Research with Map Users, Virtual Workshop, 6 May 2021. [Google Scholar]
- Manson, S.M.; Kne, L.; Dyke, K.R.; Shannon, J.; Eria, S. Using Eye-tracking and Mouse Metrics to Test Usability of Web Mapping Navigation. Cartogr. Geogr. Inf. Sci. 2012, 39, 48–60. [Google Scholar] [CrossRef]
- McArdle, G.; Tahir, A.; Bertolotto, M. Interpreting map usage patterns using geovisual analytics and spatio-temporal clustering. Int. J. Digit. Earth 2015, 8, 599–622. [Google Scholar] [CrossRef]
- Golebiowska, I.; Opach, T.; Rød, J.K. Breaking the Eyes: How Do Users Get Started with a Coordinated and Multiple View Geovisualization Tool? Cartogr. J. 2020, 57, 235–248. [Google Scholar] [CrossRef]
- Ooms, K.; Coltekin, A.; De Maeyer, P.; Dupont, L.; Fabrikant, S.; Incoul, A.; Kuhn, M.; Slabbinck, H.; Vansteenkiste, P.; Van der Haegen, L. Combining user logging with eye tracking for interactive and dynamic applications. Behav. Res. Methods 2015, 47, 977–993. [Google Scholar] [CrossRef]
- Horbiński, T.; Cybulski, P.; Medyńska-Gulij, B. Web Map Effectiveness in the Responsive Context of the Graphical User Interface. ISPRS Int. J. Geo-Inf. 2021, 10, 134. [Google Scholar] [CrossRef]
- Steinke, T.R. Eye Movement Studies in Cartography and Related Fields. Cartogr. Int. J. Geogr. Inf. Geovis. 1987, 24, 40–73. [Google Scholar] [CrossRef]
- Krassanakis, V.; Cybulski, P. A review on eye movement analysis in map reading process: The status of the last decade. Geod. Cartogr. 2019, 68, 191–209. [Google Scholar] [CrossRef]
- Krassanakis, V.; Cybulski, P. Eye Tracking Research in Cartography: Looking into the Future. ISPRS Int. J. Geo-Inf. 2021, 10, 411. [Google Scholar] [CrossRef]
- Kiefer, P.; Giannopoulos, I.; Raubal, M.; Duchowski, A. Eye tracking for spatial research: Cognition, computation, challenges. Spat. Cogn. Comput. 2017, 17, 1–19. [Google Scholar] [CrossRef]
- Roth, R.E.; Çöltekin, A.; Delazari, L.; Filho, H.F.; Griffin, A.; Hall, A.; Korpi, J.; Lokka, I.; Mendonça, A.; Ooms, K.; et al. User studies in cartography: Opportunities for empirical research on interactive maps and visualizations. Int. J. Cartogr. 2017, 3, 61–89. [Google Scholar] [CrossRef]
- Martins, V.B.; Amorim, F.R.; Schmidt, M.A.R.; Delazari, L.S. Study about the appropriate number of participants in map user studies. Int. J. Cartogr. 2023, 9, 1–14. [Google Scholar] [CrossRef]
- Draheim, C.; Mashburn, C.A.; Martin, J.D.; Engle, R.W. Reaction time in differential and developmental research: A review and commentary on the problems and alternatives. Psychol. Bull. 2019, 145, 508–535. [Google Scholar] [CrossRef]
- Keskin, M.; Krassanakis, V.; Çöltekin, A. Visual Attention and Recognition Differences Based on Expertise in a Map Reading and Memorability Study. ISPRS Int. J. Geo-Inf. 2023, 12, 21. [Google Scholar] [CrossRef]
- Tzelepis, N.; Kaliakouda, A.; Krassanakis, V.; Misthos, L.-M.; Nakos, B. Evaluating the perceived visual complexity of multidirectional hill-shading. Geod. Cartogr. 2020, 69, 161–172. [Google Scholar] [CrossRef]
- Cybulski, P. Spatial distance and cartographic background complexity in graduated point symbol map-reading task. Cartogr. Geogr. Inf. Sci. 2020, 47, 244–260. [Google Scholar] [CrossRef]
- Keil, J.; Edler, D.; Kuchinke, L.; Dickmann, F. Effects of visual map complexity on the attentional processing of landmarks. PLoS ONE 2020, 15, e0229575. [Google Scholar] [CrossRef] [PubMed]
- Liao, H.; Wang, X.; Dong, W.; Meng, L. Measuring the influence of map label density on perceived complexity: A user study using eye tracking. Cartogr. Geogr. Inf. Sci. 2019, 46, 210–227. [Google Scholar] [CrossRef]
- He, B.; Dong, W.; Liao, H.; Ying, Q.; Shi, B.; Liu, J.; Wang, Y. A geospatial image based eye movement dataset for cartography and GIS. Cartogr. Geogr. Inf. Sci. 2023, 50, 96–111. [Google Scholar] [CrossRef]
- Chen, M.C.; Anderson, J.R.; Sohn, M.H. What can a mouse cursor tell us more? In Proceedings of the CHI ’01 Extended Abstracts on Human Factors in Computing Systems (CHI ’01), Seattle, WA, USA, 31 March–5 April 2001; p. 281. [Google Scholar]
- Guo, Q.; Agichtein, E. Towards predicting web searcher gaze position from mouse movements. In Proceedings of the 28th of the International Conference Extended Abstracts on Human Factors in Computing Systems (CHI EA ’10), Atlanta, GA, USA, 10–15 April 2010; p. 3601. [Google Scholar]
- Milisavljevic, A.; Hamard, K.; Petermann, C.; Gosselin, B.; Doré-Mazars, K.; Mancas, M. Eye and Mouse Coordination During Task: From Behaviour to Prediction. In Proceedings of the International Conference on Human Computer Interaction Theory and Applications, Funchal, Portugal, 27–29 January 2018; SCITEPRESS—Science and Technology Publications: Funchal, Portugal, 2018; pp. 86–93. [Google Scholar]
- Cooke, L. Is the Mouse a “Poor Man’s Eye Tracker”? In Proceedings of the Annual Conference-Society for Technical Communication, Las Vegas, NV, USA, 7–10 May 2006; Volume 53, p. 252. [Google Scholar]
- Egner, S.; Reimann, S.; Höger, R.; Zangemeister, W.H. Attention and information acquisition: Comparison of mouse-click with eye-movement attention tracking. J. Eye Mov. Res. 2018, 11. [Google Scholar] [CrossRef]
- Liebling, D.J.; Dumais, S.T. Gaze and Mouse Coordination in Everyday Work. In Proceedings of the 2014 ACM International Joint Conference on Pervasive and Ubiquitous Computing: Adjunct Publication, Seattle, WA, USA, 13–17 September 2014; pp. 1141–1150. [Google Scholar]
- Rose, J.; Liu, Y.; Awad, A. Biometric Authentication Using Mouse and Eye Movement Data. In Proceedings of the 2017 IEEE Security and Privacy Workshops (SPW), San Jose, CA, USA, 25 May 2017; pp. 47–55. [Google Scholar]
Figure 1.
Different ways to visualize and/or quantify the same raw (experimental) data of mouse trajectory produced by the MatMouse toolbox [15] during a task-based map-reading procedure.
Figure 1.
Different ways to visualize and/or quantify the same raw (experimental) data of mouse trajectory produced by the MatMouse toolbox [15] during a task-based map-reading procedure.


Table 1.
Mouse-tracking software tools described in scientific articles.
| Tool | Programming Language | Tracking Mode | Data Analysis | Interface | Year | Reference |
|---|---|---|---|---|---|---|
| MouseTrack | PHP/JavaScript | Yes | Yes (basic visualizations) | Use through web page | 2006 | [27] |
| OGAMA | C#.NET | Yes | Yes | GUI | 2008 | [28] |
| MouseTracker | N/A | Yes | Yes | GUI | 2010 | [22] |
| Mousetrap | R | Yes | Yes | Extension of OpenSesame | 2017 | [29] |
| Qualtrics mouse-tracking | JavaScript/CSS/R | Yes | Yes | Command line-based | 2019 | [30] |
| MatMouse | MATLAB | Yes | Yes | Command line-based | 2020 | [15] |
Table 2.
Mouse-tracking strengths/potential and limitations (compared to eye tracking).
| Strengths/Potential | Limitations |
|---|---|
|
|
|
|
|
|
|
|
| |
|
Disclaimer/Publisher’s Note: The statements, opinions and data contained in all publications are solely those of the individual author(s) and contributor(s) and not of MDPI and/or the editor(s). MDPI and/or the editor(s) disclaim responsibility for any injury to people or property resulting from any ideas, methods, instructions or products referred to in the content. |
© 2023 by the authors. Licensee MDPI, Basel, Switzerland. This article is an open access article distributed under the terms and conditions of the Creative Commons Attribution (CC BY) license (https://creativecommons.org/licenses/by/4.0/).
Share and Cite
MDPI and ACS Style
Krassanakis, V.; Misthos, L.-M. Mouse Tracking as a Method for Examining the Perception and Cognition of Digital Maps. Digital 2023, 3, 127-136. https://doi.org/10.3390/digital3020009
AMA Style
Krassanakis V, Misthos L-M. Mouse Tracking as a Method for Examining the Perception and Cognition of Digital Maps. Digital. 2023; 3(2):127-136. https://doi.org/10.3390/digital3020009
Chicago/Turabian StyleKrassanakis, Vassilios, and Loukas-Moysis Misthos. 2023. "Mouse Tracking as a Method for Examining the Perception and Cognition of Digital Maps" Digital 3, no. 2: 127-136. https://doi.org/10.3390/digital3020009